public health assessment · public health assessment former burn area (a/k/a velsicol burn pit) st....
TRANSCRIPT

Public Health
Assessment
FORMER BURN AREA
(a/k/a Velsicol Burn Pit)
ST. LOUIS, GRATIOT COUNTY, MICHIGAN
EPA FACILITY ID: MIN000510389
Prepared by
Michigan Department of Community Health
MARCH 21, 2012
COMMENT PERIOD ENDS: MAY 5, 2012
Prepared under a Cooperative Agreement with the
U.S. DEPARTMENT OF HEALTH AND HUMAN SERVICES
Agency for Toxic Substances and Disease Registry
Division of Health Assessment and Consultation
Atlanta, Georgia 30333
Public Comment Release

THE ATSDR PUBLIC HEALTH ASSESSMENT: A NOTE OF EXPLANATION
This Public Health Assessment-Public Comment Release was prepared by ATSDR pursuant to the Comprehensive
Environmental Response, Compensation, and Liability Act (CERCLA or Superfund) section 104 (i)(6) (42 U.S.C. 9604
(i)(6), and in accordance with our implementing regulations (42 C.F.R. Part 90). In preparing this document, ATSDR’s
Cooperative Agreement Partner has collected relevant health data, environmental data, and community health concerns
from the Environmental Protection Agency (EPA), state and local health and environmental agencies, the community, and
potentially responsible parties, where appropriate. This document represents the agency’s best efforts, based on currently
available information, to fulfill the statutory criteria set out in CERCLA section 104 (i)(6) within a limited time frame. To
the extent possible, it presents an assessment of potential risks to human health. Actions authorized by CERCLA section
104 (i)(11), or otherwise authorized by CERCLA, may be undertaken to prevent or mitigate human exposure or risks to
human health. In addition, ATSDR’s Cooperative Agreement Partner will utilize this document to determine if follow-up
health actions are appropriate at this time.
This document has now been released for a 45-day public comment period. Subsequent to the public comment period,
ATSDR’s Cooperative Agreement Partner will address all public comments and revise or append the document as
appropriate. The public health assessment will then be reissued. This will conclude the public health assessment process
for this site, unless additional information is obtained by ATSDR’s Cooperative Agreement Partner which, in the agency’s
opinion, indicates a need to revise or append the conclusions previously issued.
Use of trade names is for identification only and does not constitute endorsement by the U.S. Department of Health and
Human Services.
Please address comments regarding this report to:
Agency for Toxic Substances and Disease Registry
Attn: Records Center
1600 Clifton Road, N.E., MS F-09
Atlanta, Georgia 30333
You May Contact ATSDR Toll Free at
1-800-CDC-INFO or
Visit our Home Page at: http://www.atsdr.cdc.gov

Former Burn Area Public Comment Release
PUBLIC HEALTH ASSESSMENT
FORMER BURN AREA
(a/k/a Velsicol Burn Pit)
ST. LOUIS, GRATIOT COUNTY, MICHIGAN
EPA FACILITY ID: MIN000510389
Prepared by:
Michigan Department of Community Health
Under A Cooperative Agreement with the
U.S. Department of Health and Human Services
Agency for Toxic Substances and Disease Registry
This information is distributed solely for the purpose of predissemination public comment under
applicable information quality guidelines. It has not been formally disseminated by the Agency for
Toxic Substances and Disease Registry. It does not represent and should not be construed to represent
any agency determination or policy.

Foreword
The Michigan Department of Community Health (MDCH) conducted this evaluation for the
federal Agency for Toxic Substances and Disease Registry (ATSDR) under a cooperative
agreement. ATSDR conducts public health activities (assessments/consultations, advisories,
education) at sites of environmental contamination. The purpose of this document is to identify
potentially harmful exposures and recommend actions that would minimize those exposures.
This is not a regulatory document and does not evaluate or confirm compliance with laws. This
is a publicly available document and is provided to the appropriate regulatory agencies for their
consideration.
The following steps are necessary to conduct public health assessments/consultations:
Evaluating exposure: MDCH toxicologists begin by reviewing available information
about environmental conditions at the site: how much contamination is present, where it
is found on the site, and how people might be exposed to it. This process requires the
measurement of chemicals in air, water, soil, or animals. Usually, MDCH does not collect
its own environmental sampling data. We rely on information provided by the Michigan
Department of Environmental Quality (MDEQ), U.S. Environmental Protection Agency
(EPA), and other government agencies, businesses, and the general public.
Evaluating health effects: If there is evidence that people are being exposed – or could be
exposed – to hazardous substances, MDCH toxicologists then determine whether that
exposure could be harmful to human health, using existing scientific information. The
report focuses on public health – the health impact on the community as a whole.
Developing recommendations: In its report, MDCH outlines conclusions regarding any
potential health threat posed by a site, and offers recommendations for reducing or
eliminating human exposure to contaminants. If there is an immediate health threat,
MDCH will issue a public health advisory warning people of the danger, and will work
with the appropriate agencies to resolve the problem.
Soliciting community input: The evaluation process is interactive. MDCH solicits and
considers information from various government agencies, parties responsible for the site,
and the community. If you have any questions or comments about this report, we
encourage you to contact us.
Please write to: Toxicology and Response Section
Division of Environmental Health
Michigan Department of Community Health
PO Box 30195
Lansing, MI 48909
Or call us at: 1-800-648-6942 (toll free)
For more information, please visit:
www.michigan.gov/mdch-toxics

iii
Table of Contents
Acronyms and Abbreviations .................................................................................................... vii
Summary ........................................................................................................................................ 8
Purpose and Health Issues ........................................................................................................... 9
Background ................................................................................................................................. 10
Discussion..................................................................................................................................... 12
Environmental Contamination .................................................................................................. 12
Site Geology.......................................................................................................................... 12
Former Burn Area (FBA) Soil Sampling .............................................................................. 13
Residential Area Soil Sampling ............................................................................................ 15
Ash Pile Sampling................................................................................................................. 15
Soil Gas Sampling................................................................................................................. 16
Hydrogeology ....................................................................................................................... 17
Groundwater Sampling ......................................................................................................... 17
Residential Well Sampling ................................................................................................... 21
Surface Water and Sediment Sampling ................................................................................ 21
Exposure Pathways Analysis .................................................................................................... 22
Soil and ash samples from the FBA ...................................................................................... 23
Soil samples from a residential area near the FBA ............................................................... 24
Groundwater samples from the FBA .................................................................................... 25
Drinking water well samples located near the FBA ............................................................. 25
Toxicological Evaluation .......................................................................................................... 26
Arsenic .................................................................................................................................. 26
Lead....................................................................................................................................... 26
Chloride................................................................................................................................. 27
Contaminants without Screening Levels .................................................................................. 27
Children’s Health Considerations ............................................................................................. 29
Conclusions .................................................................................................................................. 29
Recommendations ....................................................................................................................... 30
Public Health Action Plan .......................................................................................................... 30
Preparers of Report .................................................................................................................... 31
References .................................................................................................................................... 32

iv
List of Tables Table 1: Maximum value (in milligrams per kilograms [mg/kg]) of detected contaminants that
were higher than or had no screening levels in 17 soil samples from the 2004 soil borings
(Weston 2006). ...................................................................................................................... 13
Table 2: Maximum value (in milligrams per kilograms [mg/kg]) of detected contaminants that
were higher than or had no screening levels in 66 soil samples from the 2007 sampling
(Weston 2009). ...................................................................................................................... 14
Table 3: Maximum value (in milligrams per kilograms [mg/kg]) of detected contaminants that
were higher than or had no screening levels in 32 downwind residential soil samples (0 to
0.5 feet deep) from the 2007 sampling (Weston 2009). ....................................................... 15
Table 4: Maximum value (in milligrams per kilograms [mg/kg]) of detected contaminants that
were higher than or had no screening levels in two ash samples collected in 2004 (Weston
2006). .................................................................................................................................... 16
Table 5: Maximum value (in milligrams per liter [mg/L]) of contaminants that either had no
screening level or exceeded the screening levels in 17 groundwater samples from soil
borings (vertical aquifer sampling) sampled in 2004 (Weston 2006). .................................. 17
Table 6: Maximum value (in milligrams per liter [mg/L]) of detected compounds that either
exceeded their respective screening value or had no screening levels in the Former Burn
Area (FBA) 17 groundwater samples from the shallow outwash unit monitor wells sampled
in 2008 (Weston 2009).......................................................................................................... 19
Table 7: Maximum value (in milligrams per liter [mg/L]) of detected compounds with no
screening levels in the Former Burn Area (FBA) seven groundwater samples from the upper
till unit monitor wells sampled in 2008 (Weston 2009). ...................................................... 20
Table 8: Maximum value (in milligrams per liter [mg/L]) of detected compounds with no
screening levels in the Former Burn Area (FBA) two groundwater samples from the lower
till unit monitor wells sampled in 2008 (Weston 2009). ...................................................... 20
Table 9: Maximum value (in milligrams per liter [mg/L]) of detected compounds with no
screening levels in the Former Burn Area (FBA) eight groundwater samples from the lower
outwash unit monitor wells sampled in 2008 (Weston 2009). .............................................. 20
Table 10: Maximum value (in milligrams per kilogram [mg/kg]) of detected contaminants that
were higher than or had no screening levels in three drinking water wells sampled in 2002
(Weston 2006). ...................................................................................................................... 21
Table 11: Maximum levels (in milligrams per liter [mg/L]) of detected compounds with no
screening levels in five surface water samples from a drainage ditch adjacent to the Former
Burn Area (FBA) sampled in 2008 (Weston 2009). ............................................................. 22
Table 12: Maximum levels (in milligrams per kilograms [mg/kg]) of detected compounds with
no screening levels in seven sediment samples from a drainage ditch adjacent to the Former
Burn Area (FBA) sampled in 2008 (Weston 2009). ............................................................. 22
Table 13: Exposure pathway for contaminants present at the Former Burn Area (Velsicol Burn
Pit) at the Gratiot County Golf Course National Priorities List Site, St Louis (Gratiot
County), Michigan. ............................................................................................................... 23
Table A-1: Maximum value (in milligrams per kilogram [mg/kg]) of detected compounds at or
above the reported quantitation limit in the Former Burn Area (FBA) soil from soil borings
(17 samples) (Weston 2006). .............................................................................................. A-1

v
Table A-2: Maximum value (in milligrams per kilogram [mg/kg]) of detected compounds at or
above the reported quantitation limit in the Former Burn Area (FBA) ash samples (two
samples) (Weston 2006). .................................................................................................... A-3
Table A-3: Maximum value (in milligrams per cubic meter [mg/m3]) of soil gas levels in the
Former Burn Area (FBA) (Weston 2006). .......................................................................... A-5
Table A-4: Maximum value (in milligrams per liter [mg/L]) of detected compounds at or above
the reported quantitation limit in the Former Burn Area (FBA) groundwater samples (17
samples) from vertical aquifer sampling (Weston 2006). ................................................... A-6
Table A-5: Maximum value (in milligrams per liter [mg/L]) of detected compounds at or above
the reported quantitation limit in the Former Burn Area (FBA) groundwater samples (52
samples) from monitor wells sampled in 2005 (Weston 2006). ......................................... A-7
Table A-6: Maximum value (in milligrams per liter [mg/L]) of para-Chlorobenzenesulfonic acid
(pCBSA) in the Former Burn Area (FBA) groundwater samples from monitor wells
sampled in 2005 (Weston 2006). ...................................................................................... A-10
Table A-7: Maximum value (in milligrams per liter [mg/L]) of detected compounds at or above
the reported quantitation limit in the Hidden Oaks Golf Course and two residential wells
sampled in 2004 (Weston 2006). ...................................................................................... A-10
Table B-1: Maximum value (in milligrams per kilogram [mg/kg]) of detected compounds at or
above the reported quantitation limit in the Former Burn Area (FBA) soil sampled (66
samples) in 2007 (Weston 2009). ....................................................................................... B-1
Table B-2: Maximum value (in milligrams per kilogram [mg/kg]) of detected compounds at or
above the reported quantitation limit in the downwind residential area soil (0 to 0.5 feet
deep, 32 samples) sampled in 2007 (Weston 2009). .......................................................... B-2
Table B-3: Maximum levels (in milligrams per liter [mg/L]) of detected contaminants at or above
the reported quantitation limit from vertical aquifer sampling (15 samples) (Weston 2009).
............................................................................................................................................. B-3
Table B-4: Maximum value (in milligrams per liter [mg/L]) of detected compounds at or above
the reported quantitation limit in the Former Burn Area (FBA) groundwater samples from
the shallow outwash unit monitor wells (17 samples) (Weston 2009). .............................. B-4
Table B-5: Maximum value (in milligrams per liter [mg/L]) of detected compounds at or above
the reported quantitation limit in the Former Burn Area (FBA) groundwater samples from
the upper till unit monitor wells (seven samples) (Weston 2009). ..................................... B-7
Table B-6: Maximum value (in milligrams per liter [mg/L]) of detected compounds at or above
the reported quantitation limit in the Former Burn Area (FBA) groundwater samples from
the lower till unit monitor wells (two samples) (Weston 2009). ........................................ B-9
Table B-7: Maximum value (in milligrams per liter [mg/L]) of detected compounds at or above
the reported quantitation limit in the Former Burn Area (FBA) groundwater samples from
the lower outwash unit monitor wells (eight samples) (Weston 2009). ........................... B-11
Table B-8: Dioxin levels in soil (in nanograms per kilogram [ng/kg], 11 samples) and
groundwater (in picograms per liter [pg/L], five samples) Former Burn Area (FBA) samples
(Weston 2009). .................................................................................................................. B-13
Table B-9: Maximum levels (in milligrams per liter [mg/L]) of detected compounds at or above
the reported quantitation limit in surface water (five samples) from a drainage ditch adjacent
to the Former Burn Area (FBA) (Weston 2009). .............................................................. B-13

vi
Table B-10: Maximum levels (in milligrams per kilograms [mg/kg]) of detected compounds at or
above the reported quantitation limit in sediment (seven samples) from a drainage ditch
adjacent to the Former Burn Area (FBA) (Weston 2009). ............................................... B-14
List of Figures Figure 1: Map of the Gratiot County Golf Course (also known as the Former Burn Area [FBA]
National Priorities List (NPL) site (EPA ID# MIN000510389). The FBA boundary is
approximate........................................................................................................................... 11
List of Appendices Appendix A : Detected contaminants from the 2006 Remedial Investigation (Weston 2006). . A-1
Appendix B : Detected contaminants from the 2009 Remedial Investigation (Weston 2009). .. B-1

vii
Acronyms and Abbreviations
µg/L micrograms per liter
1,2-DCA 1,2-dichloroethane
ATSDR Agency for Toxic Substances and Disease Registry
bgs below ground surface
BHC benzene hexachloride
DBCP 1,2-dibromo-3-chloropropane
DDD dichlorodiphenyldichloroethane
DDE dichlorodiphenyldichloroethylene
DDT dichlorodiphenyltrichloroethane
EPA United States Environmental Protection Agency
FBA Former Burn Area
HBB Hexabromobenzene
HEM n-hexane extractable material
MDCH Michigan Department of Community Health
MDEQ Michigan Department of Environmental Quality
MDNR Michigan Department of Natural Resources
MDNRE Michigan Department of Natural Resources and the Environment
NAPL non-aqueous phase liquid
NPL National Priorities List
PBB polybrominated biphenyls
PCB polychlorinated biphenyls
pCBSA para-chlorobenzene sulfonic acid
RDWC Residential Drinking Water Criteria
SVOC semivolatile organic chemicals
TRIS tris(2,3-dibromopropyl) phosphate
VAS vertical aquifer sampling
VOCs volatile organic chemicals

8
Summary
The Former Burn Area (FBA), also called the Velsicol Burn Pit, was proposed to the National
Priorities List (NPL) in September 2009 and was added to the NPL in March 2010. The site is
located in an out-of-bounds area on the Hidden Oaks Golf Course. It is the former waste burning
and disposal site for the Velsicol Chemical Plant and its predecessor, Michigan Chemical
Corporation. A variety of chemicals were disposed of and burned with solid waste from the plant
at this site from the 1950s to 1970. Contaminants might have migrated or be migrating into
groundwater below the site and may, in the future, migrate into groundwater under nearby
residential areas. The Michigan Department of Community Health (MDCH) assesses the human
health risk present at all NPL (also called Superfund) sites in Michigan under a cooperative
agreement with the federal Agency for Toxic Substances and Disease Registry (ATSDR). The
purpose of this document is to identify potentially harmful human exposures to contaminants
from the FBA, and does not include discussion of contaminated material in the Pine River or at
the Velsicol Chemical Corporation plant site in St Louis, Michigan.
MDCH’s conclusions regarding contaminants from the FBA are as follows:
Contaminants present in the soil at the site will not harm people’s health. Levels of contaminants
present in the soil are, for almost all samples, below the applicable screening levels. Visitors,
including golfers, to the golf course around the FBA are expected to have little to no contact with
the FBA soil as it is not on the golf course, and it has vegetation growing on it that could prevent
soil from being blown onto the golf course. Workers at the golf course are not expected to have
contact with the soil.
Next steps: No additional public health activities are necessary at this time.
Not enough information is available to determine if the contaminants present in the ash piles at
the FBA could harm worker’s and visitor’s health. Only one sample was taken from the surface
of each ash pile. Contaminant levels of arsenic and lead in both ash piles were higher than the
screening levels. Workers and visitors to the golf course are not expected to have contact with
the ash piles; the FBA is not on the golf course. However, it is not known how large the ash piles
are, if contaminant levels are consistent throughout the pile, or if existing vegetation would
prevent ash from being blown on to the golf course. Currently, there is no fence around the ash
piles or the rest of the FBA that would limit people’s access.
Next steps: MDCH recommends that ash piles be further examined. Additional
characterization of ash pile contaminants is necessary.
Levels of contaminants in the soil from the residential area downwind of the FBA are not
expected to harm resident’s health. Overall, contaminant levels in the downwind residential area
were below applicable screening levels.
Next steps: No additional public health activities are necessary at this time.
Contaminants from the FBA may be migrating into groundwater; however, current levels of
contaminants in the groundwater at the site are not expected to harm visitor’s or worker’s health

9
because people have little to no contact with groundwater at the FBA. Contaminants that migrate
into the groundwater could, in the future, reach residential private wells or municipal drinking
water if the migration continues.
Next steps: Further contaminant migration should be prevented and groundwater
contaminant levels should be evaluated in the future.
Levels of contaminants in the two drinking water wells, one from the Hidden Oaks Golf Course
and one from the neighborhood near the site are not expected to harm people’s health. Because
contaminants may continue to migrate into the groundwater, contamination levels in monitoring
wells surrounding the site should continue to be monitored in the future. Thirty-two monitoring
wells have been installed in the FBA or nearby areas to identify the extent that chemicals from
the FBA have spread into the groundwater.
Next steps: Sampling of monitoring wells should continue around the FBA to monitor
potential contaminants in the groundwater. MDCH will review future water testing
results.
Contaminants in the surface water and sediment in the drainage ditch, a county drain, near the
site are not expected to harm people’s health. People are expected to have limited, if any, contact
with water and sediment in this ditch.
Next steps: No additional public health activities are necessary at this time.
Purpose and Health Issues
The Michigan Department of Environmental Quality (MDEQ), then the Michigan Department of
Natural Resources and Environment1, and U.S. Environmental Protection Agency (EPA)
proposed the addition of the Gratiot County Golf Course site to the EPA National Priorities List
(NPL) in September 2009 and finalized addition to the list in March 2010. The Michigan
Department of Community Health (MDCH) assesses the human health risk present at NPL (also
called Superfund) sites in Michigan under a cooperative agreement with the federal Agency for
Toxic Substances and Disease Registry (ATSDR). The site is the former waste burning and
disposal site for the Velsicol Chemical Corporation plant. A variety of chemicals were disposed
of and burned with solid waste from the plant at this site from the 1950s to 1970. The purpose of
this document is to identify potentially harmful human exposures to contaminants from the
Gratiot County Golf Course NPL site and does not include discussion of contaminated material
from the Velsicol Chemical Corporation plant site or the Pine River. This document addresses
human health concerns from contaminants and does not include any ecological assessments, such
as discussion of impacts to wildlife or the environment.
1 In January 2010, the Michigan Department of Environmental Quality (MDEQ) merged with the Michigan
Department of Natural Resources (MDNR) and became the Michigan Department of Natural Resources and
Environment (MDNRE). In March 2011, the MDNRE was once again split into the MDEQ and MDNR.

10
Background
The former burn area (FBA) (also known as the Gratiot County Golf Course site or Velsicol
Burn Pit) covers about five acres within the east side of the Hidden Oaks Golf Course2 on
Monroe Road in St Louis, Michigan (EPA 2010). It is across the Pine River from the former
Velsicol Chemical Corporation manufacturing plant. The site includes an inactive waste burning
and disposal site (Dames & Moore 1980), consisting of an open dump, burn pit, brine well, and
brine pond (Lockheed 1982). The site is surrounded by a golf course and, to the east, a
residential area (Weston 2009). See Figure 1.
The FBA was a disposal site for solid and liquid waste from the former plant site and solid waste
from the city of St Louis (Weston 2006). The Velsicol Chemical Corporation manufacturing
plant burned waste liquids weekly, from approximately 1956 to 1970 (EPA 2010). In 1963, the
site expanded northwest of the original site, and the area used in the 1950s was covered in
vegetation (Lockheed 1982).
The dumpsite for the plant was used for disposal of polybrominated biphenyls (PBB), tris(2,3-
dibromopropyl)phosphate (TRIS), dichlorodiphenyl trichloroethane (DDT), and filter cakes from
bromide operations (Lockheed 1982). Records were not available on all materials burned or
disposed of at this site. Additional materials that may have been disposed of include: magnesium
oxide wastes, sodium chloride wastes, DDT waste, TRIS and other hydrocarbon wastes, and
heavy metal residues (such as copper, cobalt, and zinc) (Dames & Moore 1980).
A gravel pit, east of the FBA, was formerly used for disposal of general refuse and municipal
materials, and possibility some general refuse and waste materials from the plant. Another pit
was identified south of the FBA. That pit was used in the 1940s to 1950s for storage of calcium
chloride brine for the chemical plant (Dames & Moore 1980).
The FBA, originally a gravel pit approximately 100 feet long and 30 feet wide (Dames and
Moore Aug 1980), was sold in 1970. A 9-hole golf course (Edgewood Farms Golf Course) was
constructed in 1972 around the FBA and is currently part of the Hidden Oaks Golf Course. As
part of the construction activities, the gravel pit was filled and graded after the 1970 purchase
and was re-graded in 1978 (Dames & Moore 1980).
This area was originally proposed to the NPL in 19823, but not added to the final list before
deletion (EPA 2010). In 1983, the responsible party excavated the contaminated soil to different
depths depending on the extent of the contamination. The MDEQ4 monitored contaminant levels
and requested additional excavation for an area with elevated levels of DDT. After removal of an
additional 300 cubic yards, no detectable DDT was present.
2 A 9- hole golf course was originally built around the FBA. Later another nine holes were added to the west and all
18 holes are now the Hidden Oaks Golf Course. 3 The site was identified with an identification number of MID980794531 and was also called Edgewood Farms
Golf Course Site when proposed to the NPL in 1982. 4 At the time of this work, the MDEQ was the Michigan Department of Natural Resources (MDNR).

11
Figure 1: Map of the Gratiot County Golf Course (also known as the Former Burn Area [FBA] National Priorities List (NPL) site
(EPA ID# MIN000510389). The FBA boundary is approximate.
Gratiot County
Approximate location of the
FBA (surrounded by the Hidden
Oaks Golf Course)

12
A one to four foot layer of a substance, visually identified as magnesium oxide, was left in place
and was located just below the imported fill layer. The excavated areas were filled with material
from adjacent land, covered with six inches of topsoil, seeded, and mulched (CRA 1982).
All excavated material was disposed of at the Velsicol plant site located across the river. Among
the material removed was domestic refuse and industrial waste, plastic sample bags (containing
magnesium oxide), 25 empty drums, and 14 drums containing material such as silica gel, hypo
crystals (sodium thiosulfate), magnesium oxide, and filter cakes (CRA 1982). Groundwater
(1.2474 million gallons) was also collected and disposed of by deep well injection on the
Veliscol plant site. Levels of contaminants in groundwater were measured in three samples and
one duplicate. PBB was not detected, but hexabromobenzene (HBB), DDT, and TRIS were
detected in the samples (CRA 1982). The excavation and groundwater collection activities
resulted in deletion of the site from the NPL in 1983.
Soil and groundwater contamination at the FBA was identified in 2006 and the site was again
proposed to the NPL in September 2009 and placed on the NPL in March 2010. Two ash piles,
identified during the work in 2006, are present at the site along with an estimated 345,606 square
feet of contaminated soil. Municipal and private residential wells, water supplies for about
20,000 residents, are located within three miles of this site (EPA 2010).
Discussion
Environmental contaminant data were compared to soil, sediment, soil gas, and water screening
levels. See Appendix A for description of the screening levels.
If maximum contaminant levels were above the screening level, averages and 95% upper
confidence levels (95% UCL) of the averages were calculated by the EPA’s ProUCL (version
4.00.05)5. Contaminants with averages or 95% UCLs above the screening levels are discussed in
the Exposure Pathways section. Contaminants without screening levels are discussed in the
Contaminants without Screening Levels section.
Environmental Contamination
Since the previous work at the site, there have been two investigations into contaminants present
at the FBA. The first investigation, in 2004-2005, identified contamination remaining at the site
from the disposal activities decades earlier (Weston 2006). Appendix A contains tables of all
chemicals detected during this investigation. A more recent investigation, in 2007-2008, further
characterized contamination of the FBA and identified offsite migration of the contaminants
(Weston 2009). Appendix B contains tables of all chemicals detected during the more recent
investigation.
Site Geology
Three units of unconsolidated material are below the site, the shallow outwash, till, and lower
outwash units. The shallow outwash unit is the layer extending 20 to 30 feet below ground
surface (bgs) and is composed of fill (from the excavation), alluvium (material deposited by
running water), and lacustrine (material formed in lakes) deposits. The till unit is below the
5 The EPA’s ProUCL (version 4.00.05) can be downloaded for free at
http://www.epa.gov/osp/hstl/tsc/softwaredocs.htm.

13
shallow outwash unit, and is composed of sandy silt (sand, gravel, and cobbles). It is 30 to 80
feet thick, with an average of 40 to 45 feet. The lower outwash unit extends from the base of the
till unit (around 80 feet bgs) to the top of the bedrock (approximately 280 feet bgs). This unit is
composed of sand, gravel, silt, and clay (Weston 2009).
Former Burn Area (FBA) Soil Sampling
Soil samples, from borings, were taken in October 2004 from random intervals in the soil cores
and from visibly contaminated soil, when present. Non-aqueous phase liquid (NAPL) was
identified in one of the soil borings. NAPL are liquids that do not dissolve in water and remain
separate from the water. Additional discussion of the NAPL is in the Groundwater Sampling
section. Soil samples were tested for volatile organic chemicals (VOCs), specialty chemicals,
inorganic chemicals, semivolatile organic chemicals (SVOCs), pesticides, and polychlorinated
biphenyls (PCBs) (Weston 2006). Specialty chemicals were HBB, PBB, TRIS, chlordane
(technical), 2,4’-DDT, and para-chlorobenzenesulfonic acid (pCBSA). Table 1 presents the
detected contaminants that were higher than or had no screening levels.
Table 1: Maximum value (in milligrams per kilograms [mg/kg]) of detected contaminants that
were higher than or had no screening levels in 17 soil samples from the 2004 soil borings
(Weston 2006).
Analyte Screening levela (mg/kg) Maximum value in FBA
soil (mg/kg) 2,4-DDT NAb 0.023
arsenic, total 7.6 10.4 calcium, total NA 87,000
delta-BHC NA 0.043c
methyl acetate NA 0.99
potassium, total NA 1,200
Bold values are higher than the screening level. DDT = dichlorodiphenyl trichloroethane BHC = benzenehexachloride a = Unless otherwise noted, the screening level is the MDEQ Residential Direct
Contact Criteria. Details on the screening level are in Appendix A. b = NA, “not available” indicates that no screening levels are available. c = This value is an estimated result.
Arsenic levels in two of 17 samples were higher than the screening level. One sample was from a
depth of seven to nine feet bgs and the other sample was from soil one to three feet bgs. The
average of the five soil samples collected at less than three feet deep was 4.6 milligrams per
kilogram (mg/kg).6 This value is below the arsenic screening level of 7.6 mg/kg
7. Other
contaminants are discussed in the Contaminants without Screening Levels section.
6 The average of the soil arsenic values, a total of 17 from all depths, was 4.6 mg/kg and the 95% upper confidence
limit of the average (UCL) was 5.6 mg/kg. The 95% UCL is a value that would be higher than the true average
contaminant level 95% of the time. It is used as a conservative value to make sure that, even if there were limited
samples, higher levels of contaminants that may be present at the site are accounted for. 7 The 95% UCL could not be calculated, as there were only five values in this group.

14
Additional soil borings were done in 2007, and seventy surface and vadose zone soil samples
were taken. Surface soil was collected from zero to 0.5 feet bgs. The vadose zone is the soil
between the land surface and the water table, including the capillary fringe (a zone above the
water table that is saturated with water). Vadose zone samples, at least one per boring, were
collected at random intervals above the capillary fringe if no contamination was identified8
(Weston 2009).
Soil samples were tested for VOCs, pesticides, inorganic chemicals, and specialty chemicals.
Select samples were also tested for pCBSA, dioxins, and furans. Dioxin and furan levels are in
Table B-8 in Appendix B. They were not detected above applicable screening levels. NAPL was
not identified in any of the soil borings from this sampling (Weston 2009). Table 2 presents the
maximum value of detected contaminants in soil samples that were higher than or had no
screening levels.
Table 2: Maximum value (in milligrams per kilograms [mg/kg]) of detected contaminants that
were higher than or had no screening levels in 66 soil samples from the 2007 sampling (Weston
2009).
Analyte Screening levela (mg/kg) Maximum levels in all soil
depths (mg/kg) 2,4-DDT NAb 0.64c
arsenic, total 7.6 21 calcium, total NA 103,000c
lead, total 400 810 PBB 1.2 5.4
d
potassium, total NA 1,510c
Bold values are those higher than the screening level. DDT = dichlorodiphenyl trichloroethane PBB = polybrominated biphenyls a = Unless otherwise noted, the screening level is the MDEQ Residential Direct Contact
Criteria. Details on the screening level are in Appendix A. b = NA, “not available”, indicates that no screening levels are available. c = The value is an estimated result. d = The value is estimated below the level which the analytical method can accurately
detect.
Three out of 70 soil samples were higher than the arsenic screening level. These 3 samples were
from depths of zero to 0.5 feet bgs, two to three feet bgs, and 13 to 14 feet bgs. Thirty-three
samples were collected from soil less than 0.5 feet deep. People are most likely to come into
contact with soil closest to the ground surface. The average arsenic value for the 33 samples
collected from soil less than 0.5 feet deep was 3.0 mg/kg, and the 95% UCL was 3.5 mg/kg9. The
three samples higher than the PBB screening level were all from zero to 0.5 feet bgs, and the one
sample above the lead screening level was from 13 to 14 feet bgs. The average PBB level, for the
33 samples collected from less than 0.5 feet deep was 0.39 mg/kg and the 95% UCL was 1.2
8 Contamination was identified visually or with a photoionization detector (a machine to detect organic chemicals). 9 For all 70 samples, the average arsenic value was 3.6 mg/kg and the 95% UCL was 4.0 mg/kg.

15
mg/kg10
. The soil lead levels, for the 33 samples collected from less than 0.5 feet deep averaged
11.2 mg/kg and the 95% UCL was 13.3 mg/kg11
. All averages and 95% UCLs were below or
equal to the applicable screening levels. Contaminants with no screening levels are discussed in
later sections.
Residential Area Soil Sampling
Thirty-two surface soil samples (all from 0 to 0.5 feet bgs) were taken from the residential area
east and northeast (downwind) of the FBA in December 2007. Samples were tested for SVOCs,
pesticides, inorganic, and specialty chemicals (Weston 2009). Table 3 presents the maximum
value of detected contaminants that were higher than or had no screening levels.
One of the samples, of the two higher than the screening level for arsenic, was in an area
adjacent to the golf course and the other was two streets to the east of the golf course. The
maximum value, 35 mg/kg, was determined to be a laboratory error (S. Cornelius, MDEQ,
personal communication, 2011). With that value removed, the average soil arsenic level was 4.4
mg/kg and the 95% UCL was 4.8 mg/kg. Both the average and 95% UCL were below the arsenic
screening level. Contaminants with no screening levels will be discussed in later sections.
Table 3: Maximum value (in milligrams per kilograms [mg/kg]) of detected contaminants that
were higher than or had no screening levels in 32 downwind residential soil samples (0 to 0.5
feet deep) from the 2007 sampling (Weston 2009).
Analyte Screening levela (mg/kg) Maximum levels in surface soil
(mg/kg) 2,4-DDT NAb 0.054c
arsenic, total 7.6 8.0 calcium, total NA 68,000
potassium, total NA 1,290c Bold values are those higher than the screening levels. DDT = dichlorodiphenyl trichloroethane a = Unless otherwise noted, the screening level is the MDEQ Residential Direct Contact
Criteria. Details on the screening level are in Appendix A. b = NA “not available” indicates that no screening levels are available. c = The value is an estimated result.
Ash Pile Sampling
Two ash piles are located in a wooded area that while not on golf course property, could be
considered to be in the rough (areas outside of the fairway or green with taller or thicker grass) or
out of bounds (a non-playable area) for the golf course. These piles are visible through the
vegetation growing on them, which may not prevent ash from blowing onto the golf course. One
sample from each of the two ash piles (two samples total) on site were analyzed for VOCs,
SVOCs, PCB/pesticides, inorganic chemicals, and specialty chemicals in 2004 (Weston 2006).
The ash piles were not sampled in the second investigation. Table 4 presents the detected
contaminants in the ash piles that were higher than or had no screening levels.
10 The average PBB value for all 70 samples was 0.22 mg/kg and the 95% UCL was 0.79 mg/kg. 11 The average lead level, for all samples, was 19.6 mg/kg and the 95% UCL was 69.6 mg/kg.

16
The two samples from the ash piles were both higher than the screening levels for arsenic and
lead. Since only two samples were taken from the surface of the pile, the size of the piles and the
range of contaminant concentrations are unknown. Arsenic and lead are discussed in the
Exposure Pathways section.
Table 4: Maximum value (in milligrams per kilograms [mg/kg]) of detected contaminants that
were higher than or had no screening levels in two ash samples collected in 2004 (Weston 2006).
Analyte Screening levela (mg/kg) Maximum value in ash
samples (mg/kg) arsenic, total 7.6 62.4 calcium, total NAb 25,000 dibenzofuran NA 0.54c
lead, total 400 670 methyl acetate NA 0.19d
Bold values are higher than the screening level. a = Unless otherwise noted, the screening level is the MDEQ Residential Direct Contact
Criteria. Details on the screening level are in Appendix A. b = NA ”not available” indicates that no screening levels are available. c = The value is estimated below the level which the analytical method can accurately
detect. d = The value is an estimated result.
Soil Gas Sampling
Nine soil gas samples were taken in the FBA from various depths (all between 1.0 and 24.3 feet
bgs) in October 2005. Soil gas samples were analyzed at an on-site mobile laboratory. One
sample, from the location where on-site analysis found the highest contaminant concentrations,
was sent to an off-site laboratory for analysis (Weston 2006). It should be noted that there are no
buildings in this area. Soil gas levels that are elevated above screening levels may indicate that if
any buildings are built on the site,12
they might have soil contaminants seeping into indoor air
that could be harmful to human health. If no buildings are present at the location, no indoor air
contamination is possible.
Results were compared to shallow and deep soil gas screening levels (MDEQ 2009); however,
soil gas samples from less than five feet deep may not be informative. Soil gas levels taken from
less than five feet deep can be influenced by the ambient air (Amy Salisbury, MDEQ, personal
communication, 2010) and be a reflection of chemicals present in the aboveground air while the
samples are being collected. Soil gas levels were higher than the screening levels for twelve
analytes, and five analytes do not have screening levels. See Table A-3, in Appendix A, for the
levels of the analytes and the screening levels.
12 There are no plans at this time to build any buildings on the FBA.

17
Hydrogeology
Groundwater for the shallow outwash and till units flows southeast toward the Pine River from
the eastern portion of the site, and west and southwest from the western part of the FBA. Based
on information from four monitoring locations, groundwater in the lower outwash unit flows
southeast, toward the Pine River (Weston 2006).
Groundwater Sampling
Groundwater samples were taken during the October 2004 soil investigation at the FBA. As
contaminants were identified in the samples, monitoring wells were installed in the FBA.
Shallow monitoring wells were installed in the shallow outwash unit between October 2004 and
March 2005. NAPL was present in one of the shallow wells. NAPL had been observed in two
monitoring wells during installation. The NAPL was sampled from one well, and identified as
1,2-dichloroethane and benzene. The NAPL was estimated to be 18 inches thick. NAPL,
composed of the above or other chemicals, might be present at other locations (Weston 2006).
Monitoring wells are present in shallow, intermediate, and deep units of groundwater and would
be able to identify NAPL in shallower or deeper groundwater.
Vertical aquifer sampling (VAS) was done to determine the extent of contamination in the lower
outwash unit groundwater. Select samples were measured for VOCs; SVOCs; PCBs, pesticides,
and specialty chemicals; and inorganic chemicals (Weston 2006). Table 5 presents the maximum
value of detected contaminants from the VAS that exceeded or had no screening levels.
Table 5: Maximum value (in milligrams per liter [mg/L]) of contaminants that either had no
screening level or exceeded the screening levels in 17 groundwater samples from soil borings
(vertical aquifer sampling) sampled in 2004 (Weston 2006).
Analyte Screening levela (mg/L) Maximum value (mg/L) benzene 11 14
calcium, dissolved NAb 186
calcium, total NA 314
potassium, dissolved NA 11.9
potassium, total NA 5.41c
Bold values are higher than the screening level. a = Unless otherwise noted, the screening level was the MDEQ’s Groundwater Contact
Criteria. Details on the screening level are in Appendix A. b = NA “not available” indicates that no screening level was available. c = The value is an estimated result.
Only benzene, in one sample, was above the screening levels. This sample was taken from 24 to
26 feet bgs. Benzene is discussed in the Exposure Pathways section. Calcium and potassium are
discussed in the Contaminants without Screening Levels section.
Two of the 22 monitoring wells sampled in October 2005 had detectable levels of pCBSA
(Weston 2006). This chemical has since been detected in all six of the municipal wells (S.
Cornelius, MDEQ, personal communication, 2011). Levels of pCBSA in municipal wells are

18
below levels considered to be protective of human health13
(M. Joseph, MDEQ, personal
communication, 2011). Detailed municipal well data is not included as none of the wells are
located on the FBA. Several of the municipal wells are located to the east of the FBA and the
others are located across the Pine River near the Velsicol Chemical Corp. Superfund site. Table
A-6 presents the maximum pCBSA level from monitoring wells tested in 2005. Levels of
pCBSA in the groundwater samples were below the applicable screening level.
In May to June 2005, monitoring wells were sampled for VOCs; SVOCs; pesticides, PCBs,
specialty chemicals; and total or dissolved inorganic chemicals. Samples from the monitoring
wells were taken again in October 2005 and analyzed for the same contaminants (Weston 2006).
Table A-5 presents the results of those sampling events. These wells were sampled again along
with additional monitoring wells installed between fall of 2007 and spring of 2008.
The new wells were screened in the shallow outwash (shallow), till (intermediate), and lower
outwash (deep) units (three in each unit). The horizontal and vertical extent (VAS) of the
contamination was assessed at the three locations. Two intermediate depth wells were installed in
the till unit, in the downwind residential area, in fall 2007. They were screened between 39 to
60.5 feet bgs. Two deep wells were also installed in the downwind residential area. (Weston
2009). Table B-3 presents the maximum level of contaminants from the VAS. None of the
contaminants were above the applicable screening levels14
.
Groundwater samples from monitoring wells, screened in various depths below the ground
surface, were collected in 2008. Samples were analyzed for VOCs, SVOCs, pesticides, specialty
chemicals, and total inorganic chemicals. Select samples were analyzed for pCBSA, PCBs,
dissolved inorganic chemicals, and hexavalent chromium (Weston 2009).
Table 6 through 9 presents maximum values of contaminants found in the monitoring wells that
were higher than or had no screening levels. No compounds from upper or lower till unit
monitoring wells were detected above screening levels; however, several analytes did not have
screening levels.
Benzene was detected above the screening level in three monitoring wells. The wells were
screened from six to 11 feet (shallow outwash unit), 33 to 38 feet (till unit), and 43.5 to 48.5 feet
(till unit) bgs. Elevated levels of benzene were previously detected in two of the three wells. The
maximum arsenic level was also higher than the screening level. The other analytes that were
higher than the screening level were estimated below the detection limit. These analytes are
discussed in the Exposure Pathways section.
13 The MDEQ has a Residential Drinking Water Criterion of 7.3 mg/L for pCBSA. 14 There was no screening level for total trihalomethanes, which is a group of chemicals with one carbon and three
halogens, such as bromine or chlorine. Although there is no screening level for total trihalomethanes, individual
screening levels are available for many of the chemicals included in this group, such as chloroform, bromoform, and
bromodichloromethane.

19
Table 6: Maximum value (in milligrams per liter [mg/L]) of detected compounds that either
exceeded their respective screening value or had no screening levels in the Former Burn Area
(FBA) 17 groundwater samples from the shallow outwash unit monitor wells sampled in 2008
(Weston 2009).
Analyte Screening levela (mg/L) Maximum value
(mg/L) 1,2,3-trichlorobenzene NAb 5c 1,2,3-trimethylbenzene NA 1c
1,2-dibromo-3-chloropropane 0.390 5c
2,4-DDT NA 0.001c aldrin 0.00034 0.001
c anthracene 0.043 0.5
c
arsenic, total 4.3 10d
benzene 11 99 calcium, dissolved NA 3,590d
calcium, total NA 5,180d cyclohexane NA 5c delta-BHC NA 0.002c
fluoranthene 0.21 0.5c
pentachlorophenol 0.2 10c
potassium, dissolved NA 110d potassium, total NA 120d
pyrene 0.14 0.5 c
trihalomethane (total) NA 3.2 Bold values are higher than the screening level. DDT = dichlorodiphenyl trichloroethane BHC = benzenehexachloride a = The screening level was the MDEQ’s Groundwater Contact Criteria. Details on
the screening level are in Appendix A. b = NA indicates that no screening levels are available. c = The value is estimated below the level which the analytical method can accurately
detect. d = The value is an estimated result within the accurate range of the analytical
method.
None of the chemicals measured from the upper or lower till monitoring wells (Table 7 and
Table 8) with screening levels were detected above their respective screening levels. Monitoring
wells installed in the lower outwash unit access groundwater from the same groundwater unit
that residential drinking water wells would access. However, since no drinking water wells are
located in the FBA, the analyte values from these wells were only compared to screening levels
protective for workers coming into contact with the groundwater. Although there are no drinking
water wells installed in the FBA, drinking water wells are in the vicinity of the FBA, and there
are no restrictions on the installation of drinking water wells in this area.

20
Table 7: Maximum value (in milligrams per liter [mg/L]) of detected compounds with no
screening levels in the Former Burn Area (FBA) seven groundwater samples from the upper till
unit monitor wells sampled in 2008 (Weston 2009).
Analyte Maximum value (mg/L) 2,4-DDT 0.0049
calcium, dissolved 8,250a calcium, total 17,400a
potassium, dissolved 53a potassium, total 77a
a = The value is an estimated result.
Table 8: Maximum value (in milligrams per liter [mg/L]) of detected compounds with no
screening levels in the Former Burn Area (FBA) two groundwater samples from the lower till
unit monitor wells sampled in 2008 (Weston 2009).
Analyte Maximum value (mg/L) 2,4-DDT 0.00001a
calcium, dissolved 321b calcium, total 309b
potassium, dissolved 4.5 potassium, total 4.6
DDT = dichlorodiphenyl trichloroethane a = The value is estimated below the level which the analytical method can
accurately detect. b = The value is an estimated result within the accurate range of the
analytical method.
Table 9 presents the analytes detected in the lower outwash unit monitoring wells that have no
screening levels. No concentrations of compounds exceeded screening levels.
Table 9: Maximum value (in milligrams per liter [mg/L]) of detected compounds with no
screening levels in the Former Burn Area (FBA) eight groundwater samples from the lower
outwash unit monitor wells sampled in 2008 (Weston 2009).
Analyte Maximum value (mg/L) 2,4-DDT 0.000051
calcium, dissolved 618a calcium, total 674a cyclohexane 0.005b
potassium, dissolved 6.6a potassium, total 6.4a
DDT = dichlorodiphenyl trichloroethane a = The value is an estimated result within the accurate range of the analytical
method. b = The value is estimated below the level which the analytical method can
accurately detect.

21
Residential Well Sampling
A residential well on Prospect Street and one on the Hidden Oaks Golf Course were tested for
VOCs, SVOCs, pesticides, PCBs, specialty chemicals, inorganic chemicals, and water quality
parameters in 2002. (Weston 2006). The Hidden Oaks Golf Course well is also used for
irrigation at the golf course. Table 10 presents the detected contaminants present that were higher
than or had no screening levels.
The Prospect Street well contained arsenic and chloride levels above drinking water screening
levels. The concentrations of several analytes were estimated values higher than the screening
levels (2,4-DDT, bis(2-ethylhexyl)phthalate, and n-nitroso-di-n-propylamine). Arsenic, chloride,
2,4-DDT, bis(2-ethylhexyl)phthalate, and n-nitroso-di-n-propylamine are discussed in the
Exposure Pathways section.
Another residential well was sampled on Orchard Court, which is adjacent to the FBA, and
tested for pCBSA. This contaminant was not detected (Weston 2009).
Table 10: Maximum value (in milligrams per kilogram [mg/kg]) of detected contaminants that
were higher than or had no screening levels in three drinking water wells sampled in 2002
(Weston 2006).
Analyte Drinking water
screening levelsa
(mg/L)
Hidden Oaks Golf
Course well values
(mg/L)
Maximum value from
two residential wells on
Prospect St (mg/L) 2,4-DDT NAb 0.00002c 0.00002c
arsenic, total 0.01 0.0032c 0.0234 bis(2-ethylhexyl)phthalate 0.006 0.013
c 0.01c
calcium, total NA 53.1 143 chloride 250 15 345
HEM, oil and grease NA 5c 5c
n-nitroso-di-n-propylamine 0.005 0.013c 0.01
c
potassium, total NA 1.04 2.98
Bold values are those that exceed the drinking water screening level. DDT = dichlorodiphenyl trichloroethane HEM = n-hexane extractable material a = Unless otherwise noted, the screening level is the MDEQ Part 201 Residential Drinking
Water Criteria. Details on the screening level are in Appendix A. b = NA “not available” indicates that no screening levels are available. c = The value is estimated below the level which the analytical method can accurately detect.
Surface Water and Sediment Sampling
Five surface water and seven sediment samples were taken from a drainage ditch next to the
FBA in January 2008. They were tested for VOCs, SVOCs, pesticides, specialty chemicals,
including pCBSA, inorganic chemicals, and general water chemistry15
(Weston 2009). No
15 Except for the oil and grease analysis, these analytes are not included in Table 11. These often do not have
screening levels and do not directly affect human health.

22
concentrations exceeded screening levels. Table 11 presents the detected contaminants in surface
water samples that had no screening levels. These analytes are discussed in the Contaminants
without Screening Levels section.
Table 11: Maximum levels (in milligrams per liter [mg/L]) of detected compounds with no
screening levels in five surface water samples from a drainage ditch adjacent to the Former Burn
Area (FBA) sampled in 2008 (Weston 2009).
Analyte Maximum value (mg/L) 2,4-DDT 0.00001a
calcium, total 134b chloride 124b
oil and grease 11a potassium, total 5.9b
sulfate 100b DDT = dichlorodiphenyl trichloroethane a = The value is estimated below the level which the analytical method can
accurately detect. b = The value is an estimated result within the accurate range of the analytical
method.
Sediment cores were collected from the drainage ditch, to a depth of one to three feet. The
sediment cores were homogenized (mixed) before testing. They were analyzed for VOCs,
SVOCs, pesticides, total organic carbon, specialty, and inorganic chemicals. Two of the
sediment samples were analyzed for pCBSA (Weston 2009). No detected compounds had levels
higher than screening levels. Table 12 presents the maximum level of detected contaminants that
had no screening levels. These are discussed in the Contaminants without Screening Levels
section.
Table 12: Maximum levels (in milligrams per kilograms [mg/kg]) of detected compounds with
no screening levels in seven sediment samples from a drainage ditch adjacent to the Former Burn
Area (FBA) sampled in 2008 (Weston 2009).
Analyte Maximum levels (mg/kg) 2,4-DDT 0.14a
calcium, total 82,200b potassium, total 700b
DDT = dichlorodiphenyl trichloroethane a = The value is estimated below the level which the analytical method can
accurately detect. b = The value is an estimated result within the accurate range of the analytical
method.
Exposure Pathways Analysis
An exposure pathway contains five elements: (1) the contaminant source, (2) contamination of
environmental media, (3) an exposure point, (4) a human exposure route, and (5) potentially
exposed populations. An exposure pathway is complete if there is a high probability or evidence

23
that all five elements are present. Table 13 describes human exposure pathways to contaminants
at the Gratiot County Golf Course, St Louis (Gratiot County), Michigan.
Table 13: Exposure pathway for contaminants present at the Former Burn Area (Velsicol Burn
Pit) at the Gratiot County Golf Course National Priorities List Site, St Louis (Gratiot County),
Michigan.
Source Environmental
Medium
Exposure
Point
Exposure
Route Exposed Population
Time
Frame Exposure
Materials
burned and
disposed of at
the FBA
Groundwater
Groundwater
wells for
irrigation
Dermal
contact and
inhalation
People who work at
or visit the golf
course (adjacent to
the FBA)
Past
Present
Future
Potential
Materials
burned and
disposed of at
the FBA
Soil Soil
Incidental
ingestion
and dermal
contact
People who work or
visit the golf course
(adjacent to the
FBA)
Past
Present
Future
Potential
Materials
burned and
disposed of at
the FBA
Air Air downwind
of the FBA Inhalation
People who live or
visit the downwind
residential area
Past Potential
Present
Future Eliminated
Materials
burned and
disposed of at
the FBA
Suspended dust
or soil in the air
Soil in the
downwind
residential
area
Incidental
ingestion
and dermal
contact
People who live or
visit the downwind
residential area
Past
Present
Future
Potential
Materials
burned and
disposed of at
the FBA
Groundwater Drinking
water wells Ingestion
People who live,
work, or visit areas
near the FBA
Past
Present
Future
Potential
Soil and ash samples from the FBA
Soil samples at the site exceeded the screening levels for arsenic, lead, and PBB. Arsenic
exceedences represented about 6% of the total soil samples tested from the FBA for the two
investigations combined (Weston 2006, 2009). The arsenic levels ranged up to a maximum of
about three times (21 mg/kg) the arsenic screening level. The average and 95% UCL levels for
the two soil investigations were below the screening level of 7.6 mg/kg. Although certain spots
on the site have elevated arsenic levels, they are not consistently elevated across the site. The soil
sample depths for all samples ranges from zero to 14 feet bgs. It is not expected that people will
come into contact with soil deep below the ground surface. The average arsenic level for soil
samples collected less than 0.5 feet bgs was 3.0 mg/kg and the 95% UCL was 3.5 mg/kg, both
below the screening level of 7.6 mg/kg.
Estimated results of three soil samples, collected in the second investigation (Weston 2009),
were higher than the PBB screening level and had an estimated maximum of 5.4 mg/kg. These
samples were collected from zero to 0.5 feet bgs. The results are estimated values because they
are lower than the lower detection limit for the analytical methods. However, the lower detection

24
limit was higher than the screening level. The average PBB level for the soil samples collected
from less than 0.5 feet deep was 0.39 mg/kg, and the 95% UCL was 1.2 mg/kg. Overall, the PBB
levels in the soil samples were below or equal to the screening level of 1.2 mg/kg.
Only one soil lead level, 810 mg/kg, collected from 13 to 14 feet bgs, was higher than the
screening level. The soil lead levels for the soil samples collected from less than 0.5 feet deep
averaged 11.2 mg/kg, and the 95% UCL was 13.3 mg/kg. Both are below the lead screening
level of 400 mg/kg.
One ash sample was collected for each of the two ash piles16
. Both ash piles samples exceeded
the lead and arsenic screening levels. The ash piles have vegetation growing on them, but still are
visible.
Visitors to the area adjacent to the FBA, such as golfers, are expected to have little or no contact
with contaminants from soil or ash piles. The FBA is not part of the golf course property and is
considered “out of bounds” for the golf course. However, there are no fences or signs that would
prevent golfers or other visitors from walking into the FBA.
Golf course rules require the use of soft spikes (Hidden Oaks Golf Course, Rules and
Regulations17
), which are plastic cleats that minimize damage to the turf grass. The use of these
plastic cleats will result in little or no soil exposure for golfers from their golf shoes. The
averages and 95% UCLs for arsenic, PBB, and lead levels in the soil are below the screening
levels. People are expected to have little to no contact with the soil; people’s health is not
expected to be harmed by the levels of these contaminants.
Workers at the golf course may have dermal contact with soil or the ash piles. Although the soil
and ash piles are not part of the golf course, workers may enter the FBA at times. No fences are
present to prevent people from going into the FBA. Although levels of arsenic, lead, and PBB in
several soil samples are higher than the screening levels, averages and 95% UCLs are below the
screening levels. It is not expected that workers at the golf course will be exposed to levels of
contaminants in the soil that will cause health effects.
Although workers or visitors to the golf course are not expected to spend much time in the FBA,
levels of arsenic and lead are elevated in the two ash samples. Further characterization of the ash
piles is necessary to determine the size of the ash piles and the uniformity of the contamination
present. Ash piles were identified during monitoring well installation and the size of the ash piles
are unknown. Arsenic and lead will be discussed in the Toxicological Evaluation section.
Soil samples from a residential area near the FBA
Soil samples were taken in the downwind residential area, a neighborhood east of the FBA on
the same side of the Pine River. Two of the downwind residential soil samples (35 total) were
higher than the arsenic screening level. The soil samples were taken from zero to 0.5 feet bgs.
The maximum arsenic level in the samples was 8.0 mg/kg, but the average level and the 95%
16 As only one sample was collected from each ash pile, averages and 95% UCL could not be calculated. 17 The Hidden Oaks Golf Course Rules and Regulations can be found at: http://www.hiddenoaksgolf.com/node/3
(accessed March 2011).

25
UCL were below the screening level of 7.6 mg/kg. It is not expected that resident’s health would
be affected by the arsenic levels as they are not consistently elevated in the soil of the residential
area.
Groundwater samples from the FBA
The three shallow outwash unit wells (the ones closest to the ground surface) were higher than
the screening levels for arsenic, aldrin, pyrene, pentachlorophenol, fluoranthene, benzene,
anthracene, and 1,2-dibromo-3-chloropropane (DBCP). One well detected benzene above
screening level values; a second well contained DBCP, benzene and arsenic above screening
values; and a third well had arsenic, aldrin, pyrene, pentachlorophenol, fluoranthene, benzene,
and anthracene above screening values. Several of the chemicals, aldrin, pyrene,
pentachlorophenol, fluoranthene, anthrancene, and DBCP, had estimated values as the values
were below the detection levels. These detection levels were higher than the screening levels. All
groundwater samples with contaminants higher than the screening levels were from wells
screened at least six to 11 feet bgs. The golf course workers are expected to have little to no
contact with water from more than six feet bgs. However, since contaminants higher than the
screening levels were only found in the shallow wells, soil contaminants may be migrating
(leaching) into the groundwater.
Although some contaminant levels were above the screening levels, golfers or other visitors to
the site are not expected to have contact with the groundwater. The Hidden Oaks Golf Course
well is used for irrigation, but levels of analytes present (bis(2-ethylhexyl)phthalate at 0.013
mg/L and n-nitroso-di-n-propylamine at 0.013 mg/L) in the water are not expected to harm
people health if they happen to have contact with the water. Furthermore, people are only
expected to have occasional exposure to irrigation or other groundwater as watering would
typically be occurring during the beginning or end of the day. It is not expected that people
visiting or golfing on this site will be exposed to levels of chemicals that will cause health
effects.
Workers contacting groundwater, either pumped to the surface or when digging underground,
could possibility inhale benzene. The maximum levels found from the two investigations were
120 mg/L (Weston 2006) and 99 mg/L (Weston 2009). These values are above the MDEQ’s
Acute Inhalation Screening Level (AISL) of 67 mg/L for benzene. The AISL a level of a
contaminant in groundwater that is not expected to harm a worker’s health if the worker is
breathing in the contaminant for a short amount of time18
. However, since the water with the
elevated benzene levels is from at least six to 11 feet bgs under the FBA, workers are not
expected to encounter groundwater during typical maintenance activities. Benzene was not
detected in the Hidden Oaks Golf Course well (used for drinking water and irrigation), but it was
sampled in 2004. Additional sampling of these wells is necessary to determine if contaminants
have migrated into the groundwater.
Drinking water well samples located near the FBA
Water samples from two residential wells and one at the Hidden Oaks were analyzed for many
contaminants. However, it is not known if concentrations of analytes (bis[2-ethylhexyl]phthalate,
18 This screening level does not take the place of any of the Michigan Occupational Safety and Health
Administration’s (MIOSHA) standards or guidance.
26
n-nitroso-di-n-propylamine) actually exceeded the screening levels. The values for these
chemicals were estimated below the accurate range that could be measured. 2,4-DDT is
discussed in the Contaminants without Screening Levels section.
Chloride (345 mg/L) and arsenic (0.0234 mg/L) were higher than the applicable screening levels,
250 mg/L for chloride and 0.01 mg/L for arsenic, in one of the two residential wells samples.
The EPA notified the residents of these findings. Arsenic is naturally occurring and can be found
in drinking water wells throughout Michigan. Arsenic and chloride will be discussed in the
Toxicological Evaluation section.
Toxicological Evaluation
Arsenic and lead were higher than the screening levels in the two ash pile samples (one from
each pile). Although it is not expected that people will be repeatedly exposed to these chemical
in the FBA, the size of the ash piles are unknown, therefore arsenic and lead are briefly
discussed.
Chloride and arsenic were higher than the screening levels for drinking water in one of the
residential well samples.
Arsenic
Arsenic is commonly present in the Earth’s crust. People ingest small amounts of arsenic in food
and water. Typical levels of arsenic in food are 0.02-0.14 mg/kg (ATSDR 2007A). Foods that
contain arsenic, mainly in the form of organic arsenic, are dairy products, meat, poultry, fish,
grains, and cereal (NAS 2001). Both children and adults can have vomiting, respiratory,
cardiovascular, dermal, and neurological effects from exposure to high levels of arsenic. Dermal
exposure to arsenic can result in direct irritation of skin (ATSDR 2007a).
Arsenic can be found in private drinking water wells throughout Michigan. Arsenic has been
found in Gratiot County drinking water at levels as high as 0.05 mg/L19
. One residential well
sample had an arsenic level that was over the screening level (0.0234 mg/L). Residents with
private drinking wells should have their water tested for arsenic.
Arsenic was found in both of the ash pile samples. The size of the ash piles are not known.
Arsenic levels may be uniform throughout the pile or may be higher or lower in different parts of
the ash piles.
Lead
Lead has been removed from many paints, ceramic products, caulking, pipe solder, and
gasoline. Houses built before the late 1970’s may still have paint containing lead. Children are
often exposed to lead from ingesting paint chips or dust. Although sources of lead have been
reduced people still encounter lead in their daily lives. Almost all (99%) of the publicly supplied
drinking water have less than 5.0 μg/L lead. Lead in food ranged from less than 0.0004 to 0.5234
μg/g. People have an average dietary intake of 1.0 μg/kg/day (ATSDR 2007).
19 A map of Gratiot County and the arsenic levels in the water can be found at
http://www.michigan.gov/documents/deq/deq-wd-gws-ciu-counties21-30-as_270825_7.pdf.

27
Compared to adults, children are more vulnerable to lead poisoning. Children absorb, on
average, 50% of the lead they ingest, while adults absorb between 6-80% depending on recent
food consumption. Although lead can be absorbed through the skin, absorption of inorganic lead
from dermal (skin) exposure appears to be less efficient than absorption from ingestion or
inhalation. In studies measuring the amount of lead absorbed after dermal exposure, people’s
absorption ranged from less than or equal to 0.3% to possibly as high as 30% of the applied dose
(ATSDR 2007).
After absorption by ingestion, inhalation, or dermal exposure, lead is distributed throughout the
body similarly. Because of this and the fact that there is little information on people’s health
effects due to dermal exposure to lead, effects from ingestion are discussed. In both adults and
children, the main target is the nervous system, but lead will affect every organ system (ATSDR
2007).
Lead was found in both of the ash pile samples. As previously stated, the size of the ash piles are
not known. Lead levels may be uniform throughout the pile or may be higher or lower in
different parts of the ash piles.
Chloride
One residential well had a chloride level (345 mg/L) higher than the drinking water screening
level (250 mg/L). People frequently eat chloride in table salt (sodium chloride) (NAS 2004).
People’s bodies typically regulate the levels of chloride they have. Drinking water or coming
into contact with water that has elevated levels of chloride will not harm people’s health,
although eating a lot of salt can contribute to high blood pressure (NAS 2004). Although it will
not harm people’s health, drinking water with elevated chloride may be unpleasant, as it could
have a salty taste. People with most types of water softeners will have higher levels of chloride in
their water.
Contaminants without Screening Levels
Calcium, potassium, 2,4-DDT, and delta-BHC were detected in the soil and groundwater
samples from the FBA. 2,4-DDT was also detected in the sediment and surface water from a
nearby county drain.
Both calcium and potassium are required elements in people. Calcium is required for teeth and
bone formation, along with muscle contracting and blood clotting. Recommended intakes are
1,000 mg/day or higher for people over 9 years of age. The upper limit on the daily intake is
2,500 mg/day for people older than 1 year old. People can obtain calcium from eating milk,
cheese, yogurt, corn tortillas, Chinese cabbage, broccoli, kale, calcium-set tofu (NAS 2001), and
calcium-fortified foods (like orange juice).
Potassium is necessary for the normal functioning of people’s cells. People obtain potassium by
eating fruits, vegetables, meat, and nuts. There is no upper limit on the daily intake set for
potassium because there is no evidence chronic excess intakes of potassium can occur in
apparently healthy individuals (NAS 2004). Most people’s bodies will remove the extra or
unnecessary calcium and potassium.

28
About 15-21% of technical grade DDT was 2,4-DDT. It is less toxic than 4,4-DDT, but 2,4-DDT
can act similar to the hormone estrogen. Laboratory experiments have shown that, 2,4-DDT was
about 100,000 times less effective than estrogen hormones in producing an effect on
reproductive systems (ATSDR 2002). Levels of 2,4-DDT range from 0.023 to 0.64 mg/kg in soil
(from the FBA) and sediment (in a county drain near the FBA), and from 0.00001 to 0.0049
mg/L in surface (in a county drain near the FBA) and groundwater (under the FBA). Adults or
children are not expected to be exposed to levels of 2,4-DDT that would harm their health20
.
Delta-BHC is one of the isomers of the pesticide lindane. Technical grade BHC contained about
6 to 10% of the delta-BHC (ATSDR 2005). It was found in the soil at and in the groundwater
under the FBA. Soil had a maximum amount of delta-BHC of 0.043 mg/kg (estimated value) and
delta-BHC was detected in groundwater, but below the detection limit for the samples (0.002
mg/L). People are expected to have little to no contact with the soil at the FBA and the
groundwater under the FBA.
Methyl acetate and dibenzofuran were detected in the ash piles and methyl acetate was detected
in the soil on the FBA Since people are expected to have limited or no contact with the soil and
ash piles on the FBA, it is not expected that these chemicals will harm people’s health.
1,2,3-Trichlorobenzene, tetrachloroethene, trihalomethane (total), and cyclohexane were detected
in groundwater samples taken from monitoring wells on the FBA. Trichlorobenzenes have been
used, in industry, as solvents, chemical intermediates, and dye carriers. However,
trichlorobenzenes can also be degradation products from other chemicals, such as lindane
(ATSDR 2010). 1,2,3-Trichlorobenzene was only detected, below the reported sample
quantitation limit (5 mg/L), in shallow outwash unit monitor wells at the FBA. People are
expected to have limited to no contact with the groundwater under this site, and people’s health
is not expected to be harmed from contact with water containing this level of 1,2,3-
trichlorobenzene.
Total trihalomethane was found up to 3.2 mg/L in groundwater under the FBA. Total
trihalomethane refers to chemicals that have three halogens, such as bromine and chlorine,
attached to a carbon. Many chemicals, such as bromoform and chloroform are included in this
group. While there is no screening level for total trihalomethane, the screening levels exist for
the individual chemicals that are included in this group. The individual chemicals included in
this group were not above the screening levels. Although people are not expected to have contact
with the groundwater, levels of total trihalomethanes present in the water will not harm people’s
health.
20 If adults or children happened to inhale airborne dust with the maximum level of 2,4-DDT (0.64 mg/kg) from the
FBA daily, the amount of 2,4-DDT ingested would be about 40 to 300 times lower than 0.3 mg/kg/day (a dose given
to rats for two generations with no effect). This assumes adults (70 kg) and children (15 kg) swallow 0.2 kg of soil
daily with 0.64 mg/kg of 2,4-DDT. If adults (70 kg) or children (15 kg) drink water (2 L/day) with 0.0049 2,4-DDT,
the amount of ingested 2,4-DDT would be 459 to 2,142 times lower than the 2,4-DDT amount given to rats for two
generations without an effect (0.3 mg/kg/day). DDT is not absorbed well through the skin, so skin contact with the
water or soil would not add to people’s exposure. The levels present in soil, water, or sediment would not harm
people’s health.

29
Cyclohexane was also detected in FBA groundwater samples at levels below the lower level that
could be accurately measured. People are expected to have little to no contact with groundwater
from the FBA and so will not come into contact with this chemical.
Sulfate and oil and grease were found in the surface water of the county drain near the FBA.
Sulfate had a maximum value of 100 mg/L. The level of sulfate in the water was below the
screening level for drinking water (250 mg/L). People’s health will not be affected by coming
into contact with water containing sulfate. Even if used for drinking water the sulfate levels
would not harm people’s health.
Oil and grease was detected in surface water and in a drinking water sample, however both were
a levels below a level that could be accurately measured by the analytical method used. The oil
and grease detected could have been from normal levels of oil and grease from natural sources,
such as fats from plant material.
Children’s Health Considerations
Compared to adults, children could be at greater risk from certain kinds of exposure to hazardous
substances. Children play outdoors and sometimes engage in hand-to-mouth behaviors that
increase their exposure potential. Children are shorter than adults; this means they breathe dust,
soil, and vapors close to the ground. A child’s lower body weight and higher intake rate results in
a greater dose of hazardous substance per unit of body weight. If toxic exposure levels are high
enough during critical growth stages, the developing body systems of children can sustain
permanent damage. Certain contaminants of concern at these locations, such as lead, produce
greater adverse effects in children as compared to adults. Children may have both increased
absorption and increased susceptibility to these contaminants.
The FBA is located adjacent to a golf course, in an area that could be considered in the rough (an
untended area). As it is not part of the golf course, children visiting the golf course are not
expected to have much contact with the soil or ash piles. As the FBA is surrounded by a golf
course, young children are not expected to encounter contaminants at this site. Older children
and teenagers could make their way onto the FBA, but the vegetation and the depth of
contaminated groundwater and soil would limit the exposure.
Contamination might have migrated off the site, either during the use of the site or from areas
that into the downwind residential areas. Children may encounter contaminants from the site in
their own yards. However, children are not expected to be harmed from the current levels of
contamination present in soil in the residential areas.
Conclusions
Contaminants present in the soil at the FBA will not harm people’s health. Visitors, including
golfers, to the golf course around the FBA are expected to have little to no contact with the soil
as it is not on the golf course, and is covered by vegetation. Golf course workers are not expected
to have contact with the soil.
Not enough information is available to determine if the contaminants present in the ash piles at
the FBA could harm people’s health as only one sample was taken from the surface of each ash
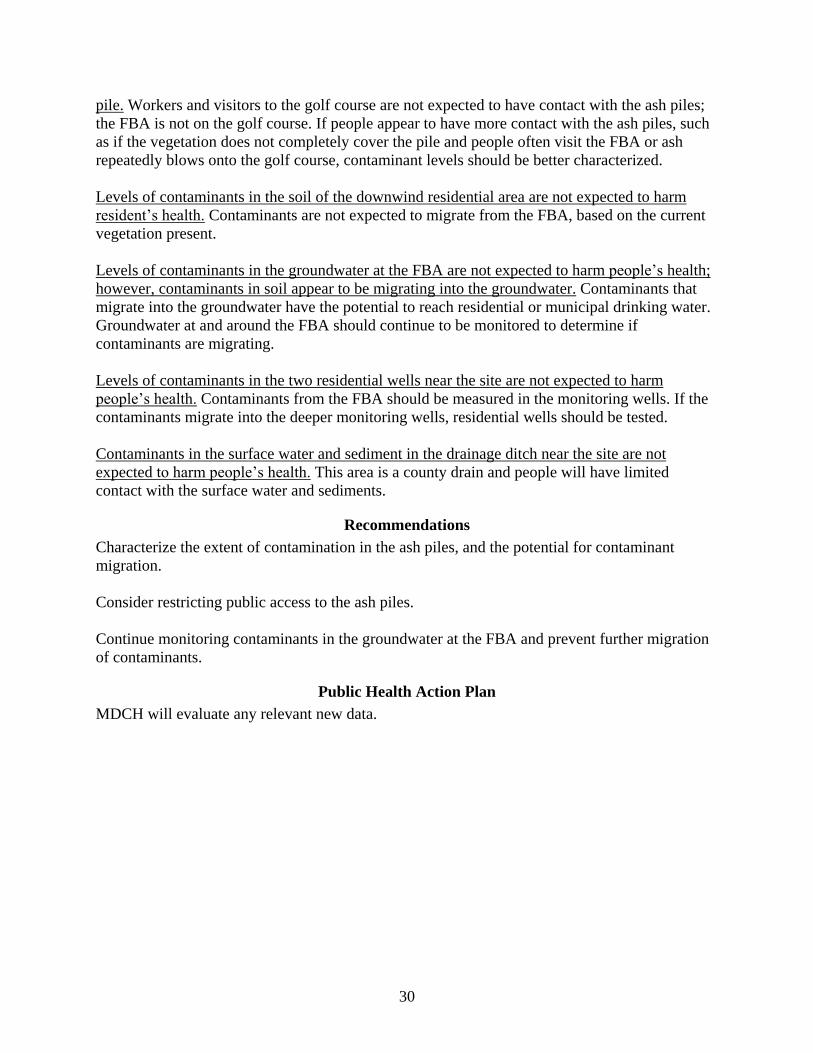
30
pile. Workers and visitors to the golf course are not expected to have contact with the ash piles;
the FBA is not on the golf course. If people appear to have more contact with the ash piles, such
as if the vegetation does not completely cover the pile and people often visit the FBA or ash
repeatedly blows onto the golf course, contaminant levels should be better characterized.
Levels of contaminants in the soil of the downwind residential area are not expected to harm
resident’s health. Contaminants are not expected to migrate from the FBA, based on the current
vegetation present.
Levels of contaminants in the groundwater at the FBA are not expected to harm people’s health;
however, contaminants in soil appear to be migrating into the groundwater. Contaminants that
migrate into the groundwater have the potential to reach residential or municipal drinking water.
Groundwater at and around the FBA should continue to be monitored to determine if
contaminants are migrating.
Levels of contaminants in the two residential wells near the site are not expected to harm
people’s health. Contaminants from the FBA should be measured in the monitoring wells. If the
contaminants migrate into the deeper monitoring wells, residential wells should be tested.
Contaminants in the surface water and sediment in the drainage ditch near the site are not
expected to harm people’s health. This area is a county drain and people will have limited
contact with the surface water and sediments.
Recommendations
Characterize the extent of contamination in the ash piles, and the potential for contaminant
migration.
Consider restricting public access to the ash piles.
Continue monitoring contaminants in the groundwater at the FBA and prevent further migration
of contaminants.
Public Health Action Plan
MDCH will evaluate any relevant new data.

31
Preparers of Report
This Public Health Assessment was prepared by the Michigan Department of Community Health
under a cooperative agreement with the federal Agency for Toxic Substances and Disease
Registry (ATSDR). It is in accordance with the approved agency methods, policies, procedures
existing at the date of publication. Editorial review was completed by the cooperative agreement
partner. ATSDR has reviewed this document and concurs with its findings based on the
information presented. ATSDR’s approval of this document has been captured in an electronic
database, and the approving agency reviewers are listed below.
Author
Jennifer Gray
Toxicologist
ATSDR Reviewer
Trent LeCoultre
Technical Project Officer

32
References
Agency for Toxic Substances and Disease Registry (ATSDR). 2002. Toxicological profile for
DDT, DDE, DDD. Atlanta, GA: U.S. Department of Health and Human Services, Public Health
Service.
Agency for Toxic Substances and Disease Registry (ATSDR). 2005. Toxicological profile for
Hexachlorocyclohexane. Atlanta, GA: U.S. Department of Health and Human Services, Public
Health Service.
Agency for Toxic Substances and Disease Registry (ATSDR). 2007a. Toxicological profile for
Arsenic. Atlanta, GA: U.S. Department of Health and Human Services, Public Health Service.
Agency for Toxic Substances and Disease Registry (ATSDR). 2007b. Toxicological profile for
Lead. Atlanta, GA: U.S. Department of Health and Human Services, Public Health Service.
Agency for Toxic Substances and Disease Registry (ATSDR). 2010. Toxicological profile for
Trichlorobenzenes. (Draft for Public Comment) Atlanta, GA: U.S. Department of Health and
Human Services, Public Health Service.
Conestoga-Rovers and Associates Limited (CRA), Engineering and Construction Report –
Securement of Waste Burning and Disposal Area Golf Course Site, St Louis, Michigan. Prepared
for Velsicol Chemical Corporation. 1982 August.
Dames & Moore. Report – Phase I: Hydrogeologic Evaluation of Inactive Industrial Waste
Burning Site, St Louis, Michigan. Prepared for The Velsicol Chemical Corporation. 1980
August.
Hidden Oaks Golf Course. Course Description – Rules & Regulations Governing Play. [accessed
2011 February 11] Available from: http://www.hiddenoaksgolf.com/node/3.
Lockheed Engineering and Management Services Company, Inc. (Lockheed). Aerial
Photography Analysis of Hazardous Waste Disposal Areas. Las Vegas (NV): U.S.
Environmental Protection Agency, Advanced Monitoring Systems Division; 1982 June. Report
No.: US-AMD-82005c. Contract No.: 68-03-3049.
Michigan Department of Environmental Quality (MDEQ). Remediation and Redevelopment
Division Footnotes: For the Part 201 Criteria/Part 213 Risk-based Screening Levels RRD
Operational Memorandum No.1. 2005 June.
Michigan Department of Environmental Quality (MDEQ). Remediation and Redevelopment
Division Operational Memorandum No. 1, Attachment 1, Table 2. Soil: Residential/Commercial
I Part 201 Generic Cleanup Criteria and Screening Levels; Part 213 Tier 1 Risk-Based Screening
Levels (RBSLs). 2006a January.
Michigan Department of Environmental Quality (MDEQ). Remediation and Redevelopment
Division Operational Memorandum No. 1, Attachment 1, Table 1. Groundwater: Residential and

33
Industrial-Commercial Part 201 Generic Cleanup Criteria and Screening Levels; Part 213 Tier 1
Risk-Based Screening Levels (RBSLs). 2006b January.
Michigan Department of Environmental Quality (MDEQ). Program Redesign 2009: Draft
Proposed Vapor Intrusion Indoor Air Criteria (IAC), Soil Gas Criteria (SGC), and Groundwater
Screening Levels (GWVISLs). http://www.michigan.gov/documents/deq/deq-rrd-PART201-
IndoorAirAndSoilGasCriteria-9-24-09_293422_7.pdf.
Michigan Department of Environmental Quality (MDEQ) Rule 57 Water Quality Values. 2010
October. http://www.michigan.gov/documents/deq/wb-swas-rule57_210455_7.xls.
National Academy of Science (NAS). 2001. Dietary Reference Intakes: Elements. Washington,
DC: The National Academies Press.
http://www.iom.edu/Global/News%20Announcements/~/media/48FAAA2FD9E74D95BBDA22
36E7387B49.ashx
National Academy of Science (NAS). 2004. Dietary Reference Intakes: Electrolytes and Water.
Washington, DC: The National Academies Press.
http://www.iom.edu/Global/News%20Announcements/~/media/442A08B899F44DF9AAD083D
86164C75B.ashx
U.S. Environmental Protection Agency (EPA). Gratiot County Golf Course. [updated 2010 July;
accessed 2011 September 8]. Available from:
http://www.epa.gov/R5Super/npl/michigan/MID980794531.htm.
Weston Solutions, Inc. (Weston). Remedial Investigation (RI) Report for Operable Unit 1 -
Velsicol Chemical Corporation Superfund Site, St. Louis, Gratiot County, Michigan. 2006
November. Prepared for the Michigan Department of Environmental Quality (MDEQ).
Weston Solutions, Inc. (Weston). Remedial Investigation (RI) Addendum Report for Operable
Unit One, Velsicol Chemical Corporation Superfund Site, St. Louis, Gratiot County, Michigan.
2009 January. Prepared for Michigan Department of Environmental Quality (MDEQ).

A-1
Appendix A: Detected contaminants from the 2006 Remedial Investigation (Weston 2006).
This appendix contains tables of all detected contaminants above the reported quantitation limit
from the first investigation (Weston 2006). Screening levels are included in each table.
MDEQ Part 201 Generic Cleanup Criteria (MDEQ 2006a, 2006b) values were selected for
screening levels if they were available. Screening levels for soil and sediment were the MDEQ
Part 201 Residential and Commercial I Direct Contact Criteria (DCC). The DCC are soil
concentrations of contaminants that are not expected to harm people’s health after long-term (30
years) ingestion and dermal contact typical of residential use. If no DCC were available, an
ATSDR soil comparison value was selected. If contaminant concentrations were below the
screening levels, either the DCC or ATSDR soil comparison values, the contaminants are not
expected to harm people’s health. The DCC were also used as screening levels to evaluate
exposure to sediments, such as when people step into the water.
For groundwater, the MDEQ Part 201 Groundwater Contact Criteria (GCC) were used as
screening levels. The GCC is a protective value for workers coming into contact with
groundwater contaminants (for 21 years) and was also used as a screening value to evaluate
contact with surface water. Since the FBA is located within a working golf course, workers
would be the group most expected to have dermal contact with groundwater. The Part 201
MDEQ Residential Drinking Water Criteria (RDWC) were used as screening levels for wells
that are used or are potentially located at a depth that could be used for drinking water. If the
RDWC was not health-based, the human health-based MDEQ Rule 57 value (MDEQ 2010) for
drinking water was selected as a screening level.
Screening levels for soil gas were from the MDEQ Part 201 Program Redesign 2009 Draft
Proposed Residential Soil Gas Criteria (MDEQ 2009). The Residential Soil Gas Criteria are
calculated from the Residential Indoor Air Criteria, levels of chemicals that people can breathe in
their home that are not expected to cause health effects. These levels are only meaningful if a
building is present on the location. If buildings are built on the FBA in the future, the possibility
of soil gas phase contaminant migration into the buildings (vapor intrusion) should be evaluated.
Soil sampling results
Table A-1: Maximum value (in milligrams per kilogram [mg/kg]) of detected compounds at or
above the reported quantitation limit in the Former Burn Area (FBA) soil from soil borings (17
samples) (Weston 2006).
Analyte Screening levela (mg/kg) Maximum value in FBA soil
(mg/kg)
1,1-dichloroethane 890 0.071 Jb
1,2-dichloroethane 91 33
2,4-DDT NAc 0.023
2,6-dinitrotoluene 200d 1.1 Ue
2-methylnaphthalene 8,100 0.47 UJf
4,4-DDD 95 0.38 J
4,4-DDE 45 0.2

A-2
Table A-1 continued
Analyte Screening levela (mg/kg) Maximum value in FBA soil
(mg/kg)
4,4-DDT 57 0.041 U
acetone 23,000 3.3 UJ
alpha-BHC 2.6 0.14 J
aluminum, total 50,000 7,800J
anthracene 230,000 1.1 U
antimony, total 180 3.9
arsenic, total 7.6 10.4
barium, total 37,000 52
benzene 180 6.2
beryllium, total 410 0.60 J
beta-BHC 5.4 0.023 J
bromomethane 320 0.29 J
cadmium, total 550 3.3 U
calcium, total NA 87,000
chlordane, total 31 0.083 J
chlorobenzene 260 0.076 J
chloroform 1,200 0.24
chromium, hexavalent 2,500 0.65
chromium, total 2,500g 14
chromium, trivalent 790,000 13.35
cobalt, total 2,600 6.4
copper, total 20,000 15
delta-BHC NA 0.043 J
diethylphthalate 740 1.1 U
endosulfan II 1,400h 0.15 J
endosulfan, total 1,400 0.15 J
endrin aldehyde 65i 0.96 DJj
endrin ketone 65i 0.041 U
ethylbenzene 140 0.22 U
gamma-BHC (lindane) 8.3 1.5 DJ
gamma-chlordane 31k 0.083 J
hexabromobenzene 1,100 0.10 U
iron, total 160,000 21,000J
lead, total 400 100J
magnesium, total 1,000,000 34,000
manganese, total 25,000 420J
mercury, total 160 0.42 J
methyl acetate NA 0.99
methylene chloride 1,300 0.29 U
naphthalene 16,000 0.47 UJ
nickel, total 40,000 15J
n-nitroso-di-n-propylamine 1.2 1.1 U
PBB 1.2 0.05 UJ
phenanthrene 1,600 0.47 UJ

A-3
Table A-1 continued
Analyte Screening levela (mg/kg) Maximum value in FBA soil
(mg/kg)
phenol 12,000 1.3
potassium, total NA 1,200
selenium, total 2,600 1.6 U
silver, total 2,500 2.4 U
sodium, total 1,000,000 460
thallium, total 35 2.0 U
toluene 250 0.25
trans-1,3-dichloropropene NA 1.3
vanadium, total 750 23
xylene (total) 150 0.67 U
zinc, total 170,000 41
Bold values are higher than the criteria.
a = Unless otherwise noted, the screening level is the MDEQ Residential DCC.
b = The “J” indicates that the value is an estimated result.
c = The “NA” indicates that no screening level is available.
d = The screening level is ATSDR’s intermediate Environmental Media Evaluation Guide
value.
e = The “U” indicates that the analyte was not detected above the reported sample quantitation
limit.
f = The “UJ” indicates that the analyte was not detected and the reporting limit is estimated.
g = The screening level is the MDEQ Residential DCC for hexavalent chromium.
h = The screening level is the MDEQ Residential DCC for total endosulfan isomers.
i = The screening level is the MDEQ Residential DCC for endrin.
j = The “DJ” indicates that the sample was diluted and the value is an estimated result.
k = The screening level is the MDEQ Residential DCC for total chlordane isomers.
Ash sampling results
Table A-2: Maximum value (in milligrams per kilogram [mg/kg]) of detected compounds at or
above the reported quantitation limit in the Former Burn Area (FBA) ash samples (two samples)
(Weston 2006).
Analyte Screening levela (mg/kg) Maximum value in ash samples
(mg/kg)
2-methylnaphthalene 8,100 0.54 U
4,4-DDD 95 0.0013
4,4-DDE 45 0.061
4,4-DDT 57 0.030
acetone 23,000 0.32 U
aluminum, total 50,000 14,000
anthracene 230,000 0.54 U
antimony, total 180 36
arsenic, total 7.6 62.4 (2/2)
barium, total 37,000 840
benzo(a)anthracene 20 0.54 U
benzo(a)pyrene 2 0.54 U
benzo(b)fluoranthene 20 0.3 J

A-4
Table A-2 continued
Analyte Screening levela (mg/kg) Maximum value in ash samples
(mg/kg)
benzo(k)fluoranthene 200 0.54 U
beryllium, total 410 5.8
butylbenzylphthalate 310 0.54 U
cadmium, total 550 1.9 J
calcium, total NA 25,000
chromium, hexavalent, 2,500 0.6 U
chromium, total 2,500 d 26
chromium, trivalent 790,000 25.4
chrysene 2,000 0.41 J
cobalt, total 2,600 41
copper, total 20,000 95
cyanide, total 12 1.0
dibenzofuran NA 0.54 U
diethylphthalate 740 0.065 J
endrin ketone 65 (endrin) 0.01
fluoranthene 46,000 0.5 J
heptachlor epoxide 3.1 0.007 U
hexabromobenzene 1,100 0.1 U
indeno(1,2,3-cd)pyrene 20 0.54 U
iron, total 160,000 62,000
lead, total 400 670 (2/2)
magnesium, total 1,000,000 2,800
manganese, total 25,000 620
mercury, total 160 0.145
methoxychlor 1,900 0.007 U
methyl acetate NA 0.19 J
naphthalene 16,000 0.54 U
nickel, total 40,000 38
PBB 1.2 0.0012 J
phenanthrene 1,600 0.58 J
phenol 12,000 0.54 U
pyrene 29,000 0.25 J
Bold values are higher than the criteria.
a = Unless otherwise noted, the screening level is the MDEQ Residential Direct Contact Criteria
(DCC).
b = The “U” indicates that the analyte was not detected above the reported sample quantitation
limit.
c = The “J” indicates that the value is an estimated result.
d = The “NA” indicates that no screening level is available.
e = The screening level is the MDEQ Residential DCC for hexavalent chromium.
f = The screening level is the MDEQ Residential DCC for endrin.

A-5
Soil gas sampling
Table A-3: Maximum value (in milligrams per cubic meter [mg/m3]) of soil gas levels in the
Former Burn Area (FBA) (Weston 2006).
Analyte
Shallow
screening level
(sub-slab)a
Maximum levels
from samples less
than five feet deep
Deep screening
level (deep 5’)b
Maximum levels
from samples over
five feet deep
1,1,1-trichloroethane 310 <0.04c 3,100 <5
1,1,2-trichloroethane 0.076 <0.04c 0.76 <5
1,1-dichloroethane 26 0.13c 260 5.8
1,1-dichloroethene 10 <0.04c 100 <5
1,2,4-trichlorobenzene 21,000 <0.04c 21,000 <5
1,2,4-trimethylbenzene 11 <0.04c 110 NDd
1,2-dibromoethane NAe <0.04c NA 0.43
1,2-dichlorobenzene 16 <0.04c 160 <10
1,2-dichloroethane 0.047 >4.0c 0.47 22
1,2-dichloroethene, cis- 1.8 <0.04c 18 <5
1,2-dichloroethene, trans- 3.7 <0.04c 37 <5
1,2-dichloropropane 0.21 0.058c 2.10 <5
1,3,5-trimethylbenzene 11 <0.04c 110 ND
1,3-dichlorobenzene 0.16 <0.04c 1.60 <10
1,4-dichlorobenzene 0.18 <0.04c 1.80 <10
1-2 dibromo-3-chloropropane 0.01 <0.1c 0.10 <25
2-butanone (MEK) 260 <0.04c 2,600 <50
2-hexanone 2.1 <0.04c 21 <50
4-methyl-2-pentanone
(MIBK) 160 0.085c 1,600 <50
acetone 310 <0.48c 3,100 <50
benzene 0.15 >3.2c 1.50 160
carbon disulfide 37 <0.04c 370 <50
carbon tetrachloride 0.081 <0.04c 0.81 <5
chlorobenzene 37 <0.04c 37 0.49
chloroethane 520 <0.1c 5,200 <25
chloroform 0.51 <0.22c 5.10 <5
cyclohexane 310 <0.04c 3,100 <50
dichlorodiflouromethane 2,600 <0.1c 26,000 <25
ethanol NA <0.04c NA ND
ethyl benzene 3.9 <0.04c 39 <5
heptane 180 <0.04c 1,800 ND
hexane, n- 37 <0.2c 370 ND
isopropylbenzene 21 <2 210 <10
methyl acetate NA <0.1c NA <50
methylcyclohexane NA <0.1c NA <50
methylene chloride 2.60 1.3c 26 <25
propylene NA >1.7c NA ND
styrene 2.10 <0.04c 21 <5
tetrachloroethene 2.10 <0.04c 21 <5
toluene 260 0.15c 2,600 <5
trichloroethene 7.20 <0.04c 7.20 <5
trichlorofluoromethane 2,900 <0.1c 29,000 <25
vinyl chloride 0.140 <0.04c 1.40 <10
xylene, m,p 5.20 <0.08c 52 <10
xylene, o- 5.20 <0.04c 52 <5

A-6
Table A-3 continued
Bold values are higher than the criteria.
a = The screening levels are MDEQ’s Draft Proposed Sub-Slab Residential Soil Gas Criteria (MDEQ 2009).
b = The screening levels are MDEQ’s Draft Proposed Deep 5’ Residential Soil Gas Criteria (MDEQ 2009).
c = The sample was collected in a Summa canister and analyzed offsite
d = The “ND” indicates that the sample was not analyzed for this analyte.
e = The “NA” indicates that no screening level is available.
Groundwater sampling results from soil borings
Table A-4: Maximum value (in milligrams per liter [mg/L]) of detected compounds at or above
the reported quantitation limit in the Former Burn Area (FBA) groundwater samples (17
samples) from vertical aquifer sampling (Weston 2006).
Analyte Screening levela
(mg/L) Maximum value (mg/L)
1,2-dichloroethane 19 16
1,3-dichlorobenzene 2 0.005 Ub
2-chlorophenol 94 0.005 U
4-methylphenol 810c 0.0092
acetone 31,000 10 UJd
aluminum, dissolved 64,000 0.2 U
aluminum, total 64,000 10.8
antimony, dissolved 68 0.0059 Je
arsenic, dissolved 4.3 0.0588
arsenic, total 4.3 0.0133 J
barium, dissolved 14,000 0.705
barium, total 14,000 0.254
benzene 11 14
beryllium, total 290 0.005 U
bis(2-ethylhexyl)phthalate 0.32 0.028
cadmium, dissolved 190 0.005 U
calcium, dissolved NAf 186
calcium, total NA 314
carbon disulfide 1,200 0.5 U
chloroform 150 0.14 J
chromium, dissolved 460g 0.01 U
chromium, total 460g 0.0841
cis-1,2-dichloroethane 19 0.2 U
cobalt, dissolved 2,400 0.0102
copper, total 7,400 0.0495 J
diethylphthalate 1,100 0.005 U
iron, dissolved 58,000 33.2
iron, total 58,000 27.1
lead, total 0.19h 0.0101 J
magnesium, dissolved 1,000,000 44

A-7
Table A-4 continued
Analyte Screening levela
(mg/L) Maximum value (mg/L)
magnesium, total 1,000,000 81.5
manganese, dissolved 9,100 0.11
manganese, total 9,100 0.604
nickel, dissolved 74,000 0.0474
nickel, total 74,000 0.0449
phenol 29,000 0.02
potassium, dissolved NA 11.9
potassium, total NA 5.41 J
selenium, dissolved 970 0.035 U
sodium, dissolved 1,000,000 483
sodium, total 1,000,000 75
tetrachloroethane 4.7i 0.2 U
thallium, dissolved 13 0.025 U
toluene 530 0.2 U
trichloroethane 21j 0.2 U
vanadium, dissolved 970 0.05 U
vinyl chloride 1.0 0.2 U
zinc, dissolved 110,000 0.0345
zinc, total 110,000 0.222
Bold values are higher than the criteria.
a = Unless otherwise noted, the screening levels is the MDEQ Groundwater Contact
Criteria (GCC).
b = The “U” indicates that the analyte was not detected above the reported sample
quantitation limit.
c = The screening level is the MDEQ GCC for total methylphenols.
d = The “UJ” indicates that the analyte was not detected and the reporting limit is
estimated.
e = The “J” indicates that the value is an estimated result.
f = The “NA” indicates that no screening level is available.
g = The screening level is the MDEQ GCC for hexavalent chromium.
h = The value is the MDEQ’s Rule 57 non-drinking water value set for human health.
i = The screening level is the MDEQ GCC for 1,1,2,2- tetrachloroethane.
j = The screening level is the MDEQ GCC for 1,1,2- trichloroethane.
Groundwater sampling results from monitor wells
Table A-5: Maximum value (in milligrams per liter [mg/L]) of detected compounds at or above
the reported quantitation limit in the Former Burn Area (FBA) groundwater samples (52
samples) from monitor wells sampled in 2005 (Weston 2006).
Analyte Screening levela
(mg/L) Maximum levels (mg/L)
1,1,1-trichloroethane 1,300 0.340 Jb
1,1-biphenyl 0.69c 0.00072 J
1,1-dichloroethane 2,400 1.8
1,2-dichloroethane 19 700 Dd

A-8
Table A-5 continued
Analyte Screening levela
(mg/L) Maximum levels (mg/L)
1,2-dichloropropane 16 0.88
2,2-oxybis(1-chloropropane) NAe 0.6 UJf
2,4-DDT NA 0.000094 UJ
2,4-dichlorophenol 48 0.6 UJ
2-chlorophenol 94 0.024
2-methylnaphthalene 25 0.014 J
2-methylphenol 810g 0.25 J
4,4-DDD 0.044 0.0022 UJ
4,4-DDE 0.027 0.0022 UJ
4,4-DDT 0.013 0.0022 UJ
4-methyl-2-pentanone 13,000 50
4-methylphenol 810 0.6 Uh
acetone 31,000 50 U
acetophenone 6,100 0.6 U
aldrin 0.00034 0.0035 J
alpha-BHC 0.06 0.001 U
alpha-chlordane 0.015i 0.001 U
aluminum, total 64,000 2.83
antimony, dissolved 68 0.06 U
antimony, total 68 0.06 U
arsenic, dissolved 4.3 0.035
arsenic, total 4.3 0.118
barium, dissolved 14,000 1.14
barium, total 14,000 1.99 J
benzene 11 120 Ej
beryllium, dissolved 290 0.005 J
beryllium, total 290 0.005 J
beta-BHC 0.12 0.001 U
bis(2-chloroethyl)ether 5.7 0.16 J
bis(2-ethylhexyl)phthalate 0.32 0.6 U
cadmium, total 190 0.005 U
calcium, dissolved NA 3,420
calcium, total NA 3,920
carbon disulfide 1,200 50 U
chlordane, (total) 0.015 0.017 J
chlorobenzene 86 50 U
chloroform 150 50 U
chromium, dissolved 460k 0.01 U
chromium, total 460k 0.049
cis-1,2-dichloroethene 19 50U
cobalt, dissolved 2,400 0.050 U
cobalt, total 2,400 0.050 U
copper, dissolved 7,400 0.025 U
copper, total 7,400 0.025 U
cyanide, total 57 0.0103
cyclohexane NA 50 U

A-9
Table A-5 continued
Analyte Screening levela
(mg/L) Maximum levels (mg/L)
endosulfan II 0.51 0.001 U
endosulfan sulfate 0.51 0.001 U
endosulfan, (total) 0.51 0.00011 J
endrin 0.16 0.001 U
endrin ketone 0.16 0.001 U
fluorene 2.0 0.6 U
gamma-BHC (Lindane) 0.19 0.041 D
gamma-chlordane 0.015h 0.017 J
heptachlor 0.0029 0.001 U
heptachlor epoxide 0.009 0.001 U
iron, dissolved 58,000 279 J
iron, total 58,000 281 J
lead, dissolved 0.19m 0.0328
lead, total 0.19 m 0.0292
magnesium, dissolved 1,000,000 675
magnesium, total 1,000,000 687.999 J
manganese, dissolved 9,100 5.62
manganese, total 9,100 5.65 J
mercury, dissolved 0.056 0.0034
mercury, total 0.056 0.0036
methoxychlor 0.045 0.011 EJj
methylcyclohexane NA 50 U
methylene chloride 220 16
methylphenol, (total) 810 0.342 J
naphthalene 31 0.6 UJ
nickel, dissolved 74,000 0.57 J
nickel, total 74,000 0.574 J
PCBs - Aroclor-1242 0.0033n 0.005 UJ
p-chloro-m-cresol 79 0.6 UJ
phenol 29,000 2.7
potassium, dissolved NA 174.999 J
potassium, total NA 171 J
pyrene 0.14 0.6 U
selenium, dissolved 970 0.035 U
selenium, total 970 0.035 U
sodium, dissolved 1,000,000 726.999 J
sodium, total 1,000,000 1,140 J
toluene 530 50 U
trichloroethene 21o 50 U
tris (2,3-dibromopropyl) phosphate 2.1 0.01 U
vanadium, dissolved 970 0.05 UJ
vanadium, total 970 0.05 U

A-10
Table A-5 continued
Analyte Screening levela
(mg/L) Maximum levels (mg/L)
zinc, dissolved 110,000 0.0686 J
zinc, total 110,000 0.063 J
Bold values are higher than the criteria.
a = Unless otherwise noted, the screening levels is the MDEQ Groundwater Contact Criteria
(GCC).
b = The “J” indicates that the value is an estimated result.
c = The screening level is the MDEQ’s Rule 57 non-drinking water value set for human
health.
d = The “D” indicates that the sample was diluted for analysis.
e = The “NA” indicates that no screening level is available.
f = The “UJ” indicates that the analyte was not detected and the reporting limit is estimated.
g = The screening level is the MDEQ GCC for total methylphenols.
h = The “U” indicates that the analyte was not detected above the reported sample
quantitation limit.
i = The screening level is the MDEQ GCC for total chlordane isomers.
j = The “E” or “EJ” indicates that the value exceeded the instrument’s calibration range for
the analytical method and the result is estimated.
k = The screening level is the MDEQ GCC for hexavalent chromium.
l = The screening level is the MDEQ GCC for total endosulfan isomers.
m = The screening level is the MDEQ’s Rule 57 non-drinking water value set for human
health.
n = The screening level is the MDEQ GCC for total PCBs.
o = The screening level is the MDEQ GCC for 1,1,2- trichloroethane.
Table A-6: Maximum value (in milligrams per liter [mg/L]) of para-Chlorobenzenesulfonic acid
(pCBSA) in the Former Burn Area (FBA) groundwater samples from monitor wells sampled in
2005 (Weston 2006).
Wells Number of wells Screening levela (mg/L) Maximum level pCBSA
(mg/L)
Shallow depth wells 8 2,200 0.015
Intermediate depth
wells 7 2,200 0.001 Ub
Deep wells 4 2,200 0.0018
a = The screening level is the MDEQ’s Rule 57 non-drinking water value set for human health.
b = The “U” indicates that the analyte was not detected above the reported sample quantitation limit.
Residential and Hidden Oaks Golf Course well sampling results
Table A-7: Maximum value (in milligrams per liter [mg/L]) of detected compounds at or above
the reported quantitation limit in the Hidden Oaks Golf Course and two residential wells sampled
in 2004 (Weston 2006).
Analyte Screening levela
(mg/L)
Maximum values from
Hidden Oaks Golf Course
well (mg/L)
Maximum values from
two residential wells
(mg/L)
1,1-biphenyl 0.46b 0.013 Uc 0.01 U
2,4-DDT NAd 0.00002 UJe 0.00002 UJ
aluminum, total 0.3f 0.0536 U 0.0311 Jg
arsenic, total 0.010 0.0032 U 0.0234

A-11
Table A-7 continued
Analyte Screening levela
(mg/L)
Maximum values from
Hidden Oaks Golf Course
well (mg/L)
Maximum values from
two residential wells
(mg/L)
barium, total 2 0.053 0.277
beryllium, total 0.004 0.0002 U 0.00085 J
bis(2-ethylhexyl)phthalate 0.006 0.013 U 0.01 U
butylbenzylphthalate 1.2 0.013 U 0.01 U
calcium, total NA 53.1 143
chloride 250 15 345
chlorobenzene 0.1 0.01 U 0.01 U
chromium, total 0.1 0.0011 U 0.0006 U
copper, total 1 0.0011 UJ 0.0123
cyanide, total 0.200 0.003 UJ 0.0062 J
di-n-butylphthalate 0.88 0.013 U 0.01 U
HEM, oil & grease NA 5 U 5U
hexabromobenzene 0.00017 0.00002UJ 0.0000067 J
iron, total 2.0b 0.161 0.989
lead, total 0.004 0.0026 U 0.0023
magnesium, total 400 17.1 56.3
manganese, total 0.86b 0.0743 0.133
nitrogen, ammonia 10 0.53 0.46
nitrogen, nitrate+nitrite 1h 0.02 0.11
n-nitroso-di-n-propylamine 0.005 0.013 U 0.01 U
potassium, total NA 1.04 2.98
selenium, total 0.05 0.0032 U 0.0025 U
sodium, total 120 83.4 J 79.1 J
sulfate 250 107 20
vanadium, total 0.0045 0.001 U 0.0015 U
zinc, total 2.4 0.0551 0.342
Bold values are higher than the criteria.
a = Unless otherwise noted, the screening levels is the MDEQ Residential Drinking Water Criteria
(RDWC).
b = The screening level is the MDEQ’s Rule 57 drinking water value set for human health.
c = The “U” indicates that the analyte was not detected above the reported sample quantitation limit.
d = The “NA” indicates that no screening level is available.
e = The “UJ” indicates that the analyte was not detected and the reporting limit is estimated.
f = The screening level is the MDEQ’s Residential health based drinking water value in the Footnotes
(MDEQ 2005).
g = The “J” indicates that the value is an estimated result.
h = The screening level is the MDEQ’s RDWC for nitrite.

B-1
Appendix B: Detected contaminants from the 2009 Remedial Investigation (Weston 2009).
This appendix contains tables of all detected contaminants above the reported quantitation limit
from the second investigation (Weston 2006).
Soil sampling results from the FBA
Table B-1: Maximum value (in milligrams per kilogram [mg/kg]) of detected compounds at or
above the reported quantitation limit in the Former Burn Area (FBA) soil sampled (66 samples)
in 2007 (Weston 2009).
Analyte Screening levela (mg/kg) Maximum levels in all soil depths
(mg/kg)
1,2-dichloroethane 91 1.7
2,4-DDT NAb 0.64 Jc
4,4-DDD 95 0.42
4,4-DDE 45 2.2
4,4-DDT 57 2.3
aldrin 1.0 0.18 Ud
alpha-BHC 2.6 0.18 U
alpha-chlordane 31e 0.22
aluminum, total 50,000 10,000
antimony, total 180 1.7
arsenic, total 7.6 21
barium, total 37,000 140
benzene 180 2.8
beryllium, total 410 1.2
cadmium, total 550 2.2
calcium, total NA 103,000 J
chlordane (total) 31 0.37
chlorobenzene 260 0.13 U
chromium, hexavalent 2,500 6.6
chromium, total 2,500f 23
cobalt, total 2,600 8.1
copper, total 20,000 120
cyanide, total 12 0.32
endosulfan (total) 1,400 0.0014
endosulfan I 1,400 0.18 U
gamma-BHC (lindane) 8.3 0.18 U
gamma-chlordane 31e 0.15 J
HBB 1,100 11U
iron, total 160,000 29,000 J
lead, total 400 810
magnesium, total 1,000,000 37,400 J
manganese, total 25,000 630
mercury, total 160 0.16
molybdenum, total 2,600 1.8
nickel, total 40,000 22

B-2
Table B-1 continued
Analyte Screening levela (mg/kg) Maximum levels in all soil depths
(mg/kg)
PBB 1.2 5.4 U
pCBSA 230,000 0.011
potassium, total NA 1,510 J
selenium, total 2,600 7.6
silver, total 2,500 0.25
sodium, total 1,000,000 1,540
thallium, total 35 0.5 U
vanadium, total 750 84
zinc, total 170,000 520
Bold values are higher than the criteria.
a = Unless otherwise noted, the screening level is the MDEQ Residential Direct Contact Criteria
(DCC).
b = The “NA” indicates that no screening level is available.
c = The “J” indicates that the value is an estimated result.
d = The “U” indicates that the analyte was not detected above the reported sample quantitation limit.
e = The screening level is the MDEQ Residential DCC for total chlordane isomers.
f = The screening level is the MDEQ Residential DCC for hexavalent chromium.
Soil sampling results from the downwind residential area
Table B-2: Maximum value (in milligrams per kilogram [mg/kg]) of detected compounds at or
above the reported quantitation limit in the downwind residential area soil (0 to 0.5 feet deep, 32
samples) sampled in 2007 (Weston 2009).
Analyte Screening levela (mg/kg) Maximum levels in surface soil
(mg/kg)
2,4-DDT NAb 0.054 Jc
4,4-DDD 95 39 UJd
4,4-DDE 45 0.61
4,4-DDT 57 0.28
aluminum, total 50,000 12,000
antimony, total 180 0.31
arsenic, total 7.6 35
barium, total 37,000 72
benzo(a)anthracene 20 0.14 Ue
benzo(b)fluoranthene 20 0.28 U
beryllium, total 410 0.52
cadmium, total 550 0.58
calcium, total NA 68,000
chromium, hexavalent 2,500 2.7 UJ
chromium, total 2,500f 18
chrysene 2,000 0.14 U
cobalt, total 2,600 8
copper, total 20,000 22
cyanide, total 12 0.22
fluoranthene 46,000 0.24
gamma-BHC (lindane) 8.3 0.038 UJ
HBB 1,100 2.2 U

B-3
Table B-2 continued
Analyte Screening levela (mg/kg) Maximum levels in surface soil
(mg/kg)
heptachlor 5.6 0.038 UJ
iron, total 160,000 22,000 J
lead, total 400 100
magnesium, total 1,000,000 18,200 J
manganese, total 25,000 350
mercury, total 160 0.16
molybdenum, total 2,600 2.4
nickel, total 40,000 19
PBB 1.2 1.1 UJ
phenanthrene 1,600 0.14 U
potassium, total NA 1,290 J
pyrene 29,000 0.21
selenium, total 2,600 1.2
silver, total 2,500 0.18
sodium, total 1,000,000 140
vanadium, total 750 27 J
zinc, total 170,000 140
Bold values are higher than the criteria.
a = Unless otherwise noted, the screening level is the MDEQ Residential Direct Contact
Criteria (DCC)..
b = The “NA” indicates that no screening level is available.
c = The “J” indicates that the value is an estimated result.
d = The “UJ” indicates that the analyte was not detected and the reporting limit is estimated.
e = The “U” indicates that the analyte was not detected above the reported sample
quantitation limit.
f = The screening level is the MDEQ Residential DCC for hexavalent chromium.
Groundwater sampling results from vertical aquifer sampling
Table B-3: Maximum levels (in milligrams per liter [mg/L]) of detected contaminants at or above
the reported quantitation limit from vertical aquifer sampling (15 samples) (Weston 2009).
Analyte Screening levela
(mg/L)
Maximum levels
(mg/L)
1,1,1,2-tetrachloroethane 30 0.001 Ub
1,1-tichloroethane 2,400 0.001 U
1,2-dichlorobenzene 160 0.001 U
1,2-trichloroethane 19 0.001 U
1,3-dichlorobenzene 2 0.001 U
1,4-dichlorobenzene 6.4 0.001 U
acetone 31,000 0.02 U
benzene 11 0.001 U
bromobenzene 12 0.001 U
bromodichloromethane 14 0.001 U
bromoform 140 0.001 U
carbon disulfide 1,200 0.001 U
chlorobenzene 86 0.001 U
chloroethane 440 0.005 U

B-4
Table B-3 continued
Analyte Screening levela
(mg/L)
Maximum levels
(mg/L)
chloroform 150 0.0021
cis-1,2-dichloroethene 200 0.001 U
ethyl ester 64,000 0.005 U
pCBSA 2,200c 0.001 U
styrene 9.7 0.001 U
toluene 530 0.001 U
trans-1,2-dichloroethene 220 0.001 U
trichloroethane 21d 0.001 U
trihalomethane (total) NAe 0.0021
vinyl chloride 1 0.001 U
a = Unless otherwise noted, the screening levels is the MDEQ Groundwater
Contact Criteria (GCC).
b = The “U” indicates that the analyte was not detected above the reported sample
quantitation limit.
c = The screening level is the MDEQ’s Rule 57 non-drinking water value set for
human health.
d = The screening level is the MDEQ GCC for 1,1,2- trichloroethane.
e = The “NA” indicates that no screening level is available.
Groundwater sampling results from monitor wells
Table B-4: Maximum value (in milligrams per liter [mg/L]) of detected compounds at or above
the reported quantitation limit in the Former Burn Area (FBA) groundwater samples from the
shallow outwash unit monitor wells (17 samples) (Weston 2009).
Analyte Screening levela (mg/L) Maximum levels
(mg/L)
1,1,1-trichloroethane 1,300 1 Ub
1,1,2,2-tetrachloroethane 4.7 1 U
1,1,2-trichloroethane 21 1 U
1,1-dichloroethane 2,400 1.3
1,1-dichloroethene 11 1 U
1,2,3-trichlorobenzene 0.073c 5U
1,2,3-trimethylbenzene 0.65d 1 U
1,2,4-trichlorobenzene 19 5U
1,2,4-trimethylbenzene 56 1 U
1,2-dibromo-3-chloropropane 0.39 5U
1,2-dibromoethane 530 1 U
1,2-dichlorobenzene 160 1 U
1,2-dichloroethane 19 1 U
1,2-dichloropropane 16 1 U
1,3-dichlorobenzene 2 1 U
1,4-dichlorobenzene 6.4 1 U
2,4-DDT NAe 0.001 U
2,4-dichlorophenol 48 5U
2-butanone 240,000 5 U
2-chlorophenol 94 5U
2-methylnaphthalene 25 2.5 U

B-5
Table B-4 continued
Analyte Screening levela (mg/L) Maximum levels
(mg/L)
3 and 4-methylphenol 810f 1 U
4,4-DDD 0.044 0.002 U
4,4-DDE 0.027 0.002 U
4,4-DDT 0.013 0.002 U
acenaphthene 4.2 0.5 U
acetone 31,000 20U
aldrin 0.00034 0.001 U
alpha-BHC 0.06 0.002 U
aluminum, dissolved 64,000 0.05 U
aluminum, total 64,000 0.05 U
anthracene 0.043 0.5 U
antimony, dissolved 68 0.001 U
antimony, total 68 0.01 U
arsenic, dissolved 4.3 0.3
arsenic, total 4.3 10 Jg
barium, dissolved 14,000 0.14
barium, total 14,000 1.8 J
benzene 11 99
beryllium, dissolved 290 0.001 U
beryllium, total 290 0.01 U
beta-BHC 0.12 0.02 U
bis(2-chloroethyl)ether 5.7 0.5 U
bromobenzene 12 1 U
bromochloromethane 59h 1 U
bromodichloromethane 14 1 U
bromoform 140 1 U
bromomethane 70 5U
cadmium, dissolved 190 0.002 U
cadmium, total 190 0.02 U
calcium, dissolved NA 3,590 J
calcium, total NA 5,180 J
carbon disulfide 1,200 1 U
carbon tetrachloride 4.6 1 U
chlorobenzene 86 1 U
chloroethane 440 5U
chloroform 150 3.2
chloromethane 490 5U
chromium, dissolved 460i 0.001 U
chromium, hexavalent 460 0.01 U
chromium, total 460i 0.59
cis-1,2-dichloroethene 200 1 U
cobalt, dissolved 2,400 0.015 U
cobalt, total 2,400 0.052
copper, dissolved 7,400 0.0017
copper, total 7,400 0.012
cyclohexane NA 5U

B-6
Table B-4 continued
Analyte Screening levela (mg/L) Maximum levels
(mg/L)
delta-BHC NA 0.002 U
dibromochloromethane 18 1 U
dibromomethane 530 1 U
ethyl ether 1,000j 5U
ethylbenzene 170 1 U
fluoranthene 0.210 0.5 U
fluorene 2 0.5 U
gamma-BHC 0.19 0.1 U
iron, dissolved 58,000 54J
iron, total 58,000 310J
isopropylbenzene 56 1 U
lead, dissolved 0.19k 0.001 U
lead, total 0.19k 0.01 U
magnesium, dissolved 1,000,000 680J
magnesium, total 1,000,000 1,120 J
manganese, dissolved 9.1 0.025
manganese, total 9.1 8.6 J
mercury, dissolved 0.056 0.0002 U
mercury, total 0.056 0.0002 U
methylene chloride 220 13
methylphenol, total 810 0.091
naphthalene 31 5U
nickel, dissolved 74,000 0.017
nickel, total 74,000 0.38
n-propylbenzene 15 1 U
pCBSA 2,200 0.036
pentachlorophenol 0.2 10 U
phenanthrene 1 0.5 U
phenol 29,000 2.5 U
potassium, dissolved NA 110J
potassium, total NA 120J
Pyrene 0.14 0.5 U
pyridine 94 10U
sec-butylbenzene 4.4 1 U
selenium, dissolved 970 0.001 U
selenium, total 970 0.1 U
silver, dissolved 1,500 0.0002 UJ
silver, total 1,500 0.00025l
sodium, dissolved 1,000,000 1,810J
sodium, total 1,000,000 3,170J
tertiary butyl alcohol 79,000 50 U
tetrachloroethene 12 1 U
toluene 530 1.5
trans-1,2-dichloroethene 220 1 U
trans-1,3-dichloropropane NA 1 U
trichloroethene 21m 1 U

B-7
Table B-4 continued
Analyte Screening levela (mg/L) Maximum levels
(mg/L)
trihalomethane, total NA 3.2
TRIS 2.1 0.1 U
vanadium, dissolved 970 0.002 U
vanadium, total 970 0.031
vinyl chloride 1 1 U
xylene, meta & para 190 2 U
xylene, o- 190 1 U
xylenes (total) 190 0.028
zinc, dissolved 110,000 0.01 U
zinc, total 110,000 0.13
Bold values are higher than the criteria.
a = Unless otherwise noted, the screening levels is the MDEQ Groundwater Contact
Criteria (GCC).
b = The “U” indicates that the analyte was not detected above the reported sample
quantitation limit.
c = The value is the MDEQ’s Rule 57 non-drinking water value set for human health.
d = The value is the MDEQ’s Rule 57 non-drinking water value set for human health.
e = The “NA” indicates that no screening level is available.
f = The screening level is the MDEQ GCC for total methylphenols.
g = The “J” indicates that the value is an estimated result.
h = The value is the MDEQ’s Rule 57 non-drinking water value set for human health.
i = The screening level is the MDEQ GCC for hexavalent chromium.
j = The value is the MDEQ’s Rule 57 non-drinking water value set for human health.
k = The value is the MDEQ’s Rule 57 non-drinking water value set for human health.
l = The “UJ” indicates that the analyte was not detected and the reporting limit is
estimated.
m = The screening level is the MDEQ GCC for 1,1,2- trichloroethane.
Table B-5: Maximum value (in milligrams per liter [mg/L]) of detected compounds at or above
the reported quantitation limit in the Former Burn Area (FBA) groundwater samples from the
upper till unit monitor wells (seven samples) (Weston 2009).
Analyte Screening levela
(mg/L)
Maximum levels from upper till
monitor wells (mg/L)
1,1-dichloroethane 2,400 0.001 Ub
1,2-dichloroethane 19 0.001 U
1,2-dichloropropane 16 0.001 U
2,4-DDT NAc 0.0049
2-butanone 240,000 0.005 U
4,4-DDD 0.044 0.0003
4,4-DDE 0.027 0.000054
4,4-DDT 0.013 0.0061
4-methyl-2-pentanone 13,000 0.005 U
acetone 31,000 0.027
aluminum, dissolved 64,000 0.05 U
aluminum, total 64,000 6.9 Jd
arsenic, dissolved 4.3 0.01 U
arsenic, total 4.3 0.19

B-8
Table B-5 continued
Analyte Screening levela
(mg/L)
Maximum levels from upper till
monitor wells (mg/L)
barium, dissolved 14,000 10J
barium, total 14,000 80J
benzene 11 0.0072
bis(2-ethylhexyl)phthalate 0.32 0.0089
bromobenzene 12 0.001 U
bromochloromethane 1e 0.001 U
calcium, dissolved NA 8,250 J
calcium, total NA 17,400 J
chlorobenzene 86 0.001 U
chloroform 150 0.001 U
chromium, dissolved 460f 0.023
chromium, total 460 f 0.055
cis-1,2-dichloroethene 0.07 0.001 U
cobalt, dissolved 2,400 0.028
cobalt, total 2,400 0.045
copper, dissolved 7,400 0.012
copper, total 7,400 0.034
dibromomethane 530 0.001 U
ethyl ether 0.01 0.005 U
iron, dissolved 58,000 16
iron, total 58,000 100J
lead, dissolved 0.19g 0.01 U
lead, total 0.19g 0.02 U
magnesium, dissolved 1,000,000 2,640 J
magnesium, total 1,000,000 2,880 J
manganese, dissolved 9,100 2.3 J
manganese, total 9,100 4.4 J
methylene chloride 220 0.005 U
molybdenum, dissolved 970 0.027
molybdenum, total 970 0.026
nickel, dissolved 74,000 0.25
nickel, total 74,000 0.66
pCBSA 2,200h 0.001 U
potassium, dissolved NA 53 J
potassium, total NA 77 J
selenium, dissolved 970 0.01 U
selenium, total 970 0.02 U
sodium, dissolved 1,000,000 2,180 J
sodium, total 1,000,000 10,900 J
toluene 530 0.001 U
vanadium, dissolved 970 0.01 U
vanadium, total 970 0.02 U
vinyl chloride 1 0.07
zinc, dissolved 110,000 0.021
zinc, total 110,000 0.042

B-9
Table B-5 continued
a = Unless otherwise noted, the screening levels is the MDEQ Groundwater Contact Criteria
(GCC).
b = The “U” indicates that the analyte was not detected above the reported sample quantitation
limit.
c = The “NA” indicates that no screening level is available.
d = The “J” indicates that the value is an estimated result.
e = The value is the MDEQ’s Rule 57 non-drinking water value set for human health.
f = The screening level is the MDEQ GCC for hexavalent chromium.
g = The value is the MDEQ’s Rule 57 non-drinking water value set for human health.
h = The value is the MDEQ’s Rule 57 non-drinking water value set for human health.
Table B-6: Maximum value (in milligrams per liter [mg/L]) of detected compounds at or above
the reported quantitation limit in the Former Burn Area (FBA) groundwater samples from the
lower till unit monitor wells (two samples) (Weston 2009).
Analyte Screening levela
(mg/L)
Maximum levels from lower till
monitor wells (mg/L)
1,1,1,2-tetrachloroethane 30 0.001 Ub
1,1,2,2-tetrachloroethane 4.7 0.001 U
1,1-dichloroethane 2,400 0.001 U
1,2,4-trichlorobenzene 19 0.005 U
1,2,4-trimethylbenzene 56 0.001 U
1,2-dichlorobenzene 160 0.001 U
1,2-dichloroethane 19 0.001 U
1,3-dichlorobenzene 2 0.001 U
1,4-dichlorobenzene 6.4 0.001 U
2,4-DDT NAc 0.00001 U
2-butanone 240,000 0.005 U
2-chlorophenol 94 0.01 U
4,4-DDD 0.044 0.00002 U
4,4-DDE 0.027 0.00002 U
4,4-DDT 0.013 0.00002 U
aluminum, dissolved 64,000 0.05 U
aluminum, total 64,000 0.38
antimony, dissolved 68 0.001 U
antimony, total 68 0.001 U
arsenic, dissolved 4.3 0.076
arsenic, total 4.3 0.077
barium, dissolved 14,000 1.2 Jd
barium, total 14,000 1.2 J
benzene 11 0.17
beta-BHC NA 0.00002 U
bis(2-chloroethyl)ether 5.7 0.001 U
bis(2-ethylhexyl)phthalate 0.32 0.016
bromobenzene 12 0.014
bromochloromethane NA 0.001 U
cadmium, dissolved 190 0.0002 U
cadmium, total 190 0.0002 U
calcium, dissolved NA 321 J

B-10
Table B-6 continued
Analyte Screening levela
(mg/L)
Maximum levels from lower till
monitor wells (mg/L)
calcium, total NA 309 J
carbon disulfide 1,200 0.001 U
chloroethane 440 0.005 U
chloroform 150 0.001 U
chromium, dissolved 460e 0.001 U
chromium, hexavalent 460 0.005 U
chromium, total 460e 0.026
cis-1,2-dichloroethene NA 0.001 U
cobalt, dissolved 2,400 0.015 U
cobalt, total 2,400 0.015 U
copper, dissolved 7,400 0.001 U
copper, total 7,400 0.0028
dibromomethane 530 0.001 U
ethyl ether 35,000 0.005 U
gamma-BHC 0.19 0.00002 U
iron, dissolved 58,000 3.2
iron, total 58,000 3.9
lead, dissolved NA 0.001 U
lead, total NA 0.001 U
magnesium, dissolved 1,000,000 160 J
magnesium, total 1,000,000 160 J
manganese, dissolved 9,100 0.13
manganese, total 9,100 0.17
methylene chloride 220 0.005 U
molybdenum, dissolved 970 0.025 U
molybdenum, total 970 0.025 U
nickel, dissolved 74,000 0.018
nickel, total 74,000 0.023
pCBSA NA 0.001 U
phenol 29,000 0.0051 U
potassium, dissolved NA 4.5
potassium, total NA 4.6
selenium, dissolved 970 0.001 U
selenium, total 970 0.001 U
sodium, dissolved 1,000,000 168 J
sodium, total 1,000,000 171 J
toluene 530 0.001 U
trans-1,2-dichloroethene NA 0.001 U
trichloroethene NA 0.001 U
TRIS 2.1 0.01 U
vanadium, dissolved 970 0.002 U
vanadium, total 970 0.002 U
zinc, dissolved 110,000 0.01 U
zinc, total 110,000 0.014
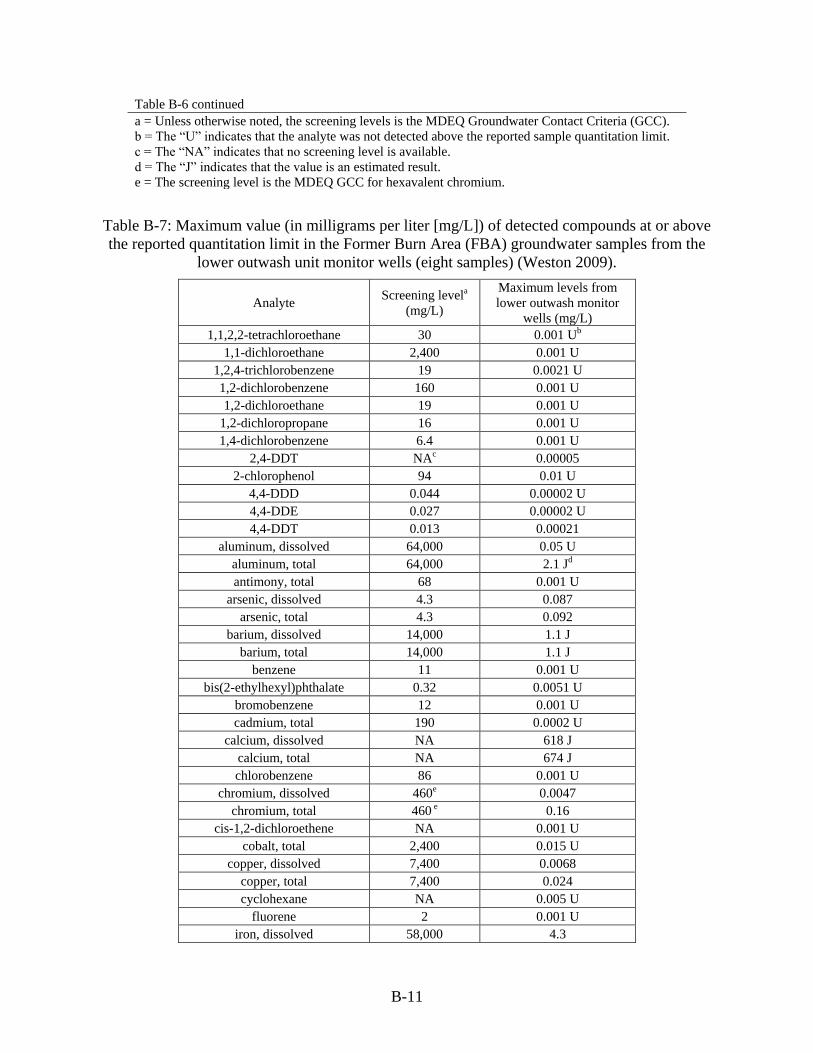
B-11
Table B-6 continued
a = Unless otherwise noted, the screening levels is the MDEQ Groundwater Contact Criteria (GCC).
b = The “U” indicates that the analyte was not detected above the reported sample quantitation limit.
c = The “NA” indicates that no screening level is available.
d = The “J” indicates that the value is an estimated result.
e = The screening level is the MDEQ GCC for hexavalent chromium.
Table B-7: Maximum value (in milligrams per liter [mg/L]) of detected compounds at or above
the reported quantitation limit in the Former Burn Area (FBA) groundwater samples from the
lower outwash unit monitor wells (eight samples) (Weston 2009).
Analyte Screening levela
(mg/L)
Maximum levels from
lower outwash monitor
wells (mg/L)
1,1,2,2-tetrachloroethane 30 0.001 Ub
1,1-dichloroethane 2,400 0.001 U
1,2,4-trichlorobenzene 19 0.0021 U
1,2-dichlorobenzene 160 0.001 U
1,2-dichloroethane 19 0.001 U
1,2-dichloropropane 16 0.001 U
1,4-dichlorobenzene 6.4 0.001 U
2,4-DDT NAc 0.00005
2-chlorophenol 94 0.01 U
4,4-DDD 0.044 0.00002 U
4,4-DDE 0.027 0.00002 U
4,4-DDT 0.013 0.00021
aluminum, dissolved 64,000 0.05 U
aluminum, total 64,000 2.1 Jd
antimony, total 68 0.001 U
arsenic, dissolved 4.3 0.087
arsenic, total 4.3 0.092
barium, dissolved 14,000 1.1 J
barium, total 14,000 1.1 J
benzene 11 0.001 U
bis(2-ethylhexyl)phthalate 0.32 0.0051 U
bromobenzene 12 0.001 U
cadmium, total 190 0.0002 U
calcium, dissolved NA 618 J
calcium, total NA 674 J
chlorobenzene 86 0.001 U
chromium, dissolved 460e 0.0047
chromium, total 460 e 0.16
cis-1,2-dichloroethene NA 0.001 U
cobalt, total 2,400 0.015 U
copper, dissolved 7,400 0.0068
copper, total 7,400 0.024
cyclohexane NA 0.005 U
fluorene 2 0.001 U
iron, dissolved 58,000 4.3

B-12
Table B-7 continued
Analyte Screening levela
(mg/L)
Maximum levels from
lower outwash monitor
wells (mg/L)
iron, total 58,000 9.0
lead, total NA 0.0019
magnesium, dissolved 1,000,000 17 J
magnesium, total 1,000,000 18 J
manganese, dissolved 9,100 0.4
manganese, total 9,100 0.46
mercury, total 0.056 0.0002 U
methylene chloride 220 0.005 U
molybdenum, dissolved 970 0.025 U
molybdenum, total 970 0.025 U
nickel, dissolved 74,000 0.041
nickel, total 74,000 0.052
pCBSA 2,200 f 0.001 U
phenol 29,000 0.005 U
potassium, dissolved NA 6.6 J
potassium, total NA 6.4 J
selenium, dissolved 970 0.001 U
selenium, total 970 0.001 U
silver, total 1,500 0.0002 U
sodium, dissolved 1,000,000 233 J
sodium, total 1,000,000 231 J
tetrachloroethene 12 0.001 U
tetrahydrofuran 1,600 0.005 U
toluene 530 0.001 U
trichloroethene 21g 0.001 U
vanadium, total 970 0.0036
xylene, o- 190 0.001 U
zinc, dissolved 110,000 0.013
zinc, total 110,000 0.037
a = Unless otherwise noted, the screening levels is the MDEQ Groundwater
Contact Criteria (GCC).
b = The “U” indicates that the analyte was not detected above the reported sample
quantitation limit.
c = The “NA” indicates that no screening level is available.
d = The “J” indicates that the value is an estimated result.
e = The screening level is the MDEQ GCC for hexavalent chromium.
f = The value is the MDEQ’s Rule 57 non-drinking water value set for human
health.
g = The screening level is the MDEQ GCC for 1,1,2- trichloroethane.

B-13
Soil and groundwater dioxin levels from the FBA samples
Table B-8: Dioxin levels in soil (in nanograms per kilogram [ng/kg], 11 samples) and
groundwater (in picograms per liter [pg/L], five samples) Former Burn Area (FBA) samples
(Weston 2009).
Analyte
Soil
screening
level (ng/kg)
Soil
(ng/kg)
Water
screening
level (pg/L)
Water
(pg/L)
2378-TCDF NAa 12 Ub NA 12 U
2378-TCDD NA 1.1 U NA 12 U
12378-PeCDF NA 190 Ec NA 59 U
23478-PeCDF NA 12 NA 59 U
12378-PeCDD NA 6.8 U NA 59 U
123478-HxCDF NA 15 NA 59 U
123678-HxCDF NA 9.5 NA 59 U
234678-HxCDF NA 6.8 U NA 59 U
123789-HxCDF NA 6.8 U NA 59 U
123478-HxCDD NA 6.8 U NA 59 U
123678-HxCDD NA 6.8 U NA 59 U
123789-HxCDD NA 6.8 U NA 59 U
1234678-HpCDF NA 24 NA 59 U
1234789-HpCDF NA 10 NA 59 U
1234678-HpCDD NA 48 NA 59 U
OCDF NA 53 NA 120 U
OCDD NA 410 NA 120 U
Total TEQ in parts per
trillion (ppt) 90d 7.9 10e 0
a = The “NA” indicates that no screening level is available.
b = The “U” indicates that the analyte was not detected above the reported sample
quantitation limit.
c = The “E” indicates that the value is the estimated maximum possible
concentration.
d = The screening level is the MDEQ Residential Direct Contact Criteria for total
dioxins based on Toxic Equivalency (TEQ) in parts per trillion (ppt).
e = The screening level is the MDEQ Groundwater Contact Criteria for total
dioxins based on Toxic Equivalency (TEQ) in parts per trillion (ppt).
Surface water sampling results
Table B-9: Maximum levels (in milligrams per liter [mg/L]) of detected compounds at or above
the reported quantitation limit in surface water (five samples) from a drainage ditch adjacent to
the Former Burn Area (FBA) (Weston 2009).
Analyte Screening levela
(mg/L)
Maximum level in surface
water (mg/L)
2,4-DDT NAb 0.00001 UJc
aluminum, total 64,000 0.71
ammonia NA 0.53
arsenic, total 4.3 0.0073
barium, total 14,000 0.092
calcium, total NA 134 Jd

B-14
Table B-9 continued
Analyte Screening levela
(mg/L)
Maximum level in surface
water (mg/L)
chloride NA 124 J
chromium, total 460e 0.0018
copper, total 7,400 0.0036
iron, total 58,000 9.2
lead, total 0.19f 0.0019
magnesium, total 1,000,000 30
manganese, total 9,100 0.86
nickel, total 74,000 0.0063
nitrate + nitrite 310,000g 0.66
oil and grease NA 11 U
potassium, total NA 5.9 J
sodium, total 1,000,000 49.5
sulfate NA 100 J
vanadium, total 970 0.004
zinc, total 110,000 0.025
a = Unless otherwise noted, the screening levels is the MDEQ Groundwater
Contact Criteria (GCC).
b = The “NA” indicates that no screening level is available.
c = The “UJ” indicates that the analyte was not detected and the reporting limit
is estimated.
d = The “J” indicates that the value is an estimated result.
e = The screening level is the MDEQ GCC for hexavalent chromium.
f = The screening level is the MDEQ’s Rule 57 non-drinking water value set for
human health.
g = The screening level is the MDEQ GCC for nitrate.
Sediment sampling results
Table B-10: Maximum levels (in milligrams per kilograms [mg/kg]) of detected compounds at or
above the reported quantitation limit in sediment (seven samples) from a drainage ditch adjacent
to the Former Burn Area (FBA) (Weston 2009).
Analyte Screening levela
(mg/kg)
Maximum levels
(mg/kg)
2,4-DDT NAb 0.14 Uc
4,4-DDD 95 0.2
4,4-DDE 45 0.05
4,4-DDT 57 0.027 U
alpha-chlordane 31d 0.013 Je
aluminum, total 50,000 5,200
antimony, total 180 0.55
arsenic, total 7.6 7.2
barium, total 37,000 58
beryllium, total 410 0.26
cadmium, total 550 0.52
calcium, total NA 82,200 J
carbon, total organic NA 87,000 J
chromium, total 2,500 (VI)f 11

B-15
Table B-10 continued
Analyte Screening levela
(mg/kg)
Maximum levels
(mg/kg)
chrysene 2,000 0.590 U
cobalt, total 2,600 5
copper, total 20,000 18
endosulfan I 1,400 0.014 U
fluoranthene 46,000 0.59 U
gamma-chlordane 31d 0.013 UJg
HBB 1,100 0.27 U
iron, total 160,000 21,000 J
lead, total 400 19
magnesium, total 1,000,000 24,800 J
manganese, total 25,000 1,000
mercury, total 160 0.15 U
molybdenum, total 16,000 4.5
nickel, total 40,000 14
pCBSA 230,000 0.01 U
phenanthrene 1,600 0.59 U
PBB 1.2 0.13 U
potassium, total NA 700 J
pyrene 29,000 0.59 U
selenium, total 2,600 0.87
silver, total 2,500 0.1 U
sodium, total 1,000,000 140
toluene 250 0.23
vanadium, total 750 14
zinc, total 170,000 130
a = Unless otherwise noted, the screening level is the MDEQ Residential
Direct Contact Criteria (DCC).
b = The “NA” indicates that no screening level is available.
c = The “U” indicates that the analyte was not detected above the reported
sample quantitation limit.
d = The screening level is the MDEQ Residential DCC for total chlordane
isomers.
e = The “J” indicates that the value is an estimated result.
f = The screening level is the MDEQ Residential DCC for hexavalent
chromium.
g = The “UJ” indicates that the analyte was not detected and the reporting
limit is estimated.