public health emergencies: use of real-time mobile ... · use of mcms to prepare for and respond to...
TRANSCRIPT

Public Health Emergencies:
Use of Real-time Mobile
Communications
Alfred Sorbello, DO, MPH, FACOI
Medical Officer
US FDA/CDER/Office of Translational Sciences
2
DisclaimerThe views and opinions expressed in the
following PowerPoint slides are those of the
individual presenter and should not be attributed to the US FDA or the federal government.
3
NATIONAL PUBLIC HEALTH EMERGENCY PREPAREDNESS:
2009 H1N1 INFLUENZA A PANDEMIC
www.fda.gov

4Fineberg HV. N Engl J Med 2014;370:1335-1342
2009 H1N1 Influenza Pandemic
A novel flu strain evolved froma combination of genetic elements from avian, pig, and human virus strains
US Secretary of DHHS declareda public health emergency onApril 26, 2009.
WHO declared a global pandemic on June 11, 2009.
By end of August 2009, cases reported in >180 countries.

5
H1N1Cases reported in Mexico
Sources:FDA 2009 H1N1 (Swine) Flu Page (archived)H1N1 EUAs – Archived Information (FDA)Historical Information about Device Emergency Use Authorizations (FDA)CDC 2009 H1N1 Pandemic: Summary Highlights, April 2009 – April 2010 (archived)
CDC starts candidate vaccines
CDC confirms US casesApr. 15
WHO declares PHEIC
FDA issues 1st
EUAs for flu antivirals & diagnostics
US declares PHE
CDC starts releasing MCMs from SNS
Apr. 21
Apr. 25
Apr. 26
Apr. 27
Apr. 26
Discussions well underway:‒ Vaccine EUA/lic.‒ Vaccine safety‒ AntiviralsMay 2009
April 2009
Vaccine distribution planning well underwayJune 2009
Resistance to oseltamivir & zanamivirfoundJuly 2009
ACIP meeting for recommendationsJuly 2009
NIH starts clinical trialsJuly 2009
FDA approves 4 H1N1 vaccinesSept. 2009
NIH announces trial resultsSept. 2009
PeramivirEUAOct. 2009
6
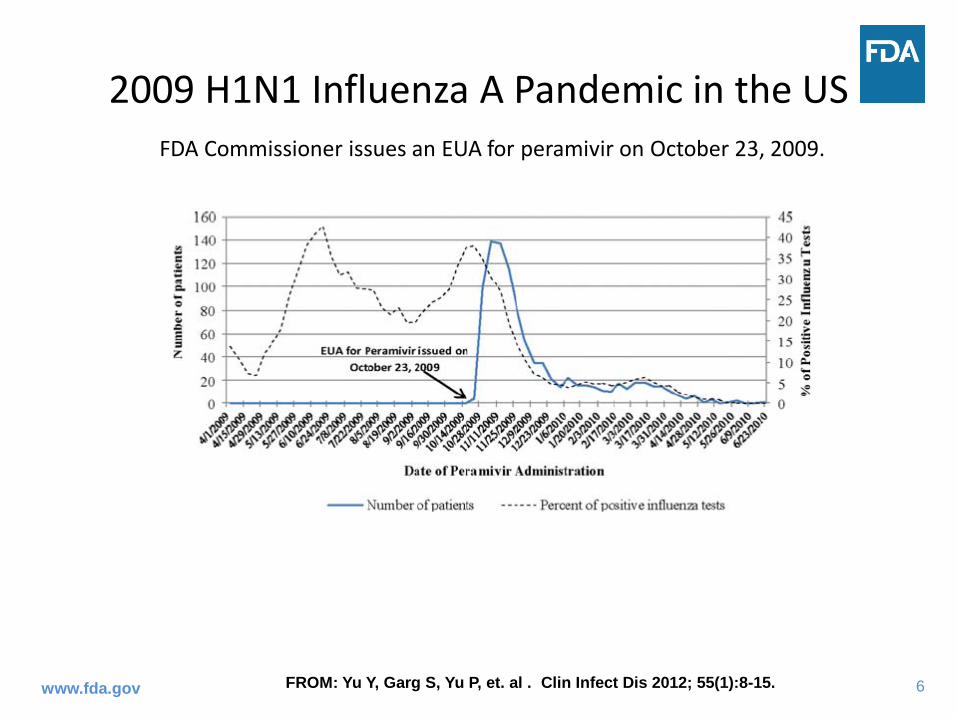
2009 H1N1 Influenza A Pandemic in the US
www.fda.gov FROM: Yu Y, Garg S, Yu P, et. al . Clin Infect Dis 2012; 55(1):8-15.
FDA Commissioner issues an EUA for peramivir on October 23, 2009.

7
An EUA :1. May be issued by FDA Commissioner based
on HHS Secretary declaration of an emergency or threat of an emergency
2. Allows FDA to facilitate availability and unapproved use of MCMs to prepare for and respond to CBRN emergencies
3. Authorizes access to a drug or device subject to specified conditions
4. Is not considered a clinical trial of an unapproved drug or device
5. May include unapproved products or approved products intended for unapproved use(s)
Medical countermeasures (MCM) refer to drugs, biologic products, antidotes, vaccines, in vitro diagnostic laboratory tests, and other drug products or devices
CBRN = chemical, biological, radiological, or nuclear, including emerging infectious diseases (pandemic influenza)
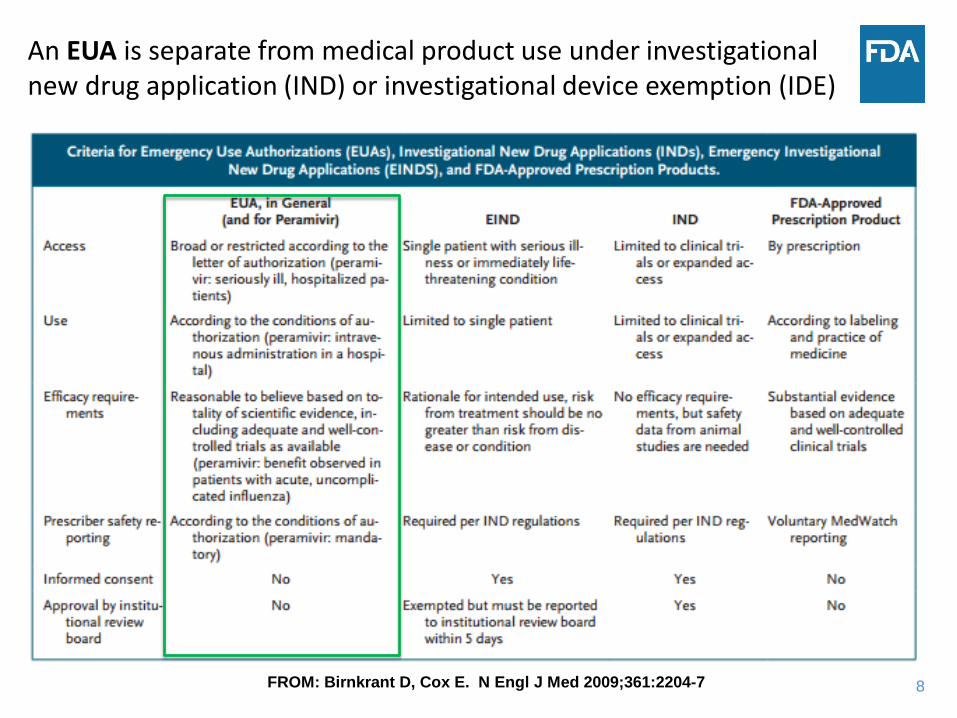
8FROM: Birnkrant D, Cox E. N Engl J Med 2009;361:2204-7
An EUA is separate from medical product use under investigational new drug application (IND) or investigational device exemption (IDE)

9
FDA Adverse Event Reporting System (FAERS)
FDA Form 3500 (MedWatch)

10
●The EUA for intravenous peramivirin October 2009 was the first EUA authorized for an unapproved drug product in the US
● The MedWatch reports served as the primary source of safety information for FDA.
● MedWatch reporting was subject to underreporting and missing data. The data was confounded in some instances by severity of influenza, concomitant drugs, and concurrent medical disorders.
FDA evaluation of the safety of peramivirduring the H1N1 influenza A pandemic

11
Lessons learned: pandemic preparedness
MedWatch reports were time consuming for reporters, and analysis was limited by variable quality of reporting and missing data
Need for systems to handle real-time reporting of safety concerns, changes in clinical condition, and patient outcomes
Limited technical tools to extract, analyze, and share information in real-time for surveillance and decision making purposes
Need for a dedicated data management platform for integrating and analyzing information from multiple data streams
Need for real-time bidirectional communication during a declared national emergency to foster communication and information sharing

12
Henry Francis, M.D.FDA/CDER/OTS
Real Time Application for Portable Interactive Devices

13
• RAPID is the FDA’s first bidirectional communication system.
• Mobile applications for data collection
• Data lake to store diverse data resources, including information on adverse drug reactions, and analytics to enable FDA to detect emerging drug safety signals
• Changes how FDA will conduct post-market product surveillance
• Enhances emergency preparedness and response involving medical countermeasures (MCM)
14
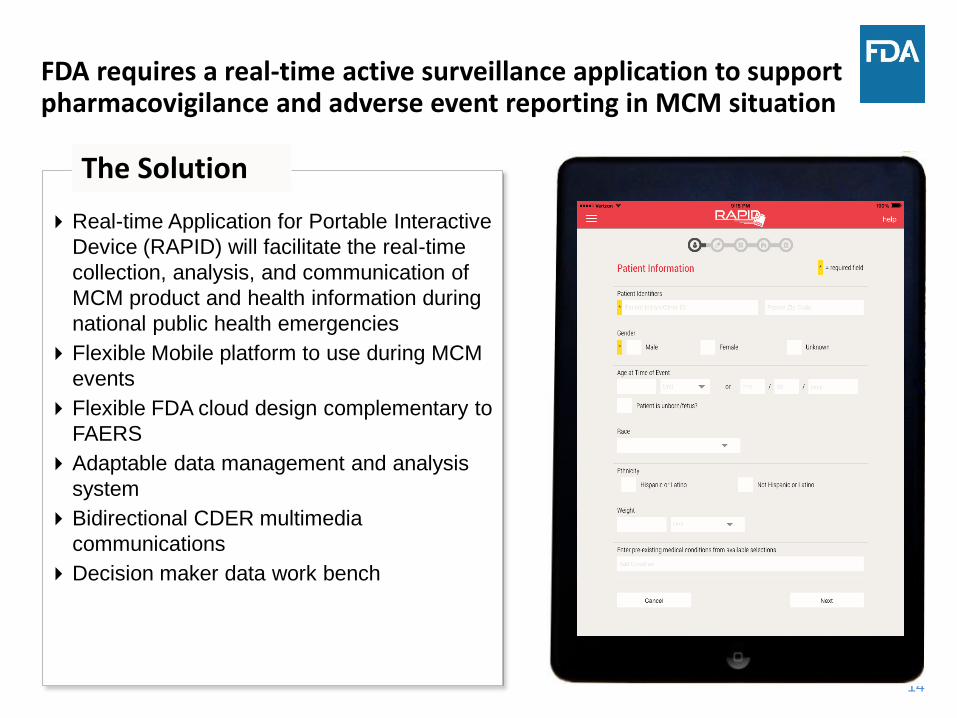
FDA requires a real‐time active surveillance application to support pharmacovigilance and adverse event reporting in MCM situation
Real-time Application for Portable Interactive
Device (RAPID) will facilitate the real-time
collection, analysis, and communication of
MCM product and health information during
national public health emergencies
Flexible Mobile platform to use during MCM
events
Flexible FDA cloud design complementary to
FAERS
Adaptable data management and analysis
system
Bidirectional CDER multimedia
communications
Decision maker data work bench
The Solution

15

16
RAPID
• Organized in four tiers:
– Mobile app for collection of incoming diverse information
– A data lake to store diverse data resources, including information on adverse drug reactions, and analytics to enable FDA to detect emerging drug safety signals
– Data visualization dashboards to assess patterns in data and allow emerging issues to be explored
– Presents information and analyses to leadership to support decision making and guidance to ensure patient safety

17
RAPID Biosurveillance System
Tier 1: Regulatory Action/Guidance
FDA and external partners issue
guidance to ensure patient safety
Tier 2: Data Visualization
Dashboards summarizing key
information provide safety alerts
Disproportionality metrics and
detailed analyses allow FDA and
collaborators to understand
emerging issues
Tier 3: Data Management &
Analytics
RAPID data is combined with
existing MedWatch and
Medwatcher reports and data
from external collaborators
Advanced analytics support AE
signal detection
Tier 4: Processing of Adverse Events
Healthcare professionals submit
AE data via the RAPID mobile app
AE data is stored in a “data lake”
to support real-time access
The cloud-based RAPID Bio-surveillance System will support collaboration between FDA and other Federal agencies to enhance monitoring emerging health threats
m
e
d
w
a
t
h
e
r
D
r
u
g
S
h
o
r
t
a
g
e

18
RAPID Biosurveillance System
Tier 4: Processing of Adverse Events
Healthcare professionals submit AE data via the RAPID mobile app
AE data is stored in a “data lake” to support real-time access
Tier 4 of the cloud-based RAPID Biosurveillance System includes the processing of adverse events submitted by clinicians, healthcare professionals and other reporters

19
RAPID Biosurveillance System
Tier 3: Data Management & Analytics
RAPID data is combined with existing MedWatch reports and data from external collaborators
Advanced analytics support AE signal detection
Tier 3 of the cloud-based RAPID Biosurveillance System includes data storage, data integration, and advanced analytics to support adverse event signal detection

20
RAPID Biosurveillance System
Tier 2: Data Visualization
Dashboards summarizing key information provide safety alerts
Disproportionality metrics and detailed analyses allow FDA and collaborators to understand emerging issues
Tier 2 of the cloud-based RAPID Biosurveillance System includes visualization of adverse event trends for interpretation by FDA staff and external collaborators
21
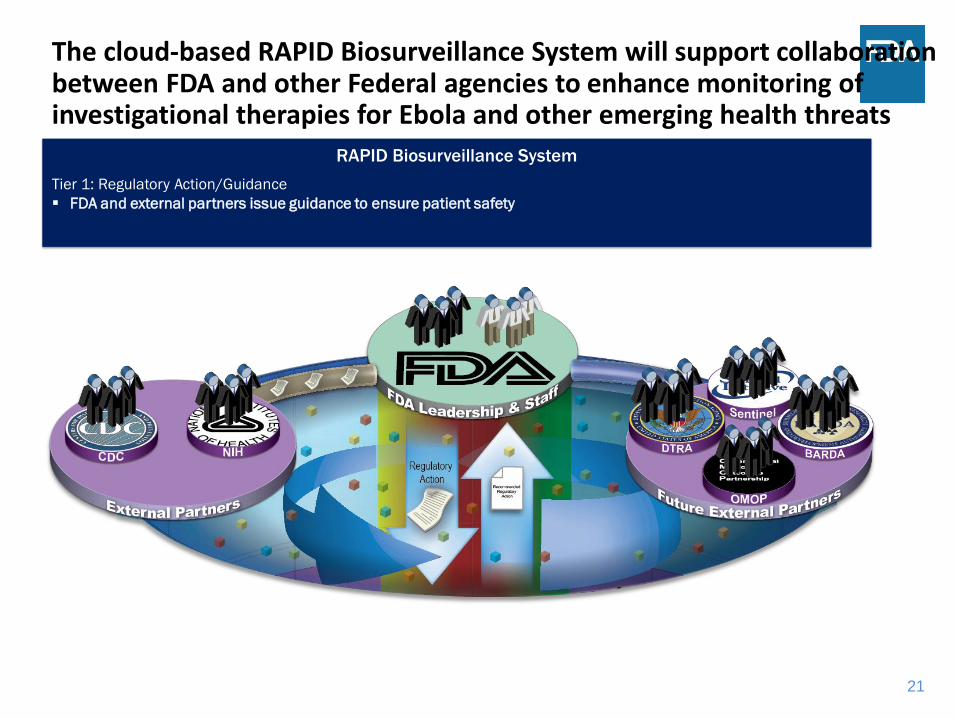
RAPID Biosurveillance System
Tier 1: Regulatory Action/Guidance
FDA and external partners issue guidance to ensure patient safety
The cloud-based RAPID Biosurveillance System will support collaboration between FDA and other Federal agencies to enhance monitoring of investigational therapies for Ebola and other emerging health threats

22
FDA collaborators in MCM events
• Federal agencies
• Healthcare providers
• Healthcare facilities
• Individuals
• Sponsors

23
RAPID use cases
• Non-MCM– Product Safety
Surveillance
– Risk Evaluation and Mitigation Strategies (REMS)
– Medication Errors
• MCM related– Real time patient
outcome and safety data collection
– Streaming data
– Merging data resources, e.g. weather and disease patterns
MCM = medical countermeasures

24
• Cloud-based storage in a data lake (can accommodate streaming information while minimizing need for physical servers)
• Analytics dashboard, including geolocation functionalities
• Secure data broker to allow approved outside collaborators to view mirrored information

Adverse Event Analytical Tools•Scott Proestel
•Robert Levin
•Samantha Cotter
3
DPV - Adverse Event Report Use Case
DPV Stakeholders
Healthcare Professionals and consumers submit regular and emergency surveillance adverse event reports
1
2
4
Geovisualization
Empirica
RAPID AE Dashboard
& Data
General Surveillance
Emergency Surveillance
RAPID External Data (Future) 5
1
2
3
4
5Mobile Data Collection:
Clinicians, reporters, and
patients create general
surveillance and emergency
surveillance reports
Data Transferred to FDA:
Data is submitted from mobile
device and sent over Cellular
network or WiFi to FDA
GovCloud via web services
Response Sent to Reporter:
Within 24 hours a targeted response
is sent via email containing links to
multimedia files like images and
podcasts
Perform Analytics :
Utilize RAPID Dashboard,
location based data, and
Empirica (signal detection) for
analysis
Obtain External Data:
Data will be shared from external
sources via web services (ex.
HL7 ICSR) and increase the
effectiveness of analysis
performed using RAPID
analytical tools
RAPID Heatmap

26
Dashboard: Homepage for Regulatory Review

27
RAPID GIS Visualizing Functionality

REMS Program Dashboard
•Cynthia LaCivita
•Lisy Vega
•Gita Toyserkani
•Doris Auth
•Shelly Harris
3
1
2
3
4
Mobile Data Collection:
Prescribers, pharmacists, and
patients complete the REMS
Assessment using the RAPID
app on their mobile device
Data Transferred to FDA:
Data is submitted from mobile
device and sent over Cellular
network or WiFi to GovCloud via
web services
Perform Analytics :
Utilize the REMS Dashboard to
view composite scores, results
by domain, and to perform
additional analysis
Response Sent to Reporter:
Send email containing information
about the REMS Program back to
the user
DRISK - REMS Assessment Use Case
DRISK Stakeholders
Prescribers & Pharmacists submit REMS Program Assessment
1
2
4

Medication Error Dashboard
•Jo Wyeth
•Mishale Mistry
•Hina Mehta
3
1
2
3
4
Mobile Data Collection:
Prescriber completes a
Medication Error Report and
attaches an image using the
RAPID app on their mobile
device
Data Transferred to FDA:
Data is submitted from mobile
device and sent over Cellular
network or WiFi to GovCloud via
web services
Perform Analytics :
Utilize the Medication Error
Dashboard to view overview of
the medication error reports that
are being submitted
Response Sent to Reporter:
Send email containing information
about the Medication Error back to
the user
DMEPA – Medication Error Use Case
DMEPA Stakeholders
Prescriber submits medication error report
1
2
4

30
RAPID Dashboard for Agency Leadership

31
• Designed to streamline completion of FDA Form 3500A (MedWatch) more efficiently and in less time (from approximately 45 minutes to 5 minutes)
• Includes voice-recognition technology to capture dictated response information
• Captures pictures, small videos, and other image recordings taken with mobile phones
• Provides bi-directional communication functionality so that FDA can send back information (such as how to use the drug and potential side effects to be aware of)

• Patient history data• Physical exam data• Laboratory data• Medical equipment data
(diagnostic, treatment, life support, monitors, etc.)
Physicians – RAPID informs diagnosis and treatment of patients
Hospital Administrators – RAPID supports allocation of healthcare resources
ASPR – RAPID enables improved management of MCM stockpiles
RAPID Secure Data
Broker (SDB) –
Provides access to
adverse event
reports and
electronic health
records to inform
decisions made by
physicians,
hospitals and the
Assistant Secretary.
• How to diagnose the patient based on symptoms, history, and data from others?
• How can data from other patients influence the current patient’s treatment plan?
• What drugs, vaccines and/or diagnostics should be ordered to treat the patient?
• Number of occupied beds• Patient characteristics
(diagnoses, level of care, etc.)• Patient status (waiting for
treatment, ready for hospital discharge, etc.)
• How to manage current patient flow?• How many patients are projected to
require care in the short- & long-term?• What number and type of medical
equipment are required to diagnose and treat patients in short- & long-term?
Daily
• Number and location of stockpiles (drugs, vaccines, diagnostics)
• Type, severity and location of potential CBRN threats
• Syndromic surveillance data from state/local public health agencies
• How to manage stockpile inventory and location?
• How to get MCM resources to patients and at-risk populations?
• What types of threats are most likely to occur in the short- and long-term?
Streaming
Monthly
Geographic visualizations
Hospital Alerts
!
Clinical Decision Support
Data from RAPID combined
with other systems
Key questions and capabilities that can be
addressed with RAPID data
RAPID MobileApplication
The Real-time Application for Portable Interactive Devices (RAPID) System can inform decision-making at the physician, hospital and Federal level

33
RAPID Phase II
The proposed RAPID Biosurveillance Platform includes a cloud-based open source big data analytic tool
to facilitate the detection of adverse event signals in near real-time.
Additional data sources can be integrated to augment product safety information received via the RAPID
mobile application.
RAPID Biosurveillance Platform
Drug-Event Tracker
Drug% Change in Number of
Reports (daily)
Algorithm & Ranking Statistic
(all data)
Peramivir-H1N1 3 2.0
Avandia-Diabetes
2.1 1.05
MPA-Steroid Injections
1.0 1.3
Zanamivir-H1N1
0.17 1
ALL 10 2.5
Cubism.jsTime Series Visualization
Cubism.js is a D3 plugin for visualizing time series. Use Cubism to construct better realtime
dashboards, pulling data from Graphite, Cube and other sources. Cubism is available under the
Apache License on GitHub.
Scalable
Cubism fetches time series data incrementally: after the initial display, Cubism reduces server load
by polling only the most recent values. Cubism renders incrementally, too, using Canvas to shift
charts one pixel to the left. This approach lets Cubism scale easily to hundreds of metrics updating
every ten seconds! Despite asynchronous fetching, rendering is synchronized so that charts update
simultaneously, further improving performance and readability.
Effective
Cubism also scales in terms of perception: small multiples aligned by time facilitate rapid
comparison. Cubism’s horizon charts make better use of vertical space than standard area charts,
allowing you to see many more metrics at-a-glance and increasing the likelihood of discovery. If you
compress a 120-pixel tall area chart to 30 pixels, you lose 75% of the resolution and it becomes
harder to see small changes:
In contrast, horizon charts reduce vertical space without losing resolution. Larger values are
overplotted in successively darker colors, while negative values are offset to descend from the top.
As you increase the number of colors, you reduce the required vertical space:
Mouseover or use the arrow
keys to inspect values.
Open in a new window.
09:23 09:24 09:25 09:26 09:27 09:28 09:29 09:30 09:31 09:32 09:33 09:34 09:35 09:36 09:37 09:38
foofoo 3.13.1
barbar 8.68.6
foo + barfoo + bar 1212
foo - barfoo - bar −5.5−5.5
Cubism.js http://square.github.io/cubism/
1 of 2 12/22/13 9:38 PM
Time Series Visualization for Number of Reports for Drug of Interest:
Adverse Event Data and Social Media Data
FAERS
Social Media
10
14
24
*Mouseover bubbles to
view information on
adverse events reported
at different geographic
locations
Alerts … Peramivir 3% Change in Number of Reports … Avandia 2.1% Change in Number of Reports …
2 3
1
1) Alerts: Display drugs with > 50% increase in the
number of reports in the last 2 weeks
2) Drug-AE Filter: Show drugs with AEs linked to fatal
outcomes or pediatric populations
3) Disproportionality Metric Filter: Show ROR, PRR
and other disproportionality metrics
*Mouseover or use the arrow keys to inspect values
Other streaming
data sources

34
Drug Safety Surveillance, Data Mining, and Data Analytics

35
Diverse Biomedical Resources for Drug and Biologic Product Safety Surveillance
Administrative claims data

36
FDA Adverse Event Reporting System (FAERS)
• Centralized repository of postmarket spontaneous adverse event reports submitted by manufacturers and consumers
• Human drugs and therapeutic biologic products
• >9 million reports since 1969
• approximately 1.5 million reports /year
• Detection of rare ADEs not observed in clinical trials

37
• Bibliographic database of more than 26 million biomedical citations
• Developed a novel prototype web-based tool (PEARL) that leverages Medical Subject Heading (MeSH) indexing terms to extract citations reporting adverse drug events (ADEs)– We used combinations of MeSH descriptors (and supplementary
concepts) and qualifiers to identify drugs involved in ADEs (e.g., ofloxacin/adverse effects) and clinical manifestations reflecting an ADE (e.g., tendinopathy/chemically induced).
• Explored various statistical approaches for data mining to detect emerging ADE safety signals
PubMed/MEDLINE

38
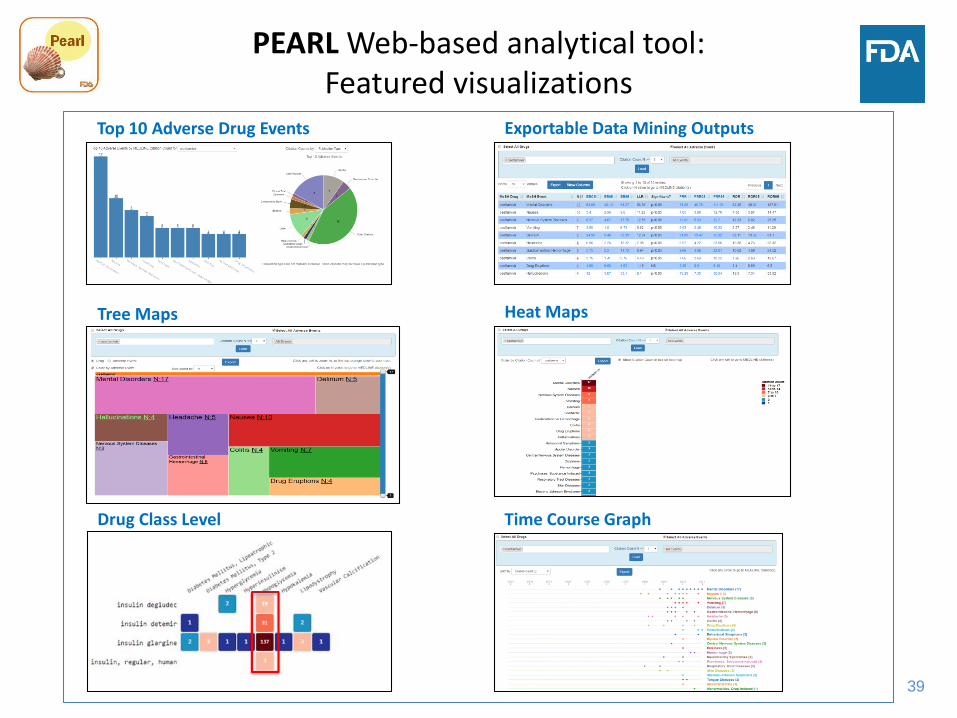
PEARL web-based analytical tool
►First-of-its-kind information technology tool
►Builds capacity to harness biomedical resources to support pre-and post-market regulatory decisions
►Complementary to existing resources (e.g., FAERS)
39
PEARL Web-based analytical tool: Featured visualizations
Top 10 Adverse Drug Events Exportable Data Mining Outputs
Tree Maps Heat Maps
Time Course GraphDrug Class Level

40
PEARL detects drug-adverse event safety signals from diverse scientific literature

41
Weekly PubMed Literature ‘Alerts’
Featured Functionalities
Managed customized literature search queries
►Aim: to detect safety and efficacy issues that are newly emerging and not known prior to the search
►Leverages existing search functionality in PubMed (MyNCBI)
►Focus on the most recently deposited PubMed/MEDLINE citations that have not yet been MeSH indexed
Sample literature ‘Alert’ email
42
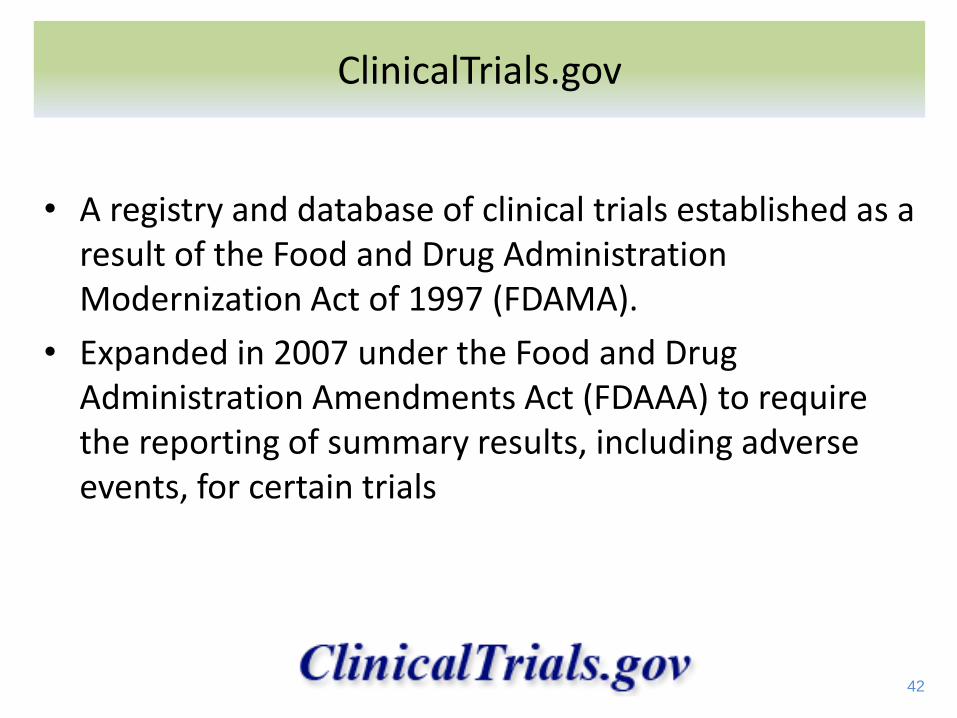
• A registry and database of clinical trials established as a result of the Food and Drug Administration Modernization Act of 1997 (FDAMA).
• Expanded in 2007 under the Food and Drug Administration Amendments Act (FDAAA) to require the reporting of summary results, including adverse events, for certain trials
ClinicalTrials.gov

43
ClinicalTrials.gov
A total of 22,546 completed studies with results through June 2017.

44
• Preliminary work designed to establish a block chain-mediated connection between a group of selected USCIIT participating hospitals and FDA
• Identify influenza cases using patient level data for case reporting and patient outcome evaluation
• Ensure removal or anonymize PII/PHI data
• Use FHIR accelerator to onboard hospitals
• Operations and analytics to be conducted in secure data broker and FDA GovCloud
PII = personally identifiable information; PHI = protected health informationUSCIIT = US Critical Illness and Injury Trials Group
Electronic Health Records
45
RAPID Summary• Bidirectional mobile platform to collect information and
analyze it in real-time, and provide information/response back within 24 hours
• Enhance efficiency and speed of response to urgent public health needs
• Flexible data and analytic cloud platform• Enhances product safety surveillance activities• Use cases oriented to medical countermeasures in
response to emerging infectious disease threats (pandemic influenza), CBRN agents, REMS, and medication errors
CBRN = chemical, biological, radiological, or nuclear; REMS = risk evaluation and mitigation strategy
