public perceptions of choice in uk dental care: findings ... · public perceptions of choice in uk...
TRANSCRIPT

1
.
Public perceptions of choice in UK dental care: findings from a national survey
October 2012 By Martin Kemp, Fiona Wallace, and Henry Edwards British Dental Association 64 Wimpole Street London W1G 8YS
I
I
About the BDA
The British Dental Association (BDA) is the professional association for dentists in
the UK. It represents more than 23,000 dentists working in general practice, in
community and hospital settings, in academia and research, and in the armed
forces, and includes dental students.
Copyright notice
Copyright © BDA 2012
All rights reserved. No part of this publication may be reproduced, stored in a
retrieval system, or transmitted in any form or by any means electronic, mechanical,
photocopying, recording or otherwise, without either the permission of the publishers
or a license permitting restricted copying in the United Kingdom issued by the
Copyright Licensing Agency Ltd, 90 Tottenham Court Road, London W1P 9HE.

II
II
Contents
Summary 1 1 Introduction and background 5
1.1 The OFT investigation of the UK Dentistry market 5
1.2 BDA response to OFT 2011/12 6
2 A National Consumer Survey of Dental Patients 8 3 Findings 10
3.1 Patterns of attendance 10
3.2 Reasons for not going to the dentist 15
3.3 Type of care received 15
3.4 Patients‟ reasons for choosing type of care at last visit to a dentist 18
3.5 Patients‟ evaluations of the care they received at last visit to a dentist 22
3.6 Awareness of complaints procedure 29
Bibliography 31 Appendix Omnibus Questions 32

III
III
List of Tables
Table 2.1 Demographic characteristics of the sample 9
Table 3.1 Frequency of visits to the dentist 10
Table 3.2 Length of time since last visit to a dentist, by socio-demographic
characteristics 14
Table 3.3 Reasons for not visiting a dentist in past two years, by sex, age, and
social grade 16
Table 3.4 Type of care received at last visit, by socio-demographic characteristics 17
Table 3.5 Reasons for choosing type of care among those who received NHS
dental care at last visit 19
Table 3.6 Reasons for choosing type of care among those who received private
dental care at last visit 20
Table 3.7 Reasons for choosing type of care among those who received mixed
private and NHS dental care at last visit 21
Table 3.8 Did cost affect the type of treatment chosen at last visit, by type of care,
age group, and social grade? 25
Table 3.9 Feeling of being involved in treatment decisions at last visit, by type of
care, age group, and social grade 26
Table 3.10 Reasons for dental care explained by dentist at last visit in a way that
could be understood, by age group, type of care, and social grade 27
Table 3.11 Level of satisfaction with last visit, by type of care received 28
Table 3.12 Awareness of practice‟s complaints procedure, by age group, type of
care, and social grade 29
List of Figures
Figure 3.1 Frequency of visits to the dentist, by sex 12
Figure 3.2 Frequency of visits to the dentist, by age group 12
Figure 3.3 Frequency of visits to the dentist, by UK country of residence 13
Figure 3.4 Frequency of visits to the dentist by social grade 13
Figure 3.5 Patients‟ ratings of how well fees and charges were explained by their
dental practice prior to treatment at last visit to a dentist 24
Figure 3.6 Value-for-money rating of care or treatment received at last visit
(excluding visit to hygienist) 24

1
1
Summary
This report describes some of the findings from a programme of research and
analysis carried out by the British Dental Association (BDA) to investigate how well
the UK dentistry market is working.
In November 2011, the BDA commissioned GfK NOP to survey a sample of adults
from across the UK in order to learn more about how well the UK dentistry market is
working for consumers.
The topics consumers were asked about included: dental health behaviour; use of
dental services; barriers to access; and level of satisfaction with the quality of the
care they received.
Eight questions were included in a GfK NOP Omnibus consumer survey of 1000
adults aged 16+ years. Fieldwork took place between 11th and 13th November 2011
and was conducted via telephone interviews. The demographic profile of the sample
was representative of all adults in telephone owning households in the UK.
Respondents are classified in this report as either „consumers‟ (all respondents) or
„patients‟ (those who have visited the dentist in the past two years).
The main findings from the survey include:
Patterns of attendance
Almost 80 per cent, or four out of five, of consumers surveyed had visited their
dentist during the previous 24 months, the maximum recall period recommended
by the National Institute for Health and Clinical Excellence (NICE)1;
Consumers in D and E social-grade categories were found to be less likely to
have visited the dentist in the past two years compared to those in A and B
categories – over 14 per cent fewer DEs compared to ABs;
Just over 12 per cent visited only when they had a problem with their teeth or
dentures and around seven per cent of consumers said they had never visited a
dentist.
Reasons for not going to the dentist
Among those who had not been to the dentist in the past two years, the most
common reason reported for non-attendance was a belief that there was no need
1 The NICE dental-recall guidelines indicate the number of months at which patients should be
recalled according to their age and oral health, where the maximum time period is 24 months. An overview of NICE dental recall guidelines can be found at: http://www.nice.org.uk/nicemedia/pdf/cg019niceguideline.pdf [Accessed 25th July 2012]

2
2
to go (two-thirds of consumers). This was a particularly common reason cited
among men and younger age groups;
The next two most common reasons for non-attendance were not being able to
afford to go (17.2 per cent) and a fear of going to the dentist (16.2 per cent);
Among non-attenders, women were more likely than men to say that they could
not afford to visit a dentist (29.9 per cent compared to 6.7 per cent);
Affordability as a reason for non-attendance also varied by social grade; for
example, 27.3 per cent of consumers in social-grade categories D and E cited
affordability issues, compared to only nine per cent of consumers in categories A
and B;
Around one in six non-attenders reported feeling afraid to visit the dentist;
The likelihood of say that they were afraid of visiting the dentist was highest
among older age groups and those in D and E social-grade categories;
More than one out of every ten consumers who had not visited a dentist in the
past two years said that it was because they could not find an NHS dentist;
Almost six per cent of consumers did not attend due to their dentist changing to
private.
Type of care received at last visit to dentist
Approximately six out of every ten patients who had visited a dentist in the past
two years said that they had only received NHS care at their last visit compared
with one-third who received private care only;
Around six per cent reported receiving a mixture of private and NHS care at their
last visit to a dentist;
Over two-thirds of women received NHS dental care at their last visit compared
with just over half of men; men were correspondingly more likely than women to
have had private treatment at last visit;
Younger people were more likely than those in older age groups to say they had
received NHS dental care at last visit, who were slightly more likely to have
received private treatment;
The type of dental care received at last visit varied by social grade; for example,
45.8 per cent of patients in the AB social-grade categories reported receiving
private care at their last visit. By comparison, only 22.8 per cent of patients in DE
categories reported receiving private care.
Reasons for choosing type of care
The main driver of patient choice of treatment was cost; for example, among those
who received exclusively NHS care at their last visit, the most common reason they
gave for choosing that type of care was financial; for example, 16.7 per cent reported
choosing NHS care because it was cheaper than private care, 13.4 per cent chose
NHS care because it was free, and 13.3 per cent said that they could not afford
private care.

3
3
Among those who had received private care at last visit, the most common reason
given (15.5 per cent) for receiving that type of care was a desire for continuity: they
had decided to stay with their dentist when they had changed from NHS to private. In
addition, 14.3 per cent said that they had received private care at their last visit
because there had been no NHS dentists available in the area where they live or
they had been unable to find an NHS dentist. Finally, another common reason given
by patients for choosing private over NHS care was that they trusted their dentist and
felt that they received a good quality service (12.7 per cent).
Patients’ evaluations of the care they received at last visit to a
dentist
How well costs were explained:
For the majority of patients who had attended a dentist in the past two years, the
survey found a high level of satisfaction with the way costs were explained; almost
eight out of ten of those who pay for their treatment rated how well their dentist
explained fees and charges as „good‟ or „very good‟.
Value for money:
Over three-quarters of patients who had visited a dentist in the past two years
thought that their treatment had been „good‟ or „very good‟ value for money at
their last visit, with only four per cent reporting that value for money had been
„poor‟ or „very poor‟. Overall, both NHS and private care were perceived to be
„good‟ or „very good‟ value for money;
Some of those who received mixed dental treatment felt that they had not
received good value for money. This suggests the need for further research
focusing specifically on the experiences of this patient group.
How cost affected choice of treatment:
Among those who attended a dentist in the past two years, 22.8 per cent said
that their choice of treatment had been affected by cost;
There was no difference between NHS and private patients in the likelihood of
saying that cost had affected their choice of treatment;
There was a clear social gradient in how likely cost of treatment affected patient
choice; for example, more patients in social-grade categories D and E said that
their choice of treatment had been affected by cost compared with those in A and
B categories;
Older patients (aged 65 or more) were least likely to say that their choice of
treatment had been affected by cost compared with those in younger age groups.
Feeling of involvement in treatment decisions:
Three-quarters of patients said they had been involved in decisions about their
treatment;

4
4
Patients in social-grade categories A and B were more likely to say that they felt
involved in treatment decisions compared with those in categories D and E;
Eight out of every ten private patients felt involved in decisions at their last visit,
compared with approximately seven out of every ten NHS and mixed dental care
patients.
Dentist explained treatment by dentist in a way that could be understood:
Almost all patients said that their dentist explained the reasons for their treatment
at their last visit in a way that could be understood;
There was little variation in how well treatment decisions were explained by social
grade, age group, or type of care received (NHS, private or mixed).
Overall level of satisfaction with treatment received at last visit:
Nearly 80 per cent of those patients who had seen a dentist in the past two years
were highly satisfied with their treatment;
Patients who had seen a dentist in the past two years reported an average
satisfaction score of 8.5 (out of a maximum of 10) at their last visit;
There was only a slight difference in levels of satisfaction between NHS and
private patients;
Recipients of mixed dental care were more likely to report a lower satisfaction
score compared with those who had received exclusively NHS or private
treatment;
This again suggests the need for further research into the experiences of mixed
dental care patients and the delivery of mixed dental care.
Awareness of complaints procedure
Around 61 per cent of patients reported that they had been aware of their dental
practice‟s complaints procedure (at last visit to a dentist);
Only nine respondents (one per cent) had made a complaint in the past two
years; the subject of these complaints mostly related to the quality of treatment or
care received. In addition, one patient complained about charges and another
about waiting times.

5
5
1 Introduction and background
In September 2011, the Office for Fair Trading (OFT) announced its plan to conduct
an investigation into the UK market for the provision of dental services (OFT, 2011).
This report forms part of a wider contribution of evidence submitted by the British
Dental Association (BDA) to the OFT investigation. Its evidence was based on a
programme of research undertaken by the BDA between October and December
2011.
The research programme consisted of: a survey of 1,000 UK consumers
commissioned from GfK NOP; an online survey of 1,723 dental practice owners; an
in-depth case study of the dental market in the London Borough of Croydon which
included three patient focus groups and eight semi-structured interviews with local
practice owners; and five interviews with local stakeholders; and a rapid search of
the research literature on choice and competition in UK dentistry.
This report describes the findings from the GfK NOP survey of UK consumers. The
current section situates this survey in relation to the wider programme of work
carried out by the BDA. This is followed in Section 2 by a description of the design
and outcome of the survey. The final section describes the findings from the survey.
1.1 The OFT investigation of the UK Dentistry market
According to the OFT‟s scoping document for the investigation, its purpose was
“to examine whether the UK dentistry market is working well for
consumers. It will examine how dentistry services are sold and the extent
to which there is access to accurate and impartial information to help
make informed decisions. It will consider consumers' ability to assess and
act on the information that is provided, as well as the nature of
competition between providers of dental services”. (OFT, 2011:3)
OFT (2010) define a market that is „working well‟ in the following way:
“When markets are working well, firms compete to win business by
achieving the lowest level of cost and prices, developing better products
and services or exploiting their strengths, skills, and other advantages to
meet consumers’ needs more effectively than their rivals. This process
encourages innovation and provides consumers with increased choice.
Competition is enhanced when consumers are empowered to shop
around through access to readily available and accurate information about
products and services.” (OFT, 2010:2)
That is, a healthy market is one that meets “consumers‟ needs”. Competition
between firms results in lower costs and better quality services or products for

6
6
consumers. By contrast, OFT describe the consequences of a market that is not
working well in the following way:
“Markets that are not working well can result in serious negative effects for
consumers, businesses and the economy. For example, consumers may
be unable to make informed choices about prospective purchases,
businesses may be deterred from improving their products or entering the
market and productivity in the sector may be undermined.” (OFT, 2010:2)
Here, then, a market that is not working well is one where there is limited competition
between firms. When consumers are not well informed and where the choices
available to them are limited, this can lead to poorer quality services and products.2
When this thinking is applied to UK Dentistry, it implies that better informed patients
and consumers, together with higher levels of competition and choice are likely to
result in more affordable and better quality dental care for the UK population.
1.2 BDA response to OFT 2011/12
In response to the OFT investigation, the British Dental Association (BDA) submitted
evidence which included relevant economic arguments, research, information, policy
positions and recommendations (BDA, January 2012).3 This submission was
grounded in the findings from a programme of research and analysis carried out to
address the question at the heart of the OFT investigation: how well is the UK
dentistry market working? This research programme sought to:
Examine the extent to which information about dental services is accessible and
transparent to consumers, enabling them to make informed decisions about their
care;
Assess whether the UK dentistry market supports consumer switching;
Identify whether current mechanisms for complaint and redress are effective;
Assess levels of competition in the UK dentistry market and how this affects
quality and cost;
Assess the extent to which there are barriers to entry into and the expansion of
the NHS dentistry market.
These objectives cluster around three main themes which were the focus of the
research programme:
Information and choice;
Competition;
2 An overview of OFT market studies can be found at: http://www.oft.gov.uk/shared_oft/business_leaflets/enterprise_act/oft519.pdf (Accessed 14 May 2012) 3 The BDA‟s submission to the Office of Fair Trading inquiry into the UK dentistry market can be found at: http://www.bda.org/dentists/policy-campaigns/research/oft/OFT.aspx (Accessed 18 July 2012)

7
7
Complaints.
Our research sought to answer the following research questions:
Is there sufficient transparency of information to enable consumers to make
informed choices between dental practices, treatments, private and NHS
provision, and different payment methods?
Is this information provided in appropriate forms?
Are effective mechanisms in place to support consumer switching? What barriers
do consumers face when they want to switch dentists?
How far are consumers aware of complaints procedures?
How do practices compete – service, speed of appointments, etc.?
How satisfied are patients with NHS and private dental care?
What is the average price of common private treatment and is there a relationship
between price and time taken?
What are the barriers to entry into the UK NHS dental market?
What are dentists‟ attitudes to direct access to dental care professionals?
The research design consisted of four main elements:
A survey of BDA member practice owners in the UK;
A search and review of the policy and research literature on the themes above;
An in-depth qualitative case study of the dentistry market in the London Borough
of Croydon;
A national survey of consumers of dental care (commissioned from GfK NOP).
The remainder of this report describes the main findings from the last of these: a
survey of consumers about their dental health behaviour and their views about the
dental care that they have received.

8
8
2 A National Consumer Survey of Dental Patients
This section gives an overview of the design and outcomes of the consumer survey
commissioned from GfK NOP that contributed to the BDA‟s OFT submission.
The BDA commissioned GfK NOP to survey consumers nationally about their
experience of using dental services. The topics consumers were asked about
included: dental health behaviour; barriers to access; and level of satisfaction with
the quality of the care they received (see Appendix for the list of questions asked).
Eight questions were included in a GfK NOP Omnibus consumer survey of 1000
adults aged 16+ years. The sample was selected to reflect the demographic profile
of all adults living in telephone-owning households in the UK. This was achieved by
setting quotas across a range of demographic variables including region, sex within
age and social grade. GfK NOP measured social grade by asking every respondent
for their actual job title and coding the job type by its allocated grade from A to E
(see Table 2.1 for more information about the grading system used).
Although the quotas ensured that the demographic profile of the sample was close to
the target population, post-survey weights were applied to the data so that it
corresponded with the demographic profile of the UK adult population.
Telephone interviews were conducted by fully trained and monitored market
research interviewers, using Computer Assisted Telephone Interviewing.
Respondents were selected using random digit dialling. This meant that a random
selection of phone numbers were chosen from a directory and then a „1‟ was added
to the last digit of the phone number. One in every ten interviews was supervised.
The fieldwork dates were 11th-13th November 2011.
The final sample included even numbers of men and women. Most consumers were
in the 25-44 and 45-64 age groups. Over 80 per cent were living in England.
Similarly the 2010 Office of National Statistics Population Estimates for UK showed
that 84 per cent of the UK population resided in England (ONS, 2010). By contrast,
under one-fifth of consumers were from Wales, Scotland and Northern Ireland
combined. There were more consumers in social grades A, B, and C1 than in social
grades C2, D, and E (53 per cent and 47 per cent respectively). Just over 40 per
cent of consumers worked full-time, with a further 12 per cent working part-time and
almost half not working at all. Over half of the sample were married or living as
married.

9
9
Table 2.1 Demographic characteristics of the sample
unweighted weighted
% N % N
Sex
Male 49.0 493 48.5 488
Female 51.0 513 51.5 518
Age group
16-24 11.3 114 12.7 128
25-44 29.9 301 33.0 332
45-64 33.6 338 32.4 326
65+ 25.1 253 21.9 220
Country
England 82.5 830 84.1 846
Wales 5.2 52 4.7 47
Scotland 9.0 91 8.4 84
Northern Ireland 3.3 33 2.8 28
Social Grade4
AB (Intermediate or Higher managerial/
professional/administrative) 22.6 227 22.0 221
C1 (Supervisory or clerical/junior
managerial/professional/administrative, student) 30.5 307 31.3 315
C2 (Skilled manual worker) 20.4 205 21.8 219
DE (Semi-skilled or unskilled manual work, casual
worker – not in permanent employment,
housewife/homemaker, retired and living on state
Pension, unemployed or not working due to long-
term sickness , full-time carer of other household
member)
26.5 267 24.9 251
Working status
Full time 40.7 409 43.9 441
Part time 11.8 119 13.9 140
Not working 47.5 478 42.2 425
Marital Status
Married/living as married 55.2 555 56.1 565
Single 21.8 219 22.4 225
Widowed/ Divorced/ Separated 23.1 232 21.5 216
Total 100.0 1006 100.0 1006
4 Social grade refers to a classification system that derives from the British National Readership
Survey, where all members of a household are classified based on the occupation of the Chief Income Earner (CIE). If the respondent is not the CIE but is working, then their individual social grade is also recorded. An overview of social grading can be found at: http://www.ipsos-mori.com/researchpublications/publications/1285/Social-Grade.aspx (Accessed: 18th June 2012)

10
10
3 Findings
This section gives an account of what was learned from the survey.
3.1 Patterns of attendance
The first questions in the survey related to consumers‟ dental health behaviour.
Consumers were asked how often they attend the dentist, excluding any visits to a
hygienist. Their responses are set out in Tables 3.1 and Figures 3.1 to 3.4.
Table 3.1 Frequency of visits to the dentist
Pattern of attendance Column percentages (weighted)
Frequent attender
At least once every six months 50.2
At least once every year 21.3
Infrequent attender
At least once every two years 4.7
Less frequently than every two years 3.6
Emergency attender
Only when having trouble with your teeth and/or
dentures 12.3
Non-attender
Never 6.9
Don't know
Don't know/can't remember 1.0
Total 100.0
Weighted base 1006
Unweighted base 1006
Base: all adults aged 16+
Note: excludes visits to hygienist
Table 3.1 shows that around half of all respondents said that they went to the dentist
at least once every six months with a further one-fifth attending at least once a year.
These patients were identified as frequent attenders. Of those identified as
infrequent attenders, five per cent visited the dentist at least once every two years
and four per cent reported visiting less frequently than every two years. Around 12
per cent were emergency attenders who reported only attending when they had
trouble with their teeth or dentures and seven per cent of consumers said that they
never visit the dentist at all. This reflects the findings of the 2011 Consumer Attitudes
towards Dentistry Survey (Denplan, 2011), where 47 per cent of consumers reported
going to the dentist at least once every six months.
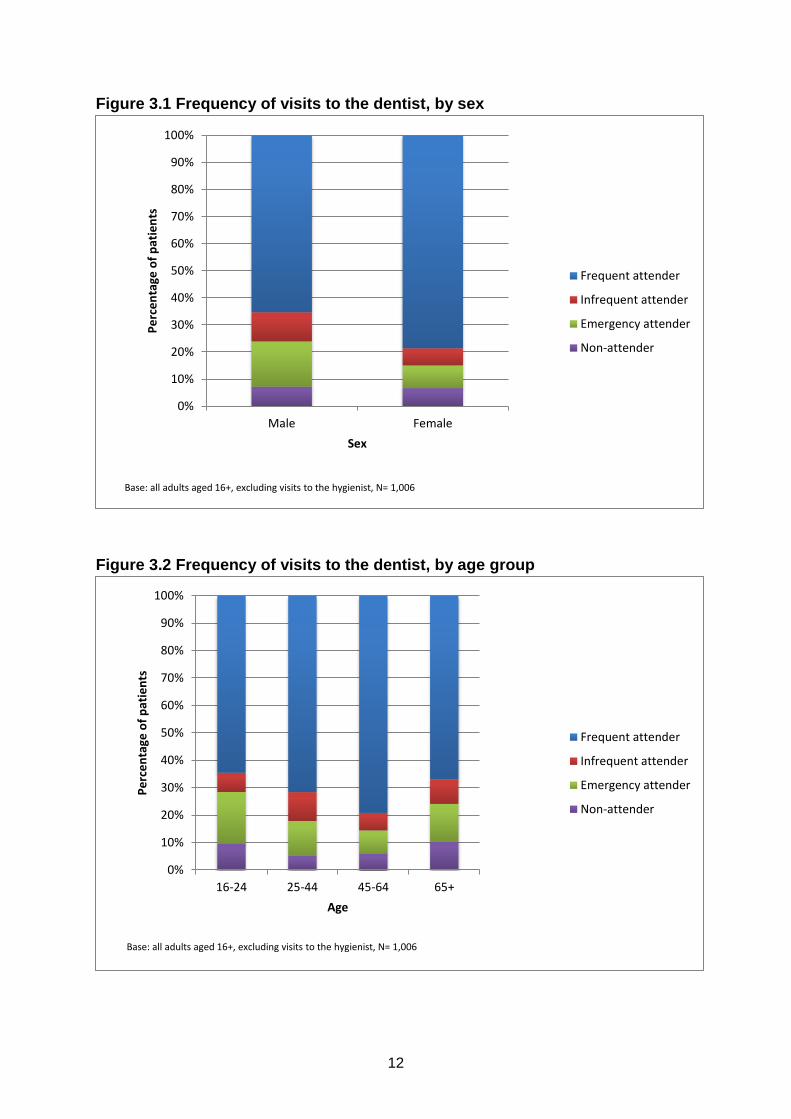
Figure 3.1 compares the attendance patterns of women and men. It shows that over
three-quarters of women were frequent attenders compared with two-thirds of men. It

11
11
also shows that men were twice as likely to say that they were emergency attenders
compared with women (16.6 per cent and 8.3 per cent respectively).
Figure 3.2 compares patterns of attendance among consumers by age group. It
shows that those aged between 25-64 years were most likely to report being
frequent attenders, compared with the youngest and oldest age groups. The latter
also reported the highest rates of non-attendance.
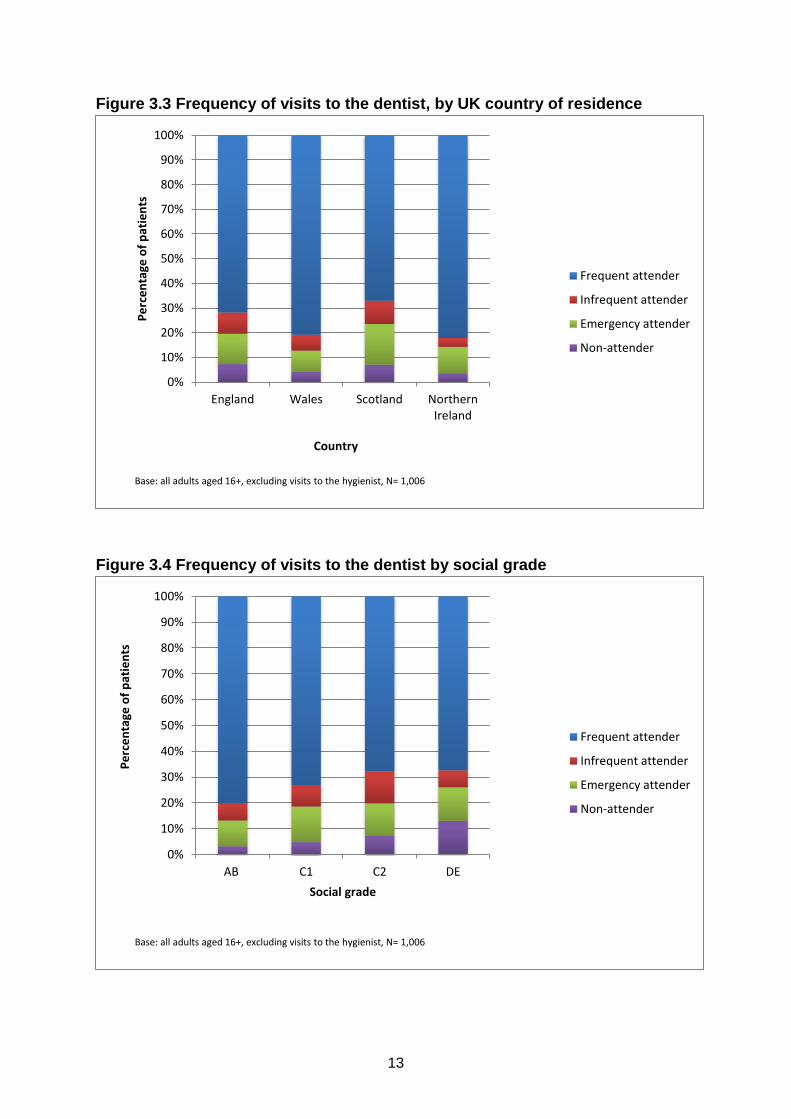
Figure 3.3 compares patients‟ patterns of attendance by country of residence. There
were more frequent attenders in Wales (80.9 per cent) and Northern Ireland (82.1
per cent) than in England (71.0 per cent) and Scotland (67.1 per cent) (Figure 3.3).
The differences were also mirrored in the proportion of non-attenders, with more
non-attenders in England and Scotland than in Wales and Northern Ireland. It should
be noted here that the numbers of respondents living in Wales and Northern Ireland
were small (N=52 and N=33 respectively) so a degree of caution should be
exercised in extrapolating from findings.
Figure 3.4 shows how the frequency of visits to the dentist varies by social grade.
There is a clear gradient visible with the likelihood of being a frequent attender
increasing with social grade; for example, around 80 per cent of consumers in social-
grade categories A and B were frequent attenders, compared with only two-thirds of
consumers in D and E categories.
12
12
Figure 3.1 Frequency of visits to the dentist, by sex
Figure 3.2 Frequency of visits to the dentist, by age group
0%
10%
20%
30%
40%
50%
60%
70%
80%
90%
100%
Male Female
Pe
rce
nta
ge o
f p
atie
nts
Sex
Frequent attender
Infrequent attender
Emergency attender
Non-attender
Base: all adults aged 16+, excluding visits to the hygienist, N= 1,006
0%
10%
20%
30%
40%
50%
60%
70%
80%
90%
100%
16-24 25-44 45-64 65+
Pe
rce
nta
ge o
f p
atie
nts
Age
Frequent attender
Infrequent attender
Emergency attender
Non-attender
Base: all adults aged 16+, excluding visits to the hygienist, N= 1,006
13
13
Figure 3.3 Frequency of visits to the dentist, by UK country of residence
Figure 3.4 Frequency of visits to the dentist by social grade
0%
10%
20%
30%
40%
50%
60%
70%
80%
90%
100%
England Wales Scotland NorthernIreland
Pe
rce
nta
ge o
f p
atie
nts
Country
Frequent attender
Infrequent attender
Emergency attender
Non-attender
Base: all adults aged 16+, excluding visits to the hygienist, N= 1,006
0%
10%
20%
30%
40%
50%
60%
70%
80%
90%
100%
AB C1 C2 DE
Pe
rce
nta
ge o
f p
atie
nts
Social grade
Frequent attender
Infrequent attender
Emergency attender
Non-attender
Base: all adults aged 16+, excluding visits to the hygienist, N= 1,006

14
14
Consumers were then asked when they last visited a dentist (Table 3.2). The
National Institute for Clinical Excellence (NICE) dental-recall guidelines indicate the
number of months at which patients should be recalled according to their age and
oral health5. The maximum time period is 24 months (NICE, 2004).
Table 3.2 Length of time since last visit to a dentist, by socio-demographic
characteristics
When last visited a dentist?
Row percentages (weighted)
Attended
in past
24
months
Attended
> 24
months
ago
Don’t
know/
can't
remem
ber Total
Weighted
Base
Unweighted
base
Sex Male 75.7 19.6 4.7 100.0 489 493
Female 81.9 15.3 2.9 100.0 518 513
Age
group 16-24 67.2 26.6 6.3 100.0 128 114
25-44 79.3 16.2 4.5 100.0 333 301
45-64 86.8 12.3 0.9 100.0 325 338
65+ 73.2 21.4 5.5 100.0 220 253
Country England 78.5 17.1 4.4 100.0 846 830
Wales 87.2 12.8 0.0 100.0 47 52
Scotland 74.1 24.7 1.2 100.0 85 91
Northern
Ireland 89.3 10.7 0.0 100.0 28 33
Social
grade6
AB 86.0 12.2 1.8 100.0 222 227
C1 81.9 14.3 3.8 100.0 315 307
C2 75.5 20.0 4.5 100.0 220 205
DE 71.6 24.0 4.4 100.0 250 267
All 78.9 17.4 3.7 100.0 1006 1006
Base: all adults aged 16+
Table 3.2 shows that almost 80 per cent, or four out of five, of consumers surveyed
had visited their dentist during the previous 24 months, the maximum recall period
recommended by the National Institute for Health and Clinical Excellence (NICE).
Women were slightly more likely than men to report that they had visited a dentist
recently. In addition, attendance within the NICE dental recall guidelines was highest
in Northern Ireland and Wales, where almost nine out of every ten consumers had
5 An overview of NICE dental recall guidelines can be found at:
http://www.nice.org.uk/nicemedia/pdf/cg019niceguideline.pdf [Accessed: 25th July 2012]
6 See Table 2.1 for a detailed breakdown of the social grades.

15
15
visited the dentist within the past 24 months, compared to around three-quarters of
consumers in England and Scotland.
Table 3.2 also shows that recent attendance varied by social grade; with 86 per cent
of consumers in A and B social-grade categories attending within the past 24
months, compared with only 71.6 per cent of those in D and E categories.
Throughout the rest of this report, a distinction is made between „consumers‟ (all
respondents) or „patients‟ (those who have visited the dentist in the past two years).
3.2 Reasons for not going to the dentist
Those consumers who said that they had not attended a dentist over the past two
years were asked about their reasons for not doing so. Table 3.3 shows the reasons
they gave, disaggregated by sex, age, and social grade. Key findings include:
Overall, two-thirds of consumers reported that they had not visited a dentist in the
past two years because they did not believe there was any need for them to go,
making it the most common reason for non-attendance. This reason was
particularly common among men and younger consumers;
The next two most common reasons for non-attendance were not being able to
afford to go (17.2 per cent) and a fear of going to the dentist (16.2 per cent);
Among those who had not attended in the past two years, women were more
likely than men to report that they had not been able to afford to visit a dentist
(29.9 per cent compared to 6.7 per cent);
The likelihood of citing affordability as a reason for non-attendance varied by
social grade, with 27.3 per cent of consumers in social-grade categories D and E
reporting affordability as a reason for non-attendance, compared with only nine
per cent of consumers in categories A and B;
Around one in six non-attenders reported feeling afraid to visit the dentist;
The likelihood of say that they were afraid of visiting the dentist was highest
among older age groups and those in D and E social-grade categories;
More than one out of every ten consumers who had not visited a dentist in the
past two years said that this had been because they had not been able to find an
NHS dentist;
One quarter of consumers in the 45-64 age group reported that they could not
find an NHS dentist; far higher than those in other age groups;
Finally, around six per cent of consumers said that they had not attended
because their dentist had changed to private.
3.3 Type of care received
The next set of questions related to patients‟ last visit to a dentist, excluding any
visits to a hygienist. Patients who had attended a dentist in the past two years were
asked whether they had received private, NHS, or mixed care (Table 3.4).

16
Table 3.3 Reasons for not visiting a dentist in past two years, by sex, age, and social grade
Reasons for not visiting a dentist
Percentage of cases (multiple responses included)
Sex Age group Social grade All
Male Female 16-24 25-44 45-64 65+ AB C1 C2 DE
There was no need for me to go to the dentist 77.0 48.3 79.8 62.7 59.5 58.1 66.9 73.5 65.9 54.3 64.0
I haven't been able to afford to go 6.7 29.9 10.2 16.1 31.2 11.5 9.0 13.1 12.6 27.3 17.2
I am afraid of going to the dentist 13.3 19.6 3.8 14.2 23.7 20.8 10.1 13.1 11.6 24.5 16.2
I keep forgetting / haven't got round to it 10.4 17.4 16.8 17.8 6.5 12.3 14.0 9.8 12.8 16.7 13.5
I couldn't find an NHS dentist 9.6 13.4 3.9 7.7 25.0 9.2 20.4 8.6 4.2 14.5 11.3
I've had a bad experience with a dentist in the past 9.6 13.1 1.5 15.7 15.0 9.7 0.0 10.7 12.9 15.3 11.2
I haven't had the time to go 10.2 8.9 14.9 12.4 9.0 3.1 20.5 1.9 11.6 9.1 9.6
I have only needed to visit the hygienist 10.1 7.8 8.1 11.2 5.8 10.3 2.4 10.0 16.4 6.1 9.1
My dentist changed to private 4.2 7.8 1.5 10.0 2.6 6.9 4.2 6.6 10.1 2.8 5.8
It's difficult to get to / from the dentist 4.6 3.0 1.5 5.6 1.5 5.8 5.0 2.1 3.8 4.8 3.9
Other 4.8 12.8 10.8 1.3 8.0 15.2 0.0 2.5 6.2 18.2 8.4
None of these reasons 0.6 6.0 0.0 2.7 0.0 8.3 0.0 2.7 6.6 2.1 3.1
Base N (weighted) 96 79 34 54 40 47 27 45 44 60 175
Base N (unweighted) 103 82 31 54 42 58 25 47 42 71 185
Base: all adults aged 16+ that have not visited a dentist during the past two years. Note that 35 cases that responded „don‟t know/can‟t remember‟ when asked they last visited
the dentist were excluded.
*Note that consumers were able to give more than one response to this question so the percentages in the table do not add up to 100 per cent.
16

17
Table 3.4 Type of care received at last visit, by socio-demographic characteristics
Row percentages (weighted)
NHS
dental care
Private
dental care
Mixed
private and
NHS
Another
type of care7
Don't
know/can’t
remember Total
Weighted
Base
Unweighted
base
Sex Male 52.7 38.1 7.8 * 1.1 100.0 370 368
Female 64.9 27.1 5.0 1.4 1.7 100.0 424 418
Age group 16-24 67.8 27.6 2.3 0.0 2.3 100.0 87 76
25-44 63.3 28.4 5.3 1.5 1.5 100.0 264 237
45-64 55.0 35.8 7.4 0.7 1.1 100.0 282 292
65+ 54.7 34.8 8.1 1.2 1.2 100.0 161 181
Country England 59.3 31.9 6.8 0.9 1.1 100.0 664 648
Wales 61.0 29.3 9.8 0.0 0.0 100.0 41 43
Scotland 64.1 31.3 0.0 1.6 3.1 100.0 64 66
Northern Ireland 34.6 46.2 3.8 3.8 11.5 100.0 26 29
Social grade8 AB 43.7 45.8 8.4 0.5 1.6 100.0 190 198
C1 59.5 30.5 6.2 1.9 1.9 100.0 259 250
C2 63.3 28.9 6.0 0.0 1.8 100.0 166 154
DE 71.1 22.8 4.4 1.1 0.6 100.0 180 184
All 59.1 32.2 6.3 1.0 1.4 100.0 795 786
Base: all adults aged 16+ who attended a dentist in the past two years
*less than 0.5 per cent
7 „Another type of care‟ could mean hospital care (i.e. wisdom teeth removal) or perhaps care in the CDS.
8 See Table 2.1 for a detailed breakdown of the social grades.
17
18
18
Table 3.4 shows that around six out of every ten patients who had visited a dentist in
the past two years said that they had received only NHS care at their last visit,
compared with one-third who received private care only. Only 6.3 per cent said they
received a mix of NHS and private care.
Table 3.4 shows that over two-thirds of women received NHS dental care at their last
visit compared with just over half of men; men were correspondingly more likely than
women to have had private treatment at last visit.
Younger people were more likely than those in older age groups to say they had
received NHS dental care at last visit; for example, almost seven in every ten of 16-
24 year olds said that they had received NHS care, compared with just over half of
those in the 45-64 and 65+ age groups. Correspondingly, patients in the 45-64 and
65+ age groups were more likely than younger patients to report receiving private
care at their last visit to the dentist (Table 3.4).
A larger proportion of patients in Northern Ireland received private dental care at
their last visit (around 46 per cent) compared to England, Wales and Scotland
(approximately 30 per cent). It should be noted here that the number of patients
included in the survey from Northern Ireland was small (N=29) so caution should be
exercised in extrapolating from these figures.
Finally, Table 3.4 also shows that the type of dental care received at last visit varied
by social grade; for example, 45.8 per cent of patients in the AB social-grade
categories reported receiving private care at their last visit. By comparison, only 22.8
per cent of patients in DE categories reported receiving private care.
3.4 Patients’ reasons for choosing type of care at last visit to a dentist
Patients were then asked the reasons for choosing the type of care they received on
their last visit. Tables 3.5 to 3.7 display these reasons, by type of dental care
received. Note that patients were free to identify more than one reason for choosing
a particular type of care.
19
19
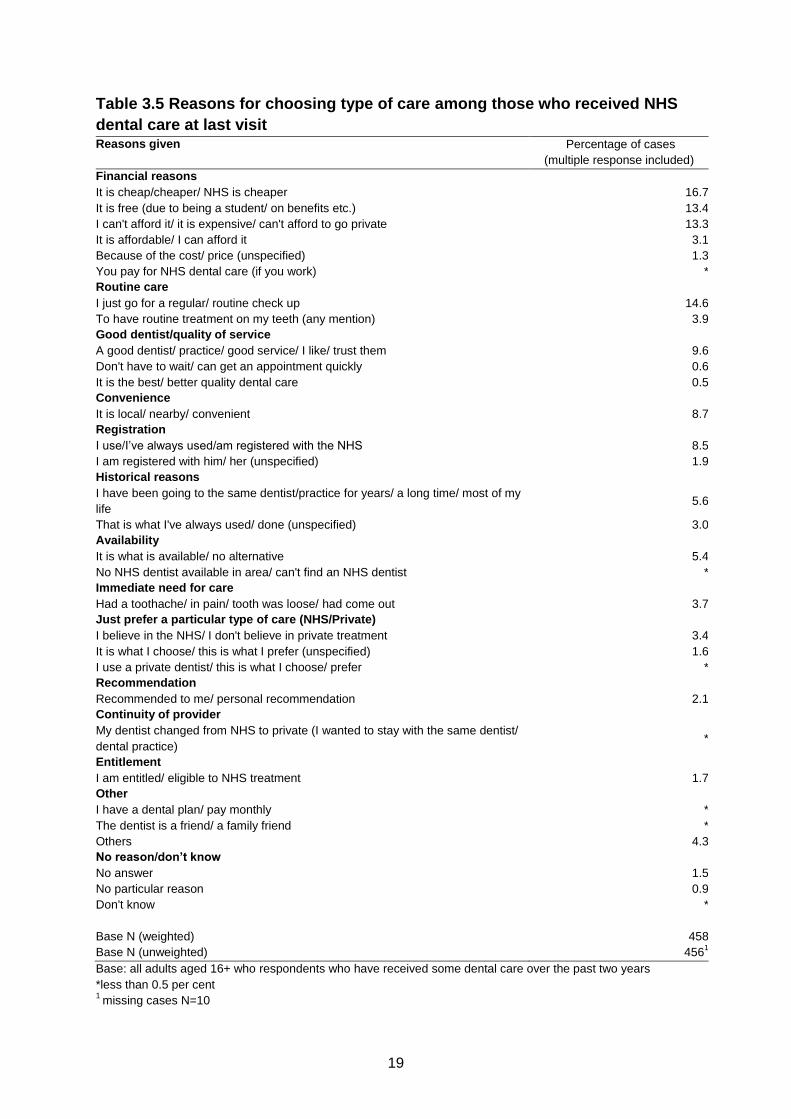
Table 3.5 Reasons for choosing type of care among those who received NHS
dental care at last visit Reasons given Percentage of cases
(multiple response included)
Financial reasons
It is cheap/cheaper/ NHS is cheaper 16.7
It is free (due to being a student/ on benefits etc.) 13.4
I can't afford it/ it is expensive/ can't afford to go private 13.3
It is affordable/ I can afford it 3.1
Because of the cost/ price (unspecified) 1.3
You pay for NHS dental care (if you work) *
Routine care
I just go for a regular/ routine check up 14.6
To have routine treatment on my teeth (any mention) 3.9
Good dentist/quality of service
A good dentist/ practice/ good service/ I like/ trust them 9.6
Don't have to wait/ can get an appointment quickly 0.6
It is the best/ better quality dental care 0.5
Convenience
It is local/ nearby/ convenient 8.7
Registration
I use/I‟ve always used/am registered with the NHS 8.5
I am registered with him/ her (unspecified) 1.9
Historical reasons
I have been going to the same dentist/practice for years/ a long time/ most of my
life 5.6
That is what I've always used/ done (unspecified) 3.0
Availability
It is what is available/ no alternative 5.4
No NHS dentist available in area/ can't find an NHS dentist *
Immediate need for care
Had a toothache/ in pain/ tooth was loose/ had come out 3.7
Just prefer a particular type of care (NHS/Private)
I believe in the NHS/ I don't believe in private treatment 3.4
It is what I choose/ this is what I prefer (unspecified) 1.6
I use a private dentist/ this is what I choose/ prefer *
Recommendation
Recommended to me/ personal recommendation 2.1
Continuity of provider
My dentist changed from NHS to private (I wanted to stay with the same dentist/
dental practice) *
Entitlement
I am entitled/ eligible to NHS treatment 1.7
Other
I have a dental plan/ pay monthly *
The dentist is a friend/ a family friend *
Others 4.3
No reason/don’t know
No answer 1.5
No particular reason 0.9
Don't know *
Base N (weighted) 458
Base N (unweighted) 4561
Base: all adults aged 16+ who respondents who have received some dental care over the past two years
*less than 0.5 per cent 1
missing cases N=10

20
20
Table 3.6 Reasons for choosing type of care among those who received
private dental care at last visit Reasons given Percentage of cases
(multiple response included)
Continuity of provider
My dentist changed from NHS to private (I wanted to stay with the same dentist/
dental practice) 15.5
Availability
No NHS dentist available in area/ can't find an NHS dentist 14.3
It is what is available/ no alternative 5.1
Good dentist/quality of service
A good dentist/ practice/ good service/ I like/ trust them 12.7
It is the best/ better quality dental care (better than NHS) 6.3
Don't have to wait/ can get an appointment quickly 5.1
Just prefer a particular type of care (NHS/Private)
I use a private dentist/ this is what I choose/ prefer 11.2
It is what I choose/ this is what I prefer (unspecified) 2.1
Routine care
I just go for a regular/ routine check up 7.7
To have routine treatment on my teeth (any mention) 3.2
Historical reasons
I have been going to the same dentist/practice for years/ a long time/most of my
life 7.2
That is what I've always used/ done (unspecified) 1.2
Financial reasons
It is cheap/cheaper/ NHS is cheaper 1.6
I can't afford it/ it is expensive/ can't afford to go private 0.5
It is free (due to being a student/ on benefits etc.) 0.9
It is affordable/ I can afford it 3.4
You pay for NHS dental care (if you work) 2.7
Immediate need for care
Had a toothache/ in pain/ tooth was loose/ had come out 5.5
Convenience
It is local/ nearby/ convenient 3.9
Recommendation
Recommended to me/ personal recommendation 2.9
Registration
I use/I‟ve always used/am registered with the NHS *
I am registered with him/ her (unspecified) *
Entitlement
I am not entitled to NHS dental care 1.3
Other
I have a dental plan/ pay monthly 5.1
The dentist is a friend/ a family friend 1.7
Others 6.9
No reason/don’t know
No particular reason 0.5
Don't know *
No answer 1.2
Base N (weighted) 251
Base N (unweighted) 2511
Base: all adults aged 16+ who respondents who have received some dental care over the past two years
*less than 0.5 per cent 1
missing cases N=5

21
21
Table 3.7 Reasons for choosing type of care among those who received mixed
private and NHS dental care at last visit Reasons given Percentage of cases
(multiple response included)
Routine care
I just go for a regular/ routine check up 15.8
To have routine treatment on my teeth (any mention) 12.9
Good dentist/quality of service
A good dentist/ practice/ good service/ I like/ trust them 10.3
It is the best/ better quality dental care 3.3
Don't have to wait/ can get an appointment quickly 3.1
Immediate need for care
Had a toothache/ in pain/ tooth was loose/ had come out 9.9
Financial reasons
Because of the cost/ price (unspecified) 8.2
It is cheap/cheaper/ NHS is cheaper 5.6
It is affordable/ I can afford it 4.1
You pay for NHS dental care (if you work) 2.0
It is free (due to being a student/ on benefits etc.) 2.0
Convenience
It is local/ nearby/ convenient 7.0
Historical reasons
I have been going to the same dentist/practice for years/ a long time/ most of
my life 5.0
That is what I've always used/ done (unspecified) 1.8
Availability
It is what is available/ no alternative 4.8
No NHS dentist available in area/ can't find an NHS dentist 3.3
Registration
I am registered with him/ her (unspecified) 2.8
Just prefer a particular type of care (NHS/Private)
I use a private dentist/ this is what I choose/ prefer 2.0
Continuity of provider
My dentist changed from NHS to private (I wanted to stay with the same dentist/
dental practice) 1.7
Other
I have a dental plan/ pay monthly 4.8
Others 11.2
No reason/don’t know
No particular reason 3.8
Base N (weighted) 49
Base N (unweighted) 44
Base: all adults aged 16+ who respondents who have received some dental care over the past two years
*less than 0.5 per cent 1
missing cases N=1
Table 3.5 shows that the main driver of patient choice of treatment was cost; the
main set of reasons given for choosing NHS care were financial; for example, 16.7
per cent chose it because it was cheaper; 13.4 per cent chose NHS care because it
was free; and 13.3 per cent could not afford private care.
Other commonly cited reasons included: a desire to continue with routine care (14.6
per cent); the quality of the service they receive and trust or confidence in their
dentist (9.6 per cent); or convenience (8.7 per cent).

22
22
Among those who had received private care at last visit, the most common reason
given (15.5 per cent) for receiving this type of care was that their dentist had
changed from NHS to private, and they had wanted to stay with the same dentist
(Table 3.6); this suggests the high value placed on continuity of care among some
patients.
Moreover, 14.3 per cent said that they had received private care because there had
been no NHS dentists available in the area where they live or they had been unable
to find an NHS dentist. In addition, one in twenty of those who received private care
at last visit said they had no alternative or that private care was all that was available
to them.
Another common reason given by patients for choosing private over NHS care was
trust or confidence in their dentist as well as the good quality of service (12.7 per
cent).
Finally, some private patients (11.2 per cent) expressed a general preference for
private over NHS dental care, and 6.3 per cent expressed a belief in the better
quality of private care (Table 3.6).
Among those patients who received a mix of private and NHS dental care at their
last visit (Table 3.7), the most common reasons for doing so were that they had
attended for a routine check-up (15.8 per cent) or routine treatment (12.9 per cent).
As with private and NHS patients, liking or trusting the dentist or practice was
another common reason given for receiving this type of care (10.3 per cent).
3.5 Patients’ evaluations of the care they received at last visit to a dentist
Patients who had visited a dental practice within the past two years were asked to
rate how well the information on fees and charges had been explained by the
practice prior to the treatment taking place at their last visit (Figure 3.5).
Over three-quarters of patients who had visited a dentist in the past two years
thought that their treatment had been „good‟ or „very good‟ value for money at their
last visit, with only four per cent reporting that value for money had been „poor‟ or
„very poor‟ (Figure 3.5).
As Figure 3.5 shows, both NHS and private care were generally perceived to be
„good‟ or „very good‟ value for money. But there was a tendency for both types of
care to be better rated by patients at explaining treatment fees and charges than
mixed care. However, there were only 42 respondents who received a mixture of
NHS and private care and who also responded to this question, so these results
need to be interpreted with a degree of caution.

23
23
Patients who had visited a dentist in the past two years were also asked to rate the
care or treatment they received for value for money (Figure 3.6).
Figure 3.6 shows that over three-quarters of patients who had visited a dentist in the
past two years thought that their treatment had been „good‟ or „very good‟ value for
money at their last visit, with only four per cent reporting that value for money had
been „poor‟ or „very poor‟.
Both NHS and private care were perceived to be „good‟ or „very good‟ value for
money with around 80 per cent of patients expressing this view. By comparison, only
62 per cent of those receiving a mix of private and NHS care at last visit perceived
that they had experienced „good‟ or „very good‟ value for money. Moreover, around
15 per cent of these patients perceived that the care they had received had been
„poor‟ or „very poor‟ value for money. Again, it should be noted here that the number
of patients who received mixed care at their last visit was relatively small (N=42) so a
degree of caution should be exercised in extrapolating from these findings.
Nonetheless, the finding that many of those who received mixed dental treatment felt
that they had not received good value for money indicates the need for further
research in this area focusing specifically on the experiences of those receiving
mixed care.

24
24
Figure 3.5 Patients’ ratings of how well fees and charges were explained by
their dental practice prior to treatment at last visit to a dentist
Figure 3.6 Value-for-money rating of care or treatment received at last visit
(excluding visit to hygienist)

25
25
Patients were asked whether the cost of treatment affected their choice of treatment
at their last visit (Table 3.8).
Table 3.8 Did cost affect the type of treatment chosen at last visit, by type of
care, age group, and social grade?
How cost affected choice of treatment at last visit
Row percentages (weighted)
Yes No
Don’t
know Total
Base
weighted
Base
unweighted
Type of care received at
last visit
NHS care 20.1 78.4 1.5 100.0 389 388
Private care 21.4 76.6 2.0 100.0 248 248
Mixed care 50.0 47.9 2.1 100.0 48 42
Other type of care9 0.0 75.0 25.0 100.0 4 4
Don't know 36.4 54.5 9.1 100.0 11 11
Social Grade10
AB 18.4 81.0 0.6 100.0 179 186
C1 19.4 79.7 0.9 100.0 227 221
C2 26.8 71.1 2.0 100.0 149 138
DE 29.4 65.0 5.6 100.0 143 148
Age group
16-24 30.6 69.4 0.0 100.0 62 55
25-44 20.8 78.3 0.9 100.0 226 206
45-64 25.5 73.0 1.5 100.0 263 269
65+ 17.7 76.9 5.4 100.0 147 163
All 22.8 75.2 2.0 100.0 698 693
Base: all adults aged 16+ who have visited a dentist during the past two years
*less than 0.5 per cent
Table 3.8 shows that more almost one quarter of patients said that their choice of
treatment was affected by cost. However, there was some variation by the type of
care received; for example, half of those who received mixed dental care at their last
visit reported that their choice of treatment was affected by cost. By comparison, one
fifth of those who received NHS or private dental care said that their choice of
treatment was affected by cost.
A clear social gradient in how likely cost of treatment affected patient choice is visible
in Table 3.8; for example, more patients in social-grade categories D and E said that
9 Please refer to footnote 6
10 See Table 2.1 for a detailed breakdown of the social grades.

26
26
their choice of treatment had been affected by cost compared with those in A and B
categories.
Finally, older patients (aged 65 or more) were least likely to say that their choice of
treatment had been affected by cost compared with those in younger age groups.
Conversely, younger patients (aged 16-24) were most likely to say that cost had
influenced their treatment choice.
All patients who had visited a dentist in the past two years were then asked whether
they felt involved in treatment decisions (Table 3.9).
Table 3.9 Feeling of being involved in treatment decisions at last visit, by type
of care, age group, and social grade
Felt involved in treatment decision?
Row percentages (weighted)
Yes No
Don’t
know Total
Base
weighted
Base
unweighted
Type of care received
at last visit
NHS care 71.4 27.7 0.9 100.0 469 466
Private care 80.1 19.9 0.0 100.0 256 256
Mixed care 68.0 32.0 0.0 100.0 50 45
Other type of care11
87.5 12.5 0.0 100.0 8 8
Don't know 54.5 36.4 9.1 100.0 11 11
Social grade12
AB 82.7 17.3 0.0 100.0 191 198
C1 78.3 20.9 0.8 100.0 258 250
C2 68.7 30.7 0.6 100.0 166 154
DE 63.7 35.8 0.6 100.0 179 184
Age group
16-24 71.3 26.4 2.3 100.0 87 76
25-44 76.1 23.9 0.0 100.0 264 237
45-64 74.8 24.5 0.7 100.0 282 292
65+ 70.8 28.6 0.6 100.0 161 181
All 74.0 25.4 0.6 100.0 794 786
Note: Excludes visits to the hygienist
Base: all adults aged 16+ that have visited a dentist during the past two years
*less than 0.5 per cent
Table 3.9 shows that three-quarters of patients said they had been involved in
decisions about their treatment. Involvement in treatment decisions varies by social
11
Please refer to footnote 6 12
See Table 2.1 for a detailed breakdown of the social grades.

27
27
grade; for example, 82.7 per cent of patients in social-grade categories A and B
reported that they felt involved in decisions, compared with 63.7 per cent of patients
in categories D and E.
Eight out of every ten private patients felt involved in decisions at their last visit,
compared with approximately seven out of every ten NHS and mixed dental care
patients.
Patients who had visited a dental practice within the past two years were asked
whether the dentist had explained their treatment in a way they could understand at
their last visit to a dentist (Table 3.10).
Table 3.10 Reasons for dental care explained by dentist at last visit in a way
that could be understood, by age group, type of care, and social grade
Were reasons given for treatment given in way that could be
understood?
Row percentages (weighted)
Yes No
Don’t
know Total
Base
weighted
Base
unweighted
Type of care received
at last visit
NHS care 94.7 4.5 0.9 100.0 469 466
Private care 95.7 4.3 0.0 100.0 256 256
Mixed care 94.0 6.0 0.0 100.0 50 45
Other type of care13
100.0 0.0 0.0 100.0 8 8
Don't know 81.8 18.2 0.0 100.0 11 11
Social grade14
AB 96.8 3.2 0.0 100.0 190 198
C1 94.6 4.6 0.8 100.0 259 250
C2 95.2 4.2 0.6 100.0 165 154
DE 93.3 6.1 0.6 100.0 179 184
Age group
16-24 95.3 4.7 0.0 100.0 86 76
25-44 94.7 4.5 0.8 100.0 264 237
45-64 95.4 4.2 0.4 100.0 283 292
65+ 93.8 5.6 0.6 100.0 161 181
All 94.9 4.6 0.5 100.0 794 786
Ninety-five per cent of patients felt that their dentist had explained the reasons for
their treatment in a way they could understand (Table 3.10). This compares with the
2010 Which? survey of private dental services in England that found that 91 per cent
13
Please refer to footnote 6 14
See Table 2.1 for a detailed breakdown of the social grades.

28
28
agreed slightly or strongly that „my dentist explained why he was
recommending/carrying out this treatment‟; and 86 per cent that „overall I felt
confident this was the best treatment for me‟ (Which?, 2011).15 There was little
variation in how well treatment decisions were explained by type of care, social
grade or age group.
Patients who had seen a dentist in the past two years were asked to rate how
satisfied or dissatisfied they had been with the care they had received – they were
asked to rate their level of satisfaction with their care on a scale between one and
ten (where „one‟ is extremely dissatisfied and „ten‟ is extremely satisfied). Patients
were able to use any number in between (Table 3.11).
Table 3.11 Level of satisfaction with last visit, by type of care received
Treatment satisfaction rating
Row percentages (weighted)
1-4 5-7 8-10
Don’t
know Total
Mean
satisfaction
score
Weighted
base
Unweighted
base
Type of care
received at last
visit
NHS care 2.1 17.9 79.5 * 100.0 8.5 469 466
Private care 2.0 12.2 85.9 0.0 100.0 8.7 255 256
Mixed care 2.0 36.0 62.0 0.0 100.0 7.9 50 45
Other type of
care16
0.0 37.5 62.5 0.0 100.0 8.9 8 8
Don't know 0.0 54.5 45.5 0.0 100.0 7.2 11 11
All 2.0 17.9 79.9 * 100.0 8.5 793 786
Base: all adults aged 16+ that have visited a dentist during the past two years
*less than 0.5 per cent
Patients who had seen a dentist in the past two years reported an average
satisfaction score of eight and a half out of ten at their last visit (Table 3.11).
Similarly, Denplan‟s Consumer Attitudes towards Dentistry Survey (2011) showed
that satisfaction was high across all types of dental care with 88 per cent of regular
patients reporting satisfaction with their last visit. In a recent General Dental Council
patient and public survey, 95 per cent of patients were satisfied with their treatment
and 94 per cent were confident in the dental treatment they received (GDC, 2011).
15
These figures come from an online panel survey of 1,821 people conducted by Which? in 2010. The research assessed how far the private healthcare market has improved for consumers since the Office of Fair Trading made its recommendations in 2003. A summary of the findings can be found at: http://www.which.co.uk/documents/pdf/oft-private-heathcare-market-study-which-comments-255807.pdf 16
Please refer to footnote 6

29
29
There was a slight difference in levels of satisfaction between NHS and private
patients. However, recipients of mixed dental care were more likely to report a lower
satisfaction score compared with those who had received exclusively NHS or private
treatment (Table 3.11). As was mentioned previously, the number of patients
reporting receiving mixed care at last visit was relatively small (N=45) so a degree of
caution should be exercised in extrapolating from these findings.
In a way this is what might be expected: greater satisfaction for higher fees and
greater ability of those who choose to pay to obtain the quality of care to which they
aspire. NHS dentists are working under activity targets of one kind or another and
this impacts on some elements of quality of care, such as time spent with the patient.
3.6 Awareness of complaints procedure
Patients were asked whether they were aware of the practice‟s complaints procedure
(the practice at which they had their last visit) (Table 3.12).
Table 3.12 Awareness of practice’s complaints procedure, by age group, type
of care, and social grade
Aware of complaints procedure?
Row percentages (weighted)
Yes No
Don’t
know Total
Base
weighted
Base
unweighted
Type of care received
at last visit
NHS care 61.4 38.4 0.2 100.0 469 466
Private care 60.0 38.8 1.2 100.0 255 256
Mixed care 60.0 40.0 0.0 100.0 50 45
Other type of care17
62.5 37.5 0.0 100.0 8 8
Don't know 50.0 50.0 0.0 100.0 12 11
Social grade18
AB 59.2 40.8 0.0 100.0 191 198
C1 58.1 41.1 0.8 100.0 258 250
C2 61.4 38.6 0.0 100.0 166 154
DE 65.4 33.5 1.1 100.0 179 184
Age group
16-24 76.7 23.3 0.0 100.0 86 76
25-44 59.1 40.5 0.4 100.0 264 237
45-64 56.0 44.0 0.0 100.0 282 292
65+ 62.7 35.4 1.9 100.0 161 181
All 60.7 38.8 0.5 100.0 794 786
Base: all adults aged 16+ that have visited a dentist during the past two years
17
Please refer to footnote 6 18
See Table 2.1 for a detailed breakdown of the social grades.

30
30
Well over half of patients indicated that they had been aware of the practice‟s
complaints procedure at their last visit to a dentist. Patients who received NHS and
private care were equally likely to say they were aware of their practice‟s complaints
procedure (Table 3.12). There was some variation by social grade, with 59.2 per
cent of those in categories A or B saying that they were aware of their practice‟s
complaints procedure compared with 65.4 per cent of those in categories D or E.
Only one per cent (N=8) of patients had made a complaint about their dental practice
in the past two years. These respondents were asked for more information about the
complaints they made. Their responses included:
“Lack of care”
“Do not spread dental care over a period of time”
“Didn't like the dentist or his manner or his charges so changed”
“Had to wait too long for appointment”
“Student dentist worked on braces and due to the work she had done a
part of it broke and they didn't let him fix it for 6 weeks”
“It was about the dentures. I wanted to get top as well as bottom teeth but
he only gave me the top one and they wouldn't fit and fall off. Also
because my daughter had complained about him before he was nasty”
“Orthodontist. The way I was treated”
As the excerpts show, the subject of these complaints mostly related to the quality of
treatment or care received. In addition, one patient complained about charges and
another about waiting times.

31
31
Bibliography
British Dental Association (2012) Submission to the Office of Fair Trading
Inquiry into the UK dentistry market [online], http://www.bda.org/dentists/policy-
campaigns/research/oft/OFT.aspx (Accessed 18 July 2012)
Denplan (2011) Consumer Attitudes towards Dentistry Survey [online], http://www.denplan.co.uk/~/media/Files/pdfs/news/article/consumer-survey-2011.ashx (Accessed 9 July 2012)
General Dental Council (2011) THE ANNUAL PATIENT AND PUBLIC SURVEY [online], http://www.gdc-uk.org/Aboutus/Researchandconsultations/Documents/GDC20Patient20Public20Report20May11.pdf (Accessed 28 June 2012)
Ipsos MediaCT (2009) Social Grade, A Classification Tool [online], http://www.ipsos-mori.com/researchpublications/publications/1285/Social-Grade.aspx (Accessed 18 June 2012)
NHS Information Centre (2011) Service considerations – a report from the Adult
Dental Health Survey 2009 [online],
http://www.ic.nhs.uk/webfiles/publications/007_Primary_Care/Dentistry/dentalsurvey
09/AdultDentalHealthSurvey_2009_Theme6_Serviceconsiderations.pdf (Accessed
18 June 2012)
National Institute for Health and Clinical Excellence (2004) Dental recall: Recall
interval between routine dental examinations [online],
http://www.nice.org.uk/nicemedia/pdf/cg019niceguideline.pdf (Accessed 25.07.12)
Office of Fair Trading (2011) Dentistry Market Study: Statement of Scope/Q&A
[online], http://www.oft.gov.uk/shared_oft/market-studies/Dentistry/QandAs.pdf
(Accessed 10 July 2012)
Office of Fair Trading (2010) Market Studies: Guidance on the OFT approach [online], http://www.oft.gov.uk/shared_oft/business_leaflets/enterprise_act/oft519.pdf (Accessed 14 May 2012)
Office of National Statistics (2010) Annual Mid-year Population Estimates, 2010
[online], http://www.ons.gov.uk/ons/rel/pop-estimate/population-estimates-for-uk--
england-and-wales--scotland-and-northern-ireland/mid-2010-population-
estimates/annual-mid-year-population-estimates--2010.pdf (Accessed 20 June 2012)
Which? (2011) OFT Private Healthcare Market Study [online],
http://www.which.co.uk/documents/pdf/oft-private-heathcare-market-study-which-
comments-255807.pdf (Accessed 11 July 2012)

32
32
Appendix Omnibus Questions
1. How often do you go to the dentist? Please do not count visits to the
hygienist in your response. Would you say…
[select one category only]
At least once every six months
At least once every year
At least once every two years
Less frequently than every two years
Only when having trouble with your teeth and/or dentures
Never
Don‟t know/can‟t remember
Again, for the rest of the questionnaire please do not count visits to the hygienist.
2. How long ago is it since you last visited a dentist? Was it
[select one category only]
Within the last 6 months [Skip to Q4]
Within the last 7-12 months [Skip to Q4]
More than 1, but less than 2 years ago [Skip to Q4]
More than 2, but less than 5 years ago [Go to Q3 then close]
More than 5, years ago [Go to Q3 then close]
Don‟t know/ can‟t remember [Go to Q3 then close]
3. Which of these, if any, are the reasons why you have not visited a dentist
during the last two years?
[select as many as apply]
There was no need for me to go to the dentist
I couldn‟t find an NHS dentist
My dentist changed to private
I haven‟t been able to afford to go
I haven‟t had the time to go
I am afraid of going to the dentist
I keep forgetting / haven‟t got round to it
It‟s difficult to get to / from the dentist
I‟ve had a bad experience with a dentist in the past
I have only needed to visit the hygienist
OTHER (PLEASE SPECIFY)

33
33
None of these reasons
[Skip to End for all responses to Q3]
The next set of questions relate to your last visit to the dentist, again excluding any
visits to the hygienist.
4. Thinking about the last time you visited your local dentist, what type of care
did you receive? Was it…
[select one category only]
NHS dental care
Private dental care
A mix of private care and NHS dental care (for example, NHS dental care followed
by additional private dental care)
Another type of care
Don‟t know/can‟t remember [Skip to Q6]
5. What were your reasons for using that form of care?
INTERVIEWER: PROBE FULLY.
[Open text response]
6. How would you rate your dental practice in their explanation of fees and
charges prior to the treatment taking place? Would you say they were….
[select one category only]
Very Good
Good
Fair
Poor
Very poor
Or did you not pay for your dental treatment [Skip to Q9]
Don‟t know/can‟t remember
7. How would you rate the care or treatment you received for value for money?
Would you say it was….
[select one category only]
Very Good
Good
Fair
Poor

34
34
Very Poor
Don‟t know/can‟t remember
8. Did the cost affect the type of treatment you chose?
[select one category only]
Yes
No
Don‟t know/can‟t remember
9. Did you feel involved in any decisions about your dental care or treatment
you received?
[select one category only]
Yes
No
Don‟t know
10. Did the dentist explain the reasons for any dental care or treatment in a
way that you could understand?
[select one category only]
Yes
No
Don‟t know
11. Are you aware of your practice’s complaints procedure?
[select one category only]
Yes
No
Don‟t know
12. Have you made a complaint about your dentist or dental practice in the last
2 years?
[select one category only]
Yes
No [Skip to 14]

35
35
Don‟t know [Skip to 14]
13. What was your reason(s) for the complaint?
INTERVIEWER: PROBE FULLY.
[Open text]
14. Still thinking about your last visit to the dentist, how satisfied were you
with the care you received?
Please use a scale from 1 to 10, where “1” is extremely dissatisfied, “10” is extremely
satisfied and you can use any number in between.
[1-10]
Don‟t know
End

36
36
British Dental Association
64 Wimpole Street
London W1G 8YS
020 75634563
www.bda.org