public-private employment choice, wage … · public-private employment choice, wage differentials...
TRANSCRIPT
ECONOMIC GROWTH CENTER
YALE UNIVERSITY
P.O. Box 20826927 Hillhouse Avenue
New Haven, Connecticut 06520-8269
CENTER DISCUSSION PAPER NO. 797
PUBLIC-PRIVATE EMPLOYMENT CHOICE, WAGE DIFFERENTIALSAND GENDER IN TURKEY
Aysit Tansel
Yale University and Middle East Technical University
February 1999
Note: Center Discussion Papers are preliminary materials circulated to stimulate discussions andcritical comments.
Public-Private Employment Choice, Wage Differentials
and Gender in Turkey∗
by
Aysit Tansel
Middle East Technical University
06531 Ankara, Turkey
Telephone: 90-312-210 20 57
Fax : 90-312-210 12 44
e-mail : atansel @rorqual.cc.metu.edu.tr
April 1998
Revised: February 1999
Key Words: Public-Private Wages; gender; Turkey
JEL Codes: J31, J45, J16
Abstract:
There is no evidence on the extent of public versus private wage differentials in Turkey.The main objective of this paper is to examine the factors which explain the employmentchoice and the wage differentials in the public administration, state owned enterprisesand the formal private wage sector in Turkey. Selectivity corrected wage equations areestimated for each sector for men and women separately. Oaxaca decomposition of thewage differentials between sectors for men and women are carried out. For this purpose,results of the 1994 Household Expenditure Survey Conducted by the State Institute ofStatistics are used. The results indicate that when controlled for observed characteristicsand sample selection, for men, public administration wages are at parity or lower thanprivate sector wages in particular at the university level. State Economic Enterprisewages for men are higher than private sector wages except at the university level.Opposite results are obtained for women: their wages are at par or higher in publicadministration than in the private sector. Further, while men’s and women’s wages are atparity in the public administration, there is a large gender wage-gap in the private sector.Lower private returns to schooling are found in public than in the private sector. ∗ This paper was written when I was a visiting scholar at Yale University, Economic Growth Center. Iam grateful to T.P. Schultz for many suggestions and comments. Programming assistance of PaulMcGuire is appreciated. President Ömer Gebizliolu, vice-president Nurgül Ögüt and other members ofthe State Institute of Statistics of Turkey helped to implement the study. Any errors are mine alone.
1
1. Introduction
Several studies addressed public-private wage differentials. Gjourko and Tracy
(1988), Hartog and Oosterbeck (1993) and Mueller (1998) are recent examples of
studies in developed countries and Terrell (1993) and Assaad (1996) are recent examples
of studies in developing countries. The issue is believed to be particularly important in
developing countries where public sector usually comprises a major part of the wage
employment. Therefore, it could influence the wage setting and other employment
practices in the rest of the labor market. Furthermore, substantial public employment
may mean a large public wage bill in the government budged. This was an important
concern of many governments due to recent public sector fiscal problems and the
associated budgetary constraints. Such considerations led researchers to investigate
public-private wage differentials.
This study examines how individuals are selected into employment in public
administration, state owned enterprises (SOE) and formal private sector and the wage
determination in these sectors in Turkey. Individual survey data from the 1994
Household Budget Survey are used to assess the sectoral differentials for men and
women separately. I distinguish between non-participation, public administration work
SOE work, covered private sector work and other employment. Accordingly, five-way
multinomial logit model is estimated for sector selection. Mincerian, sectoral wage
equations are estimated taking sector selection into account. The central questions
addressed are as follows. Do public sector employees earn a premium? Are women
discriminated against in the public or in the private sectors? The commonly held beliefs
are negative answers to both of these querries. The results indicate that when controlled
for observed characteristics and sample selection, for men, public administration wages
are at par or lower than private sector wages in particular at the university level, while
SOE wages are higher than private sector wages except at the university level. The
results are somewhat different for women: Public administration wages are at par or
2
higher than the private sector wages. Further, while there is parity in wages between
sexes in public administration, there is a large gender gap in wages in the private sector.
Lower private returns to schooling are found in public than in the private sector.
This paper is organized as follows. Section 2 provides background information
about the Turkish labor market and the institutional setting. The conceptual framework
and the empirical specification are described in Section 3. Section 4 introduces the data
used in this study. Estimation results are presented in Section 5. Conclusions appear in
Section 6.
2. Turkish Labor Market
Turkish labor market is characterized by high rates of population and labor force
growth, declining rates of participation and exceptionally low levels of female
participation in urban areas. Another salient feature of the Turkish labor market is the
small share of wage earners in the total work force but, the large share of the public
sector in total urban employment. The public sector employees are about 3.4 percent of
the total employment and about 30 percent of the wage earners (OECD, 1996). The
share of government employment in non-agricultural employment was 17.2 percent in
1988 (Bulutay, 1995). The relative size of the public sector in Turkey is larger than in
Haiti but smaller than in Egypt. In Haiti public sector employment accounted 7 percent
of all non-agricultural employment and 11 percent of all wage earners (Terrell, 1993). In
Egypt, 35 percent of total employment was in the public sector in 1995 (Assaad, 1997).
Public administration employment in Turkey has shown an increasing trend over
time except in the 1930s. It grew at the rate of about eight percent per year during the
1960s, about 11 percent per year in the 1970s and by about only two percent per year in
the 1980s1. In the 1980s there was emphasis in reducing the size of the government as
1 These percentages are computed using the public administration potential openings provided inBulutay (1995: 294).
3
suggested by the structural adjustment and stabilization policies of January 24, 1980.
There was a decline in public administration employment in 1990 and a substantial
increase in 1994 (SIS, 1997b:318). Privatization of the SOEs was on the agenda of the
governments and gained momentum in the late 1980s. Since then, privatized or reformed
SOEs dismissed a number of workers (Tansel, 1998a).
There was substantial real wage erosion in the 1980s possibly a larger erosion in
the public than in the private sector. By 1988 real wages were half of what they were in
1978 (Bulutay, 1995). In response to wage erosion, moonlighting by public sector
workers increased during this period (Tansel, 1996b). After the general election of 1989
both the public and the private sector employees made up the loss in their real wages.
The strong bargaining position of the unions in the 1989 wage rounds and the social
democratic partner of the newly elected government were responsible for these wage
gains. There were further wage gains in the 1991 round of the collective bargaining
process which led to large number of dismissals in the private sector. On April 5, 1994 a
stabilization program was implemented and the year 1994 (during which the data of this
study was collected) was a year of austerity. State Planning Organization (1999: 53)
state the following changes: public administration real wages declined by twenty-two
percent in 1994 and by five percent in 1995 before registering increases thereafter; SOE
workers experienced no change in real wages in 1994 but declines of seventeen and
twenty-five percent respectively in 1995 and 1996; real wages of the large establishments
of the private sector declined by eighteen percent in 1994 and by eight percent in 1995.
Thus, the relationship of real wages among the sectors may not remain the same over
time.
Since there is no unemployment compensation in Turkey2 provision of work is
considered one of the functions of the government. This function is extensively misused
by political patronage (Bulutay, 1995). As a result, there is overstaffing in the public
2 Limited unemployment compensation is introduced with the recent privatization law in 1994 for theworkers dismissed from privatized SOEs.
4
administration and the SOEs both. Although, there is no guaranteed public employment
for graduates in Turkey as there is in Egypt (Assaad, 1997), nonetheless the graduates in
Turkey as a pressure group have some power to create public sector jobs for themselves
(Bulutay, 1995).
Employment and wage setting processes between the public administration,
SOEs and the private sector differ from each other. In the public administration, wages
are generated by a non-market process. There is a system of base salary for each
education level which are incremented annually according to seniority. There are
differentials according to the position occupied also. Performance seems irrelevant in
promotions. There are further allowances for working in the disadvantaged parts of the
country. The normal hours of work is 40 hours per week. Public administration
employees have life time contracts. A recent law granted them the right to organize trade
unions. However, they are not allowed to collectively bargain or strike. They are covered
by the Retirement Fund (ES) for the purposes of retirement and health benefits. Public
administration employees include health and education personnel.
State Owned Enterprise (SOE) workers are subject to the Labor Law as are the
private sector employees. SOE employees have open ended contracts which could be
canceled with a notice period, notice compensation and severance payment. Their wages
are determined by a process of collective bargaining. They have almost 100 percent
unionization rates. They are covered by the Social Security Institution (SSK) for the
purposes of retirement and health benefits. The normal hours of work is 45 hours per
week. In this study, the covered private sector employees are defined as those who are
covered by the Social Security Institution in terms of retirement and health benefits. I
chose covered private sector wage earners as the comparison group in order to maintain
comparability in the nonpecuniary aspects of the public and private sector jobs3. In the
3 Tansel (1998b) examines wage determination in the covered versus uncovered wage sector in Turkeywhere covered wage earners are those who are covered by the social security program while uncoveredwage earners are not covered by any social security program. Uncovered wage earners are found to havemuch lower wages than covered wage earners.
5
survey used in this study no information was collected on the kind of contracts of the
private sector workers if they have any or on their unionization status. In this paper
private sector refers to the SSK covered wage earners in the private sector.
3. The Model
The wage equations are specified according to the traditional human capital
framework (Becker, 1975; Mincer, 1958 and 1974). Log wages are explained by human
capital characteristics and locational factors as follows:
ln Wj = βoj + βjXj + Uj
where W denotes wages, X is a vector of characteristics of workers, β is a vector of
unknown parameters with βo as the intercept term, and U is the random disturbance
term; j stands for public administration, SOE or covered private sector.
The distribution of workers among these sectors is not random. In estimating the
wage equations, the selection into different sectors for which we observe wages must be
taken into account. Potential biases could result from ignoring sample selection
(Heckman, 1974). To take this into account, I assume that, individuals face five mutually
exclusive choices: not working (j=0), public administration employment (j=1), SOE
employment (j=2), covered private sector wage employment (j=3) or other employment
(j=4). The sectoral choice depends on the perceived net differentials in the wage and
non-wage compensation in each of these sectors. Worker’s tastes and preferences as well
as human capital and other characteristics will determine the sectoral choice. I assume a
conditional logit model for the probability that the individual chooses alternative j as
follows.
4Pj = exp (Zαj) / (1 + ∑ exp (Zαj))
j=1
6
where Z is a vector of explanatory variables affecting sectoral choice, αj is a vector of
unknown parameters of the alternative j. I adopt the two-step estimation method
developed by Lee (1983) and Trost and Lee (1984). In the first stage, I estimate the
sectoral choice probabilities by maximum likelihood logit method and construct the
selection term for the alternative j as follows:
λj = φ(Hj) / Φ (Hj) where Hj = Φ -1 (Pj)
φ is the standard normal density function and Φ is the standard normal distribution
function. In the second stage, the estimated λj is included among the explanatory
variables of the wage equations. The implied wage equations which are then estimated by
OLS are:
lnWj = βoj + Xjβj + θjλj + υj
where θj = pjσj, provides consistent estimates of β and θ.
Empirical Specification:
The explanatory variables that are included in both the multinomial logit and the
wage equations are as follows. Education is represented by the dummy variables for
different levels of diplomas achieved. Since it is necessary to be at least primary school
graduate for a job in the public administration sector, in the multinomial logit and the
public administration wage equations the reference category was primary schooling
diploma. In the wage equations of the remaining alternatives the reference category
includes illiterate and nongraduate people.
The experience variable is computed as age minus the number of years of
schooling minus six, the age of entry into school (Mincer, 1974). A quadratic term in
experience is also included. A dummy variable indicates whether the individual resides in
7
an urban area which is defined as a location with over twenty thousand population.
Further, dummy variables for regions of residence are included to control for differentials
in the labor market opportunities. Since interviews took place in different months
throughout 1994, I included dummy variables representing seasons of the year to control
for seasonal factors if any. Winter was the reference category.
The additional variables that are included only in the multinomial logit equation
are as follows. Schultz (1990) suggests use of unearned income to explain choices
involving labor force participation. Accordingly, I include unearned income of the
individual and unearned income of the other household members and the amount of land
owned. They are expected to reduce the probability of labor force participation by
raising the shadow value of a person’s time in nonmarket activities and in self
employment. Unearned income includes rental income and the interest income.
4. Data
I use individual level sample data which come from the 1994 Household
Expenditure Survey conducted by the State Institute of Statistics of Turkey.4 I restricted
the sample to individuals 15 to 65 years of age who are not employed in agriculture.
Wages are the sum of cash earnings, bonuses and the value of income in kind.5
Information on wages were collected both for the month of the interview and for the
previous year. The survey also asked the usual hours of work per week. I obtained the
4 The survey was administered to 26,256 households. Interviews covered 58 provinces out of the total of76 provinces in the country. There were 281 clusters which were selected with stratified, multistagesampling. The stratification was on seven geographical regions, rural urban settlements in each regionand according to the size of its population. Further stratification was according to socioeconomic statusof the settlements as developed, developing and undeveloped. Household was the sampling unit. Eachhousehold was interviewed ten times a month. A different series of households were interviewed in eachmonth throughout 1994. Details may be found in State Institute of Statistics (1997a).
5 I considered only the wages on the main job. If the individual is secondarily employed I ignored theearnings from the second job since no information was collected on the hours of work on the second job.
8
hourly wage by dividing the reported monthly wage by the imputed monthly hours of
work. The monthly hours of work is imputed by multiplying the usual hours of work per
week by 4.3 since no information was collected on the number of weeks worked during a
month. Similarly, no information was collected on the number of weeks worked per year.
Therefore, hourly wages could not be computed using the annual wages without further
assumption about the number of weeks worked during a year. In the ensuing analysis
hourly wage based on monthly wage is used assuming that there may be less errors of
measurement in the monthly wage.6
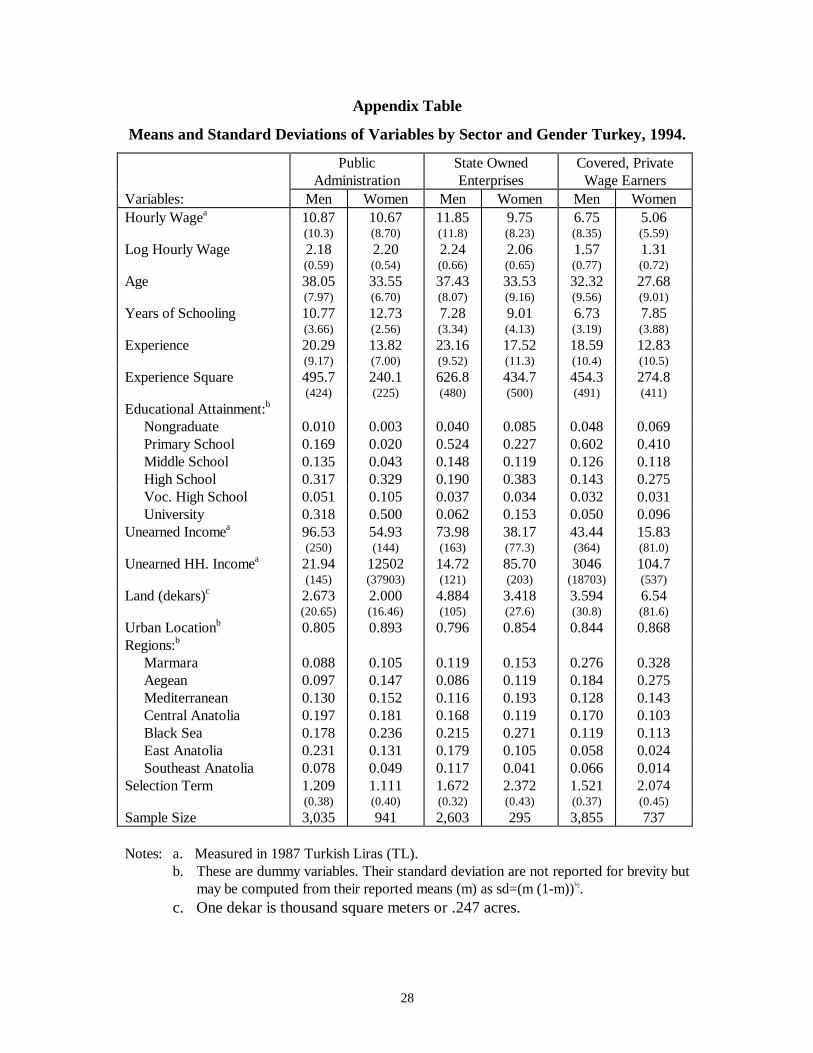
The main characteristics of the data are shown in the Appendix Table. The public
sector wages are markedly higher than those in the private sector. But, schooling
achievements are also higher in the public sector than in the private sector. Public
administration and covered private sector log hourly wages differ by 0.61 points for men
and 0.89 points for women. Men have four and women have five years more schooling in
public administration than their counterparts in the covered private sector. Women in
public administration earn more than twice what they earn in the covered private sector.
It is also noteworthy that men’s hourly wages in the SOEs are higher than those in the
public administration.
The facts that public sector workers are better educated than the private sector
workers and women are better educated than men are also evident from the distribution
of schooling attainment in the Appendix Table. Nearly 90 percent of the female and 70
percent of the male public administration workers hold a high school diploma or above,
while the same percentages in the covered private sector are 40 for women and 23 for
men. Since SOE male workers are predominantly blue collar workers it is note worthy
6 Since the households were interviewed at different months throughout 1994 during which the annualrate of inflation was about 90 percent the wages and unearned income figures were deflated by the localmonthly consumer price index (CPI). Households in 16 major cities were assigned the monthly CPIs forthose cities. Households in other locations were assigned either a rural or an urban monthly CPI for oneof the five regions in which they are located according to whether they are in a rural or an urbanlocation. A location is considered urban if its population is over twenty thousand. The base for the CPIfigures was 1987. They were obtained from the State Institute of Statistics (1994).
9
that about 52 percent of them have primary school diploma only. On average both the
male and female public sector (public administration and SOE) workers are about six
years older than private sector workers. Further, male public administration workers
have two years and the male SOE workers have about four years more experience than
the private sector workers. In case of females, public administration workers have one
extra year of experience and SOE workers have five extra years of experience over
private sector workers. In all sectors men have more years of experience than women.
The mean wage data in the Appendix Table show a large gender gap in wages in
the SOEs and in the private sector, while there is near parity between male and female
wages in the public administration. Log hourly wages between men and women differ by
0.18 points in the SOEs and by 0.26 points in the covered private sector. Thus wage
differentials favor men in spite of the higher average years of schooling of women than of
men in all three sectors.
Appendix Table also gives information about individual’s unearned income, the
unearned income of the other household members and land holdings.7 With regards to
the regional distribution of workers, it can be observed that the percentage of female
workers in all sectors, are about the same as men’s or larger than men’s in all regions
except in the East and Southeast Anatolia where the percentages of female workers are
about half as those of male workers. This can be attributed to the prevailing social norms
in the latter two regions adverse to women’s market employment.
5. Estimation Results
Multinomial Logit Estimates:
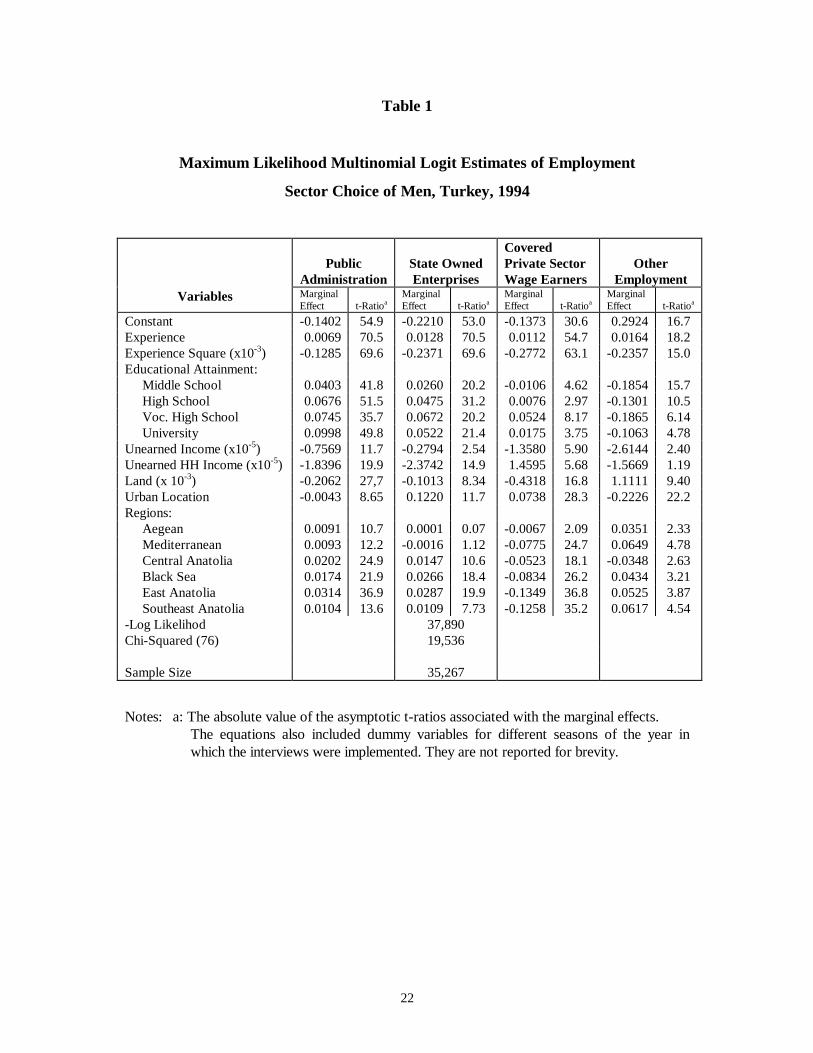
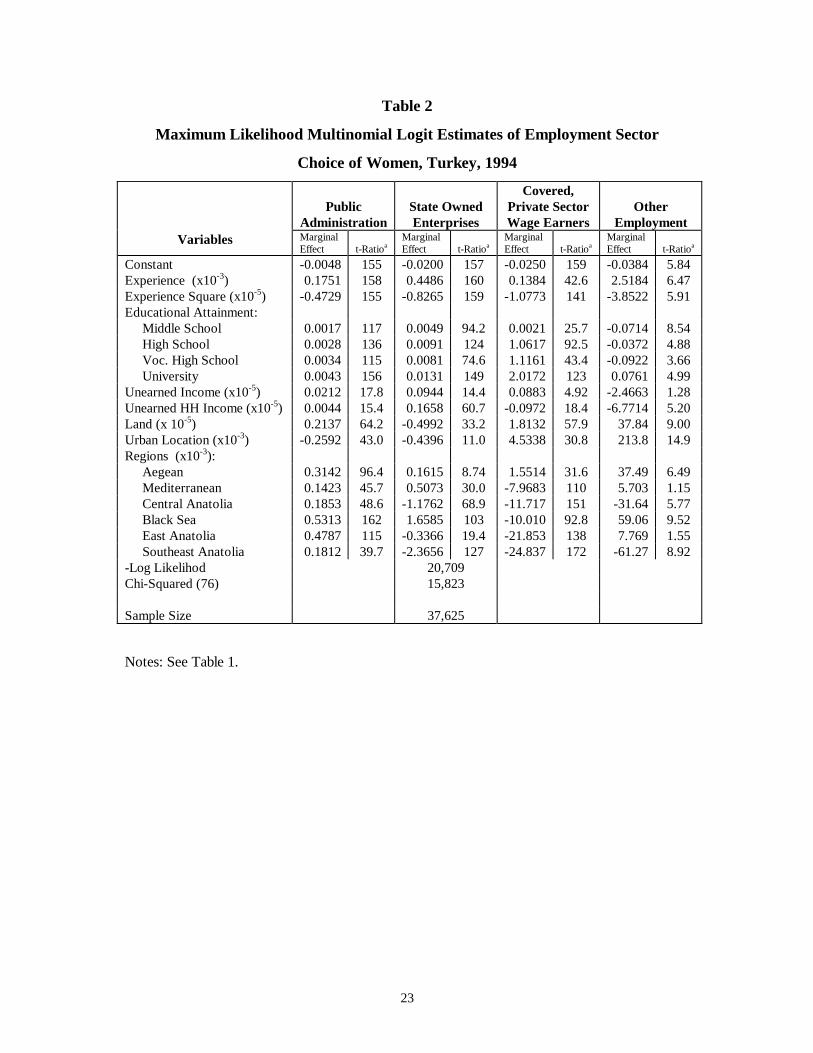
Multinomial logit estimates of sector choice for men and women are shown in
Tables 1 and 2 respectively. The tables give the marginal effects of each variable on the
7 See Note 6 about adjustment of unearned income for inflation.
10
probability of joining a particular sector calculated at the mean values of the variables
and the associated asymptotic t-ratios. The category of “other employment” includes all
other employed individuals who are not included in the previous categories. They are,
uncovered wage earners, self employed in agricultural or nonagricultural activities,
unpaid family workers and employers.
Experience significantly increases the probability of employment in all of the four
sectors as compared to nonparticipation. All levels of educational attainment are
statistically significant and increase the probability of joining public administration, SOEs
and the covered private sector but reduce the probability of participation in the other
employment category. In each case, the higher the educational level, the higher its
contribution to the participation in a sector. The marginal effects of experience and
education terms are much larger for men than for women. For men, the probability of
joining public administration is highest, for university graduates while for women highest
probabilities are observed for joining the private sector. Other researchers also found that
higher levels of education are associated with greater probability of public employment
(Terrell, 1993).
Income effects on participation are measured by the unearned income of the
individual and of the other household members. For men, both of these terms are
negative (except for household unearned income for private sector participation) and
statistically significant. For women, both of these terms are statistically significant but
seem to increase the probability of participation in all sectors of work except in other
employment. For men, the amount of land owned significantly reduces the probability of
participation in all of the sectors except in the other employment category. While for
women the amount of land owned significantly increases the probability of participation
in all sectors except in SOEs. The unexpected positive effects of the amounts of
unearned incomes and land owned in case of women could possibly be explained with
the indirect and positive effect of these factors on schooling and the positive impact of
schooling on women’s participation. As for the regional factors: For men the
11
probabilities of working in the public administration or in the SOEs are higher in all
regions as compared to the Marmara region. However, the probability of working in the
covered private sector is lower in all regions as compared to the Marmara region. Similar
regional patterns hold for women also.
The Wage Equations:
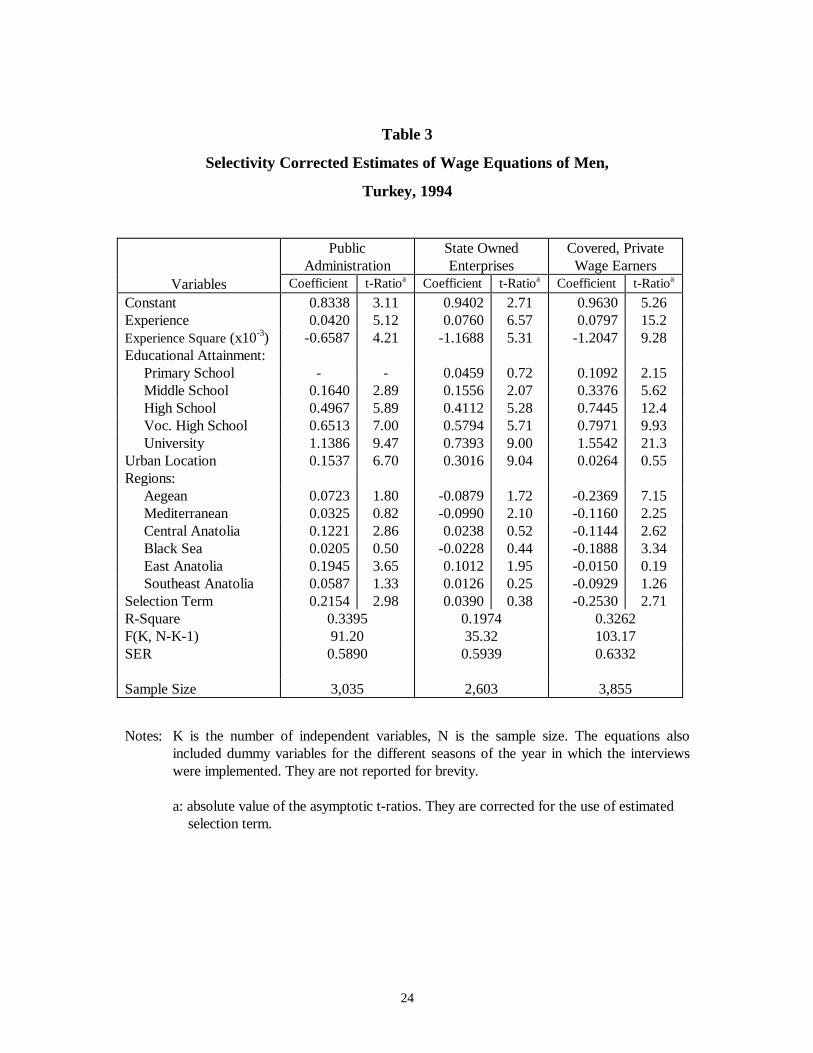
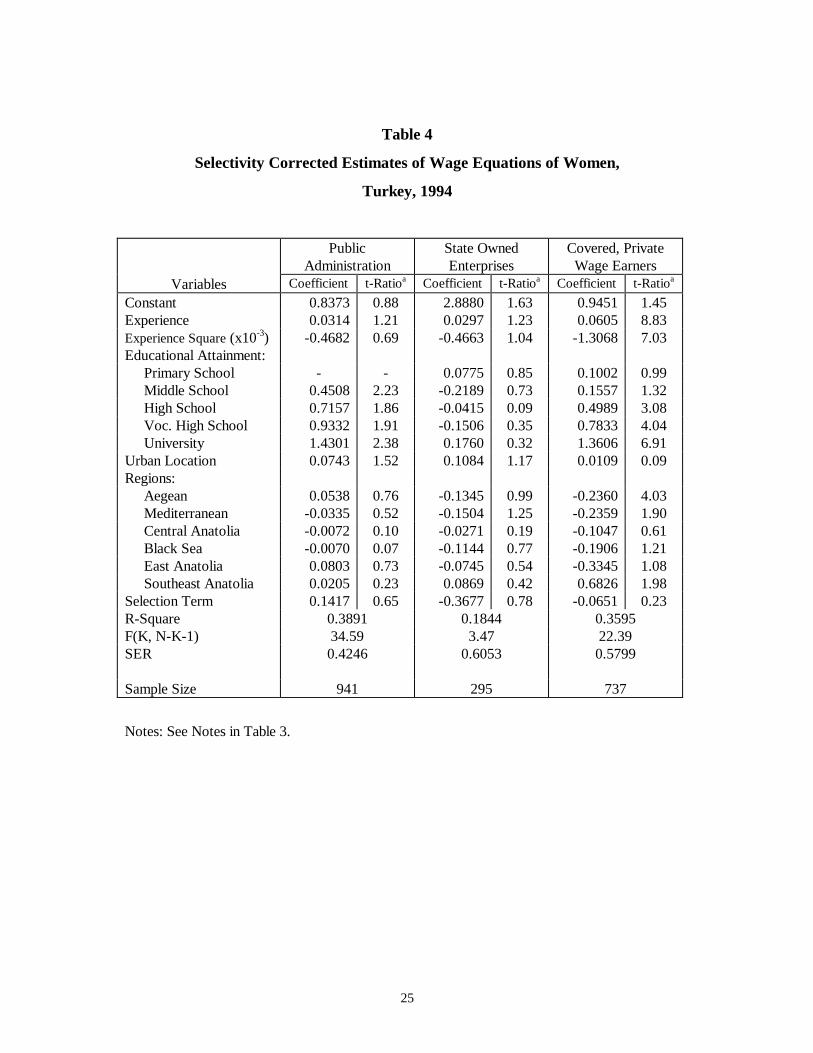
Selectivity corrected estimates of the sectoral wage equations for men and
women are given in Tables 3 and 4 respectively. All of the wage equations are over all
statistically significant. However, in case of women the SOE wage equation has a poor
fit and none of individual coefficients are statistically significant. This may possibly be
due to the small number of observations in this case. Therefore, in the ensuing
discussion, women in SOEs will be ignored.
Linear and quadratic terms in experience have the expected positive and negative
signs respectively in all sectors. However, they are statistically insignificant for women in
the public administration. For men, the curvature of the wage experience profile is
steeper in the SOEs and the covered private sector than in the public administration
implying a lower impact for an additional year of experience in public than in the private
sector. Terrell (1993) also finds steeper wage experience profile in the private than in the
public sector. For men, wages peak at 32 years of experience in the public administration
and 33 years of experience in the SOEs and the covered private sector. For women,
wages peak at 34 years of experience in public administration and 23 years of experience
in the covered private sector. In all sectors for both men and women the coefficient
estimates of the educational attainment terms are all statistically significant. The
coefficient estimates for regions indicate that there are some regional wage differentials
for men in all sectors while there are no regional wage differentials for women. In all
cases, wages are higher in urban areas.
12
The coefficient estimate of the selection term for men in public administration is
statistically significant and positive which implies that men who select public
administration have higher productivity than the average. Thus, unobserved
characteristics that increase probability of public administration employment have a
positive impact on wages. The term for selection into SOEs is statistically insignificant.
The term for selection into covered private sector is statistically significant and negative
implying that men who select into private sector have lower productivity than the
average. These results seem counterintuitive however, their statistical significance should
not be exagerated. In case of women all of the selection terms are statistically
insignificant.
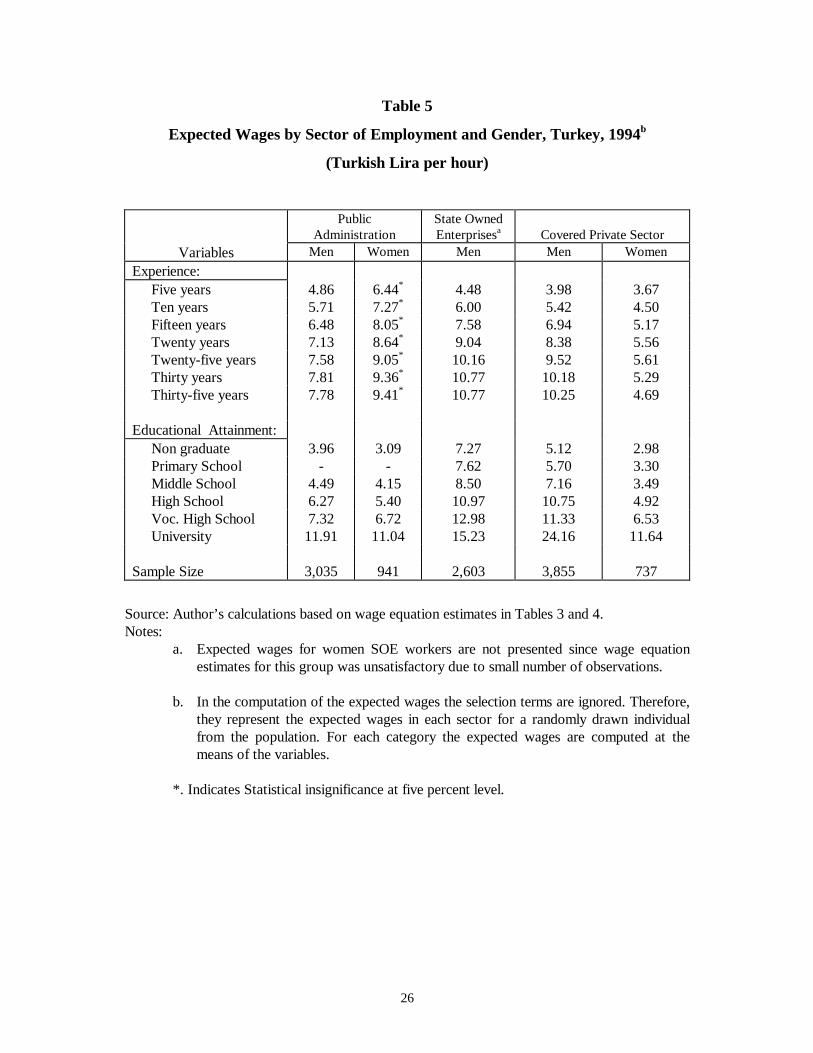
Table 5 shows the expected wages for different levels of experience and
educational attainment. For men, at different levels of experience, highest wages are
achieved at the SOEs. At different levels of education highest wages are achieved again
at the SOEs except at the university level where highest wages are achieved in the
covered private sector8. Higher wages at low levels of education and lower wages at the
university level in the SOEs than in the private sector give credence to the wage
compression hypothesis in the SOEs. Comparing public administration and the private
sector, we observe that at low levels of experience, wages are at par while at higher
levels of experience, public administration wages are lower than in the covered private
sector. This too supports the wage compression hypothesis in public administration. At
different levels of education public administration wages are lower than private sector
wages. The differential is in particular large at the university level. At this level concern
is sometimes expressed that graduates choose private over public sector. I also note that
in the public administration and the SOEs after 20 years of experience and in the private
sector after 25 years of experience, there are no more substantial wage gains from
working more years.
8 Tansel (1998a) compares the earnings of a group of SOE workers before and after they lost their jobsdue to privatization. For most of the workers the dismissals meant a movement to the informal sector.Therefore, their earnings were much lower in the private sector than when in the SOEs.
13
For women, at all levels of experience wages are higher in the public
administration than in the private sector although public administration expected values
are insignificant. In the private sector after twenty-five years of experience there is a
declining tendency in wages. At different levels of education, public administration
wages are at par or higher than the private sector wages. Kanellopoulos (1997) found
that in Greece for men, wages were lower in the public than in the private sector at low
levels of education while the opposite was true at high levels of education. Assaad
(1997) found that government wages were at par or higher than private sector wages in
Egypt. Stelcner et al. (1989) in Peru and van der Gaag and Vijverberg (1988) in Côte
d’lvoire found lower public sector wages than private sector wages.
Comparing wages of men and women in public administration we observe that at
different levels of experience, a comparison can not be made due to insignificant
expected values for women. However, at different levels of education there is near parity
between the wages of men and women. This is expected since in the public sector wages
are set by law irrespective of gender. In the covered private sector, there is a large
gender gap in wages at all levels of experience and education. This finding suggests that
women may be facing discrimination in the private sector. Assaad (1997) in Egypt and
Lassibille (1998) in Spain found that male-female wage differential is larger in the private
than in the public sector.
Oaxaca-Blinder Decomposition:
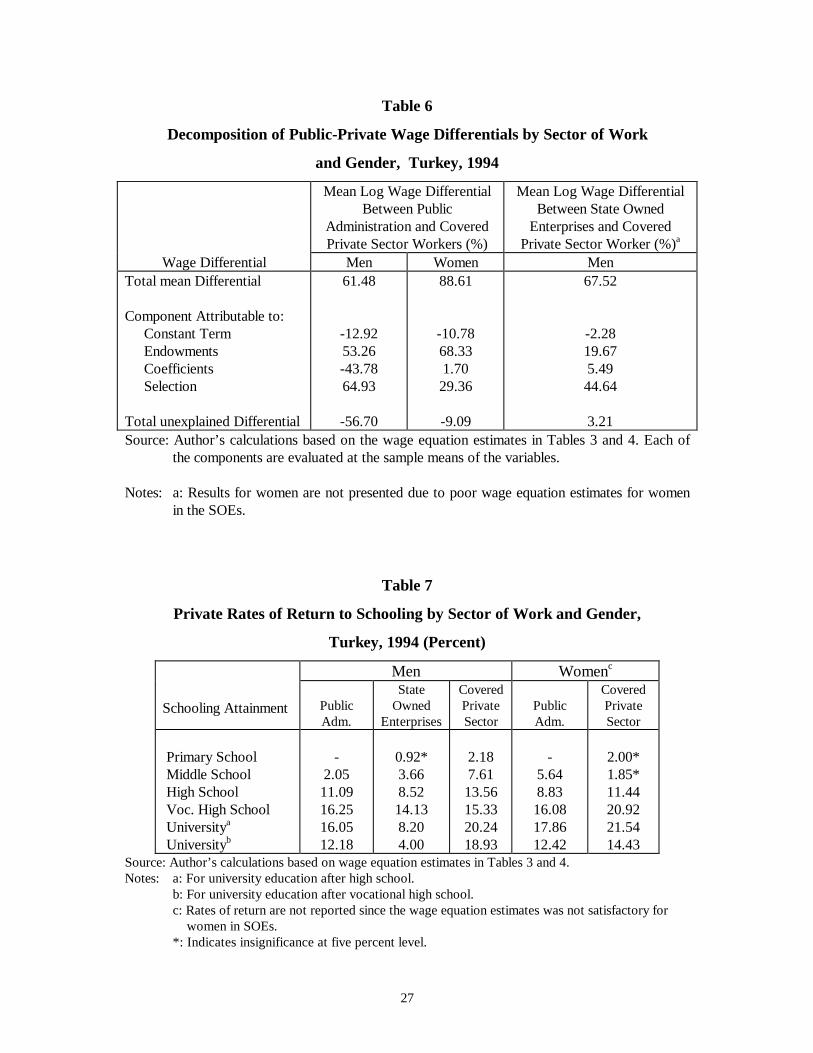
Table 7 shows the decomposition of wage differentials between sectors for men
and women which is due to Oaxaca (1973) and Blinder (1974). I decompose the total
mean log wage differential between public administration and private sector and between
SOE and the private sector into four components including the differentials caused by
the selectivity bias (Idson and Feaster, 1990) as follows:
lnWj - lnWi = (βoj - βoi) + 0.5 (βj + βi) (Xj - Xi) + 0.5 (Xj + Xi) (βj - βi) + θj λj- θiλi
14
where bar denotes the mean of the variables; j denotes public administration or SOE and
i denotes the private sector. The first component is the difference in the constant terms.
This differential is often interpreted as the premium or pure rent from being in a given
sector (Terrell, 1993). The second component is due to the difference in endowments of
the workers. The third component is due to the difference in the coefficients or due to
the market returns to the endowments. The final component is due to the difference in
the selection terms. The first and the third components are often referred to as the
unexplained differentials. All the components are evaluated at the sample means of the
variables. The decomposition in Table 7 indicates that the positive public-private wage
differential in favor of the public sector is partly due to higher levels of human capital
endowments of public sector workers and partly due to the large positive selection
differential in all cases. The total unexplained differential is large and negative in case of
public administration versus private sector differential for men. This differential is mostly
due to the differential in coefficients which results from higher returns to worker
characteristics in the private sector. In the case of SOE versus private wage differential
for men the total unexplained differential is positive and small while in the case of public
administration versus private sector differential for women, it is negative and small. In
the latter two cases the differentials in the coefficients indicate higher returns to worker
characteristics in the public sector. Thus we can talk about positive rents only in the case
of men in the SOEs. Terrell (1993) found in Haiti that the public administration workers
especially SOE workers earn a sizable rent. Similarly, Lindauer and Sabot (1983)
suggested that the SOEs may be distributing monopoly rents in Tanzania.
Covered and Uncovered Private Sectors:
In this paper I choose only those private sector workers which are covered by
Social Security Administration (SSK) in order to maintain comparability to the public
administration workers who are covered by Retirement Fund (ES) and SOE workers
who are covered by SSK. This provides comparability in terms of the retirement and
15
health benefits coverage. However, it is well known that the retirement and health
benefits of SSK are much inferior to those provided by the ES. Thus, the two sets of
benefits are not exactly comparable. Further, the three sectors considered also differ in
terms of other nonpecuniary job attributes such as job security, work effort and others
which may include subsidized lunch, housing and transportation, heating fuel and other
allowances.Such nonpecuniary aspects are not considered in this paper.
About 30 percent of the private sector wage workers were not covered by the
SSK and they constitute part of the informal sector. Tansel (1998b) examines the wages
of the covered versus uncovered sector wage workers. covered wage earners are found
to have two and a halftimes higher wages than private sector wage earners who are not
covered by SSK. Thus, if we compare the wages of the public sector workers with those
of the total, of covered and uncovered private sector workers we would find that both
the public administration and SOE workers, men and women alike earn substantial
premiums.
Returns to Schooling:
Table 8 presents the private rates of return to schooling computed using the
wage equation estimates. Returns to schooling are observed to increase with level of
schooling in all sectors for both men and women. There are not much gender differences
in returns to schooling both in public administration and in the covered private sector.
Small gender differences in private returns to schooling were also observed in other
Turkish studies (Tansel, 1994 and 1996a).
As for the public versus private sector differentials, the figures indicate that for
men, returns in the public administration and the SOEs are lower than in the private
sector. Similarly, for women returns are lower in the public administration than in the
private sector. Psacharopoulos (1994) reported lower returns in the noncompetitive
public sector than in the competitive private sector for a group of countries. This was
16
hypothesized to be due to the wage compression in the public sector. Assaad (1997)
found higher returns in public than in private sector at the primary, and secondary levels
of schooling but lower returns in public than in private at the university and post-
graduate levels in Egypt. Terrell (1993) in Haiti, Kanellopoulos (1997) in Greece and
Lassibille (1998) in Spain also found lower returns to schooling in public than in the
private sector.
6. Conclusion
This paper examines the factors which explain the employment sector choice and
the wage differentials in public administration, state owned enterprises and the private
wage sector in Turkey in 1994. Private sector includes only those wage earners who are
covered by the social security program in terms of retirement and health benefits.
Employment sector choice is explained with a five-way logit model with nonparticipation
as the base choice. Selectivity corrected sectoral wage equations are estimated for men
and women separately. One of the main findings is that when controlled for observed
characteristics and sample selection, for men, public administration wages are at parity or
lower than covered private sector in particular at the university level wages while SOE
wages are higher than covered private sector wages except at the university level. There
is evidencen that there is wage compression in the SOEs. SOE rents may be due to
several factors such as unionization, monopoly market power in some cases or purely
public sector factor. For women, public administration wages are at par or higher than
the private sector wages. Further, men’s and women’s wages are at parity in the public
administration however there is a large gender gap in wages in the covered private
sector. This finding suggests that women may be facing discrimination in the private
sector. As it was found in many other studies, the private returns to schooling are lower
in the noncompetitive public sector than in the competitive private sector.
The private sector workers considered in this paper were covered by SSK.
Uncovered workers are known to have considerably lower wages than covered ones.
17
Thus, a comparison of the wages of public sector workers with those of the total private
sector would lead to a conclusion that public sector workers earn substantial premiums.
Data on labor turnover indirectly attest attractiveness of the public sector jobs. The quit
rate was strikingly low among SOE workers as compared with private firm workers over
the 1992-1995 period (OECD, 1996). Another indirect evidence on the desirability of
public sector jobs is the enormous number of qualified applicants when a few public
position openings are announced. Recently, there were fifty thousand applicants for a
thousand openings all over the country for positions at the Ministry of Village Affairs
(Cumhuriyet, 1999). Analysis in this paper does not take into account the nonpecuniary
aspects of the public sector jobs. A number of nonpecuniary factors may render a public
sector job preferable over a private sector job. These factors may include job security,
work effort, work hours and various fringe benefits. Given these nonpecuniary benefits
workers may prefer public sector even if public sector wages are lower than private
sector wages. Nonpecuniary aspects of the public sector jobs provide attractive
employment opportunities which are difficult to come by in the private sector. Further
research is needed to quantify the nonpecuniary benefits.
18
References
Assaad, R. (1997) The Effects of Public Sector Hiring and Compensation Policies on the
Egyptian Labor Market, World Bank Economic Review, 11(1):85-118.
Becker, G.S. (1975) Human Capital, second edition, National Bureau of Economic
Research. New York: Columbia University Press.
Blinder, A.S. (1974) Wage Discrimination: Reduced Form and Structural Estimates,
Journal of Human Resources, 8(4): 436-455.
Bulutay, T. (1995) Employment, Unemployment and Wages in Turkey, Ankara:
International Labor Office and the State Institute of Statistics.
Cumhuriyet, January 17, 1999: 19.
Gjourko, J., J. Tracy (1988) an Analysis of Public and Private Sector Wages Allowing
for Endogenous Choices of both Government and Union Status, Journal of
Labor Economics, 6(2): 229-251.
Hartog, J. and H. Oosterbeek (1993) Public and Private Sector Wages in Netherlands,
European Economic Review, 37: 97-114.
Heckman, J.J. (1974) Shadow Prices, Market Wages and Labor Supply, Econometrica,
42: 679-694.
Idson, T. and D. Feaster (1990) A Selectivity Model of Employer-Size Wage
Differentials, Journal of Labor Economics, 8(1): 99-122.
19
Kanellopoulos, C.N. (1997) Public-Private Wage Differentials in Greece, Applied
Economics, 29 ( ): 1023-1032.
Lassibille, G. (1998) Wage Gaps Between the Public and Private Sectors in Spain,
Economics of Education Review, 17(1): 83-92.
Lee, L.F. (1982) Some Approaches to the Correction of Selectivity Bias, Review of
Economic Studies, 49: 355-372.
Lee, L.F. (1983) Generalized Econometric Models With Selectivity, Econometrica, 51:
507-512.
Lindauer, D.L. and R.H. Sabot (1983) The Public-Private Wage Differential in a Poor
Urban Economy, Journal of Development Economics, 12(3): 137-157.
Mincer, J. (1958) Investments in Human Capital and Personal Income Distribution,
Journal of Political Economy, 56: 281-302.
Mincer, J. (1974) Schooling, Experience and Earnings, National Bureau of Economic
Research. New York: Columbia University Press.
Mueller, R.E. (1998) Public-Private Sector Wage Differentials in Canada: Evidence from
Quantile Regressions, Economics Letters, 60(2): 229-235.
Oaxaca, R. (1973) Male-Female Wage Differentials in Urban Labor Markets,
International Economic Review, 14(3): 693-709.
Organization for Economic Cooperation and Development (OECD) (1996) OECD
Economic Surveys: Turkey, 1996, Paris: OECD.
20
Psacharopoulos, G. (1994) Returns to Investment in Education: A Global Update,
World Development, 22(9): 1325-1343.
Schultz, T.P. (1990) Testing the Neoclassical Model of Family Labor Supply and
Fertility, Journal of Human Resources, 25: 599-634.
State Institute of Statistics (SIS) (1994) Monthly Bulletin of Statistics, Ankara: SIS.
State Institute of Statistics (SIS) (1997a) Household Consumption Expenditures
Survey Results, 1994, Ankara: SIS.
State Institute of Statistics (SIS) (1997b) Labor Statistics, 1996, Ankara: SIS.
State Planning Organization (SPO) (1999) Program for 1999, Ankara: SPO.
Stelcner, M. J., van der Gaag and W. Vijverberg (1989) A Switching Regression Model
of Public-Private Sector Wage Differentials in Peru: 1985-1986, Journal of
Human Resources, 24(3): 545-559.
Tansel, A. (1994) Wage Employment, Earnings and Returns to Schooling for Men and
Women in Turkey, Economics of Education Review, 13(4): 305-320.
Tansel, A. (1996a) Self Employment, Wage Employment and Returns to Education for
Urban Men and Women in Turkey in T. Bulutay (ed.) Education and the Labor
Markets in Turkey, Ankara: State Institute of Statistics.
Tansel, A. (1996b) Wage Earners and Moonlighting in Turkey, Research in Middle
East Economics, I: 1-25.
21
Tansel, A. (1998a) Earnings of Turkish Workers Before and After Dismissal Due to
Privatization. Processed, Ankara: Department of Economics, Middle East
Technical University.
Tansel, A. (1998b) Formal versus Informal Sector Choice of Wage Earners and their
Wages in Turkey. Processed, Ankara: Department of Economics, Middle East
Technical University.
Terrell, K. (1993) Public-Private Wage Differentials in Haiti: Do Public Servants Earn a
Rent? Journal of Development Economics, 42 ( ): 293-314.
Trost R. and L.F. Lee (1984) Technical Training and Earnings: A Polytomous Model
With Selectivity, Review of Economics and Statistics, 66: 151-156.
Van der Gaag, J. and W. Vijverberg (1988) A Switching Regression Model for Wage
Determinants in the Public and Private Sectors of a Developing Country, Review
of Economics and Statistics, 70(2): 244-252.
22
Table 1
Maximum Likelihood Multinomial Logit Estimates of Employment
Sector Choice of Men, Turkey, 1994
PublicAdministration
State OwnedEnterprises
CoveredPrivate SectorWage Earners
OtherEmployment
Variables MarginalEffect t-Ratioa
MarginalEffect t-Ratioa
MarginalEffect t-Ratioa
MarginalEffect t-Ratioa
Constant -0.1402 54.9 -0.2210 53.0 -0.1373 30.6 0.2924 16.7Experience 0.0069 70.5 0.0128 70.5 0.0112 54.7 0.0164 18.2Experience Square (x10-3) -0.1285 69.6 -0.2371 69.6 -0.2772 63.1 -0.2357 15.0Educational Attainment: Middle School 0.0403 41.8 0.0260 20.2 -0.0106 4.62 -0.1854 15.7 High School 0.0676 51.5 0.0475 31.2 0.0076 2.97 -0.1301 10.5 Voc. High School 0.0745 35.7 0.0672 20.2 0.0524 8.17 -0.1865 6.14 University 0.0998 49.8 0.0522 21.4 0.0175 3.75 -0.1063 4.78Unearned Income (x10-5) -0.7569 11.7 -0.2794 2.54 -1.3580 5.90 -2.6144 2.40Unearned HH Income (x10-5) -1.8396 19.9 -2.3742 14.9 1.4595 5.68 -1.5669 1.19Land (x 10-3) -0.2062 27,7 -0.1013 8.34 -0.4318 16.8 1.1111 9.40Urban Location -0.0043 8.65 0.1220 11.7 0.0738 28.3 -0.2226 22.2Regions: Aegean 0.0091 10.7 0.0001 0.07 -0.0067 2.09 0.0351 2.33 Mediterranean 0.0093 12.2 -0.0016 1.12 -0.0775 24.7 0.0649 4.78 Central Anatolia 0.0202 24.9 0.0147 10.6 -0.0523 18.1 -0.0348 2.63 Black Sea 0.0174 21.9 0.0266 18.4 -0.0834 26.2 0.0434 3.21 East Anatolia 0.0314 36.9 0.0287 19.9 -0.1349 36.8 0.0525 3.87 Southeast Anatolia 0.0104 13.6 0.0109 7.73 -0.1258 35.2 0.0617 4.54-Log Likelihod 37,890Chi-Squared (76) 19,536
Sample Size 35,267
Notes: a: The absolute value of the asymptotic t-ratios associated with the marginal effects.The equations also included dummy variables for different seasons of the year inwhich the interviews were implemented. They are not reported for brevity.
23
Table 2
Maximum Likelihood Multinomial Logit Estimates of Employment Sector
Choice of Women, Turkey, 1994
PublicAdministration
State OwnedEnterprises
Covered,Private SectorWage Earners
OtherEmployment
Variables MarginalEffect t-Ratioa
MarginalEffect t-Ratioa
MarginalEffect t-Ratioa
MarginalEffect t-Ratioa
Constant -0.0048 155 -0.0200 157 -0.0250 159 -0.0384 5.84Experience (x10-3) 0.1751 158 0.4486 160 0.1384 42.6 2.5184 6.47Experience Square (x10-5) -0.4729 155 -0.8265 159 -1.0773 141 -3.8522 5.91Educational Attainment: Middle School 0.0017 117 0.0049 94.2 0.0021 25.7 -0.0714 8.54 High School 0.0028 136 0.0091 124 1.0617 92.5 -0.0372 4.88 Voc. High School 0.0034 115 0.0081 74.6 1.1161 43.4 -0.0922 3.66 University 0.0043 156 0.0131 149 2.0172 123 0.0761 4.99Unearned Income (x10-5) 0.0212 17.8 0.0944 14.4 0.0883 4.92 -2.4663 1.28Unearned HH Income (x10-5) 0.0044 15.4 0.1658 60.7 -0.0972 18.4 -6.7714 5.20Land (x 10-5) 0.2137 64.2 -0.4992 33.2 1.8132 57.9 37.84 9.00Urban Location (x10-3) -0.2592 43.0 -0.4396 11.0 4.5338 30.8 213.8 14.9Regions (x10-3): Aegean 0.3142 96.4 0.1615 8.74 1.5514 31.6 37.49 6.49 Mediterranean 0.1423 45.7 0.5073 30.0 -7.9683 110 5.703 1.15 Central Anatolia 0.1853 48.6 -1.1762 68.9 -11.717 151 -31.64 5.77 Black Sea 0.5313 162 1.6585 103 -10.010 92.8 59.06 9.52 East Anatolia 0.4787 115 -0.3366 19.4 -21.853 138 7.769 1.55 Southeast Anatolia 0.1812 39.7 -2.3656 127 -24.837 172 -61.27 8.92-Log Likelihod 20,709Chi-Squared (76) 15,823
Sample Size 37,625
Notes: See Table 1.
24
Table 3
Selectivity Corrected Estimates of Wage Equations of Men,
Turkey, 1994
PublicAdministration
State OwnedEnterprises
Covered, PrivateWage Earners
Variables Coefficient t-Ratioa Coefficient t-Ratioa Coefficient t-Ratioa
Constant 0.8338 3.11 0.9402 2.71 0.9630 5.26Experience 0.0420 5.12 0.0760 6.57 0.0797 15.2Experience Square (x10-3) -0.6587 4.21 -1.1688 5.31 -1.2047 9.28Educational Attainment: Primary School - - 0.0459 0.72 0.1092 2.15 Middle School 0.1640 2.89 0.1556 2.07 0.3376 5.62 High School 0.4967 5.89 0.4112 5.28 0.7445 12.4 Voc. High School 0.6513 7.00 0.5794 5.71 0.7971 9.93 University 1.1386 9.47 0.7393 9.00 1.5542 21.3Urban Location 0.1537 6.70 0.3016 9.04 0.0264 0.55Regions: Aegean 0.0723 1.80 -0.0879 1.72 -0.2369 7.15 Mediterranean 0.0325 0.82 -0.0990 2.10 -0.1160 2.25 Central Anatolia 0.1221 2.86 0.0238 0.52 -0.1144 2.62 Black Sea 0.0205 0.50 -0.0228 0.44 -0.1888 3.34 East Anatolia 0.1945 3.65 0.1012 1.95 -0.0150 0.19 Southeast Anatolia 0.0587 1.33 0.0126 0.25 -0.0929 1.26Selection Term 0.2154 2.98 0.0390 0.38 -0.2530 2.71R-Square 0.3395 0.1974 0.3262F(K, N-K-1) 91.20 35.32 103.17SER 0.5890 0.5939 0.6332
Sample Size 3,035 2,603 3,855
Notes: K is the number of independent variables, N is the sample size. The equations alsoincluded dummy variables for the different seasons of the year in which the interviewswere implemented. They are not reported for brevity.
a: absolute value of the asymptotic t-ratios. They are corrected for the use of estimated selection term.
25
Table 4
Selectivity Corrected Estimates of Wage Equations of Women,
Turkey, 1994
PublicAdministration
State OwnedEnterprises
Covered, PrivateWage Earners
Variables Coefficient t-Ratioa Coefficient t-Ratioa Coefficient t-Ratioa
Constant 0.8373 0.88 2.8880 1.63 0.9451 1.45Experience 0.0314 1.21 0.0297 1.23 0.0605 8.83Experience Square (x10-3) -0.4682 0.69 -0.4663 1.04 -1.3068 7.03Educational Attainment: Primary School - - 0.0775 0.85 0.1002 0.99 Middle School 0.4508 2.23 -0.2189 0.73 0.1557 1.32 High School 0.7157 1.86 -0.0415 0.09 0.4989 3.08 Voc. High School 0.9332 1.91 -0.1506 0.35 0.7833 4.04 University 1.4301 2.38 0.1760 0.32 1.3606 6.91Urban Location 0.0743 1.52 0.1084 1.17 0.0109 0.09Regions: Aegean 0.0538 0.76 -0.1345 0.99 -0.2360 4.03 Mediterranean -0.0335 0.52 -0.1504 1.25 -0.2359 1.90 Central Anatolia -0.0072 0.10 -0.0271 0.19 -0.1047 0.61 Black Sea -0.0070 0.07 -0.1144 0.77 -0.1906 1.21 East Anatolia 0.0803 0.73 -0.0745 0.54 -0.3345 1.08 Southeast Anatolia 0.0205 0.23 0.0869 0.42 0.6826 1.98Selection Term 0.1417 0.65 -0.3677 0.78 -0.0651 0.23R-Square 0.3891 0.1844 0.3595F(K, N-K-1) 34.59 3.47 22.39SER 0.4246 0.6053 0.5799
Sample Size 941 295 737
Notes: See Notes in Table 3.
26
Table 5
Expected Wages by Sector of Employment and Gender, Turkey, 1994b
(Turkish Lira per hour)
PublicAdministration
State OwnedEnterprisesa Covered Private Sector
Variables Men Women Men Men WomenExperience: Five years 4.86 6.44* 4.48 3.98 3.67 Ten years 5.71 7.27* 6.00 5.42 4.50 Fifteen years 6.48 8.05* 7.58 6.94 5.17 Twenty years 7.13 8.64* 9.04 8.38 5.56 Twenty-five years 7.58 9.05* 10.16 9.52 5.61 Thirty years 7.81 9.36* 10.77 10.18 5.29 Thirty-five years 7.78 9.41* 10.77 10.25 4.69
Educational Attainment: Non graduate 3.96 3.09 7.27 5.12 2.98 Primary School - - 7.62 5.70 3.30 Middle School 4.49 4.15 8.50 7.16 3.49 High School 6.27 5.40 10.97 10.75 4.92 Voc. High School 7.32 6.72 12.98 11.33 6.53 University 11.91 11.04 15.23 24.16 11.64
Sample Size 3,035 941 2,603 3,855 737
Source: Author’s calculations based on wage equation estimates in Tables 3 and 4.Notes:
a. Expected wages for women SOE workers are not presented since wage equationestimates for this group was unsatisfactory due to small number of observations.
b. In the computation of the expected wages the selection terms are ignored. Therefore,they represent the expected wages in each sector for a randomly drawn individualfrom the population. For each category the expected wages are computed at themeans of the variables.
*. Indicates Statistical insignificance at five percent level.
27
Table 6
Decomposition of Public-Private Wage Differentials by Sector of Work
and Gender, Turkey, 1994
Mean Log Wage DifferentialBetween Public
Administration and CoveredPrivate Sector Workers (%)
Mean Log Wage DifferentialBetween State Owned
Enterprises and CoveredPrivate Sector Worker (%)a
Wage Differential Men Women MenTotal mean Differential
Component Attributable to: Constant Term Endowments Coefficients Selection
Total unexplained Differential
61.48
-12.9253.26-43.7864.93
-56.70
88.61
-10.7868.331.7029.36
-9.09
67.52
-2.2819.675.4944.64
3.21Source: Author’s calculations based on the wage equation estimates in Tables 3 and 4. Each of
the components are evaluated at the sample means of the variables.
Notes: a: Results for women are not presented due to poor wage equation estimates for womenin the SOEs.
Table 7
Private Rates of Return to Schooling by Sector of Work and Gender,
Turkey, 1994 (Percent)
Men Womenc
Schooling Attainment PublicAdm.
StateOwned
Enterprises
CoveredPrivateSector
PublicAdm.
CoveredPrivateSector
Primary School Middle School High School Voc. High School Universitya
Universityb
-2.0511.0916.2516.0512.18
0.92*3.668.5214.138.204.00
2.187.6113.5615.3320.2418.93
-5.648.8316.0817.8612.42
2.00*1.85*11.4420.9221.5414.43
Source: Author’s calculations based on wage equation estimates in Tables 3 and 4.Notes: a: For university education after high school.
b: For university education after vocational high school.c: Rates of return are not reported since the wage equation estimates was not satisfactory for women in SOEs.*: Indicates insignificance at five percent level.
28
Appendix Table
Means and Standard Deviations of Variables by Sector and Gender Turkey, 1994.
PublicAdministration
State OwnedEnterprises
Covered, PrivateWage Earners
Variables: Men Women Men Women Men WomenHourly Wagea 10.87
(10.3)10.67(8.70)
11.85(11.8)
9.75(8.23)
6.75(8.35)
5.06(5.59)
Log Hourly Wage 2.18(0.59)
2.20(0.54)
2.24(0.66)
2.06(0.65)
1.57(0.77)
1.31(0.72)
Age 38.05(7.97)
33.55(6.70)
37.43(8.07)
33.53(9.16)
32.32(9.56)
27.68(9.01)
Years of Schooling 10.77(3.66)
12.73(2.56)
7.28(3.34)
9.01(4.13)
6.73(3.19)
7.85(3.88)
Experience 20.29(9.17)
13.82(7.00)
23.16(9.52)
17.52(11.3)
18.59(10.4)
12.83(10.5)
Experience Square 495.7(424)
240.1(225)
626.8(480)
434.7(500)
454.3(491)
274.8(411)
Educational Attainment:b
Nongraduate 0.010 0.003 0.040 0.085 0.048 0.069 Primary School 0.169 0.020 0.524 0.227 0.602 0.410 Middle School 0.135 0.043 0.148 0.119 0.126 0.118 High School 0.317 0.329 0.190 0.383 0.143 0.275 Voc. High School 0.051 0.105 0.037 0.034 0.032 0.031 University 0.318 0.500 0.062 0.153 0.050 0.096Unearned Incomea 96.53
(250)54.93(144)
73.98(163)
38.17(77.3)
43.44(364)
15.83(81.0)
Unearned HH. Incomea 21.94(145)
12502(37903)
14.72(121)
85.70(203)
3046(18703)
104.7(537)
Land (dekars)c 2.673(20.65)
2.000(16.46)
4.884(105)
3.418(27.6)
3.594(30.8)
6.54(81.6)
Urban Locationb 0.805 0.893 0.796 0.854 0.844 0.868Regions:b
Marmara 0.088 0.105 0.119 0.153 0.276 0.328 Aegean 0.097 0.147 0.086 0.119 0.184 0.275 Mediterranean 0.130 0.152 0.116 0.193 0.128 0.143 Central Anatolia 0.197 0.181 0.168 0.119 0.170 0.103 Black Sea 0.178 0.236 0.215 0.271 0.119 0.113 East Anatolia 0.231 0.131 0.179 0.105 0.058 0.024 Southeast Anatolia 0.078 0.049 0.117 0.041 0.066 0.014Selection Term 1.209
(0.38)1.111(0.40)
1.672(0.32)
2.372(0.43)
1.521(0.37)
2.074(0.45)
Sample Size 3,035 941 2,603 295 3,855 737
Notes: a. Measured in 1987 Turkish Liras (TL).b. These are dummy variables. Their standard deviation are not reported for brevity but
may be computed from their reported means (m) as sd=(m (1-m))½.c. One dekar is thousand square meters or .247 acres.