public-private partnerships: how much should producers pay ... · how much should governments...
TRANSCRIPT

Public-private partnerships: How much should producers pay and
how much should governments subsidize area-wide programmes?
Prof John Mumford
Centre for Environmental Policy Imperial College London
FAO/IAEA Area-wide Management Conference, Vienna 24 May 2017
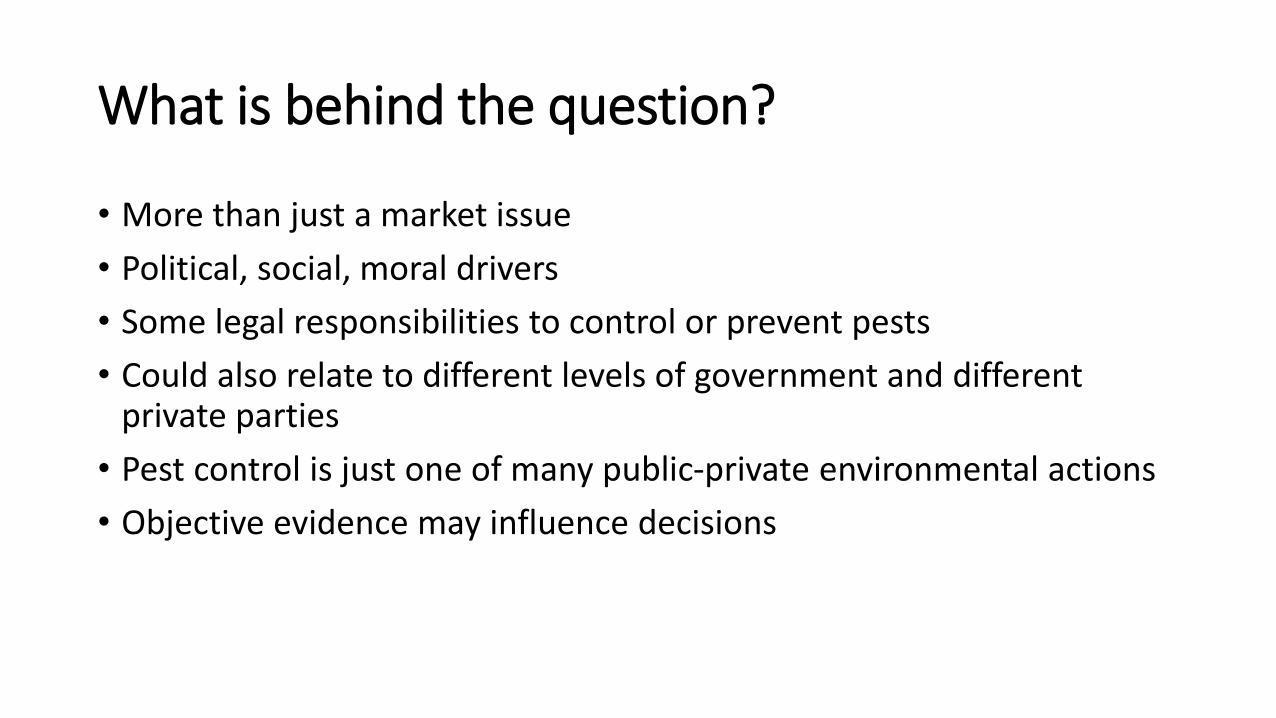
What is behind the question?
• More than just a market issue
• Political, social, moral drivers
• Some legal responsibilities to control or prevent pests
• Could also relate to different levels of government and different private parties
• Pest control is just one of many public-private environmental actions
• Objective evidence may influence decisions

Why have a partnership?
• Set priorities, make decisions, assign or share responsibility
• Who has standing to be a partner? • Senior and junior partners?
• Can a partner raise and borrow funds; be held accountable?
• What is the metric for being a stakeholder?
• What is their mandate?
• How to join, quit, invite or expel? • Status may change over time

Why share costs?
• Helps ensure sufficient resources
• Allocate shares according to some principles • Pay to assert priorities • Incentives or punishment for actions • Accountability; Link responsibility to benefits
• Helps ensure efficiency • Stakeholders have a tangible stake in keeping costs down, effectiveness up
• Only direct and additional costs? • Potential opportunity losses? • Cap liability? Who is left with the rest?

Who pays for Area-wide Control?
• Normative, political question based on values and strength
• Precedents cover the whole range of possible arrangements
• Who causes the problem, who benefits? What share?
• Who can pay? How to collect?
• What objectives? Who sets them?
• Who can act with the greatest efficiency?
• Three broad cases: • Ongoing seasonal control of established pests
• Emergency outbreak control (eradication and prevention)
• Eradication of established pests
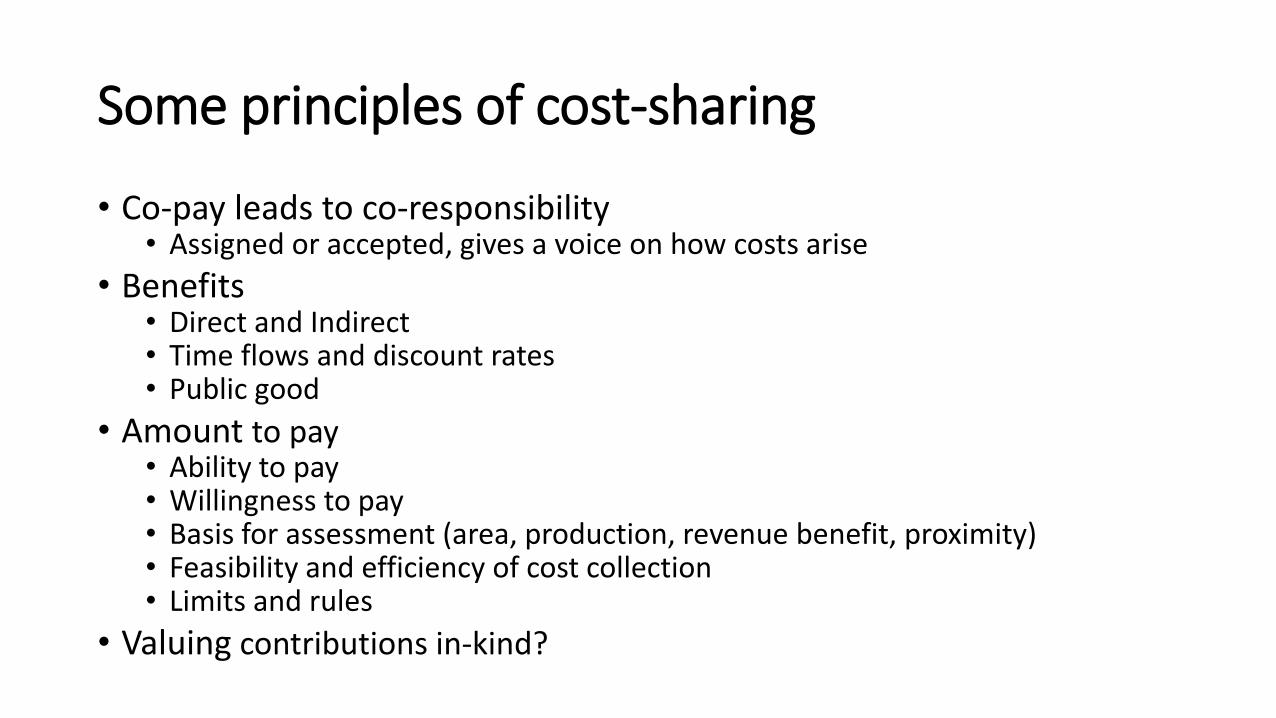
Some principles of cost-sharing
• Co-pay leads to co-responsibility • Assigned or accepted, gives a voice on how costs arise
• Benefits • Direct and Indirect • Time flows and discount rates • Public good
• Amount to pay • Ability to pay • Willingness to pay • Basis for assessment (area, production, revenue benefit, proximity) • Feasibility and efficiency of cost collection • Limits and rules
• Valuing contributions in-kind?

Public good in area-wide management
• Spatial externalities/issues • Spread potential beyond current limits, and predictability
• Pesticide pollution affecting other sectors/areas
• Inefficient inclusion of free-riders
• Vulnerable agricultural sector • Why is it valued?
• Vulnerable sectors dependent on agriculture
• Responsibility for public space as pest reservoirs

Public good in area-wide management
• Temporal externalities/issues • Uncertainty about future exotic incursions
• Likelihood of incursion independent of domestic growers
• Volume of trade, quality of foreign supplies, effectiveness of authorities
• Public-Private discount differential • 10 yr stream of $10mn: public NPV@4% =$81.11mn; private NPV@10%=$61.45mn
• $20mn represents the public good premium
• Age structure of farmers • Median farmer age is near 60yrs worldwide!
• Second oldest occupation in the USA, 13 yrs older than biological scientists
• Time horizon and aspirations for the next generation

Benefit Cost Analysis (BCA) as a basis
• Spatial, temporal, sectoral assessment • Benefits and costs
• Direct and indirect
• Space and sector dimensions change over time
• Assign present values • By area, location, production value, sector responsibility
• Choice of discount rate and time horizon is problematic
• Allocate benefits and costs by agreed criteria • Mandate for agreement?
• BCA is descriptive, not normative

Croatia Medfly SIT Outline map of SIT plan in Croatia with 1 km2 grid Benefits per cell are proportional to production (orange cells) Costs are proportional to all release cells (orange, grey, purple)
Leach, Mumford, Enkerlin FAO/IAEA BCA Model 2007

Externality €/ha of some Medfly pesticides Chemical name: Malathion Malathion Fenitrothion Chlorpyriphos Taufluvalinate Phosmet Dimethoate Spinosad Spinosad
Formulation:
50% EC Cover
spray
in aerial bait
sprays
50% EC cover
spray orchard
(Cyprus)
4% EC cover
spray
EC 22% Cover
spray
Unknown 400 EC Entrust -
Cover spray
GF-120
Naturalyte
Bait Spray
Applicator effects € 0.19 € 0.037 € 0.70 € 0.20 € 0.02 € 0.12 € 0.65 € 0.02 € 0.00003
Picker effects € 0.04 € 0.007 € 0.07 € 0.04 € 0.00 € 0.02 € 0.12 € 0.00 € 0.00001
Consumer effects € 3.60 € 0.692 € 6.49 € 3.63 € 0.38 € 2.16 € 6.05 € 0.43 € 0.00058
Ground water € 0.24 € 0.047 € 0.88 € 0.74 € 0.03 € 0.15 € 0.82 € 0.06 € 0.00008
Aquatic effects € 0.67 € 0.064 € 1.20 € 1.01 € 0.07 € 0.40 € 1.12 € 0.08 € 0.00005
Bird effects € 0.23 € 0.045 € 0.42 € 0.47 € 0.02 € 0.28 € 0.78 € 0.03 € 0.00004
Bee effects € 0.36 € 0.034 € 0.64 € 0.36 € 0.02 € 0.21 € 0.60 € 0.04 € 0.00003
Beneficials effects € 0.46 € 0.045 € 0.84 € 0.47 € 0.05 € 0.28 € 0.78 € 0.03 € 0.00004
Total € 5.80 € 0.9705 € 11.23 € 6.91 € 0.593 € 3.62 € 10.93 € 0.697 € 0.00085
EIQ 24.5 12.5 38.7 46.0 38.7 27.3 80.7 18.7 7.3
% ai in formulation 50% 96% 50% 20% 22% 50% 40% 80% 0.02%
Rate (Kg formulation per Ha) 2.50 0.25 4.50 6.30 0.60 1.50 5.25 0.19 1.00
EIQ Field Use Rating 30.6 3.0 87.0 58.0 5.1 20.5 169.4 2.8 0.00147
Country independent values, 2009 €
Leach and Mumford 2011 doi:10.1007/s00003-011-0674-7

Senegal cost – 25 km locust spray externalities
Leach, Mullié, Mumford and Waibel, 2010
€8 million total externality accounted

Senegal – District locust spray externalities
Leach, Mullié, Mumford and Waibel, 2010

Western Australia Medfly
• Three beneficiary groups identified
• WA orchards • WA home fruit tree owners • Other states, primarily South
Australia
• Benefits of eradication could be quantified
• Apportionment of costs was very difficult due to narrow and distant benefits
Mumford and Quinlan, 2001
Medfly zones, land use and LGA areas by zone
These zones are based on similar agroclimatic conditions and are provide a basis for phased eradication of Medfly
Medfly
Zone Risk
1 Esperance Med
2 Albany Med
3 Manjimup-Nannup Low
4 Bunbury-Donnybrook Med
5 Perth High
6 Perth East High
7 Geraldton High
8 Midwest High
9 North Med

Example compensation programmes - EU
• EC Solidarity funds can reimburse 50% of costs of MS outbreak control
• One outbreak case per year per MS
• Does not cover natural spread or private sector loss
• Around half EU MS have national support schemes
• Spain has largest national public scheme (Red palm weevil), from 1997 to 2009 it paid producers €24.8mn
FCEC 2010 CPHR Evaluation for DG SANCO
http://ec.europa.eu/food/plant/strategy/docs/final_report_eval_en.pdf

EC Solidarity payout, MS and total, 1999-2009
Pinewood nematode
FCEC 2010 CPHR Evaluation for DG SANCO
http://ec.europa.eu/food/plant/strategy/docs/final_report_eval_en.pdf

Example compensation programmes - USA
• Diverse schemes from government • Compensation on a case by case basis • Federal/state funded control programmes • Subsidized, all-risks industry Farm Insurance
• US Plant Protection Act 2000 specifies two cases for Federal payments: • Mormon cricket and grasshoppers (both native species) • 100% on Federal land, 50% on State land, and 33.3% of cost on private land
• Other payments discretionary; largest was citrus canker • $536mn compensation for citrus canker in Florida from 1995 through 2006 • Included payments to uproot orchards and leave the industry • Similar amount in public control costs, at least $100mn after acceptance that
eradication was no longer possible in 2006
Mumford 2011 doi:10.1007/s00003-011-0676-5

Emergency Plant Pest Response Deed
• Contract between Government and Industries (began Oct 2004)
• Pre-agreement on response to Quarantine emergencies • Share specified costs for pre-set pest category (public benefit)
• Provide and receive training needed to participate fully
• Emergency plant pests and cost shares are defined • Species included are agreed by parties
• Funding categories set by expert group and agreed by industry
• Total liability is capped to lesser of 2% of local value of production or A$20mn; or to amount agreed by all parties
• Mechanism for raising funds left to each party
http://www.planthealthaustralia.com.au

Emergency Plant Pest Response Deed
Category of EPP Government Industry
Category 1
Major environmental damage; Potential to affect human health; Significant
damage to amenity flora; Little commercial impact
100% 0%
Category 2
Significant loss of amenity, environmental value and or affects households;
Severe economic impacts on national/regional economy, large trade losses;
Impose major costs on industries
80% 20%
Category 3
Primarily harms affected industry, with some significant public cost;
Moderate national/regional economic impacts, or trade implications
50% 50%
Category 4
Little/no public cost and little/no impact on natural ecosystems;
Industries affected through some added costs, but no trade issues
20% 80%
http://www.planthealthaustralia.com.au

USA Boll weevil eradication
• Established pest since early 1900s
• 40 year eradication plan
• Federal, State, Grower cost sharing • Organise locally and pay control contractors
• About 30% from federal government • Technical support, some funds
• Grower levy based on area or production
• Some state governments matched grower funds
• County referenda for participation • Two-thirds support in referendum triggered mandatory levy of costs
https://www.aphis.usda.gov/publications/plant_health/2013/faq_boll_weevil_erad.pdf
https://www.aphis.usda.gov/plant_health/plant_pest_info/cotton_pests/downloads/bwe-map.pdf

USA Final stages of the Boll weevil eradication
LRGV 2015 Assessment: $14.00 - per dryland acre $28.00 - per irrigated acre
https://www.txbollweevil.org/Zones/lrgv.html
Photo: entoweb.okstate.edu
N Carolina maintenance levy at $1.00/ac
Issues over precedent to give private bodies power to tax for specific purposes, also basis of levies

Evolution of benefits/costs
• Early adopters get benefit of input saving and high prices
• High uncertainty in performance, but easier at edge of range
• Mid-stage has higher certainty
• Late-stage has high certainty • Lower crop prices due to production benefits
• Final stage may have higher uncertainty as reservoir is outside the country
https://www.aphis.usda.gov/plant_health/plant_pest_info/cotton_pests/downloads/bwe-map.pdf

Brazil Rio Grande do Sul Codling moth
• Area-wide eradication by traps and host removal/replacement • Eradication declared May 2014
• Action from 1991-2011
• Government: planning, management, pheromone trapping • Federal, State and Local authorities
• Orchard industry: tree removal manpower and non-host replacement trees • Over 100,000 host trees removed and replaced in urban areas
• Public persuasion to accept removal and replacement
Kovaleski and Mumford, 2007 EMBRAPA at https://www.embrapa.br/en/busca-de-noticias/-/noticia/1712390/brazil-is-free-from-codling-moth
Photo: Adelecio Kovaleski

India Mango fruit fly ME traps
• Government developed concept/recommendation
• ME lure and traps sold by private suppliers
• Local grower associations persuade neighbours to create local area-wide zones
• Extended areas of control enhance quality recognition
ISFFEI, 2014

Summary
• Area-wide Management is both a socio-economic and technical concept • Cooperation and partnership from relevant stakeholders is essential
• Need for government role to stimulate most schemes
• Precedents cover all combinations • Partnership: Complex / Simple / None
• Costs: 0-100% shared in any direction
• Area, production, proximity
• Who pays depends on sector complexity and the share of public good and private benefit
• Collaborative, proactive approach gives most effective cost-sharing and risk reduction