public procurement and growth of micro and small
TRANSCRIPT

PUBLIC PROCUREMENT AND GROWTH OF MICRO
AND SMALL ENTERPRISES IN COUNTIES IN KENYA
FRANCIS KISSINGER AMAYI
DOCTOR OF PHILOSOPHY
(Supply Chain Management)
JOMO KENYATTA UNIVERSITY OF
AGRICULTURE AND TECHNOLOGY
2019
Public Procurement and Growth of Micro and Small
Enterprises in Counties in Kenya
Francis Kissinger Amayi
A Thesis Submitted in Partial Fulfilment for the Degree of Doctor
of Philosophy in Supply Chain Management in the Jomo Kenyatta
University of Agriculture and Technology
2019
ii
DECLARATION
This thesis is my original work and has never been presented in other
University.
Signature………………………………………Date …………………………
Francis Kissinger Amayi
This thesis has been submitted for examination with my approval as University
Supervisor.
Signature………………………………………Date …………………………
Dr. Patrick Karanja Ngugi, Phd
JKUAT, Kenya
Signature………………………………………Date …………………………
Dr. David Mburu Kiarie, Phd
Dedan Kimathi, Kenya
Signature………………………………………Date …………………………
Prof. Romanus Otieno Odhiambo, Phd
MUST, Kenya

iii
ACKNOWLEDGEMENT
This study is indebted to the Almighty God for the knowledge, wisdom and
guidance throughout the period of its undertaking. Glory be to God! I further
my gratitude to my family members for unrivaled moral and material support
for successful completion of this onerous endeavor. Specifically, I wish to
recognize my grandmothers the late Orina, Veronica, my role model and
mentor Dr. Jairus B. Amayi and the family, my dear wife Happy Cara, my
angel daughter Audrey Veron, my brothers and sisters including Peter, Joyce,
Lorna, Susy, Emmanuel, Avith among others. My family too, among them my
father Omwami Washingtone Mukara, Joyce, Peter, Lorna without forgetting
Davis, Sheila, Aggie, Suzane and Maurice.
My profound regards go the JKUAT NCBD campus Director Dr. Peter Njenga,
chairman of the Entrepreneurship and Procurement Department (EPD) NCBD
Campus Dr. Mary Kamaara, my supervisors Dr. Patrick Karanja Ngugi; Dr.
David Kiarie and Professor Romanus Odhiambo, and JKUAT fraternity.
Lastly, my peers friends and colleagues Fred Ogomo, Milkah Wairimu, Berita
Tiira, Hillary, Jael, Thomas Abade, Nasiche Fred, John Mugo among others.
iv
TABLE OF CONTENTS
DECLARATION .................................................................................................................... ii
ACKNOWLEDGEMENT ....................................................................................................iii
LIST OF TABLES ............................................................................................................... vii
LIST OF APPENDICES ..................................................................................................... xii
OPERATIONAL DEFINITION OF TERMS .................................................................. xvi
ABSTRACT ......................................................................................................................... xix
CHAPTERONE ..................................................................................................................... 1
INTRODUCTION .................................................................................................................. 1
1.1 Background of the Study .............................................................................................. 1
1.2 Statement of the Problem ............................................................................................. 8
1.3 Objectives of the Study ................................................................................................ 9
1.4 Research Hypotheses ................................................................................................. 10
1.5 Justification of the Study ............................................................................................ 10
1.6 Scope of the Study ..................................................................................................... 11
1.7 Limitations of the Study ............................................................................................. 12
CHAPTER TWO ................................................................................................................. 13
LITREATURE REVIEW .................................................................................................... 13
2.1 Introduction ................................................................................................................ 13
2.2 Theoretical Review .................................................................................................... 13
2.3 Conceptual Framework .............................................................................................. 20
2.4 Empirical Literature Review ...................................................................................... 43
2.5 Critique of Literature.................................................................................................. 52

v
2.6 Summary of Literature ............................................................................................... 53
2.7 Research Gaps ............................................................................................................ 53
CHAPTER THREE ............................................................................................................. 55
RESEARCH METHODOLOGY ....................................................................................... 55
3.1 Introduction ................................................................................................................ 55
3.2 Research Design ......................................................................................................... 55
3.3 Target Population ....................................................................................................... 57
3.4 Sampling Frame ......................................................................................................... 58
3.5 Sample and Sampling technique ................................................................................ 58
3.6 Instruments of Data Collection .................................................................................. 59
3.7 Pilot Test .................................................................................................................... 60
3.8 Data Analysis and Presentation .................................................................................. 61
3.9 Ethical Issues ............................................................................................................ 66
CHAPTER FOUR ................................................................................................................ 68
RESEARCH FINDINGS AND DISCUSSIONS ................................................................ 68
4.1 Introduction ................................................................................................................ 68
4.2. Response Rate ........................................................................................................... 68
4.3 Pilot Study Results ..................................................................................................... 69
4.4 Background Information ............................................................................................ 72
4.5 Growth of MSEs ........................................................................................................ 79
4.6. Procurement Procedures ........................................................................................... 88
4.7 Procurement Contract Administration ....................................................................... 98
4.8 E-Procurement Technology ..................................................................................... 109
4.9 Bidding Capacity ...................................................................................................... 119

vi
4.10 Oversight Agencies ................................................................................................ 129
4.11 MSEs Participation in Public Procurement ............................................................ 141
4.12 Statistical Modelling .............................................................................................. 154
CHAPTER FIVE ................................................................................................................ 177
SUMMARY OF CONCLUSIONS AND RECOMMENDATIONS ............................ 177
5.1 Introduction .............................................................................................................. 177
5.2 Findings of the Study ............................................................................................... 177
5.3 Conclusions of the Study ......................................................................................... 179
5.4 Recommendations of the Study ............................................................................... 181
5.5 Knowledge Addition ................................................................................................ 183
5.6 Areas for Future Research ........................................................................................ 184
REFERENCES ................................................................................................................... 185
APPENDICES .................................................................................................................... 195

vii
LIST OF TABLES
Table 3.1: Target population for the study .......................................................................... 58
Table 3.2: Measurement of Variables ................................................................................. 67
Table 4.1: Response rate ..................................................................................................... 69
Table 4.2: Statistics for reliability test ................................................................................ 70
Table 4.3: Test for multicollinearity ................................................................................... 72
Table 4.4: Type of business................................................................................................. 73
Table 4.5: Number of Employees ....................................................................................... 74
Table 4.6: Level of Education ............................................................................................. 77
Table 4.7: Gender ................................................................................................................ 78
Table 4.8: Contract awards.................................................................................................. 82
Table 4.9: Value of Contract to MSEs ................................................................................ 84
Table 4.10: Disputed procurements .................................................................................... 86
Table 4.11: Growth parameters summary ........................................................................... 87
Table 4.12: Public Procurement and MSEs Growth ........................................................... 88
Table 4.13: Effect of procurement regulation ..................................................................... 90
Table 4.14: Financial capability .......................................................................................... 93
Table 4.15: MSE Staff Competences .................................................................................. 95
Table 4.16: Registration requirements ................................................................................ 96
Table 4.17: Procurement procedures summary ................................................................... 97
Table 4.18: Effectiveness of Contract administration ....................................................... 100

viii
Table 4.19: Contract variations ......................................................................................... 101
Table 4.20: Specifications variation .................................................................................. 102
Table 4.21: Dispute resolution .......................................................................................... 104
Table 4.22: Debriefing ...................................................................................................... 105
Table 4.23: Contract Documentation ................................................................................ 106
Table 4.24: Contract administration parameters summary ............................................... 107
Table 4.25: Effectiveness of e-procurement ..................................................................... 111
Table 4.26: ICT tools and infrastructure ........................................................................... 112
Table 4.27: Technological know-how ............................................................................... 114
Table 4.28: Flow of information ....................................................................................... 115
Table 4.29: Network Reliability ........................................................................................ 117
Table 4.30: e-Procurement parameters summary .............................................................. 117
Table 4.3: Bidding skills ................................................................................................... 122
Table 4.32: Negotiation Skills ........................................................................................... 124
Table 4.33: Competition .................................................................................................... 125
Table 4.34: Volume of Contract ........................................................................................ 127
Table 4.35: Bidding capacity summary ............................................................................ 128
Table 4.36: Competences of oversight agencies ............................................................... 133
Table 4.37: Independence and objectivity ......................................................................... 134
Table 4.38: Funding .......................................................................................................... 136
Table 4.39: Inter agency relationships .............................................................................. 137
Table 4.40: Role clarity ..................................................................................................... 139
Table 4.41: Oversight agencies summary ......................................................................... 140

ix
Table 4.42: Procurement procedures ................................................................................. 144
Table 4.43: Contract administration .................................................................................. 145
Table 4.44: e-Procurement Technology ............................................................................ 147
Table 4.45: Bidding capacity ............................................................................................ 148
Table 4.46: Oversight Agencies ........................................................................................ 150
Table 4.47: Participation ................................................................................................... 151
Table 4.48: MSEs participation summary ......................................................................... 152
Table 4.49: Test for normality .......................................................................................... 156
Table 4.50: Growth rate X1 cross tabulation ..................................................................... 158
Table 4.51: Chi-square tests .............................................................................................. 158
Table 4.52: Growth rate X2 cross tabulation ..................................................................... 159
Table 4.53: Chi-square tests .............................................................................................. 160
Table 4.54: Growth rate X3 cross tabulation ..................................................................... 161
Table 4.55: Chi-square tests .............................................................................................. 161
Table 4.56: Growth rate X4 cross tabulation ..................................................................... 162
Table 4.57: Chi-square tests .............................................................................................. 163
Table 4.58: Growth rate X5 cross tabulation ..................................................................... 164
Table 4.59: Chi-square tests .............................................................................................. 164
Table 4.60: Growth rate X6 cross tabulation ..................................................................... 165
Table 4.61: Chi-square tests .............................................................................................. 166
Table 4.62: Study Correlations ......................................................................................... 168
Table 4.63: Model Summary ............................................................................................. 169
Table 4.64: ANOVA ......................................................................................................... 170

x
Table 4.65: Regression coefficients .................................................................................. 172
xi
LIST OF FIGURES
Figure 2. 1: Conceptual framework ................................................................................ 22
Figure 4.1: Business running period ................................................................................... 75
Figure 4.2: MSEs total sales ............................................................................................... 76
Figure 4.3: Profession ......................................................................................................... 79
Figure 4.4: MSEs growth rate ............................................................................................. 81
Figure 4.5: Total debriefings ............................................................................................... 85
Figure 4.6: Past experience ................................................................................................. 92
Figure 4.7: Procedures influence ........................................................................................ 98
Figure 4.8: Equitability of opportunities ........................................................................... 109
Figure 4.9: Measure to adopt e-procurement technology ................................................. 119
Figure 4.10: MSEs Bidding Competence ......................................................................... 121
Figure 4.11: Measures to improve bidding capacity ......................................................... 129
Figure 4.12: Performance of oversight agencies ............................................................... 131
Figure 4.13: Measures to improve agencies performance ................................................ 141
Figure 4.14: Frequency of participation ............................................................................ 143
Figure 4.15: Level of participation ................................................................................... 154
Figure 4.16: Histogram for normality test ........................................................................ 156
Figure 4.17: Normal Q-Q Plot for normality .................................................................... 157
Figure 4.18: Correlation scatter diagram .......................................................................... 167
Figure 4.19: Revised conceptual framework .................................................................... 176
xii
LIST OF APPENDICES
Appendix I: Consent Letter........................................................................................... 195
Appendix II: Questionnaire .......................................................................................... 196

xiii
ABBREVIATIONS AND ACRONYMS
AO Accounting Officer
APRM African Peer Review Mechanism
BVR Bio-Voter Registration
CACL Crown Agency Company Limited
CDF Constituency Development Fund
CEO Chief Executive Officer
CG Central Government
CID Criminal Investigations Department
COMESA Common Market for Eastern and Southern Africa
CPST Centre for Parliamentary Studies Training
CTCs County Tender Committees
DPP Director of Public Prosecutions
EAC East African Community
EACC Ethics and Anti-Corruption Commission
EPD Entrepreneurship and Procurement Department
ERSA Economic Recovery Strategy Assistance
ERS Economic Recovery Strategy
ESR Economic Survey Report
GDP Gross Domestic Product
ICT Information Communications Technology
IT Information Technology
IFMIS Integrated Financial Management Information System
IPPD Integrated Personnel Payroll Database
IPR Independent Procurement Review
JKUAT Jomo Kenyatta University of Agriculture and Technology
KENAO Kenya National Audit Office
KIPPRA Kenya Institute of Policy, Planning and Research Analysis

xiv
KISM Kenya Institute of Supplies Management
LG Local Governments
MAT Multi Agency Taskforce
MDA Ministries, Departments and Agencies
MSE Micro and Small Enterprises
MSEA Micro and Small Enterprises Authority
NCBD Nairobi Central Business District
NACOSTI National Council for Science, Technology and Innovation
NCSE National Council for Small Enterprise
NSSF National Social Security Fund
ODPP Office of the Director of Public Prosecutions
OECD Organization for Economic Co-operation and Development
PDE Procurement and Disposal Entities
PFMS Public Financial Management Systems
POEA Public Officer Ethics Act
PPADA Public Procurement and Asset Disposal Act
PPARB Public Procurement Administrative Review Board
PPAREC Public Procurement Assessment Reforms and Enhanced Capacity
PPCRAB Public Procurement Complaints Review and Appeals Board
PPDA Public Procurement and Disposal Act
PPD Public Procurement Directorate
PPDR Public Procurement and Disposal Regulations
PPOA Public Procurement Oversight Authority
PPOAB Public Procurement Oversight Advisory Board
RoK Republic of Kenya
SKAs Skills, Knowledge and Aptitudes
SOPs Standard Operating Procedures
SPMA Supply Practitioners Management Act
SPSS Statistical Package for Social Sciences

xv
SRC Salaries and Remuneration Commission
TCIDP Trans Nzoia County Integrated Development Plan
UK United Kingdom
UN United Nations
VER Voluntary Early Retirement
xvi
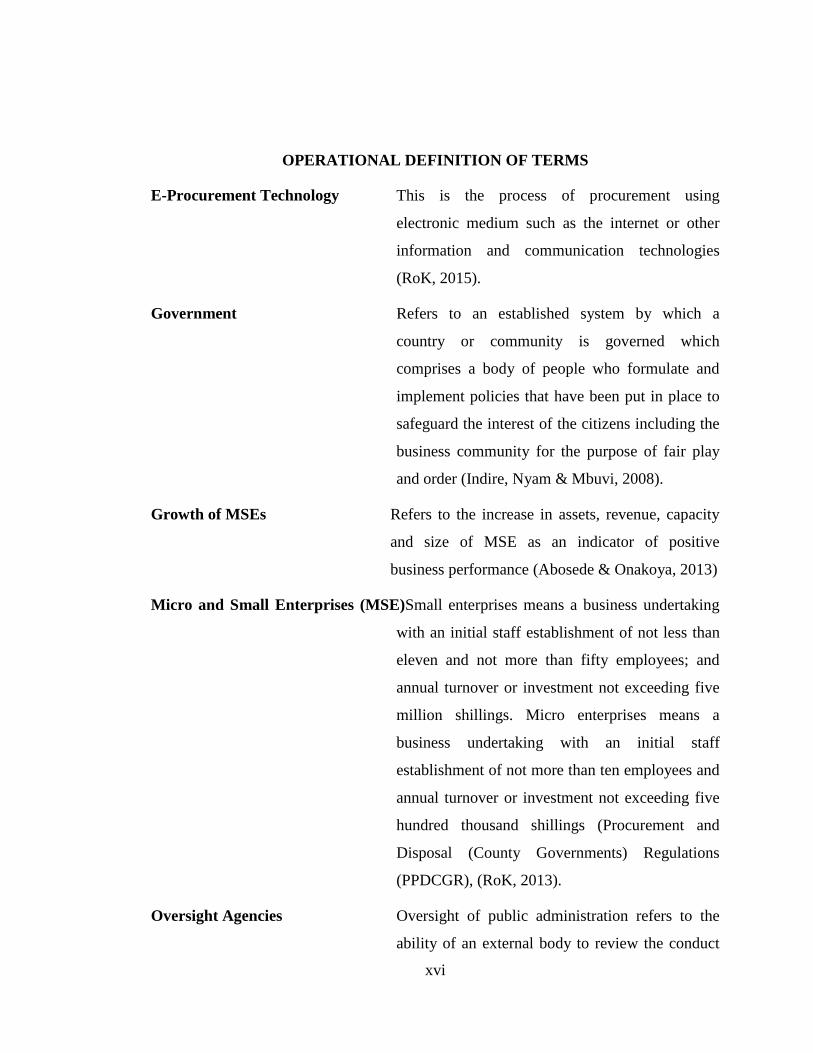
OPERATIONAL DEFINITION OF TERMS
E-Procurement Technology This is the process of procurement using
electronic medium such as the internet or other
information and communication technologies
(RoK, 2015).
Government Refers to an established system by which a
country or community is governed which
comprises a body of people who formulate and
implement policies that have been put in place to
safeguard the interest of the citizens including the
business community for the purpose of fair play
and order (Indire, Nyam & Mbuvi, 2008).
Growth of MSEs Refers to the increase in assets, revenue, capacity
and size of MSE as an indicator of positive
business performance (Abosede & Onakoya, 2013)
Micro and Small Enterprises (MSE)Small enterprises means a business undertaking
with an initial staff establishment of not less than
eleven and not more than fifty employees; and
annual turnover or investment not exceeding five
million shillings. Micro enterprises means a
business undertaking with an initial staff
establishment of not more than ten employees and
annual turnover or investment not exceeding five
hundred thousand shillings (Procurement and
Disposal (County Governments) Regulations
(PPDCGR), (RoK, 2013).
Oversight Agencies Oversight of public administration refers to the
ability of an external body to review the conduct
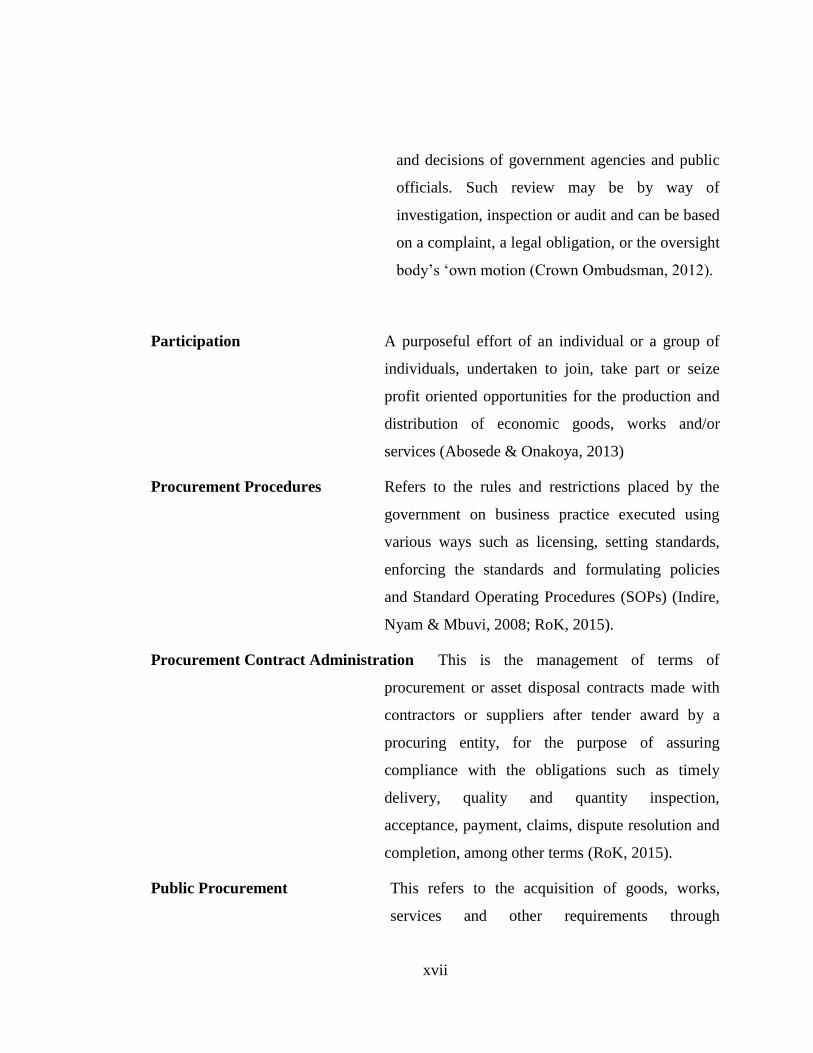
xvii
and decisions of government agencies and public
officials. Such review may be by way of
investigation, inspection or audit and can be based
on a complaint, a legal obligation, or the oversight
body’s ‘own motion (Crown Ombudsman, 2012).
Participation A purposeful effort of an individual or a group of
individuals, undertaken to join, take part or seize
profit oriented opportunities for the production and
distribution of economic goods, works and/or
services (Abosede & Onakoya, 2013)
Procurement Procedures Refers to the rules and restrictions placed by the
government on business practice executed using
various ways such as licensing, setting standards,
enforcing the standards and formulating policies
and Standard Operating Procedures (SOPs) (Indire,
Nyam & Mbuvi, 2008; RoK, 2015).
Procurement Contract Administration This is the management of terms of
procurement or asset disposal contracts made with
contractors or suppliers after tender award by a
procuring entity, for the purpose of assuring
compliance with the obligations such as timely
delivery, quality and quantity inspection,
acceptance, payment, claims, dispute resolution and
completion, among other terms (RoK, 2015).
Public Procurement This refers to the acquisition of goods, works,
services and other requirements through

xviii
contractual means by public entities using public
funds (RoK, 2015).
xix
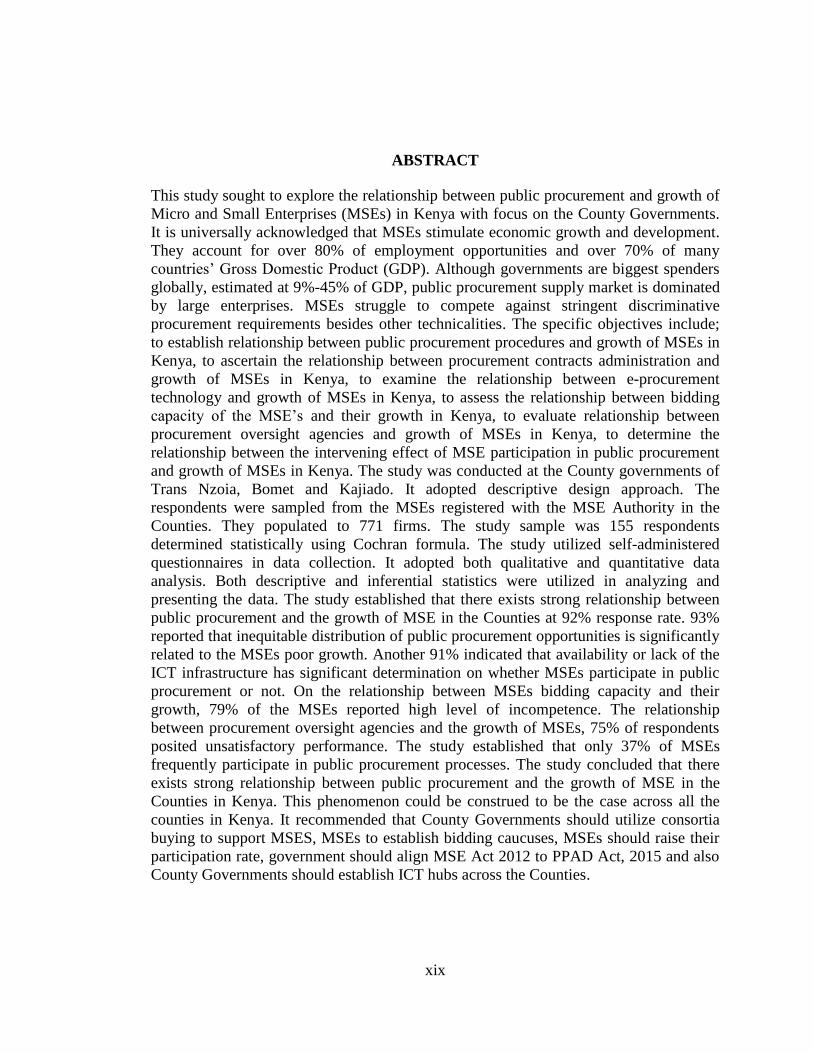
ABSTRACT
This study sought to explore the relationship between public procurement and growth of
Micro and Small Enterprises (MSEs) in Kenya with focus on the County Governments.
It is universally acknowledged that MSEs stimulate economic growth and development.
They account for over 80% of employment opportunities and over 70% of many
countries’ Gross Domestic Product (GDP). Although governments are biggest spenders
globally, estimated at 9%-45% of GDP, public procurement supply market is dominated
by large enterprises. MSEs struggle to compete against stringent discriminative
procurement requirements besides other technicalities. The specific objectives include;
to establish relationship between public procurement procedures and growth of MSEs in
Kenya, to ascertain the relationship between procurement contracts administration and
growth of MSEs in Kenya, to examine the relationship between e-procurement
technology and growth of MSEs in Kenya, to assess the relationship between bidding
capacity of the MSE’s and their growth in Kenya, to evaluate relationship between
procurement oversight agencies and growth of MSEs in Kenya, to determine the
relationship between the intervening effect of MSE participation in public procurement
and growth of MSEs in Kenya. The study was conducted at the County governments of
Trans Nzoia, Bomet and Kajiado. It adopted descriptive design approach. The
respondents were sampled from the MSEs registered with the MSE Authority in the
Counties. They populated to 771 firms. The study sample was 155 respondents
determined statistically using Cochran formula. The study utilized self-administered
questionnaires in data collection. It adopted both qualitative and quantitative data
analysis. Both descriptive and inferential statistics were utilized in analyzing and
presenting the data. The study established that there exists strong relationship between
public procurement and the growth of MSE in the Counties at 92% response rate. 93%
reported that inequitable distribution of public procurement opportunities is significantly
related to the MSEs poor growth. Another 91% indicated that availability or lack of the
ICT infrastructure has significant determination on whether MSEs participate in public
procurement or not. On the relationship between MSEs bidding capacity and their
growth, 79% of the MSEs reported high level of incompetence. The relationship
between procurement oversight agencies and the growth of MSEs, 75% of respondents
posited unsatisfactory performance. The study established that only 37% of MSEs
frequently participate in public procurement processes. The study concluded that there
exists strong relationship between public procurement and the growth of MSE in the
Counties in Kenya. This phenomenon could be construed to be the case across all the
counties in Kenya. It recommended that County Governments should utilize consortia
buying to support MSES, MSEs to establish bidding caucuses, MSEs should raise their
participation rate, government should align MSE Act 2012 to PPAD Act, 2015 and also
County Governments should establish ICT hubs across the Counties.
1
CHAPTERONE
INTRODUCTION
1.1 Background of the Study
In this study, this chapter contains background of the study, statement of the problem,
the aim and objectives of the study, hypotheses of the study, significance of the study,
the scope of the study and also limitations of the study. It serves to discuss the
background of the thesis besides stating and defining the problem being addressed,
sentiments shared by (Kombo & Tromp, 2006). In essence, the chapter gives an
indication of how the study progressed to finality.
According to Kirton (2013), excluding procurement in the defense sector, the estimated
value of global public procurement is US$ 1.5 trillion. That notwithstanding, studies
indicate that many supply chains dominated by MSEs do not generally grow as would be
desirously expected (Muiruri, 2014). The study sought to explore the influence of public
procurement on the growth of Micro and Small Enterprise (MSE) supply chains in the
county governments of Trans Nzoia, Bomet and Kajiado. Muniu and Ngugi (2013)
argue that despite its importance to the economy, the MSE sector is generally
characterized by dilapidated infrastructure, low technology, poor access to the corporate
markets and continued harassment from government agencies. This has rendered them
less competitive with almost nil chances of gaining their growth from the opportunities
offered by public procurement (Ogachi, 2013). The study is anchored on the conviction
that government expenditure is key to socio-economic growth and development around
the globe.
Bor and Githaiga (2015) argue that with the significance it carries, public procurement is
one of the Kenya government’s key areas of emphasis in poverty reduction and
employment creation. Government organizations (MDAs) across the world spend over
60% of GDP on acquisition of goods and services. In Kenya today, public procurement

2
budget stands at 65% of the government’s annual expenditure according to (Aketch &
Karanja, 2013). This is a significant amount of money which if well managed can have
far reaching positive impact on the growth and sustainability of MSEs sector especially
in the devolved government units in Kenya.
1.1.1 Micro and Small Enterprises
MSEs are not only engines of economic growth and development, but also vehicular
tools through which County governments and even national government can utilize to
achieve macro-economic growth and development, views supported by (Waithaka,
Ngugi, Aiyabei, Itunga & Kirago, 2012). They have both an active role of, and more
often than not, the potential for reliable sources of supply base in the domestic as well as
local procurement markets. Through their supply chain activities, they contribute
immensely to job creation and poverty reduction through exploitation of local natural
resources, accounting for 60%-80% of private sector employment opportunities and over
45% of many countries’ Gross Domestic Product (GDPs) (Materu, 2013). In the
European Union (EU) bloc for instance, MSE firms with less than 50 employees account
for 98.9% of all the firms in their economies while in Hong Kong they comprise 98% of
the total businesses according to (Muniu & Ngugi, 2013). This dominance should be
replicated in the public procurement contracts if governments intend to foster their
growth.
However, it saddens to note that although governments are biggest spenders globally
consuming an estimated average of 60% of the GDP as concurred by (Matindi, 2013;
Aketch (2013), public procurement supply markets are conventionally dominated by
large enterprises at the exclusion of MSEs. MSEs in the counties are struggling to
compete against stringent discriminative procurement requirements, sentiments
supported by (Njiraini & Moyi, 2006). Consequently, countries have been pursuing
varied approaches over a long time to mainstream MSEs into their public procurement

3
processes in order to make them gain growth from these opportunities (Njiraini & Moyi,
2006).
Public procurement plays a significant role in the generation of country’s wealth and it
can therefore be a vehicle through which MSEs can be shuttled to their ultimate success,
as contended by (Aketch, 2013). According to Agaba and Shipman (2008), the
Organization for Economic Cooperation and Development (OECD) estimates the value
of government procurement in the world to be over US$ 10,000 billion equivalent to
15% of world GDP and 30% of global merchandise trade. Owegi and Aligula (2006)
observe that the United States of America, regarded as the world’s biggest public buyer
whose procurement budget exceeds $200 billion annually is struggling with the
establishment of procurement policies and procedures that can support the growth of its
MSE enterprises, projected to receive on average 21% of federal government’s
contracts. In South Africa whose public procurement takes over 13% of its GDP in
regard to (Tinyu, 2011; Owegi et al 2006), the government is reportedly struggling to
reform its procurement to facilitate participation of MSEs including classifying building
and engineering contracts to promote favorable competition at the level of MSEs.
1.1.2 Growth of Micro and Small Enterprises
Despite Kirton (2013) observation that fast-growing MSE sector having great potential
for reducing unemployment, (Muiruri, 2014; Ngugi, 2013 & Waithaka, et al 2012) argue
that the MSE growth rate on average remains below 25% in the East African region,
with approximately 60% of MSEs in Kenya collapsing within their first 3 years resulting
to economic downturn. According to Pearce, Robinson and Mital (2012) government
support for MSEs participation in economic growth or its willingness to remove barriers
for fair trade can have positive influence on their growth. The government of Kenya has
seemingly been showing intention to support the growth of domestic Micro and Small
Enterprises since independence. In the 1960s, it began to develop policies and enacting
legislations aimed at ‘Africanizing’ and consequently ‘Kenyanizing’ the economy to

4
enable small scale entrepreneurs at the grass roots to play part in economic development
argues (Theuri, 2013).
However, public procurement in Kenya has historically and perpetually ignored the
MSEs since independence, because local MSE firms have been regarded as lacking
capacity to service the government with its needs, reports (Ochiri, 2011). This scenario
has been a major setback towards the growth of this important informal sector leading to
the endless ailing of entrepreneurship culture in Kenya, as contended by (Muniu &
Ngugi , 2013). Although the government had good intentions for the young independent
Kenya, the ugly face of corruption and other economic malpractices among the state
officials led to selfish, narrow personal interest taking over the common good of
Africanization spirit (Theuri, 2013).
According to Njiraini and Moyi (2006) Kenya’s public sector purchasing procedures and
practices have persistently locked out MSEs through high volume standards, need for
proof of large financial base and other pre-qualification standards. Ogachi (2013) argues
that although the government has a strategy of setting aside at least 30% of total public
procurement spend for the Kenyan youth, disabled and women owned MSEs across the
country, and the challenge lies in the implementation system that seems cumbersome,
uncoordinated and bureaucratic especially in this era of devolved government system.
The growth of MSE sector in Kenya continues to suffer from dilapidated infrastructure,
poor technology and continued harassment from the government procurement agencies
that undermine their desired growth, (Muniu & Ngugi, 2013). Thuo and Katuse (2013)
observe that executives in both private and public sector organizations so far have
recognized the importance of strategic planning, although few succeed at translating
their strategies into business results.
Mwendwa (2010) says that the major challenge that County governments face in
implementing devolution in Kenya is narrowing regional disparities in income, resource
endowment and economic development. This can be successfully achieved if the
5
devolved system can tap into and harness the available local resources through the local
MSE entrepreneurs by supporting the ‘buy county-built county’ initiatives. Devolution
being the heart of the Constitution, County governments should be the champions of the
constitutional spirit and desire to purpose to enable locals to take part in setting their
own economic, political and social agenda, (Alande & Wekhuyi, 2013). This will assist
to combat and ease unnecessary bureaucratic policies previously experienced in the
government at the expense of MSE access to government opportunities in the defunct
County Council administrations, thus hampering their growth (Mulwa, 2010). Despite
all the effort and determination however, micro and small enterprises in the Counties are
unable to grow due to lack of support from large corporate markets such as public
procurement, observe (Ogwel, Iravo & Lagat, 2016; Ongachi & Bwisa, 2013).
According to Omondi (2016) over 400,000 Kenyan MSEs collapse annually, an
indicator that government efforts to support MSEs are yet to realize the intended
objectives.
1.1.3 Public Procurement
According to Okoth (2013), Kenyan government spends approximately 70% of the
national budget on public procurement. Amayi and Ngugi (2013) observe that public
procurement system in Kenya has been undergoing transformation consistent with the
global trend since the mid-1990s to make it supportive of the socio-economic
development objectives. In this regard, Materu (2013) states that modern day
socioeconomic dynamics have resulted in the acknowledgement by Government,
development community and civil society of the importance of active participation and
involvement of MSEs in the growth of the economy and creation of employment
opportunities in Kenya. The government and other relevant stakeholders have therefore
embarked on designing programs and policies that are market driven and market non-
distorting to support the establishment and sustainable growth of MSEs as their sources
of supplies.
6
Soon after gaining independence, the government began developing policies and
enacting legislations aimed at ‘Kenyanizing’ the economy to enable small scale
entrepreneurs at the grass roots to grow and play their part in economic development,
(Theuri, 2013). This was supported through the establishment of functions such as
Industrial and Commercial Development Corporation (ICDC) to offer small industrial
loans to African entrepreneurs so as to encourage ownership of their businesses.
Although this objective could have equally been achieved by involving the MSEs in
public procurement, they have perpetually been ignored (Ochiri, 2011).
Odoro and Ngugi (2013) say that supporting entrepreneurship through public
procurement is desirable especially for County governments as a tool for combating
poverty as well as stirring economic growth and development. The public procurement
in Kenya has ignored MSEs since independence. At the time of independence and long
after, procurement was done by the Crown Agency Company Limited (CACL) on behalf
of the government because local MSE firms have been considered as lacking capacity to
service the government with its needs (Ochiri, 2011). This has denied potential medium
and small scale public organizations’ suppliers opportunity to explore their growth
through the benefits accruing from public procurement lucrative contracts even for
common user items (Amayi & Ngugi, 2013).
According to Ogachi (2013) although the government has reviewed the Public
Procurement and Disposal Regulations (PPDR) of 2006 to accommodate the Access to
Government Procurement Opportunities (AGPO) program with focus on devolution,
lack of effective compliance system is the Achilles heel of the program. This indicates
therefore that the intended benefits to the youths in particular and MSEs generally are
far from being realized (Ogachi, 2013)
7
1.1.4 Counties in Kenya
The research was conducted at the County governments of Trans Nzoia, Bomet and
Kajiado. These are public entities pursuant to Public Procurement and Asset Disposal
Act, (PPADA, 2015), Public Procurement and Disposal Preference Reservations
Amendment Regulations (PPDPRAR, 2013) and the (PPDCGR, 2013 which say that a
public procuring entity is an organization making a procurement to which they apply
including Government Ministries, Departments and Agencies (MDAs) and County
governments (RoK, 2015; RoK, 2013). All the target County Governments are located
within the Rift Valley part of Kenya.
Shikuku and Omwenga (2015) posit that Trans Nzoia, Bomet and Kajiado Counties
rank poorly among the forty seven counties in Kenya, where MSEs face hardships in
terms of growth, performance and sustainability. The problems that hindered the growth
and development of MSE as supply chains in public procurement included inadequate
institutional capacity on the part of the MSEs, limited access to government
opportunities, inhibitive legal and regulatory environment, inappropriate technology and
hostile attitude from the some of the administrative staffs (RoK, 2013).
Although the state had done a lot to remove the obstacles that prevented special interest
groups from supplying it with goods, works and services, there were still niggling issues
in the devolved government entities as agreed by (Okoth, 2013 & RoK 2013).
Cumbersome procurement procedures, inappropriate technology, inadequate governance
structures, incoherent policies and capacity constraints on the part of MSEs were among
the issues deterring their effective participation in public procurement, argue (Amayi et
al, 2013; Muniu & Ngugi , 2013; RoK, 2013 & Waithaka et al, 2012). In order to
support and grow MSEs in the devolved system of governance, chief executives across
the Counties were required establish databases of the enterprises in their areas owned by
Micro and Small Entrepreneurs and set aside specific categories of supplies they could
ably perform. This approach, if supported by appropriate Information Technology (IT)
8
systems to digitize respective operations could greatly enhance efficiency and service
delivery by both the government and the MSEs (Anyanzwa, 2013).
1.2 Statement of the Problem
Kenya’s Micro and Small Enterprises suppliers in the Counties are unable to grow,
views shared by (Ongachi & Bwisa, 2013). This is partly due to lack of support by large
corporate buyers such as public procuring entities. MSEs contribute over 60% of private
sector job creation and poverty reduction globally. They constitute between 60%-80% of
supply base in Kenya. They contribute between 16%-45% of many countries Gross
Domestic Product (GDPs), strategically posturing them as significant sources of supply
for public entities. They are pivotal vehicular engines for the growth of the domestic
industries and exploitation of natural resources at the grassroots (Ong’olo & Odhiambo,
2013). However, despite governments being biggest spenders globally consuming over
60% of the (GDP) on public procurement, as argued by (Matindi & Ngugi, 2013;
Aketch, 2013), public procurement market skewly supports growth of large enterprise
suppliers at the expense of MSEs. Consequently, the public entities not only across the
devolution spectrum, but also at the national level continue losing a key local supply
base for their requirements. The economy of the country equally lags behind as a result
of this inequitable growth of suppliers. On average, the growth of MSEs supply base
remains below 25% in the East African region as observed by (Mohamed & Mnguu,
2014; Muiruri, 2014). Approximately 400,000 MSEs in Kenya collapse annually,
leading not only to job losses and economic downturn but shrinkage of the public
procurement supply base for the local market as well as echoed by (Shikuku &
Omwenga, 2015). Trans Nzoia, Bomet and Kajiado Counties lead among the forty-seven
other counties with the least MSE growth rate, if not stagnated growth. The problems
hindering the growth and development of MSE as alternative sources of supply base in
the counties according to (TCIDP 2013-2017) include inadequate institutional capacity
on the part of the MSEs, limited access to government opportunities, inhibitive legal and
9
regulatory environment, inappropriate technology and general marginalization (RoK,
2013).
A number of studies conducted on the problem include (Mohamed & Mnguu, 2014;
Muiruri, 2014; Ngugi, 2013 & Ong’olo & Odhiambo, 2013). Poor growth rates of MSEs
could therefore be attributed inadequate market for their products. Can public
procurement market support the development and growth of MSEs as small scale
suppliers in Kenya? Despite spirited efforts by the government to allocate them
procurement opportunities including reservation of at least 30% of procurement
opportunities to MSE suppliers as provided for in the PPADA, (RoK, 2015), many
counties are unlikely to implement it because of the inherent technicalities (Ogachi,
2013). Limited studies seem to have been conducted on this problem especially on the
devolved system in Kenya and hence the cause for this study.
1.3 Objectives of the Study
This part represents the intentions and purposes, in their measurable terms of this study.
It is meant to provide opportunity for evaluating the end results of the entire research
work. It is divided into general objectives or the aim of the study and specific objectives.
General objective represents the overall goal that the study seeks to cover. Specific
objectives will operationalize the study as they represent the independent variables of
the same.
1.3.1 General Objective
The main objective of this study is to establish the relationship between public
procurement and growth of Micro and Small Enterprises (MSEs) in Kenya.
1.3.2 Specific Objectives
1. To establish the relationship between public procurement procedures and growth of
MSEs in Kenya.

10
2. To interrogate the relationship between procurement contracts administration and
growth of MSEs in Kenya.
3. To examine the relationship between e-procurement technology and growth of MSEs
in Kenya.
4. To assess the relationship between bidding capacity of the MSE’s and their growth
in Kenya.
5. To evaluate the relationship between procurement oversight agencies and the growth
of MSEs in Kenya.
6. To determine the intervening effect of participation in public procurement and the
growth of MSEs in Kenya.
1.4 Research Hypotheses
1. H1: Public procurement procedures significantly support the growth of MSEs in
Kenya.
2. H1: Procurement contract administration significantly supports the growth of
MSEs in Kenya.
3. H1: E-Procurement technology significantly supports the growth of MSEs in
Kenya.
4. H1: Bidding Capacity of MSEs does not significantly constraint the growth of
MSEs in Kenya.
5. H1: Procurement oversight agencies significantly support the growth of MSEs in
Kenya.
6. H1: MSE intervening effect of participation significantly supports growth of
MSEs in Kenya.
1.5 Justification of the Study
This study was justified on the following grounds. First of all, as Shikuku and
Omwenga, (2015) concur that County Governments of Trans Nzoia, Bomet and Kajiado

11
led the other forty seven counties as the most hard hit counties with the least MSE
growth rate coupled with multiple self-sustainability problems. Muirui (2014) shared the
sentiments and posited that the MSEs growth continues to suffer due to the poor market
environment with the biggest constraint being lack of support from the public
procurement market. The problems hindering the growth and development of MSE
supply chains in the county according to TCIDP 2013-2017 include inadequate
institutional capacity on the part of the MSEs, limited access to government
opportunities, inhibitive legal and regulatory environment, inappropriate technology
among others (RoK, 2013). Second, it is imperative to note the fact that public
procurement is governed by uniform regulatory framework and that all counties apply
the same framework in Kenya. Third, the e-procurement platform in the public sector in
Kenya, the IFMIS software, applies to all the public entities as envisaged in the PPADA,
2015 which defines a public procuring entity as an organization making a procurement
to which it applies including County governments (RoK, 2015). These enable
generalizability of the findings of the study across the devolution spectrum in the
country.
Forth, the study will help to reveal the drawbacks in the public procurement which
hinder effective participation by the MSEs to assist policy makers to strengthen the
strategies used to achieve the intended goals. Fifth, it will provide a source of reference
for future scholars in this academic domain. Sixth the society stands to gain from the
study through economic growth that will spur employment opportunities and promote
living standards of the general populace. Finally, the study will enable the researcher to
become an authority in this field of knowledge besides enabling the attainment of the
degree course to which it applies.
1.6 Scope of the Study
The study targeted all MSEs registered by the Micro and Small Enterprises Authority in
the County Governments of Trans Nzoia, Bomet and Kajiado for generalized

12
applicability of its findings. The counties are public entities pursuant to Public
Procurement and Asset Disposal Act, 2015 and the Public Procurement and Disposal
Regulations, 2006. The Act defines a public procuring entity as an organization making
a procurement to which it applies including county governments and their departments
and agencies, the national government ministries, departments and agencies (MDAs),
(RoK, (2015). According to the Micro and Small Enterprise Authority’s database the
Counties have 1,076 registered MSEs (RoK, 2014). A sample of 155 respondents,
statistically determined was picked from the MSEs to help furnish the study with the
necessary information and material relevant in developing the research.
1.7 Limitations of the Study
The major limitations of the study were that, first, it was confined to a few Counties
which were meant for generalizability to the entire country which could be limiting.
However, this was tackled by drawing a large sample size to make it more
representative, heterogeneous and generalizable. Second, the instrument for data
collection could also have been limited in its construction. This was addressed by
conducting a pilot study to ascertain its ability to be understood by the respondents and
taking necessary remedial actions. The results of the pilot study have been discussed in
detail in chapter of this study. Third, although the study assumed that all Counties
experience similar problems, it was established there were differences in experiences
occasioned by regional imbalances. This was addressed focusing the instruments of data
collection as much as possible on areas that cut across the board in public procurement.

13
CHAPTER TWO
LITREATURE REVIEW
2.1 Introduction
The government has the responsibility to ensure that the country’s development is well
controlled and coordinated for better quality of citizenry life. A number of studies have
been undertaken to explain relationship between public procurement and the growth of
Medium and Small Enterprises (MSE), but none has been focused on devolved government
system in Kenya. The underpinning principles of public procurement reforms are among
other tenets fair competition and support for the growth of the local informal sector.
However, Kenyan MSEs continue to be plagued with poor participation in public
procurement procedures thus remaining uncompetitive and exhibit lackluster performance.
This chapter contains theoretical framework, the conceptual framework, empirical
literature, critique, summary and the research gaps.
2.2 Theoretical Review
This section deals with the theoretical basis of the study seeking to determine the existing
theories that could explain the linkage between public procurement and the growth of
MSEs through the devolved government system in Kenya. Sekaran and Bougie (2013) posit
that theoretical framework is the foundation on which the entire deductive research is
based, which provides a logically developed, described and elaborated network of
associations among the variables considered relevant to the problem situation identifiable
through interviews, observations and literature review. A theory is a set of interrelated
concepts, definitions or prepositions that have been put forth to explain or predict a
scenario says (Aiyabei, 2013). According to Amayi and Ngugi (2013) the main essence of
theory is to provide an explanation to both an observed phenomenon and a tentative reality.
Theoretical review is a concrete examination of the of theories that have accumulated in
respect to an issue, phenomenon or concept which is necessary in assisting to ascertain the

14
existing theories, their relationships, extent or degree the theories have been investigated
and to develop new hypothesis to be tested. Theoretical literature is defined as lenses that
provide a view of the world (Blumberg et al, 2011).
2.2.1 Theory of Bureaucracy
Amayi et al (2013) say that the theory of bureaucracy was developed by Max Weber to
help Germany government to gain global competitiveness by becoming efficient and
effective through government control of its operations. Consequently, public organizations
have largely remained to be characterized with highly regulated governance systems with
rigid procedures, contends (Clegg, 1999). In bureaucratic systems of administration,
obedience is owed to managerial regulations because they occupy a position that is
associated with a certain level of authority and responsibility, (Jones et al, 2000). Authority
is the power to hold people accountable for their actions and to make decisions concerning
the use of organizational resources which gives the manager the right to direct and control
their subordinates’ behavior to achieve organizational goals. However, if bureaucracies are
not managed well, many problems result.
According to Clegg (1999), when managers rely too much on rules and rigid procedures to
solve problems and not on their wit, skills and judgmental capability, their behavior
becomes rigidly stereo-typed which may harm the organization and stifle creativity and
innovation. Otieno (2013) states that unwillingness to change catalyzes ineptitude in
government institutions which stifles the effective implementation of government policies
such as the AGPO policy. Rigidity in the public sector comes as a result of bureaucratic
structures in existence. This has increased red tape and lackluster performance in the public
service argue (Jones et al, 2000; Amayi et al 2013). In this respect, effective public
procurement should not only be responsive to existing situations, but also be adaptable to
the ever changing social-economic dynamics. This theory helps to demonstrate the effect of
red tape in public procurement on the MSE suppliers’ participation in the procurement
processes.

15
2.2.2 Normative Ethical Theory
Darwall (Undated) says that philosophers use normative ethical theory to refer broadly to
principles, concepts and ideals that can be cited in support of ethical judgments about cases.
As such, the investigation of normative ethical theory is unavoidable if we are to think
about ethical issues with any case. This is because the part of ethics we call morality is
modeled on law, even if other parts are not. What is wrong in a person’s undertaking is
what one can appropriately be held accountable for doing and that it warrants blame where
there is no adequate and justified reason.
Public procurement operatives work in institutional environment of increasingly intense
scrutiny and characterized by a complex array of statutes, regulations, policies and
directives observe (Eyaa & Oluka, 2011). The managers are often responsible for making a
variety of decisions which affect both internal and external stakeholders for their
organizations, (Thomason, 2013). It is therefore the management’s responsibility when
making decisions to act ethically guided by the ethical or moral principles defined by
society. Darwall (Undated) says that a manager held accountable for wrongdoing should be
capable of accepting the judgment in some sense, of being brought to see that it is a
reasonable judgment to have been made. This can help to foster integrity and moral
dealings among public procurement personnel.
Eyaa and Oluka (2011) argues that the level of professionalism in public procurement is
low or even non-existent. This according to Mosoba (2012) is the reason why procuring
entities brought before the PPARB in Kenya continue ignoring the advice of the Board and
commit the same mistakes while blaming the law instead of their own deliberate interests.
In response, several cases and controversies have characterized tendering for public
projects in critical social-economic development areas. However, Land, Riley and Cayer
(2005) argue that finding, hiring and retaining dedicated, energetic and ethical employees
with requisite skills has remained difficult especially in the public sector. This theory helps
16
to explain reasons why public procurement contract administration practices continue to be
plagued with malpractice, and thus harming MSE participation and growth.
2.2.3 Innovation Diffusion Theory
Eyaa and Oluka (2011) advance that public procurement operational environment is
increasingly facing accelerated changes driven by among other things technological
dynamisms and public and political expectations. Furthermore, many present day
organizations private and public, small and large are stymied by traditional management,
which cannot optimize the intangible resources such as the natural talents, innovation and
visionary leadership skills, opines (Sussland, 2013). Technological innovation assists a
great deal organizational performance, the way people think, behave and act which
influence the success or failure of an entity. Vittori (2013) echoes these views by stating
that technology, globalization and the emergence of new innovators are the powering force
of an innovation based economy. However, other studies indicate that majority of MSE
management are not satisfied with the results produced by their technological innovation
efforts due to lack of support from their governments.
Clegg (1999) notes that if such organizations are the form of modern condition, one cannot
help but note that this is frequently represented less as an opportune or benevolent
phenomenon but more as something which is constraining and repressive. Mumo et al
(2013) observes that ten years after the e-government directorate was set to manage ICT in
the government, Kenyans are still struggling with the manual access of government
services making it difficult for the private sector to engage profitably with the government.
This facet has led to exploitation of the procuring entities resulting in poor service delivery
to the public besides perpetuating other malpractices such as corruption. If this is not
checked, it might spill over into the devolution system and deny MSEs their opportunity to
effectively grow through public procurement system. This theory explains how e-
procurement technology continues to influence the MSE activities in public procurement in
Kenya.
17
2.2.4 Competency Models (CM) Theory
Waithaka et al (2012) observe that Competency Model (CM) is a framework that identifies
a combination of the skills, knowledge and behaviors desirable in an organization, and for
these models to be considered useful, the competences must comply with the job activities
of individuals. Muniu and Ngugi (2013) argues that such technical competences can be
achieved through training of human resources to equip organization with a pool of core
competence. According to Mallin (2013) whatever the size of MSE and/or family owned
firms, they stand to benefit from having good competences and strong governance
structures in competitive business environments. In the financial year 2013/2014, Ksh. 300
billion was up for grabs by special interest groups in Kenya which include MSEs through
participation in public procurement (Okoth 2013).
Nasio et al (2003) say that for the government to ensure that the control of the economy
does not excessively pass on to foreign investors, it should involve itself in promoting local
investors. Indire et al (2008) argue that to facilitate small business growth and
development, the government should undertake training initiatives to instill and improve
skills of the business people to enhance better management of the informal sector, with
regard to nurturing MSEs in the devolved system of governance. The theory highlights the
importance of skills, knowledge and aptitude that MSEs should possess to effectively
partake in public procurement as reliable suppliers.
2.2.5 Institutional Theory
According to Mallin (2013) although corporate governance is relatively a new
phenomenon, theories underlying it date much earlier and are drawn from a variety of
academic disciplines. They include among others the institutional theory. Eyaa and Oluka
(2011) say that there is no single universally agreed definition of institution or institutional
theory. Accordingly, institutions are composed of cultural-cognitive and regulative
elements that, together with associated activities and resources give meaning to life.
18
The three pillars of institutions include regulatory, normative and cultural cognitive. The
regulatory pillar emphasizes use of rules, laws and sanctions as enforcement mechanism,
with expedience as a basis for compliance, which is the case in county governments as
public institutions. The normative pillar refers to norms and values, social obligation being
the basis of compliance. The cultural-cognitive pillar rests on shared understanding among
the various stakeholders. In Kenya, public procurement is guided by PPADA, 2015 and
PPDR, 2006 according to (RoK, 2015; RoK, 2006), treasury circulars and guidelines which
are issued from time to time and PPOA regulations which must be complied with by all
MDAs among other statutes.
Scott (1995) and Amayi et al (2013) say that one cognitively oriented view is that a given
institution is encoded into an actor through a socialization process which when internalized
transforms a patterned behavior. When the actor behaves according to the pattern the
institution is enacted. In the same manner, institutions are produced or reproduced. After
some time, the institution becomes sedimented and taken for granted which might make it
hard to realize that the behavior within the institution is controlled and hence causing non-
compliance to the set rules and regulations. According to Meyer and Rowan (Undated)
institutional environment can strongly influence the development of formal structure in an
organization which if they improve technical efficiency in first adopting organizations
becomes legitimatized within the environment.
However, these formal structures of legitimacy can reduce efficiency in performance and
hinder the organization’s competitive position in the technical environment. Dimaggio and
Powell (Undated) conclude that to reduce the net negative effect, organizations adopt
homogenous structures because of pressures. In the public sector for instance, coercive
pressures from legal mandates or influence from other entities they are dependent upon
such as donors and development partners arise during high uncertainty times causing need
for change in organizational functioning. This theory sheds light on institutional and
organizational efficiency and effectiveness as a result of governance systems in place says

19
(Bartle, 2002). Mallin (2013) concludes that organizations with effective governance
structures tend to be more focused and open to diverse views from outsiders for sustained
economic growth and corporate social responsibility (CSR) demands. This helps to foster
objectivity and order especially when making rational managerial decisions. This theory
demonstrates the reasons as to why rules and regulation governing oversight roles in public
procurement should be observed and implemented fairly and objectively.
2.2.6 Transaction Cost Theory
According to Njiraini and Moyi (2006) transaction cost theory can be useful in unraveling
sources of barriers to firms intending to participate in public procurement. Such costs
include among other things the cost incurred in obtaining and verifying information about
the quantity and quality of goods and services and the quality of property rights to be
transferred including legal and contractual framework. According to Eyaa and Oluka
(2011), the cost of compliance with the public procurement regulations, especially on the
part of MSEs can determine whether they participate in the procurement processes or not as
well as affect many other internal and external stakeholders.
According to Bartle (2002) transaction costs originate from different backgrounds which
include bounded rationality in decision making, opportunistic tendencies of gents and
market uncertainties. Bounded rationality is the result of human limitations on the ability to
gather and process information. Opportunism is the result of self-interest while uncertainty
is the result of unforeseen difficulties embedded in every transaction. Njiraini and Moyi
(2006) says that transaction costs relating to public procurement are those costs that
enterprises incur in trying to access contracts.
In most cases, communication costs are higher for MSEs than large organizations which
hinder effective, fair and open competition among suppliers. In order to mitigate on such
problems, (Anyanzwa, 2013) states that the government needs to acquire necessary
software and hardware systems that are secure and cost effective to be used to communicate

20
and share information with the stakeholders. Besides, the MSEs should be exempted from
multiple registration requirements by the PPDPRAR which increases real costs in terms of
effort and time spent in filling myriad compliance forms (Ogachi, 2013). This theory
explains the reasons why MSEs find it difficult to exercise their ligation rights when they
become aggrieved in the public tendering system.
2.3 Conceptual Framework
This study conceptualizes that Governments are the biggest spenders globally, consuming
on average 60% of GDP, an observation echoed by (Matindi, 2013 & Aketch (2013). MSEs
find themselves locked out of public procurement by the stringent requirements set by the
MDAs. Mwendwa (2010) says that the major challenge that County governments face in
implementing devolution in Kenya is narrowing regional disparities in income, resource
endowment and economic development. Devolution being the heart of the Constitution,
governors should champion the constitutional spirit of socio-economic empowerment and
desire to enable locals to take part in setting their own economic, political and social
agenda say (Alande & Wekhuyi, 2013). Technology wise, unless County governance is
empowered to plan, execute and control their governments’ mandates, the inefficiencies of
the defunct County Council administrations are likely to crop up and bedevil these
devolved units.
Despite revision of PPDR, 2006 to create the PPDPRAR (2013) as argued by (Okoth,
2013) to lay ground for the implementation of the AGPO policy framework, there still exist
bottlenecks in its implementation considering that the PPDA of 2005 remains intact. The
study conceptualizes that with rigid public procurement procedures in place, stereotyped
contract administration practices, low adoption of advanced technology by the MSEs, weak
and outdated policy framework in place, bidding capacity constraints coupled with
ineffective moderation of procurement operations by the respective oversight agencies and
low or even non-participation in procurement glaring majority of MSEs, their access and
exploitation of public procurement opportunities has been hampered more often and it is

21
likely to persist for unforeseeable future. Figure 2.1 illustrates conceptual framework of the
study.

22
Intervening variable Dependent variable
Independent variables
Figure 2.1: Conceptual framework
Growth of
MSEs
- Increase in assets
- Increase in
contracts value
- Growth in contracts
volumes
Procurement
Procedures -Experience
-Financial ability
-Registration
requirements
Procurement
Contract
Administration
-Contract
variations
-Conflict
resolution
-No. of
debriefings
e-Procurement
Technology
-ICT Tools
availability
-System reliability
-System
confidentiality
Bidding
Capacity
-Human
resources
-Production
equipment
-Bids preparation
Oversight
Agencies
-Competences
-Funding
-Independence
MSE Participation
- Rate of
Participation.
- Bidding capacity.
- Contract
administration.
23
2.3.1 Growth of MSEs
According to Pearce, et al (2012) government support for MSEs participation in economic
growth or its willingness to remove barriers for fair trade can have positive influence on
their growth. The government of Kenya has seemingly shown intention to support the
growth of domestic Micro and Small Enterprises since independence, in 1960s when it
began developing policies and enacting legislations aimed at ‘Kenyanizing’ and
consequently ‘Africanizing’ the economy to enable small scale entrepreneurs at the grass
root to grow and play part in economic development argues (Theuri, 2013). However,
public procurement in Kenya has perpetually ignored the MSEs since independence,
because local MSE firms have been regarded as lacking capacity to service the government
with its needs, reports (Ochiri, 2011). This scenario has been a major setback towards the
growth of this important informal sector leading to the endless ailing of entrepreneurship
culture in Kenya, contends (Muniu & Ngugi , 2013). Although the government had good
intentions for the young independent Kenya, the ugly face of corruption among the state
officials led to selfish, narrow personal interest taking over the common good of
Africanization spirit (Theuri, 2013).
According to Njiraini and Moyi (2006) Kenya’s public sector purchasing procedures and
practices have persistently locked out MSEs through high volume standards, need for proof
of large financial base and other pre-qualification standards. Ogachi (2013) argues that
although the government has a strategy of setting aside 30% of total public procurement
spend for the Kenyan youth, disabled and women owned MSEs across the country, the
challenge lies in the implementation system that seems cumbersome, uncoordinated and
bureaucratic especially in this era of devolved county system. The growth of MSE sector in
Kenya continues to suffer from dilapidated infrastructure, poor technology and continued
harassment from the government procurement agencies that undermine their desired
growth, (Muniu & Ngugi , 2013). Thuo and Katuse (2013) observe that executives in both
private and public sector organizations so far have recognized the importance of strategic
planning, although few succeed at translating their strategies into business results.
24
Mwendwa (2010) says that the major challenge that County governments face in
implementing devolution in Kenya is narrowing regional disparities in income, resource
endowment and economic development. This can be successfully achieved if the devolved
system can tap into and harness the available local resources through the local MSE
entrepreneurs by supporting the ‘buy county-built county’ initiatives. Devolution being the
heart of the Constitution, County governors should be the champions of the constitutional
spirit and desire to enable locals to take part in setting their own economic, political and
social agenda, (Alande & Wekhuyi, 2013). This will assist in combating bureaucratic
policies previously experienced in the government at the expense of MSE access to
government opportunities in the defunct County Council administrations, thus hampering
their growth (Mulwa, 2010).
In order to enhance sustainable positive and expeditious growth of MSE, the County
governments should put in place entrepreneurship promoting policies with positive
externalities to enhance economic growth and development not only for the national
economy, but also for potential entrepreneurial activities at county level observe (Abosede,
et al, 2013). These programs should incorporate participatory monitoring mechanisms in
order to ensure that industrial and commercial policies perpetually depict the priorities of
the marginalized business groups. Although the government has legislated to give 30% of
its tenders to the perceived marginalized groups’ owned MSE through the AGPO program
according to RoK (2013), Ogachi (2013) observes that the categories of contracts set aside
for these groups award are based on low-value jobs such as supply of calling cards, flowers,
printing services and newspapers. This leaves the older established firms to deal in jobs
with real money further relegating MSEs to the periphery of public procurement
opportunities.
Unless County governance is empowered to plan, execute and control their governments’
mandates, the inefficiencies of the former County Council administrations are likely to crop
up and bedevil these devolved units. Okoth (2013) says that the success of this program
25
will depend on the means through which procuring entities use to disseminate information
on procurement opportunities. Although use of information technology (IT) is the most
appropriate channel, this approach is constraint in capacity reports (Anyanzwa, 2013). Most
MSEs lack comprehensive infrastructure to enable them access government tender websites
besides most Counties in particular and other public entities in general not posting their
tender notices electronically which deprive MSEs access to these opportunities as desired.
Besides the aforementioned factors, Government regulatory framework plays significant
role in limiting, constraining a right or allocating responsibility or duty to both public and
private organizations, says (Okumu, 20013). Despite revision of PPDR, 2006 to create the
PPDPRAR as echoed by (Okoth, 2013) to lay ground for the implementation of the AGPO
policy framework, Ogachi (2013) argues that there still are bottlenecks on its
implementation considering that the PPDA of 2005 remains unchanged. This scenario
impedes adherence to the government policy as the legal public procurement position lies
in the provisions of the procurement law and not the operationalizing regulations or policy
directives that seem repugnant to the provisions of the law (RoK, 2005).
Kihanya (2013) states that better government regulation initiatives play an important role to
establish simpler, more appropriate and sustainable regulatory environment for businesses
to implement their business strategies successfully. The fact that the quality and quantity of
regulation influence the way businesses develop, implement and evaluate their business
strategies at whatever level, imposes need for a friendly government policy framework
established within the statutory purview to nurture the growth of business organizations
irrespective of their size.
As regards capacity as a factor in MSE-government procurement correlation, (Muniu &
Ngugi , 2013) argue that for MSEs to be able to grow into bigger companies, they must be
capacitated to attract and retain skilled employees in their entities. This implies that human
resource is the foremost important capacity building measure that the MSEs must be
assisted to develop. Thuo et al (2013) argue that the belief that a well-defined business
26
goals and strategies will implement themselves contributes to their failure. Nothing can be
further from the truth, not even a brilliant strategy can ensure a quality implementation
devoid of competent human resource intervention.
The government should therefore underscore need for technical training of entrepreneurs at
the grass root level to equip with competitive capacity to enable them to perform well in
discharging their expected roles in regard to taking part in public procurement opportunities
according to (Indire, Nyam & Mbuvi, (2008). This is echoed by Alande (2013) who adds
that the training should not be an isolated event but strategically aligned to knowledge,
skills and ability (SKA) improvement for competitive reasons. Against this background,
Jomo Kenyatta University of Agriculture and Technology (JKUAT) underscore need for
graduates to take advantage of the devolved system of governance to stamp their authority
in the field of entrepreneurial trade skills that may spur the country’s economic
development (JKUAT, 2013). Other capacity constraints afflicting the growth of MSEs in
Kenya include poor infrastructure, poor technology, poor access to credit facilities, poor
government communication channels and inadequate access to the market and market
information (Muniu & Ngugi, 2013; Njiraini et al, 2006).
2.3.2 Public Procurement Procedures
Indire, et al (2008) posit that government participates in business in various ways including
establishment of regulatory framework and operating procedures. In Kenya, Public
procurement procedures are established and enforced by the Public Procurement and Asset
Disposal Act (PPADA, 2015) and Public Procurement, Disposal Regulations (PPDR, 2006)
and Public Procurement and Disposal Preference Reservations Amendment Regulations
(PPDPRAR), 2013 explain (RoK, 2015; RoK, 2006; RoK, 2013). According to the public
procurement statutory and regulatory frame, there are several established categories of
procurement procedures.
27
These procedures have tendencies to lock out MSEs by imposing tight regulation such as
levying high volume standards, need for proof of large financial base and other stringent
pre-qualification standards as observed by (Njiraini & Moyi , 2006). According to Amayi et
al (2013) the legal framework in Kenya is bureaucratically cumbersome to the extent of
rendering public procurement performance ineffective. According to Kenya Institute of
Supplies Management (KISM), the Kenyan Constitution calls for use of public
procurement to meet social objectives such as supporting small businesses and
disadvantaged groups through public procurement procedures (KISM, 2013).
This will assist the government to align Kenya’s Vision 2030 which relies on harnessing
private sector resources to build public infrastructure for sustainable economic growth and
development. In order to improve the management of public procurement, many countries
have come up with procurement reforms to streamline operations in Public Finance
Management Systems, (Eyaa & Oluka, 2011). Nonetheless, the challenges in public
procurement go beyond procurement rules and regulations to include process, methods,
organizational structure and work force, argue (Eyaa & Oluka, 2011). Pearce et al (2012)
argue that through tax incentives, liability protection and other forms of direct and indirect
support for the MSE business can help to foster their participation in procurement
procedures and contribute to their economic growth.
Amayi et al (2013) observed that the public procurement law in Kenya needs to be revised
in order to make it relevant and keep it in touch with the requirements of the local supply
market, government plans and constitutionalism. These amendments will allow effective
participation of the MSEs in public purchasing processes contends (Kiplagat and Leftie,
2013). Although Kenya’s ICT sector is headed for sweeping reforms likely to yield an
efficient and effective governance system, (Mumo & Wokabi, 2013) observe that the
private sector has persistently experienced hardships when engaging the public procuring
entities on the IT front owing to cumbersome procurement laws. This has negatively
28
affected the implementation of the Public Private Partnerships (PPPs) despite the existence
of the regulations guiding the initiative.
Matindi and Ngugi (2013) say that according to the National Association of State
Procurement Officials, the procurement environment of public sector has become complex
more than ever before. This is especially compounded by the advent of devolution as
reinforced by revision of procurement regulations in Kenya. Muteru (2013) observes that
Governments in the developing nations are grappling with the need to develop an
environment conducive to job creation with a view to generate employment for the high
number of new labour market entrants and reduce high structural unemployment.
To achieve this goal, entrepreneurship is desirable for counties as a tool for eradicating or
reducing poverty and stirring economic development that Kenyan counties must pursue say
(Odoro et al, 2013). In order to prepare a robust economic expansion plan and provide
economic opportunities for the county populace, the option of propagating entrepreneurship
through procurement opportunities among the MSE or informal sector has to be critically
explored. The Kenya government has placed emphasis on the development and expansion
of the microenterprise activities. This is intended to improve the business climate, build the
domestic talent, pool and develop a more entrepreneurial-driven economy. Towards this
end, evidence shows that the development of the private sector, of which micro, small and
medium-sized enterprises (SMEs) and entrepreneurship are essential elements, and a main
drivers of economic growth and employment creation as well as a fundamental factor in
poverty reduction (Muteru, 2013; Ngugi, 2012).
According to Asiago and Ngao (2013), policy change initiative should be developed in
consistency to the overall organizational heritage and identity which makes change
initiative an expression of existing strengths rather than a demonstration of areas of
weakness. This can go a long way to enhance institutional performance due to lower
resistance from the employees and other stakeholders. Economic Recovery Strategy Paper
2003-2007 states that among the reasons for poor procurement performance in Kenya have
29
been due to poor implementation of policies, mismanagement and weak institutions of
governance, (RoK, 2007). The gains made soon after independence seemingly begun on a
downward trend during the late 1980s and deteriorated in 1990s reports (Theuri, 2013). The
public service reforms that sought to deal with the economic resuscitation and revamp
government performance seem to have had limited success or even failed. This has been a
contributory factor to ineffectiveness of the MSEs in participation in the public
procurement spends.
It has also been claimed that there is no coherent policy framework governing public
procurement in Kenya that can complement and broaden the scope of continuing legislative
reforms to make public purchasing stable, predictable, less problematic and supportive of
the small-scale entrepreneurship in Kenya, (Owegi & Aligula, 2006). This is discernible
through IFMIS Re-engineering Strategic Plan 2011-2013 which states that the procurement
policy governing public procurement in Kenya needs an overhaul to make it consistent with
the changing trends in economic management and allow seamless implementation of the
IFMIS program in all MDAs in Kenya, (RoK, 2011). ERS states that clearly stated
procurement policy can be helpful in supporting and contributing to the national growth
and development strategies as enshrined in Vision 2030 (RoK, 2007).
Jones and George (2000) say that reforms bring changes in the way critical organizational
components such as organization structure, culture, strategies and communication systems
are re-engineered. In order to ensure effectively change, especially in devolved governance,
(Draft, Kendrick & Vershinina, 2010; Asiago & Ngao, 2013) say that human resources
must be adequately involved because they are the most important element of an
organization. They are in essence, the driving force towards desired change. However smart
the strategy may be without competent human capital committed to the achievement of the
strategy, it is doomed to fail. Saunders (1997) argues that public sector has not been
insulated from forces of change which have as well confronted the private sector. The
introduction and management of changes is mandatory and necessary in this part of the
30
economy as well. Various reform measures in the public procurement signal a swing away
from processes of administration to the need for processes on management, which implies a
number of changes in approach. The management of cultural change, as organizations
undergo fundamental reforms and re-organization, becomes a significant activity in this
endeavor. In essence, the preferred result should be to move away from enforcement of
defined processes and rules to the exercise of discretion. Although the government
structures do not permit a free hand in conduct of operations as implied here, there is need
to give sufficient autonomy to enable public procurement practitioners to facilitate the
achievement of the reforms objectives.
According to IFMIS Re-engineering strategy, the government failure to address the change
management and communication challenges including human resources management was
experienced in the pilot phase of IFMIS implementation which greatly contributed to the
lackluster performance of the reform initiative, reports (RoK, 2013). There is a clear
indication here of lack of adequate involvement of the human resources factor in the roll
out plan of the system which (Saunders, 1997) argues that they play an integral part in the
process of introducing change and can determine whether the efforts succeed or fail.
Globally, all successful changes involve changes in people and culture say (Draft et al,
2010). This pertains to people’s mind-set, how employees think. People change concerns
just a few employees, such as sending a handful of middle managers to a training course to
improve their leadership skills. Culture change on the contrary pertains to the organization
as a whole. Large-scale culture change, which is a pre-requisite for reforms, is however not
easy and thus the reason for poor momentum in public procurement reforms initiatives.
Change management strategy that provides buy-in by all employees to reforms can easily
facilitate faster realization of the objectives of this effort
According to Daft et al (2010) governments around the world invest heavily in change and
innovation projects but become disappointed with the results. However, Baily et al (2005)
says that the most important concern should be to first ask ourselves whether we are doing
31
the right things and if we are doing them right. Armstrong (2011) observes that it is
important to bear in mind that while those wanting change need to be constant about ends,
they have to be flexible about means. This is echoed by Asiago and Ngao (2013) who argue
that effective organizational policies should be flexible, agile and responsive to
environmental conditions with home grown input from the internal employees rather than
relying heavily on external consultants.
Employees resist change, many of them for no apparent reason. It is important to get all
stakeholders to understand the need for change as the first step in implementation.
Managers and employees who are not involved in a given innovation often seem to prefer
the status quo. This therefore requires that the change champions should seek to understand
the underlying reasons for resistance by other stakeholders, which can then help them to
implement change more effectively. Asiago and Ngao, 2013) argue that organization’s
policies assist to create efficiency and effectiveness. The ability of an organization to
change or modify processes in anticipation of environmental shift therefore remains key to
improving its policies.
2.3.3 Procurement Contract Administration
In order to enable the government to achieve the public procurement objectives as
enshrined in the PPADA, 2005 and other regulatory framework, procurement personnel
should exercise high levels of professionalism in the discharge of their mandates argues
(Aketch, 2013). According to Eyaa and Oluka (2011), the overall area where public
procurement management at both the Central Government (CG) and Local Government
(LG) Procurement and Disposal Entities (PDEs) score the lowest is in respect to contract
award and contract management and administration. This is so because public procurement
is vulnerable to all manner of irregularities such as bribery and bid rigging. Aketch and
Karanja (2013) observe that public procurement irregularities are most likely to occur in
public utility funding activities such as award and general administration of public
contracts.
32
Arguably, improper and ill-driven contract administration approach among the PDEs has
perpetually locked out MSEs in the mainstream procurement activities in Kenya. Although
the Constitution of Kenya 2010 seeks to protect and promote social-economic development
of local and communities marginalized groups to ensure equitable sharing of national as
well as local resources through devolution, RoK (2010), Shiundu and Rotich (2013) posit
that proverbially, an organization is as effective as its applied governance styles,
management attitudes and approaches of the executives. Management executives in
counties should provide the pivot point upon which all aspects of organizational
functioning revolve, says (Amayi, 2013). This is because decisions about overall strategic
planning and organizational management are the responsibility of the chief executive
officers (CEOs) and their immediate subordinates. However, such decisions should be
complemented with appropriate management attributes which take on board all
stakeholders for sustainable positive results.
In the views of Mallin (2013) effective governance structures tend to have a more focused
view of business with willingness to take into account the benefit from external
constructive views for the betterment of the general good. Odunga (2013) argues that some
county governors in Kenya rarely consult on important matters of public interest.
Consequently, the Senate parliament is seeking to enact a law that will give emphasis on
participation by the county inhabitants in matters that concern their socio-economic and
political wellbeing. The law will help to compel good governance in the counties and lead
to the establishment of structures for effective citizen participation in the county affairs
which will enhance transparency and accountability in public projects management.
In the effort to counter the move and perpetuate the status quo, Njoroge and Wainaina,
(2013) report that the county governance is vehemently opposed to the Senate’s move
claiming a scheme to usurp their executive powers. According to Msimangira (2003)
purchasing department has been traditionally ignored in most organizations with top
management perpetually playing it second fiddle to other department starving the function

33
of necessary support for effective functioning. It is considered as a cost center without due
consideration to the immense economic potential that the function contributes to the
national economic growth.
These drawbacks are likely to derail the Constitutional spirit as well the premise of Kenya
Vision 2013 of devolving economic power to the grass roots to stir growth through MSEs
and the rural small scale entrepreneurs. If effective laws are enacted, especially with regard
to public procurement management at the County level forcing the government to buy
locally, the ailing domestic industries will be revived, (Wafula & Kiplangat, 2013). This is
the viable strategy to ensure support and growth of MSEs through procurement in the
devolved system of governance.
Theuri (2013) argues that Africanization policies at independence in Kenya were successful
in small towns more than in big towns. Small-scale entrepreneurs succeeded especially in
agricultural production, leading to injection over Ksh. 42 million into the economy
annually. This supports the fact that growth conscious administration in a devolved
government system is an asset to economic empowerment of the small and medium
business enterprises. For an organization to have a good administrative system, the solution
is through collaborative investment and partnership with stakeholders, (Wekesa, 2013).
This attribute is conspicuously lacking on the public procurement-MSE participation front
and should be cultivated and nurtured by the devolved government at the county level.
2.3.4 E-Procurement Technology
Electronic procurement (e-procurement) which is a component of ICT, arguably, leads to
more market transactions, improves market transparency, lowers search and supplier
switching costs besides improving the overall management of supply chains as concurred
by (Aketch & Karanja, 2013 & Eyaa & Oluka, 2011). However, Aketch and Karanja,
(2013) argue that despite the aforementioned influence of ICT on procurement
performance, it is disheartening to note that its implementation in most Kenyan entities is
34
poor. According to Pearce (2012) firms in competitive market environment must strive to
understand both the existing technological advances and the probable future advances that
can affect their products and service delivery. This is likely to offer competitive advantage
especially in identifying and ceasing business opportunities within the environment.
According to JKUAT, slackened socio-economic growth and development in East Africa
(EA) is attributable to slow uptake and commercialization of locally generated social and
scientific technological innovations, (JKUAT, 2013). This owes to inadequate
infrastructure and lack of political goodwill to support the appropriate rate of growth of
technology in the region. In the same spirit, Shiundu and Rotich (2013) argue that the
objective of IT in procurement should be two-fold; to enable the wide variety of purchasing
transactions on which organizations depend to be done accountably and transparently and
also arm decision-makers at every level with meaningful and actionable information in a
predictable, fair and easily accessible manner.
Apparently, Kenya’s commercial spheres seem to be gathering steam technologically
according to (Anyanzwa, 2013). This is compounded by the fact that Kenyan traders
importing and exporting their cargo in the EAC region are currently taking less time in
processing clearance of their goods as a result of growing effort of digitizing files in the
public sector. The ease and availability of Internet technologies is assisting to increase the
marketplace for online e-tailers, says (Pearce, 2013). Grounded in this, it is deducible that
the interaction between the public buying entities and the special interest groups, MSEs
included should therefore be managed by adopting Internet based business engagement
approach. Kenya’s ongoing ICT sector’s sweeping reforms as argued by Mumo (2013) are
likely to yield an efficient and effective public procurement system.
In the past, manual systems that characterized the public sector processes have been a
deterrent to effective participation of the private sector, especially the MSEs in government
procurement opportunities. Chopra et al (2010) says that information is crucial to the
performance of a supply chain because it provides the basis on which supply chain

35
managers make decisions. Information Technology (IT) consists of the tools used to gain
awareness of information, analyze this information and execute on it to increase the
performance of the supply chain. ICT facilitates knowledge management by transforming
data into information and knowledge, and share all across the enterprise, (Draft et al, 2010).
It is a key supply chain drive that glues and allows the other supply chain drivers, to work
together with the goal of creating an integrated, coordinated supply chain. A supply chain
can be effective only if all stakeholders within the supply chain share a common reasoning
about the information that they have to make decisions for competitive advantage and
economic sustainability.
Different information with different stakeholders results in misaligned action plans that hurt
supply chain players. ERS states that achieving the government objectives of public
expenditure reforms require the government to implement improvement in the reporting
and accountability by establishing regular reporting flows in and out of public accounts,
implementing the IFMIS and strengthening oversight bodies and automating the internal
audit function, (RoK, 2003). According to Owegi (2006) reforms in Kenya’s public
procurement are expected to focus on four major areas which earlier legislative and
institutional reforms overlooked. Among these areas include application of ICT in
procurement reforms. Besides promoting economic cooperation, integration of government
procurement markets by regional blocs can realize major scale economies and stimulate
growth through trade links. It is worth to note that the initiatives by the PPD to formulate
joint public procurement directives within COMESA and establish common thresholds,
plus an IT public procurement support system within EAC, remain formless as long as no
domestic policy detailing what public procurement is expected to achieve and how. A broad
policy framework addressing this concern can be helpful in sustaining the gains from past
public procurement reforms and ensure that the envisaged initiatives eventuate.
These observations sound reasonable and logically coherent in this context. However, there
exists long term jittery among the government employees that with full operationalization
36
of ICT in the public sector, the danger of loss of employment impends them. This is
traceable from ERS report that the government has been carrying out civil service reforms
over the past decade focusing on downsizing the core civil service which has seen over
79,000 civil servants lose jobs in 2002 through Voluntary Early Retirement scheme and
compulsory retrenchment, reports (RoK, 2003).
This drives the employees to silently frustrate any effort by the government to deploy the
technology in cutting its operational costs and improve service delivery efficiency and
effectiveness. Unless this aspect of reform is mutually implemented, the overall public
reforms initiative will remain a mirage for as long as the issues remain unaddressed.
However, public employees should note that resisting the introduction of new efficient
approaches and to perpetuate the less effective and less efficient processes by any force
could spell danger to all economic players in the long run. The UN (2006) reports that for
an organization to be able to successfully implement e-procurement, those involved in the
procurement function need to understand the e-procurement concepts and tools so as to
provide input into their development, use, evaluation and refinement as a means of
improving procurement efficiency, effectiveness objectives. The study thus establishes that
procurement officers can make useful contribution to decisions about investment in, and
configuration and use of e-procurement tools in many ways including having general
understanding of the various e-procurement applications, understanding the sources of e-
procurement benefits and identifying the procurement processes that are effectively
supported by e-procurement. This requires a professional supply chain complete with
technically qualified personnel. Such staffs will have a better understanding of need to
reform the system and offer positive contribution toward the same course.
The most successful e-procurement implementations have been driven by those who best
understand the procurement processes and the outcomes to be achieved from deploying ICT
in decision making. Unfortunately, Burt et al (2004) argue that it is common to ascertain
that transaction-based procurement system has been purchased, implemented, operated and
37
maintained with almost no input or participation from supply chain management. These
systems may be acquired on the strength of purging costs of full time employees (FTE)
which does not discriminate between individuals performing tactical and strategic value-
added activities. Such purging increases future problems since few professionals are left to
contribute during the critical requirements development process.
However, information only becomes knowledge when a person absorbs it and puts it to use,
(Draft et al, 2010). The government should therefore embrace knowledge management as
an effective tool for change if it intends to enhance its reform agenda. Despite the
deployment of IT being a major boost for procurement reforms, Choppra et al, (2010) opine
that when organizations switch over to new systems without proper integration, the new
system is unable to perform all that was, for the purpose of this study support for MSE to
take part in public procurement. It may even perform worse than the system being replaced.
It therefore remains a delicate balance to actually make the transition over to the newer
ways of doing business. Nevertheless, Aketch and Karanja (2013) sum it up that e-
procurement is still at its nascent stages in Kenya, with for instance, only 33% of the textile
and apparel firms having implemented e-procurement strategies.
2.3.5 Bidding Capacity
Nasio et al (2003) say that for the government to ensure that the control of the economy
does not excessively pass on to foreign investors, it involves itself in regulating and
promoting the growth of local investors. Indire et al (2008) argue that to facilitate small
business growth and development, the government should commit to undertake training
initiatives to impart and improve skills of the business people to enhance better
management of the informal business sector, with regard to nurturing MSEs at the grass
root economies. According to Mumuni and Insah (2013) entrepreneurs play an important
role in local economies in developing countries through employment creation and
livelihood sustainability for the rural fork. Through entrepreneurship, people’s purchasing
power grows thus supporting industrialization and macro-economic growth. JKUAT (2013)
38
reports that in order to support innovative programs that can promote entrepreneurship and
create a pool of indigenous, skilled, adaptive and competent human capital capable of
stimulating the region’s socio-economic development, universities should work closely
with MSEs and young entrepreneurs to enhance their capacity. Alande (2013) blames
inadequacy in staff training both technically and experientially, technology and financially
for poor performance of County governments as they reduce effective capacity for service
delivery. However, training-based capacity makes more sense when coupled with
competence-based capacity. According to Shiundu and Rotich (2013), competent
procurement related decisions are those based on rules and analysis with sufficient
organizational experience which enhances responsiveness to citizens’ expectations and
aspirations.
Although the Integrated Financial Management Information System (IFMIS) was intended
to enhance operational and control capacity in the public financial management reform
effort, many key activities are still undertaken outside the system albeit the IFMIS
capabilities to achieve full automation of these manual processes, (RoK, 2013). The IFMIS
strategic plan seeks to identify the political, administrative and capacity constraints that
require rigorous interventions in order to secure the buy-in and ownership attributes
necessary within MDAs to facilitate effective implementation of IFMIS and improve the
confidence of all relevant stakeholders. This owes to a surprising trend that in most entities,
procurement systems have been basically built for financial reporting and budgeting
purposes, and are hence not set up primarily to furnish sufficient information about
procurement performance, (Shiundu et al, 2013). It has therefore remained as a drawback to
effective assessment by the policy makers on determination of the ratio of MSE to large
enterprise participation in public procurement opportunities. As such, large enterprises have
persistently had a field day in government procurement at the expense of MSEs.
Besides, the re-engineering of IFMIS may not achieve much unless the government
professionalizes the public procurement function with necessary and relevant human

39
capital. This area has been marred by corruption and ineptitude, due to deployment of non-
professionals to manage public procurement against the requirement of the Supply
Practitioners Management Act (SPMA), 2007), argue (Amayi et al, 2013). Technology
impacts on the development of business conditions and creates new opportunities for
suppliers, producers and customers. The personnel in public procurement can determine the
extent to which the government takes advantage of ICT. Failure to recognize and exploit
such innovations may jeopardize the future of public organizations.
Kihanya, (2013) argues that financial capability is instrumental in the determination of
whether an organization succeeds or fails. The government should therefore establish
favorable financing structures and modalities to facilitate MSEs in developing their
financial base in to enable them to effectively take part in public procurement opportunities.
Okoth (2013) observes that government suppliers suffer financial constraints due to delayed
payments forcing them to halt operations because they tend to spend a lot of money upfront
but get paid much later. For the MSEs, especially at the county level, this is a big financial
blow because most of them operate on a shoe string budget due to inadequate or
unfavorable financing sources.
2.3.6 Procurement Oversight Agencies
PPDA, 2005, PPDR, 2006 as amended by PPDCGR, 2013 vest supreme authority of public
procurement decisions in PDEs’ tender committees, sentiments echoed by (RoK, (2015;
RoK, 2006 & RoK, 2013). Some of the authority is further delegated to other oversight
agencies such as PPRA’s complaints review and administrative board, EACC, KENAO and
even the internal audit divisions.
The basic purpose for establishment of the oversight agencies by public procurement
regulatory framework is to assist in striking a moderated balance not only in the way
procurement and its accompanying processes and technologies is structured, but in how the
various roles, responsibilities and decision rights are allocated between procuring entities

40
and other stakeholders, say (Shiundu et al, 2013). This puts public tender awarding
authorities in a pivotal position in the adjudication of government procurement processes.
Consequently, the onus of effective participation of all categories of suppliers including
MSEs in public procurement lies with these authorities.
Manual for Centre for Parliamentary Studies Training (CPST) states that it is important that
tender awarding and oversight authorities have the appropriate competences to properly
assess, rationalize, and afford equal public procurement opportunities to all potential
bidders, (RoK, 2015). However, unless proper ethical standards are observed in the
discharge of their mandate, bias will arise and the weaker firms may not benefit from public
procurement processes. It therefore requires tender committees to be constituted from a
team of officers with sufficient and relevant managerial experience, knowledge, confidence
and competences. According to Asiago and (Ngao, 2013), despite the recognition of the
value of managerial experience in converting organizations’ resources into societally
beneficial plans in the public sector, little effort and attention have been devoted to
developing an experience-based cross functional team of public executives to serve in
procurement oversight committees.
Kenya National Audit Office (KENAO) report in 2008-2009 financial year states that this
has rendered the quality of procurement and procurement related decisions in public entities
ineffective and costly at the expense of the general Kenyan society, (RoK, 2009). This
should be a reason enough to compel the government in general and County Governments
in particular to acclimatize with the global trends in this respect through effective
benchmarking or risk being irrelevant in today’s dynamic socio-economic and political
environment. As observed by Eyaa and Oluka, (2011) many corporate members in Africa,
especially in state owned PDEs have limited understanding of their oversight roles and are
usually open to manipulation by principal shareholders, due to among other factors, their
incompetence. In order to ensure that they deliver on their mandate, the oversight agencies
should pool together their team-specific experiences to make and implement decisions with

41
positive impact of the public procurement processes on the economy for the benefit of the
local business community that comprises over 70% MSEs, argue (Asiago & Ngao, 2013;
Ngugi, 2012 & Muniu & Ngugi, 2013). This can be achieved through the engagement of
fair and constructive discussions and debates on strategic decisions during their committee
sittings in adjudicating on suppliers’ determination, selection and contract awards.
2.3.7 MSE Participation
Expanding the participation of MSEs in the tendering processes has numerous benefits for
poverty reduction and sustainable growth and development (Kirton, 2013). There exists
interventional relationship between the independent variables of this study and the
dependent variable. Bougie and Sekaran (2013) observe that whereas independent variables
help in explaining the co-variance in the dependent variables, the intervening variable
exerts contingent effect on the relationship between the two variables owing to their
interactional relationships. Bougie and Sekaran (2013) further advance that unless there is
the presence of a intervening variable, the theorized relationship between the independent
and dependent variables cannot be sustained which is the case for participation as an
intervening variable in this study.
According to the Ministry of Industrialization and Enterprise Development, lack of vibrant
market for the MSE products inhibits their growth and competitiveness, (RoK, 2013).
Njiraini and Moyi (2006) contend that one of the innovative ways in which countries
should be dealing with the MSE market access constraint is by enhancing participation of
MSEs in public procurement since it provides an important market for MSEs and offers
them an opportunity to overcome the market constraint.
In Kenya however, public sector purchasing practices tend to lock out MSEs through high
volume standards of pre-requisite requirements for participation. Yusuf and Mnguu (2014)
argue that high cost of compliance to regulations usually discourage the potential MSEs
from doing business with the government and in most cases drives the existing enterprises
42
out of business. In an effort to remedy this phenomenon, the government is seeking to
upgrade the dilapidated MSE infrastructure in order to incorporate the sector into the
mainstream economic development activities for their growth and self-sustainability (RoK,
2013).
This trend has been a long time ridicule for the government as reflected in Muteru (2013)
argument that for quite some time, governments in the developing nations have been
grappling with the need to develop an environment conducive to job creation with a view to
generate employment for the high number of new labour market entrants and reduce high
structural unemployment without much breakthrough. Increasing the level of aggregate
demand through the expansion of public procurement budgets and the introduction of active
labour market policies is therefore the way to go. In order to achieve this goal, it is
imperative to prepare for economic expansion, providing economic opportunities for the
populace through entrepreneurship in the MSE sector. To stimulate economic activity and
growth and to ultimately reduce unemployment, the Kenya government has placed
emphasis in the development and expansion of the microenterprise activities.
This is also intended to improve the business climate, build the domestic talent pool and
develop a more entrepreneurial-driven economy. This is a stimulant for demand for the
goods, works and services which leads to demand for more investment. Arguably, and as
(Shahnazi & Gharagoz, 2014) contend, the importance of investment as a driving force for
economic growth and development world over cannot be overstated. In the Keynesian
expenditure model of accounting for the national income as put forth by Jhingan (1989)
the government expenditure ‘G’ component is crucial in influencing economic growth in a
given economy. The model comprises of the following variables Y= C+I+G+(X-M). Where
‘Y’ represents the national income, ‘C’ denotes consumption expenditure, ‘I’ equals to the
investment expenditure, ‘G’ relates to government expenditure while (X-M) are the exports
less imports.
43
According to the model, the government expenditure in the ‘G’ component, especially on
acquisition of goods, works and services influences the income of suppliers which affects
their investment decisions in the economy. This owes to the fact that government is the
largest sole buyer of all goods and services produced in a given economy. Owegi and
Aligula (2006) note that governments across the globe are major buyers or in some cases
the only buyers of goods and services and that governments in developing countries have
significant influence on the size, structure, conduct and performance of industries. Since
they utilize public funds from taxes and other public sources aimed at re-distribution
purposes, according to (Lysons & Farrington, 2010). The re-distribution should therefore
be as equitable as relevance and socio-economic objectives of the government permit. All
stakeholders in the economy including the most crucial ones such as the MSEs should be
adequately supported to participate in government buying process to enhance their
competitiveness and sustainable growth.
2.4 Empirical Literature Review
This section is concerned with review if literature material from various sources. It covers
both published and unpublished written materials by various groups of authors. According
to Sekaran and Bougie (2013), this is a careful review of textbooks, journals, conference
proceedings and other published and unpublished materials. This section is structured along
the variables as the sub-headings in order to allow for strategic alignment of the entire
study to the variable.
2.4.1 Growth of MSEs
Njiraini and Moyi (2006) conducted a study titled Supporting MSEs to Access Public
Procurement Market in Kenya. The study was published by the Kenya Institute of Public
Policy and Research Analysis (KIPPRA) in Nairobi. The main objective of the study was to
analyze how MSEs in Kenya can be integrated into the public procurement processes. The
paper analyzed public procurement policies, laws, institutions, procedures and practices

44
with view to identifying inherent barriers to participation by Micro and Small Enterprises
sector in Kenya.
In order to achieve its objectives, the study adopted descriptive design approach. The study
found out that there are several barriers facing MSEs in public procurement in Kenya.
These include among others inhibitive technical documentation, slow payment cycles,
bundling of public procurement contracts, costly and tedious government procedures,
inaccessibility to procurement information, limited capacity, and costly tender security
guarantees requirement. The study concluded that public procurement market in Keya is
huge estimated at 9.07% of GDP. It was also noted that despite good intentions of the
policy to reserve 25% of government tenders for the MSEs vide Sessional Paper No 2 of
2005, which has since been raised to 30% through the AGPO policy framework, according
to Chai (2013), there lacks implementable strategies and guidelines specifying how MSEs
would take advantage of the policy proposal.
Picking from this cue, the study recommended two major interventions. It states that the
government should establish the National Council for Small Enterprise (NCSE) which
would cope with the inefficiencies of poorly functioning public procurement system by
absorbing significant amounts of the transaction costs for both the MSEs and the
government. Second intervention is to harmonize procurement policies and regulations.
Kenya lacks an explicit public procurement policy and hence need to develop a
comprehensive procurement policy and harmonize it with the procurement law (RoK,
2005). This would in effect reduce the high fixed and transaction cost associated with
conducting business with the government in uncertain and complex environment.
Furthermore, the affirmative policy of reserving 30% of all government procurement
tenders for the MSEs sector should be translated into an additional market for the MSEs
coming through public procurement.
45
2.4.2 Public Procurement Procedures
Mnguu and Mohamed (2014) in their thesis titled Fiscal and Monetary Policies: Challenges
for Small and Medium Enterprises (SMEs) Development in Tanzania published by the
International Journal of Social Sciences and Entrepreneurship sought to evaluate challenges
afflicting the growth and development of SMEs in the Tanzanian economy. Among the
specific objectives was an objective to evaluate the effect of SMEs capacity to tap and
utilize the opportunities offered by the fiscal and monetary policies by the government. The
study used secondary data by reviewing previous research reports relevant to its problem.
Among the factors found out to be limiting the participation and growth of SMEs include
complex, bureaucratic and costly legal, regulatory and administrative environment. These
disadvantage the SMEs against their large sized enterprise counterparts. The high cost of
compliance to regulations discourage the potentiality of SMEs to their businesses, while
driving some of the existing enterprises out of business and rendering joblessness to their
employees and the economy at large. Other inhibitive factors for the survival of SMEs were
found to be tight registration procedures, vague regulative policies, inadequate
infrastructure and bureaucratic processing time (Mohamed & Mnguu, 2014).
As a way forward, the study recommended that there should be practical advocacy plan
tailored for the SME Development at the national level. This would encourage and help
SME-government links to play their part effectively in national dialogues that help to set
the strategic frameworks for growth and development as well as employment creation and
poverty reduction. Mohamed and Mnguu (2014) contended that there is also need to
promote policy coherence at national, regional and international level so that trade and
investment policies are aligned with the national SME development objectives in respect to
opportunities offered by public procurement.
46
2.4.3 Procurement Contract Administration
Owegi and Aligula (2006) conducted a research titled Public Procurement in Kenya: The
Need for a Coherent Policy Framework. The study was published by the Kenya Institute of
Public Policy and Research Analysis (KIPPRA) in Nairobi. In the objectives, they sought to
analyze trends in Kenya’s public procurement system since independence on the growth of
the economy. From this study, it was noted that besides its business objectives, public
procurement is an instrument for the attainment of broader national socio-economic
objectives such as supporting employment of citizens and income creation as well as
promoting the growth of indigenous MSEs. The study notes that since governments across
the globe are major buyers or in some cases the only buyers of goods and services,
governments in developing countries have significant influence on the size, structure,
conduct and performance of national industries.
Through objective contract administration in the public procurement, governments can
determine entry, growth and/or exit of firms within an industry. However, whereas public
procurement has great significance for the growth of a country’s economy, it has its
limitations and failures. It is normally blunted and even perverted by misuse. For instance,
preferential and discriminatory public purchasing is used as a guise to favour constituencies
associated established business organizations and prominent individuals rather than as a
strategy to improve legitimately marginalized sectors (Owegi & Aligula, 2006).
Owegi and Aligula (2006) study concludes that the subject of public procurement in Kenya
has never been far from controversy. There have been many allegations of unscrupulous
behavior regarding the public procurement contract administration in both the central and
devolved government entities leveled against the public officers. The most outstanding
cases involve corruption, rent-seeking and underhandedness between public officials and
the business community. This phenomenon has perpetually inhibited most MSEs from
taking part in public procurement and hence their consequent poor growth rate.
47
The study recommends that there is need to escalate the pace of government procurement
reforms even after the enactment of the public procurement law. The outstanding reforms
should be recast and implemented as interconnected rather than disjointed activities of a
wholesome reform discipline. Owegi and Aligula (2006) recommended that the Central
Bureau of Statistics should begin collecting, processing and disseminating quantitative data
on Kenya’s public procurement across ministries, departments and other sectors. Such data
will provide a useful basis for further analysis of the problems facing government
purchasing and, therefore, more detailed recommendations of how these bottlenecks can be
surmounted.
2.4.4 E-Procurement Technology
Mboya and Ngugi (2013) conducted a study with the title Influence of Adoption of
Information Communication Technology on Organizational Performance and published it
with International Journal of Social Sciences and Entrepreneurship. The study sought to
establish the influence of adoption of ICT on organizational performance. The MSE sector
in Kenya is characterized by dilapidated infrastructure that fuels low adoption rates of
advanced technology and continued harassment from the public procurement entities that
otherwise need to be protecting and nurturing their growth say (Muniu & Ngugi, 2013).
According to Mboya and Ngugi (2013) technology plays a key role in the growth and
development of an enterprise in any given economy especially in the developing countries.
It is known to increase operational efficiency, provide access to new markets or services
and create new opportunities for income generation. Although there has been considerable
improvements achieved in Africa with respect to certain aspects of ICT, there are still areas
where improvement is needed in order for MSEs to be able to take advantage of the
benefits this technology offers.
Mboya and Ngugi (2013) study took a descriptive study design with a case study approach.
The target population was the staff at the Kenya Wildlife Service head office. A sample of
48
80 respondents was taken from the total population of 800 staffs which represents
approximately 10% of the population. Muniu and Ngugi (2013) study concluded that the
adoption of ICT has influence on the organizational performance. The adoption has led to
better process efficiency within the organization, resulting to cohesion between
departments, better decision making and the relation that the organization has with other
firms. Automation of processes and systems within the organization has resulted in the
organizations increasing their revenue as they are now able to monitor and track the monies
that are collected due to the integration with the headquarter and the implementation
systems. The organization is also able to make decisions based on reports generated from
systems and they are able to forecast their budgets and allocate resources into areas that
generate income for the organization.
Muniu and Ngugi (2013) and Mboya et al, (2013) recommended that an organization
should adopt and utilize a business model which can be used to add value to the
organization and assist in the process efficiency. This result in improved processes and
creates new processes that make it easier for the organization to carry out their business and
be able to provide better service and become competitive.
2.4.5 Bidding Capacity
Muniu and Ngugi (2013) in their study Effects of Human Resource Management Practices
on Performance of Small and Medium Enterprises in Kenya, published by the International
Journal of Social Sciences and Entrepreneurship sought to establish the effect of employee
training and development on the business performance of SMEs in Kenya. The study
adopted descriptive design approach with sample of 200 SMEs with questionnaire as its
instrument of data collection. It established that time taken to induct employees and the
resources deployed to training the employee have significant effect on the business
performance. New knowledge and skills are imparted which empower and capacitate the
employee in the discharge of their duties.
49
However, the cost of training remains prohibitive for the MSEs due to financial constraints.
Mnguu et al, (2014) observe that MSEs have lower demand for business development
services such as training, counseling, professional advice and consultancy due to cost
considerations. This limits their competitiveness especially when they compete for public
tenders with their large enterprise competitors. It thus hurts their bidding capabilities which
denies them opportunity to effectively participate and eventually attain growth through
public procurement system (Muniu & Ngugi 2013; Mnguu et al 2014).
This study by Muniu and Ngugi (2013) recommended that MSEs should embrace extensive
recruitment and training procedures in order to remain competitive in their bidding for
tenders in the public entities. Mnguu et al, (2014) study on the other hand recommends that
the government needs to ensure that necessary fiscal and monetary conditions for the SMEs
participation and development in useful economic activities are in place. It should seek to
assist in training the MSEs with a view to raising their competitive capacity especially in
bidding for the public tenders and contracts.
2.4.6 Procurement Oversight Agencies
Getuno, Awino, Ngugi, and Ondieki, (2015) conducted a study to analyze Public
Procurement and Disposal Regulations Implementation and Performance of State
Corporations in Kenyan. The main objective of the study was to assess the effect Public
Procurement and Disposal Regulations, 2006 implementation on organizational
performance of Kenyan state corporations. The study applied a survey research design with
a target population of 187 state corporations. The study sample comprised 250 procurement
staff and 60 Accounting officers. According to the study, in recent years, public sector
performance and its capacity to deliver services has received a renewed focus given the
declining morals and increasing levels of dubious decisions, especially within the
procurement oversight agencies fraternity as echoed by (Eyaa & Oluka 2011).
50
There is hardly any oversight agency that has escaped the seemingly contagious
predicament of corruption accusations including the EACC itself. The findings of the study
show that majority of the respondents 70% are not familiar with procurement rules and
regulations within their organizations (Eyaa & Oluka, 2011). On average majority of
individuals involved in the oversight of procurement process are not conversant with legal
and general regulatory framework governing it. This is the main cause of lackluster
performance and poor enforcement of policies such as the YAGPO policy plan that sets
aside 30% of the total procurement spend for the marginalized MSE enterprises in Kenya.
Getuno, et al. (2015) concluded that while implementation of the PPDR, (2006) improves
performance of public organizations in line with objectives of the public procurement, the
implementation of the same is inadequate and skewed. The level of familiarity with the
procurement rules and regulations by the oversight agencies is low as most of those
involved in the procurement process do not possess relevant training. Documentation and
records management was found to be a challenge for state agencies and this equally
undermines legal reforms thus creating room for malpractices and negatively affecting
enforcement of procurement rules and regulations.
Getuno, et al. (2015) recommended that state organs procurement plans for all requirements
should be prepared and linked with the approved budget of the organization. Fair and
transparent procurement procedures should be used for all procurements with the
provisions for reservations and preference clauses for the local MSE firms getting the
fairness they deserve. Tender committee should be appointed based on the proven
competences and capabilities for procurement know-how and they should be seen to be
working diligently. Lastly, state organs should train all those involved in the procurement
process on the rules and regulations. This will lead to increase in the implementation levels.

51
2.4.7 MSE Participation
Mohd, Chea and Juhary, (2010) conducted a study titled Moderating Effect of Government
Policy on Entrepreneurship and Growth of Small and Medium Enterprise in Cambodia. It
was published in the International Journal of Business and Management Science. The study
sought to analyze causes of poor growth of SME firms resulting from the government’s
economy moderating effect in Cambodia. The study was carried out using descriptive
design approach with focus on all SME registered by the Small and Medium Enterprise
Corporation in the Country. From the study, Mohd, et al (2010) established that SMEs
faced many problems in their growth performance. These problems were caused by lack of
entrepreneurial values, finances, markets and management. Government policies and
regulations as well as the physical infrastructure have an effect on the growth performance
of the SMEs.
Siti and Atikah (2010) in their research titled The Impact of Supply Chain Operational
Capabilities on Business Performance of Small and Medium Enterprises in Malaysia
concur with (Mohd et al, 2010) that SMES poor showing in public procurement is, besides
regulatory constraints from the government side, as a result of lack of SMEs management
to realize their potential capabilities or failure to exploit such capabilities to take advantage
of the opportunities arising from public procurement. This case is shared even in the
Kenyan scenario where despite the existence of the preference and reservations clauses in
the PPDR, 2006, many MSEs in Kenya still do not take effectively part in procurement
process in the public sector organization. The studies recommend that the government
should reduce the barriers inhibiting SMEs from accessing procurement opportunities
making it a pipe dream for the majority of the firms. There should also be established
formal training institutions with specific focus on the existing SMEs in their respective
countries. This, they argue will foster faster growth of the SMEs which would lead to
increases in the growth of their national economies.
52
2.5 Critique of Literature
The study has reviewed substantial volumes of literature in order to enable it to build a
strong case on the stated problem. This review has helped to shade sufficient light and also
explain the relationship between the specific objectives of the study and the dependent
variable as conceptualized by the study. Literature review was conducted from several
sources including published sources, unpublished literature, statutory and other policy
documents. However, despite the positive contribution from the review, there were
limitations as well.
For instance, much of the literature material concerned itself with addressing the problems
faced by the SMEs in accessing market for their products. Save for Njiraini and Moyi
(2006) who recommended that public procurement could offer a suitable alternative market
for the MSE in Kenya, the rest of the studies were silent on this front. Furthermore, to a
large extent, the literature materials accessed by the study were analyzing the SMEs
performance from internal organization perspective. Omondi (2016) argues that over
400,000 Kenyan MSEs collapse annually due to capacity constraints arising from poor
internal organization of the enterprises. This does not provide an opportunity to understand
external factors that equally affect their performance and growth especially in the public
procurement system and more so, in devolved system of government in Kenya.
Another conspicuous limitation in the literature reviewed arises from the fact that most the
papers were modeled along entrepreneurship discipline. Articles presented by Waithaka,
Ngugi, Aiyabei, Itunga and Kirago, (2012), Odoro and Ngugi (2013), Shikuku and
Omwenga (2015) represent among the typical cases. This is a contrast to this particular
study that seeks to address the performance of MSE’s growth dimension from a supply
chain viewpoint. Besides, majority of the studies and documents reviewed dealt with the
performance of Small and Medium Enterprises in the national economy as demonstrated in
studies by (Muiruri, 2014; Ngugi, 2013 & Waithaka, et al 2012). Conversely, this study
seeks to addresses the growth of Micro and Small Enterprises in the devolved procurement
53
structure in Kenya. This is a paradigm shift in the focus. The study seeks to demonstrate
that given opportunity to develop, MSEs can grow to robust supply base for the
government unlike the remain the conventional entrepreneurs struggling to make a living
the normal way.
2.6 Summary of Literature
Arising from the literature review, is evident that government support for MSEs as a source
of its suppliers or its willingness to remove barriers for equitable competition has far
reaching influence on their growth. However, this endeavor is conspicuously lacking from
the strategic point of view. The variables public procurement procedures, procurement
contracts administration, e-procurement technology, bidding capacity, procurement
oversight agencies, MSE participation in public procurement have been identified to have
relationship between public procurement and the growth of MSE in Kenya. This study
seeks to determine the nature of relationship that exists and the extent to which they
influence the MSEs growth in the County government of Trans Nzoia.
2.7 Research Gaps
Arising from the criticisms above, there are outstanding gaps that the study sought to
address. The first one is that most of the reviewed literature is domiciled in the
entrepreneurship discipline. Secondly, the links between MSEs performance and the
variables public procurement procedures, procurement contracts administration, e-
procurement technology, bidding capacity, procurement oversight agencies, MSE
participation in public procurement have not been comprehensively documented by any of
the reviewed studies. Thirdly, there is no particular research conducted on the relationship
between public procurement and the growth of MSEs as a source supply market for their
products, in Counties in Kenya. This study identifies itself with these gaps.
54
Although Pearce, et al (2012) argues that government support for MSEs participation in
economic growth or its willingness to remove barriers for fair trade can have positive
influence on their growth, public procurement in Kenya has perpetually ignored the MSEs.
Local MSE firms have been perceived as lacking capacity to service the government with
its needs, according to Ochiri (2011), which has relegated these micro entities to the
periphery of public sector procurement operations. This scenario has been a major setback
towards the growth of this important sector which has led to the endless ailing of
entrepreneurship culture in Kenya at large, (Muniu & Ngugi, 2013), and devolved
government units in particular. This, thus, has denied the exchequer sufficient competitive
bidding and hence lack of value for money in public procurement. There is no particular
research study that has been conducted on the relationship between public procurement and
the growth of MSEs in Counties in Kenya, which informs the gap and need for this study.
55
CHAPTER THREE
RESEARCH METHODOLOGY
3.1 Introduction
This chapter contains the study design, target population, sample and sample design,
data collection methods, data analysis design and data presentation. It gives the roadmap
to solving the stated research problem. It is a stepwise approach adopted by the study to
analyze the specified problem along with the logic behind them. Methodology is
essentially a way to systematically solve the research problem as contended by (Kothari,
2002).
3.2 Research Design
The study adopted a descriptive research design with focus on the County Governments
of Trans Nzoia, Bomet and Kajiado. Research design is a blueprint that will enable the
collection, measurement and analysis of data based on research questions of the study,
sentiments shared by (Sekaran & Bougie, 2013). As distinct to other study designs done
in controlled environment, this study is largely descriptive with both quantitative and
qualitative data. Descriptive studies are correlational in nature especially when the
researcher is interested in associations among the variables contend (Sekaran et al,
2013). Kombo and Tromp (2006) say that descriptive survey is a method of collecting
information by interviewing or administering a questionnaire to a sample of individuals.
They are not only restricted to fact findings, but may often result in the formulation of
important principles of knowledge and solution to significant problems, a facet shared
by (Mugenda & Mugenda, 2003), which was the basic purpose of this study.

56
3.2.1 Research Philosophy
The study was guided by the realists philosophical position. Born from a frustration that
positivist philosophical paradigm is over-deterministic and that constructionist on the
other hand is totally relativist, realism takes aspects from both positivist and
interpretivist positions. It holds that real structures exist independent of human
consciousness, but that knowledge is socially created. Our knowledge of reality is a
result of social conditioning argues (Flowers, 2009). Accordingly, while realism is
concerned with what kinds of things there are, and how these things behave, it accepts
that reality may exist in spite of science or observation, and so there is validity in
recognizing realities that are simply claimed to exist or act, whether proven or not. In
common with intepretivists’ positions, realism recognizes that natural and social
sciences are different, and that social reality is pre-interpreted, however realists, in line
with the positivist position also hold that science must be empirically-based, rational and
objective and so it argues that social objects may be studied scientifically as social
objects, not simply through language and discourse.
Whereas positivists hold that direct causal relationships exist, that these relationships
apply universally, thus leading to prediction, and that the underlying mechanisms can be
understood through observation, realists take the view that the underlying mechanisms
are simply the powers or tendencies that things have to act in a certain way, and that
other factors may moderate these tendencies depending upon circumstances, and hence
the focus is more on understanding and explanation than prediction. Although realism is
described as ultimately a search for generative mechanisms, realists recognize that the
underlying mechanisms can act apparently independently or out of phase with the
observable events, and that events can occur independently of them being experienced, a
view described as a stratified form of reality whereby surface events are shaped by
underlying structures and mechanisms but that what we see is only part of the picture.
From an organizational perspective, Chia (2002) describes the realist researcher as
enquiring into the mechanisms and structures that underlie institutional forms and
57
practices, how these emerge over time, how they might empower and constrain social
actors, and how such forms may be critiqued and changed. Realists take the view that
researching from different angles and at multiple levels will all contribute to
understanding since reality can exist on multiple levels as contended by (Chia, 2002)
and hence realism may be seen as inductive or theory building.
3.3 Target Population
The study targeted all MSEs registered by the Micro and Small Enterprises Authority
(MSEA) in the County Governments of Trans Nzoia, Bomet and Kajiado. Micro and
small enterprises in Kenya are not growing in commensurate with the public
procurement budgets as concurred by (Ongachi & Bwisa, 2013). This is partly due to
lack of support by the essential markets such as public procurement, views shared by
(Ogwel, Iravo & Lagat, 2016). Shikuku and Omwenga (2015) concur with the fact that
Trans Nzoia, Bomet and Kajiado Counties are the most affected counties, with the least
ranking of MSEs growth rate if not stagnated growth out of the 47 counties in Kenya.
Muirui (2014) shares the sentiments and posits that the MSEs growth in Kenya
continues to suffer due to the poor market environment with the biggest constraint being
lack of support by the public procurement market as part of the supply chain. The
problems hindering the growth and development of MSE supply chains in the county
according to (TCIDP 2013-2017) include inadequate institutional capacity on the part of
the MSEs, limited access to government opportunities, inhibitive legal and regulatory
environment, inappropriate technology among others (RoK, 2013). It is imperative to
note the fact that public procurement is governed by uniform regulatory framework and
that all counties apply the same framework in Kenya. Importantly still, the e-
procurement platform in the public sector in Kenya, the IFMIS system, applies to all the
public entities as envisaged in the PPADA, 2015 which defines a public procuring entity
as including County governments (RoK, 2015). The above foregoing cause the findings
of the study to be reliably representative and hence good for generalizability.

58
According to the MSEA’s database, the Counties had 771 registered MSEs (RoK, 2014).
The target population of the study was therefore the 771 firms. The study presumed all
MSEs to be actively involved or potentially involved in one way or another with
government purchasing processes which according to Baily et al, (2005) impacts their
growth and performance. The target population is summarized in table 3.1.
Table 3.1: Target population for the study
Association Name No. of MSE
Trans Nzoia 207
Bomet 234
Kajiado 330
Total 771
Source: Republic of Kenya (2014). Micro and Small Enterprises Authority:
Harmonization of Micro and Small Enterprises (MSE) Sector in Kenya.
3.4 Sampling Frame
The sampling frame for this study included the 771 MSEs registered by the Micro and
Small Enterprises Authority. The study sample was 155 firms to represent the universe.
This sample size was considered representative, as supported by (Kothari, 2004 &
Ogachi, 2011). The detailed register of the firms was obtained from the Micro and Small
Enterprises Authority offices in the County.
3.5 Sample and Sampling technique
The study employed a combination of clustered and stratified probability sampling
technique since the subjects in the target population were heterogeneous. This choice as
supported by Kothari et al. (2014) was appropriate since the population from which the
sample was selected did not constitute a homogeneous group. Stratified sampling

59
technique was applied to obtain a representative sample. Based on the nature of
distribution as provided in table 3.1, the Counties provided a basis for clustering.
However, within the clusters, there existed strata modelled along the nature of business,
which was grouped according to the industry within which the MSEs belong. Each type
of industry informed the strata while the sectors within the industry constituted sub-
strata. The actual sampling was based on the sub-strata.
Kothari et al. (2014) and Bougie et al (2013) echore that under stratified sampling the
population is divided into several sub-populations that are individually more
homogeneous than the total population. The study then selected items from each stratum
to constitute a sample. This sampling technique helped to provide more reliable and
detailed information for better estimation of the whole population. Being a finite
population, the study used Cochran finite population correction factor formula proposed
by (Mugenda & Mugenda, 2003) for social science research to determine its sample size.
The sample size statistic was determined as shown in the following calculation:
n = n0 *N
n0 + ( N-1)
n = (193) (771)
193 + (771-1)
n = 155
3.6 Instruments of Data Collection
The study collected data from primary sources using questionnaires as the instrument for
data collection. Use of questionnaire has capacity to collect enormous amount of
information over a large sample within reasonably little time. Besides questionnaires,
unstructured observation technique was used to gather data in order to give an intuitive
60
understanding of what is happening in the culture under the study. The study will carry
out data collection through a systematic sequence of events. The sequence began by
seeking permission from the National Council for Science Technology and Innovation
(NACOSTI) to conduct the study in Kenya so as to avoid any potential hitches that
might have arisen from lack of permission to conduct the research. The administrative
heads of the counties besides county directors of education were informed of the
intention to conduct the study in the county through a request letter attached to a copy of
the authority letter from the NACOSTI.
This was followed by stratifying the clusters for sample selection based on the industry
and then sectors within which the MSEs were classified as explained in the sampling
technique above. For effective approach of the respondents, the researcher made self-
introduction and request for consent of the respondents for taking part in the exercise.
After the introduction, the questionnaires were then distributed to the selected and
willing respondents from the sample. The study employed research assistants because
the sample size was large. Respondents were given five days in order allow ample time
for them to respond to the issues raised to enhance objective and reasonable responses.
3.7 Pilot Test
In order to test the validity, reliability and practicability of the instruments of data
collection, the study conducted a pilot study on sampled colleagues at the place of work.
A 10% equivalent of the study sample, randomly selected from the members of staff
took part in the pre-test exercise to enable the study to ascertain the instruments’ content
and construct validity, before the actual data collection. However, the pilot sample did
not participate as the actual sample for the main study as the study targeted MSEs
registered with the MSEA within Trans Nzoia, Bomet and Kajiado Counties. The pilot
sample size was sufficient and it produced realistic projections for reliability and validity
of the research tools, an aspect concurred by (Aiyabei, 2013 & Tappin, 2014).

61
3.7.1 Reliability Test
The study used Cronbachs’s test to test for the reliability of the instruments of data
collection. Reliability of an instrument is its ability to produce consistent and stable
measurement, a statement supported by (Ngugi, 2013). The coefficient of internal
consistency provides an estimate of the reliability of measurement and is based on the
assumption that items measuring the same construct should correlate. The most widely
used method for estimating internal consistency reliability is Cronbach’s alpha, an
argument that is backed by (Kimberlin & Winterstein, 2008). It is expressed as a
coefficient between 0.00 and 1.0 with the highest level of coefficient indicating higher
reliability. This tool was used in testing the reliability of the instruments of data
collection in this study. A Cronbach alpha of 0.6 and above was accepted as an
appropriate scale of reliability as concurred by (Ngugi, 2013).
3.7.2 Validity Test
Comparatively, validity is the most critical criterion because it indicates the degree to
which an instrument measures what it is supposed to measure. This fact is shared by
Kothari (2002) and Ngugi (2013) with Kimberlin and Winterstein (2008) observing that
there is no statistical test to determine whether a measure adequately covers a content
area or adequately represents a construct. Content validity thus usually depends on the
judgment of experts in the field. This will be the scenario to be taken in this study.
3.8 Data Analysis and Presentation
The study adopted both qualitative and quantitative data analysis techniques because of
the mixture of data collected. As contended by Sekaran et al, (2013), Kombo et al,
(2006) and Mugenda et al (2003), quantitative data analysis consists of measuring
numerical values from which descriptions such as mean and standard deviations are
made while qualitative data consists of opinions and inferences based on personal
judgments of the respondents. The data analysis began by editing the data to clean up the

62
collected material facts in order to ensure that only relevant responses remained. The
irrelevant ones were discarded so as avoid invalid findings, conclusions and
recommendations. This process helped to enhance time efficiency during the final
analysis of data as the study was able to concentrate on what was validly relevant.
After editing the data, the remaining portion was coded for easier classification and
avoidance of mixing up facts during the writing of the final report. Alpha-numeric codes
were preferred because of their convenience and memorability besides being elastic.
Classification was based on the question and nature of responses. After coding and
classifying data, the study tabulated the results of the findings using a laptop, model hp
intel CORE i7. To realize accuracy and effectiveness in the analysis of data, Statistical
Package for Social Sciences (SPSS) software, version 23 was utilized.
Both descriptive and inferential statistics were utilized to analyze the data. As echoed by
Kothari (2002) inferential statistics or otherwise known as sampling statistics is
concerned with the process of generalization of the sample results to the population.
This sought to address the problem of the estimation of population parameters and the
testing of statistical hypothesis. Descriptive statistics on the other hand dealt with
development of indices from the raw data for the purpose of developing the inferential
statistics analysis. In order to sufficiently and critically analyze the significance of each
independent variable in the study and based on large data expected, stepwise regression
model was utilized.
This was applied by building a model in which adding and/or removing the variables
based on f-statistics of their estimated coefficients was done. Being a social science
study, Pearson’s coefficient correlation was used to determine the degree of significance
between the independent and dependent variables at 95% confidence level and 5%
degree of significance as concurred by Sekaran and Bougie (2013), as the acceptable
standard. The following multiple regression models, derived from the variables under
the study were applied in the determination of coefficient correlations between the
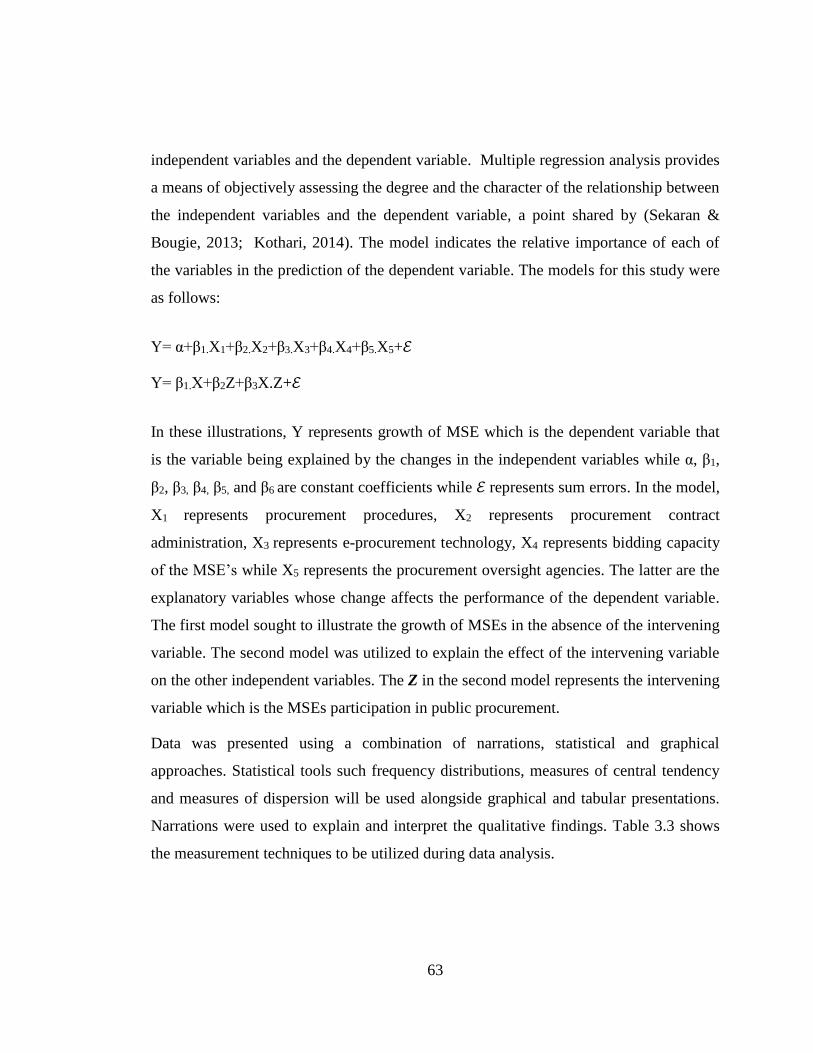
63
independent variables and the dependent variable. Multiple regression analysis provides
a means of objectively assessing the degree and the character of the relationship between
the independent variables and the dependent variable, a point shared by (Sekaran &
Bougie, 2013; Kothari, 2014). The model indicates the relative importance of each of
the variables in the prediction of the dependent variable. The models for this study were
as follows:
Y= α+β1.X1+β2.X2+β3.X3+β4.X4+β5.X5+ℰ
Y= β1.X+β2Z+β3X.Z+ℰ
In these illustrations, Y represents growth of MSE which is the dependent variable that
is the variable being explained by the changes in the independent variables while α, β1,
β2, β3, β4, β5, and β6 are constant coefficients while ℰ represents sum errors. In the model,
X1 represents procurement procedures, X2 represents procurement contract
administration, X3 represents e-procurement technology, X4 represents bidding capacity
of the MSE’s while X5 represents the procurement oversight agencies. The latter are the
explanatory variables whose change affects the performance of the dependent variable.
The first model sought to illustrate the growth of MSEs in the absence of the intervening
variable. The second model was utilized to explain the effect of the intervening variable
on the other independent variables. The Z in the second model represents the intervening
variable which is the MSEs participation in public procurement.
Data was presented using a combination of narrations, statistical and graphical
approaches. Statistical tools such frequency distributions, measures of central tendency
and measures of dispersion will be used alongside graphical and tabular presentations.
Narrations were used to explain and interpret the qualitative findings. Table 3.3 shows
the measurement techniques to be utilized during data analysis.

64
3.8.1 Coefficient of Multiple Correlation (Ro)
Kothari, (2010) says that the most commonly used measure of correlation between two
or more independent variables and a dependent variable is the coefficient of correlation.
This is symbolically represented as Ro1234….n. Multiple coefficient correlation explains
the degree of influence that the joint or the sum of explanatory variables exerts on the
behavior of the dependent variable in a given multiple linear regression model. The
reliability of Ro was determined from appropriate tables of significance that provided a
satisfactory method of estimating the reliability and the multiple linear regression
equation built about it. These tables helped to describe the coefficients that appeared by
pure chance among the sample from uncorrelated ones in 20 times (5% table). The table
value was compared with the computed value of Ro and accordingly the significance of
Ro judged and its reliability examined.
3.8.2 R2 and Adjusted R2 (R2adj)
As observed by Kothari (2014), we can use coefficient of determination (R2) to judge the
goodness of the fitted model by the formula R2 = SSR/SST = 1-(SSE/SST). However,
(Kothari, 2014) proceeds to explain that R2 is higher where there are more explanatory
variables in a model, which is not by coincidence but a normal property of R2. Whenever
an explanatory variable is added to the model, the value of R2 increases regardless of the
contribution of the newly added explanatory variable. Thus, the value of R2 may be
misleading in multiple regression models. The study therefore utilized an adjusted R2
which is defined statistically as R2adj and computed as:
R2adj =1- SSE/(n-k-1)
SST/(n-1).
This is because R2adj increases only if the added explanatory variable contributes in
explaining the variation in the response variable Y. This helps to indicate the
significance of an explanatory variable within the model. The estimates drawn from the
model therefore, become useful and reliable.
65
3.8.3 Multicollinearity Test
Multicollinearity, according to Sekaran and Bougie (2013) is a statistical phenomenon in
which two or more independent variables in a multiple regression model are highly
correlated. When we regress Y on X1, X2….Xk, we assume that all explanatory variables
in the model are statistically independent of one another and that the explanatory
variables affect the values of Y. However, one explanatory variable should not affect the
values of other explanatory variable says (Kothari, 2014). Sometimes, in practice this is
not met, subjecting a study to the problem of multicollinearity. The correlated variables
contribute redundant information to the model and contradictory results or estimates are
drawn. Some indications of strong multicollinearity include cases where F-test says at
least one variable is significant but none of the t-test indicates a useful variable, large
standard error and corresponding variable is still significant, MSE is very high/or R2 is
very small. In this study, any multicollinearity generated by X variables will be
measured by variance inflationary factor given by (Kothari, 2014) as VIFj = 1/1-R2j.
(Kothari, 2014) says that if VIFj ≥ 5, Xj is highly correlated with the other explanatory
variables. Sekaran and Bougie (2013) argue that this makes the estimation of regression
coefficients impossible, which makes the estimates of the coefficients unreliabile.
However, muclticollinearity is not a serious problem if the purpose of the study is to
predict or forecast future values of the dependent variable because even though the
estimations of the regression coefficient may be unstable, multicollinearity does not
affect the reliability of the forecast according to Sekaran and Bougie (2013) which was
the basis for this study.
3.8.4 F-Test
According to Kothari (2014), in multiple linear regression analysis F-test is used to test
the overall validity of the model or to test if any explanatory variables is having linear
relationship with the response variable. Sekaran and Bougie (2013) opine that ANOVA
can be used to examine the effect of two nonmetric independent variables on a single
metric dependent variable. In this context, an independent variable is referred to as a

66
factor. A design that aims to examine the effect of two nonmetric independent variables
on a single metric dependent variable is called a factorial design. This is, as echoed by
Sekaran and Bougie (2013), very popular in social sciences, and thus, the approach
taken by this study.
3.9 Ethical Issues
As normal with research processes, the ethical aspects of the study were concerned more
especially with the data collection process as shared by (Kothari, 2014). In order to
observe ethical moments, the study was conducted in a clearly structured and
coordinated manner. For instance, the study sought authority to collect data in the
Counties from the National Council for Science, Technology and Innovation
(NACOSTI). This was followed by informing both the County director of education and
the County Commissioner of the intended data collection project. The respondents were
also assured of the confidentiality of the data they supplied through an introduction letter
attached to all the questionnaires.
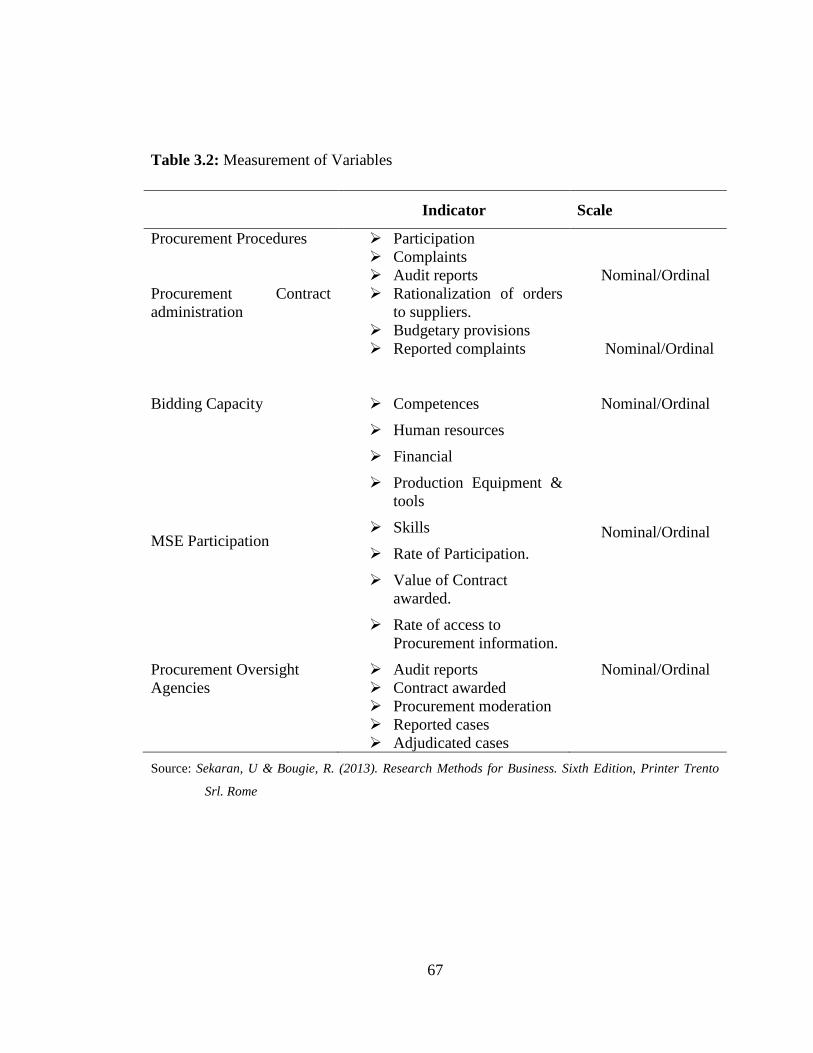
67
Table 3.2: Measurement of Variables
Indicator Scale
Procurement Procedures Participation
Complaints
Audit reports
Nominal/Ordinal
Procurement Contract
administration
Rationalization of orders
to suppliers.
Budgetary provisions
Reported complaints
Nominal/Ordinal
Bidding Capacity
MSE Participation
Competences
Human resources
Financial
Production Equipment &
tools
Skills
Rate of Participation.
Value of Contract
awarded.
Rate of access to
Procurement information.
Nominal/Ordinal
Nominal/Ordinal
Procurement Oversight
Agencies
Audit reports
Contract awarded
Procurement moderation
Reported cases
Adjudicated cases
Nominal/Ordinal
Source: Sekaran, U & Bougie, R. (2013). Research Methods for Business. Sixth Edition, Printer Trento
Srl. Rome

68
CHAPTER FOUR
RESEARCH FINDINGS AND DISCUSSIONS
4.1 Introduction
This chapter contains details and explanations arising from the actual findings of the
study. The information was presented both quantitatively and qualitatively using both
descriptive and inferential statistics. It is the chapter from which conclusions and
recommendations in chapter five were derived. The details in this chapter represent
information arising from the examination and tests carried out on the raw data collected
from respondents.
4.2. Response Rate
The target sample size for the study was 155 respondents. Out of the 155 self-
administered questionnaires sent out to the respondents, 125 were positively responsive.
This represents 81% response rate. According to Kothari and Garg, (2014) a response of
50% is sufficient for reliable generalizability of the findings to the universe. The
response rate for this study surpasses the minimum proposed by (Kothari & Garg, 2014).
The study therefore concludes that its findings are reliably generalizable to the universe.
Table 4.1 provides summary of the details on the rate of response for the study:

69
Table 4.1: Response rate
Target sample Positive responses % Rounded off %
155 125 80.65 81
4.3 Pilot Study Results
In order to test the validity, reliability and practicability of the instruments of data
collection, the study conducted a pilot test on sampled colleagues at the place of work. A
10% equivalent of the study sample, randomly selected from the members of staff took
part in the pre-test exercise. However, the pilot sample was not part of the actual sample
for the study. This size was considered sufficient and capable of producing realistic
projections for the reliability and validity of the research tools, an assumption concurred
by (Aiyabei, 2013 & Tappin, 2014).
4.3.1: Test for Reliability
The Cronbach alphas for the study for the various variables were above was 0.70
indicating convincing instruments reliability. The statistics were computed from a 10%
equivalent of the study sample, randomly selected from the members of staff at the place
of work who took part in the pre-test exercise. These fall within the range argued by
Ngugi (2013) that a Conbach alpha of 0.6 and above is accepted as an appropriate scale
of reliability. The coefficient of internal consistency provides an estimate of the
reliability of measurement and is based on the assumption that items measuring the same
construct should correlate, concurs (Kimberlin & Winterstein, 2008). It is normally
expressed as a coefficient between 0.00 and 1.0 with the highest level of coefficient
indicating higher reliability. Tables 4.2 below provide details of the results for the
reliability tests for the study variables.

70
Table 4.2: Statistics for reliability test
4.3.2 Validity Test
With strong regard to the findings in the test for reliability, the study concluded that the
validity of the instruments of data collection was guaranteed. This was anchored on the
understanding that since there is no statistical test for validity in research, a strong
reliability test is a significant pointer to instrument validity. There was therefore no
statistical test to compute for validity other than expertise judgment.
This argument is supported by Kimberlin and Winterstein (2008) who observe that there
is no statistical test to determine whether a measure adequately covers a content area or
adequately represents a construct. However, comparatively, validity is the most critical
criterion because it indicates the degree to which an instrument measures what it is
supposed to measure. This fact is shared by Kothari (2002) and (Ngugi (2013). Content
validity thus usually depends on the judgment of experts in the field, which the guided
the direction that this study took.
4.3.3: Test for Multicollinearity
In this study, multicollinearity was measured by variance inflationary factor given by
Kothari, (2014) as VIFj. If VIFj ≥ 5, Xj is significantly correlated with the other
explanatory variable says (Kothari, 2014). The purpose for multicollinearity test was to
Variable Cronbach's Alpha N of Items
Y .751 4
X1 .835 4
X2 .818 5
X3 .763 5
X4 .798 4
X5 .882 6
X6 .931 6
71
inform dropping or merging the variables that are highly correlated. This was to be done
in order to remove non-significant variables that could not have been adding value in the
model. The following were the results of the test for multicollinearity.
The multicollinearity test for the variable X1 indicates VIF ≤ 5. This shows that X1 is not
significant multicollineated with the other model variables. There is therefore no alarm
in this test. In respect to multicollinearity for the variable X2, the results were more or
less similar as in the previous case. Test for the X3 did not demonstrate significant
multicollinearity as well. With regard to multicollinearity test for the variable X4 the
results comparatively higher with VIF value slightly ≥ 2. However this degree of
multicollinearity is not worrisome. The variable X5 also demonstrated commendable
level of independence from the other variables in the model. The VIF value posted is a
demonstration of variables independence. Finally, the VIF statistic for the variable X6
show that it is not significantly multicollineated with the others in the model to an
alarming level. All the variables demonstrated negligible low levels of multicollinearity.
Statistically therefore, there is high degree of independence among the explanatory
variables. At this point, the study can almost confidently conclude that the variables in
this test were independently selected. Table 4.3 gives details on the results for test for
multicollinearity.

72
Table 4.3: Test for multicollinearity
Model
Unstandardized
Coefficients
Standardized
Coefficients T Sig. Collinearity Statistics
B Std. Error Beta Tolerance VIF
1
(Constant) 2.705 .672 4.026 .000
X1 .178 .134 .136 1.328 .018 .884 1.275
X2 .052 .074 .077 .708 .048 .792 1.444
X3 .099 .022 .038 .406 .028 .948 1.055
X4 .034 .115 .039 .292 .007 .659 1.177
X5 .070 .090 .086 .772 .014 .655 1.026
X6 .133 .109 .126 1.222 .022 .775 1.290
a. Dependent Variable: Growth_Rate
4.4 Background Information
The background information section contains information obtained on the general details
about the study sample. It is from this information that the study was capable to
determine how informed the respondents were with the problem under the study. It
contained information on demographic distribution in terms of gender, education and
training, type of business they run among other relevant areas to the study. The findings
on this section are presented as follows.
4.4.1 Type of Business
In seeking to determine the type of business enterprises that the respondents operate,
71% (89) of the respondents reported that they operate micro enterprise businesses. This
figure is more than 50% of the total respondents. This information is presented in table
4.4. It illustrates that the prevalent type of the small scale businesses in Trans County are
Micro enterprises.

73
This resonates well with Njiraini and Moyi (2006) who argue that public procurement
market in Kenya largely supports growth of large enterprise. However it differs with
Sikuku and Omwenga (2014) who reported that most scale enterprises in the Counties
fall within the purview of small and medium Enterprises (SMEs). This is an indication
that it despite the spirited effort by the government to develop and grow small scale
business enterprises as the alternative cheaper sources of supply for its needs, especially
by attempting to afford them business opportunities through the public procurement
platform, little has been achieved. It also hints to the fact that the transition rates for the
MSEs is negligible.
Table 4.4: Type of business
Frequency Percent
Valid Micro Enterprise 89 71.2
Small Enterprise 36 28.8
Total 125 100.0
4.4.2 Number of Employees
When asked about the number of employees, the study established 85% of respondents
have less than five employees. This identifies well with the findings in the type of
business enterprises MSE owners operated. This is because in the definition of a micro
enterprise, the number of employees are between 1 and 10. It is therefore candid to
conclude that most small scale entities in Kenya are within the framework of micro
enterprises. This information is presented in details in table 4.5 as shown below.
This finding resonates with Momanyi (2016) who says that micro enterprises dominate
the Kenya’s business enterprise. They are apparently the biggest contributor to country’s
economy, despite the inherent problems, overtaking the traditional economic drivers
such as agriculture and real estate. This is further supported by a survey by Kenya
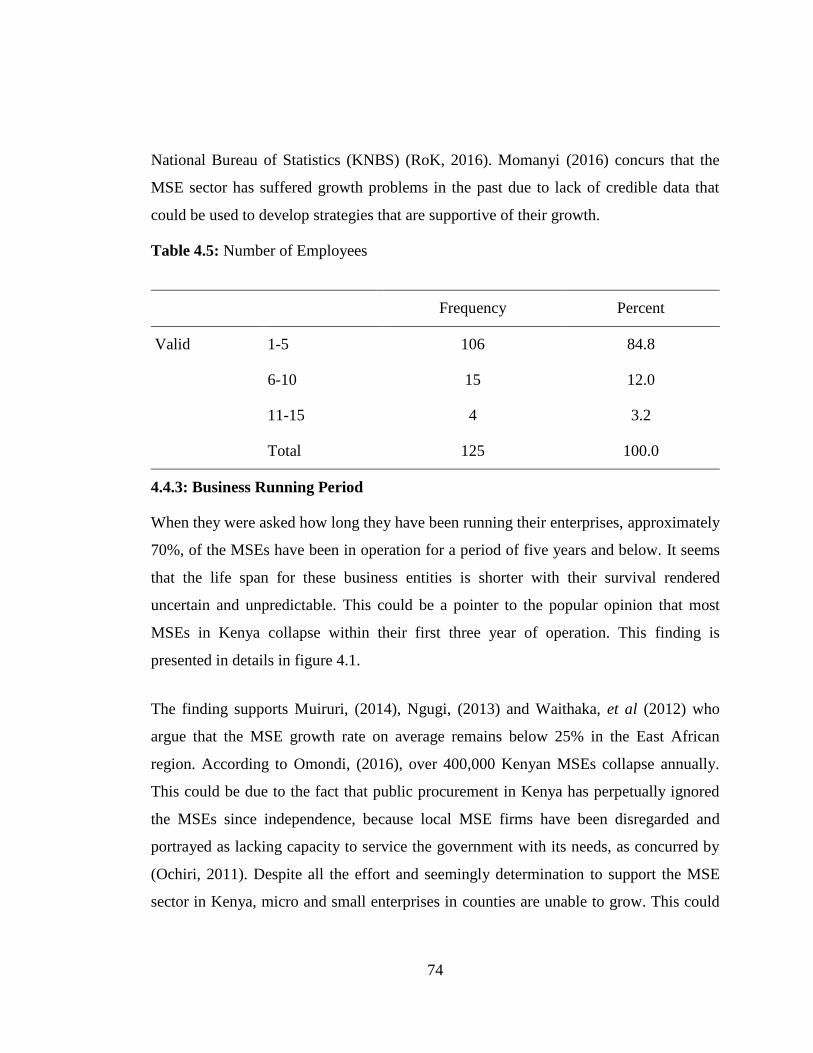
74
National Bureau of Statistics (KNBS) (RoK, 2016). Momanyi (2016) concurs that the
MSE sector has suffered growth problems in the past due to lack of credible data that
could be used to develop strategies that are supportive of their growth.
Table 4.5: Number of Employees
Frequency Percent
Valid 1-5 106 84.8
6-10 15 12.0
11-15 4 3.2
Total 125 100.0
4.4.3: Business Running Period
When they were asked how long they have been running their enterprises, approximately
70%, of the MSEs have been in operation for a period of five years and below. It seems
that the life span for these business entities is shorter with their survival rendered
uncertain and unpredictable. This could be a pointer to the popular opinion that most
MSEs in Kenya collapse within their first three year of operation. This finding is
presented in details in figure 4.1.
The finding supports Muiruri, (2014), Ngugi, (2013) and Waithaka, et al (2012) who
argue that the MSE growth rate on average remains below 25% in the East African
region. According to Omondi, (2016), over 400,000 Kenyan MSEs collapse annually.
This could be due to the fact that public procurement in Kenya has perpetually ignored
the MSEs since independence, because local MSE firms have been disregarded and
portrayed as lacking capacity to service the government with its needs, as concurred by
(Ochiri, 2011). Despite all the effort and seemingly determination to support the MSE
sector in Kenya, micro and small enterprises in counties are unable to grow. This could

75
be attributable to lack of support by large corporate markets such as public procurement,
observe (Ogwel, Iravo & Lagat, 2016; Ongachi & Bwisa, 2013).
Figure 4.1: Business running period
4.4.4 Three Year Total Sales
In response to the total annual sales for the period between 2013 to 2015, the total sales
revenue for the majority MSEs was established to be Ksh. 500,000 and below. This is
according to approximately 81% or (101) respondents who indicated that their annual
sales income falls within this range. This ascertainment is important because it shades
more light on the type of the majority of business entities under the study. Figure 4.2
gives summary of the average annual sales of MSEs in Trans County.
According to Ngugi (2012) and RoK (2013) micro enterprises can be defined not only in
terms of number of employees, but also average annual revenue. RoK (2013) portrays a
micro enterprise as a business entity with sales turnover not exceeding five hundred
thousand shillings per annum. This is echoes by Ongachi and Bwisa, (2016), Ogwel,

76
Iravo and Lagat (2016) who concur that lack of alternative markets for the MSE
products causes their lackluster performance in terms of low sales revenues.
Figure 4.2: MSEs total sales
4.4.5 Level of Education
As far as the level of education is concerned, the study shows that 57% (71) respondents
are diploma holders. However, the study population comprise of respondents of diverse
academic qualifications. This shows that the target sample was literate and hence
sufficiently competent to understand and respondent to issues addressed in the
questionnaires. More details are captured and presented in table 4.6.
This contravenes Ngugi, (2012) who posited that the main reason that leads to collapse
of most SMEs in Kenya is low levels of academic qualifications among the heirs of
family owned SMEs. However, this finding aligns itself well with Momanyi (2016) who
reports that among the reasons for starting MSEs include desire for better income and
self-employment arising from ostensibly literate population. Economic recovery strategy
paper of 2003 contends that an academically enlightened society stands a better chance
to drive economic growth and development (RoK, 2003).

77
Based on this foregoing, the study established that most MSE in the Counties in Kenya
comprise educated people. Given necessary support and opportunities by the
government, they are capable of taking the economy to the next level within shortest
time possible. As provided for within the Kenya Vision 2030 framework, informal
sector has been given significant priority to steer the economy from agriculture driven to
industrial driven. This is a clear recognition and appreciation that having a trained
society of entrepreneurs can help the country to expeditiously realize this vision.
Table 4.6: Level of education
Frequency Percent
Valid Ph.D 2 1.6
Masters 13 10.4
Bachelor 35 28.0
Diploma 71 56.8
Other 4 3.2
Total 125 100.0
4.4.6 Gender
In response to the gender issue, 55% of respondents were males. Although the males
were the majority, the proportion of females was equally reasonable. This implies that
the MSE operatives are almost evenly distributed between the two genders. This gave
the study a reasonably heterogeneous sample in respect to the gender issue. This
information is tabulated in table 4.7 in details.
From this finding, the study ascertains that the MSE are composed of both males and
females. These two groups of gender are equipped with adequate academic
qualifications that can help them run successful enterprises were they to be given
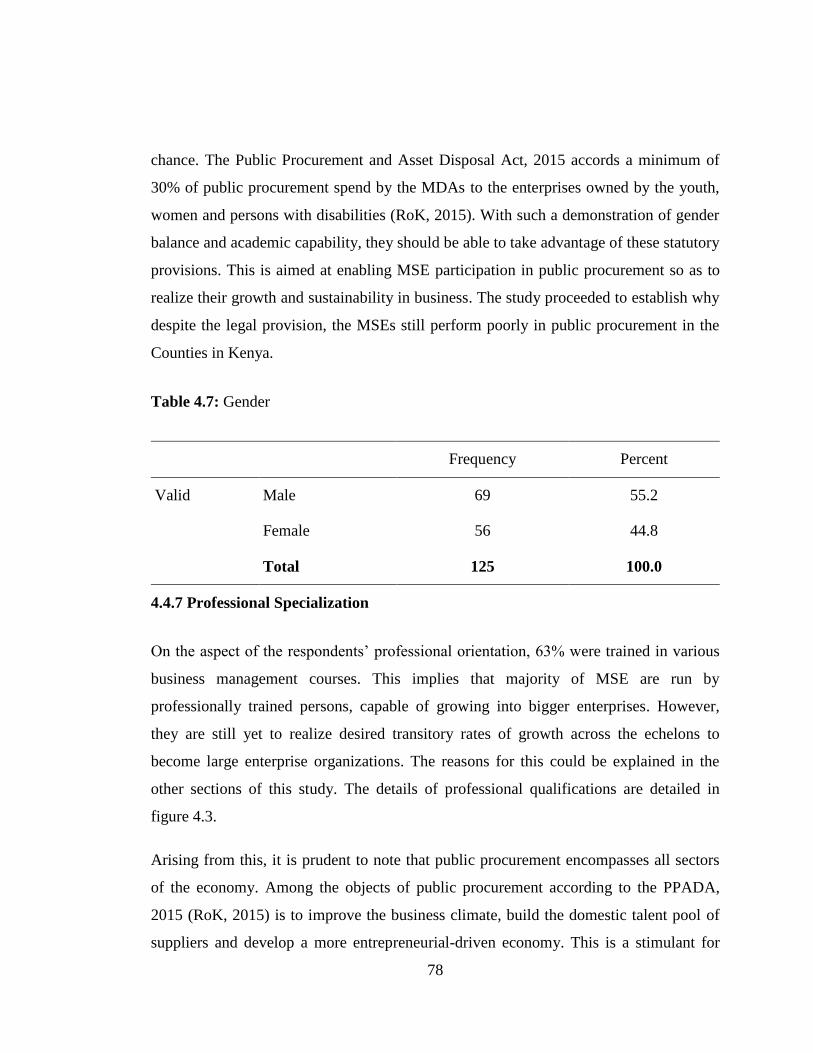
78
chance. The Public Procurement and Asset Disposal Act, 2015 accords a minimum of
30% of public procurement spend by the MDAs to the enterprises owned by the youth,
women and persons with disabilities (RoK, 2015). With such a demonstration of gender
balance and academic capability, they should be able to take advantage of these statutory
provisions. This is aimed at enabling MSE participation in public procurement so as to
realize their growth and sustainability in business. The study proceeded to establish why
despite the legal provision, the MSEs still perform poorly in public procurement in the
Counties in Kenya.
Table 4.7: Gender
Frequency Percent
Valid Male 69 55.2
Female 56 44.8
Total 125 100.0
4.4.7 Professional Specialization
On the aspect of the respondents’ professional orientation, 63% were trained in various
business management courses. This implies that majority of MSE are run by
professionally trained persons, capable of growing into bigger enterprises. However,
they are still yet to realize desired transitory rates of growth across the echelons to
become large enterprise organizations. The reasons for this could be explained in the
other sections of this study. The details of professional qualifications are detailed in
figure 4.3.
Arising from this, it is prudent to note that public procurement encompasses all sectors
of the economy. Among the objects of public procurement according to the PPADA,
2015 (RoK, 2015) is to improve the business climate, build the domestic talent pool of
suppliers and develop a more entrepreneurial-driven economy. This is a stimulant for
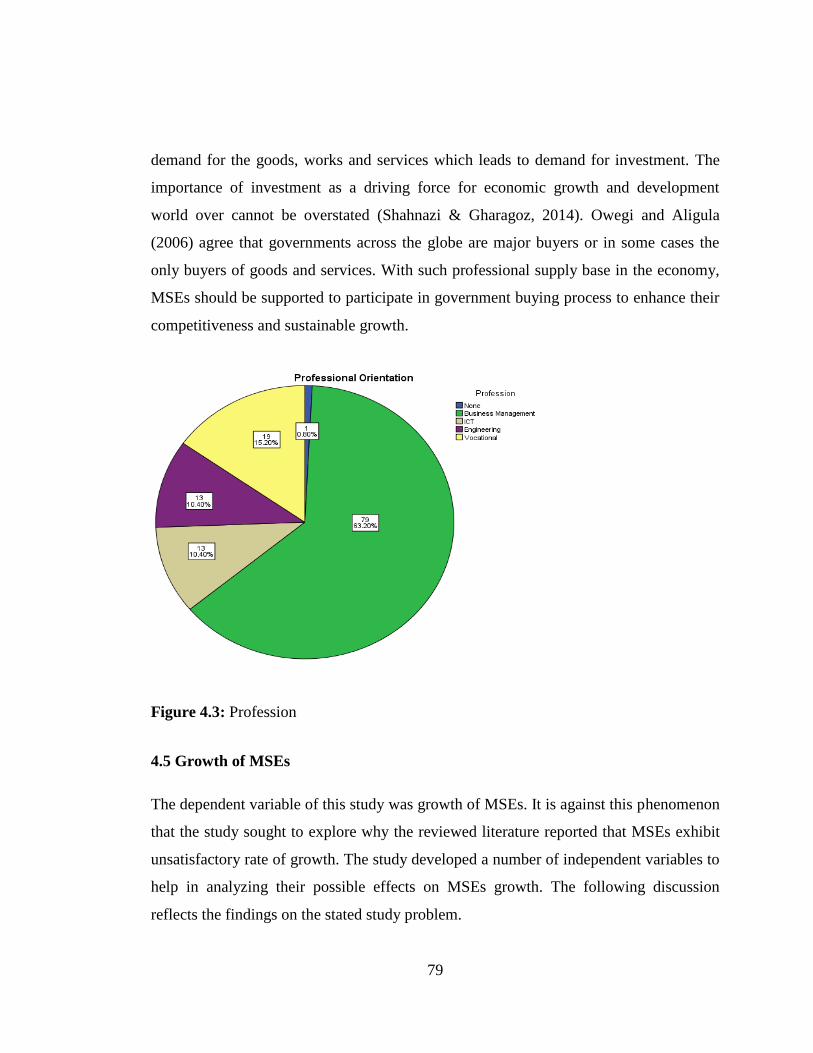
79
demand for the goods, works and services which leads to demand for investment. The
importance of investment as a driving force for economic growth and development
world over cannot be overstated (Shahnazi & Gharagoz, 2014). Owegi and Aligula
(2006) agree that governments across the globe are major buyers or in some cases the
only buyers of goods and services. With such professional supply base in the economy,
MSEs should be supported to participate in government buying process to enhance their
competitiveness and sustainable growth.
Figure 4.3: Profession
4.5 Growth of MSEs
The dependent variable of this study was growth of MSEs. It is against this phenomenon
that the study sought to explore why the reviewed literature reported that MSEs exhibit
unsatisfactory rate of growth. The study developed a number of independent variables to
help in analyzing their possible effects on MSEs growth. The following discussion
reflects the findings on the stated study problem.
80
4.5.1 Growth Rate
The study sought to find out the rate of growth of MSEs in Counties in Kenya. The
findings on this particular variable demonstrates that 92% (114) respondents held the
view that the growth rate of MSEs in the County was extremely low. This implies that
the respondents were dissatisfied with the MSEs rate of growth. It should remain an
issue of concern to obtain such disheartening revelations. The study had initially
assumed that with advent of devolution, the results may be evident strong show of
growth.
Despite spirited effort by the government to support development of small scale
suppliers through such measures as establishment of preference schemes for what is
popularly termed as special or interest groups, MSEs, which fall among the target group
remain disadvantaged. This finding resonates well with Ongachi and Bwisa (2013) who
advanced the argument that Micro and small enterprises in Trans Nzoia County are not
growing at all. It is a fact as observed by Ogwel, Iravo and Lagat (2016) resulting from
lack of support by essential markets such as public procurement.
Despite the fact that even the government itself acknowledges the importance of MSE
sector’s contribution to the economy according to Momanyi (2016), its strategies to
develop small enterprise suppliers remains inconsequential. This may be associated to
among other things, lack of goodwill to operationalize the strategies. Consequently, the
MSEs will end up lagging behind with disheartening growth statistics. Figure 4.8 gives
details of these findings. The same is illustrated in figure 4.4.
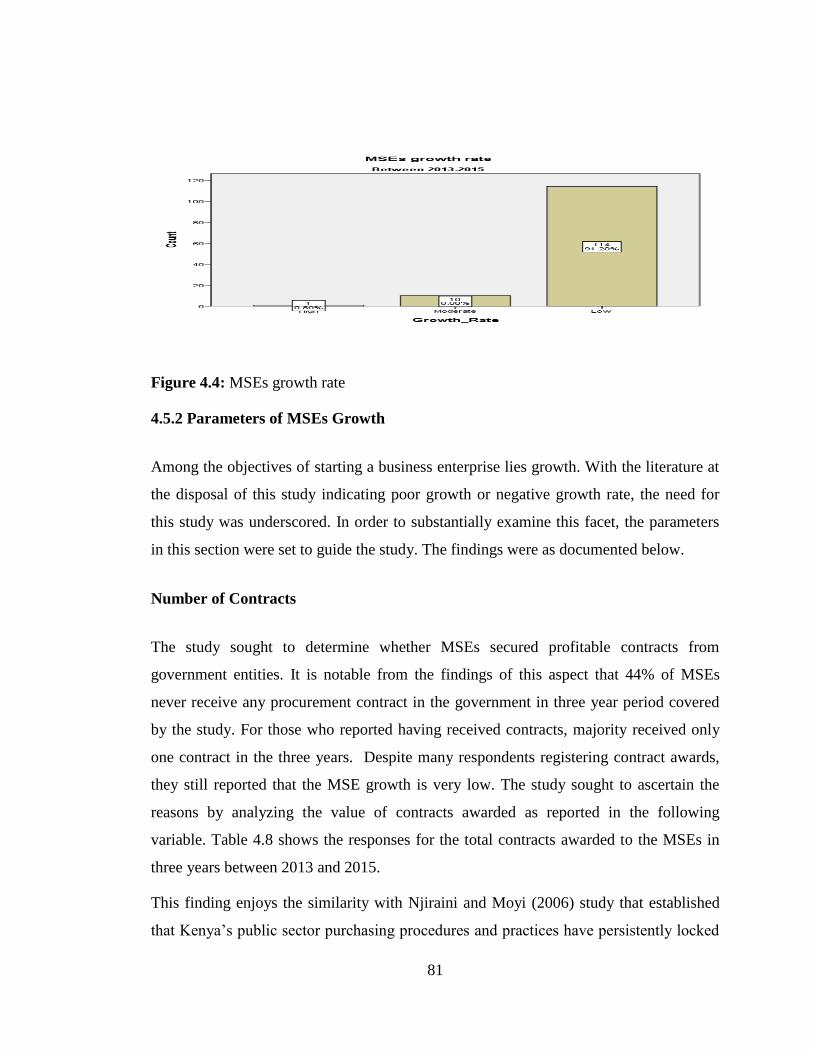
81
Figure 4.4: MSEs growth rate
4.5.2 Parameters of MSEs Growth
Among the objectives of starting a business enterprise lies growth. With the literature at
the disposal of this study indicating poor growth or negative growth rate, the need for
this study was underscored. In order to substantially examine this facet, the parameters
in this section were set to guide the study. The findings were as documented below.
Number of Contracts
The study sought to determine whether MSEs secured profitable contracts from
government entities. It is notable from the findings of this aspect that 44% of MSEs
never receive any procurement contract in the government in three year period covered
by the study. For those who reported having received contracts, majority received only
one contract in the three years. Despite many respondents registering contract awards,
they still reported that the MSE growth is very low. The study sought to ascertain the
reasons by analyzing the value of contracts awarded as reported in the following
variable. Table 4.8 shows the responses for the total contracts awarded to the MSEs in
three years between 2013 and 2015.
This finding enjoys the similarity with Njiraini and Moyi (2006) study that established
that Kenya’s public sector purchasing procedures and practices have persistently locked
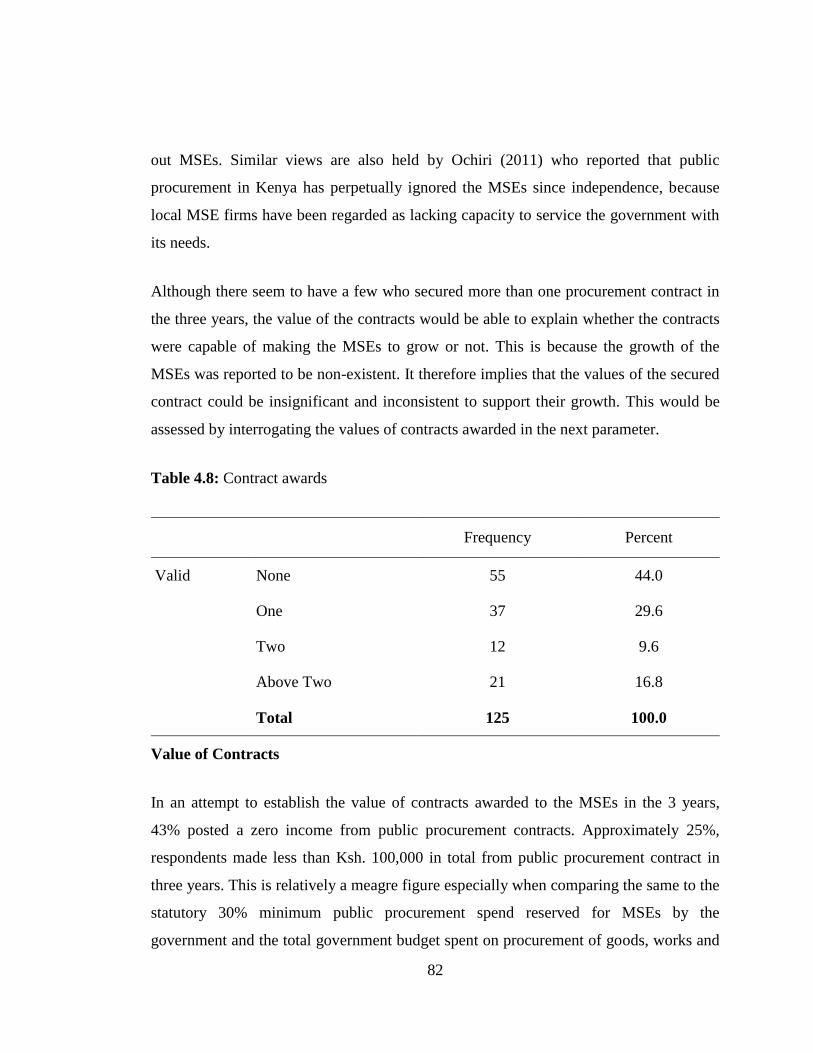
82
out MSEs. Similar views are also held by Ochiri (2011) who reported that public
procurement in Kenya has perpetually ignored the MSEs since independence, because
local MSE firms have been regarded as lacking capacity to service the government with
its needs.
Although there seem to have a few who secured more than one procurement contract in
the three years, the value of the contracts would be able to explain whether the contracts
were capable of making the MSEs to grow or not. This is because the growth of the
MSEs was reported to be non-existent. It therefore implies that the values of the secured
contract could be insignificant and inconsistent to support their growth. This would be
assessed by interrogating the values of contracts awarded in the next parameter.
Table 4.8: Contract awards
Frequency Percent
Valid None 55 44.0
One 37 29.6
Two 12 9.6
Above Two 21 16.8
Total 125 100.0
Value of Contracts
In an attempt to establish the value of contracts awarded to the MSEs in the 3 years,
43% posted a zero income from public procurement contracts. Approximately 25%,
respondents made less than Ksh. 100,000 in total from public procurement contract in
three years. This is relatively a meagre figure especially when comparing the same to the
statutory 30% minimum public procurement spend reserved for MSEs by the
government and the total government budget spent on procurement of goods, works and
83
services. These statistics are way below expectations in as far as supporting and
developing small scale suppliers is a concern.
It is against such backdrop that Ogachi (2013) argued that although the government has
a strategy setting aside minimum 30% of total public procurement spend for the Kenyan
youth, persons with disability and women owned MSEs across the country, the
challenge lies in the implementation system that seems cumbersome, poorly coordinated
and bureaucratic especially in this era of devolved government system. Furthermore,
Ogachi (2013) observes that the categories of contracts set aside for these groups award
are based on low-value jobs. This leaves the older established firms to deal in jobs with
real money further relegating MSEs to the periphery of public procurement
opportunities. Mwendwa (2010) echoes these sentiments and says that the major
challenge that County governments face in implementing devolution in Kenya is
narrowing regional disparities in income, resource endowment and economic
development.
This can be successfully achieved if the devolved system can tap into and harness the
available local resources through the local MSE entrepreneurs by supporting the ‘buy
county-built county’ initiatives. Devolution being the heart of the Constitution,
governors should be the champions of the constitutional spirit and desire to enable locals
to take part in setting their own economic, political and social agenda as contented by
(Alande & Wekhuyi, 2013). This will assist in combating bureaucratic policies
previously experienced in the government at the expense of MSE access to government
opportunities in the defunct County Council administration order, thus hampering their
growth. More details about this aspect are explained in table 4.9.

84
Table 4.9: Value of Contract to MSEs
Frequency Percent
Valid None 54 43.2
Below 100,000 31 24.8
Above 100,000 25 20.0
Over 500,000 15 12.0
Total 125 100.0
Debriefings
The study sought to determine if any debriefings had been accorded the MSEs in Trans
Nzoia County. It was ascertained that the county government of Trans Nzoia hardly ever
conduct debriefing sessions to the MSEs. Anchored on this, it may be generalized that
other county governments across the country do not debrief their MSE on public
procurement. A total of 91% of respondents said that they have never been debriefed on
any procurement process. This could be one of the many other reasons why they keep
losing out on the procurement contracts as they could be repeating similar mistakes
made in the past without information about the same. If the cause of the failure to win
public procurement contract is related to requirement that MSEs have failed to meet,
they should be informed.
In most cases, communication costs are higher for MSEs than large organizations which
hinder effective, fair and open competition among suppliers. In order to mitigate on such
problems, Anyanzwa (2013) states that the government needs to acquire necessary
software and hardware systems that are secure and cost effective to be used to
communicate and share information with the stakeholders. Besides, the MSEs should be
exempted from multiple registration requirements by the PPDPRAR which increases
real costs in terms of effort and time spent in filling myriad compliance forms (Ogachi,
2013).
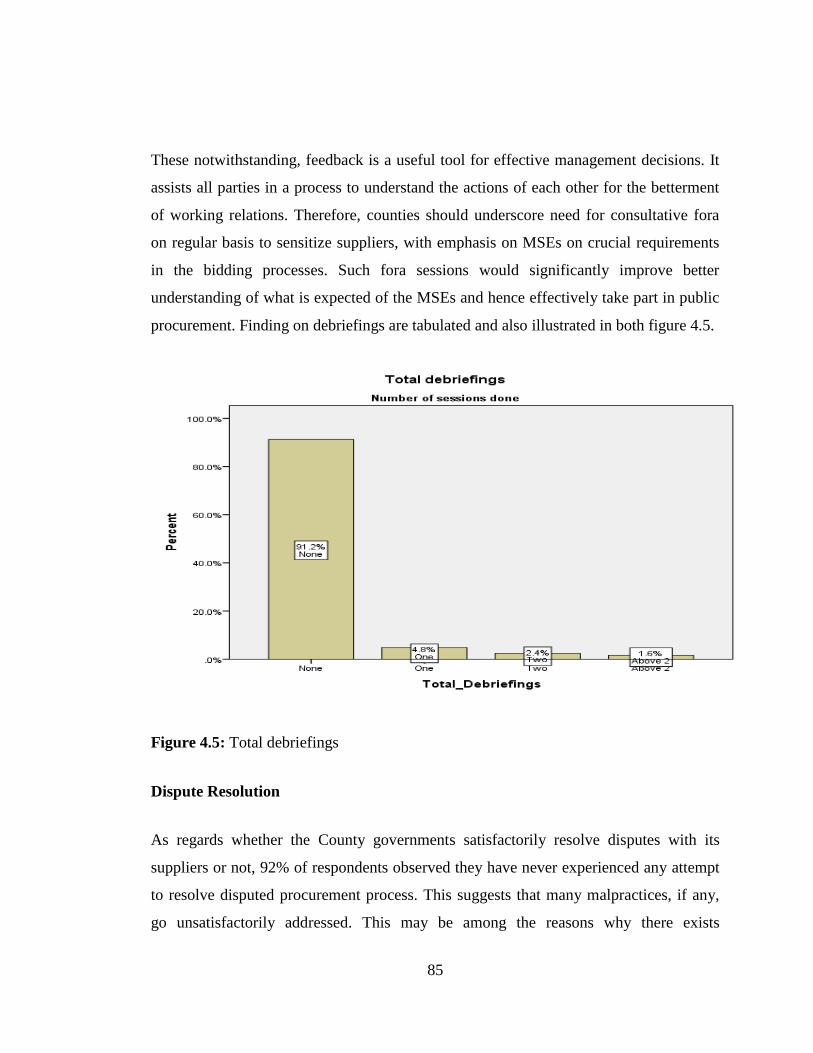
85
These notwithstanding, feedback is a useful tool for effective management decisions. It
assists all parties in a process to understand the actions of each other for the betterment
of working relations. Therefore, counties should underscore need for consultative fora
on regular basis to sensitize suppliers, with emphasis on MSEs on crucial requirements
in the bidding processes. Such fora sessions would significantly improve better
understanding of what is expected of the MSEs and hence effectively take part in public
procurement. Finding on debriefings are tabulated and also illustrated in both figure 4.5.
Figure 4.5: Total debriefings
Dispute Resolution
As regards whether the County governments satisfactorily resolve disputes with its
suppliers or not, 92% of respondents observed they have never experienced any attempt
to resolve disputed procurement process. This suggests that many malpractices, if any,
go unsatisfactorily addressed. This may be among the reasons why there exists

86
perpetuated unabated sidelining of MSEs from mainstream public procurement
processes and hence lack of growth. The culture of unresolved procurement disputes has
tendencies to discourage bidders from taking part in further procurement processes.
However, it is upon the MSE to take the initiative and rise to the occasion to endeavor to
chart their own course taking full advantage of the statutory provisions favoring them in
matters public procurement. They should therefore, refuse to be taken for granted as
lacking capacity to supply government its needs shares (Ochiri, 2012). MSEs should
realize that they occupy a very important economic niche and that they are now the
biggest contributor to national economy, according to a survey by the Kenya National
Bureau of Statistics (KNBS) says (Momanyi, 2016). This information is illustrated in
table 4.10 as follows:
Table 4.10: Disputed procurements
Frequency Percent
Valid None 115 92.0
One 5 4.0
Two 3 2.4
Above 2 2 1.6
Total 125 100.0
Statistics on Growth Parameters
From the data collected, the following statistics were derived and their interpretation
could be as follows. The mean value of the contracts awarded to the MSEs is 0.99. This
indicates that on average, in the three years under the study, the MSEs secured only one
supply contract each to the government entities in the County. On average each MSE
was awarded contracts below Ksh. 100,000 as indicated by the mean of 1.01. On
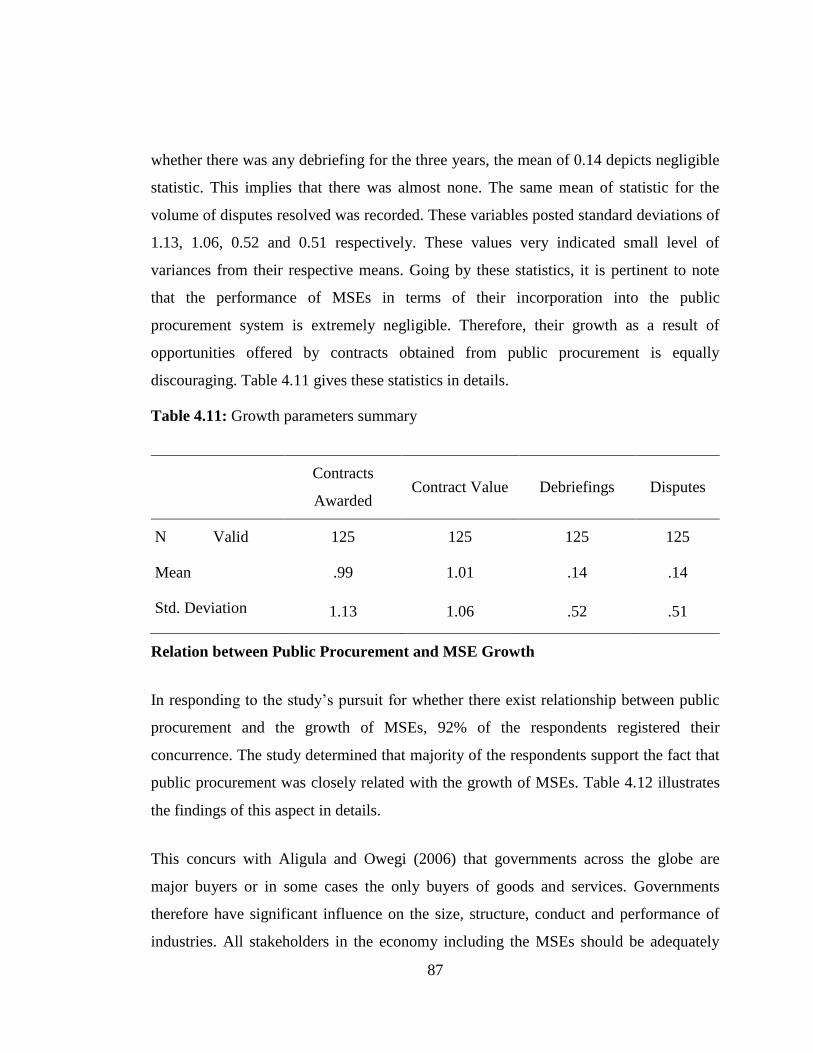
87
whether there was any debriefing for the three years, the mean of 0.14 depicts negligible
statistic. This implies that there was almost none. The same mean of statistic for the
volume of disputes resolved was recorded. These variables posted standard deviations of
1.13, 1.06, 0.52 and 0.51 respectively. These values very indicated small level of
variances from their respective means. Going by these statistics, it is pertinent to note
that the performance of MSEs in terms of their incorporation into the public
procurement system is extremely negligible. Therefore, their growth as a result of
opportunities offered by contracts obtained from public procurement is equally
discouraging. Table 4.11 gives these statistics in details.
Table 4.11: Growth parameters summary
Contracts
Awarded Contract Value Debriefings Disputes
N Valid 125 125 125 125
Mean .99 1.01 .14 .14
Std. Deviation 1.13 1.06 .52 .51
Relation between Public Procurement and MSE Growth
In responding to the study’s pursuit for whether there exist relationship between public
procurement and the growth of MSEs, 92% of the respondents registered their
concurrence. The study determined that majority of the respondents support the fact that
public procurement was closely related with the growth of MSEs. Table 4.12 illustrates
the findings of this aspect in details.
This concurs with Aligula and Owegi (2006) that governments across the globe are
major buyers or in some cases the only buyers of goods and services. Governments
therefore have significant influence on the size, structure, conduct and performance of
industries. All stakeholders in the economy including the MSEs should be adequately
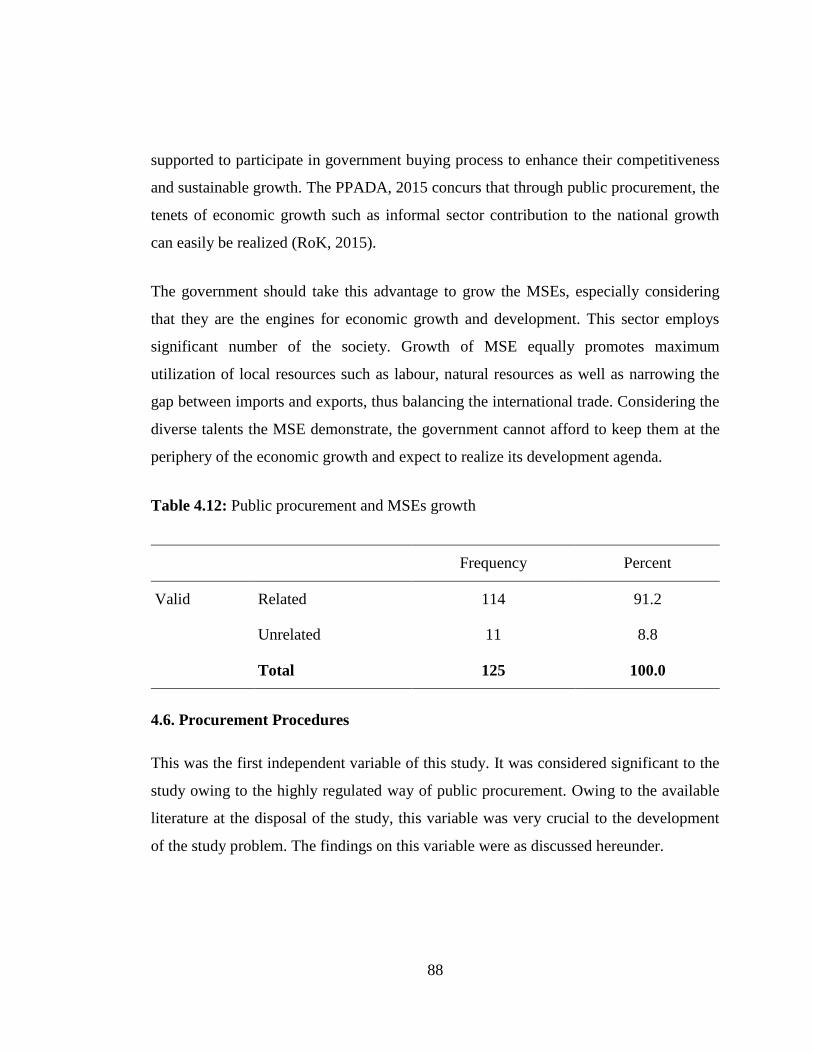
88
supported to participate in government buying process to enhance their competitiveness
and sustainable growth. The PPADA, 2015 concurs that through public procurement, the
tenets of economic growth such as informal sector contribution to the national growth
can easily be realized (RoK, 2015).
The government should take this advantage to grow the MSEs, especially considering
that they are the engines for economic growth and development. This sector employs
significant number of the society. Growth of MSE equally promotes maximum
utilization of local resources such as labour, natural resources as well as narrowing the
gap between imports and exports, thus balancing the international trade. Considering the
diverse talents the MSE demonstrate, the government cannot afford to keep them at the
periphery of the economic growth and expect to realize its development agenda.
Table 4.12: Public procurement and MSEs growth
Frequency Percent
Valid Related 114 91.2
Unrelated 11 8.8
Total 125 100.0
4.6. Procurement Procedures
This was the first independent variable of this study. It was considered significant to the
study owing to the highly regulated way of public procurement. Owing to the available
literature at the disposal of the study, this variable was very crucial to the development
of the study problem. The findings on this variable were as discussed hereunder.
89
4.6.1 Procurement Regulation
The study sought to ascertain how regulation of public procurement affects participation
and growth of MSEs. It was established 85% respondents felt it actually did. The
regulation of public procurement entails the rules, regulations and policies measures put
in place to govern procurement processes in government entities. Among them is the
legal framework put in place by the government which encompasses the Public
Procurement and Asset Disposal Act, (PPADA) 2015 among other statues.
Concurrence to this finding is the proposition by Njiraini and Moyi (2006) who opine
that procurement regulation procedures in Kenya have tendencies of locking out MSEs
by imposing tight regulation such as levying high volume standards, need for proof of
large financial base and other stringent pre-qualification standards. According to Amayi
et al, (2013) the legal framework in Kenya is bureaucratically cumbersome to the extent
of rendering public procurement performance ineffective. According to Kenya Institute
of Supplies Management (KISM), the Kenyan Constitution calls for use of public
procurement to meet social objectives such as supporting small businesses and
disadvantaged groups through public procurement procedures (KISM, 2013). Matindi
and Ngugi (2013) say that according to the National Association of State Procurement
Officials, the procurement environment of public sector has become complex more than
ever before. This is especially compounded by the advent of devolution as reinforced by
revision of procurement regulations in Kenya. Muteru (2013) observed that
Governments in the developing nations are grappling with the need to develop an
environment conducive to job creation with a view to generate employment for the high
number of new labour market entrants and reduce high structural unemployment vide
MSE sector.
Based on this finding viv-a-vis the objectives of the MSE sector, the procurement
regulatory environments seems to be unsupportive of the MSEs. The government should
therefore aspire to work on the procurement procedures in order to ensure the objects of
public procurement as anchored on Section 227 of the Constitution of Kenya are
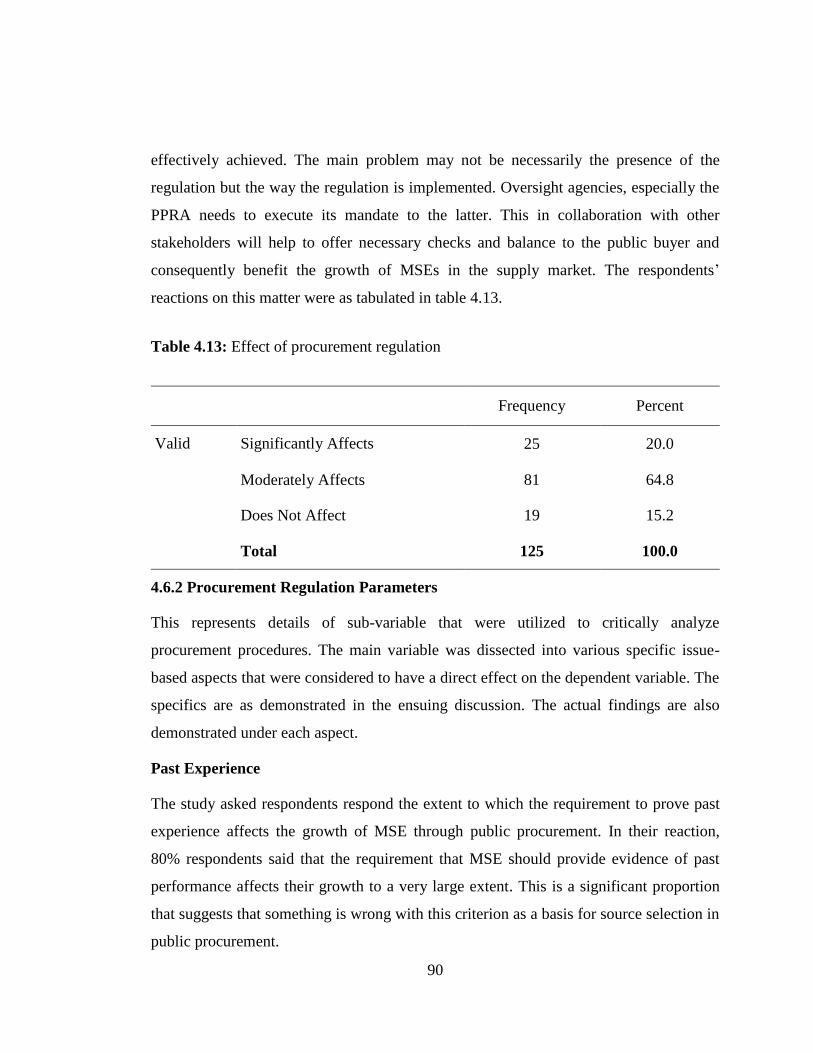
90
effectively achieved. The main problem may not be necessarily the presence of the
regulation but the way the regulation is implemented. Oversight agencies, especially the
PPRA needs to execute its mandate to the latter. This in collaboration with other
stakeholders will help to offer necessary checks and balance to the public buyer and
consequently benefit the growth of MSEs in the supply market. The respondents’
reactions on this matter were as tabulated in table 4.13.
Table 4.13: Effect of procurement regulation
Frequency Percent
Valid Significantly Affects 25 20.0
Moderately Affects 81 64.8
Does Not Affect 19 15.2
Total 125 100.0
4.6.2 Procurement Regulation Parameters
This represents details of sub-variable that were utilized to critically analyze
procurement procedures. The main variable was dissected into various specific issue-
based aspects that were considered to have a direct effect on the dependent variable. The
specifics are as demonstrated in the ensuing discussion. The actual findings are also
demonstrated under each aspect.
Past Experience
The study asked respondents respond the extent to which the requirement to prove past
experience affects the growth of MSE through public procurement. In their reaction,
80% respondents said that the requirement that MSE should provide evidence of past
performance affects their growth to a very large extent. This is a significant proportion
that suggests that something is wrong with this criterion as a basis for source selection in
public procurement.
91
A number of studies concur with these findings. According to Njiraini and Moyi (2006)
Kenya’s public sector purchasing procedures and practices have persistently locked out
MSEs through high volume standards, need for proof of large financial base and other
pre-qualification standards. According to Omondi (2016), over 400,000 Kenyan MSEs
collapse annually. Pearce, et al (2012) concurs that government support for MSEs
participation in economic growth or its willingness to remove barriers for fair trade can
have positive influence on their growth. However, public procurement in Kenya has
perpetually ignored the MSEs because local MSE firms have been regarded as lacking
experience and capacity to service the government with its needs, reports (Ochiri, 2011).
This scenario has been a major setback towards the growth of this important informal
sector leading to the endless ailing of entrepreneurship culture in Kenya, contends
(Muniu & Ngugi, 2013). Despite all the effort and determination made by micro and
small enterprises to participate in public procurement, they remain unable to grow due to
stiff criteria and lack of support by large corporate markets such as public procurement,
a position supported by (Ogwel, Iravo & Lagat, 2016; Ongachi & Bwisa, 2013).
Although it may not be the sole discriminatory factor for effective growth of MSE as a
source of supply to the government, requirement for sufficient past experience has had a
negative toll to their participation and growth. It is pertinent for the government to
reconsider its prequalification criteria with regard to selection of supply sources
especially from MSE sector. Stringent source selection regulations could be among the
causes of the collapse of most MSE to the alarming tune of 400,000 annually as
(Omondi, 2016) posits. Figure 4.6 gives more details about this finding.

92
Figure 4.6: Past experience
Financial Capability
The study sought to establish how requirement for proof of financial capability affected
MSEs participation and growth in public procurement. In response, approximately 85%
felt that it significantly inhibited them from effectively taking part in public
procurement. This has consequently thwarted their desired growth and thus rendered
them helpless. Most of the MSE seem to have lean financial base and even need
intervention of some sort to help them source their capital to suffice government
contracts. This is instead of being required to proof their capitation for them to win the
contracts.
Mohamed and Mnguu (2014) in their thesis titled Fiscal and Monetary Policies:
Challenges for Small and Medium Enterprises (SMEs) Development in Tanzania in
evaluating challenges afflicting the growth and development of SMEs concurred that
among the factors limiting the participation and growth of SMEs include complex,
costly regulatory and administrative environment. These disadvantage the SMEs against
their large sized enterprise counterparts already enjoying the advantage of scale

93
economies with attractive break-even levels. The high cost of compliance to regulations
discourage the potentiality of SMEs to their businesses, while driving some of the
existing enterprises out of business and rendering joblessness to their employees and the
economy at large. Other inhibitive factors for the survival of SMEs include tight
registration procedures, vague regulative policies, inadequate infrastructure and
bureaucratic processing time (Mohamed & Mnguu, 2014).
Financial ability remains a nightmare not only of the MSEs but medium and large
enterprises as well. The government should come up with supportive schemes such as
pay to procure payment in advance (PIA) specifically for MSE suppliers. The current
procure to pay (P2P) only favours the big brothers of the trade with plummeted scale
quantity advantages. The payment cycles also need to be strictly complied with and even
scaled downwards to reduce long suffering for the MSE in terms of pending bills.
Liquidity problems remain the sole pandemic killer of MSE in the competitive market
environment. Table 4.14 give summary of the findings.
Table 4.14: Financial capability
Frequency Percent
Valid Large Extent 19 15.2
Very Large Extent 106 84.8
Total 125 100.0
Staff Competences
When asked to give their position on whether a requirement that MSEs should
demonstrate staff competence in order to be allowed to participate in procurement
processes, 66% agreed. They posted that it has significant effect on their much required
growth through public procurement opportunities. This is a significant number that
cannot be ignored just and wished away on any basis of argument.
94
It is extremely important to note, as also concurred by Indire, et al (2008) that
government participates in business in various ways including establishment of
regulatory framework and operating procedures. In order to make it easy for MSEs to
effectively participate in procurement processes, a number of reforms focused on
capacity development are necessary. Many countries have come up with procurement
reforms to streamline operations in Public Finance Management Systems, (Eyaa &
Oluka, 2011). In Kenya, this should aim to assist the government to align Kenya’s
Vision 2030 which relies on harnessing private sector resources to build public
infrastructure for sustainable economic growth and development. Nonetheless, the
challenges in public procurement go beyond procurement rules and regulations to
include process, methods, organizational structure and work force training and
development, views shared by (Eyaa & Oluka, 2011). Pearce et al, (2012) say that
offering capacity development support for the MSE business can help to foster their
participation in procurement procedures and contribute to their economic growth.
This foregoing therefore, require the government to establish deliberate effort to offer
training and development to the MSEs. This will go a long way into equipping the small
scale entities to improve on their performance. Equally, the government should also
consider establishing tailor made strategies such as sponsoring business incubators for
the MSE where necessary skills, knowledge and aptitudes can be disseminated to them.
This would consequently, hopefully help the MSE to gain better competences to
participate in government procurement process and in effect raise their growth transition
rates. Table 4.15 gives respondents details about competence requirement criterion as a
means to obtain access to public procurement.

95
Table 4.15: MSE Staff Competences
Frequency Percent
Valid Moderate Extent 2 1.6
Large Extent 40 32.0
Very Large Extent 83 66.4
Total 125 100.0
Legal Registration
When they were asked to indicate how requirement to fulfill legal obligations affected
their ability to grow themselves in public procurement, 94% reported that it had
significant influence on MSE participation in public procurement and hence their
growth. From table 4.16 below, majority expressed views that this requirement greatly
affects their participation in public procurement. Despite registering with Micro and
Small Enterprise Authority, they still cannot secure any meaningful business that could
guarantee them of sustainable growth. However, legal registration is mandatory for not
only the government but also all other entities to engage any part into contractual
dealings.
Despite that, this study’s finding aligns well with Njiraini and Moyi (2006) who say that
the government should consider simplifying the complicated registration processes. This
will enable and permit the MSEs to effectively take advantage of the opportunities that
come with public procurement. Multiple registration requirements that that have dogged
the MSEs which include incorporation registration, registration with the National
Treasury for the AGPO program, KRA certification among other types of registration
have a significant impact on the MSEs ability to take part in public procurement. These
sentiments concur with Ogachi (2013) observation that multiple registration
requirements continue having a toll on the implementation of the AGPO scheme. There
need for simplification and easing of these requirements to the most affordable extent
possible.
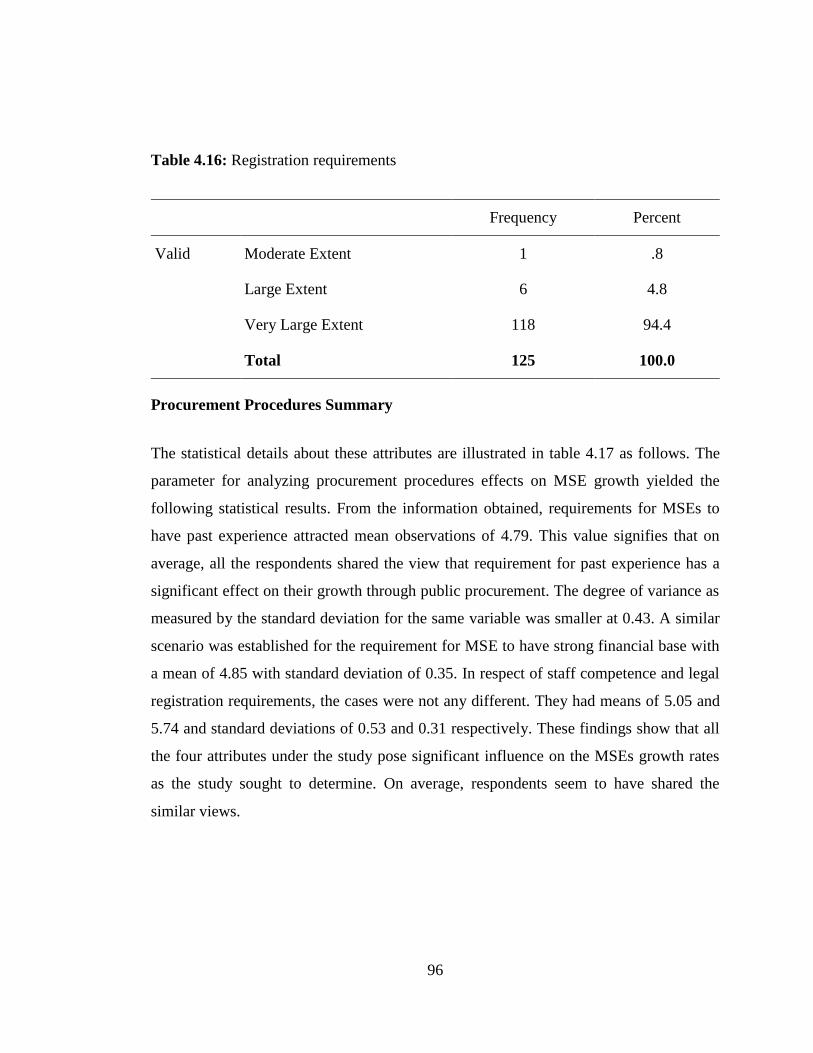
96
Table 4.16: Registration requirements
Frequency Percent
Valid Moderate Extent 1 .8
Large Extent 6 4.8
Very Large Extent 118 94.4
Total 125 100.0
Procurement Procedures Summary
The statistical details about these attributes are illustrated in table 4.17 as follows. The
parameter for analyzing procurement procedures effects on MSE growth yielded the
following statistical results. From the information obtained, requirements for MSEs to
have past experience attracted mean observations of 4.79. This value signifies that on
average, all the respondents shared the view that requirement for past experience has a
significant effect on their growth through public procurement. The degree of variance as
measured by the standard deviation for the same variable was smaller at 0.43. A similar
scenario was established for the requirement for MSE to have strong financial base with
a mean of 4.85 with standard deviation of 0.35. In respect of staff competence and legal
registration requirements, the cases were not any different. They had means of 5.05 and
5.74 and standard deviations of 0.53 and 0.31 respectively. These findings show that all
the four attributes under the study pose significant influence on the MSEs growth rates
as the study sought to determine. On average, respondents seem to have shared the
similar views.

97
Table 4.17: Procurement procedures summary
Experience Financial Competence Registration
N Valid 125 125 125 125
Mean 4.79 4.85 5.05 5.74
Std. Deviation .43 .36 .53 .31
Nature of Influence
The study sought to ascertain whether procurement procedures influence positively or
negatively the growth of MSEs in the county. In response, 85% felt that they have
retrogressively influenced their growth. This shows that the public procurement
procedures currently in place are yet to post any positive support for the growth of
MSEs. Although a few respondents differ in opinion, the majority paint a gloomy picture
of the whole scenario. This requires attention of the government policy makers and
strategists. More details are presented in figure 4.7.
This finding does not significantly depart from Njiraini and Moyi (2006) views that
Kenya’s public sector purchasing procedures and practices have persistently locked out
MSEs through high volume pre-qualification standards. Devolution being the heart of
the national development, governors should be the champions of the constitutional spirit
and desire to enable locals to take part in setting their own economic, political and social
agenda, (Alande & Wekhuyi, 2013). This will assist in combating bureaucratic policies
previously experienced in the government at the expense of MSE access to government
opportunities (Mulwa, 2010). In order to enhance sustainable positive and expeditious
growth of MSE, the County governments should put in place entrepreneurship
promoting policies with positive externalities to enhance economic growth and
development not only for the national economy, but also for potential entrepreneurial
activities at county level observe (Abosede, et al, 2013).
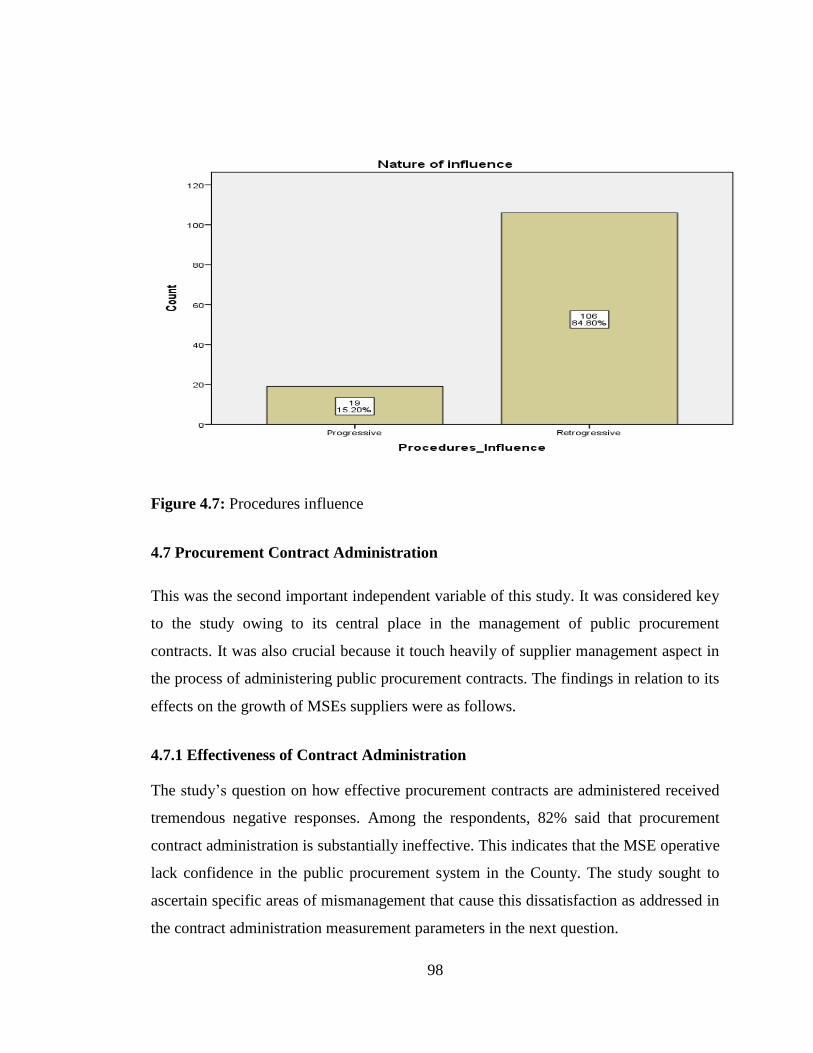
98
Figure 4.7: Procedures influence
4.7 Procurement Contract Administration
This was the second important independent variable of this study. It was considered key
to the study owing to its central place in the management of public procurement
contracts. It was also crucial because it touch heavily of supplier management aspect in
the process of administering public procurement contracts. The findings in relation to its
effects on the growth of MSEs suppliers were as follows.
4.7.1 Effectiveness of Contract Administration
The study’s question on how effective procurement contracts are administered received
tremendous negative responses. Among the respondents, 82% said that procurement
contract administration is substantially ineffective. This indicates that the MSE operative
lack confidence in the public procurement system in the County. The study sought to
ascertain specific areas of mismanagement that cause this dissatisfaction as addressed in
the contract administration measurement parameters in the next question.

99
This finding compares relatively well with a number of observations by other scholars.
For instance, Aketch (2013) reported that in order to enable the government to achieve
the public procurement objectives as enshrined in the PPADA, 2015 and other
regulatory framework, procurement personnel should exercise high levels of
professionalism in the discharge of their mandates. According to Eyaa and Oluka
(2011), the overall area where public procurement management at both the Central
Government (CG) and Local Government (LG) Procurement and Disposal Entities
(PDEs) score the lowest is in respect to contract award and contract management and
administration. The reason being that public procurement is vulnerable to all manner of
irregularities such as bribery and bid rigging. Aketch and Karanja (2013) observed that
public procurement irregularities are most likely to occur in public utility funding
activities such as award and general administration of public contracts.
Gauging by these views, procurement contract administration is a very sensitive part in
the procurement process. Any slight impropriety on the part of the contract managers
results in unimaginable level of mistrust and loss of confidence by various stakeholders.
It is therefore helpful for the government procurement contract administrators to exhibit
high degree of professionalism when handling their duties. Issues of concern include
among others conflict of interest, bid rigging, subjecting MSEs to unfair competition,
withholding of crucial information and general lack of corporate social responsibility to
relevant stakeholders. More findings on aspect are clearly explained by table 4.18.
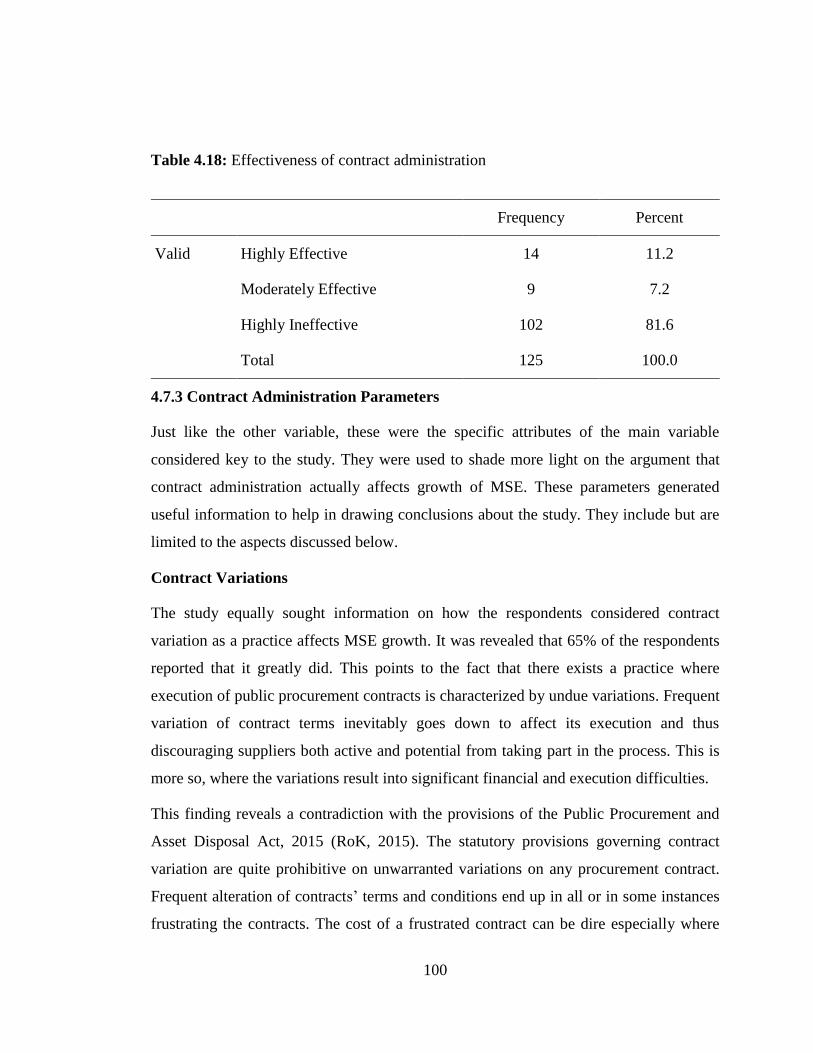
100
Table 4.18: Effectiveness of contract administration
Frequency Percent
Valid Highly Effective 14 11.2
Moderately Effective 9 7.2
Highly Ineffective 102 81.6
Total 125 100.0
4.7.3 Contract Administration Parameters
Just like the other variable, these were the specific attributes of the main variable
considered key to the study. They were used to shade more light on the argument that
contract administration actually affects growth of MSE. These parameters generated
useful information to help in drawing conclusions about the study. They include but are
limited to the aspects discussed below.
Contract Variations
The study equally sought information on how the respondents considered contract
variation as a practice affects MSE growth. It was revealed that 65% of the respondents
reported that it greatly did. This points to the fact that there exists a practice where
execution of public procurement contracts is characterized by undue variations. Frequent
variation of contract terms inevitably goes down to affect its execution and thus
discouraging suppliers both active and potential from taking part in the process. This is
more so, where the variations result into significant financial and execution difficulties.
This finding reveals a contradiction with the provisions of the Public Procurement and
Asset Disposal Act, 2015 (RoK, 2015). The statutory provisions governing contract
variation are quite prohibitive on unwarranted variations on any procurement contract.
Frequent alteration of contracts’ terms and conditions end up in all or in some instances
frustrating the contracts. The cost of a frustrated contract can be dire especially where
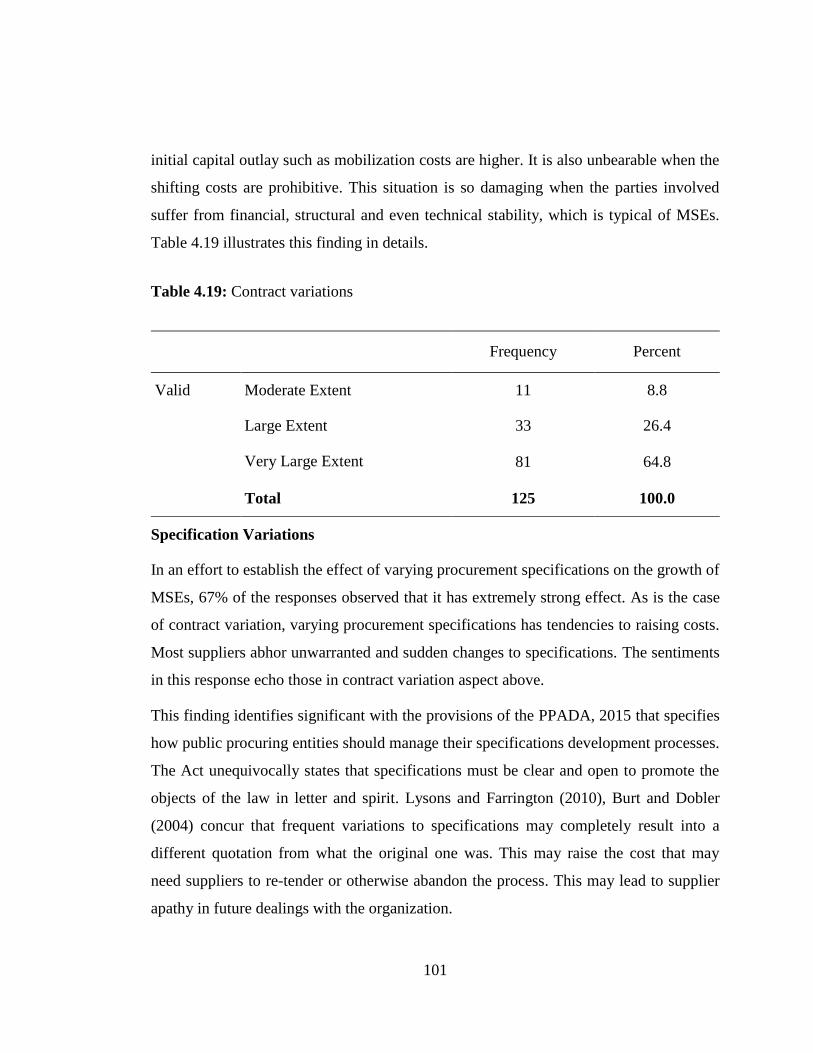
101
initial capital outlay such as mobilization costs are higher. It is also unbearable when the
shifting costs are prohibitive. This situation is so damaging when the parties involved
suffer from financial, structural and even technical stability, which is typical of MSEs.
Table 4.19 illustrates this finding in details.
Table 4.19: Contract variations
Frequency Percent
Valid Moderate Extent 11 8.8
Large Extent 33 26.4
Very Large Extent 81 64.8
Total 125 100.0
Specification Variations
In an effort to establish the effect of varying procurement specifications on the growth of
MSEs, 67% of the responses observed that it has extremely strong effect. As is the case
of contract variation, varying procurement specifications has tendencies to raising costs.
Most suppliers abhor unwarranted and sudden changes to specifications. The sentiments
in this response echo those in contract variation aspect above.
This finding identifies significant with the provisions of the PPADA, 2015 that specifies
how public procuring entities should manage their specifications development processes.
The Act unequivocally states that specifications must be clear and open to promote the
objects of the law in letter and spirit. Lysons and Farrington (2010), Burt and Dobler
(2004) concur that frequent variations to specifications may completely result into a
different quotation from what the original one was. This may raise the cost that may
need suppliers to re-tender or otherwise abandon the process. This may lead to supplier
apathy in future dealings with the organization.
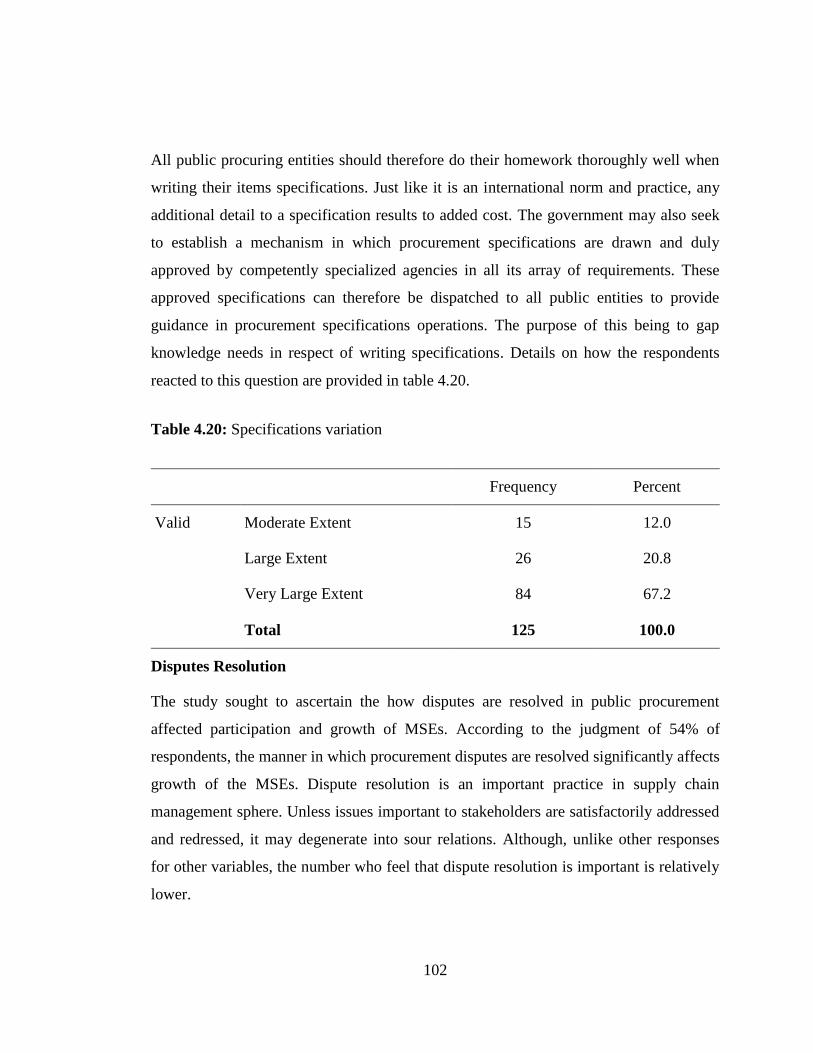
102
All public procuring entities should therefore do their homework thoroughly well when
writing their items specifications. Just like it is an international norm and practice, any
additional detail to a specification results to added cost. The government may also seek
to establish a mechanism in which procurement specifications are drawn and duly
approved by competently specialized agencies in all its array of requirements. These
approved specifications can therefore be dispatched to all public entities to provide
guidance in procurement specifications operations. The purpose of this being to gap
knowledge needs in respect of writing specifications. Details on how the respondents
reacted to this question are provided in table 4.20.
Table 4.20: Specifications variation
Frequency Percent
Valid Moderate Extent 15 12.0
Large Extent 26 20.8
Very Large Extent 84 67.2
Total 125 100.0
Disputes Resolution
The study sought to ascertain the how disputes are resolved in public procurement
affected participation and growth of MSEs. According to the judgment of 54% of
respondents, the manner in which procurement disputes are resolved significantly affects
growth of the MSEs. Dispute resolution is an important practice in supply chain
management sphere. Unless issues important to stakeholders are satisfactorily addressed
and redressed, it may degenerate into sour relations. Although, unlike other responses
for other variables, the number who feel that dispute resolution is important is relatively
lower.
103
For the public procuring entities in Kenya, there are bodies established to deal with
procurement dispute. PPADA, 2015 establishes Public Procurement Administrative and
Appeals Review Board (PPAARB) (RoK, 2015). According to Lysons et al, (2010),
effective dispute resolution is a recipe for pleasant working relations with suppliers. It is
essentially part of the corporate social responsibility (CSR) to suppliers. Seemingly,
PPAARB seems to be ineffective in their mandate and therefore causing MSE to opt not
to seek their intervention in the many disputes that there may be. This is ultimately
affecting their participation in public procurement with the consequences of negative
growth rate.
This trend may be reversed by the agencies responsible for resolving disputes rising to
the occasion and delivering effective, efficient and progressive decisions and judgments
in matters procurement. The agencies such PPAARB, EACC and ODPP should actively
help in resolving the issues raised by MSE and even facilitate affordable mechanisms
through which such disputes may be raised by aggrieved parties without strain. The
entities need to adopt a proactive approach in resolving disputes in order to create and
build confidence among the MSEs. This will encourage them to take part in public
procurement and hence improve on their growth rate. The details are provided in table
4.21.

104
Table 4.21: Dispute resolution
Frequency Percent
Valid Very Small Extent 1 .8
Small Extent 1 .8
Moderate Extent 26 20.8
Large Extent 30 24.0
Very Large Extent 67 53.6
Total 125 100.0
Debriefing
In seeking to discover how debriefing affects the growth of MSEs, study established this
was among the factors that significantly affect MSEs growth. According to the finding,
46% of the respondents reported that they approve the fact that debriefing sessions
affects their participation and growth in public procurement. However, it was the only
variable among the five tested in the same group that had two equally rated tallies by the
respondents shown in table 4.22.
PPADA, 2015 provides for the notification to be made to all bidders that take part in a
procurement process at the award stage (RoK, 2015). This is despite of whether they lost
the tender or not or whether they requested for the notification or not. However, the law
does not make it mandatory to inform the bidders who lose, the reasons why they lost in
the process. This could have been an opportune moment for an automatic debriefing
effort. It only stipulates grounds under which such information may be provided, of
which they involve some element of sacrifice for the seeker to undergo such through
litigation and appeal. These involve financial implications that may be out of reach by
MSEs and thus not pursued in most circumstances.
There is need to make debriefing a mandatory statutory requirement for all public
entities. This will not only help to foster bidding skills but also enhance the participation

105
spirit for MSE. With an increase in the level of participation in procurement processes,
the small scale suppliers will be able to grow because frequent participation sharpens
bidding skills. Wekesa (2013) sums this by observing that for an organization to have a
good administrative system, the solution is through collaborative investment and
partnership with stakeholders. These details are explained in table 4.27 as follows.
Table 4.22: Debriefings
Frequency Percent
Valid Very Small Extent 1 .8
Moderate Extent 20 16.0
Large Extent 52 41.6
Very Large Extent 52 41.6
Total 125 100.0
Contract Documentation
The study sought to understand if contract documentation affects the MSEs growth in
public procurement. Contract documentation was noted to significantly affect MSE
growth. This is according to 71% of the respondents who shared the views. It could be
concluded that the management of procurement contracts records have been facing
numerous management problems. This could probably have degenerated into scenarios
such as delayed payments. Bearing in mind that records are life blood of any
organization, their mismanagement portends serious problems on activity management.
This finding concurs with the provisions of the PPADA, 2015. The Act clarifies that
contract administration is the management of terms of procurement or asset disposal
contracts made with contractors or suppliers after tender award by a procuring entity, for
the purpose of assuring compliance with the obligations such as timely delivery, quality
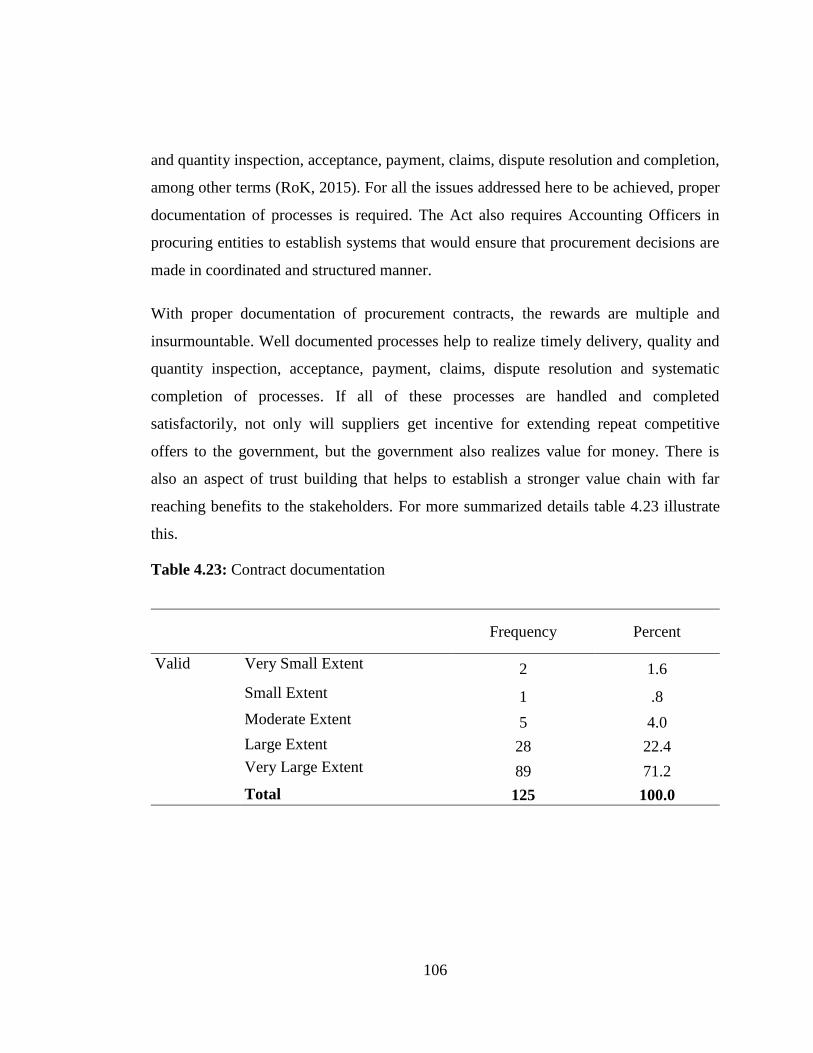
106
and quantity inspection, acceptance, payment, claims, dispute resolution and completion,
among other terms (RoK, 2015). For all the issues addressed here to be achieved, proper
documentation of processes is required. The Act also requires Accounting Officers in
procuring entities to establish systems that would ensure that procurement decisions are
made in coordinated and structured manner.
With proper documentation of procurement contracts, the rewards are multiple and
insurmountable. Well documented processes help to realize timely delivery, quality and
quantity inspection, acceptance, payment, claims, dispute resolution and systematic
completion of processes. If all of these processes are handled and completed
satisfactorily, not only will suppliers get incentive for extending repeat competitive
offers to the government, but the government also realizes value for money. There is
also an aspect of trust building that helps to establish a stronger value chain with far
reaching benefits to the stakeholders. For more summarized details table 4.23 illustrate
this.
Table 4.23: Contract documentation
Frequency Percent
Valid Very Small Extent 2 1.6
Small Extent 1 .8
Moderate Extent 5 4.0
Large Extent 28 22.4
Very Large Extent 89 71.2
Total 125 100.0
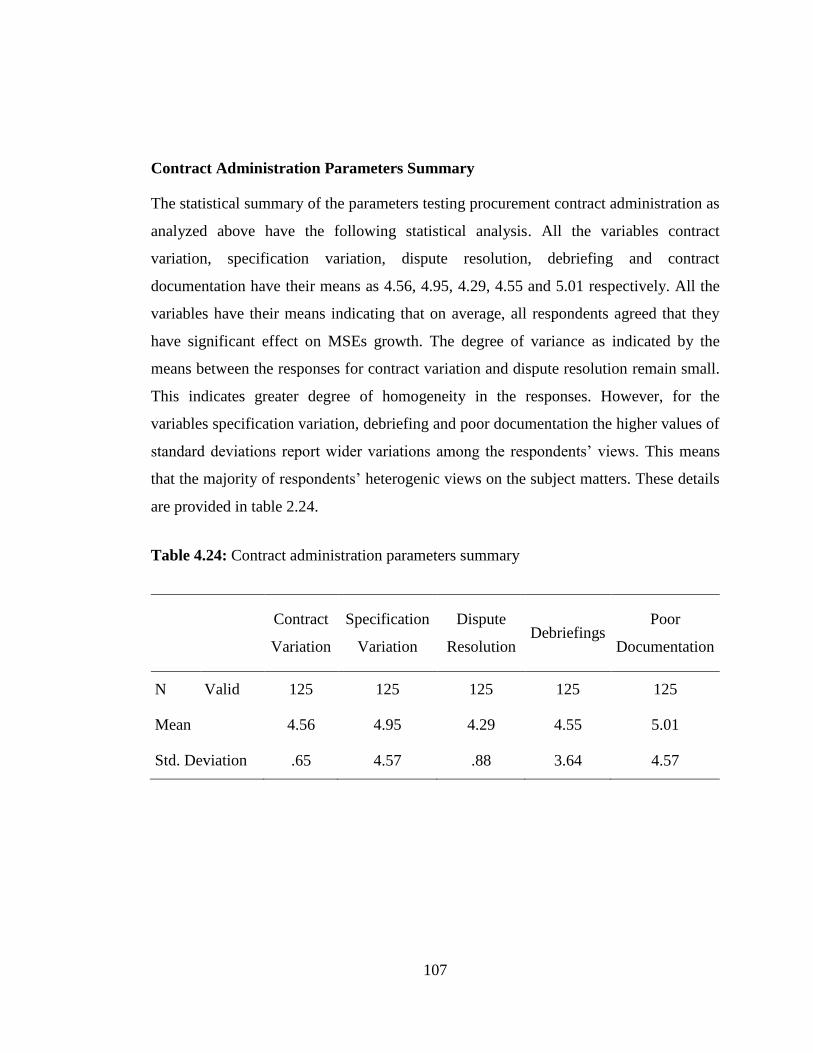
107
Contract Administration Parameters Summary
The statistical summary of the parameters testing procurement contract administration as
analyzed above have the following statistical analysis. All the variables contract
variation, specification variation, dispute resolution, debriefing and contract
documentation have their means as 4.56, 4.95, 4.29, 4.55 and 5.01 respectively. All the
variables have their means indicating that on average, all respondents agreed that they
have significant effect on MSEs growth. The degree of variance as indicated by the
means between the responses for contract variation and dispute resolution remain small.
This indicates greater degree of homogeneity in the responses. However, for the
variables specification variation, debriefing and poor documentation the higher values of
standard deviations report wider variations among the respondents’ views. This means
that the majority of respondents’ heterogenic views on the subject matters. These details
are provided in table 2.24.
Table 4.24: Contract administration parameters summary
Contract
Variation
Specification
Variation
Dispute
Resolution Debriefings
Poor
Documentation
N Valid 125 125 125 125 125
Mean 4.56 4.95 4.29 4.55 5.01
Std. Deviation .65 4.57 .88 3.64 4.57
108
Equitability of Procurement Opportunities
The study wanted to establish whether the procurement opportunities were equitably
distributed in the county. When they were asked how equitable public procurement
opportunities are rationalized in the county, 935 of the respondents said that the
opportunities were skewed to a few suppliers. The finding supports the findings posted
in the measures of MSE growth parameters above which established that majority of
MSE are unable to secure contracts in governments entities. This has gone ahead to
curtail their potential growth, consequently phasing majority of them out of business.
This finding echoes Njiraini and Moyi (2006) findings that Kenya’s public sector
purchasing practices have persistently sidelined MSEs. Ogachi (2013) argues that
although the government has legislated to set aside 30% of total public procurement
spend for the MSEs across the country, the challenge lies in the implementation system
especially in this era of devolved government regime. The growth of MSE sector in
Kenya continues to suffer from dilapidated infrastructure and continued harassment
from the government procurement agencies that undermine their desired growth says,
(Muniu & Ngugi, 2013). The most disturbing aspect here is the harassment by
government operatives.
This study observes that the problems bedeviling MSE in their bids to secure
procurement contracts are fueled by multiplicity of other factors. Considering that
contract awards are slop sided and skewed towards one side of the supply category of
firms tells that the oversight agencies have failed in their mandates. It is incumbent upon
the government to crack the whip and have the institutions responsible to execute their
mandates as expressly set in their respective statutes. In the case of overlapping
mandates like other agencies appear to be, the government should consider merging the
agencies to establish one or few vibrant entities that effectively oversight the
procurement system in Kenya. Equitable rationalization of procurement opportunities is
presented in figure 4.8.
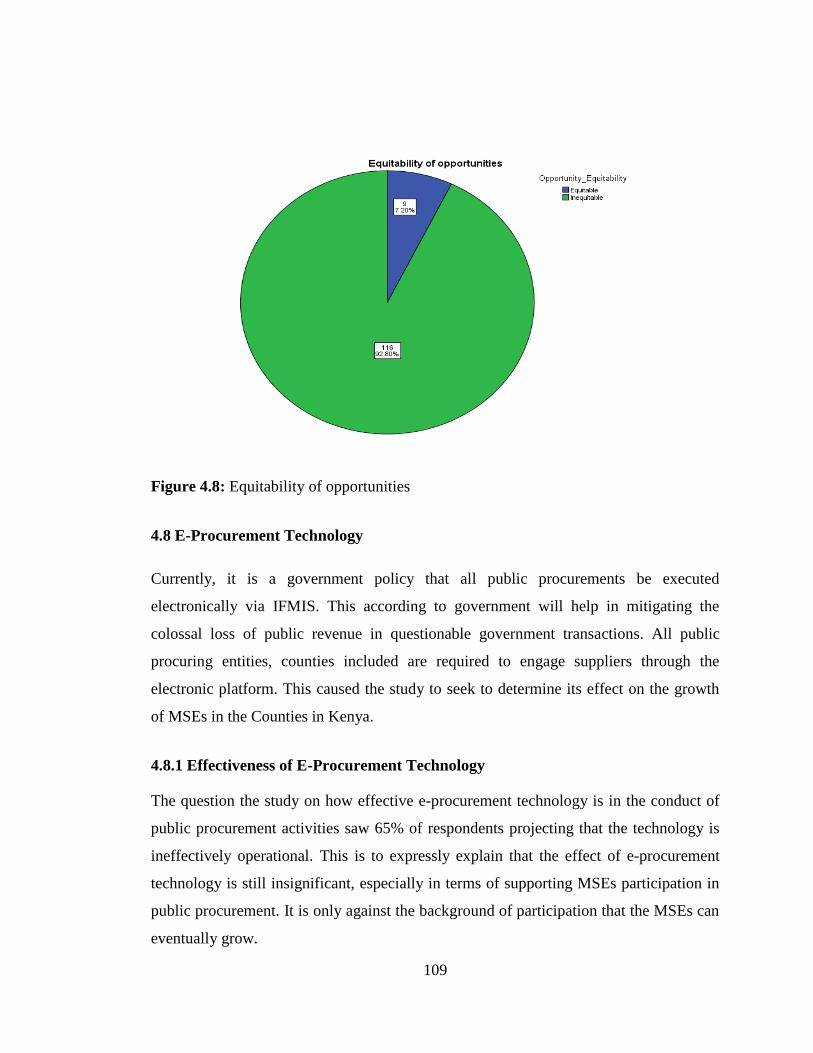
109
Figure 4.8: Equitability of opportunities
4.8 E-Procurement Technology
Currently, it is a government policy that all public procurements be executed
electronically via IFMIS. This according to government will help in mitigating the
colossal loss of public revenue in questionable government transactions. All public
procuring entities, counties included are required to engage suppliers through the
electronic platform. This caused the study to seek to determine its effect on the growth
of MSEs in the Counties in Kenya.
4.8.1 Effectiveness of E-Procurement Technology
The question the study on how effective e-procurement technology is in the conduct of
public procurement activities saw 65% of respondents projecting that the technology is
ineffectively operational. This is to expressly explain that the effect of e-procurement
technology is still insignificant, especially in terms of supporting MSEs participation in
public procurement. It is only against the background of participation that the MSEs can
eventually grow.

110
This finding contracts the benefits of electronic procurement, arguably that it leads to
more market transactions, improves market transparency, lowers search and supplier
switching costs besides improving the overall management of supply chains as
concurred by (Aketch & Karanja, 2013 & Eyaa & Oluka, 2011). However, it concurs
with Aketch and Karanja (2013) who argue that despite the aforementioned influence of
ICT on procurement performance, it is disheartening to note that its implementation in
most Kenyan entities is still poor. According to Pearce (2012) firms in competitive
market environment must strive to understand both the existing technological advances
and the probable future advances that can affect their products and service delivery. This
is likely to offer competitive advantage especially in identifying and ceasing business
opportunities within the environment.
Pertinent to note from this variable is the general emphasis and desire that government
procurement processes head towards electronic transactions. The re-engineering of the
IFMIS in government entities is desired to transform the procurement operations from
manual to electronic platform. However, by critically analyzing the respondents’
reactions, it is conspicuously discernible that the electronic platform in public procuring
entities is substantially parallel in a way to manual systems to the extent of rendering the
e-technology ineffective and insignificant. The main reason for this kind of scenario
could be that there is a lacuna in the law that procuring entities exploit to circumvent the
spirit of automation of procurement operations. The best way out of this kind of a
situation is to cap the degree to which alternative, non-electronic systems may be
utilized in executing procurement operations with emphasis on electronic procurement
technology. Table 4.25 presents these findings in details.
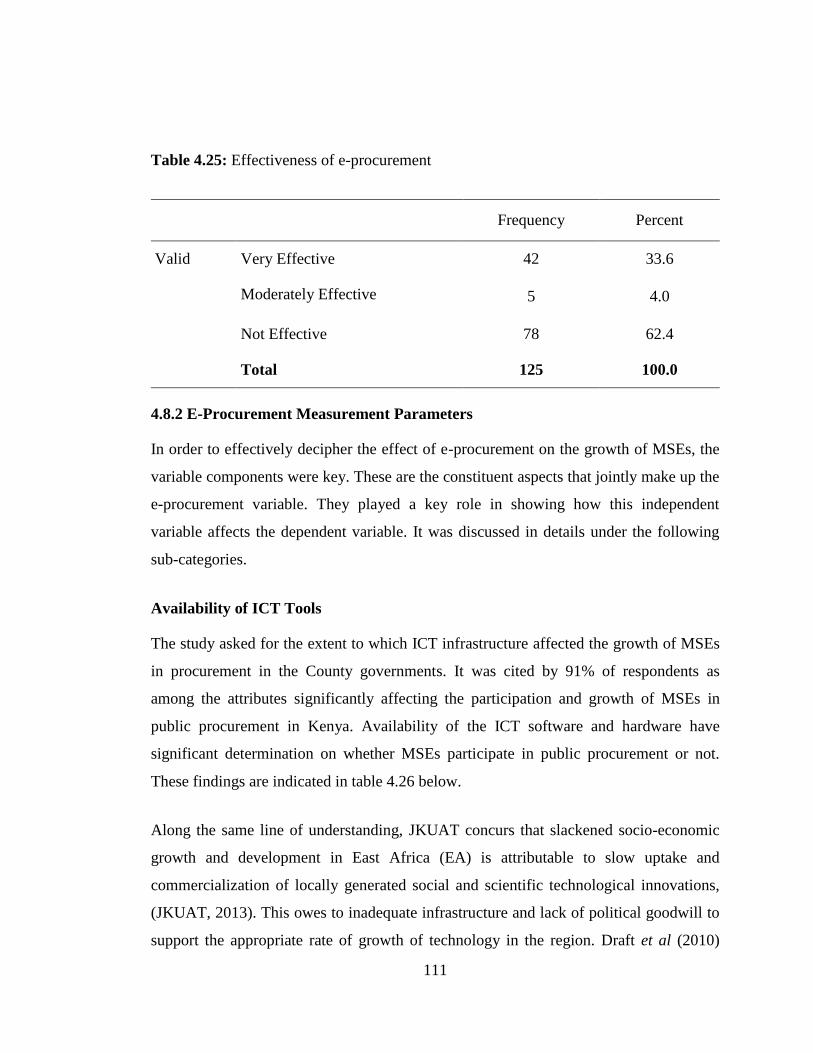
111
Table 4.25: Effectiveness of e-procurement
Frequency Percent
Valid Very Effective 42 33.6
Moderately Effective 5 4.0
Not Effective 78 62.4
Total 125 100.0
4.8.2 E-Procurement Measurement Parameters
In order to effectively decipher the effect of e-procurement on the growth of MSEs, the
variable components were key. These are the constituent aspects that jointly make up the
e-procurement variable. They played a key role in showing how this independent
variable affects the dependent variable. It was discussed in details under the following
sub-categories.
Availability of ICT Tools
The study asked for the extent to which ICT infrastructure affected the growth of MSEs
in procurement in the County governments. It was cited by 91% of respondents as
among the attributes significantly affecting the participation and growth of MSEs in
public procurement in Kenya. Availability of the ICT software and hardware have
significant determination on whether MSEs participate in public procurement or not.
These findings are indicated in table 4.26 below.
Along the same line of understanding, JKUAT concurs that slackened socio-economic
growth and development in East Africa (EA) is attributable to slow uptake and
commercialization of locally generated social and scientific technological innovations,
(JKUAT, 2013). This owes to inadequate infrastructure and lack of political goodwill to
support the appropriate rate of growth of technology in the region. Draft et al (2010)
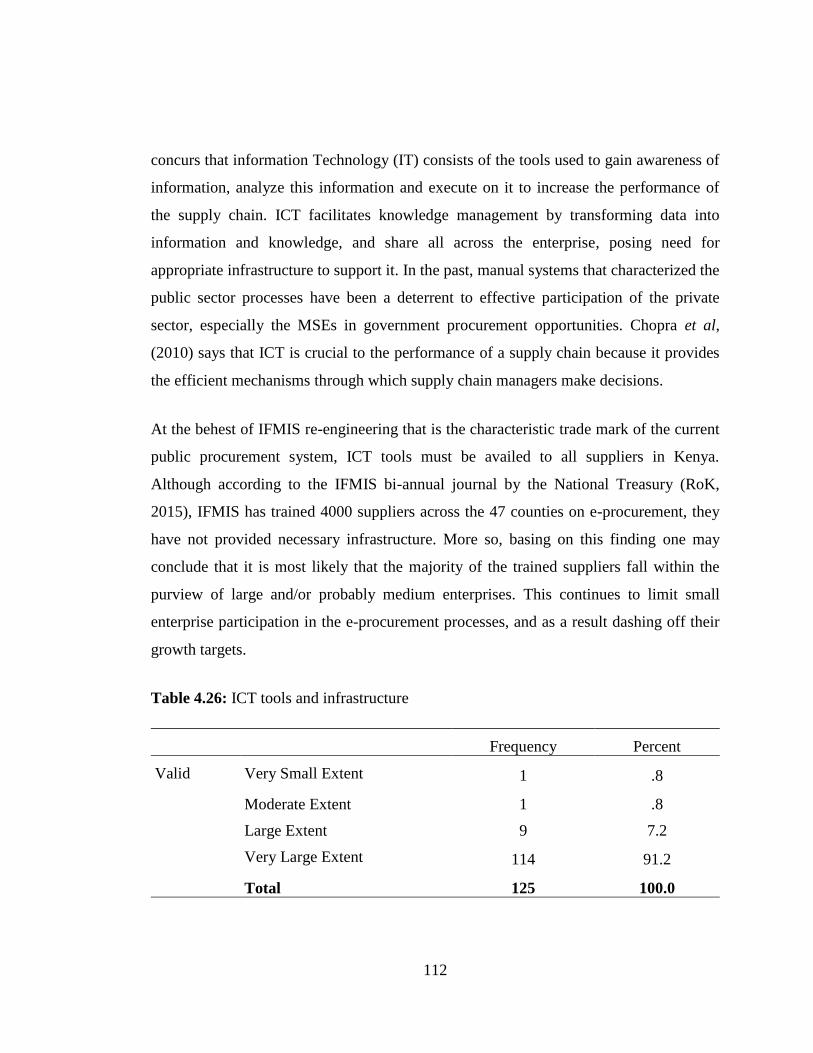
112
concurs that information Technology (IT) consists of the tools used to gain awareness of
information, analyze this information and execute on it to increase the performance of
the supply chain. ICT facilitates knowledge management by transforming data into
information and knowledge, and share all across the enterprise, posing need for
appropriate infrastructure to support it. In the past, manual systems that characterized the
public sector processes have been a deterrent to effective participation of the private
sector, especially the MSEs in government procurement opportunities. Chopra et al,
(2010) says that ICT is crucial to the performance of a supply chain because it provides
the efficient mechanisms through which supply chain managers make decisions.
At the behest of IFMIS re-engineering that is the characteristic trade mark of the current
public procurement system, ICT tools must be availed to all suppliers in Kenya.
Although according to the IFMIS bi-annual journal by the National Treasury (RoK,
2015), IFMIS has trained 4000 suppliers across the 47 counties on e-procurement, they
have not provided necessary infrastructure. More so, basing on this finding one may
conclude that it is most likely that the majority of the trained suppliers fall within the
purview of large and/or probably medium enterprises. This continues to limit small
enterprise participation in the e-procurement processes, and as a result dashing off their
growth targets.
Table 4.26: ICT tools and infrastructure
Frequency Percent
Valid Very Small Extent 1 .8
Moderate Extent 1 .8
Large Extent 9 7.2
Very Large Extent 114 91.2
Total 125 100.0
113
Technological Know-How
When asked the extent to which technological know-how affected MSEs growth, 90%
noted that it equally has significant influence on the growth of MSE through public
procurement. The implication here being that unless the MSEs are adequately equipped
with relevant knowledge of the workings of the e-procurement system, they may never
make it through public procurement. The details of this finding are tabulated in 4.27.
The most successful e-procurement implementations have been driven by those who best
understand and partake the procurement processes and the outcomes to be achieved from
deploying ICT in decision making. Unfortunately, Burt et al (2004) argue that it is
common to ascertain that transaction-based procurement system has been purchased,
implemented, operated and maintained with almost no input or participation from all
relevant stakeholders. These systems may be acquired on the strength of purging costs of
full time employees (FTE) which does not discriminate between individuals performing
tactical and strategic value-added activities. Such purging increases future problems
since few professionals are left to contribute during the critical requirements
development process, and hence loss of buy-in and ownership of the new technologies
by those left out.
From this viewpoint, it is advisable that all supply chain partakers should be trained,
sensitized and inducted to any changes in technology. These sensitization efforts should
not be limited to a selected few just like the National Treasury seems to be doing.
Important to consider still, is that considering the huge number of both active and
potential small scale suppliers in the market, the training and sensitization efforts must
be perpetual and tailor made to address specific areas of interest to the MSEs. This will
ensure that the technological challenges faced by these small scale supply entities are
addressed and they become enabled to fully participate in public procurement operations
and processes.
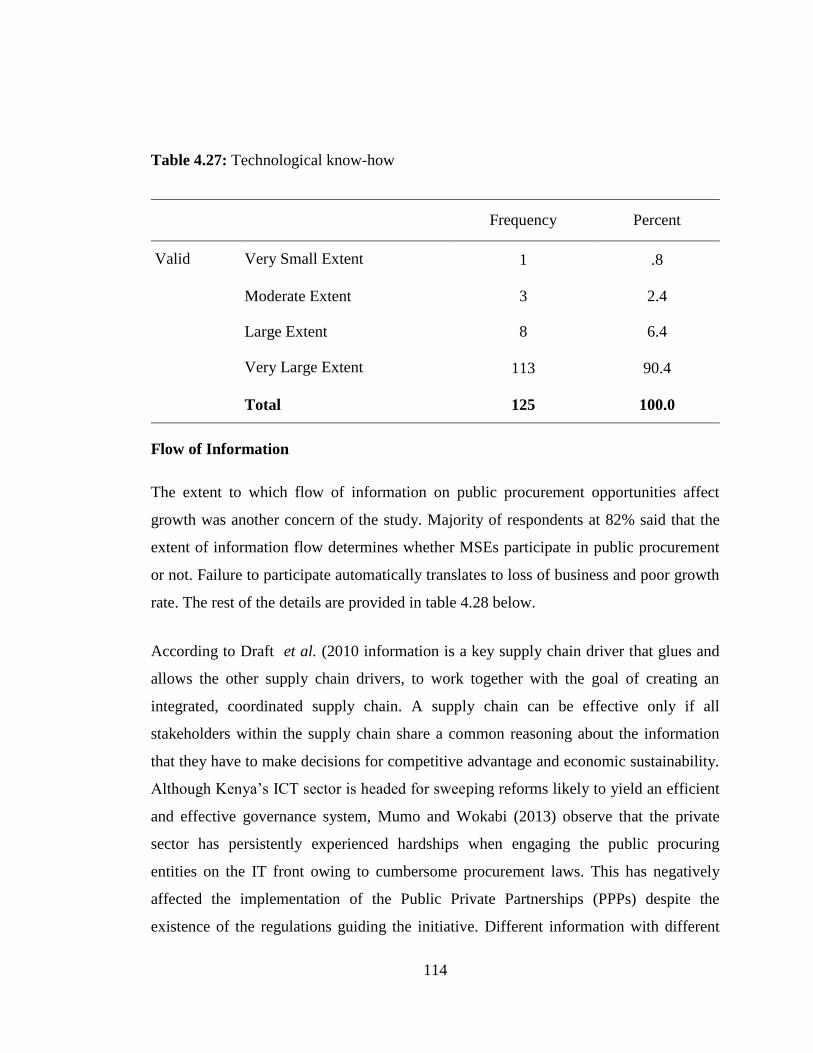
114
Table 4.27: Technological know-how
Frequency Percent
Valid Very Small Extent 1 .8
Moderate Extent 3 2.4
Large Extent 8 6.4
Very Large Extent 113 90.4
Total 125 100.0
Flow of Information
The extent to which flow of information on public procurement opportunities affect
growth was another concern of the study. Majority of respondents at 82% said that the
extent of information flow determines whether MSEs participate in public procurement
or not. Failure to participate automatically translates to loss of business and poor growth
rate. The rest of the details are provided in table 4.28 below.
According to Draft et al. (2010 information is a key supply chain driver that glues and
allows the other supply chain drivers, to work together with the goal of creating an
integrated, coordinated supply chain. A supply chain can be effective only if all
stakeholders within the supply chain share a common reasoning about the information
that they have to make decisions for competitive advantage and economic sustainability.
Although Kenya’s ICT sector is headed for sweeping reforms likely to yield an efficient
and effective governance system, Mumo and Wokabi (2013) observe that the private
sector has persistently experienced hardships when engaging the public procuring
entities on the IT front owing to cumbersome procurement laws. This has negatively
affected the implementation of the Public Private Partnerships (PPPs) despite the
existence of the regulations guiding the initiative. Different information with different
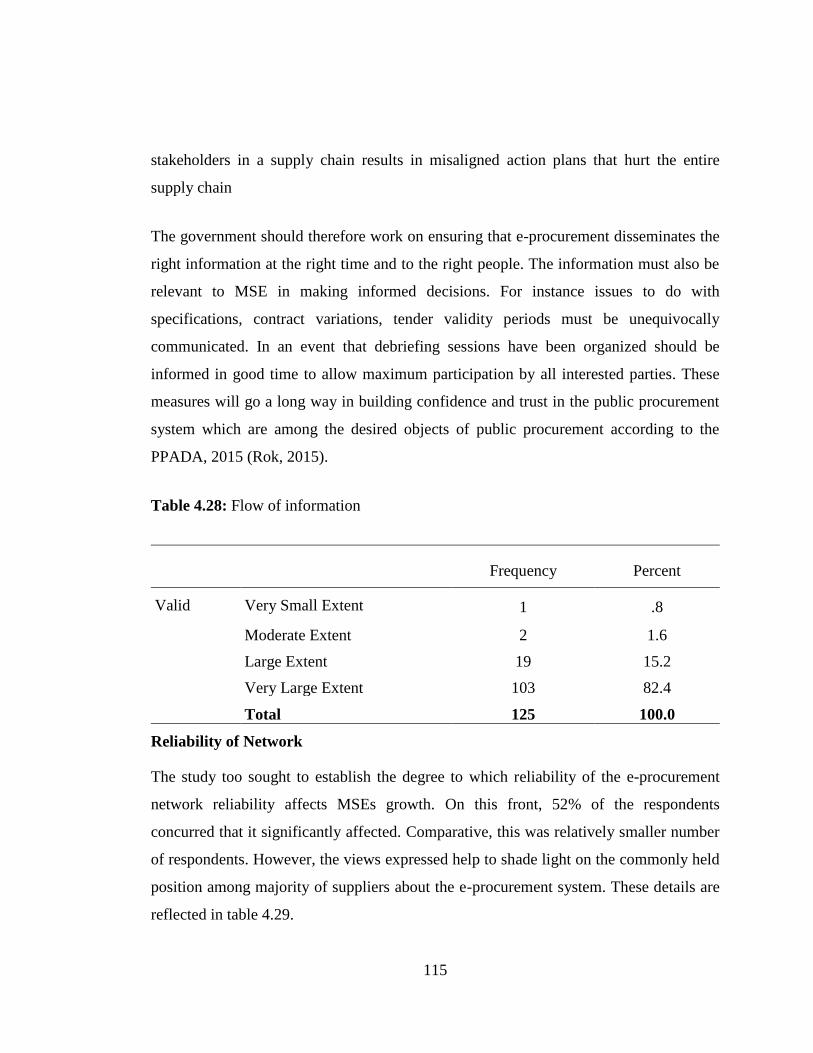
115
stakeholders in a supply chain results in misaligned action plans that hurt the entire
supply chain
The government should therefore work on ensuring that e-procurement disseminates the
right information at the right time and to the right people. The information must also be
relevant to MSE in making informed decisions. For instance issues to do with
specifications, contract variations, tender validity periods must be unequivocally
communicated. In an event that debriefing sessions have been organized should be
informed in good time to allow maximum participation by all interested parties. These
measures will go a long way in building confidence and trust in the public procurement
system which are among the desired objects of public procurement according to the
PPADA, 2015 (Rok, 2015).
Table 4.28: Flow of information
Frequency Percent
Valid Very Small Extent 1 .8
Moderate Extent 2 1.6
Large Extent 19 15.2
Very Large Extent 103 82.4
Total 125 100.0
Reliability of Network
The study too sought to establish the degree to which reliability of the e-procurement
network reliability affects MSEs growth. On this front, 52% of the respondents
concurred that it significantly affected. Comparative, this was relatively smaller number
of respondents. However, the views expressed help to shade light on the commonly held
position among majority of suppliers about the e-procurement system. These details are
reflected in table 4.29.
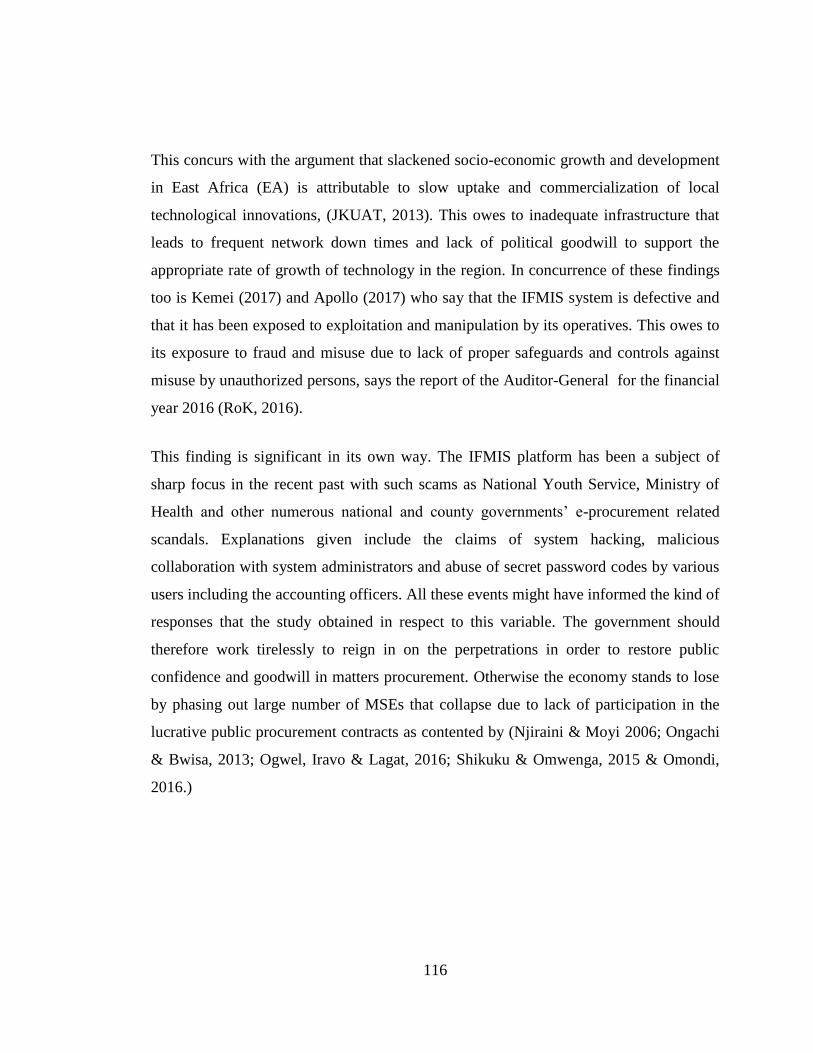
116
This concurs with the argument that slackened socio-economic growth and development
in East Africa (EA) is attributable to slow uptake and commercialization of local
technological innovations, (JKUAT, 2013). This owes to inadequate infrastructure that
leads to frequent network down times and lack of political goodwill to support the
appropriate rate of growth of technology in the region. In concurrence of these findings
too is Kemei (2017) and Apollo (2017) who say that the IFMIS system is defective and
that it has been exposed to exploitation and manipulation by its operatives. This owes to
its exposure to fraud and misuse due to lack of proper safeguards and controls against
misuse by unauthorized persons, says the report of the Auditor-General for the financial
year 2016 (RoK, 2016).
This finding is significant in its own way. The IFMIS platform has been a subject of
sharp focus in the recent past with such scams as National Youth Service, Ministry of
Health and other numerous national and county governments’ e-procurement related
scandals. Explanations given include the claims of system hacking, malicious
collaboration with system administrators and abuse of secret password codes by various
users including the accounting officers. All these events might have informed the kind of
responses that the study obtained in respect to this variable. The government should
therefore work tirelessly to reign in on the perpetrations in order to restore public
confidence and goodwill in matters procurement. Otherwise the economy stands to lose
by phasing out large number of MSEs that collapse due to lack of participation in the
lucrative public procurement contracts as contented by (Njiraini & Moyi 2006; Ongachi
& Bwisa, 2013; Ogwel, Iravo & Lagat, 2016; Shikuku & Omwenga, 2015 & Omondi,
2016.)
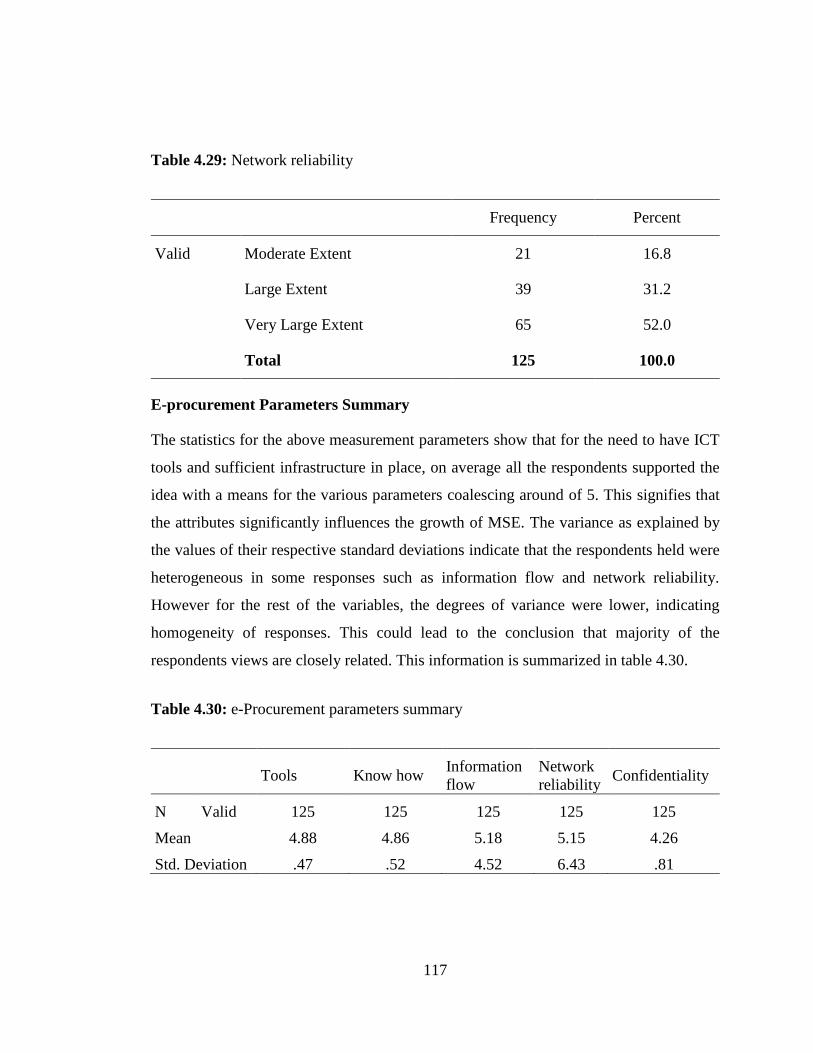
117
Table 4.29: Network reliability
Frequency Percent
Valid Moderate Extent 21 16.8
Large Extent 39 31.2
Very Large Extent 65 52.0
Total 125 100.0
E-procurement Parameters Summary
The statistics for the above measurement parameters show that for the need to have ICT
tools and sufficient infrastructure in place, on average all the respondents supported the
idea with a means for the various parameters coalescing around of 5. This signifies that
the attributes significantly influences the growth of MSE. The variance as explained by
the values of their respective standard deviations indicate that the respondents held were
heterogeneous in some responses such as information flow and network reliability.
However for the rest of the variables, the degrees of variance were lower, indicating
homogeneity of responses. This could lead to the conclusion that majority of the
respondents views are closely related. This information is summarized in table 4.30.
Table 4.30: e-Procurement parameters summary
Tools Know how
Information
flow
Network
reliability Confidentiality
N Valid 125 125 125 125 125
Mean 4.88 4.86 5.18 5.15 4.26
Std. Deviation .47 .52 4.52 6.43 .81

118
Adoption of e-Procurement
It was again in the interest of the study to ascertain measures that could help to improve
the effective adoption of electronic procurement technology by MSE. Various views
were expressed on the measures that the government should put in place to help in the
adoption and implementation of e-procurement for MSEs. Approximately 51% of
respondents preferred training and sensitization of the MSEs on the requirements of the
technology. A number of other suggestions were put forth as figure 4.9 exhibits.
This establishment supports Indire et al, (2008) who say that to facilitate small business
growth and development, the government should commit to undertake training
initiatives. This will impart fresh knowledge and improve skills of the business people to
enhance better management of the informal business sector. JKUAT (2013) contends
that in order to support innovative programs that can promote entrepreneurship and
create a pool of indigenous, skilled, adaptive and competent human capital capable of
stimulating the region’s socio-economic development, universities should work closely
with MSEs and young entrepreneurs to enhance their capacity. Alande, (2013) blames
inadequacy in staff training both technically and experientially, technology and
financially for poor performance of County governments as they reduce effective
capacity for service delivery. However, training-based capacity carries makes more
sense when coupled with competence-based capacity.
Although the government proposes to incorporate MSEs in training programs as
indicated by various state agencies such as public training institutions, it government
should endeavor to collaborate with MSEs. This would be appropriate in designing
relevant training curriculum. It will avoid negative perceptions that may exist were the
programs be developed devoid of the user or the consumer input. The MSEs should be
trained mainly on change of attitudes and mindset towards progressive approach to
public procurement management.
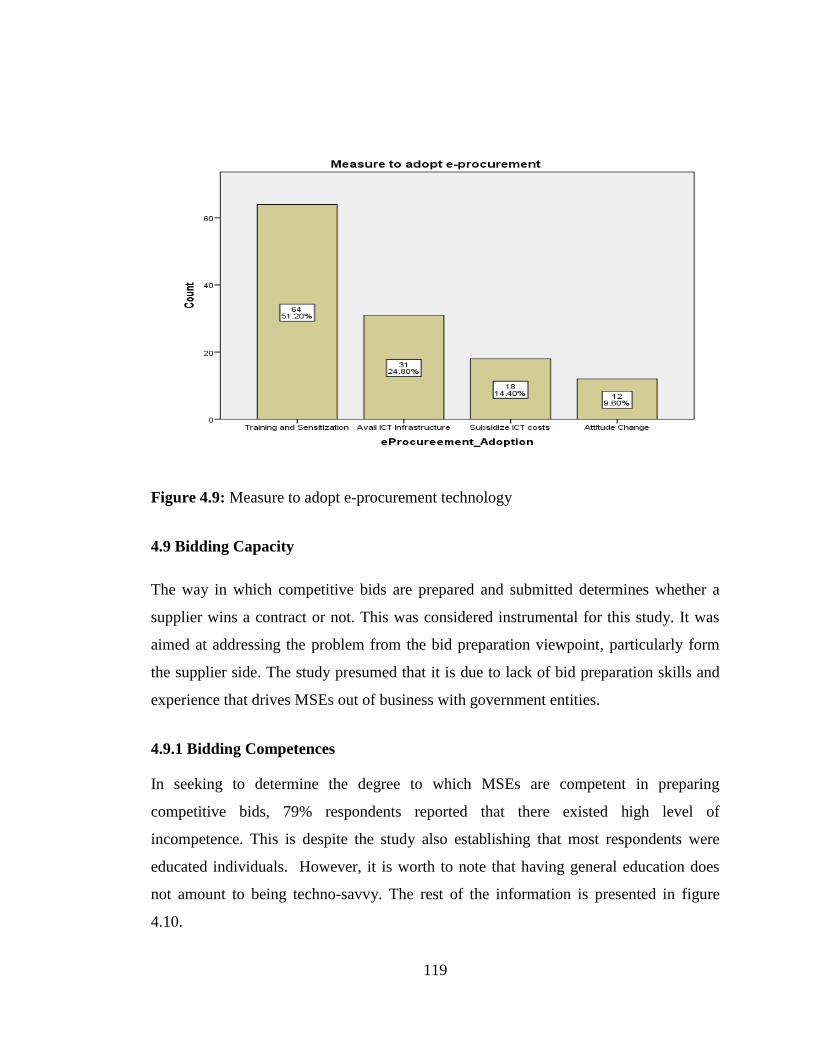
119
Figure 4.9: Measure to adopt e-procurement technology
4.9 Bidding Capacity
The way in which competitive bids are prepared and submitted determines whether a
supplier wins a contract or not. This was considered instrumental for this study. It was
aimed at addressing the problem from the bid preparation viewpoint, particularly form
the supplier side. The study presumed that it is due to lack of bid preparation skills and
experience that drives MSEs out of business with government entities.
4.9.1 Bidding Competences
In seeking to determine the degree to which MSEs are competent in preparing
competitive bids, 79% respondents reported that there existed high level of
incompetence. This is despite the study also establishing that most respondents were
educated individuals. However, it is worth to note that having general education does
not amount to being techno-savvy. The rest of the information is presented in figure
4.10.

120
In contending with this finding, Amayi et al, (2013) explain that re-engineering of
IFMIS may not achieve much unless the government professionalizes and capacitates
the supply chain function with necessary and relevant human capital at all stages of the
supply chain. This area has been marred by corruption and ineptitude, due to deployment
of non-professionals to manage public procurement against the requirement of the
Supply Practitioners Management Act (SPMA), (RoK, 2007). Technology impacts on
the development of business conditions and creates new opportunities for suppliers,
producers and customers. The stakeholders in government supply chains can determine
the extent to which the government takes advantage of ICT. Failure to recognize and
remedy such problems jeopardizes the survival not only of public organizations but
suppliers as well.
The government has since time immemorial insisted on engaging competent suppliers to
services its requirement. Essentially, the competences are determined in terms of bid
preparation at the evaluation stage of the procurement processes. With demonstrated
level of incompetence in this study, it is deducible that the MSEs keep losing contracts
due to their inability to present well prepared bid documents. In order to establish key
areas of interest as far as incompetence is concerned the following parameters were
studied.
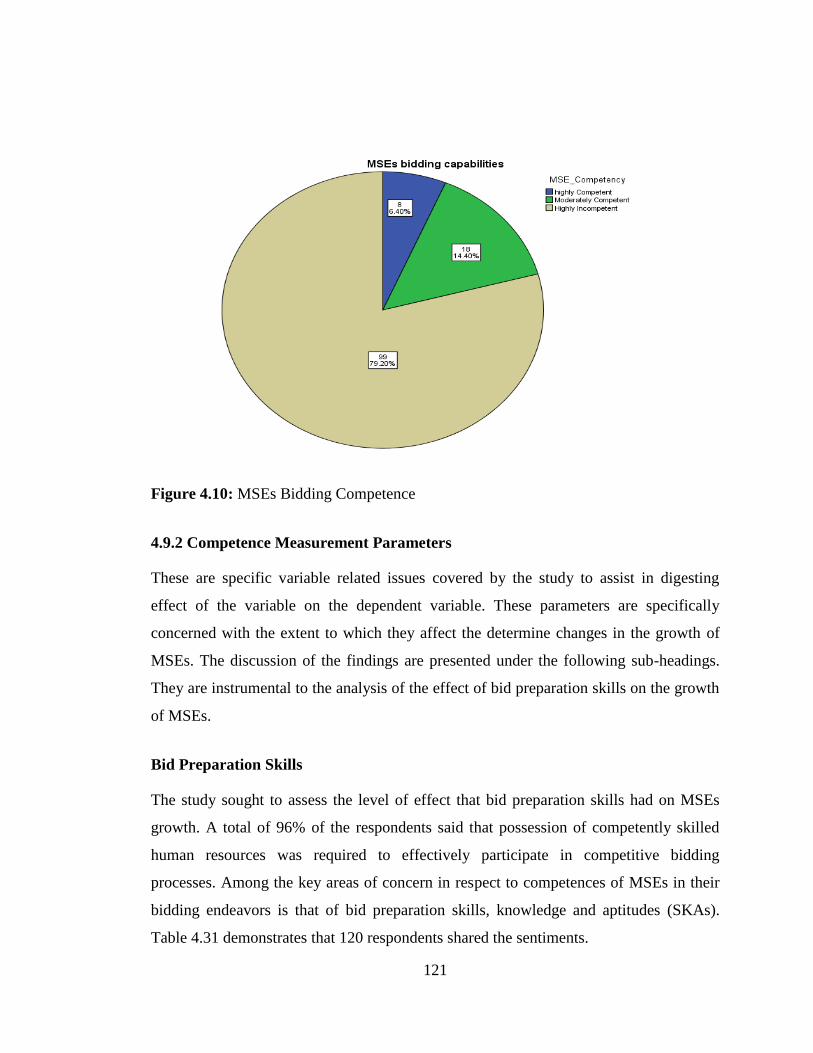
121
Figure 4.10: MSEs Bidding Competence
4.9.2 Competence Measurement Parameters
These are specific variable related issues covered by the study to assist in digesting
effect of the variable on the dependent variable. These parameters are specifically
concerned with the extent to which they affect the determine changes in the growth of
MSEs. The discussion of the findings are presented under the following sub-headings.
They are instrumental to the analysis of the effect of bid preparation skills on the growth
of MSEs.
Bid Preparation Skills
The study sought to assess the level of effect that bid preparation skills had on MSEs
growth. A total of 96% of the respondents said that possession of competently skilled
human resources was required to effectively participate in competitive bidding
processes. Among the key areas of concern in respect to competences of MSEs in their
bidding endeavors is that of bid preparation skills, knowledge and aptitudes (SKAs).
Table 4.31 demonstrates that 120 respondents shared the sentiments.

122
Indire et al (2008) concurs that to facilitate small business growth and development, the
government should undertake training initiatives to impart knowledge and improve their
bidding skills. According to Mumuni and Insah (2013) entrepreneurs play an important
role in local economies in developing countries through employment creation and
livelihood sustainability for the rural fork. Their active incorporation in mainstream
economic activities is therefore crucial and necessary. Nasio et al (2003) supports the
view that for the government to ensure that the control of the economy does not
excessively pass on to foreign investors, it involves itself in regulating and promoting
the growth of local investors.
There is no better way local investors can be promoted other than involving them in
lucrative businesses such public procurement. Governments are reportedly biggest
spenders globally consuming an estimated average of 60% of the GDP according to
(Matindi, 2013; Aketch, 2013). Equipping MSEs with necessary SKAs enables them to
be competitive enough to solicit public procurement contracts that will allow their rapid
growth. Effective participation in public procurement will also permit the trickle-down
economic effect that would lead to robust investment in the cottage industry due to
growth in disposable income and propensity to consume at the grassroots.
Table 4.31: Bidding skills
Frequency Percent
Valid Moderate Extent 2 1.6
Large Extent 3 2.4
Very Large Extent 120 96.0
Total 125 100.0
123
Negotiation Skills
The study sought to examine degree to which negotiation skills influenced MSEs
growth. Negotiation skills were equally noted to significantly affect the participation and
growth of MSEs in public procurement. This was observed by 59% of the respondents.
It reveals that apart from bidding skills, negotiation skills are equally necessary and
useful. MSEs should realize that with well-developed negotiation skills, they are capable
of charting their success in public procurement. Further information on this variable are
presented in table 4.32.
Unlike large enterprises that enjoy scale economies that allow them to offer lower prices
in competitive businesses, MSEs do not enjoy this advantage. Ogachi (2013) agrees that
due to their weak negotiating power, the categories of contracts set aside for the MSEs
award are based on low-value jobs. This leaves the established firms to deal in jobs with
real money further relegating MSEs to the periphery of public procurement
opportunities. As such, Muniu and Ngugi (2013) argue that for MSEs to be able to grow
into bigger companies, they must be capacitated to attract and retain skilled employees
in their entities to enable them to negotiate for profitable procurement deals.
From the above information, it is evident that effective negotiations require shrewd
competent persons. Government entities are institutional buyers with presumably trained
manpower in negotiating for better business offers from suppliers. This important
resource may not be easily forthcoming for the MSEs as most of them are established
without clear work plans owing to the nascent informal sector environment. With the
inherent intrigues in negotiations, MSE need to establish closer collaborative mechanism
through which they can pool their resources together for effective and efficient
negotiations taking advantage of the provisions of the MSEA, 2012.

124
Table 4.32: Negotiation Skills
Frequency Percent
Valid Very Small Extent 1 .8
Moderate Extent 10 8.0
Large Extent 40 32.0
Very Large Extent 74 59.2
Total 125 100.0
Competition
The study sought to examine to what extent was the level of completion influencing the
growth of MSEs. The level of competition was reported to have significant effect on the
participation and growth of MSEs via public procurement in the counties in Kenya. This
is according to 71% of the respondents. With the ascertained information under growth
rate of MSEs section of this study, it implies that there could be intense cut throat
competition within the public procurement spheres. This could be the persistent cause
for the poor showing and growth of the MSEs in public procurement. Table 4.33
illustrates these findings.
Kihanya (2013) observed that favorable government regulations play an important role
in establishing simpler, more appropriate and sustainable environment for businesses to
implement their business strategies successfully. However, public procurement in Kenya
has perpetually ignored the MSEs for a long time contends (Ochiri, 2011). This state of
affairs has favored large enterprises to the extent that they have exerted intense
competition in the supply market for the government. This scenario has been a major
setback towards the growth of the MSE sector leading to their endless ailing contends
(Muniu & Ngugi, 2013).

125
These findings are a pointer to the fact that MSEs in Kenya have suffered from
economic historical injustices since time immemorial. The appropriate way to mitigate
the historical injustices that the MSEs have been subjected to is for them taking
advantage of the opportunities accruing from the new developments in the legal
framework governing public procurement in Kenya. The legal framework has afforded
the MSEs preferential treatment in terms of opportunities rationalization and
competition mitigation. Furthermore, the advent of devolution has played a big role in
pushing resources closer to them. They should therefore cease the opportunities
jealously and aggressively seek their growth through these opportunities.
Table 4.33: Competition
Frequency Percent
Valid Very Small Extent 1 .8
Moderate Extent 2 1.6
Large Extent 33 26.4
Very Large Extent 89 71.2
Total 125 100.0
Volume of Contract
Does the volume of contract affect the MSEs participation and growth through public
procurement? In response to this question, approximately 71% concurred. From analysis
of the quantity and value of contracts awarded to the MSEs, it is evident that the
contracts are discouragingly low. This is in comparison to the cost and time involved in
working out the bid winning matrix for public tenders. Table 4.34 provides details about
these findings.
Despite the statutory provision that 30% of public tenders set aside for MSE through the
AGPO program according to RoK (2013), Ogachi (2013) decries that the categories of
126
contracts set aside for these groups award are based on low-value jobs such as supply of
calling cards, flowers, printing services and newspapers. This leaves the larger firms to
deal in jobs with real money. This relegates MSEs to the periphery of public
procurement opportunities. Kihanya, (2013) argues that financial capability is
instrumental in the determination of whether an organization succeeds or fails. Okoth
(2013) observes that government suppliers suffer financial constraints due to delayed
payments forcing them to halt operations because they tend to spend a lot of money
upfront but get paid much later. For the MSEs, especially at the county level, this is a
big financial blow because most of them operate on a shoe string budget due to
inadequate or unfavorable sources of financing.
The major undoing in respect of the volume of the contract therefore, is not that they are
huge and therefore infeasible, the converse is the case. Considering the findings in the
volume and the value of contracts awarded to the MSEs in the last three, the results were
disheartening. Only 2 respondents managed to secure procurement contracts worth of
Ksh. 1 Million while over 46% of the respondents recorded negligible values of
contracts of below Ksh. 100,000 while only 16% recorded having received contracts
worth Ksh. 500,000 and below. With such minimal values, there would inevitably be no
incentive for any serious business entity participating in a transaction whose returns are
not promising even to settle its cost of capital.
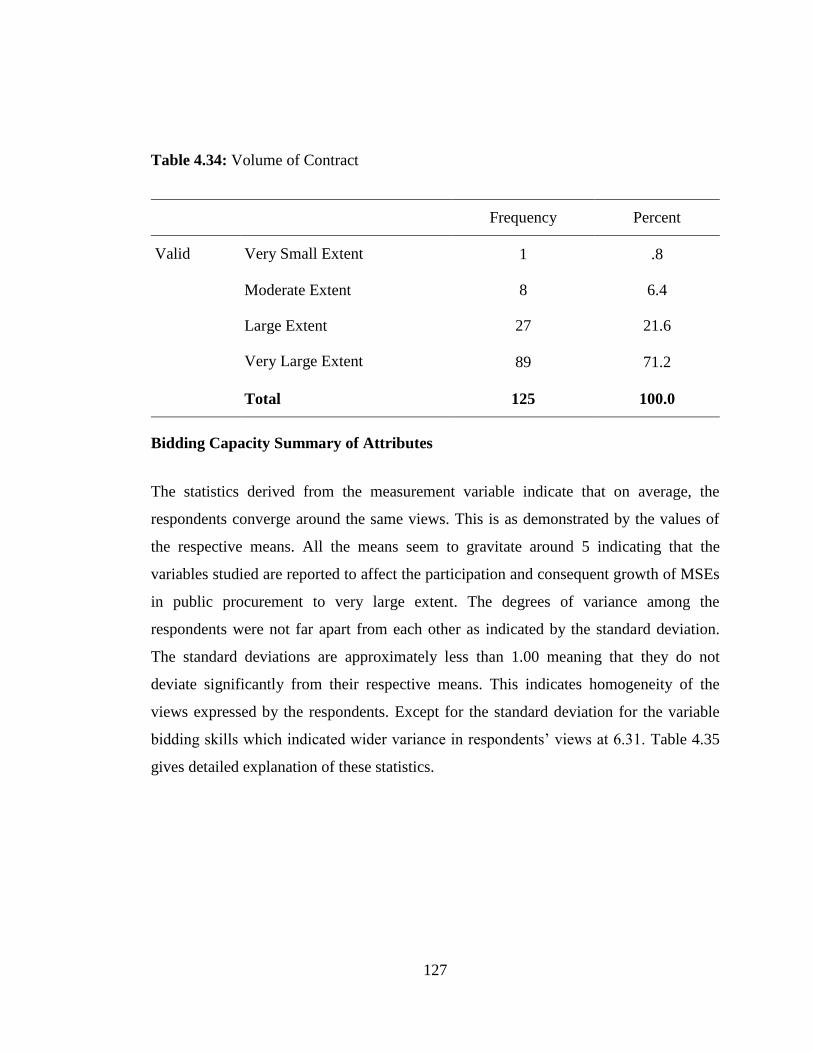
127
Table 4.34: Volume of Contract
Frequency Percent
Valid Very Small Extent 1 .8
Moderate Extent 8 6.4
Large Extent 27 21.6
Very Large Extent 89 71.2
Total 125 100.0
Bidding Capacity Summary of Attributes
The statistics derived from the measurement variable indicate that on average, the
respondents converge around the same views. This is as demonstrated by the values of
the respective means. All the means seem to gravitate around 5 indicating that the
variables studied are reported to affect the participation and consequent growth of MSEs
in public procurement to very large extent. The degrees of variance among the
respondents were not far apart from each other as indicated by the standard deviation.
The standard deviations are approximately less than 1.00 meaning that they do not
deviate significantly from their respective means. This indicates homogeneity of the
views expressed by the respondents. Except for the standard deviation for the variable
bidding skills which indicated wider variance in respondents’ views at 6.31. Table 4.35
gives detailed explanation of these statistics.

128
Table 4.35: Bidding capacity summary
Bidding skills Negotiation
skills Competition
Contract
volume
N Valid 125 125 125 125
Mean 5.74 4.49 4.67 4.62
Std. Deviation 6.31 .71 .59 .68
4.9.4 Measures to Improve Capacity
While responding to what should be done to improve bidding capacity for the MSEs,
mixed responses were obtained. However, the majority of respondents at 47% provided
that the MSEs should increase their level of participation in procurement activities.
Unless they rise to the occasion and claim their rightful stake in public procurement,
MSEs will continue lagging behind in growth. More details are provided in figure 4.11.
Although this differs with other literature reviewed, it could complement well the views
projected in the literature. For instance, Indire, Nyam and Mbuvi (2008) opine that the
government should underscore need for technical training of entrepreneurs at the grass
root level to equip with competitive capacity to enable them to perform well in
discharging their expected roles in regard to taking part in public procurement. This is
echoed by Alande (2013) who adds that the training should not be an isolated event but
strategically aligned to knowledge, skills and ability (SKA) improvement for
competitive reasons. Against this background, Jomo Kenyatta University of Agriculture
and Technology (JKUAT) concurs with the need for graduates to take advantage of the
devolved system of governance to stamp authority in the field of entrepreneurial skills
that may spur the country’s economic development (JKUAT, 2013).
Although frequent participation helps to improve bidding skills and aptitudes, it may not
be obvious as it may look. In the interest and spirit of supplier development, trainings,
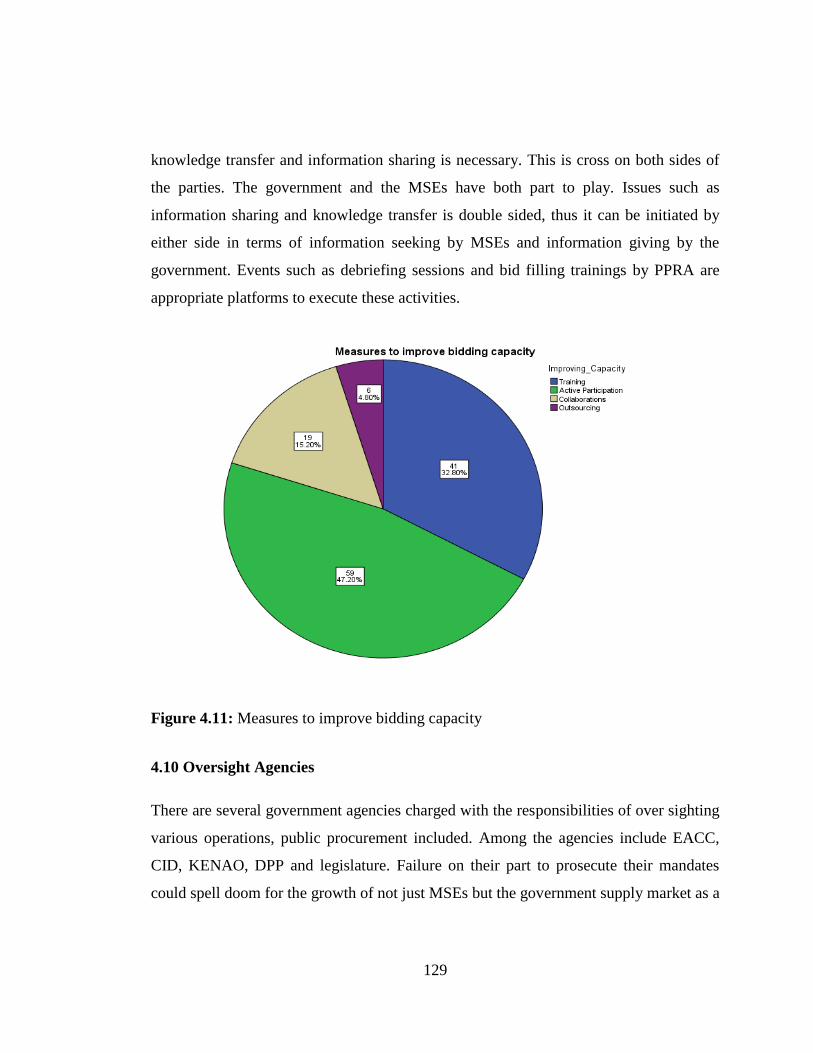
129
knowledge transfer and information sharing is necessary. This is cross on both sides of
the parties. The government and the MSEs have both part to play. Issues such as
information sharing and knowledge transfer is double sided, thus it can be initiated by
either side in terms of information seeking by MSEs and information giving by the
government. Events such as debriefing sessions and bid filling trainings by PPRA are
appropriate platforms to execute these activities.
Figure 4.11: Measures to improve bidding capacity
4.10 Oversight Agencies
There are several government agencies charged with the responsibilities of over sighting
various operations, public procurement included. Among the agencies include EACC,
CID, KENAO, DPP and legislature. Failure on their part to prosecute their mandates
could spell doom for the growth of not just MSEs but the government supply market as a
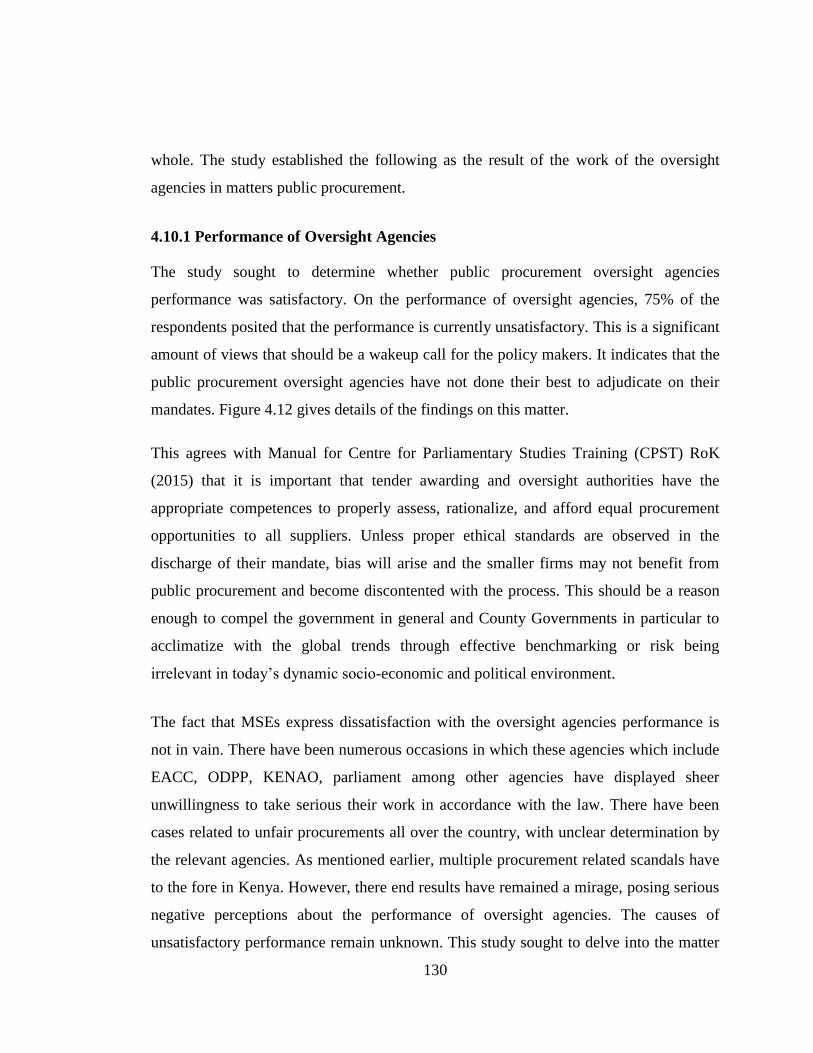
130
whole. The study established the following as the result of the work of the oversight
agencies in matters public procurement.
4.10.1 Performance of Oversight Agencies
The study sought to determine whether public procurement oversight agencies
performance was satisfactory. On the performance of oversight agencies, 75% of the
respondents posited that the performance is currently unsatisfactory. This is a significant
amount of views that should be a wakeup call for the policy makers. It indicates that the
public procurement oversight agencies have not done their best to adjudicate on their
mandates. Figure 4.12 gives details of the findings on this matter.
This agrees with Manual for Centre for Parliamentary Studies Training (CPST) RoK
(2015) that it is important that tender awarding and oversight authorities have the
appropriate competences to properly assess, rationalize, and afford equal procurement
opportunities to all suppliers. Unless proper ethical standards are observed in the
discharge of their mandate, bias will arise and the smaller firms may not benefit from
public procurement and become discontented with the process. This should be a reason
enough to compel the government in general and County Governments in particular to
acclimatize with the global trends through effective benchmarking or risk being
irrelevant in today’s dynamic socio-economic and political environment.
The fact that MSEs express dissatisfaction with the oversight agencies performance is
not in vain. There have been numerous occasions in which these agencies which include
EACC, ODPP, KENAO, parliament among other agencies have displayed sheer
unwillingness to take serious their work in accordance with the law. There have been
cases related to unfair procurements all over the country, with unclear determination by
the relevant agencies. As mentioned earlier, multiple procurement related scandals have
to the fore in Kenya. However, there end results have remained a mirage, posing serious
negative perceptions about the performance of oversight agencies. The causes of
unsatisfactory performance remain unknown. This study sought to delve into the matter
131
and analyzed a number of variables as discussed in the performance measurement
parameters in 4.9.3.
Figure 4.12: Performance of oversight agencies
4.10.3 Oversight Agencies Performance Parameters
As the standard for the study, this variable was further analyzed in more dissected form.
It was opened up into individual specific constituents that make up the whole variable
for ease of evaluation. A numbers of parameters were drawn for analysis, with more
revelations emanating from their assessment. The details were as discussed in the
succeeding discussion on the oversight agencies as an independent variable.
Competence of Members
The study sought the respondents’ assessment on the extent to which competences of the
members appointed to the oversight agencies in Kenya affect their performance.
According to 90% of the respondents, for the oversight agencies to function and
prosecute their mandates, competency of their members is significant. Competency of
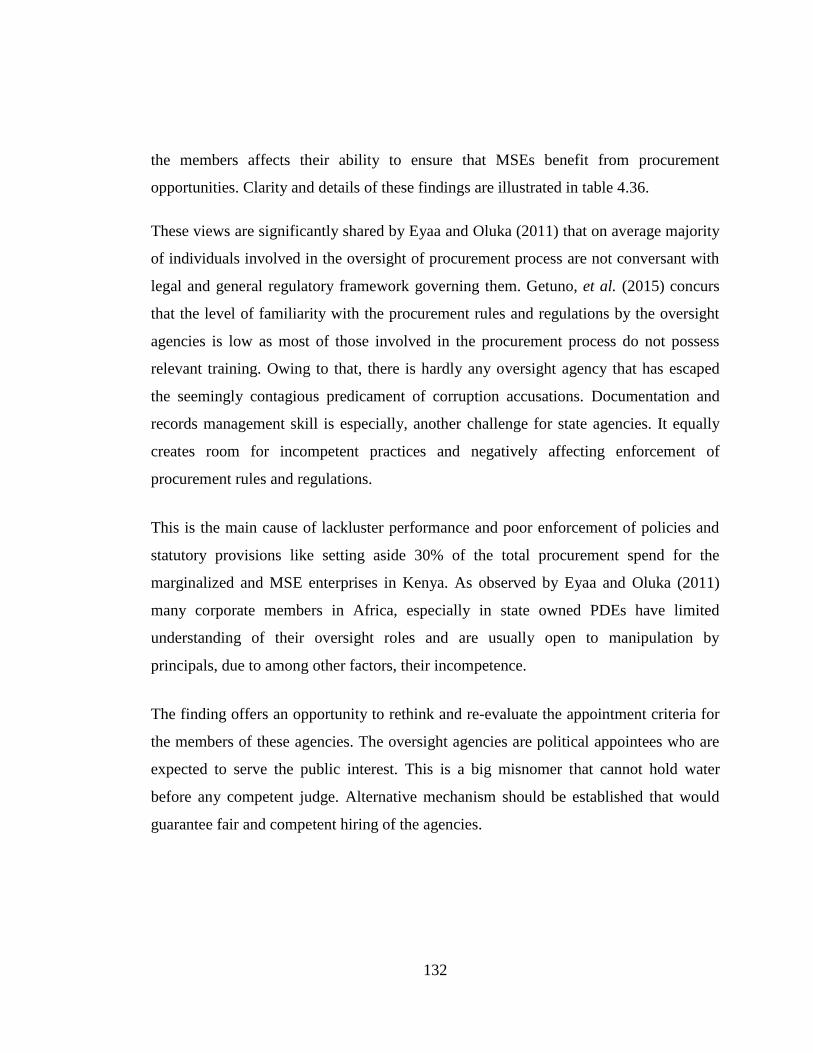
132
the members affects their ability to ensure that MSEs benefit from procurement
opportunities. Clarity and details of these findings are illustrated in table 4.36.
These views are significantly shared by Eyaa and Oluka (2011) that on average majority
of individuals involved in the oversight of procurement process are not conversant with
legal and general regulatory framework governing them. Getuno, et al. (2015) concurs
that the level of familiarity with the procurement rules and regulations by the oversight
agencies is low as most of those involved in the procurement process do not possess
relevant training. Owing to that, there is hardly any oversight agency that has escaped
the seemingly contagious predicament of corruption accusations. Documentation and
records management skill is especially, another challenge for state agencies. It equally
creates room for incompetent practices and negatively affecting enforcement of
procurement rules and regulations.
This is the main cause of lackluster performance and poor enforcement of policies and
statutory provisions like setting aside 30% of the total procurement spend for the
marginalized and MSE enterprises in Kenya. As observed by Eyaa and Oluka (2011)
many corporate members in Africa, especially in state owned PDEs have limited
understanding of their oversight roles and are usually open to manipulation by
principals, due to among other factors, their incompetence.
The finding offers an opportunity to rethink and re-evaluate the appointment criteria for
the members of these agencies. The oversight agencies are political appointees who are
expected to serve the public interest. This is a big misnomer that cannot hold water
before any competent judge. Alternative mechanism should be established that would
guarantee fair and competent hiring of the agencies.
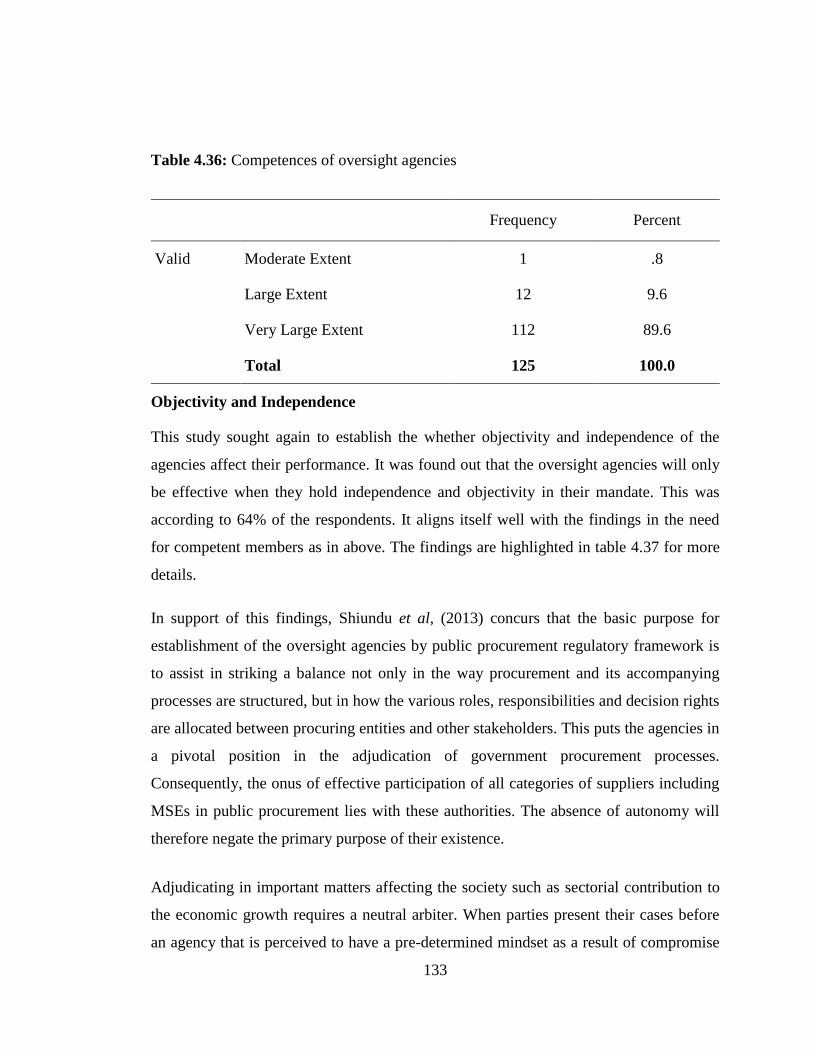
133
Table 4.36: Competences of oversight agencies
Frequency Percent
Valid Moderate Extent 1 .8
Large Extent 12 9.6
Very Large Extent 112 89.6
Total 125 100.0
Objectivity and Independence
This study sought again to establish the whether objectivity and independence of the
agencies affect their performance. It was found out that the oversight agencies will only
be effective when they hold independence and objectivity in their mandate. This was
according to 64% of the respondents. It aligns itself well with the findings in the need
for competent members as in above. The findings are highlighted in table 4.37 for more
details.
In support of this findings, Shiundu et al, (2013) concurs that the basic purpose for
establishment of the oversight agencies by public procurement regulatory framework is
to assist in striking a balance not only in the way procurement and its accompanying
processes are structured, but in how the various roles, responsibilities and decision rights
are allocated between procuring entities and other stakeholders. This puts the agencies in
a pivotal position in the adjudication of government procurement processes.
Consequently, the onus of effective participation of all categories of suppliers including
MSEs in public procurement lies with these authorities. The absence of autonomy will
therefore negate the primary purpose of their existence.
Adjudicating in important matters affecting the society such as sectorial contribution to
the economic growth requires a neutral arbiter. When parties present their cases before
an agency that is perceived to have a pre-determined mindset as a result of compromise

134
and conflict of interest, they develop apathy. This could be the genuine scenario in the
adjudication of public procurement in Kenya. The public seems to have no confidence in
the oversight agencies owing to their perceived or demonstrated alignments to various
slants of the society. If allowed to continue, the economy will be the main loser as the
sectors such as MSE and other informal sectors continue on a down turn path to the
doldrums.
Table 4.37: Independence and objectivity
Frequency Percent
Valid Small Extent 2 1.6
Moderate Extent 9 7.2
Large Extent 34 27.2
Very Large Extent 80 64.0
Total 125 100.0
Funding of Agencies
The study asked whether funding of the oversight agencies affected their performance. It
was determined that adequate funding of the activities of the oversight agencies is
mandatory. This is according to 62% of the respondents. Owing to the nature of their
work and the public expectations from the agencies, funding is handy for the oversight
agencies. These findings are detailed in table 4.38 below.
However this finding goes against Mutambu (2016) report that shows that even with
perceived level of sufficient funding, oversight institutions can still fail to deliver. The
report highlights the frustrations of the government that despite funding the agencies,
they have not shown results in terms of tackling the economic vices they are established
to combat. According to Mutambo (2016), enough resources were availed at the disposal
135
of the agencies in the financial year 2015-2016. However, no one agency could show
tangible results for the same. Based on the findings in this study, it may however, be
concluded that the reported funding may have been overwhelmed by the voluminous
amount of pending work in the target institutions back logs.
Inadequate funding of an entity is a recipe for under performance and other
malpractices. This is the basis for sentiments by Eyaa and Oluka (2011) that there is
hardly any oversight agency that has escaped the seemingly contagious predicament of
corruption accusations. In Kenya, the government has strived to extend more funding of
the oversight agencies under the Multi-Agency Taskforce (MAT). However, the
additional funding does not seem to yield tangible results. This contravenes the essence
of increasing funding for the agencies because it is expected to produce commensurate
results in terms of water tight cases that can stand prosecution beyond reasonable doubt.
The MAT includes agencies such as EACC, DPP, CID, AG, and the judiciary. Funding
should therefore be aligned to specific clearly defined tasks such as specific cases and
administrative tasks so that the money does go to waste as a result of lack of planning
for the same.
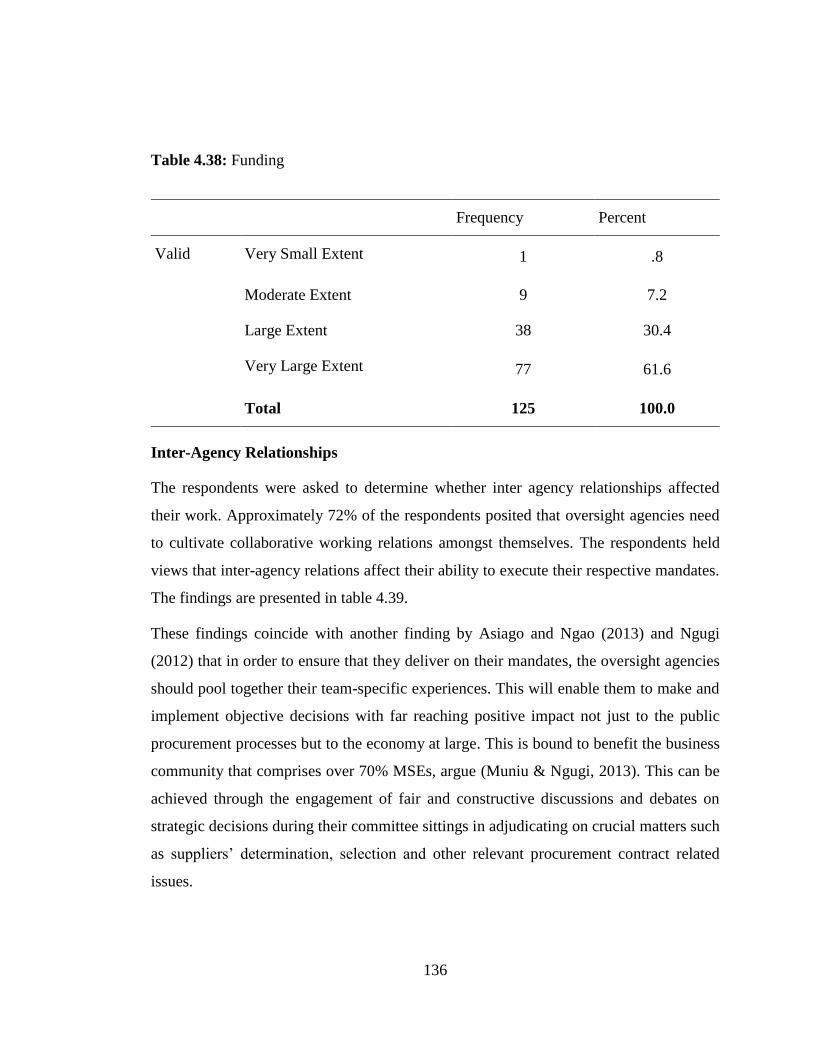
136
Table 4.38: Funding
Frequency Percent
Valid Very Small Extent 1 .8
Moderate Extent 9 7.2
Large Extent 38 30.4
Very Large Extent 77 61.6
Total 125 100.0
Inter-Agency Relationships
The respondents were asked to determine whether inter agency relationships affected
their work. Approximately 72% of the respondents posited that oversight agencies need
to cultivate collaborative working relations amongst themselves. The respondents held
views that inter-agency relations affect their ability to execute their respective mandates.
The findings are presented in table 4.39.
These findings coincide with another finding by Asiago and Ngao (2013) and Ngugi
(2012) that in order to ensure that they deliver on their mandates, the oversight agencies
should pool together their team-specific experiences. This will enable them to make and
implement objective decisions with far reaching positive impact not just to the public
procurement processes but to the economy at large. This is bound to benefit the business
community that comprises over 70% MSEs, argue (Muniu & Ngugi, 2013). This can be
achieved through the engagement of fair and constructive discussions and debates on
strategic decisions during their committee sittings in adjudicating on crucial matters such
as suppliers’ determination, selection and other relevant procurement contract related
issues.
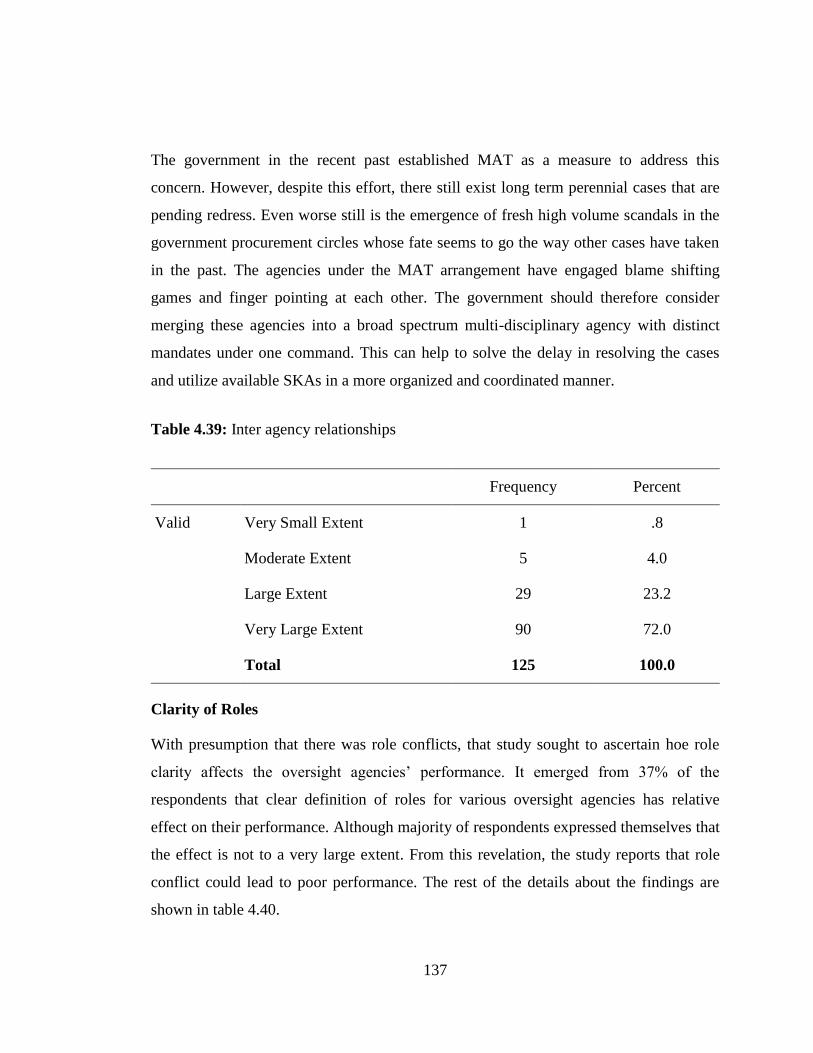
137
The government in the recent past established MAT as a measure to address this
concern. However, despite this effort, there still exist long term perennial cases that are
pending redress. Even worse still is the emergence of fresh high volume scandals in the
government procurement circles whose fate seems to go the way other cases have taken
in the past. The agencies under the MAT arrangement have engaged blame shifting
games and finger pointing at each other. The government should therefore consider
merging these agencies into a broad spectrum multi-disciplinary agency with distinct
mandates under one command. This can help to solve the delay in resolving the cases
and utilize available SKAs in a more organized and coordinated manner.
Table 4.39: Inter agency relationships
Frequency Percent
Valid Very Small Extent 1 .8
Moderate Extent 5 4.0
Large Extent 29 23.2
Very Large Extent 90 72.0
Total 125 100.0
Clarity of Roles
With presumption that there was role conflicts, that study sought to ascertain hoe role
clarity affects the oversight agencies’ performance. It emerged from 37% of the
respondents that clear definition of roles for various oversight agencies has relative
effect on their performance. Although majority of respondents expressed themselves that
the effect is not to a very large extent. From this revelation, the study reports that role
conflict could lead to poor performance. The rest of the details about the findings are
shown in table 4.40.

138
PPDA, 2005, PPDR, 2006 as amended by PPDCGR, 2013 vest supreme authority of
public procurement decisions in PDEs’ tender committees, sentiments echoed by (RoK,
(2015; RoK, 2006 & RoK, 2013). Some of the authority is further delegated to other
oversight agencies such as PPRA’s complaints review and administrative board, EACC,
KENAO and even the internal audit divisions.
Shiundu et al, (2013) contends that the basic purpose for establishment of the oversight
agencies in public procurement is to assist in ensuring fairness and equity in
opportunities. This is not only in the way procurement and its accompanying processes
are conducted, but in how the various roles, responsibilities and decision are allocated
and executed within procuring entities. This is effective when the roles of the entities are
clear and unambiguous. Lysons and Farrington (2010) concur that one of the causes of
conflicts and unsatisfactory performance within inter related agencies is the role
ambiguity. Eyaa and Oluka (2011) says that many corporate members in Africa,
especially in state owned PDEs have limited understanding of their oversight roles and
are therefore open to manipulation.
This is evident among the MAT agencies. In their recent anti-corruption summit with
various stakeholders, there was blame shifting amongst themselves to the extent that it
was difficult to identify the areas of concern in the fight against the vice. In order to
contain this phenomenon, the measure of unifying their role under one broad spectrum
as addressed above is necessary. It would eliminate the inherent conflicts and help to
streamline the operations therein.

139
Table 4.40: Role clarity
Frequency Percent
Valid Very Small Extent 1 .8
Small Extent 1 .8
Moderate Extent 35 28.0
Large Extent 46 36.8
Very Large Extent 42 33.6
Total 125 100.0
Oversight Agencies Summary of Attributes
From the table 4.41, the means for the variables gravitate around 5 which was the
statistic for the very large extent effect. This is except the mean responses for the
variable role clarity which is 4, a statistic for large extent effect. This shows that on
average respondents agree that variables addressed by the study have significant effect
on the oversight agencies ability to ensure that MSEs gain from public procurement
opportunities. The degrees of variance within the responses as indicated by the standard
deviations of the respective variables demonstrate varied degrees of respondents
positions on the extents to which the variable affect the growth of MSEs.
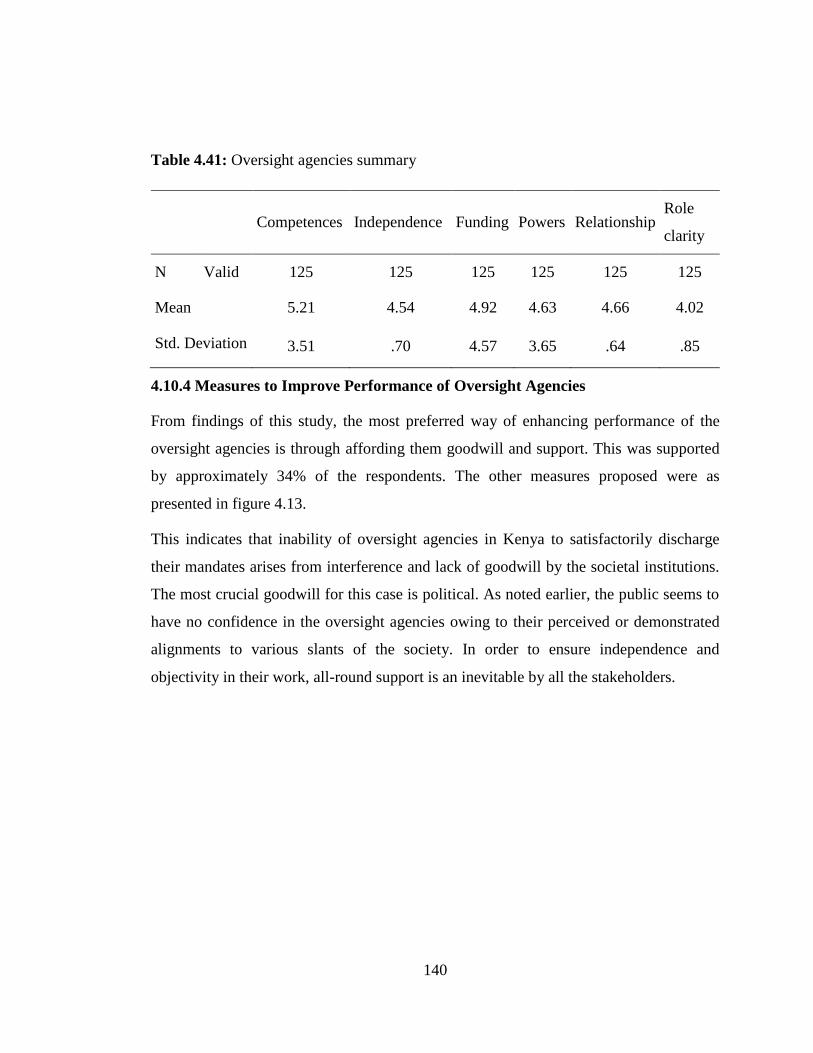
140
Table 4.41: Oversight agencies summary
Competences Independence Funding Powers Relationship Role
clarity
N Valid 125 125 125 125 125 125
Mean 5.21 4.54 4.92 4.63 4.66 4.02
Std. Deviation 3.51 .70 4.57 3.65 .64 .85
4.10.4 Measures to Improve Performance of Oversight Agencies
From findings of this study, the most preferred way of enhancing performance of the
oversight agencies is through affording them goodwill and support. This was supported
by approximately 34% of the respondents. The other measures proposed were as
presented in figure 4.13.
This indicates that inability of oversight agencies in Kenya to satisfactorily discharge
their mandates arises from interference and lack of goodwill by the societal institutions.
The most crucial goodwill for this case is political. As noted earlier, the public seems to
have no confidence in the oversight agencies owing to their perceived or demonstrated
alignments to various slants of the society. In order to ensure independence and
objectivity in their work, all-round support is an inevitable by all the stakeholders.
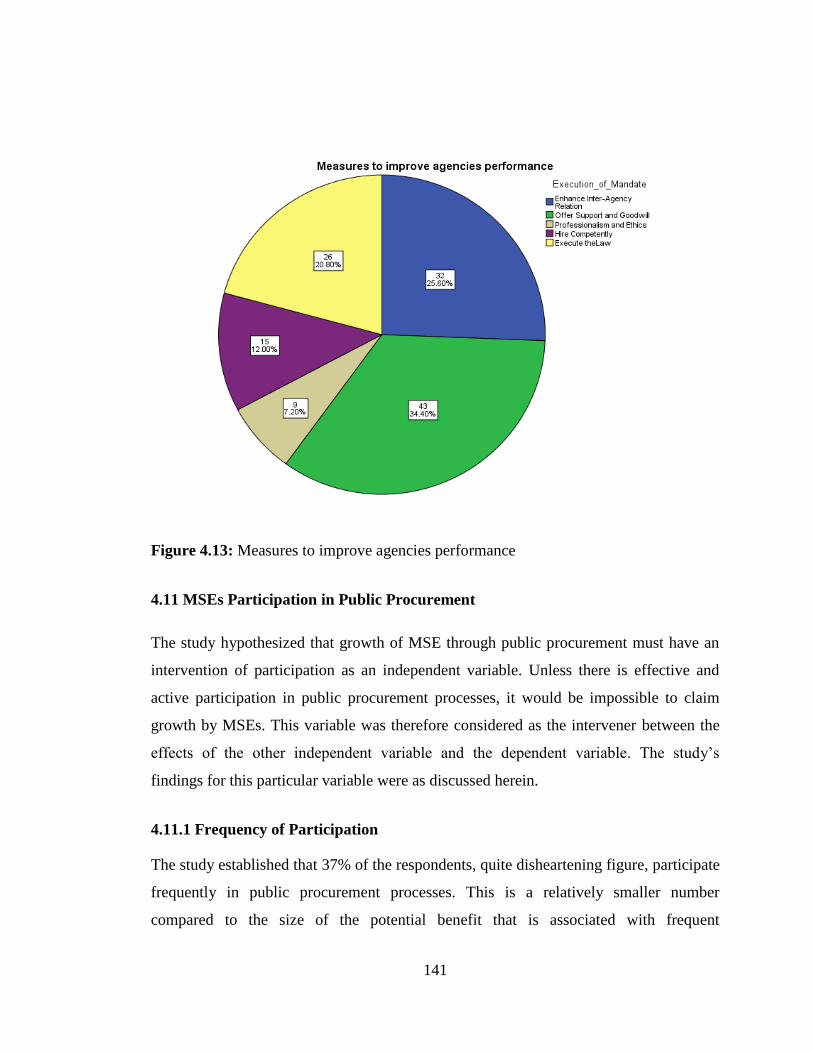
141
Figure 4.13: Measures to improve agencies performance
4.11 MSEs Participation in Public Procurement
The study hypothesized that growth of MSE through public procurement must have an
intervention of participation as an independent variable. Unless there is effective and
active participation in public procurement processes, it would be impossible to claim
growth by MSEs. This variable was therefore considered as the intervener between the
effects of the other independent variable and the dependent variable. The study’s
findings for this particular variable were as discussed herein.
4.11.1 Frequency of Participation
The study established that 37% of the respondents, quite disheartening figure, participate
frequently in public procurement processes. This is a relatively smaller number
compared to the size of the potential benefit that is associated with frequent
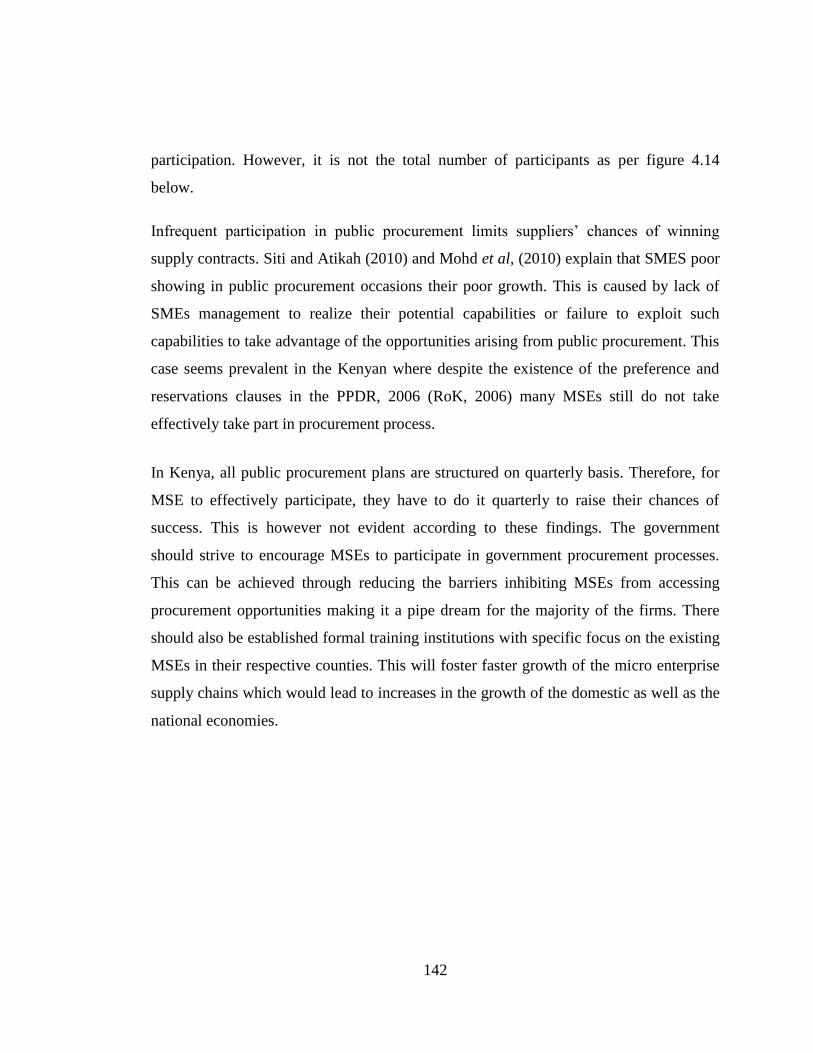
142
participation. However, it is not the total number of participants as per figure 4.14
below.
Infrequent participation in public procurement limits suppliers’ chances of winning
supply contracts. Siti and Atikah (2010) and Mohd et al, (2010) explain that SMES poor
showing in public procurement occasions their poor growth. This is caused by lack of
SMEs management to realize their potential capabilities or failure to exploit such
capabilities to take advantage of the opportunities arising from public procurement. This
case seems prevalent in the Kenyan where despite the existence of the preference and
reservations clauses in the PPDR, 2006 (RoK, 2006) many MSEs still do not take
effectively take part in procurement process.
In Kenya, all public procurement plans are structured on quarterly basis. Therefore, for
MSE to effectively participate, they have to do it quarterly to raise their chances of
success. This is however not evident according to these findings. The government
should strive to encourage MSEs to participate in government procurement processes.
This can be achieved through reducing the barriers inhibiting MSEs from accessing
procurement opportunities making it a pipe dream for the majority of the firms. There
should also be established formal training institutions with specific focus on the existing
MSEs in their respective counties. This will foster faster growth of the micro enterprise
supply chains which would lead to increases in the growth of the domestic as well as the
national economies.

143
Figure 4.14: Frequency of participation
4.11.3 Determinants of MSEs Growth
This section sought to measure the extent to which each of the independent variables
directly influenced the dependent variable. It was utilized to show the respondents rating
of the effects of the other independent variables on the participation of MSEs in public
procurement. Presumably, all the other independent variables affected how the MSEs
participated in public procurement. The study outcomes on this variable were discussed
as follows.
Procurement Procedures
It was determined by the study that 91% of respondents feel that procurement
procedures significantly affect the growth of MSEs. The regulation of public
procurement includes the rules and regulations that regulate procurement processes in
public entities. They include the legal framework put in place by the government which
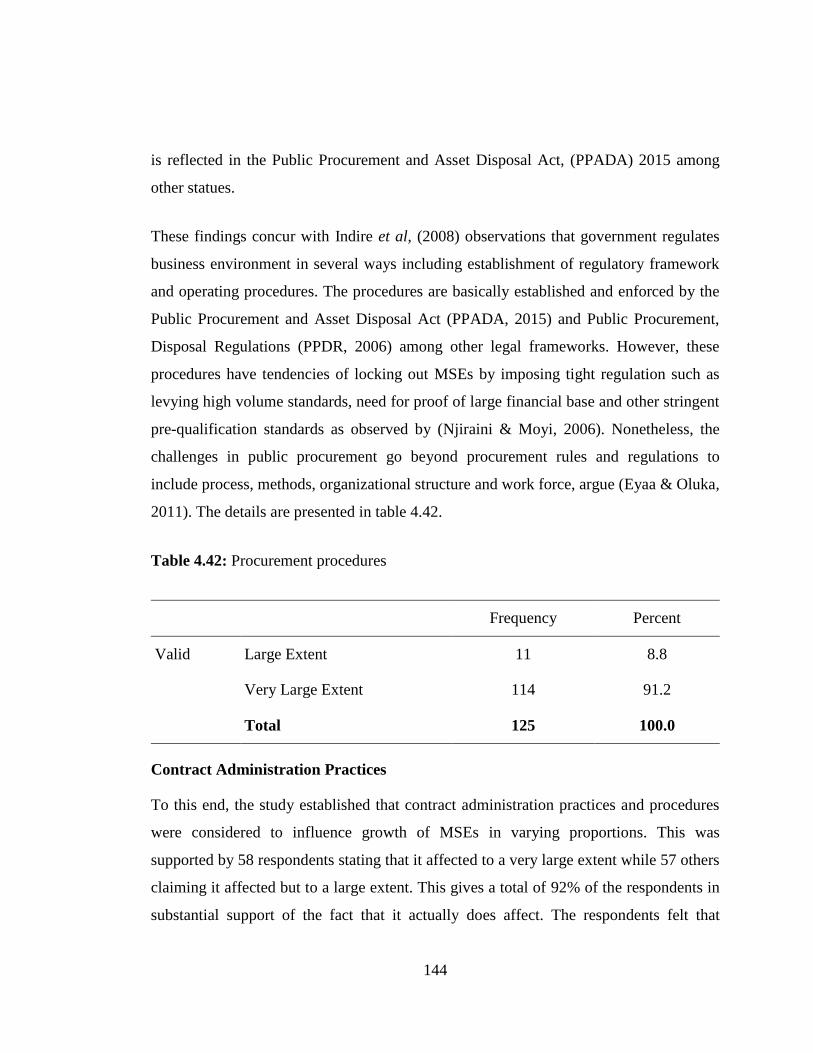
144
is reflected in the Public Procurement and Asset Disposal Act, (PPADA) 2015 among
other statues.
These findings concur with Indire et al, (2008) observations that government regulates
business environment in several ways including establishment of regulatory framework
and operating procedures. The procedures are basically established and enforced by the
Public Procurement and Asset Disposal Act (PPADA, 2015) and Public Procurement,
Disposal Regulations (PPDR, 2006) among other legal frameworks. However, these
procedures have tendencies of locking out MSEs by imposing tight regulation such as
levying high volume standards, need for proof of large financial base and other stringent
pre-qualification standards as observed by (Njiraini & Moyi, 2006). Nonetheless, the
challenges in public procurement go beyond procurement rules and regulations to
include process, methods, organizational structure and work force, argue (Eyaa & Oluka,
2011). The details are presented in table 4.42.
Table 4.42: Procurement procedures
Frequency Percent
Valid Large Extent 11 8.8
Very Large Extent 114 91.2
Total 125 100.0
Contract Administration Practices
To this end, the study established that contract administration practices and procedures
were considered to influence growth of MSEs in varying proportions. This was
supported by 58 respondents stating that it affected to a very large extent while 57 others
claiming it affected but to a large extent. This gives a total of 92% of the respondents in
substantial support of the fact that it actually does affect. The respondents felt that
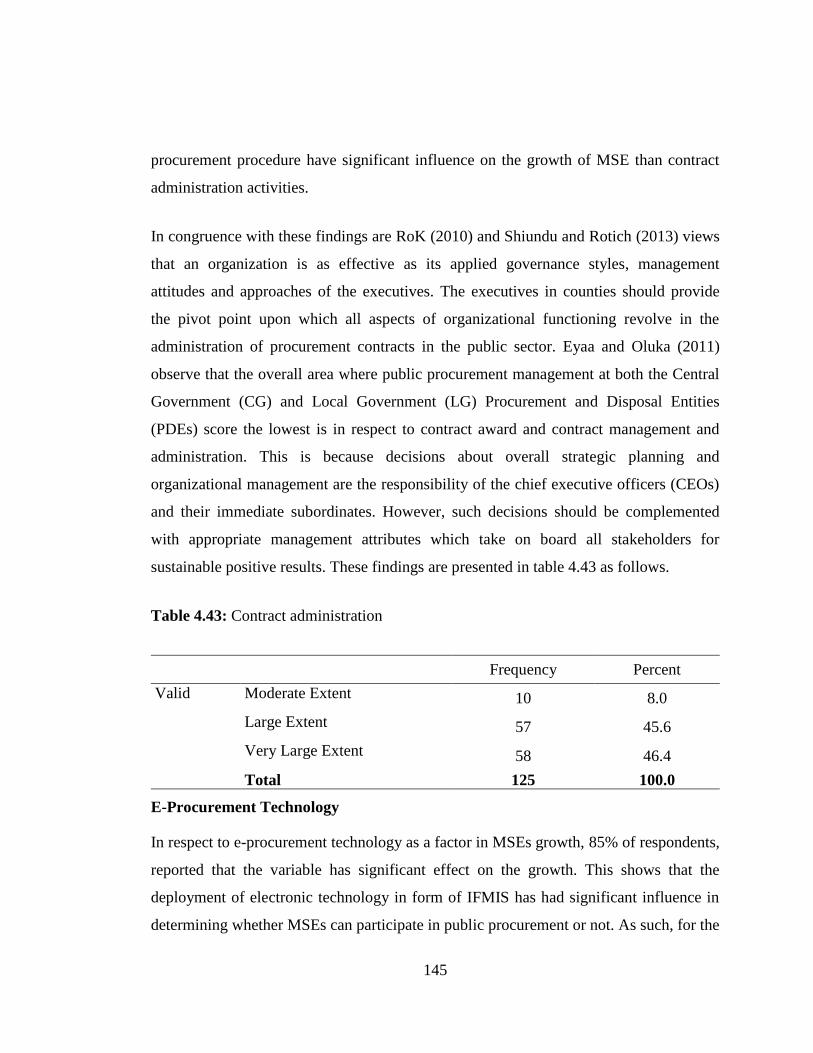
145
procurement procedure have significant influence on the growth of MSE than contract
administration activities.
In congruence with these findings are RoK (2010) and Shiundu and Rotich (2013) views
that an organization is as effective as its applied governance styles, management
attitudes and approaches of the executives. The executives in counties should provide
the pivot point upon which all aspects of organizational functioning revolve in the
administration of procurement contracts in the public sector. Eyaa and Oluka (2011)
observe that the overall area where public procurement management at both the Central
Government (CG) and Local Government (LG) Procurement and Disposal Entities
(PDEs) score the lowest is in respect to contract award and contract management and
administration. This is because decisions about overall strategic planning and
organizational management are the responsibility of the chief executive officers (CEOs)
and their immediate subordinates. However, such decisions should be complemented
with appropriate management attributes which take on board all stakeholders for
sustainable positive results. These findings are presented in table 4.43 as follows.
Table 4.43: Contract administration
Frequency Percent
Valid Moderate Extent 10 8.0
Large Extent 57 45.6
Very Large Extent 58 46.4
Total 125 100.0
E-Procurement Technology
In respect to e-procurement technology as a factor in MSEs growth, 85% of respondents,
reported that the variable has significant effect on the growth. This shows that the
deployment of electronic technology in form of IFMIS has had significant influence in
determining whether MSEs can participate in public procurement or not. As such, for the
146
MSEs to participate in public procurement and probably secure their growth, they need
to be techno savvy. This could be the main reason for this outcome from the
respondents.
Aketch and Karanja, (2013) and Eyaa and Oluka (2011) echo these findings that
electronic procurement (e-procurement) which is a component of ICT, leads to more
market transactions, improves market transparency, lowers search and supplier
switching costs besides improving the overall management of supply chains. That
notwithstanding, Aketch and Karanja (2013) argue that it is disheartening to note that its
implementation in most Kenyan entities is extremely poor. According to Pearce (2012)
firms in competitive market environment must strive to understand both the existing
technological advances and the future advancements that could affect their products and
service delivery.
This is likely to offer competitive advantage especially in identifying and ceasing
business opportunities within the environment. Slackened socio-economic growth and
development for MSEs is attributable to slow uptake and commercialization of scientific
technological innovations. This owes to inadequate infrastructure and lack of political
goodwill to support the appropriate rate of growth of technology amongst the MSEs. In
the past, manual systems that characterized the public sector processes deterred effective
participation of the private sector, especially the MSEs in government procurement
opportunities. More details are provided in table 4.44.

147
Table 4.44: e-Procurement Technology
Frequency Percent
Valid Large Extent 19 15.2
Very Large Extent 106 84.8
Total 125 100.0
Bidding Capacity
In almost equal measure, just like other previous variables, 82% of respondents regarded
bidding capacity to exert to a very large extent its effects on MSEs growth. It was yet the
other critically significant factor in the study that was found to influence the growth of
MSEs in counties in Kenya.
Indire et al (2008) advance that in order to facilitate small business growth and
development, the government should commit to undertake training initiatives to impart
and improve skills of the business people to enhance their business management
capacities. Alande, (2013) blames inadequacy in staff training both technically and
experientially, technology and financially for poor performance of County governments
as they reduce effective capacity for service delivery. According to Shiundu and Rotich
(2013), competent procurement related decisions are those based on rules and analysis
with sufficient organizational experience which enhances responsiveness to citizens’
expectations and aspirations.
Although the Integrated Financial Management Information System (IFMIS) was
intended to enhance operational and control capacity in the public financial management
reform effort, many key activities are still undertaken outside the system albeit the
IFMIS capabilities to achieve full automation. The IFMIS strategic plan presumably,
seeks to identify the political, administrative and capacity constraints that require
rigorous interventions in order to secure the buy-in and necessary ownership within
MDAs. Apparently, large enterprises have persistently had a field day in government

148
procurement at the expense of MSEs. Besides, the re-engineering of IFMIS may not
achieve much unless the government professionalizes the public procurement function
with necessary and relevant human capital as well as capacitate the MSE to participate
in public procurement. In table 4.45 these findings are clearly presented in their detailed
form.
Table 4.45: Bidding capacity
Frequency Percent
Valid Moderate Extent 1 .8
Large Extent 22 17.6
Very Large Extent 102 81.6
Total 125 100.0
Oversight Agencies
From these findings, majority of respondents said that although it had influence, they did
not consider the influence of oversight agencies to have significant effect on the growth
of MSEs taking part in public procurement in Kenya. It was found out that 43% of the
respondents, believed that the procurement oversight agencies affected the growth of
MSEs. This implies that although oversight agencies are expected to offer checks and
balances on the procurement operations in the public entities, their existence has not
convinced the MSEs that they can help them to grow.
This aligns with Shiundu et al, (2013) that the basic purpose for establishment of the
oversight agencies by procurement regulatory framework is to assist in striking a
moderated balance not only in the way procurement processes and technologies are
structured, but in how the various roles, responsibilities and decision rights are allocated
between procuring entities and other stakeholders. This puts public tender awarding

149
authorities in a pivotal position in the adjudication of government procurement
processes. Consequently, the onus of effective participation of all categories of suppliers
including MSEs in public procurement lies with these authorities. Centre for
Parliamentary Studies Training (CPST) states that it is important that tender awarding
and oversight authorities have the appropriate competences to properly assess,
rationalize, and afford equal public procurement opportunities to all potential bidders,
(RoK, 2015).
However, unless proper ethical standards are observed in the discharge of their mandate,
bias will arise. Resultantly, the weaker firms may not benefit from public procurement
processes. It therefore requires tender adjudication committees to be constituted from a
team of officers with sufficient and relevant managerial experience, knowledge,
confidence and competences. Despite the recognition of the value of managerial
experience in converting organizations’ resources into societally beneficial plans in the
public sector, little effort and attention have been devoted to developing an experience-
based cross functional team of public executives to serve in procurement oversight
committees. In order to ensure that they deliver on their mandate, the oversight agencies
should pool together their team-specific experiences to make and implement decisions
with positive impact of the public procurement processes on the economy. This can be
achieved through the engagement of fair and constructive discussions and debates on
strategic decisions during their committee sittings in adjudicating on suppliers’
determination, selection and contract awards. More results about these findings are in
table 4.46.

150
Table 4.46: Oversight agencies
Frequency Percent
Valid Very Small Extent 1 .8
Moderate Extent 20 16.0
Large Extent 54 43.2
Very Large Extent 50 40.0
Total 125 100.0
Participation in Public Procurement
The study further ascertained that as an intervening variable, for the MSEs to register
significant growth through public procurement, they must participate. Among the six
independent variables of the study, 93% of the respondents said that MSE participation
significantly affects their rate of growth. This was the second in rank variable that was
considered the most influential by the majority of the respondents.
In agreement with this finding, Njiraini and Moyi (2006) contend that one of the
innovative ways in which countries should be dealing with the MSE market access
constraint is by enhancing participation of MSEs in public procurement. This provides
an important market for MSEs and offers them an opportunity to overcome the market
constraint. Bougie and Sekaran (2013) advance that unless there is the presence of an
intervening variable, the theorized relationship between the independent and dependent
variables cannot be sustained. The rate at which the MSEs participate in public
procurement in the counties in Kenya is critical and crucial for their growth. According
to the Ministry of Industrialization and Enterprise Development, lack of vibrant market
for the MSE products inhibits their growth and competitiveness, (RoK, 2013).

151
In Kenya however, public sector purchasing practices tend to lock out MSEs through
unfavorable pre-requisite requirements for participation for the MSEs. In an effort to
remedy this phenomenon, the government should be seeking to upgrade the dilapidated
MSE infrastructure in order to incorporate the sector into the mainstream procurement
activities for their growth and self-sustainability. This trend has been a long time ridicule
for the governments in the developing nations. They have been grappling with the need
to develop an environment conducive to job creation with a view to generate
employment for the high number of new labour market entrants and reduce high
structural unemployment without much breakthrough. In order to achieve this goal, it is
imperative to prepare for economic expansion, providing economic opportunities for the
populace through entrepreneurship in the MSE sector. The details were as demonstrated
in table 4.47.
Table 4.47: Participation
Frequency Percent
Valid Very Small Extent 1 .8
Moderate Extent 1 .8
Large Extent 7 5.6
Very Large Extent 116 92.8
Total 125 100.0
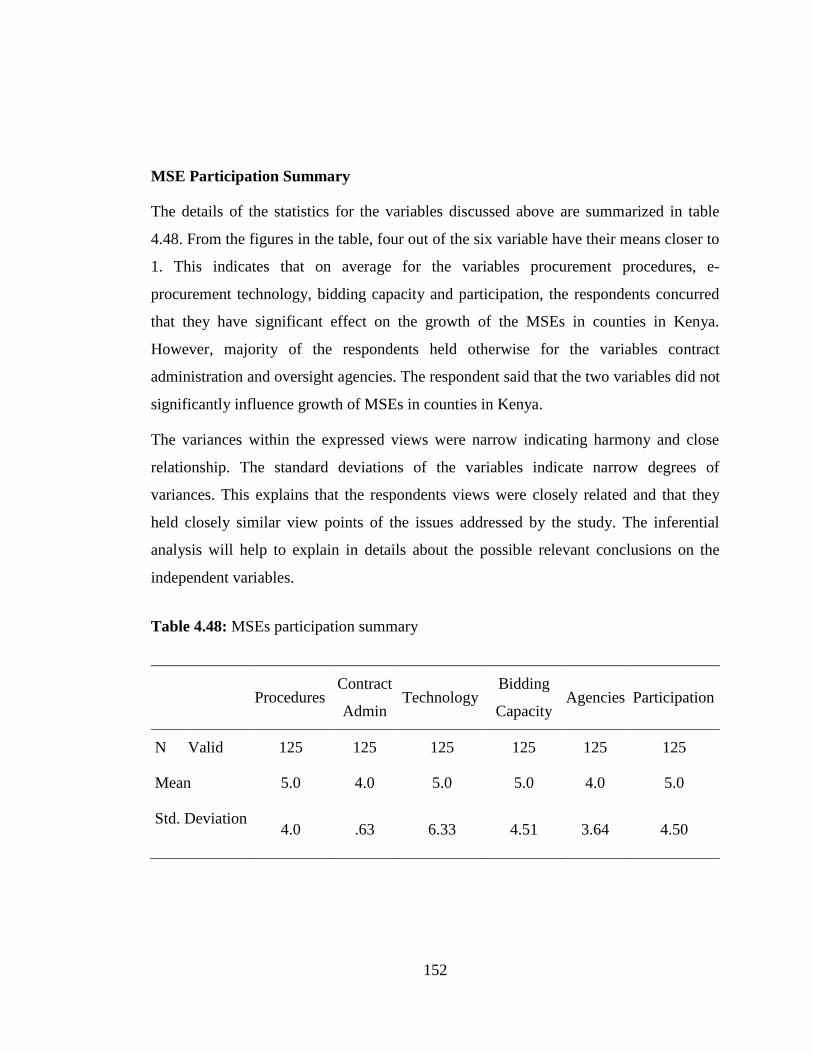
152
MSE Participation Summary
The details of the statistics for the variables discussed above are summarized in table
4.48. From the figures in the table, four out of the six variable have their means closer to
1. This indicates that on average for the variables procurement procedures, e-
procurement technology, bidding capacity and participation, the respondents concurred
that they have significant effect on the growth of the MSEs in counties in Kenya.
However, majority of the respondents held otherwise for the variables contract
administration and oversight agencies. The respondent said that the two variables did not
significantly influence growth of MSEs in counties in Kenya.
The variances within the expressed views were narrow indicating harmony and close
relationship. The standard deviations of the variables indicate narrow degrees of
variances. This explains that the respondents views were closely related and that they
held closely similar view points of the issues addressed by the study. The inferential
analysis will help to explain in details about the possible relevant conclusions on the
independent variables.
Table 4.48: MSEs participation summary
Procedures Contract
Admin Technology
Bidding
Capacity Agencies Participation
N Valid 125 125 125 125 125 125
Mean 5.0 4.0 5.0 5.0 4.0 5.0
Std. Deviation 4.0 .63 6.33 4.51 3.64 4.50

153
4.11.4 Level of Participation
The level of participation of the MSEs in the counties in Kenya remains disturbing and
very low. This is according to 83% of respondents. Despite the purported efforts by the
government to stimulate growth of MSEs by incorporating them into public
procurement, they still do not take part as may be desired. This problem may be
addressed by reviewing the issues raised in this study and formulating appropriate policy
measures. The level of participation could be significantly increased if research based
decisions were the main focus by the public policy strategists.
This agrees with Ochiri (2011) report that public procurement in Kenya has perpetually
ignored the MSEs since independence. Local MSE firms have been regarded as lacking
capacity to service the government with its needs. This scenario has been a major
setback towards the growth of this important informal sector leading to the endless ailing
of entrepreneurship culture in Kenya, contends (Muniu & Ngugi, 2013). Njiraini and
Moyi (2006) augments this argument by observing that Kenya’s public sector
purchasing procedures and practices have persistently shunned MSEs participation by
setting tough pre-qualification standards. The growth of MSE sector in Kenya suffers
from dilapidated infrastructure and inappropriate technology that undermine their
desired growth, (Muniu & Ngugi, 2013).
The major challenge that County governments face in implementing devolution in
Kenya is narrowing regional disparities in income, resource endowment and economic
development. This can be achieved if the devolved governance system can tap into and
harness the available local resources through the local MSE entrepreneurs. County
government units should place premium on the philosophy of ‘buy county-built county.’
Devolution being the heart of the Constitution, governors should champions
constitutional spirit and endeavor to enable locals to take part in setting their own
economic, political and social agenda. Measures to mitigate prohibitive bureaucratic
policies previously experienced in the government at the expense of MSE access to

154
government opportunities should be addressed comprehensively. The findings are
presented in figure 4.15 in more details.
Figure 4.15: Level of participation
4.12 Statistical Modelling
This study was conducted on the basis of fundamental research; to make contribution to
the existing knowledge. However, although the objective was to generate additional
knowledge about the stated problem, the knowledge generated may be applied later for
solving real world problems. It is against this backdrop that inferential analysis is
essential to demonstrate the significance of the statistics herein to generally applying
them to help solve the problems in real world environment. The inferential statistics are
meant for the generalizability purposes.
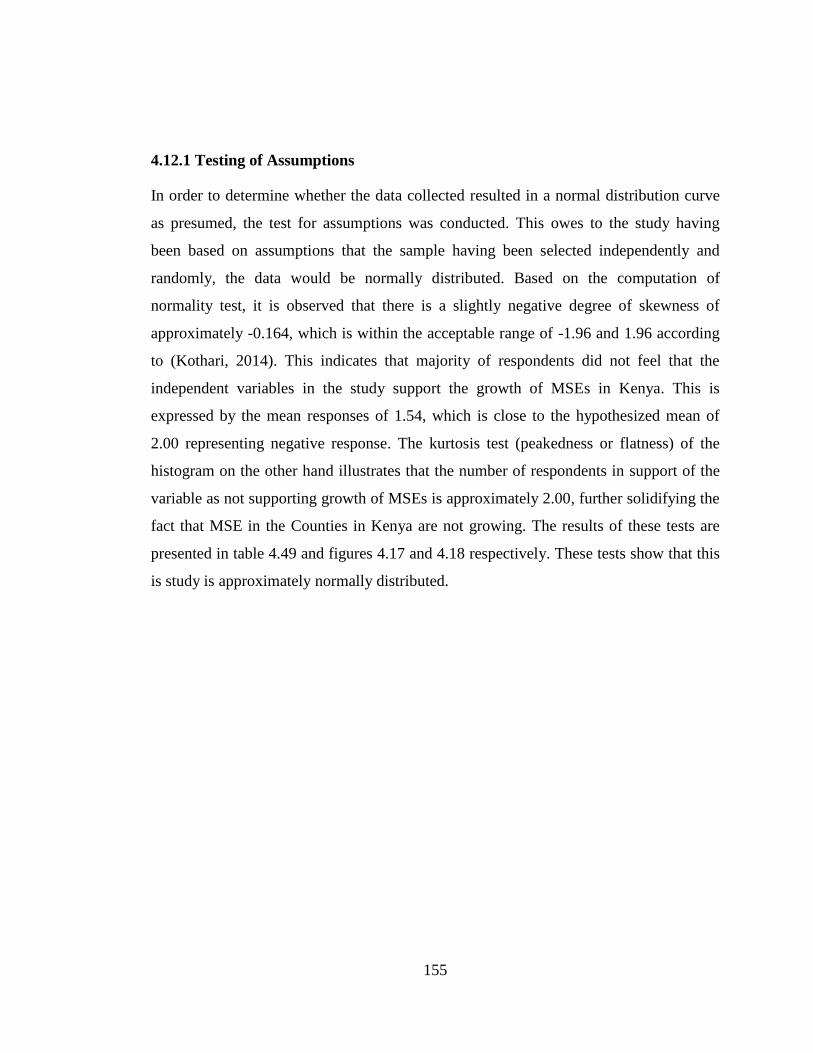
155
4.12.1 Testing of Assumptions
In order to determine whether the data collected resulted in a normal distribution curve
as presumed, the test for assumptions was conducted. This owes to the study having
been based on assumptions that the sample having been selected independently and
randomly, the data would be normally distributed. Based on the computation of
normality test, it is observed that there is a slightly negative degree of skewness of
approximately -0.164, which is within the acceptable range of -1.96 and 1.96 according
to (Kothari, 2014). This indicates that majority of respondents did not feel that the
independent variables in the study support the growth of MSEs in Kenya. This is
expressed by the mean responses of 1.54, which is close to the hypothesized mean of
2.00 representing negative response. The kurtosis test (peakedness or flatness) of the
histogram on the other hand illustrates that the number of respondents in support of the
variable as not supporting growth of MSEs is approximately 2.00, further solidifying the
fact that MSE in the Counties in Kenya are not growing. The results of these tests are
presented in table 4.49 and figures 4.17 and 4.18 respectively. These tests show that this
is study is approximately normally distributed.
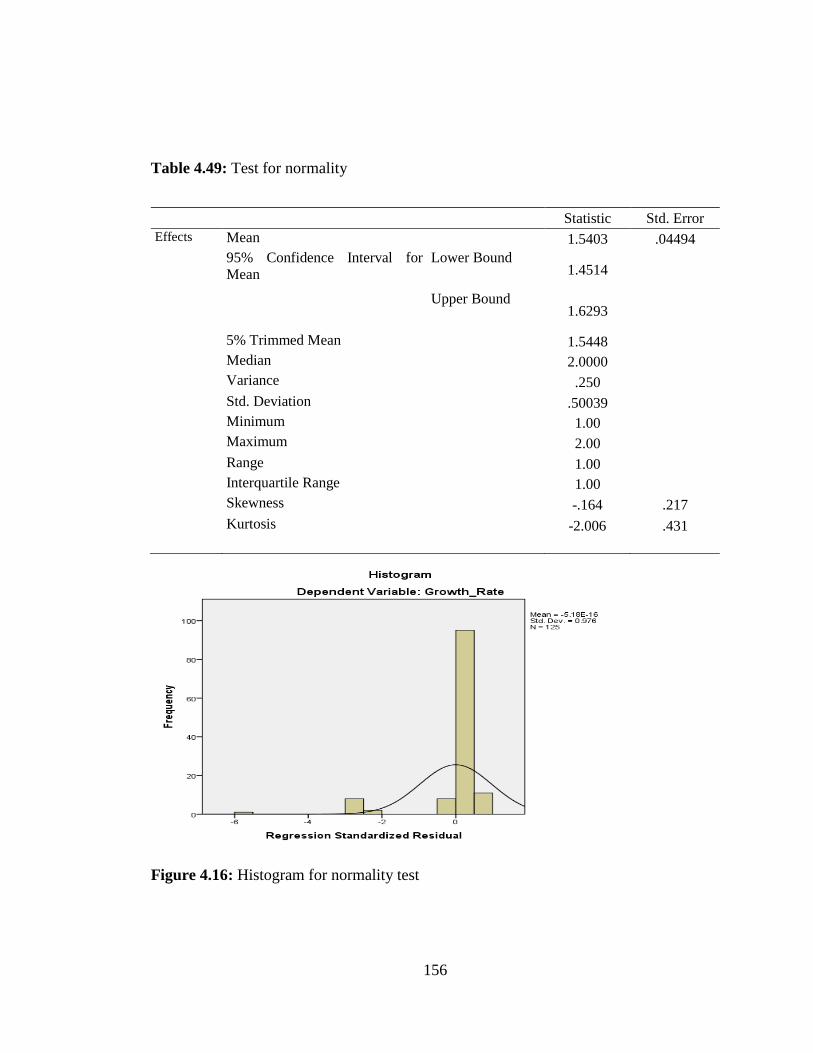
156
Table 4.49: Test for normality
Statistic Std. Error
Effects Mean 1.5403 .04494
95% Confidence Interval for
Mean
Lower Bound 1.4514
Upper Bound 1.6293
5% Trimmed Mean 1.5448
Median 2.0000
Variance .250
Std. Deviation .50039
Minimum 1.00
Maximum 2.00
Range 1.00
Interquartile Range 1.00
Skewness -.164 .217
Kurtosis -2.006 .431
Figure 4.16: Histogram for normality test

157
Figure 4.17: Normal Q-Q Plot for normality
4.12.2 Testing of Hypotheses: Chi Square Test
Hypothesis is usually considered as the principal instrument in research whose main
function is to suggest new experiments and observations as contended by (Kothari &
Garg, 2014). In social science where direct knowledge of population parameter(s) is
rare, hypothesis testing is the often used strategy for deciding whether a sample data
offers such support for hypothesis that generalization can be made argue (Kothari &
Garg, 2014; Sekaran & Bougie, 2013). Therefore, testing of hypothesis enabled the
study to make probability statements about the population parameters. Although
hypothesis may not be proved absolutely according to Kothari and Garg (2014) in
practice it is accepted if it withstands critical testing.
From the cross tabulation for the variable X1 in table 4.50, it was evident that the rate of
growth of MSEs is extremely low. The observed count for the low rate of growth of
MSEs was equal to the expected count at 114 against the 10 for moderate growth. The
asymptotic significance in table 4.51, which is the Pearson Chi square p value for this
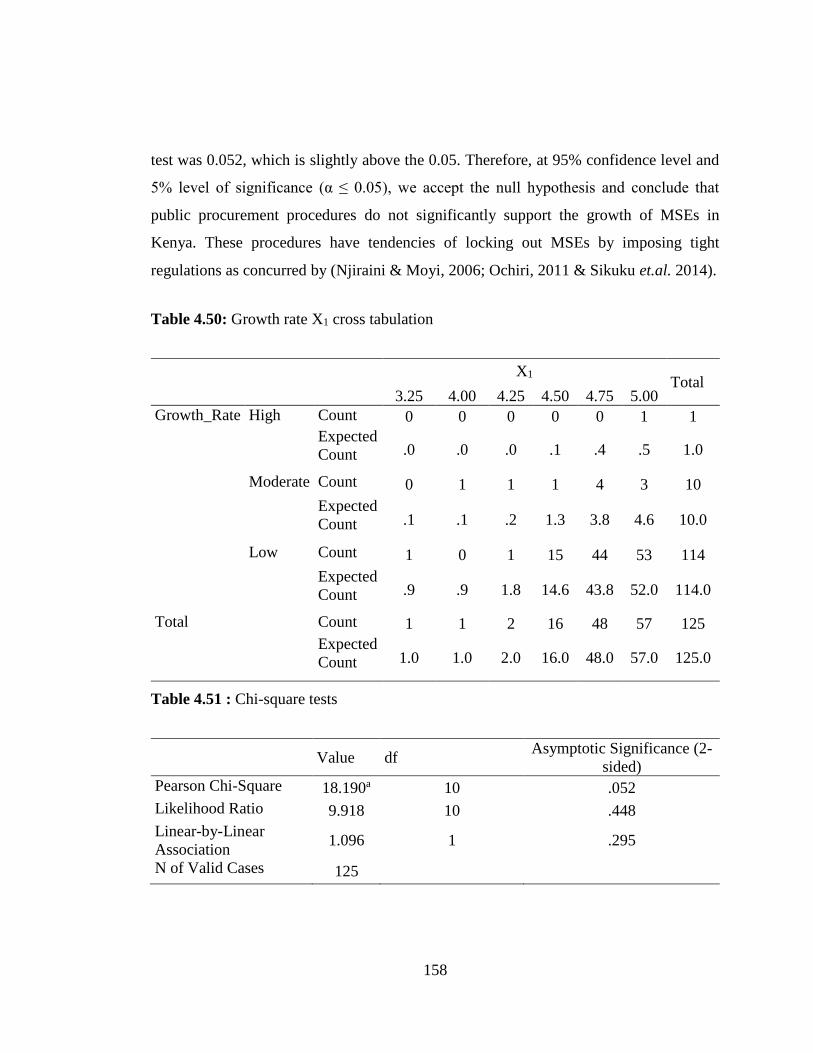
158
test was 0.052, which is slightly above the 0.05. Therefore, at 95% confidence level and
5% level of significance (α ≤ 0.05), we accept the null hypothesis and conclude that
public procurement procedures do not significantly support the growth of MSEs in
Kenya. These procedures have tendencies of locking out MSEs by imposing tight
regulations as concurred by (Njiraini & Moyi, 2006; Ochiri, 2011 & Sikuku et.al. 2014).
Table 4.50: Growth rate X1 cross tabulation
X1 Total
3.25 4.00 4.25 4.50 4.75 5.00
Growth_Rate High Count 0 0 0 0 0 1 1
Expected
Count .0 .0 .0 .1 .4 .5 1.0
Moderate Count 0 1 1 1 4 3 10
Expected
Count .1 .1 .2 1.3 3.8 4.6 10.0
Low Count 1 0 1 15 44 53 114
Expected
Count .9 .9 1.8 14.6 43.8 52.0 114.0
Total Count 1 1 2 16 48 57 125
Expected
Count 1.0 1.0 2.0 16.0 48.0 57.0 125.0
Table 4.51 : Chi-square tests
Value df
Asymptotic Significance (2-
sided)
Pearson Chi-Square 18.190a 10 .052
Likelihood Ratio 9.918 10 .448
Linear-by-Linear
Association 1.096 1 .295
N of Valid Cases 125
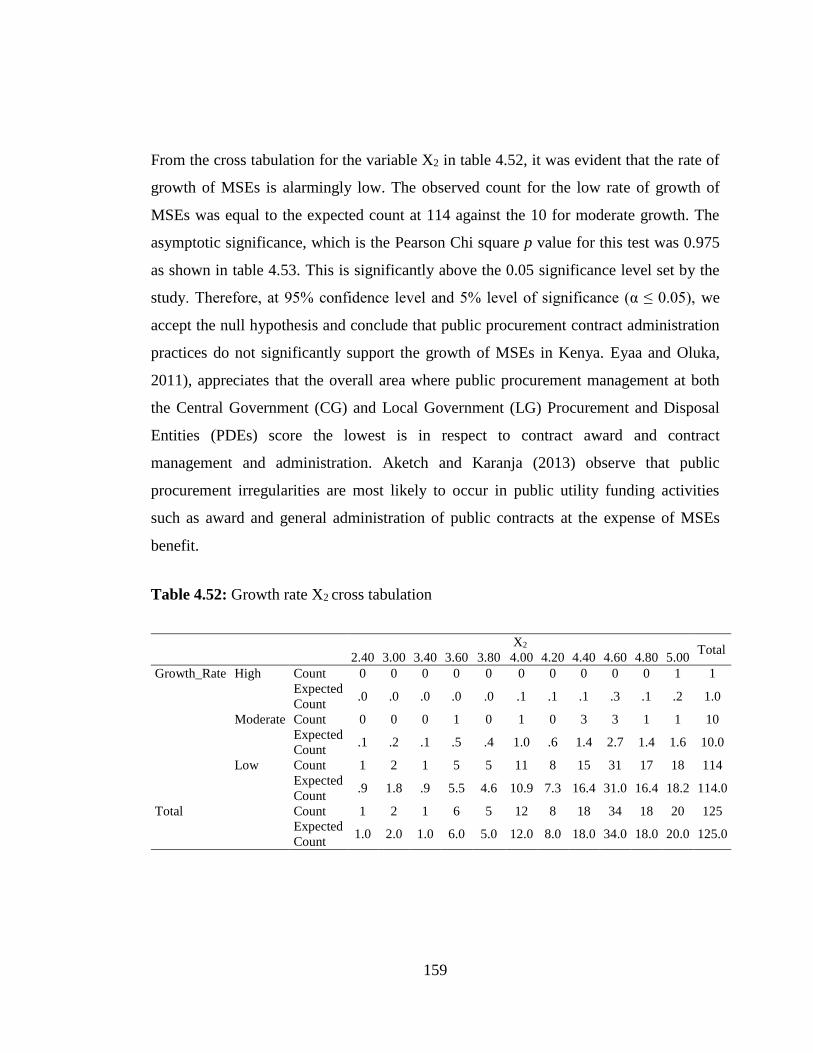
159
From the cross tabulation for the variable X2 in table 4.52, it was evident that the rate of
growth of MSEs is alarmingly low. The observed count for the low rate of growth of
MSEs was equal to the expected count at 114 against the 10 for moderate growth. The
asymptotic significance, which is the Pearson Chi square p value for this test was 0.975
as shown in table 4.53. This is significantly above the 0.05 significance level set by the
study. Therefore, at 95% confidence level and 5% level of significance (α ≤ 0.05), we
accept the null hypothesis and conclude that public procurement contract administration
practices do not significantly support the growth of MSEs in Kenya. Eyaa and Oluka,
2011), appreciates that the overall area where public procurement management at both
the Central Government (CG) and Local Government (LG) Procurement and Disposal
Entities (PDEs) score the lowest is in respect to contract award and contract
management and administration. Aketch and Karanja (2013) observe that public
procurement irregularities are most likely to occur in public utility funding activities
such as award and general administration of public contracts at the expense of MSEs
benefit.
Table 4.52: Growth rate X2 cross tabulation
X2 Total
2.40 3.00 3.40 3.60 3.80 4.00 4.20 4.40 4.60 4.80 5.00
Growth_Rate High Count 0 0 0 0 0 0 0 0 0 0 1 1
Expected
Count .0 .0 .0 .0 .0 .1 .1 .1 .3 .1 .2 1.0
Moderate Count 0 0 0 1 0 1 0 3 3 1 1 10
Expected
Count .1 .2 .1 .5 .4 1.0 .6 1.4 2.7 1.4 1.6 10.0
Low Count 1 2 1 5 5 11 8 15 31 17 18 114
Expected
Count .9 1.8 .9 5.5 4.6 10.9 7.3 16.4 31.0 16.4 18.2 114.0
Total Count 1 2 1 6 5 12 8 18 34 18 20 125
Expected
Count 1.0 2.0 1.0 6.0 5.0 12.0 8.0 18.0 34.0 18.0 20.0 125.0
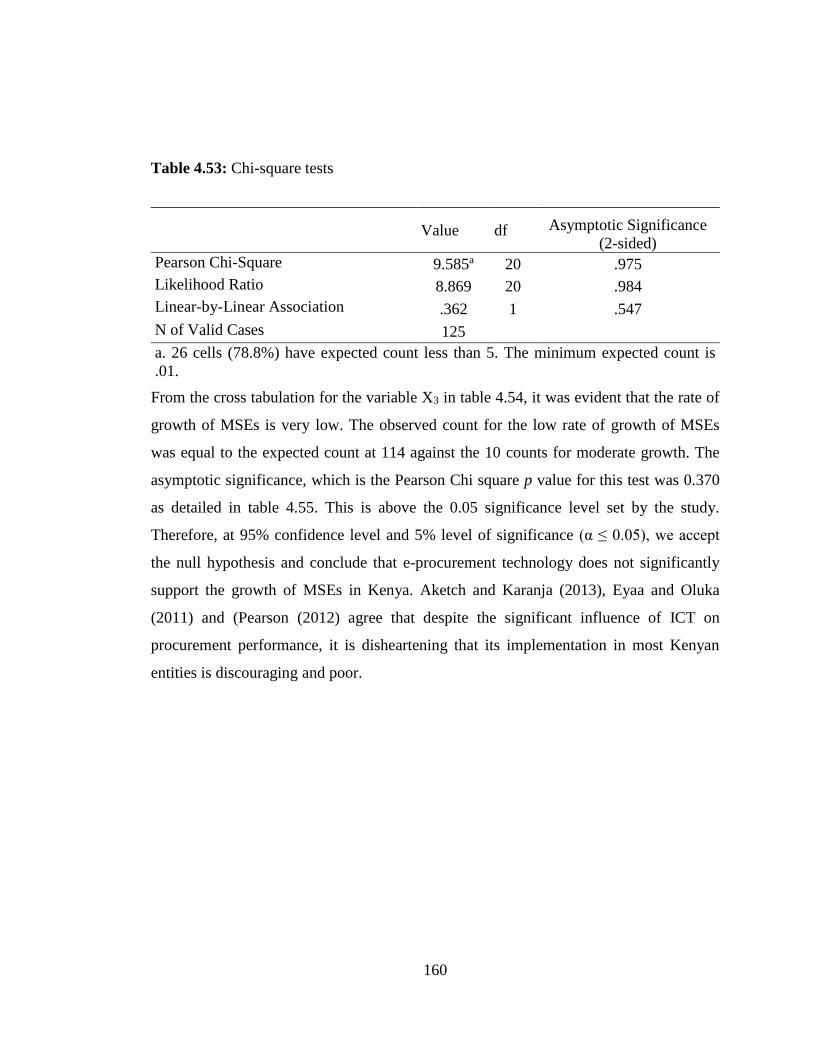
160
Table 4.53: Chi-square tests
Value df Asymptotic Significance
(2-sided)
Pearson Chi-Square 9.585a 20 .975
Likelihood Ratio 8.869 20 .984
Linear-by-Linear Association .362 1 .547
N of Valid Cases 125
a. 26 cells (78.8%) have expected count less than 5. The minimum expected count is
.01.
From the cross tabulation for the variable X3 in table 4.54, it was evident that the rate of
growth of MSEs is very low. The observed count for the low rate of growth of MSEs
was equal to the expected count at 114 against the 10 counts for moderate growth. The
asymptotic significance, which is the Pearson Chi square p value for this test was 0.370
as detailed in table 4.55. This is above the 0.05 significance level set by the study.
Therefore, at 95% confidence level and 5% level of significance (α ≤ 0.05), we accept
the null hypothesis and conclude that e-procurement technology does not significantly
support the growth of MSEs in Kenya. Aketch and Karanja (2013), Eyaa and Oluka
(2011) and (Pearson (2012) agree that despite the significant influence of ICT on
procurement performance, it is disheartening that its implementation in most Kenyan
entities is discouraging and poor.

161
Table 4.54: Growth rate X3 cross tabulation
X3
Total
1.80 3.40 3.60 3.80 4.00 4.20 4.40 4.60 4.80 5.00 14.80
Growth_Rate High Count 0 0 0 0 0 0 0 0 0 1 0 1
Expected
Count .0 .0 .0 .0 .0 .1 .1 .3 .3 .2 .0 1.0
Moderate Count 0 0 0 1 0 2 1 4 0 2 0 10
Expected
Count
.1 .1 .1 .1 .2 .8 1.3 2.6 2.6 2.2 .2 10.0
Low Count 1 1 1 0 2 8 15 28 32 24 2 114
Expected
Count .9 .9 .9 .9 1.8 9.1 14.6 29.2 29.2 24.6 1.8 114.0
Total Count 1 1 1 1 2 10 16 32 32 27 2 125
Expected
Count 1.0 1.0 1.0 1.0 2.0 10.0 16.0 32.0 32.0 27.0 2.0 125.0
Table 4.55: Chi-square tests
Value df
Asymptotic Significance
(2-sided)
Pearson Chi-Square 21.469a 20 .370
Likelihood Ratio 16.915 20 .658
Linear-by-Linear Association .259 1 .611
N of Valid Cases 125

162
From the cross tabulation for the variable X4 in table 4.56, it was evident that the rate of
growth of MSEs is very low. The observed count for the low rate of growth of MSEs
was equal to the expected count at 114 against the 10 counts for moderate growth. The
asymptotic significance, which is the Pearson Chi square p value for this test was 0.946
as detailed in table 4.57. This is greater than 0.05 significance level set by the study.
Therefore, at 95% confidence level and 5% level of significance (α ≤ 0.05), we accept
the null hypothesis and conclude that bidding capacity of the MSEs does not
significantly support their growth in Kenya. Shiundu and Rotich (2013) and Alande
(2013) agree with this finding and blame inadequacy in MSE training both technically
and technologically for poor performance in the County governments as they reduce
effective bidding capacity. They pose that competent procurement related decisions are
those based on rules and analysis with sufficient organizational experience and
capability.
Table 4.56: Growth rate X4 cross tabulation
X4 Total
2.20 3.00 4.00 4.20 4.40 4.60 4.80 5.00
Growth Rate High Count 0 0 0 0 0 0 0 1 1
Expected
Count .0 .0 .0 .0 .1 .2 .3 .3 1.0
Moderate Count 0 0 1 1 1 1 2 4 10
Expected
Count .1 .1 .3 .3 .9 1.8 3.3 3.2 10.0
Low Count 1 1 3 3 10 22 39 35 114
Expected
Count .9 .9 3.6 3.6 10.0 21.0 37.4 36.5 114.0
Total Count 1 1 4 4 11 23 41 40 125
Expected
Count 1.0 1.0 4.0 4.0 11.0 23.0 41.0 40.0 125.0

163
Table 4.57: Chi-square tests
Value df Asymptotic Significance (2-sided)
Pearson Chi-Square 6.701a 14 .946
Likelihood Ratio 6.119 14 .963
Linear-by-Linear
Association .037 1 .848
N of Valid Cases 125
a. 20 cells (83.3%) have expected count less than 5. The minimum expected count is
.01.
From the cross tabulation for the variable X5 in table 4.58, it was evident that the rate of
growth of MSEs is very low. The observed count for the low rate of growth of MSEs
was equal to the expected count at 114 against the 10 counts for moderate growth. The
asymptotic significance, which is the Pearson Chi square p value for this test was 0.480
as detailed in table 4.59. This is above the 0.05 significance level set by the study.
Therefore, at 95% confidence level and 5% level of significance (α ≤ 0.05), we accept
the null hypothesis and conclude that oversight agencies do not significantly support the
growth of MSEs in Kenya. According to Asiago and Ngao (2013), despite the
recognition of the value of managerial experience in converting organizations’ resources
into societally beneficial plans in the public sector, little effort has been devoted to
developing an experience-based cross functional team executives to serve in
procurement oversight committees. KENAO report in 2008-2009 says that this has
rendered the quality of procurement and procurement related decisions in public entities
ineffective and costly at the expense of the general Kenyan society, (RoK, 2009). Eyaa
and Oluka (2011) add that many corporate members in Africa, especially in state owned
PDEs have limited understanding of their oversight roles and are usually open to
manipulation by principal shareholders, due to among other factors, their incompetence.

164
Table 4.58: Growth rate X5 cross tabulation
X5 Total
1.67 3.67 3.83 4.00 4.17 4.33 4.50 4.67 4.83 5.00
Growth
Rate
High Count 0 0 0 0 0 0 0 0 0 1 1
Expected
Count .0 .0 .0 .1 .1 .1 .2 .2 .1 .1 1.0
Moderate Count 0 0 1 1 1 3 1 3 0 0 10
Expected
Count .1 .2 .2 .6 .8 1.4 2.5 2.5 .6 1.2 10.0
Low Count 1 3 1 6 9 15 30 28 7 14 114
Expected
Count .9 2.7 1.8 6.4 9.1 16.4 28.3 28.3 6.4 13.7 114.0
Total Count 1 3 2 7 10 18 31 31 7 15 125
Expected
Count 1.0 3.0 2.0 7.0 10.0 18.0 31.0 31.0 7.0 15.0 125.0
Table 4.59: Chi-square tests
Value Df
Asymptotic Significance (2-
sided)
Pearson Chi-Square 17.629a 18 .480
Likelihood Ratio 14.042 18 .726
Linear-by-Linear Association .062 1 .803
N of Valid Cases 125
a. 23 cells (76.7%) have expected count less than 5. The minimum expected count is
.01.
From the cross tabulation for the variable X6 in table 4.60, it was evident that the rate of
growth of MSEs is very low. The observed count for the low rate of growth of MSEs
was equal to the expected count at 114 against the 10 counts for moderate growth. The
asymptotic significance, which is the Pearson Chi square p value for this test was 0.991
as detailed in table 4.61. This is above the 0.05 significance level set by the study.

165
Therefore, at 95% confidence level and 5% level of significance (α ≤ 0.05), we accept
the null hypothesis and conclude that e-procurement technology does not significantly
support the growth of MSEs in Kenya. In Kenya, public sector purchasing practices lock
out MSEs participation through high volume standards for participation. Mnguu and
Yusuf (2014) argue that high cost of compliance to regulations usually discourage the
potential MSEs from doing business with the government and in most cases drives the
existing enterprises out of business. Muteru (2013) argues that for a long time,
governments in the developing nations have been grappling with the need to develop an
environment conducive to job creation with a view to generate employment for the high
number of new labour market entrants and reduce high structural unemployment without
much breakthrough.
Table 4.60: Growth rate X6 cross tabulation
X6 Total
3.17 3.67 3.83 4.00 4.17 4.33 4.50 4.67 4.83 5.00
Growth
Rate High
Count 0 0 0 0 0 0 0 0 0 1 1
Expected
Count .0 .0 .0 .0 .0 .1 .2 .3 .1 .3 1.0
Moderate Count
0 0 0 0 0 2 2 1 1 4 10
Expected
Count .1 .1 .1 .1 .3 .9 1.6 2.8 1.3 2.8 10.0
Low Count
1 1 1 1 4 9 18 34 15 30 114
Expected
Count .9 .9 .9 .9 3.6 10.0 18.2 31.9 14.6 31.9 114.0
Total Count 1 1 1 1 4 11 20 35 16 35 125
Expected
Count 1.0 1.0 1.0 1.0 4.0 11.0 20.0 35.0 16.0 35.0 125.0
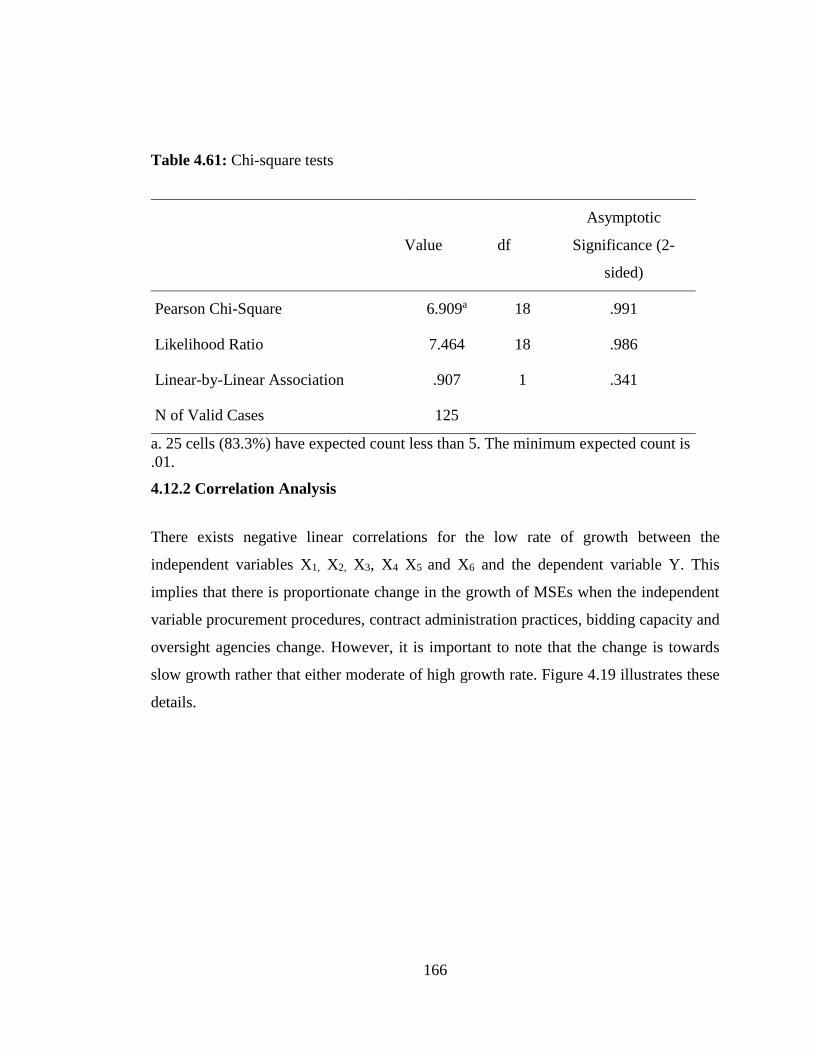
166
Table 4.61: Chi-square tests
4.12.2 Correlation Analysis
There exists negative linear correlations for the low rate of growth between the
independent variables X1, X2, X3, X4 X5 and X6 and the dependent variable Y. This
implies that there is proportionate change in the growth of MSEs when the independent
variable procurement procedures, contract administration practices, bidding capacity and
oversight agencies change. However, it is important to note that the change is towards
slow growth rather that either moderate of high growth rate. Figure 4.19 illustrates these
details.
Value df
Asymptotic
Significance (2-
sided)
Pearson Chi-Square 6.909a 18 .991
Likelihood Ratio 7.464 18 .986
Linear-by-Linear Association .907 1 .341
N of Valid Cases 125
a. 25 cells (83.3%) have expected count less than 5. The minimum expected count is
.01.

167
Figure 4.18: Correlation scatter diagram
From the analysis of multiple linear correlation as presented in table 4.62, the
independent variables exhibit varying correlation coefficients. This implies that when
independent variables increase, the dependent variables increase by some margin for
those independent variables with positive correlation correlations. In other instances, it
decreases by some margins for those negative coefficient correlations as indicated. For
instance, an increase by a unit of X1 causes 9.4% increase in Y, X2 brings about an
increase of 5.4% decrease, X3 generates 4.6% rise, X4 gives 1.7% growth decline, X5
results in 2.2% positive growth while X6 declines Y by 8.6%. the significance values
indicate that at 95% significance level and 5% confidence, the study accepts the Ho and
concludes that the independent variable herein do not significantly support the growth of
MSEs in Keya.
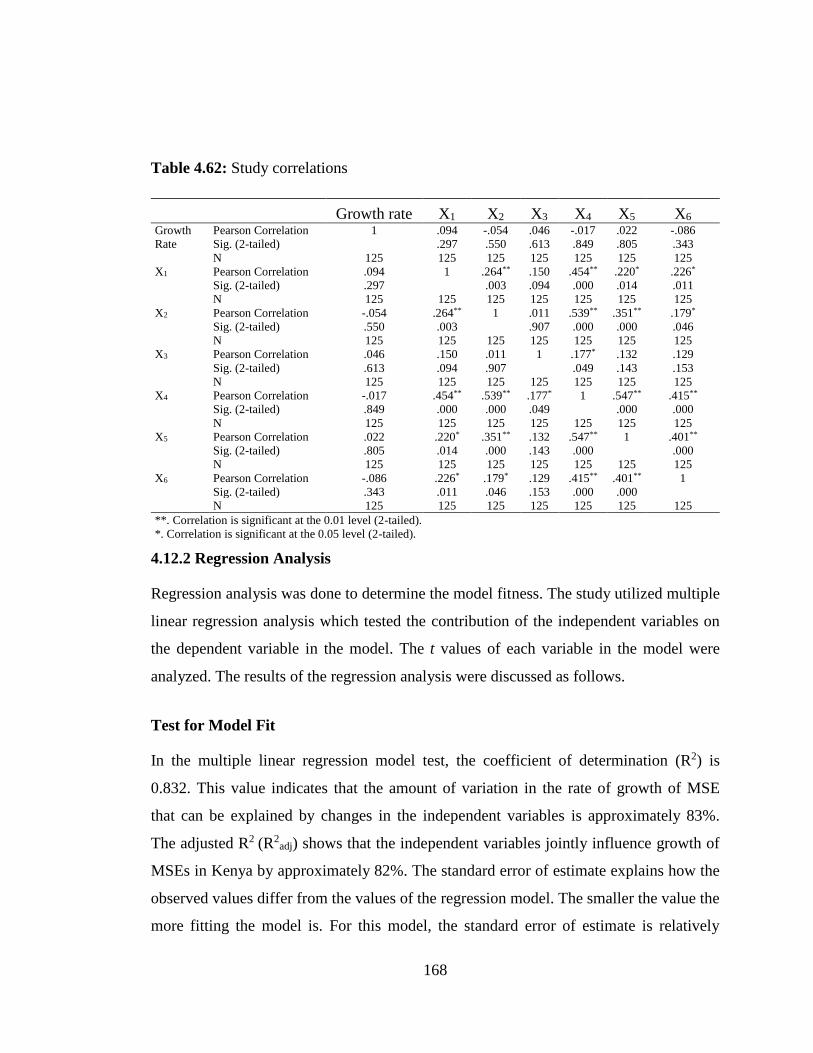
168
Table 4.62: Study correlations
Growth rate X1 X2 X3 X4 X5 X6 Growth
Rate
Pearson Correlation 1 .094 -.054 .046 -.017 .022 -.086
Sig. (2-tailed) .297 .550 .613 .849 .805 .343
N 125 125 125 125 125 125 125
X1 Pearson Correlation .094 1 .264** .150 .454** .220* .226*
Sig. (2-tailed) .297 .003 .094 .000 .014 .011
N 125 125 125 125 125 125 125
X2 Pearson Correlation -.054 .264** 1 .011 .539** .351** .179*
Sig. (2-tailed) .550 .003 .907 .000 .000 .046
N 125 125 125 125 125 125 125
X3 Pearson Correlation .046 .150 .011 1 .177* .132 .129
Sig. (2-tailed) .613 .094 .907 .049 .143 .153
N 125 125 125 125 125 125 125
X4 Pearson Correlation -.017 .454** .539** .177* 1 .547** .415**
Sig. (2-tailed) .849 .000 .000 .049 .000 .000
N 125 125 125 125 125 125 125
X5 Pearson Correlation .022 .220* .351** .132 .547** 1 .401**
Sig. (2-tailed) .805 .014 .000 .143 .000 .000
N 125 125 125 125 125 125 125
X6 Pearson Correlation -.086 .226* .179* .129 .415** .401** 1
Sig. (2-tailed) .343 .011 .046 .153 .000 .000
N 125 125 125 125 125 125 125
**. Correlation is significant at the 0.01 level (2-tailed).
*. Correlation is significant at the 0.05 level (2-tailed).
4.12.2 Regression Analysis
Regression analysis was done to determine the model fitness. The study utilized multiple
linear regression analysis which tested the contribution of the independent variables on
the dependent variable in the model. The t values of each variable in the model were
analyzed. The results of the regression analysis were discussed as follows.
Test for Model Fit
In the multiple linear regression model test, the coefficient of determination (R2) is
0.832. This value indicates that the amount of variation in the rate of growth of MSE
that can be explained by changes in the independent variables is approximately 83%.
The adjusted R2 (R2adj) shows that the independent variables jointly influence growth of
MSEs in Kenya by approximately 82%. The standard error of estimate explains how the
observed values differ from the values of the regression model. The smaller the value the
more fitting the model is. For this model, the standard error of estimate is relatively

169
smaller compared to the sample size studied and thus the model is good fitting. Table
4.63 gives summary of the details
Table 4.63: Model summary
Model R R Square Adjusted R Square Std. Error of the
Estimate
1 .879a .832 .817 .03246
a. Predictors: (Constant), X1, X2, X3, X4, x5, X6
b. Dependent Variable: Growth Rate
4.12.3 ANOVA Test
The Ho for the study was that all the coefficients are zero. At 95% level of significance,
this test confirms that the model coefficients are zero or less than zero as presumed. That
is the reason why the MSE rate of growth is extremely low. Based on the F significance,
the study accepts the Ho that the coefficients of the model are either zero or very close to
zero. These results are tabulated as follows in table 4.64.

170
Table 4.64: ANOVA analysis
Model Sum of
Squares df Mean Square F Sig.
1 Regression .411 6 .069 .650 .690b
Residual 12.437 118 .105
Total 12.848 124
a. Dependent Variable: Growth Rate
b. Predictors: (Constant), X1, X2, X3, X4, X5, X6
Regression Coefficients Analysis
The Y-intercept (α) value in the model is 2.705. This implies that other factors held
constant, the growth of MSEs according to the information from the respondents is
approximately 2.7%. The Y-intercept represents the point at which the dependent
variable lies on the Y-axis of the curve of growth against the independent variables. This
is an indicator that the MSEs in Trans Nzoia County in particular, and probably the other
counties in general exhibit stunted growth.
The first independent variable in the linear regression the model, procurement
procedures denoted X1 has t value equivalent to 3.973 (39.73%). The coefficient β value
(β1) is 3.178. This implies that a unit increase in X1 causes approximately 40% change in
the growth of MSEs. This could signify that procurement procedures as they currently
stand do not significantly support the growth of MSEs in the Counties in Kenya. The
significance values 0.000 which is p-value of the test is lesser than 0.05. Therefore, at
95% confidence level and 5% level of significance (α ≤ 0.05), we fail to accept the null
hypothesis and conclude that the independent variable procurement procedures is
significant and therefore the fitted linear model is valid.
171
The second independent variable in the linear regression the model, public procurement
contract administration practices denoted X2 has t value equivalent to 7.630 (76.30%).
The coefficient β value (β2) is 3.052. This implies that a unit increase in X2 causes
approximately 76% change in the growth of MSEs. The significant p-value is 0.001
which is lesser than 0.05. Therefore, at 95% confidence level and 5% level of
significance (α ≤ 0.05), we fail to accept the null hypothesis and conclude that the
independent variable public procurement contract administration practices is significant
and therefore the fitted linear model is valid.
The third independent variable in the linear regression the model, e-procurement
technology, denoted X3 has t value of 5.565 (55.65%). The coefficient β value (β3) is
5.009. This implies that a unit increase in X3 causes approximately 56% growth of
MSEs. This signifies that the way e-procurement technology is implemented in the
public procurement system in the counties in Kenya has significant impacts on the
growth of MSEs. The p-value of the test is 0.000, which is lesser than 0.05. Therefore,
95% confidence level and 5% level of significance (α ≤ 0.05), we fail to accept the null
hypothesis and conclude that the independent variable e-procurement technology is
significant and therefore the fitted linear model is valid.
The fourth independent variable in the linear regression the model, bidding capacity of
the MSEs, denoted X4 has t value of 4.334 (43%)). The coefficient β value (β4) is 3.034.
This implies that a unit increase in X4 causes approximately 43% change in the growth
of MSEs. The significance of the p-value of the test at 0.000 is lesser than 0.05.
Therefore, at 95% confidence level and 5% level of significance (α ≤ 0.05), we fail to
accept the null hypothesis and conclude that the independent variable bidding capacity is
significant and therefore the fitted linear model is valid.
The fifth independent variable in the linear regression the model, oversight agencies,
denoted X5 has t value of 8.450 (85%). The coefficient β value (β5) is 5.070. This implies
that a unit increase in X5 causes approximately 85% change in the growth of MSEs. The

172
significance values, the p-value of the test at 0.000 is lesser than 0.05. Therefore, 95%
confidence level and 5% level of significance (α ≤ 0.05), we fail to accept the null
hypothesis and conclude that the independent variable oversight agencies is significant
and therefore the fitted linear model is valid.
The intervening variable in the linear regression the model, participation by MSEs,
denoted X6 has t value of 5.222 (52.22%). The coefficient β value (β6) is 3.133. This
implies that a unit increase in X6 causes approximately 52% change in the growth of
MSEs. The significant p-value of the test at 0.000 is lesser than 0.05. Therefore, 95%
confidence level and 5% level of significance (α ≤ 0.05), we fail to accept the null
hypothesis and conclude that the intervening variable MSEs participation is significant
and therefore the fitted linear model is valid. The summaries of all these results are
presented in table 4.65 below.
Table 4.65: Regression analysis
Model
Unstandardized
Coefficients
Standardized
Coefficients
t Sig. B Std. Error Beta
1 (Constant) 2.705 .006 4.026 .000
X1 3.178 .008 .036 3.973 .001
X2 3.052 .004 .037 7.630 .000
X3 5.009 .009 .028 5.565 .000
X4 3.034 .007 .049 4.334 .000
X5 5.070 .006 .066 8.450 .000
X6 3.133 .006 .026 5.222 .000
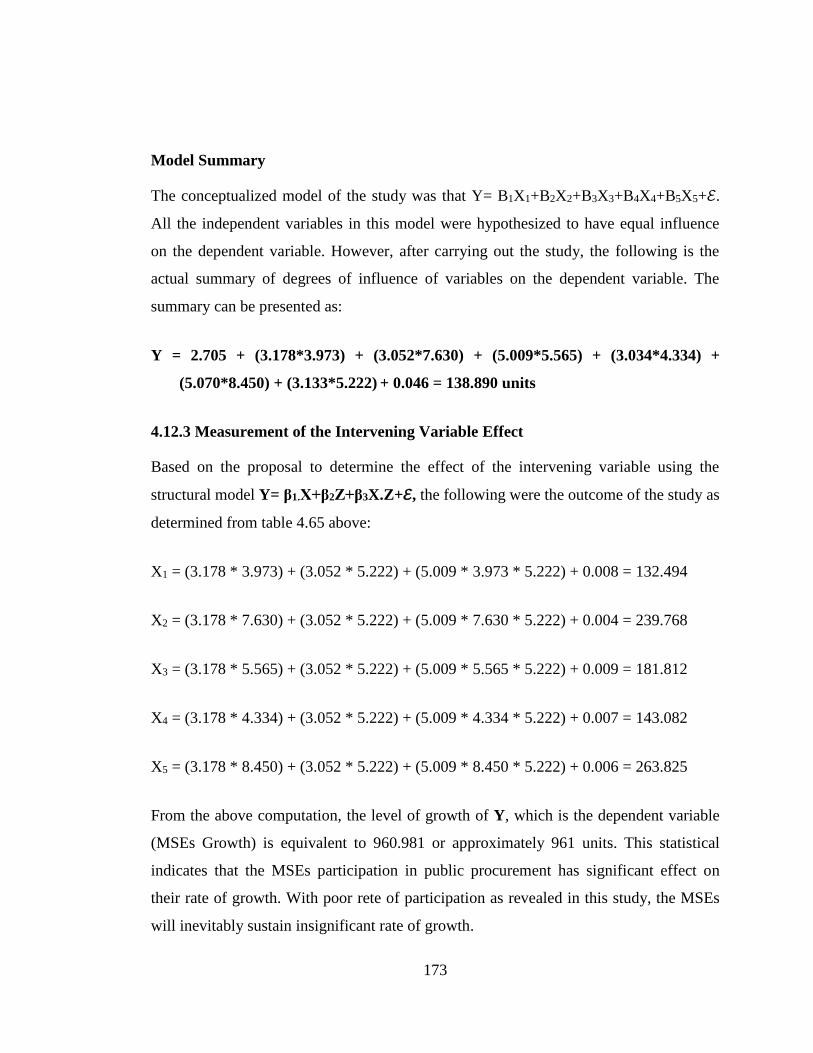
173
Model Summary
The conceptualized model of the study was that Y= B1X1+B2X2+B3X3+B4X4+B5X5+ℰ.
All the independent variables in this model were hypothesized to have equal influence
on the dependent variable. However, after carrying out the study, the following is the
actual summary of degrees of influence of variables on the dependent variable. The
summary can be presented as:
Y = 2.705 + (3.178*3.973) + (3.052*7.630) + (5.009*5.565) + (3.034*4.334) +
(5.070*8.450) + (3.133*5.222) + 0.046 = 138.890 units
4.12.3 Measurement of the Intervening Variable Effect
Based on the proposal to determine the effect of the intervening variable using the
structural model Y= β1.X+β2Z+β3X.Z+ℰ, the following were the outcome of the study as
determined from table 4.65 above:
X1 = (3.178 * 3.973) + (3.052 * 5.222) + (5.009 * 3.973 * 5.222) + 0.008 = 132.494
X2 = (3.178 * 7.630) + (3.052 * 5.222) + (5.009 * 7.630 * 5.222) + 0.004 = 239.768
X3 = (3.178 * 5.565) + (3.052 * 5.222) + (5.009 * 5.565 * 5.222) + 0.009 = 181.812
X4 = (3.178 * 4.334) + (3.052 * 5.222) + (5.009 * 4.334 * 5.222) + 0.007 = 143.082
X5 = (3.178 * 8.450) + (3.052 * 5.222) + (5.009 * 8.450 * 5.222) + 0.006 = 263.825
From the above computation, the level of growth of Y, which is the dependent variable
(MSEs Growth) is equivalent to 960.981 or approximately 961 units. This statistical
indicates that the MSEs participation in public procurement has significant effect on
their rate of growth. With poor rete of participation as revealed in this study, the MSEs
will inevitably sustain insignificant rate of growth.

174
4.12.4 Optimal Model
After collecting, analyzing and testing data, the proposed linear regression model
yielded the results as explained in the regression analysis above. From the findings, the
independent variable in the model; X1, X2, X3, X4 and X5 generated varying coefficients
that signify their revised significance in the model and influence on the dependent
variable Y. However, test for significance of each independent variable in the model
confirmed that they remain valid and therefore the proposed model holds. The results of
table 4.65 provide a basis for the review of the model structure based on the t values and
consequently the revision of the conceptual framework in figure 4.19. The following is
the revised model of the study.
Y= α + β5.X5+ β2.X2+ β3.X3 + β4.X4 + β1.X1 + ℰ
From the revised model, procurement oversight agencies emerged as the most critical
factor that significantly affects growth of the micro enterprises in the Counties in Kenya.
The second in the order was the procurement contract administration practices. It was
closely followed e-procurement technology. The MSEs bidding capacity ranked forth
with procurement procedures coming last in that respective order.
This study conceptualized that governments are the biggest spenders globally,
consuming on average 60% of GDP, a concept supported by (Matindi, 2013 & Aketch,
2013). MSEs are locked out of public procurement by the stringent requirements set for
the MDAs. According to Mwendwa (2010) the major challenge that County
governments face in implementing devolution is narrowing regional disparities in
income, resource endowment and economic development. With devolution as the
heartbeat of the Constitution, governors should champion the constitutional spirit of
socio-economic empowerment and desire to enable locals to take part in setting their
own economic, political and social agenda say (Alande & Wekhuyi, 2013). Technology
wise, unless County governance is empowered to plan, execute and control their

175
governments’ mandates, the inefficiencies of the defunct County Council
administrations are likely to crop up and bedevil these devolved units.
Despite revision of PPDR, 2006 to create the PPDPRAR (2013) as argued by (Okoth,
2013) to lay ground for the implementation of the AGPO policy framework, there still
exist bottlenecks in its implementation considering that the PPADA of 2015 remains
intact. The study conceptualized that with rigid public procurement procedures in place,
stereotyped contract administration practices, low adoption of advanced technology by
the MSEs, weak and outdated policy framework in place, bidding capacity constraints
coupled with ineffective procurement operations by the respective oversight agencies
and low or even non-participation in procurement glaring at the majority of MSEs, their
access and exploitation of public procurement opportunities has been hampered more
often and it is likely to persist for unforeseeable future. After collecting, collating and
analyzing data, the optimal model above gave rise to the revised conceptual framework
as illustrated in figure 4.19.

176
In
Figure 4.19: Revised conceptual framework
Public
Procurement procedures -Experience
-Financial ability
-Registration
requirements
Independent variables Intervening variable
Dependent variable
Contract
administration
practices
-ICT Tools
availability
-System reliability
-System
confidentiality
E-procurement
technology
-ICT Tools
availability
-System reliability
-System
confidentiality
Procurement
oversight agencies
-Competences
-Funding
-Independence
MSEs growth
- Increase in
assets
- Increase in
contracts value
- Growth in
contracts
volumes
MSE participation
- Rate of
Participation.
- Bidding capacity.
- Contract
administration
Bidding capacity
-Human resources
-Production
equipment
-Bids preparation

177
CHAPTER FIVE
SUMMARY OF CONCLUSIONS AND RECOMMENDATIONS
5.1 Introduction
This is the final chapter of this study which provides the summary of the whole research
process. The chapter contains the main findings of the study, conclusions and
recommendations in a summarized format. All of these are modeled on the objectives of
the study as presented in the following sections. The study adopted descriptive research
design approach in its execution.
5.2 Findings of the Study
The main objective of this study was to establish the relationship between public
procurement and growth of Micro and Small Enterprises (MSEs) in Kenya. Self-
administered structured questionnaires were utilized to collect data. After data analysis
and interpretation, a number of findings were drawn. These informed the main findings
reported in this chapter. The findings ordered according to the revised conceptual
framework of the study as follows:
5.2.1 To evaluate the relationship between procurement oversight agencies and the
growth of MSEs in Kenya.
On evaluation of the relationship between procurement oversight agencies and the
growth of MSEs, these agencies were found to be related by 8.450 approximately 85%.
This is despite the findings that the performance of the oversight agencies is deemed
unsatisfactory by majority of the respondents.

178
5.2.2 To interrogate the relationship between procurement contracts
administration and growth of MSEs in Kenya.
Procurement contract administration practices have 7.630 or approximately 76%
relationship with growth of MSEs in Kenya. However, inequitable rationalization of
public procurement opportunities is significantly related with the MSEs poor growth in
the County. Considering that contract awards are slop sided and skewed towards one
side of the supply chain, MSEs perpetually pay dearly the price of inequitable business
opportunities with poor growth rate.
5.2.3 To examine the relationship between e-procurement technology and growth of
MSEs in Kenya.
Electronic procurement was ascertained to have 5.565 equivalent to approximately 57%
relationship with the MSEs growth rate at. However, lack of ICT infrastructure and
network unreliability were cited as among the attributes significantly affecting the
participation and growth of MSEs in public procurement in Kenya.
5.2.4 To assess the relationship between bidding capacity of the MSE’s and their
growth in Kenya.
In respect of the MSEs’ bidding capacity’s relationship with the growth, it was
ascertained that there exists 4.334 or approximately 43% relationship with the growth of
MSEs. With demonstrated level of e-procurement incompetence in this study, the MSEs
will keep losing contracts due to their inability to present well prepared bid documents
and hence, continue to perform poorly in terms of their growth.
5.2.5 To establish the relationship between public procurement procedures and
growth of MSEs in Kenya.
The study established that procurement procedures have 3.973, or approximately 40%)
relationship with the rate of growth of MSEs in Kenya. This is a significant statistic.
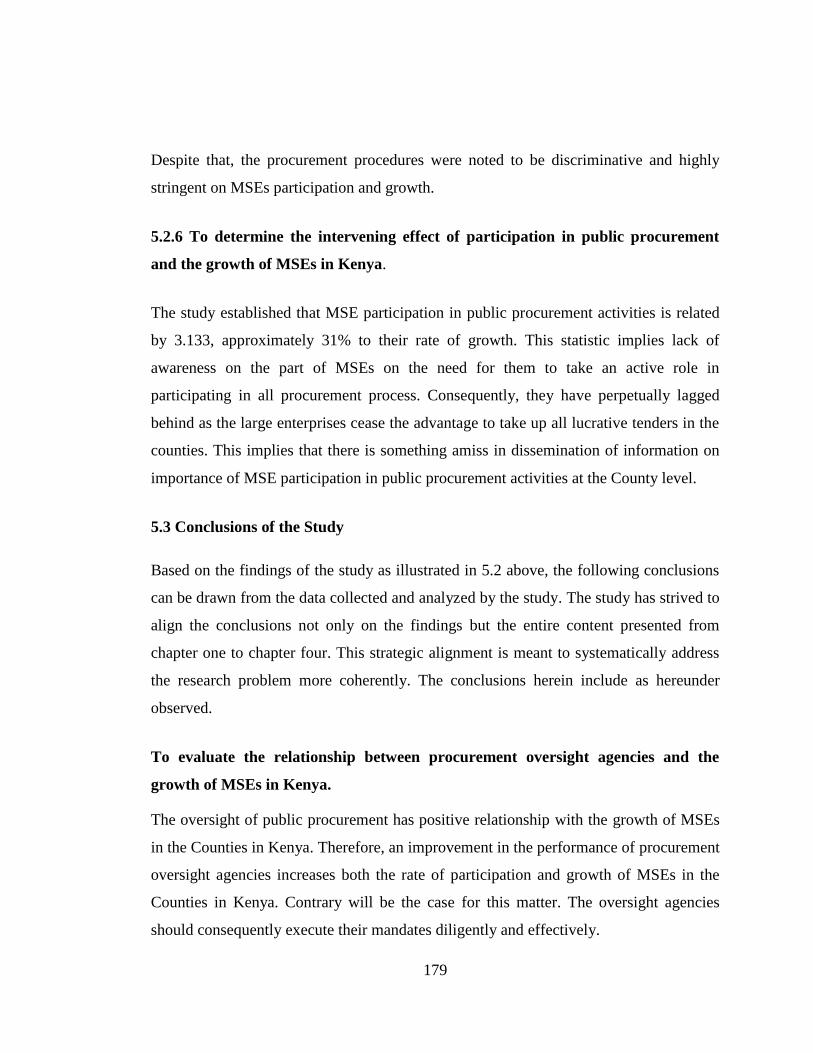
179
Despite that, the procurement procedures were noted to be discriminative and highly
stringent on MSEs participation and growth.
5.2.6 To determine the intervening effect of participation in public procurement
and the growth of MSEs in Kenya.
The study established that MSE participation in public procurement activities is related
by 3.133, approximately 31% to their rate of growth. This statistic implies lack of
awareness on the part of MSEs on the need for them to take an active role in
participating in all procurement process. Consequently, they have perpetually lagged
behind as the large enterprises cease the advantage to take up all lucrative tenders in the
counties. This implies that there is something amiss in dissemination of information on
importance of MSE participation in public procurement activities at the County level.
5.3 Conclusions of the Study
Based on the findings of the study as illustrated in 5.2 above, the following conclusions
can be drawn from the data collected and analyzed by the study. The study has strived to
align the conclusions not only on the findings but the entire content presented from
chapter one to chapter four. This strategic alignment is meant to systematically address
the research problem more coherently. The conclusions herein include as hereunder
observed.
To evaluate the relationship between procurement oversight agencies and the
growth of MSEs in Kenya.
The oversight of public procurement has positive relationship with the growth of MSEs
in the Counties in Kenya. Therefore, an improvement in the performance of procurement
oversight agencies increases both the rate of participation and growth of MSEs in the
Counties in Kenya. Contrary will be the case for this matter. The oversight agencies
should consequently execute their mandates diligently and effectively.

180
To interrogate the relationship between procurement contracts administration and
growth of MSEs in Kenya.
Contract administration practices have positive relationship with the growth of MSEs in
Kenya. Improving the contract administration practices increases the rate of participation
and thus, growth of MSEs in the Counties in Kenya. Contrary will be the case. In this
case therefore, much effort should be focused on continuous improvement in the public
procurement contract administration practices by the County Governments.
To examine the relationship between e-procurement technology and growth of
MSEs in Kenya.
There is equally positive relationship between e-procurement technology and growth of
MSEs through public procurement in Kenya. An improvement in the performance of e-
procurement technology increases the rate of participation and consequently, growth of
MSEs in the Counties in Kenya. Contrary will be the case. In this case therefore, the
Counties should be focused on tireless investment into e-procurement technology to
facilitate access and hence, participation and growth of MSEs in public procurement in
the Counties in Kenya.
To assess the relationship between bidding capacity of the MSE’s and their growth
in Kenya.
There is positive relationship between bidding capacity of MSEs and their growth in
Kenya. An effort in the improvement of the bidding capacity of MSEs increases the rate
of not only participation, but also growth of MSEs in the Counties in Kenya. Contrary
will be the case. In this case therefore, the Counties should be focused on enhancing
bidding capacity of MSEs in order to facilitate their participation and growth.
To establish the relationship between public procurement procedures and growth
of MSEs in Kenya.
Despite public procurement procedures not spurring rapid growth of MSE in Kenya,
there is established positive relationship between the MSEs growth rate and public
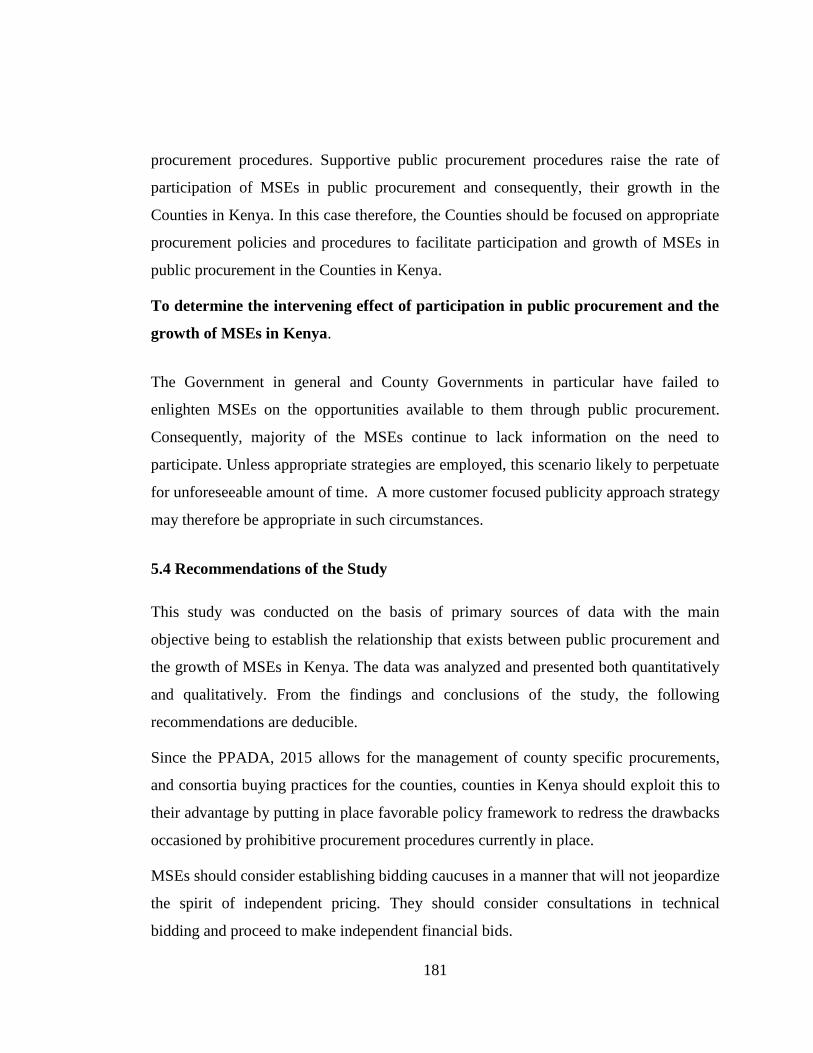
181
procurement procedures. Supportive public procurement procedures raise the rate of
participation of MSEs in public procurement and consequently, their growth in the
Counties in Kenya. In this case therefore, the Counties should be focused on appropriate
procurement policies and procedures to facilitate participation and growth of MSEs in
public procurement in the Counties in Kenya.
To determine the intervening effect of participation in public procurement and the
growth of MSEs in Kenya.
The Government in general and County Governments in particular have failed to
enlighten MSEs on the opportunities available to them through public procurement.
Consequently, majority of the MSEs continue to lack information on the need to
participate. Unless appropriate strategies are employed, this scenario likely to perpetuate
for unforeseeable amount of time. A more customer focused publicity approach strategy
may therefore be appropriate in such circumstances.
5.4 Recommendations of the Study
This study was conducted on the basis of primary sources of data with the main
objective being to establish the relationship that exists between public procurement and
the growth of MSEs in Kenya. The data was analyzed and presented both quantitatively
and qualitatively. From the findings and conclusions of the study, the following
recommendations are deducible.
Since the PPADA, 2015 allows for the management of county specific procurements,
and consortia buying practices for the counties, counties in Kenya should exploit this to
their advantage by putting in place favorable policy framework to redress the drawbacks
occasioned by prohibitive procurement procedures currently in place.
MSEs should consider establishing bidding caucuses in a manner that will not jeopardize
the spirit of independent pricing. They should consider consultations in technical
bidding and proceed to make independent financial bids.

182
County governments should establish procuring units or agency at the County level to
specifically promote MSEs participation in matters procurement. Sufficient resources, at
least 50% of the total county procurement spend should be set aside for the MSEs
through the establishment.
Counties should establish ICT hubs countywide to facilitate access to the e-procurement
services by the MSEs. These hubs should be at least in every sub-county, well equipped
with hardware, software, competent personnel, and other enablers to handle the ICT
requirements by MSEs as sources of supply.
MSEs should actively raise their rate of participation in procurement trainings fora
organized by the agencies such as PPRA and KISM. These trainings provide relevant
support platforms through which they learn more in matters procurement. This
knowledge helps to raise their competence levels in bidding.
The MSEs should embrace outsourcing as a viable option in the preparation of their
bids. This may help them overcome the problem of preparing ineffective bids as they
will tap into the pool of skilled expertise in the trade.
The government, should purposely demonstrate goodwill and align the MSEA Act, 2012
to the PPADA, 2015 and the constitution to support the growth of MSE through public
procurement.
In the long term, the government should consolidate all procurement oversight agencies
into a single broad-based body to oversee oversight agencies functioning, with one
center of control in order to coordinate their affairs in a well-coordinated and more
systematic manner.
In the meantime, some functions of some of the agencies should be merged such as
investigative function by EACC, CID and other related agencies to increase efficiency
and speed in investigations. The ceiling on the value of contracts partaken by non MSEs
enterprises taking part in public procurement at any level of government should be
scaled down. In the interest of specialization, county governments should establish full-
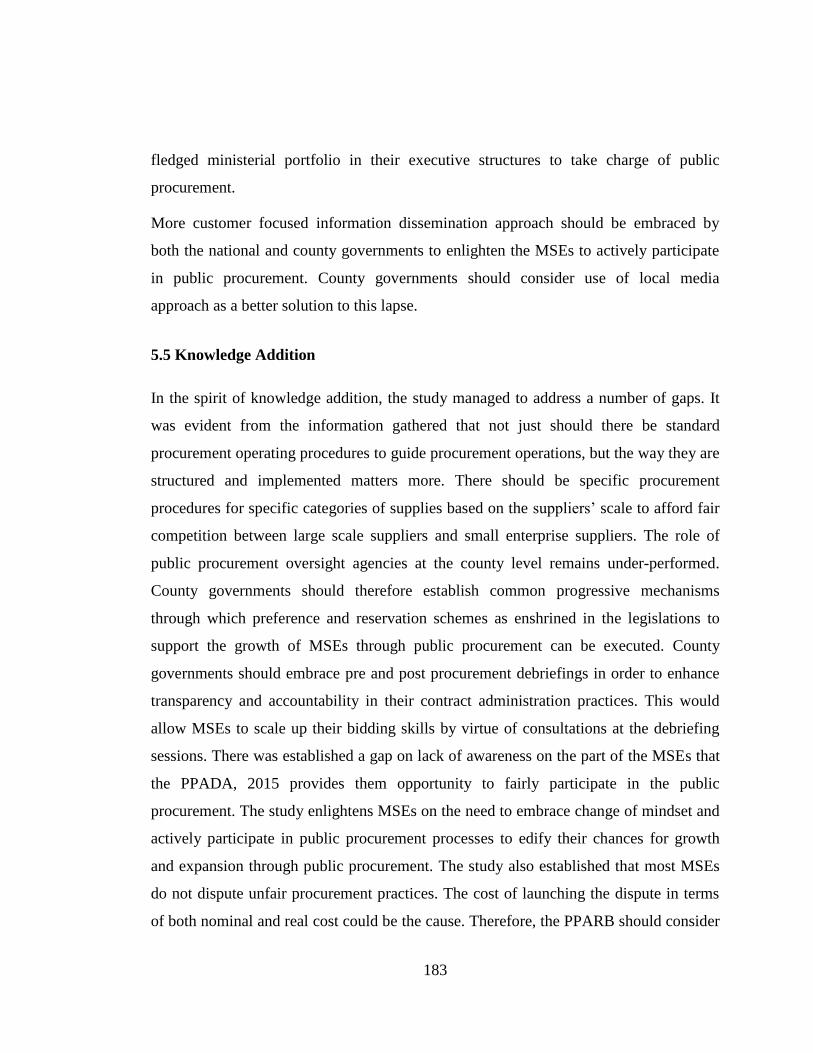
183
fledged ministerial portfolio in their executive structures to take charge of public
procurement.
More customer focused information dissemination approach should be embraced by
both the national and county governments to enlighten the MSEs to actively participate
in public procurement. County governments should consider use of local media
approach as a better solution to this lapse.
5.5 Knowledge Addition
In the spirit of knowledge addition, the study managed to address a number of gaps. It
was evident from the information gathered that not just should there be standard
procurement operating procedures to guide procurement operations, but the way they are
structured and implemented matters more. There should be specific procurement
procedures for specific categories of supplies based on the suppliers’ scale to afford fair
competition between large scale suppliers and small enterprise suppliers. The role of
public procurement oversight agencies at the county level remains under-performed.
County governments should therefore establish common progressive mechanisms
through which preference and reservation schemes as enshrined in the legislations to
support the growth of MSEs through public procurement can be executed. County
governments should embrace pre and post procurement debriefings in order to enhance
transparency and accountability in their contract administration practices. This would
allow MSEs to scale up their bidding skills by virtue of consultations at the debriefing
sessions. There was established a gap on lack of awareness on the part of the MSEs that
the PPADA, 2015 provides them opportunity to fairly participate in the public
procurement. The study enlightens MSEs on the need to embrace change of mindset and
actively participate in public procurement processes to edify their chances for growth
and expansion through public procurement. The study also established that most MSEs
do not dispute unfair procurement practices. The cost of launching the dispute in terms
of both nominal and real cost could be the cause. Therefore, the PPARB should consider
184
revising appeal costs in favor of MSEs. Finally, there is a big gap between e-
procurement technology implementation and MSEs adoption of the same. The
government should work on the infrastructure to facilitate the uptake and buy-in of the
same by the MSEs.
5.6 Areas for Future Research
This study was centered on the growth of Micro and Small Enterprises through public
procurement at the county level. However, there are other avenues for growth available
for the MSEs besides this. These avenues could provide reasonable research problems to
future studies. Among the suggested areas for future research include value chain model
approach and the growth of micro and small enterprises in counties in Kenya. Besides,
future scholars could explore the area of Micro and small enterprise supply chains and
the economic performance in the counties in Kenya. Further research may also focus on
electronic procurement technology and performance of MSEs supply chains in Kenya.
In conclusion, Consortia buying Techniques and growth of Micro and small enterprises
in Kenya may also be a rich area for research.

185
REFERENCES
Abosede, A.J, & Onakoya, A.B. (2013). Entrepreneurship, Economic Development and
inclusive Growth, International Journal of Social Sciences and
Entrepreneurship, 1 (3), 375-387.
Agaba, E., & Shipman, N. (2008). Public Procurement Reforms in Developing
Countries: The Ugandan experience, Kampala.
Aiyabei, J.K. (2013). Determinants of Adopting Risk Management Strategies by Pension
schemes in Kenya, Research paper, JKUAT (Unpublished), Nairobi.
Aketch, J. & Karanja, P., (2013). Factors Influencing Procurement Performance in
Constituency Development Fund (Cdf): Case of CDF Use in Makadara
Constituency. International Journal of Social Science & Entrepreneurship,
1(2), 41-55
Alande, J.O., (2013). The Role of Human Resource Management in Devolution of
counties in Kenya. Case study of Mombasa County. International Journal of
Social Sciences and Entrepreneurship, 1 (3), 568-582.
Amayi, F. K. & Ngugi, G. K. (2013). Determinants of Public Procurement Performance
in Kenya: Case Ministry of Environment, Water and Natural Resources.
International Journal of Social Sciences and Entrepreneurship, 1(5), 647-667.
Amayi, J.B., (2013). Human Resource Management: Experiential and Educational
Perspectives, Nairobi. Kadesh Ventures.
Anyanzwa, J. (2013, October 22). Delivering the Digital Dream: Paperless Systems to
Grease the Wheels of Government. Nairobi, The Standard Media Group, p 14.
Apollo, S., (2017, February 6). Ouko Calls for Overhaul of Controversial Ifmis. Nation
Media Group, p 23.
Asiago, R. & Ngao, E.W. (2013). Effects of Employee Skills and Knowledge on
Effective Organizational Change: A Case Study of National Social Security

186
Fund, International Journal of Social Sciences and Entrepreneurship, 1(7),
601-609.
Bartle, J. (2002). A Transaction Cost Model of State Government Procurement,
Department of Public administration, University of Nebraska-Omaha.
Association for Budgeting and Financial Management Annual Conference.
Washington DC.
Blumberg, R. Cooper, D.R., & Schindler, P.S. (2011) Business Research Methods 11th
Edition, New York. McGraw-Hill.
Bor, M.K.J. & Githaiga N.P. (2015). Determinants of Non Compliance with Public
Procurement Regulations in the Public Sector. A Survey of Selected
Parastatals in Nairobi, Kenya. International Journal of Social Sciences and
Entrepreneurship, 3(1), 1-13.
Burt D.N., Dobler D.W., Startling S.L., (2004). World Class Supply Chain, The Key to
Supply Chain Management, 7th Edition. New York, McGraw-Hill.
Chai, K. (2013, September 8,). Government Launches Sh6 Billion Uwezo Fund for
Youth and Women. The Standard Media Group, p 24.
Chia, R. (2002). The Production of Management Knowledge: Philosophical
Underpinnings of Research Design, in Partington, Essential Skills for
Management Research. London, Sage.
Chopra, S., Meindl, P., (2010). Supply Chain Management: Strategy, Planning &
Operation,4th Edition, New Jersey. Pearson Education,.
Clegg, S.R. (1999). Modern Organizations: Organizational Studies in the Postmodern
World, London, Sage.
Crown Ombudsman, (2012). Good Conduct and Administrative Practice – Guidelines
for state and local government: Oversight of Public Administration, Sydney, NSW,
ISBN: 978-1-921132-92-6 03/2012 Level 24, 580
187
Darwall, S.L, (Undated). Theories of Ethics. Retrieved from:
http://www.online.wiley.com (13 June, 2013)
DiMaggio and Powell, (Undated).Institutional Theory. Retrieved from
http://www.faculty.babson.ed./krollag/org_site/org_theory/scott_articles/rs.in
t_theory.html (13 June, 2013)
Draft, R.L., Kendrick, M., Vershinina, N. (2010). Management, International Edition,
Seng Lee Press
Eyaa, S. & Oluka, N., (2011). Explaining Non-Compliance in Public Procurement in
Uganda International Journal of Business and Social Science, 2(11), 11-14.
Getuno, P. M., Awino, B. Z., Ngugi, P. K., & Ondieki, F. (2015). Public Procurement
and Disposal Regulations, (2006) Implementation and Performance of Kenyan
State Corporations. International Journal of Human Resources and
Procurement. 3 (1), 14-37.
Flowers, P. (2009). Research Philosophies – Importance and Relevance, Issue 1
(Jan’09). Leading Learning and Change, London, Cranfield School of
Management
Indire, J., Nyam, J. & Mbuvi, K. (2008). Certificate Business Studies. Nairobi, Oxford
University Press.
Jhingan, M.L. (1989). Macro-Economic Theory. 5th Edition, New Delhi, Konark
Publishers PVT Ltd,.
JKUT, (2013). Academia and Private Sector Chart Growth Path for Region, Retrieved
from www.jkuat.ac.ke: on 05 November, 2013
JKUAT, (2013). Scholars Urged to Participate in Country’s Economic Growth,
Retrieved from www.jkuat.ac.ke: on 31 October, 2013
Jones, G.R., George J.M., Hill, C.W.L. (2000). Contemporary Management, 2nd Edition,
Washington DC, Craig S. Beytien,

188
Kemei, T., (2017, January 11). Wamwangi Says Ifmis Faulty, Calls for its Urgent
Overhaul. Nairobi, Nation Media Group, p 8.
Kihanya, T. (2013). Challenges Influencing the Implementation of Business Strategies
in Public Sector Firms in Kenya: A Survey of Parastatals in the Ministry of
Agriculture. International Journal of Social Sciences and Entrepreneurship,
1(2), 635-649.
Kimberlin, C.L and Winterstein, A. (2008). Research fundamentals: Validity and
reliability of Measurement Instruments used in Research, Florida, Gainesville.
Kiplagat, J., Leftie, P. (2013, June 13). Corrupt Workers put on Notice, Nairobi, Nation
Media Group.
Kombo, D.K. & Tromp, D.L.A. (2006). Proposal and Thesis writing: An introduction.
Nairobi, Paulines Publications Africa.
Kothari, C.R. & Garg, G. (2014). Research Methodology: Methods and Techniques.
Third Edition, Delhi , Ajit Printers,
Kothari, C.R., (2010). Quantitative Techniques. Delhi, Ajit Printers,
Kothari, C.R., (2002). Quantitative Techniques. New Delhi, New Age International.
Lysons K, Farrington, (2010): Purchasing and Supply Chain Management, 6th Edition,
London, Prentice-Hall
Malli, C.A. (2013). Corporate Governance. London, Oxford University Press,
Matindi, R. & Ngugi, G. K. (2013). Determinants of Procurement Performance at
Kenya National Highways Authority (KENHA). International Journal of
Social Sciences and Entrepreneurship, 1(5), 767-793.
Mboya, P.A & Ngugi, K. (2013). Influence of Adoption of Information Communications
Technology on Organizational Performance: Case of Kenya Wildlife Service.
International Journal of Social Sciences and Entrepreneurship 3(4), 818-841.
189
Meyer and Rowan, (Undated). Institutional Theory Retrieved from
http://www.faculty.babson.ed./krollag/org_site/org_theory/scott_articles/rs.int
_theory.html on 13 June,
Mohamed, Y. & Mnguu Y.O. (2014). Fiscal and Monetary Policies: Challenges for
Small and Medium Enterprises (SMEs) Development in Tanzania.
International Journal of Social Sciences and Entrepreneurship, 1(10), 305-
320
Mohd, S.N.M., Chea, P. & Juhary, P. (2010). Moderating Effect of Government Policy
on Entrepreneurship and Growth Performance of Small and Medium
Enterprises in Cambodia. International Journal of Business and Management
Science, 1(2), 315-325.
Momanyi, J., (2016, October 25). Small Enterprises the Top Drivers of Kenya Economy,
Nairobi, Nation Media Group, p11.
Mulwa, B., & Wekhuyi, (2010). Devolution and Nation Building in Kenya. Nairobi,
Strathmore University,
Mumo, M. & Wokabi, C. (2013, August 16). Merger of Agencies to Streamline ICT in
Kenya, Nairobi, Nation Media Group, p 31.
Mumuni, A.I. & Insah, B. (2013). Developing Rural Women Entrepreneurs as a Key to
Poverty Reduction in Ghana: the Case of WA Municipality International
Journal of Social Sciences and Entrepreneurship, 1(3), 406-415.
Muniu, K.N., Ngugi P.K. (2013). Effects of Human Resource Management Practices on
Performance of Small and Medium Enterprises in Kenya: Case of Kiambu
Municipality. International Journal of Social Sciences and Entrepreneurship,
1(3), 583-600.
Mutambu, A. (2016). Government Officials Defend Themselves, Pass Blame for Failing
to Tame Corruption, Nation Media Group, October 18, Nairobi.

190
Muteru, B. (2013). The Effect of Micro Finance Institutions on Growth of Women
Owned Enterprises: A Case Study of Kenya Women Finance Trust in Kikuyu
Township. International Journal of Social Studies and Entrepreneurship,
1(5), 351-371.
Mwendwa, A. K., (2010). Devolution in Kenya: Prospects, Challenges and Future.
Nairobi, Institute of Economic Affairs in Kenya.
Nasion, J.A., & Ali, A. (2003. Dynamics of Business Studies. Nairobi, Longhorn.
Ngugi, K.J. (2013). Influence of Intellectual Capital on the growth of small and Medium
Enterprises in Kenya. Nairobi (Unpublished).
Njiraini, P., & Moyi E., (2006).Supporting MSEs to Access Public Procurement Market
in Kenya, Nairobi, KIPPRA.
Njoroge, K. & Wainaina, E. (2013, October 28). County Speakers now Oppose Bill.
Nairobi, The Standard Media Group p 4.
Ogwel, S.T., Iravo, M. & Lagat, KM.K. (2016). Factors Influencing Performance of
Public Procurement Function in Trans Nzoia County, Kenya. International
Journal of Recent Research in Commerce, Economics and Management 3(2),
95-106.
Omondi, D. (2016, November 29). Fired, Pain of Lost Jobs. Nairobi, The Standard
Media Group, p 3.
Ongachi, R.N., & Bwisa, H.M. (2013). Factors Influencing Growth of Women owned
Micro and Small Enterprises: A case of Kitale Municipality. International
Journal of Academic Research in Business and Social Sciences, 3(10). 222-
6990
Ong’olo, D & Odhiambo, S. (2013). SMEs Development in the Devolved Governance
System: Policy Options for Institutional and Regulatory Reforms in Kenya,
Nairobi. Policy Brief No. 1/2013. CUTS International
191
Odoro, P. A. & Ngugi, P. K. (2013). Factors Hampering Uptake of Entrepreneurship
among Persons with Impairments in Kenya: A Survey of Entrepreneurs with
Impairments in Nairobi County. International Journal of Social Sciences and
Entrepreneurship, 1(5), 756-767
Odunga, D. (2013, October 28). Senators Drafting Law Seeking to Give Residents More
Say on County Matters, Nairobi, Nation Media Group p 13.
Ogachi, J. (2013). Empowering the Kenyan Youth through Public Procurement: Reality
or Fiction? Nairobi, K I SM.
Okoth, J. (2013, October 22). The Reality of Doing Business with Government. Nairobi,
The Standard Media Group. P 9.
Okumu, F. (2003). Towards a Strategy Implementation Framework. International
Journal of Contemporary Hospitality Management, 1(3), 327-338
Owegi, F., & Aligula E., (2006). Public Sector Procurement in Kenya: The Need for a
Coherent Policy Framework. Nairobi, KIPPRA.
Pearce, J., Robinson, R.B. & Mital, A. (2012). Strategic Management: Formulation,
Implementation and Control. Twelfth Edition, New Delhi, McGraw Hill.
Republic of Kenya, (2013). Trans Nzoia County Integrated Development Plan 2013-
2017, Kitale, Kitale Printers.
Republic of Kenya (2014). Micro and Small Enterprises Authority: Harmonization of
Micro and Small Enterprises (MSE) Sector in Kenya, Trans Nzoia County
Office, Kitale (Unpublished)
Republic of Kenya (2015). Public Finance Management: Manual of the Centre for
Parliamentary Studies and Training, New York, Ford Foundation.
Republic of Kenya, Kenya Gazette Supplement Acts (2015). Public Procurement and
Asset Disposal Act, Nairobi, Government Press.
192
Republic of Kenya, Kenya Gazette Supplement Acts (2005). Public Procurement and
Disposal Act, Nairobi, Government Press.
Republic of Kenya, Kenya Gazette Supplement Acts (2006). Public Procurement and
Disposal Regulations, Nairobi, Government Press.
Republic of Kenya, (2010). Public Procurement Oversight Authority. October Edition,
Nairobi, PPOA.
Republic of Kenya, (2003). Economic Recovery Strategy for Wealth and Employment
Creation 2003-2007, Nairobi, Government Press.
Republic of Kenya, (2013, May 13). Ms Waiguru Leave a Markon IFMIS Re-
Engineering, Nairobi, The National Treasury.
Republic of Kenya, (2009), “Modernizing Public Service towards Vision 2030,”
Departmental Service Charter, Office of the Deputy Prime Minister and
Ministry of Finance, Nairobi, The Treasury.
Republic of Kenya, (2009). Systems Audit Report for the State Law Office, Nairobi, KE
NAO.
Scott, W.R. (1995). Institutions and Organizations, Thousand Oaks, Retrieved from
thttp://www.istheory.byu.edu/wiki/Institutional_theory/concise_description-
of-theory on 13 June, 2013.
Sekaran, U & Bougie, R. (2013). Research Methods for Business. Sixth Edition, Rome,
Trento Srl.
Shahnazi, K. & Gharagoz, S,A. (2014). The Impact of Corruption on Private Domestic
Sector Investment. Case of Selected Developing Countries. Islamic Azad
University, Sciences and Research Branch, Azerbaijan, Trento Srl.
Shikuku, D.N., Omwenga, J. (2015). Determinants of Performance of Group Owned
Enterprises in the Dairy Industry in Trans-Nzoia County. Strategic Journal
of Business and Change Management. 2(95), 1385 – 1405
193
Shiundu, D. & Rotich, G. (2013). Factors Influencing Efficiency in Procurement
Systems among Public Institutions: A Case of City Council of Nairobi.
International Journal of Social Sciences and Entrepreneurship, 1(7), 508-
524.
Siti, Z. & Atika, N. (2010). The Impact of Supply Chain Operational Capabilities on
Business Performance of Small and Medium Enterprises in Malaysia: A
Preliminary Analysis. International Journal of Business and Management
Science. 1(7), 608-644.
Sussland, W.A. (2013). The Innovative Enterprise: How to Transform a Traditional
Organization in an Innovative Networking Enterprise Paperback. Retrieved
from http://www.amazon.com/Innovative-Enterprise-traditional-
organization-
innovative/dp/1484016068/ref=sr_1_1?s=books&ie=UTF8&qid=138330309
1&sr=1-1 on 01 November, 2013
Tappin,R.M. (2014). How to Figure Out an appropriate Sample for the Pilot Study,
Capella, Capella University.
Theuri, C. (2013, October 31). Economy Stagnates as Thousands of Asian Traders are
Sent Packing. Nairobi , Nation Media Group, p 16.
Thuo, R. K. & Katuse, P. (2013). A Critical Analysis of the Strategic Planning
Effectiveness in the Public Sector Reform: A survey of Local Authorities in
Kenya. International Journal of Social Sciences and Entrepreneurship, 1(5),
322-330.
Tinyu, R,L., (2011, December Edition). South Africa Makes Strategic Plans to Simplify
Procurement. Britain, Supply Management, CIPS Press.
UN, (2006). Procurement Practitioner’s Handbook, Interagency Procurement Working
Group, Nairobi, UN.

194
Wafula, C. & Kiplangat J. (2013, October 11). Lawmakers Seek to Alter Procurement.
Nairobi, Nation Media Group, p 20.
Waithaka, M.W, Ngugi, K.J, Aiyabei, J.K, Itunga, J.K, & Kirago, P. (2012). Role of
Succession Planning on Survival of Small and Medium Family Enterprises
after Retirement/death of the first generation entrepreneur in Kenya. Prime
Journal of Business Administration and Management 2(12), 788-802.
Wekesa, G. (2013, October 31). Bad Governance Cause of Slow Education Growth,
Nairobi, The Standard Media Group.
Vittori, R. (2013). Review from: The Innovative Enterprise: How to Transform a
Traditional Organization in an Innovative Networking Enterprise (Retrieved
from http://www.amazon.com/Innovative-Enterprise-traditional-
organization-
innovative/dp/1484016068/ref=sr_1_1?s=books&ie=UTF8&qid=138330309
1&sr=1-1. Accessed on 01 November, 2013

195
APPENDICES
APPENDIX I: CONSENT LETTER
FRANCIS KISSINGER AMAYI
P.O. BOX 4221-30200
KITALE.
Dear Sir/Madam,
RE: RESEARCH AUTHORITY
I am PhD, Supply Chain Management student at Jomo Kenyatta University of
Agriculture and Technology carrying out research on PUBLIC PROCUREMENT
AND GROWTH OF MICRO AND SMALL ENTERPRISES IN COUNTIES IN
KENYA. This study is being carried out as part of requirement of obtaining the degree.
In order to carry out the research successfully, you have been selected to form part of the
study which is purely academic. The information you are giving will be treated with
utmost confidentiality. The respondents will not be required to give their names, unless
they voluntarily offer it in which case the name will not appear in the final report that
will be submitted to the university.
Your cooperation and assistance in this research is highly appreciated.
Thank you in advance.
Sincerely
Francis Kissinger Amayi
PhD. Student, JKUAT.

196
APPENDIX II: QUESTIONNAIRE
Section A: Background Information
Which among the following is your type of business enterprise? (Select one as
appropriate)
Micro { } Small { }
How many employees does the business enterprise has? (Select one as appropriate)
1-5 { } 6-10 { } 11-15 { } Above 15 { }
How long have you been running the business enterprise? (Select one as appropriate)
0-5 yrs { } 5-10 yrs { } 10-15 yrs { } 15-20 yrs { }
Over 20 yrs { }
What is your average annual sales turnover for the business? (Select one as appropriate)
Ksh. 0-500,000 { } Ksh. 500,001- 1000,000 { } Ksh. 1,000,000-
2,000,000 { }
Ksh. 2000,0003,000,000 { } Ksh. 3,000,000- 5,000,000 { } Over
Ksh. 5,000,000 { }
What is you level of education? (Select the highest)
Ph.D { } Masters { } Bachelor { } Diploma { }
Others (Specify)……………………………………………………………………………
What is your gender? (Select one as appropriate)
Male { } Female { }
What is your professional specialization? (Indicate your area of training)
……………………………………………………………………………………………

197
Section B: Growth of MSEs
How is the growth rate of MSEs through public procurement in the Counties in Kenya?
(Tick as appropriate)
High { } Moderate { } Low { }
Do procurement procedures, public procurement contract administration practice, E-
procurement (IFMIS) bidding capacity of MSEs and procurement oversight agencies
support growth of MSEs through public procurement in Kenya
Yes { } No { }
How many of the following aspects has your enterprise recorded in the periods provided
from public procurement in Kenya? (Indicate the values)
2015 2014 2013
Total number of
contracts awarded
……………….. …………………. ……………………
Total value of
contracts awarded
……………….. …………………. ……………………
Total number
debriefings done
……………….. …………………. ……………………
Total number of
disputed
procurements
……………….. …………………. ……………………
Comment on the relationship between public procurement and the growth rate of MSEs
in the Counties in Kenya. (Indicate whether related or not related)
…………………………………………………………………………………………

198
Section C: Procurement Procedures
How does regulation of public procurement affect MSEs’ participation and growth in
Kenya? (Tick as appropriate)
Significantly affects { } Moderately affects { } Does not affects { }
To what extent do the following requirements by public procuring entities significantly
hinder participation and growth of MSEs in public Procurement in Kenya? (Tick as
appropriate)
Variable
Very
small
extent
Small
extent
Moderate
extent
Large
extent
Very large
extent
Past experience
Financial capability
Competence of personnel
Legal registration
How have procurement procedures influenced the growth of MSEs in Kenya? (Indicate
whether progressive or retrogressive)
…………………………………………………………………………………………
Section D: Procurement Contract Administration
How effective is procurement contract administration conducted in Kenya? (Tick as
appropriate)
Highly effective { } moderately effective { } Highly ineffective { }
To what extent do the following contract administration practices affect MSEs growth in
Kenya?
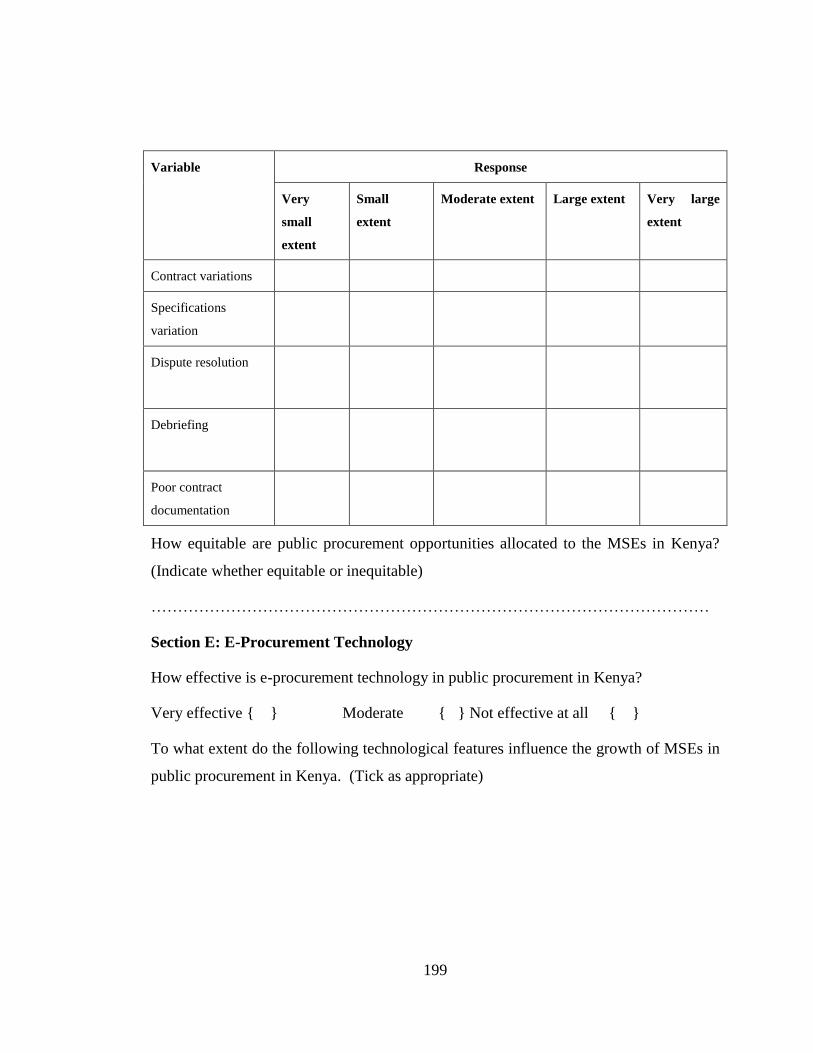
199
Variable Response
Very
small
extent
Small
extent
Moderate extent Large extent Very large
extent
Contract variations
Specifications
variation
Dispute resolution
Debriefing
Poor contract
documentation
How equitable are public procurement opportunities allocated to the MSEs in Kenya?
(Indicate whether equitable or inequitable)
……………………………………………………………………………………………
Section E: E-Procurement Technology
How effective is e-procurement technology in public procurement in Kenya?
Very effective { } Moderate { } Not effective at all { }
To what extent do the following technological features influence the growth of MSEs in
public procurement in Kenya. (Tick as appropriate)
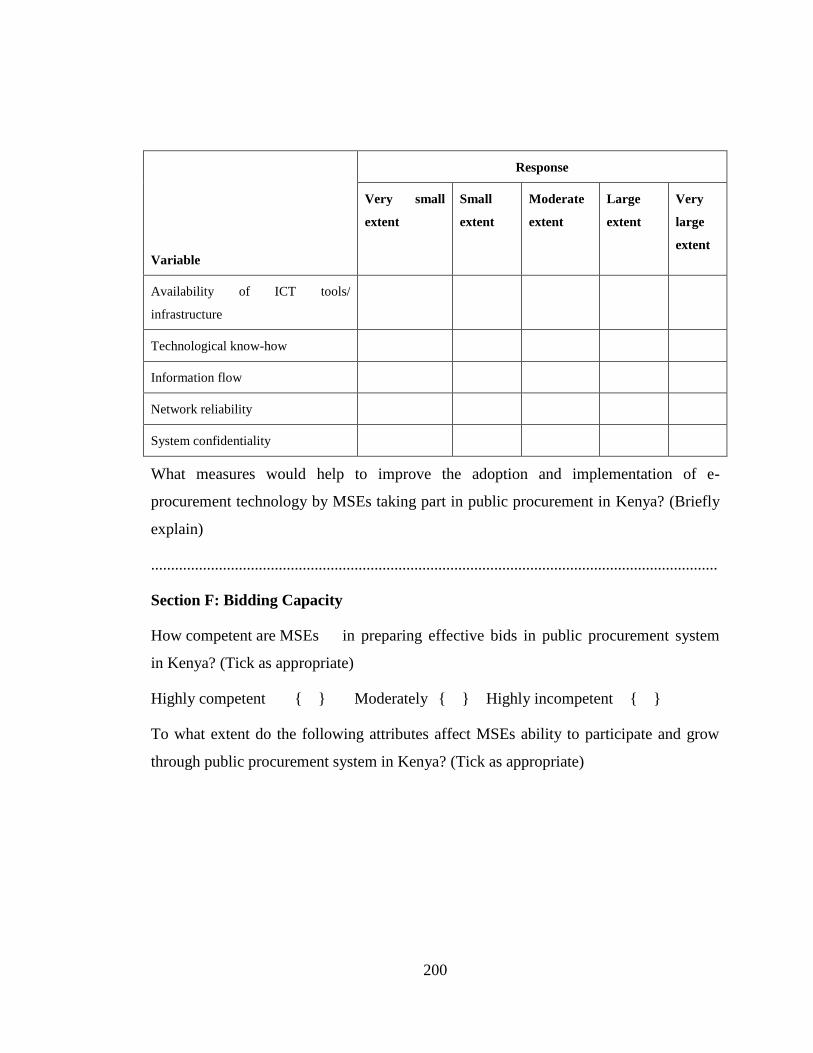
200
Variable
Response
Very small
extent
Small
extent
Moderate
extent
Large
extent
Very
large
extent
Availability of ICT tools/
infrastructure
Technological know-how
Information flow
Network reliability
System confidentiality
What measures would help to improve the adoption and implementation of e-
procurement technology by MSEs taking part in public procurement in Kenya? (Briefly
explain)
..............................................................................................................................................
Section F: Bidding Capacity
How competent are MSEs in preparing effective bids in public procurement system
in Kenya? (Tick as appropriate)
Highly competent { } Moderately { } Highly incompetent { }
To what extent do the following attributes affect MSEs ability to participate and grow
through public procurement system in Kenya? (Tick as appropriate)

201
Variable
Response
Very small
extent
Small
extent
Moderate
extent
Large
extent
Very large
extent
Human resources competences
Bids preparation skills
Negotiation skills
Level of competition
Volume of the contract
In which ways can MSEs improve their bidding capacity to effectively win procurement
contracts in Kenya? (Briefly explain)
………………………………………………………………………………………….
Section G: Oversight Agencies
How is the performance of oversight agencies in enforcing the implementation of
procurement procedures?
Satisfactory { } Moderately { } Unsatisfactory { }
To what extent do the following factors influence the oversight agencies’ ability to help
to ensure that MSEs benefit from opportunities offered by public procurement in Kenya?
(Tick as appropriate)

202
Variable
Response
Very small
extent
Small
extent
Moderate
extent
Large
extent
Very
large
extent
Competences of the members
Independence and objectivity of the
agencies
Funding of the agencies
Adequacy of powers
Inter-agency relationships
Clarity of their roles
What should be done to enhance the execution of the mandates of the oversight agencies
in overseeing the conduct of public procurement in Kenya? (Briefly explain)
……………………………………………………………………………………………
Section H: MSE Participation
How many times per year do you participate in public procurement in Kenya? (Tick as
appropriate)
Quarterly { } Half yearly { } Once a year { }
Others (specify):
……………………………………………………………………………………………
To what extent do the following variables determine growth of MSEs in public
procurement in Kenya? (Tick as appropriate)
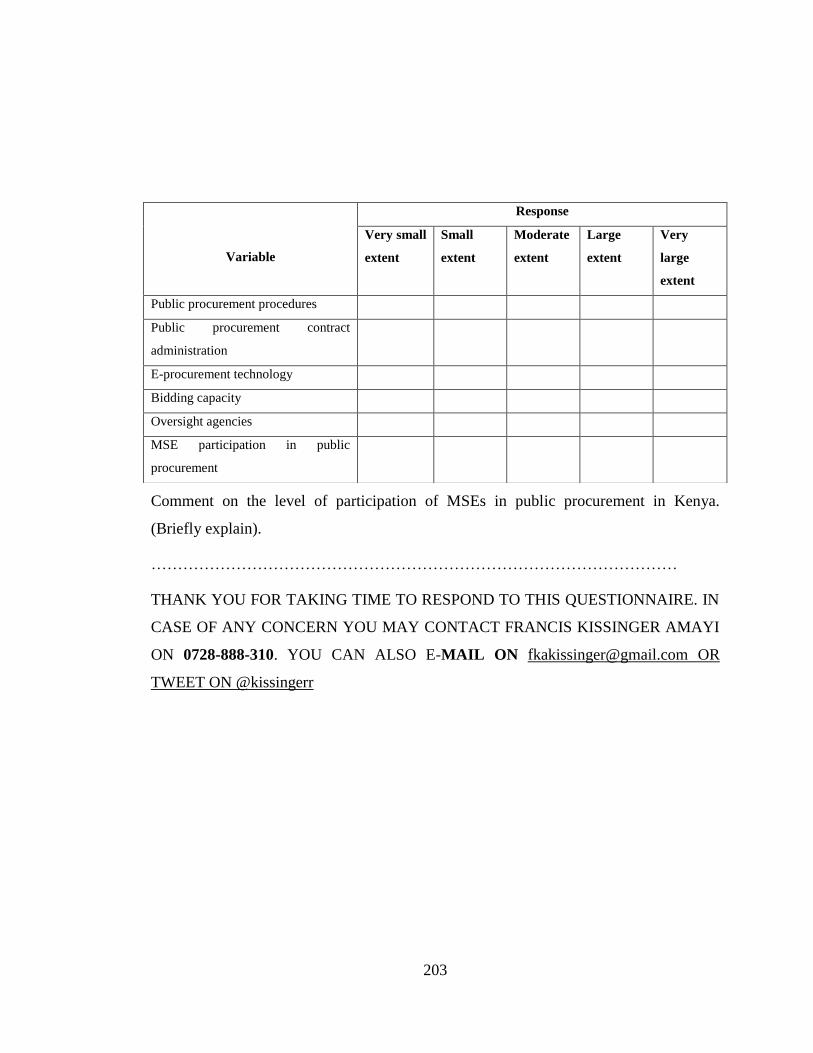
203
Comment on the level of participation of MSEs in public procurement in Kenya.
(Briefly explain).
………………………………………………………………………………………
THANK YOU FOR TAKING TIME TO RESPOND TO THIS QUESTIONNAIRE. IN
CASE OF ANY CONCERN YOU MAY CONTACT FRANCIS KISSINGER AMAYI
ON 0728-888-310. YOU CAN ALSO E-MAIL ON [email protected] OR
TWEET ON @kissingerr
Variable
Response
Very small
extent
Small
extent
Moderate
extent
Large
extent
Very
large
extent
Public procurement procedures
Public procurement contract
administration
E-procurement technology
Bidding capacity
Oversight agencies
MSE participation in public
procurement