public research universities
TRANSCRIPT

Public Research Universities: Understanding the Financial Model
A Publication of The Lincoln Project: Excellence and Access in Public Higher Education

© 2016 by the American Academy of Arts & Sciences
All rights reserved.
isbn: 0-87724-107-4
This publication is available online at https://www.amacad.org/LincolnProject.
The views expressed in this publication are those held by the contributors and are not necessarily those of the Officers and Members of the American Academy of Arts & Sciences.
Please direct inquiries to: American Academy of Arts & Sciences 136 Irving Street Cambridge, ma 02138-1996 Telephone: 617-576-6117 Fax: 617-576-5050 Email: [email protected] Web: www.amacad.org
Cover: The lights on the map represent the locations of Carnegie-classified Very High Research Activity and High Research Activity public universities in the United States as of January 2016.
The Lincoln Project: Excellence and Access in Public Higher Education
Public Research Universities: Understanding the Financial Model
IntroductionIn the last twenty years, and especially since the onset of the Great Recession, states have dra-matically reduced their contributions to public higher education. While the cuts have affected every public higher education institution, the cuts at public research universities have been the most severe, averaging a 26 percent drop in investment since 2008.1 The federal government has not covered this deficit, but has rather scaled back its support for the public research enter-prise.2 No one has yet devised a workable plan to reverse these trends.
Tuition & FeesState Support
Gifts

Faculty and administrators across the country have responded to this challenge with urgency and cre-ativity. Nearly all public research universities have reduced administrative costs, improved financial management, and found new efficiencies in pur-chasing, information technology (it), and human resources (hr) infrastructure. In addition, public research universities have embedded themselves more deeply and productively in local communities by offering services and partnerships to govern-ments and businesses, and by extending educational offerings to previously underserved populations of students. But even these efforts have not been enough to make up for the funding shortfall.
For the first time in the history of American public higher education, tuition has become the principal revenue source for many public research universities.
Figure 1: Drivers of Rising Tuition at Public Research Universities, 2001–2011
79%Decreased State Support
9%Increased
Spending onInstruction
6%Increased Spending
on Construction
6%Increased Spending
on Administrationand Support
Source: Robert Hiltonsmith, Pulling Up the Higher-Ed Ladder: Myth and Reality in the Crisis of College Affordability (New York: Demos, 2015), http://www.demos.org/sites/default/files/publications/Robbie%20admin-bloat.pdf.
For the purposes of the Lincoln Project, public research universities are defined as institutions of higher education that receive a portion of their funding from state and local appropriations, educate undergraduate and graduate students, are Carnegie-classified as Very High and High Research Activity universities, and are located in one of the fifty states.
2 The Lincoln Project: Excellence and Access in Public Higher Education

The American Academy of Arts & Sciences has created the Lincoln Project: Excellence and Access in Public Higher Education to study the importance of public research universities, analyze economic trends affecting their operations, and recommend new strategies to sustain these critical institutions. In its first publication, Public Research Universities: Why They Matter, the Lincoln Project demonstrated the many ways in which public research universities are a vital public good. The second publication, Public Research Universities: Changes in State Funding, examined the financial challenges that state governments face, described the effects of those chal-lenges on university budgets, and assessed the prospects for greater state support in the future.
This publication details the most common financial models that sustain public research uni-versities, describes institutional responses to the changing financial climate, and identifies state funding cuts as the primary cause of rising tuition. It also examines new ideas for diversifying and enhancing funding sources in the future.
Figure 2: The Shifting Responsibility of Payingfor a Public University Degree: 1970s to Today
33%≥50%
60%
34%7% ≤16%
Student & FamilyResponsibilty
1970s Today
State Support
Federal Government
Source: David H. Feldman, Myths and Realities about Rising Tuition (Washington, D.C.: National Association of Stu-dent Financial Aid Administrators, 2012), http://www.nasfaa.org/news-item/4565/Myths_and_Realities_about_ Rising_College_Tuition.
Public Research Universities: Understanding the Financial Model 3

Section 1: Current Revenue Sources for Public Research Universities
2000
2001
2002
2003
2004
2005
2006
2007
2008
2009
2010
2011
2012
Net Tuition andFees Revenue
State and LocalAppropriations
Federal Appropriations(Net Pell) and Revenuefrom State and LocalGrants and Contracts
Auxiliary, Hospital, and Independent Operations, and Other Sources of Revenue
Figure 3: Distribution of Revenue per Full-Time Equivalent Student, 2000–2012
0%
10%
20%
30%
40%
50%
60%
70%
80%
90%
100%
Net tuition is the published tuition minus any grants, loans, or other aid; in other words, it is the actual amount stu-dents pay to attend an institution. While auxiliary activities like housing management and food services are important components of universities, they are generally self-funding and do not contribute substantial revenue to the core op-erating budget of the university. Source: National Center for Education Statistics, IPEDS Analytics: Delta Cost Project Database 2000–2012, https://nces.ed.gov/ipeds/deltacostproject/.
4 The Lincoln Project: Excellence and Access in Public Higher Education

State SupportThe turn of the twenty-first century introduced a period of fundamental change to the sources of revenues at public research universities. Traditionally, public research universities received the largest portion of their funding for operations (including education) from state and local appropriations. But between 2000 and 2012, state appropriations to public research universities declined by 34 percent per full-time equivalent (fte) student; meanwhile, public research universities increased the number of students they educate by approximately 23 per-cent.3 The causes of these shifts—detailed in the Lincoln Project’s previous publication, Public Research Universities: Changes in State Funding—include increasing enrollment; rising costs of health care, prisons, and k–12 education; increasing numbers of mandated requirements; and the economic recession.
Other Sources of FundingAs state appropriations for higher education diminish, public universities increasingly rely on other sources to advance their mission and maintain the quality of education and training they provide: tuition, philanthropy, auxiliary services, grants and contracts, and endowment and investment income. The extent to which individual public research universities rely on diverse sources of funding varies greatly by location, demographics of students served, state aid programs, and relationships with regional business and industry. Some institutions fare better than others due to generous state funding, robust philanthropic enterprises, or lucrative part-nerships with local corporations.
Figure 4: State Support for Education and Related Spending per FTE Student at Public Research Universities Varies Widely by State
39%
61%
$26,512 $10,140
61%
39%
State Support
Average E&R Spending per FTE Student
Family Contributions
Connecticut Louisiana
Connecticut and Louisiana represent opposite ends of the spectrum, with public research universities distributed across the range of total educational expenses and proportions of state and student contributions. Data from 2012. Source: National Center for Education Statistics, IPEDS Analytics: Delta Cost Project Database 2000–2012, https://nces.ed.gov/ipeds/deltacostproject/.
Public Research Universities: Understanding the Financial Model 5

Tuition and FeesWhile higher education is the “balance wheel” of state budgets, tuition is the balance wheel of public university budgets: it is one of the only unrestricted sources of funding that the institution receives.4 To compensate for the decline in state subsidies at a time of increasing enrollment, tuition and fees increased to surpass both state and federal appropriations as a source of revenue for public research universities. In fact, recent data reveal that revenues from tuition and fees now average more than one-half (and often far more) of the core education expenditures at public research universities.5
Even with the rise in tuition prices, tuition often only covers one-third to one-half of the total cost of edu-cation. While net tuition revenue (total revenue from tuition and fees minus grant and loan aid) has risen at all public research universities, only 17 percent of first-year students in ay2013–2014 paid full tuition without receiving any form of financial aid.6
PhilanthropyAt public research universities, philanthropy supports an average of 7.5 percent of core institutional bud-gets. The proportion is greater at “very high” research universities (8.9 percent) than at “high” research universities (6.2 percent). In 2013, public research universities reported over $5.17 billion in gifts.7 There is wide variation within these averages, including sev-eral schools—the University of California, Berkeley; University of Michigan; University of Virginia; and University of Texas at Austin—that have successfully launched and completed $3 billion (or greater) cam-paigns, accounting for a large portion of this total. Nevertheless, the effects of fundraising, even at smaller institutions with more limited donor prospects, can be significant.8
The Decentralization of University Budget Management
Budgeting at public research universities has changed dramatically in the last thirty years. In the early 1980s, most universities operated with a cen-tral budgeting model, in which the provost (or vice president for academic affairs) and the CFO (or vice president for business and administration) split control of the budget, according to function. Many public research universities introduced Resource/Responsi-bility Centered Management (RCM) in the late 1980s and early 1990s. The RCM approach moves the responsibility for a balanced budget to the unit or school level: the central adminis-tration taxes units to advance the common mission of the university, but schools and units manage their own resources.
6 The Lincoln Project: Excellence and Access in Public Higher Education

Gifts and grants from nonprofit foundations and other private organizations are an important com-ponent of fundraising. In 2012, foundations awarded a total of $1.77 billion to higher education, of which $639 million went to public colleges and universities (including community colleges, com-prehensive state colleges, and public research universities), with the rest going to private colleges and universities.9 However, gifts and grants from foundations often fund very specific projects and their associated project costs, and do not cover the costs of overhead, which can include adminis-trative expenses and utilities. This often results in institutions having to provide operational support for grants received. In short, foundation support is not a substitute for state appropriations, tuition, or other unrestricted funding.
Private research universities have a long history of successfully fundraising from their alumni, while development is a fairly new operation at most public research universities. Many alumni of public research universities continue to assume that their alma maters are adequately supported
Figure 5: All Revenues Consist of Either . . .
Can be used for any purposethe institution chooses, butis most often used for instructionor facility-operations expenses.
Limited in use by third partiessuch as donors and researchsponsors, typically to specificunits, activities, or purposes.
Unrestricted Funds Restricted Funds
As state appropriations have decreased, restricted funds have grown as a percentage of total budgets at public research universities. While federal appropriations and revenues from state and local grants and contracts have increased since 2000, these are restricted to purposes specified in the original agreements and can rarely, if ever, be shifted to cover educational expenses. The net effect of a shift over time from unrestricted funds to restricted funds is a decline in the budgetary flexibility of public research universities.
Public Research Universities: Understanding the Financial Model 7

by the state. Updating public perceptions of state university financing is a key step in cultivating public university alumni giving.
One major caveat to the use of private gifts is that they are very often restricted to particular pur-poses outlined by the donor (such as scholarships, buildings, or faculty chairs) and are often supple-mental to preexisting gifts.10 As such, private gifts—like foundation gifts and grants—often cannot substitute for state funding. While philanthropic gifts advance the institution, it is a challenge for—and the responsibility of—public research universities to find creative ways to use philanthropy to support core operations.
Auxiliary ServicesPublic research universities receive some revenue from auxiliary services such as housing, uni-versity presses and bookstores, and food service. (Contrary to popular belief, in very few cases do athletics revenues exceed their expenses.)11 Many of these enterprises are self-supporting, with any surplus revenue reinvested in the operation of the service. As a result, use of these funds is generally restricted.
Grants and ContractsPublic research universities also receive funds from the federal, state, and local governments in the form of grants and contracts. The largest examples of these are grants for financial aid and research. As engines of research, public research universities often receive significant support from agencies like the National Science Foundation, National Institutes of Health, and Department of Defense.12 Garnering these funds is very competitive and use of these funds is highly restricted, but research funding often generates resources that help support faculty salaries and student fellowships.
Endowments and Investment IncomeSome public research universities receive revenue from investment returns on institutional cash balances and endowment income, but these are usually restricted and often minimal when compared to their private counterparts. Only a handful of public research universities benefit from endowments, such as the University of Michigan, whose annual return now surpasses state appropriations.13 Yet even when the return on investment is quite large, the dollar amount per enrolled student (a popular measure for the impact of an endowment’s return) is very low relative to smaller private universities.14
8 The Lincoln Project: Excellence and Access in Public Higher Education

Figure 6: Resource Sources for Select Institutions, FY2015
0%
20%
40%
60%
80%
100%
University of Michigan
Other
Departmental Sales& Services
Gifts
State Appropriations
Endowment
Auxiliary Activities
Contracts & Grants
Tuition & Fees
University of Pittsburgh
University of Colorado
Boulder
University of Washington
36%
31%
9%
9%
8%
3%3%
34%
33%
7%
5%
7%2%
8%
4%
44%
29%
15%
5%4%2%1%
20%
37%
27%
8%
8%
These data exclude revenues from university health systems. For the University of Pittsburgh, “Other” includes rental revenue, patent and royalty revenue, faculty and staff newspaper advertising and subscriptions sales, and symposium registration fees. For the University of Colorado Boulder, “Other” includes facilities-rental and royalty income, and mis-cellaneous fees, fines, and charges for services (including application fees, library fines, and testing fees). Source: Office of Planning, Budget, and Analysis, University of Colorado Boulder; Office of Budget and Planning, University of Michigan; Office of the Provost, University of Pittsburgh; and Office of Planning and Budgeting, University of Washington.
Public Research Universities: Understanding the Financial Model 9
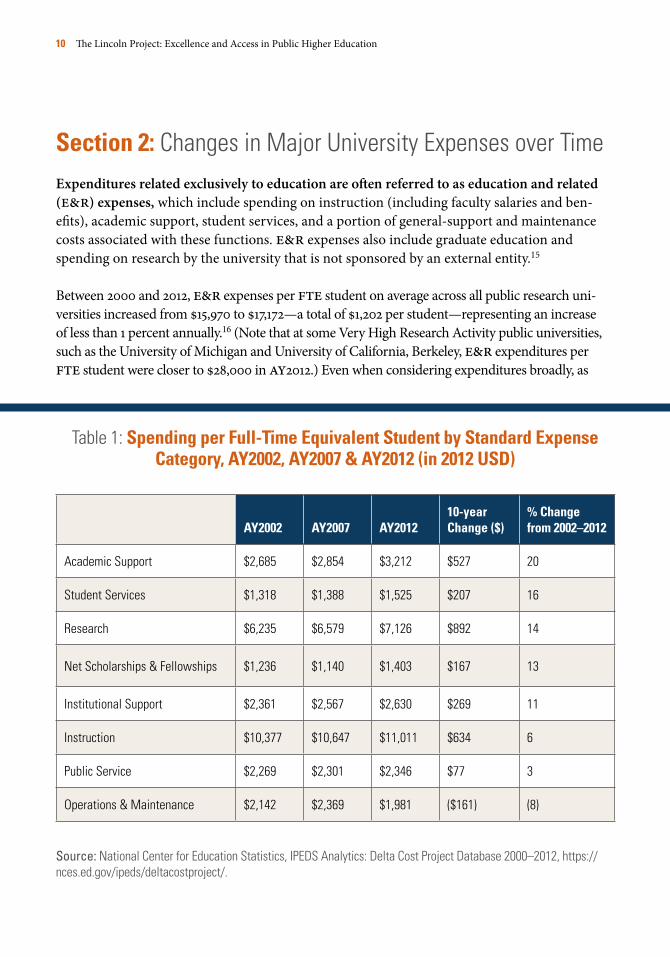
Section 2: Changes in Major University Expenses over TimeExpenditures related exclusively to education are often referred to as education and related (e&r) expenses, which include spending on instruction (including faculty salaries and ben-efits), academic support, student services, and a portion of general-support and maintenance costs associated with these functions. e&r expenses also include graduate education and spending on research by the university that is not sponsored by an external entity.15
Between 2000 and 2012, e&r expenses per fte student on average across all public research uni-versities increased from $15,970 to $17,172—a total of $1,202 per student—representing an increase of less than 1 percent annually.16 (Note that at some Very High Research Activity public universities, such as the University of Michigan and University of California, Berkeley, e&r expenditures per fte student were closer to $28,000 in ay2012.) Even when considering expenditures broadly, as
Table 1: Spending per Full-Time Equivalent Student by Standard Expense Category, AY2002, AY2007 & AY2012 (in 2012 USD)
AY2002 AY2007 AY201210-year Change ($)
% Change from 2002–2012
Academic Support $2,685 $2,854 $3,212 $527 20
Student Services $1,318 $1,388 $1,525 $207 16
Research $6,235 $6,579 $7,126 $892 14
Net Scholarships & Fellowships $1,236 $1,140 $1,403 $167 13
Institutional Support $2,361 $2,567 $2,630 $269 11
Instruction $10,377 $10,647 $11,011 $634 6
Public Service $2,269 $2,301 $2,346 $77 3
Operations & Maintenance $2,142 $2,369 $1,981 ($161) (8)
Source: National Center for Education Statistics, IPEDS Analytics: Delta Cost Project Database 2000–2012, https://nces.ed.gov/ipeds/deltacostproject/.
10 The Lincoln Project: Excellence and Access in Public Higher Education

does Chart 1, budgets have been kept under tight control, particularly in light of the fact that public research universities are serving far more students today than in ay2000.17
The five expense categories that have increased most dramatically over the last decade are 1) aca-demic support; 2) student services; 3) research, with an implied link to graduate education; 4) net scholarships and fellowships; and 5) institutional support. Each of these is reflective of the princi-pal activities hosted by public research universities and of the changing demographics of students being served. Academic support has drawn more resources because today’s students both require and expect ancillary technology and services to enhance their educational experience. Student services have continued to expand as institutions have enrolled increasingly diverse student bod-ies with greater need for counseling and support, and as safety and security for all members of university communities has become a greater priority.18 Additionally, there are greater demands for accountability from the federal sector than ever before, often in the form of unfunded federal mandates that lead to increased costs (such as the Clery Act, which requires colleges to provide and publicize information about campus crimes). As the nation’s research needs have changed, univer-sities have continued to compete effectively for federal research dollars from government agencies across broad categories. Net scholarships and fellowships have increased to offset rises in tuition. Institutional support has grown modestly and reflects the imperative for universities to keep class-rooms and laboratories updated and capable of supporting modern instructional strategies.
Policy regulations and expectations about the role of public research universities have also shifted over time. Since new regulations and legal mandates are almost always unfunded, the growing web of reporting processes demands increasing financial resources. Yet calculating the added cost of regulation is difficult and has only been attempted at a small number of institutions. Most recently, Vanderbilt conducted an extensive analysis of expenses related to federal mandates and found that eleven cents of every tuition dollar is spent on compliance with legal and regulatory mandates.19
Compensation and StaffingLike all colleges and universities, public research universities devote more than half of their e&r spending to employee compensation.20 Since the core missions of these institutions include research and graduate instruction, staffing levels are relatively high and demands on faculty and staff time are intense. However, it is important to note that faculty salaries have been slow to rise in the last decade. According to the American Association of University Professors, between ay2008 and ay2012, salaries at public research universities grew only 1.12 percent annually, well below the average annual rate of U.S. inflation.21
Popular discussion often inaccurately attributes rising tuition solely to “administrative bloat” at public universities. However, the Delta Cost Project at the American Institutes for Research (air) found that in 2012, public research universities employed 30 fewer staff per thousand fte students
Public Research Universities: Understanding the Financial Model 11
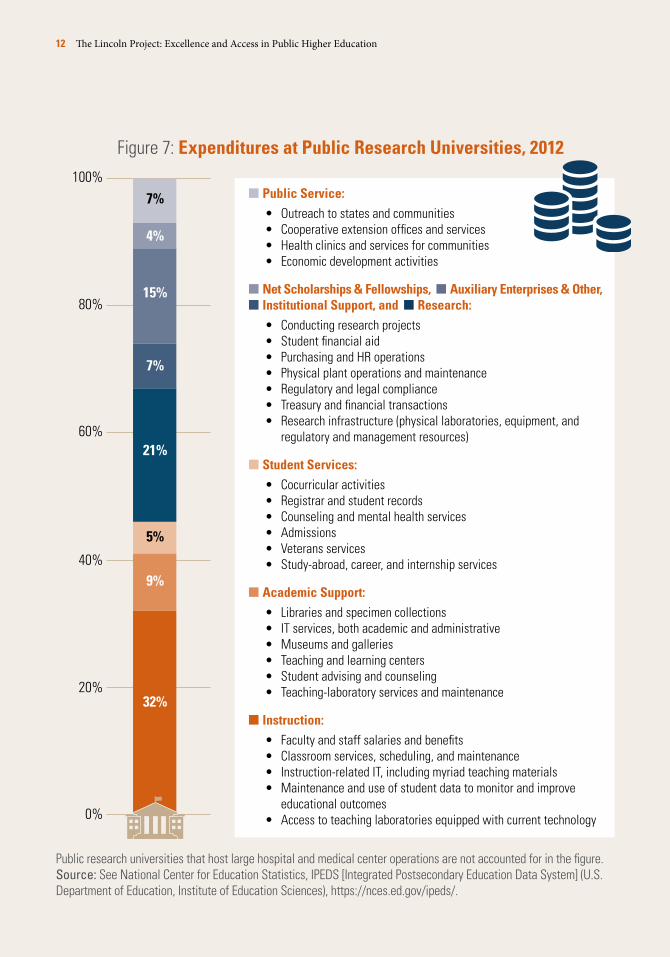
Figure 7: Expenditures at Public Research Universities, 2012
0%
20%
40%
60%
80%
100%
32%
9%
5%
21%
7%
15%
7%
4%
Public research universities that host large hospital and medical center operations are not accounted for in the figure. Source: See National Center for Education Statistics, IPEDS [Integrated Postsecondary Education Data System] (U.S. Department of Education, Institute of Education Sciences), https://nces.ed.gov/ipeds/.
Public Service:• Outreach to states and communities• Cooperative extension offices and services• Health clinics and services for communities• Economic development activities
Net Scholarships & Fellowships, Auxiliary Enterprises & Other, Institutional Support, and Research:• Conducting research projects• Student financial aid • Purchasing and HR operations• Physical plant operations and maintenance• Regulatory and legal compliance• Treasury and financial transactions• Research infrastructure (physical laboratories, equipment, and
regulatory and management resources)
Student Services: • Cocurricular activities• Registrar and student records• Counseling and mental health services• Admissions• Veterans services• Study-abroad, career, and internship services
Academic Support:• Libraries and specimen collections• IT services, both academic and administrative• Museums and galleries• Teaching and learning centers• Student advising and counseling• Teaching-laboratory services and maintenance
Instruction:• Faculty and staff salaries and benefits• Classroom services, scheduling, and maintenance• Instruction-related IT, including myriad teaching materials• Maintenance and use of student data to monitor and improve
educational outcomes• Access to teaching laboratories equipped with current technology
12 The Lincoln Project: Excellence and Access in Public Higher Education

compared with 2002. In contrast, during this same time period, private institutions increased staff by 137 employees per thousand fte students. Clearly, rising tuition at public research universities is not due to unrestrained hiring of staff, administrative or otherwise. In Figure 8, the full array of hiring patterns for faculty and staff between 2002 and 2012 is displayed.
However, the costs of benefits for existing employees and retirees are rising and have a large impact on the operations budget of public research universities. Such benefits include medical and dental plans, retirement contributions, Social Security, unemployment and Medicare taxes, life and disability insurance plans, and, in some instances, tuition benefits. Depending on the state and the higher education oversight within that state, universities are often constrained in managing these costs because they are treated as “fixed” costs within the state budget and are not under the control of individual institutions.
Adding to the complexity of the costs of benefits is the variation in pension plans across states and higher education systems. In general, pension plans represent obligations to retired and current employees that must be met by law.
Figure 8: Changes in Workforce at Public Research Universities,2002–2012
0
50
2002
2003
2004
2005
2006
2007
2008
2009
2010
2011
2012
100
150
Num
ber o
f Sta
ff pe
r One
Tho
usan
d FT
E St
uden
ts
Full-Time Faculty
Part-Time Faculty
Instructors/ResearchAssistants
Executive, Administrative,and Managerial
Professional
Nonprofessional
Professional staff includes positions such as business analyst, human resources staff, and admissions staff. Source: National Center for Education Statistics, IPEDS Analytics: Delta Cost Project Database 2000–2012, https://nces.ed.gov/ipeds/deltacostproject/.
Public Research Universities: Understanding the Financial Model 13

Section 3: How are Public Research Universities Responding?Many public research universities have responded to decreased state funding by increasing tui-tion. While this solves short-term crises, increasing tuition above ordinary inflation and growth of family incomes is not a sustainable model for public institutions dedicated to serving their states, regions, and nation. Public research universities are working hard to keep tuition increases in check by finding creative ways to reduce expenses and increase revenues in other areas.
Cost Savings and EfficienciesWith rapid decreases in state funding, public research universities have aggressively explored new ways to generate revenue and cut costs. Over the past several years, these institutions have cut faculty positions, eliminated or streamlined course offerings, closed satellite cam-puses, shut computer labs, and reduced library services, among other cuts. Many institutions attempted to protect university performance by deferring maintenance work and minimizing administration costs.22
Public research universities have also launched aggressive cost savings plans that include reducing administrative layers, creating joint appointments that share faculty between departments, instituting shared services centers, creating purchasing consortia, and embarking on systems-wide collaborations. For example, the University System of Maryland launched an Effectiveness and Efficiency (e&e) Initiative that yielded $356 million in savings during its first ten years.23 The University of California, Berkeley launched the Operational Excellence Program three years ago and—through pro-curement-related savings, standardized it offerings and campus-wide software licenses, and streamlined organizational structure—has achieved more than $63 million in cumulative savings to date.24 Miami University launched the mu–Lean project in 2009, which has since identified over $25 million in savings and new reve-nues. Other institutions have taken to outsourcing some operations, including management of parking lots, residence halls, and other campus facilities.
Beyond cutting costs, universities are also diversifying their investment portfolio strategies and devel-oping better systems to manage the funds they have. Many institutions are creating comprehensive and detailed financial models that project financial results in the short, medium, and long term in
Over the past several years, public research universities have cut faculty positions, eliminated or streamlined course offerings, closed satellite campuses,
shut computer labs, and reduced library services.
14 The Lincoln Project: Excellence and Access in Public Higher Education
order to execute strategic multiyear planning. Modeling future revenue streams enables universities to establish targets and realistic goals. Even in an environment in which states commit only to a single-year funding cycle, the existence of such modeling can help legislators and governors propose aspirational funding goals.
Universities are also establishing performance metrics with the goal of increasing institutional accountability, while also reflecting institutional variation. For example, public research univer-sities with high graduation rates are reaching out to previously underserved populations. For institutions that have a higher access model (for example, if the state mandates that students from many different qualification levels be admitted) increasing completion rates may be a high priority. Here, one size does not fit all, and universities should avoid introducing counterpro-ductive incentives for funding.
Georgia State University (gsu) provides a dramatic example of organizational efficiency: by creating and implementing a new academic tracking program to improve student outcomes, gsu’s six-year graduation rate has increased from 32 percent in 2003 to 51 percent in 2014 (with no disparities along racial or ethnic lines).25 During the same period, gsu has made a concerted effort to increase enrollment for traditionally underserved students. Remarkably, the share of its students who are eligible for federal Pell Grants nearly doubled, from 31 percent in 2003 to 58 percent in 2013. In this instance, investing in learning analytics and new technologies to improve student learning outcomes paid off with enormous dividends without appreciably increasing the budget. This model is being replicated at other institutions.26
Institution-Based Financial AidIn light of decreasing state investment and increasing tuition, many public research universities have significantly increased their financial aid budgets to maintain access to students from all income levels. As a result, at some public research universities, financial aid is now the larg-est expenditure after instruction. Financial aid that comes directly from the institution—as opposed to the state, federal government, or a private entity—is often funded by a combination of tuition, fees, endowment funds, and the operating budget.
Financial aid can be used to achieve many different institutional goals, such as meeting student financial need, attracting more high-ability students, and enrolling a more diverse student body. It should be noted that while a number of students receive financial aid, many do not. Full- paying students are critical to the bottom line, and allow institutions to enroll students from all socioeconomic backgrounds.
At some public research universities, financial aid is now the largest expenditure after instruction.
Public Research Universities: Understanding the Financial Model 15

In 2012, the majority (70 percent) of first-time, full-time, in-state students at public research universities received a grant or scholarship, with an average award of $7,844.28 Grant aid from all colleges and universities in the form of discounts to their students grew $23 billion between ay2003 and ay2013, with the most rapid growth in the second half of the decade. 29 Between 2009 and 2011 alone, the percentage of tuition and fee “sticker price” that is covered by the average institutional grant per fte student at public colleges and universities increased by about 10 percent.30 At public colleges and universities, the percentage of institutional grant aid meeting undergrad-uate financial need increased from 29 percent in ay2000 to an estimated 48 percent in ay2013.31 The majority of grants are need-based, with a smaller percentage going to merit and athletic grants and tuition waivers.
PhilanthropyPublic research universities are striving to offset decreases in state funding and to diversify their revenue streams by increasing their fundraising operations. While a number of public insti-tutions have anticipated the eventual decline in public support and established robust devel-opment strategies, many are just now making investments in the infrastructure required and beginning educational campaigns with their alumni about the criticality of donor support. Illus-trative of the rapidly changing environment in public university fundraising, of the seventy- seven institutions that responded to a Lincoln Project survey, 90 percent have recently com-pleted or are in early stages of launching a capital campaign. However, it must be reiterated that most giving is highly restricted—one institution we surveyed estimated that as much as 98 percent of giving is restricted. Endowments are not checking accounts that can be spent at will; rather, donors give to support specific initiatives, and universities have both a legal and ethical obligation to use these gifts to support the activities for which they were given.
Changing Sources of StudentsIn response to rapid and dramatic decreases in state funding, many public research univer-sities—if permitted by state regulation or law—have increased the number of out-of-state or international students to their campuses. Out-of-state and international students play a vital role in creating a more diverse and vibrant student body than would be attained by admitting only in-state students. Beyond bringing tremendous value both in and out of the classroom, these students strengthen the financial base of the university, since these students often pay
North Carolina State University’s Centennial Campus is home to more than seventy corporate, governmental, and nonprofit partners, along with seventy-five North Carolina State research centers, institutes, and departmental units, and numerous colleges.27
16 The Lincoln Project: Excellence and Access in Public Higher Education

higher tuition rates. At most public research universities, the out-of-state and international tuition and fee prices are two to five times higher than those for in-state students, and are not offset by state or federal financial aid.
This strategy, while widely employed, represents a “bridge-funding” option more than a long-term solution to revenue stream diversification for research universities. Over time, there may be limited opportunities for state universities to continually increase the numbers of out-of-state students. International students, while now flocking to the United States to study at its unparalleled higher education institutions, may become increasingly attracted to universities in their own countries, whose quality is rapidly improving. Additionally, a reliance on external sources of full-paying students can lead to problematic disparities in the socioeconomic profiles of in-state versus out-of-state and international students. Each institution needs to find its own balance of students, while ensuring that enrollment of out-of-state and international students does not come at the expense of fully qualified in-state students.
With the advent of improved learning software, some public research universities are expanding the number of students they serve with online-degree and educational-certificate programs. These initiatives range in their goals, structures, and outcomes. For example, the University of North Carolina now offers an online mba program (unc@mba) that enrolls more than six hundred students from more than thirty countries, with a minimal price dif-ferential from on-campus instruction, while Georgia Tech has partnered with Udacity and at&t to offer an online master’s degree in computer science at a fraction of the cost of the on-campus experience. For some institutions, online education has allowed them to enhance their revenue streams in certain niche areas, though it has not been a panacea.
Alliances with Business and Industry PartnersUniversities are becoming more entrepreneurial in nature, opening their doors to collabora-tions with businesses large and small. As a result of these adaptations, universities are making it easier for students and faculty to start new businesses by improving intellectual-property and technology-transfer policies. Some institutions are building business-accelerator units or new research parks either on or in close proximity to the physical campus. Such parks encourage partnerships with local businesses and corporations and provide great opportunities for intern-ships, joint research, and employment for graduates. North Carolina State University’s Centen-nial Campus—comprising one thousand acres adjacent to the main campus—has employed these strategies, encouraging university researchers to collaborate with corporate, governmen-tal, and institutional partners on topics of mutual interest. These business partnerships often generate funds that flow back to the university, as well as increase opportunities for students and faculty to apply research in real-world settings.
Public Research Universities: Understanding the Financial Model 17

ConclusionFaced with sudden and dramatic state and federal budget reductions, university administra-tions across the country have responded with inventiveness and urgency. Nearly all public research universities have reduced administrative costs; improved financial processes and man-agement; found new efficiencies in purchasing, it, and hr infrastructure; and developed more effective and economical ways of serving students. In addition, public research universities have embedded themselves more intensively in local economies by offering services and partnerships to governments and businesses, diversifying their sources of revenue, and extending educa-tional offerings to previously underserved populations of students.
But even provided the enormous energy devoted to innovation within these institutions, the cre-ation of new and sustainable funding models for public research universities remains immensely challenging. Tuition, by necessity, has become the principal revenue source for many public research universities. Data clearly show that most of the increases in tuition at public universities were a direct result of decreased state appropriations. This reality is often obscured in the public debate about higher education, but it is a reality that must instruct any proposed solutions.
Public research universities are dedicated to the public: that is their mission; it is the value that animates all of their activities. These universities are a critical piece of the intellectual and eco-nomic infrastructure of our nation and, as such, are as important to our future prosperity as physical infrastructure like roads and bridges. But it is the public character of these institutions that the current financial model has put at the greatest risk. Recent trends threaten to increase the divide between well-endowed public research universities and lesser-endowed institutions, and weaken the relative quality of the educational experience at both. Without careful and sus-tained attention, we not only risk blurring the line between public and private research univer-sities, we also risk magnifying other social divides.
Clearly, the current model is broken, unsustainable, and sorely in need of an infusion of new strategies, ideas, and partnerships from and with the state and federal governments, corporate America, and philanthropy. Universities must continue to do their part by containing costs and enhancing existing—and developing new—revenue streams. Governments and corporations need to recommit as well. States should restore (and maintain) per-student funding at public institu-tions to the mean level of the fifteen-year period preceding the recession, adjusted for inflation.32 Federal programs should match state funding in order to incentivize and leverage state invest-ment. Corporations should contribute directly to public research universities, recognizing that their private sector success is correlated with the talent and creativity of employees recruited from these educational institutions. Using the power of collaboration and leverage, a new compact for financial sustainability for public research universities is possible, and will ensure that these insti-tutions remain a powerful component to the success and prosperity of our democracy.
18 The Lincoln Project: Excellence and Access in Public Higher Education

Appendix: Alternative Tuition ModelsThe rising costs of higher education are deeply troubling to families with modest or even middle- class incomes. As a result, many public research universities and states are investigating alternative tuition models. These models run the gamut from free tuition for all to a “pay what you can afford” model, which is already in use by some private universities and liberal arts colleges.
The “pay what you can afford” model might be best suited for institutions that attract large numbers of out-of-state students and whose students’ family incomes fall across a broad spectrum. In this model, tuition and fees would be set at the current out-of-state rate for both in-state and out-of-state students. The total state appropriation (per fte under-graduate) would then be awarded to each in-state student, regardless of family income.
Modeled for the University of Michigan, where 40 percent of the undergraduate students are from out of state, this strategy would net about $90 million in new revenue annually for the institution, which would then be distributed to both in- and out-of-state students according to financial need. Depending on family income, students and their families could pay as little as $0 and up to as much as $53,500 (for out-of-state fami-lies with incomes over $160,000). This model has the potential to significantly improve financial access for both in-state and out-of-state students.
Hypothetically, tuition and fees for both in-state and out-of-state students would be set at the current out-of-state rate (for the University of Michigan, about $53,500 per year). An amount equal to the total state appropriation per fte undergraduate
(approximately $13,000 as of October 2015) would then be awarded to each in-state stu-dent, regardless of family income.
In this scenario, for in-state students with a family income of less than $40,000, in con-junction with work-study and the federal tax credit, the annual cost would be $0. For in-state students with family incomes between $40,000 and $120,000, the annual cost would be between $700 and $15,800. For in-state students with a family income exceeding $160,000 (and with no need) the cost to attend the University of Michigan would rise from the current $26,000 to about $40,000.
For out-of-state students with incomes less than $40,000, the annual cost would be $5,500. For those out-of-state students with a family income between $40,000 and $120,000, the annual cost would be about $6,200 to $21,300 (a decrease of 40–70 per-cent when compared to the current cost for these families).
With this strategy, an institution like the Uni-versity of Michigan could meet the full needs of all in-state students (with no loans), pro-vide additional aid to in-state families earn-ing $120,000 to $160,000 per year, and meet the full needs of out-of-state students with families earning up to $120,000 per year.
Public Research Universities: Understanding the Financial Model 19

Endnotes1 Analysis of data from State Higher Education Executive Officers (sheeo) Association, SHEF: FY 2014—State Higher Education Finance (Boulder, Colo.: State Higher Education Executive Officers Association, 2015). Adjusted for inflation, state cost of living, and enrollment mix.
2 American Academy of Arts & Sciences, Restoring the Foun-dation: The Vital Role of Research in Preserving the American Dream (Cambridge, Mass.: American Academy of Arts & Sciences, 2014).
3 National Center for Education Statistics, ipeds Analytics: Delta Cost Project Database 2000–2012, https://nces.ed.gov/ipeds/deltacostproject/.
4 American Academy of Arts & Sciences, Public Research Universities: Changes in State Funding, (Cambridge, Mass.: American Academy of Arts & Sciences, 2015), 4.
5 Delta Cost Project, Trends in College Spending 1999–2009 (Washington, D.C.: Delta Cost Project, 2011), 31, http://www .deltacostproject.org/sites/default/files/products/Trends2011_Final_090711.pdf.
6 National Center for Education Statistics, 2011–2012 National Postsecondary Student Aid Study (npsas:12) (U.S. Department of Education, Institute of Education Sciences).
7 See National Center for Education Statistics, ipeds [Inte-grated Postsecondary Education Data System] (U.S. Depart-ment of Education, Institute of Education Sciences), https://nces.ed.gov/ipeds/. Ten institutions were not included in the total due to nonreporting.
8 The Chronicle of Philanthropy, Philanthropy 400 Project, “Philanthropy’s Uneven Climb: Success Stories, Red Flags, and a Trove of Data,” October 29, 2015, https://philanthropy.com/specialreport/philanthropys-uneven-climb-s/73.
9 See the Foundation Center at http://foundationcenter.org/. Gifts recorded are $10,000 or higher and from the top one thousand foundations.
10 National Association of College and University Business Officers, nacubo-Commonfund Study of Endowments, http://www.nacubo.org/Research/NACUBO-Commonfund_Study_of_Endowments.html.
11 National Science Board, Diminishing Funding and Rising Expectations: Trends and Challenges for Public Research Univer-sities (a companion to Science and Engineering Indicators 2012) (Arlington, Va.: National Science Foundation, 2012), 14, http://www.nsf.gov/nsb/sei/companion2/files/nsb1245.pdf.
12 Delta Cost Project, Academic Spending Versus Athletic Spending: Who Wins? (Washington, D.C.: Delta Cost Project, 2013), 10, http://www.deltacostproject.org/sites/default/files/products/DeltaCostAIR_AthleticAcademic_Spending_ IssueBrief.pdf).
13 National Association of College and University Business Officers and the Commonfund Institute, U.S. and Canadian Institutions Listed by Fiscal Year (FY) 2014 Endowment Market Value and Change in Endowment Market Value from FY2013 to FY2014 (Washington, D.C.; Wilton, Conn.: National As-sociation of College and University Business Officers and the Commonfund Institute, revised February 2015), http://www .nacubo.org/Documents/EndowmentFiles/2014_Endowment_Market_Values_Revised.pdf.
14 The College Board, “Trends in Higher Education: Endow-ment Assets per Student, 2012–13,” http://trends.collegeboard .org/college-pricing/figures-tables/endowment-assets-student -2012-13.
15 Delta Cost Project, Trends in College Spending 1999–2009, 20.
16 National Center for Education Statistics, ipeds Analytics: Delta Cost Project Database 2000–2012.
17 National Center for Education Statistics, ipeds.
18 Robin Wilson, “An Epidemic of Anguish,” The Chronicle of Higher Education, August 31, 2015.
19 Vanderbilt University, The Cost of Federal Regulatory Compliance in Higher Education: A Multi-Institutional Study (Nashville, Tenn.: Vanderbilt University, 2015).
20 Delta Cost Project, Labor Intensive or Labor Expensive? Changing Staff and Compensation Patterns in Higher Education (Washington, D.C.: Delta Cost Project, 2014), 15.
21 John Barnshaw and Samuel Dunietz, Busting the Myths: The Annual Report on the Economic Status of the Profession, 2014–15 (Washington, D.C.: American Association of Uni-versity Professors, 2015). Inflation data are based on the Con-sumer Price Index; see The World Bank, “Inflation, Consumer Prices (Annual %),” http://data.worldbank.org/indicator/FP.CPI.TOTL.ZG.
22 Delta Cost Project, Trends in College Spending 1999–2009, 20.
23 University System of Maryland, “Effectiveness and Efficiency Initiative,” http://www.usmd.edu/usm/workgroups/ EEWorkGroup/eeproject/ (accessed December 7, 2015).
24 University of California, Berkeley, “Operational Excellence,” http://oe.berkeley.edu/ (accessed December 7, 2015).
25 Education Advisory Board, “Improving Student Outcomes with Data-Driven Advising and Intervention” (Washington, D.C.: Education Advisory Board, 2014), https://www .eab.com/~/media/EAB/Technology/Student-Success -Collaborative/GSU-Case-Study/GSU-Case-Study-Feb-2015.
26 See the Innovation Alliance, http://innovationalliance.net/.
27 North Carolina State University Centennial Campus, https://centennial.ncsu.edu/ (accessed December 22, 2015).
28 National Center for Education Statistics, ipeds.
29 The College Board, Trends in Student Aid 2014 (New York: The College Board, 2013), 15.
30 Don Hossler and Derek Price, “Setting Institutional Student-Aid Policies: New Metrics for Governing Boards,” Trusteeship, Journal of the Association of Governing Boards of Universities and Colleges 22 (2) (2014), http://agb .org/trusteeship/2014/3/setting-institutional-student-aid -policies-new-metrics-governing-boards.
31 The College Board, Trends in Student Aid, 2014, 39.
32 National Research Council of the National Academies, Re-search Universities and the Future of America: Ten Breakthrough Actions Vital to Our Nation’s Prosperity and Security (Washing-ton, D.C.: National Academies Press, 2012), 9.
20 The Lincoln Project: Excellence and Access in Public Higher Education

The Lincoln Project: Excellence and Access in Public Higher Education
Advisory GroupRobert Birgeneau, Cochair, University of
California, Berkeley
Mary Sue Coleman, Cochair, University of Michigan
Lawrence S. Bacow, Harvard Kennedy School
Gene D. Block, University of California, Los Angeles
Henry Brady, University of California, Berkeley
Phil Bredesen, former Governor of Tennessee
Nancy Cantor, Rutgers University–Newark
John T. Casteen III, University of Virginia
Jonathan Cole, Columbia University
Gray Davis, former Governor of California
Patrick Doyle, Domino’s Pizza, Inc.
David B. Frohnmayer†, University of Oregon
E. Gordon Gee, West Virginia University
Matthew Goldstein, The City University of New York
Donald Graham, Graham Holdings Company
Carl Guardino, Silicon Valley Leadership Group
Robert D. Haas, Levi Strauss & Co.
Jim Hackett, Steelcase
Ann Weaver Hart, University of Arizona
Michael Hout, New York University
Kay Bailey Hutchison, former United States Senator, Texas
Jim Leach, University of Iowa
Earl Lewis, The Andrew W. Mellon Foundation
Ann Marie Lipinski, Nieman Foundation for Journalism at Harvard University
George Miller, former United States Representative, California
William Powers, Jr., The University of Texas at Austin
John Rogers, Ariel Investments
Thomas Siebel, C3 Energy; First Virtual Group
Shirley M. Tilghman, Princeton University
Phyllis M. Wise, University of Illinois at Urbana-Champaign
Frank Yeary, CamberView Partners llc; University of California, Berkeley
Pauline Yu, American Council of Learned Societies
FundersThe William and Flora Hewlett Foundation
The Spencer Foundation
Carnegie Corporation of New York
Thomas and Stacey Siebel Foundation
Robert and Colleen Haas
Project StaffSamantha CarneyEliza BergJohn TessitoreElissa Chin Lu, ConsultantBeata FitzPatrick, Consultant
† Deceased

@americanacad www.amacad.org