public rooftop revolution: putting the solar shine on city buildings
TRANSCRIPT

P U B L I C R O O F T O P R E V O L U T I O N
P U T T I N G T H E S O L A R S H I N E O N C I T Y B U I L D I N G S
John Farrell Director of Democratic Energy
June 9, 2015

3 G O A L SFind muni solar…

3 G O A L SCelebrate success

3 G O A L SBreak barriers
P O L L : H O W M A N Y B R O W S E R TA B S A R E O P E N O N Y O U R C O M P U T E R ?
• 1 - just this
• 2-4 - email, news site, and this
• 5-10 - doing a little research while I listen
• 11+ - I can hear you talking, but I can’t find the slides

H U G E S O L A R P O T E N T I A L

Residential and Commercial roofs
L O C A L S O L A R P O T E N T I A L
50% or more 25 to 50% 10 to 25%
25-50%
50%+
15-25%
P O T E N T I A L P E R C E N T O F P O W E R F R O M L O C A L R O O F T O P
S O L A R

8500
590
750
30,000
16,000
7200
11,000
1800
990
360012,000
780
7000
8200
510011,000
190026,0002400
7300
5100
360
26001100
1200
800
14004800
1800
32,000
5000
580
970
2300
4100
4400
2900
7200
6800
2800
7100
11,000
11,000
550010,000
12,000
20
1140700
4000
Percent of Sales1-5%5-10%10% or moreSource: http://www.ilsr.org/commercial-roofop-revolution/
*No incentives
D I S T R I B U T E D S O L A R P O T E N T I A L AT PA R I T Y * B Y 2 0 2 2
(Megawatts, residential & commercial)

26,000
4400
12,000
Percent of Sales1-5%5-10%10% or moreSource: http://www.ilsr.org/commercial-roofop-revolution/
*No incentives
20 MW9,977 MW397 MW
D I S T R I B U T E D S O L A R P O T E N T I A L AT PA R I T Y * B Y 2 0 2 2
(Megawatts, residential & commercial)
0
5,000
10,000
15,000
20,000
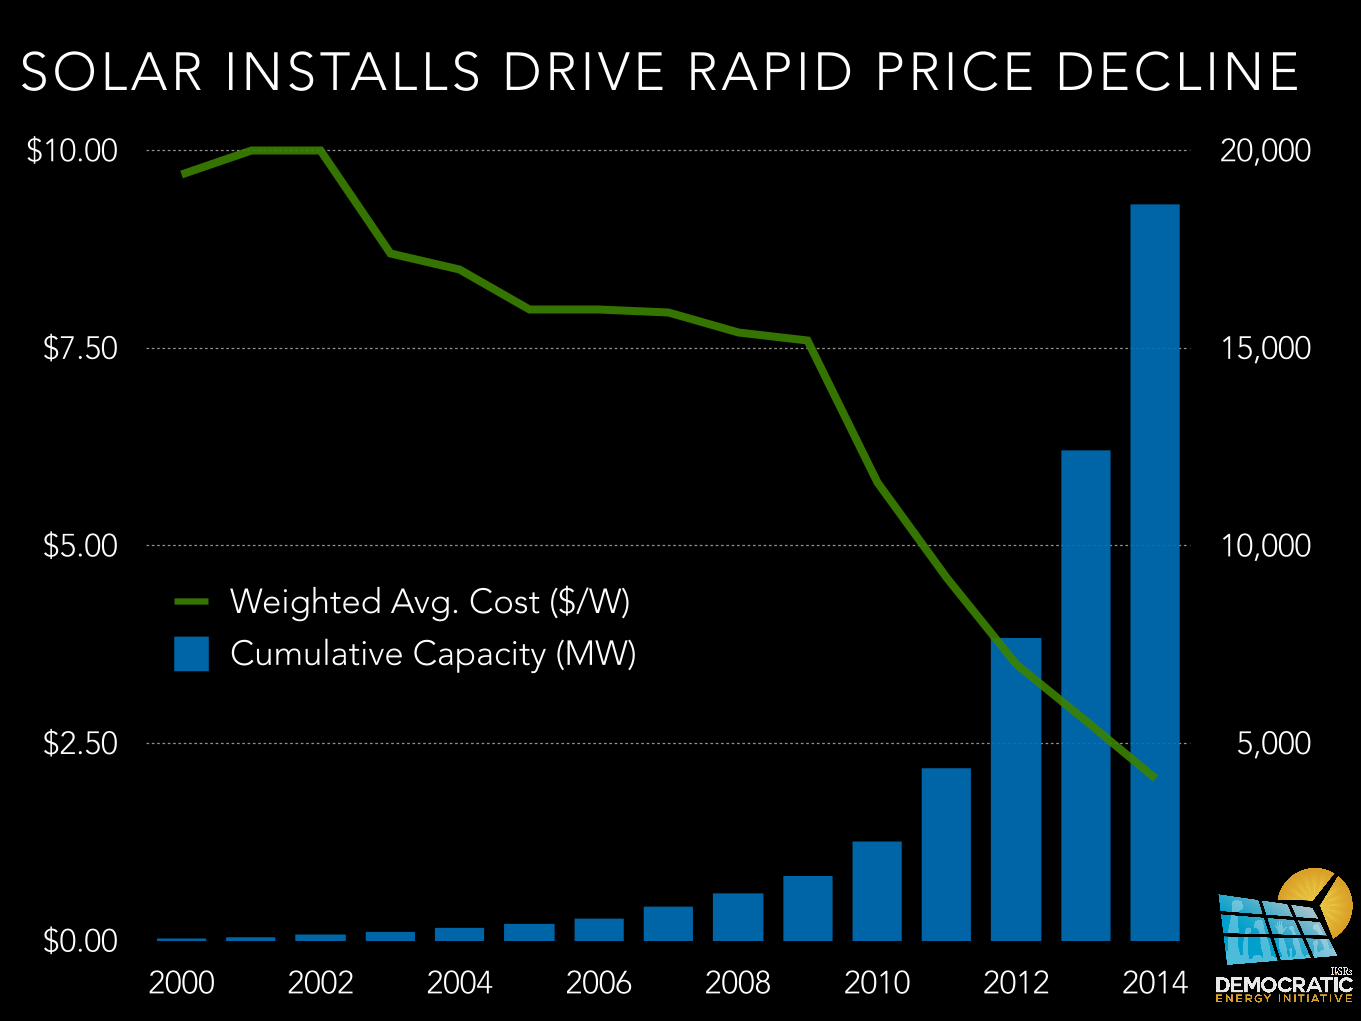
$0.00
$2.50
$5.00
$7.50
$10.00
2000 2002 2004 2006 2008 2010 2012 2014
Weighted Avg. Cost ($/W)
Cumulative Capacity (MW)
SOLAR INSTALLS DRIVE RAPID PRICE DECLINE

C I T Y S O L A R P O T E N T I A L

“Instead of looking at solar as a frivolous
amenity, look at it as an investment”
Robert Hinson, Renewable Energy Coordinator with the City of Raleigh, NC
Listen to the full podcast: http://www.ilsr.org/duking-it-out-over-municipal-solar-in-raleigh/

P O L L : H O W M U C H S O L A R O N K A N S A S C I T Y R O O F T O P S ?
• 2 MW
• 25 MW
• 70 MW
• 200 MW
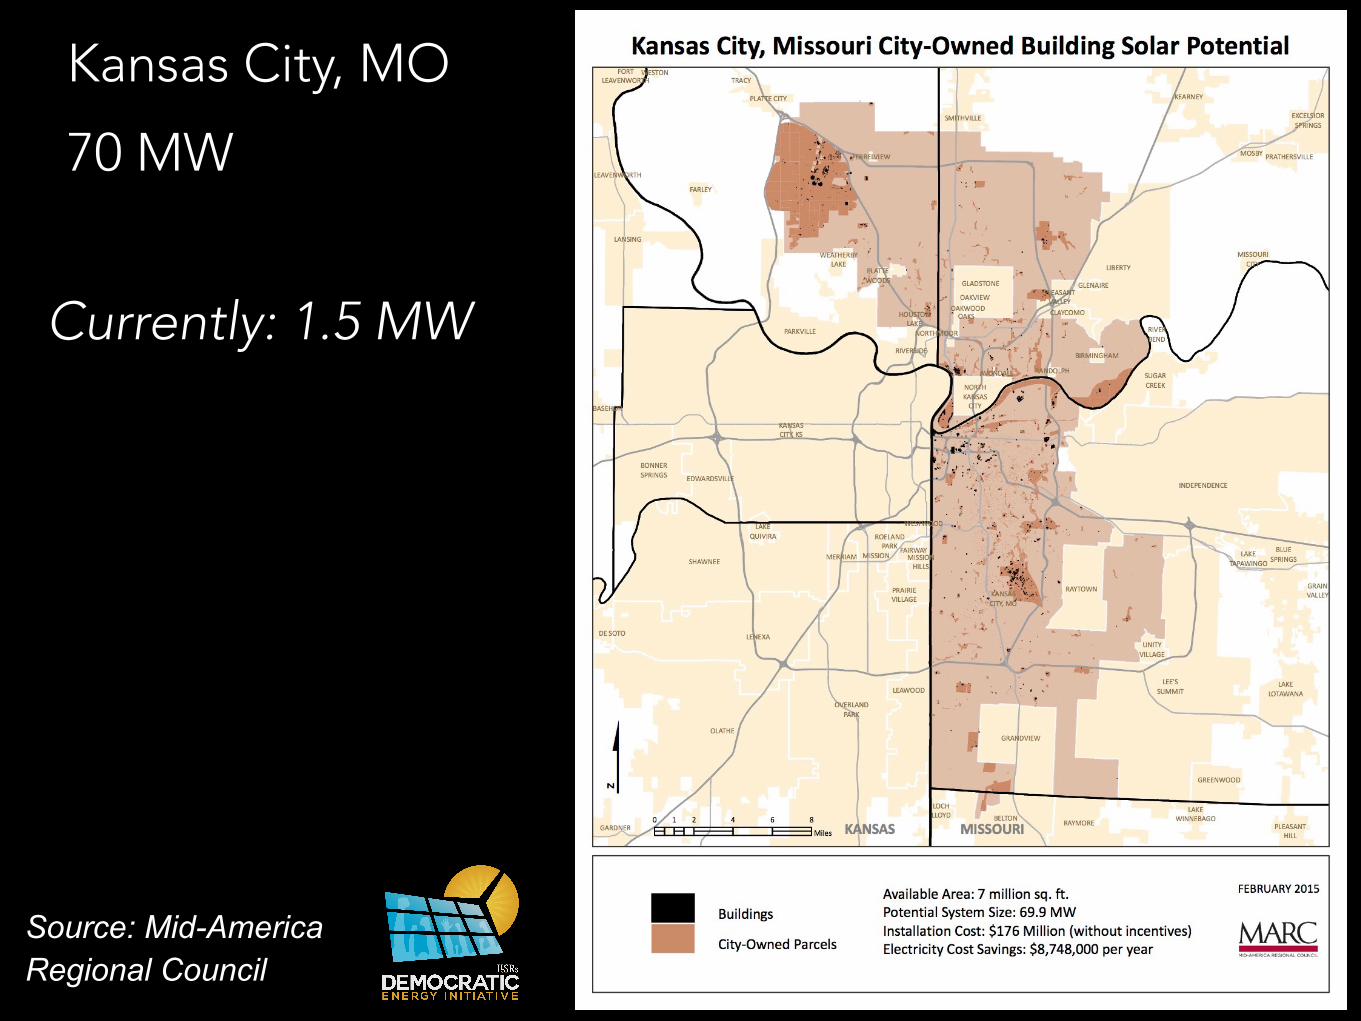
Kansas City, MO
70 MW
Source: Mid-America Regional Council
Currently: 1.5 MW
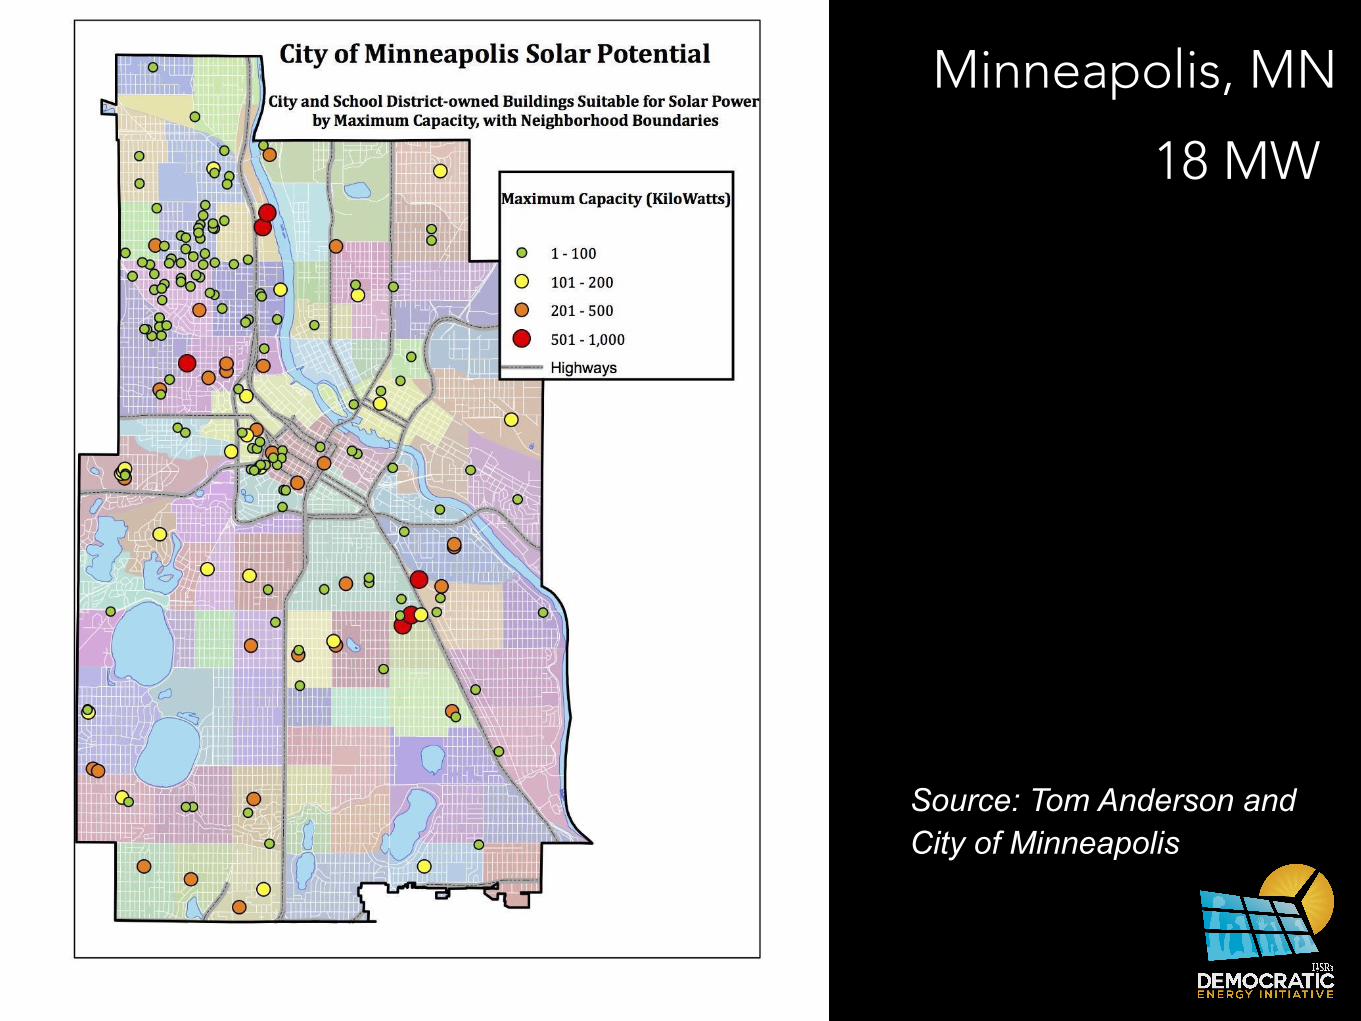
Source: Tom Anderson and City of Minneapolis
Minneapolis, MN
18 MW

KANSAS CITY SOLAR OPPORTUNITY
70megawatts
electricity bill savings$8.7 million
1,400 jobs
economic impact$175 million

B R E A K I N G B A R R I E R S

P O L L : W H AT ’ S T H E B I G G E S T B A R R I E R T O M U N I C I PA L S O L A R ?
• COST/FINANCING
• SHADE, STRUCTURAL LIMITS
• BUREAUCRACY
• STATE RULES, E.G. NET METERING

B R E A K I N G B A R R I E R S
C O S T

Co
st p
er k
ilow
att-
hour
0¢
5¢
10¢
15¢
20¢
Solar purchase method
Self-financed Lease, opt. 1 Lease, opt. 2 PPA* Private sector
P E R V E R S E TA X P O L I C Y M A K E S M U N I C I PA L S O L A R C O S T M O R E
Incentives do not
apply to tax-exempt
cities
Depreciation only Tax credit only
Tax credit and
depreciation
Transaction costs
Tax credit and
depreciation
Transaction costs
Transaction costs
15.5¢14.1¢ 13.7¢
12.3¢11.2¢
Federal tax credit = 30% off Depreciation = ~24% off
*PPA not legal in 25 states
Cost per kilowatt-hour

-$100,000
$0
$100,000
$200,000
$300,000
$400,000
$500,000
$600,000
$700,000
$800,000
$900,000
Raleigh Lancaster New Bedford
Self-Financed
Power Purchase Agreement (PPA)
Leased
LIFETIME VALUE OF SOLAR PROJECT TO CITY (30 YEARS)

T H E T R U M P C A R D ?
Credit: Gage Skidmore via Flickr

3 R D PA R T Y T R U M P C A R D
COST PHYSICAL AESTHETIC EXPERTISEBUREAU-CRACY
POLICY

P O L L : H O W M A N Y S TAT E S A L L O W P O W E R P U R C H A S E A G R E E M E N T S ?
• 5
• 14
• 25
• 36
• All of them

Allows 3rd parties
DC
S TAT E S U P P O R T F O R S O L A R T H I R D PA R T Y O W N E R S H I P
Source: DSIRE & ILSR, Apr. 2015 Ban or no official policy
via power purchase agreements
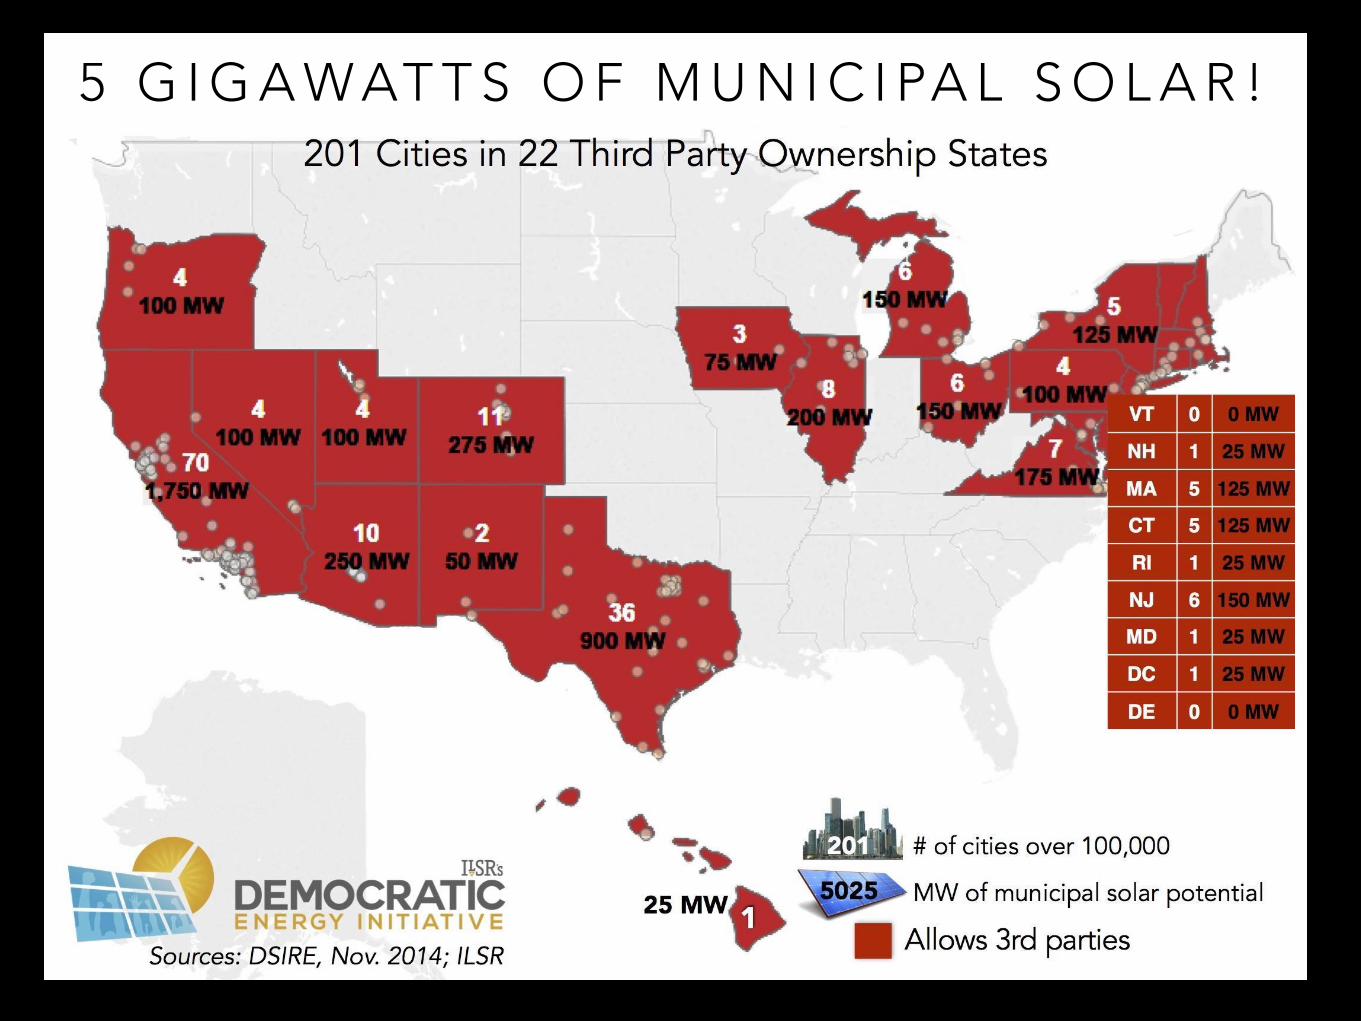
5 G I G A W AT T S O F M U N I C I PA L S O L A R !

B R E A K I N G B A R R I E R S
P O L I C Y
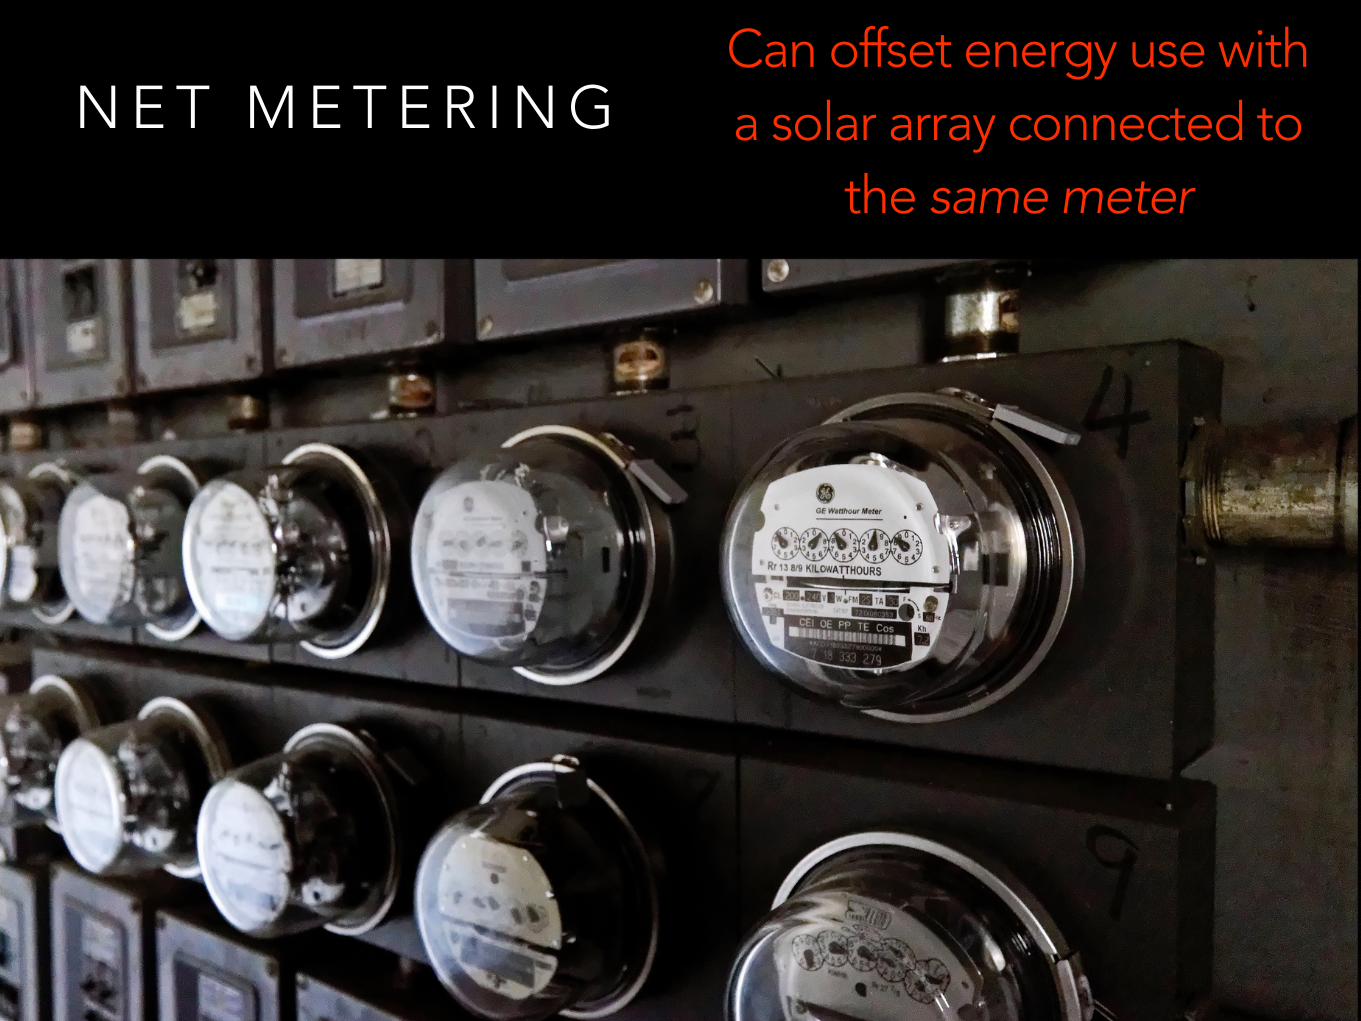
N E T M E T E R I N GCan offset energy use with a solar array connected to
the same meter

A G G R E G AT E N E T M E T E R I N G
Source: Aggregate Net Metering: Opportunities for Local Governments (North Carolina Solar Center, 2013)
Available*
Not available to any sector
No net metering policy
*For some electric customers
N/A for local governments
Allowing electric customers to offset energy use at all meters/buildings with solar at any
meter/building

V I R T U A L N E T M E T E R I N G
Virtual Net Metering EligibilityCalifornia Multi-tenant properties, local governments
Colorado IOU customers; solar gardens
Connecticut Municipal customers only
Illinois Utility choice to offer
Maine All customers
MarylandAllowed for agricultural customers, non-profit organizations, and municipal governments or their affiliates
Massachusetts All customers
Minnesota Community solar; Xcel Energy only
New Hampshire All customers
Rhode Island Local and state governments
Vermont All customers
Allowing electric customers to offset energy use at all meters/buildings with solar
anywhere nearby

B R E A K I N G B A R R I E R S
O T H E R

P H Y S I C A L
Credit: Wally Gobetz via Flickr
Shading 20%
Structural limitations
20%
Source: Rooftop Photovoltaics Market Penetration Scenarios (NREL, 2008)

410 MW potential
2 MW installed
New York City
Muni Solar
Shading 20%
Structural limitations
20%
There’s a lot more in here

A E S T H E T I C / H I S T O R I C
Credit: MCAD Library via Flickr
“[At least two major national solar installers] do not believe that solar
guidelines for historic districts are too onerous
for installers.”
Source: Solar Panels and Historic Preservation. (National Trust for Historic Preservation, undated)

T E C H N I C A L / L E G A L E X P E R T I S E
Credit: Janet Lindenmuth via Flickr
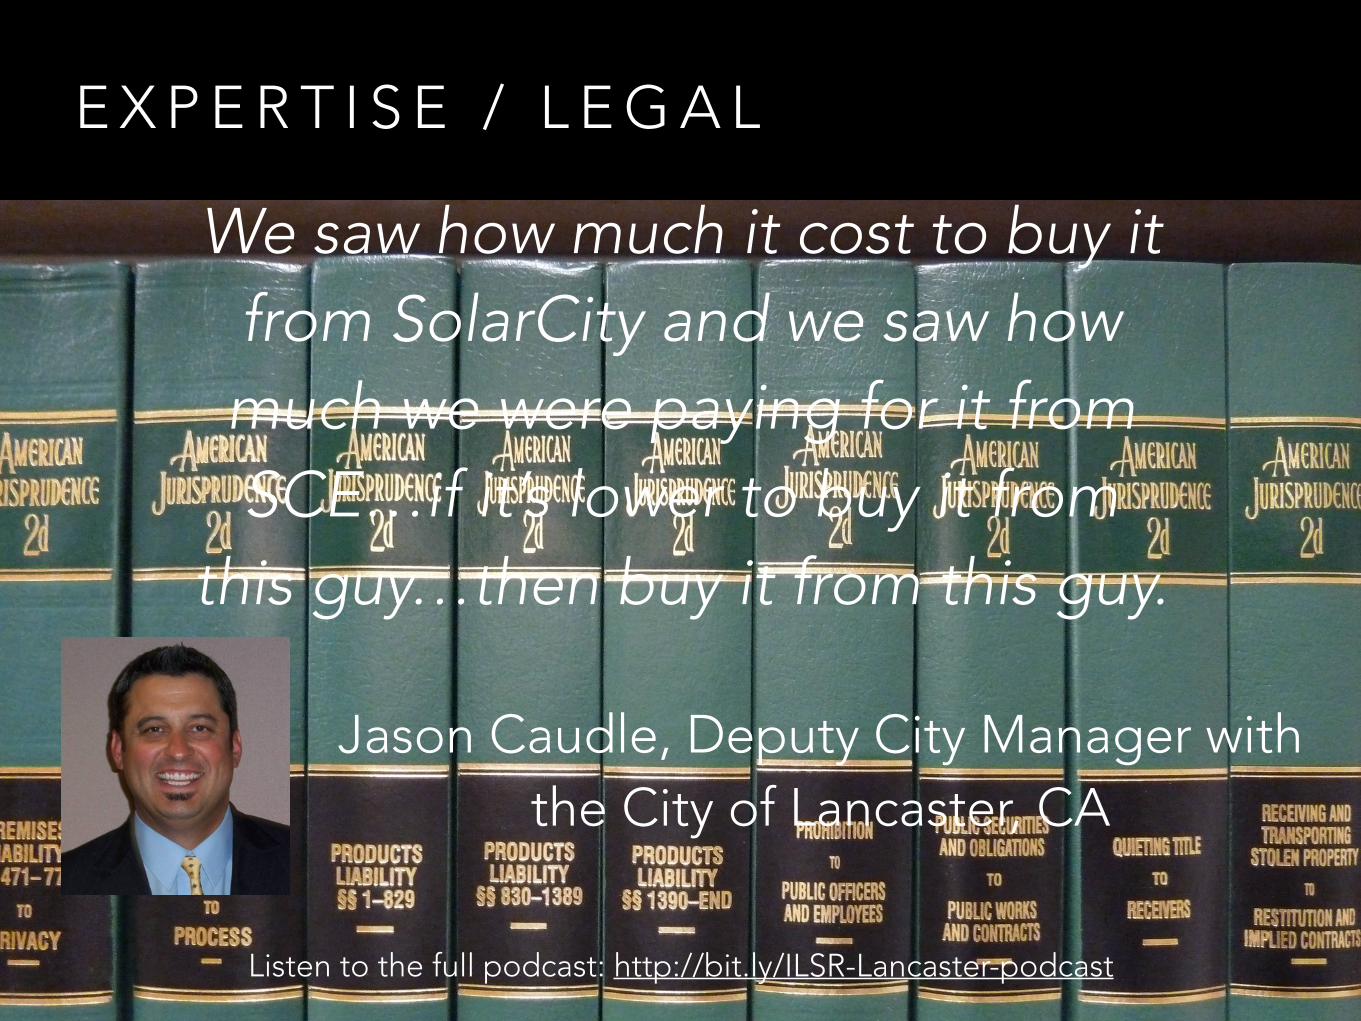
E X P E R T I S E / L E G A L
We saw how much it cost to buy it from SolarCity and we saw how much we were paying for it from SCE…if it’s lower to buy it from
this guy…then buy it from this guy.
Jason Caudle, Deputy City Manager with the City of Lancaster, CA
Listen to the full podcast: http://bit.ly/ILSR-Lancaster-podcast

B U R E A U C R A C Y
Credit: net_efekt via Flickr

Credit: Ian Anderson via Flickr
S P I L L O V E R B E N E F I T S

C O P Y C AT
Credit: miconian via Flickrhttp://bit.ly/VoteSolarContagious
Solar on municipal buildings leads to
more solar installed in the
community

E X P E R I E N C E
0
5,000
10,000
15,000
20,000
$0.00
$2.50
$5.00
$7.50
$10.00
2000 2002 2004 2006 2008 2010 2012 2014
Weighted Avg. Cost ($/W)
Cumulative Capacity (MW)
Solar on municipal buildings gives
installers and city staff expertise to drive down costs

L O C A L R U L E S
Denver Solar permitting fee = $50 Online permitting
Minimal wait time
Kansas City
Experience with municipal solar
helps cities lower barriers to solar

S TAT E R U L E S
Lawsuit over municipal solar led to
legalization of power purchase agreements
for entire state
Dubuque, IA

S U M M A R Y
5 G I G A W AT T S O F M U N I C I PA L S O L A R !

T H A N K Y O U !
21%
http://www.ilsr.org/public-rooftop-revolution/
@johnffarrell
www.ilsr.org
“It was a story more of financing than it was a story of engineering or
construction”Jason Caudle, Deputy City Manager with the City of
Lancaster, CA