public safety realignment and reentry - welcome … · public safety realignment and reentry...
TRANSCRIPT
Public Safety Realignment and Reentry
PREPARED BY: OFFICE OF REENTRY SERVICES (ORS)
REPORTING PERIOD
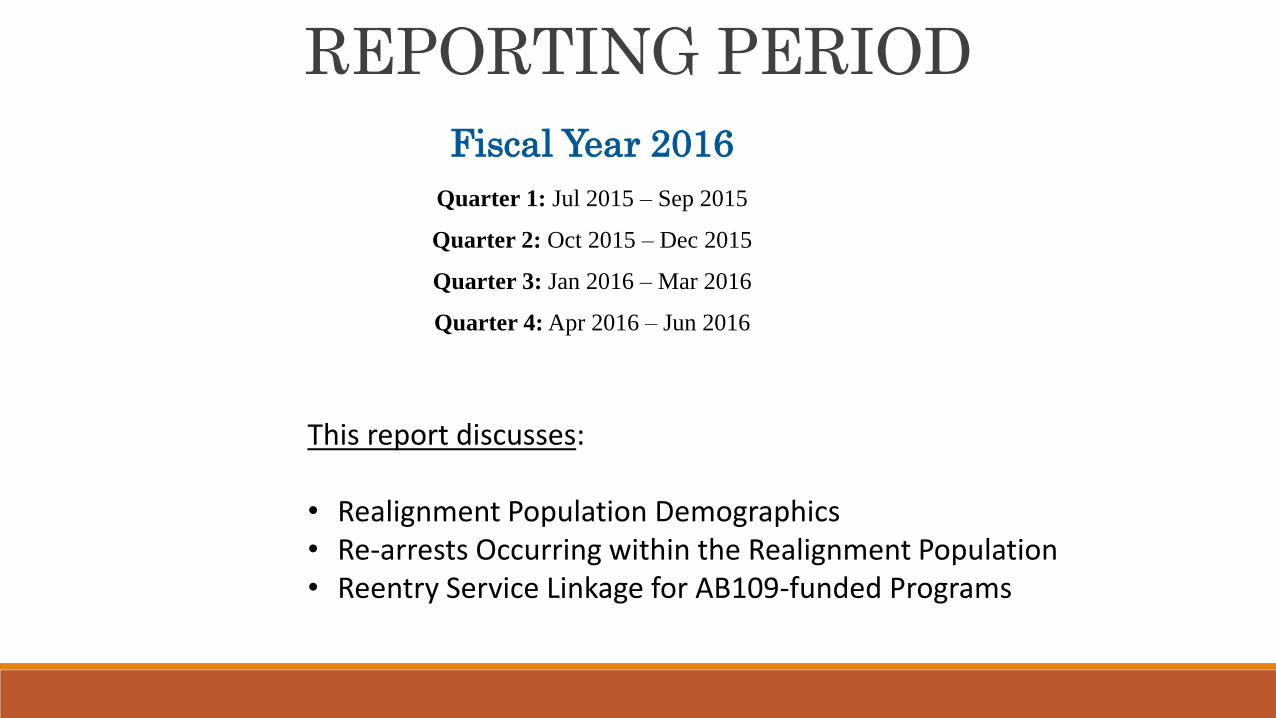
This report discusses:
• Realignment Population Demographics• Re-arrests Occurring within the Realignment Population• Reentry Service Linkage for AB109-funded Programs
Fiscal Year 2016
Quarter 1: Jul 2015 – Sep 2015
Quarter 2: Oct 2015 – Dec 2015
Quarter 3: Jan 2016 – Mar 2016
Quarter 4: Apr 2016 – Jun 2016
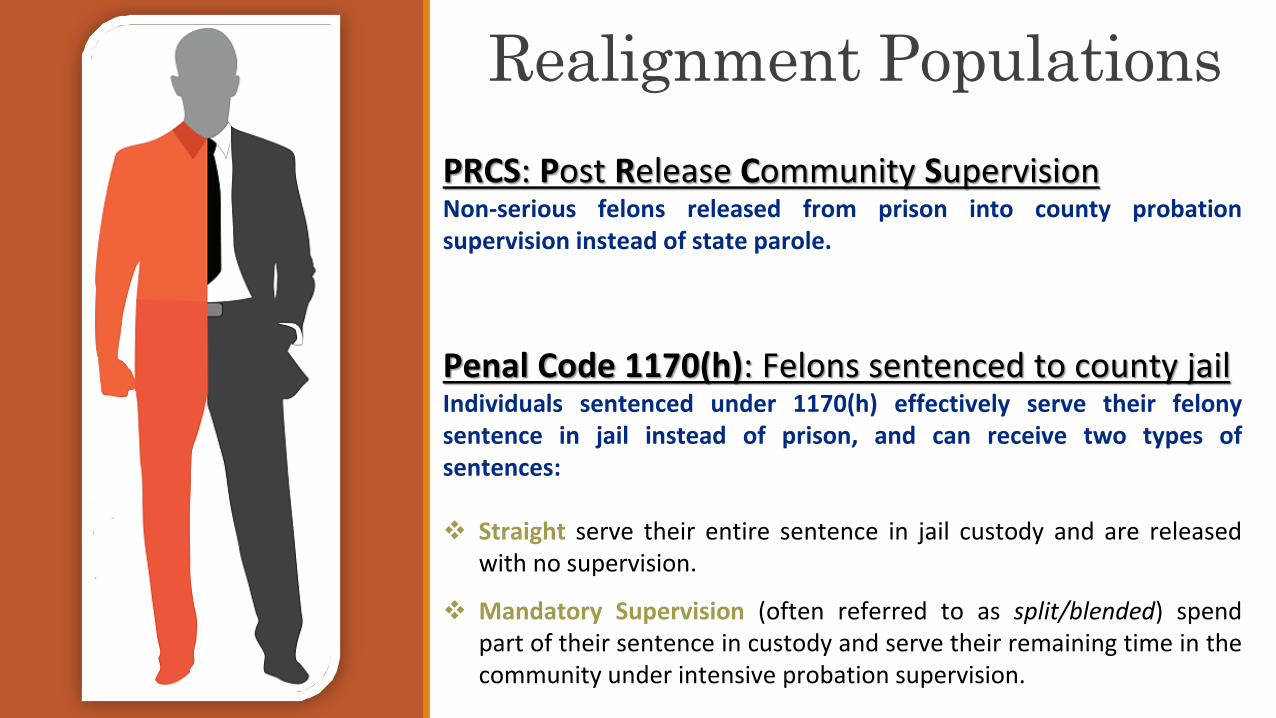
PRCS: Post Release Community SupervisionNon-serious felons released from prison into county probationsupervision instead of state parole.
Penal Code 1170(h): Felons sentenced to county jailIndividuals sentenced under 1170(h) effectively serve their felonysentence in jail instead of prison, and can receive two types ofsentences:
Straight serve their entire sentence in jail custody and are releasedwith no supervision.
Mandatory Supervision (often referred to as split/blended) spendpart of their sentence in custody and serve their remaining time in thecommunity under intensive probation supervision.
Realignment Populations

Realignment SnapshotOCTOBER 2011 – JUNE 2016
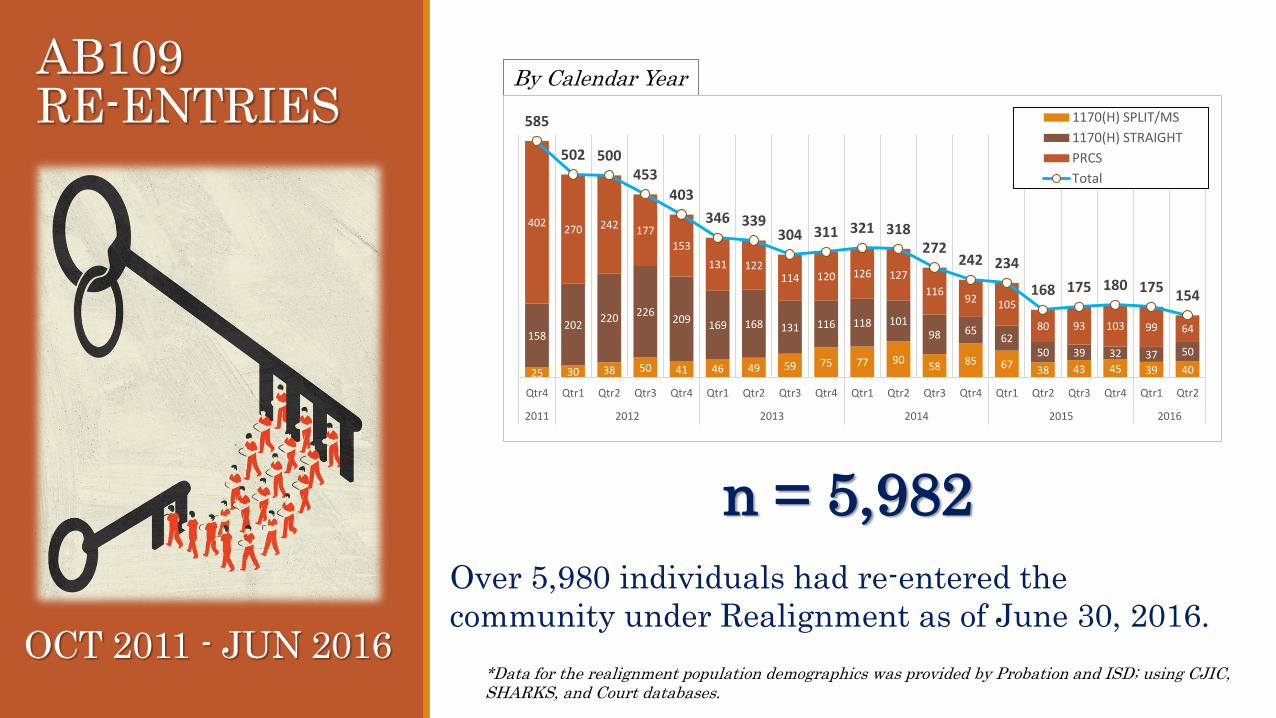
AB109RE-ENTRIES
Over 5,980 individuals had re-entered the
community under Realignment as of June 30, 2016.
n = 5,982
OCT 2011 - JUN 2016*Data for the realignment population demographics was provided by Probation and ISD; using CJIC, SHARKS, and Court databases.
By Calendar Year
25 30 38 50 41 46 49 59 75 77 9058 85 67 38 43 45 39 40
158202
220226
209169 168 131 116 118 101
98 6562
50 39 32 37 50
402270 242 177
153
131 122114 120 126 127
11692 105
80 93 103 99 64
585
502 500453
403
346 339304 311 321 318
272242 234
168 175 180 175154
Qtr4 Qtr1 Qtr2 Qtr3 Qtr4 Qtr1 Qtr2 Qtr3 Qtr4 Qtr1 Qtr2 Qtr3 Qtr4 Qtr1 Qtr2 Qtr3 Qtr4 Qtr1 Qtr2
2011 2012 2013 2014 2015 2016
1170(H) SPLIT/MS
1170(H) STRAIGHT
PRCS
Total
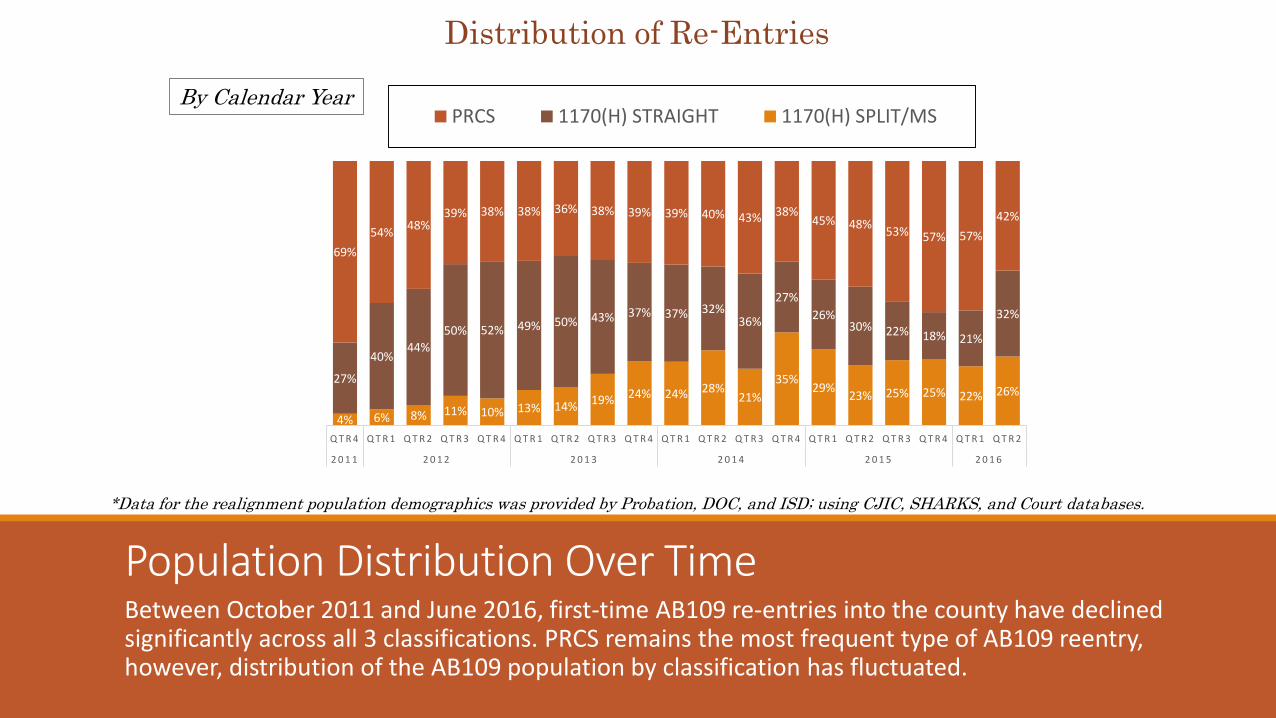
Population Distribution Over TimeBetween October 2011 and June 2016, first-time AB109 re-entries into the county have declined significantly across all 3 classifications. PRCS remains the most frequent type of AB109 reentry, however, distribution of the AB109 population by classification has fluctuated.
Distribution of Re-Entries
*Data for the realignment population demographics was provided by Probation, DOC, and ISD; using CJIC, SHARKS, and Court databases.
By Calendar Year
4% 6% 8% 11% 10% 13% 14% 19% 24% 24% 28%21%
35%29%
23% 25% 25% 22% 26%27%
40%44%
50% 52% 49% 50% 43% 37% 37% 32%36%
27%
26%30% 22% 18% 21%
32%
69%
54%48%
39% 38% 38% 36% 38% 39% 39% 40% 43% 38%45% 48%
53% 57% 57%
42%
Q T R 4 Q T R 1 Q T R 2 Q T R 3 Q T R 4 Q T R 1 Q T R 2 Q T R 3 Q T R 4 Q T R 1 Q T R 2 Q T R 3 Q T R 4 Q T R 1 Q T R 2 Q T R 3 Q T R 4 Q T R 1 Q T R 2
2 0 1 1 2 0 1 2 2 0 1 3 2 0 1 4 2 0 1 5 2 0 1 6
PRCS 1170(H) STRAIGHT 1170(H) SPLIT/MS
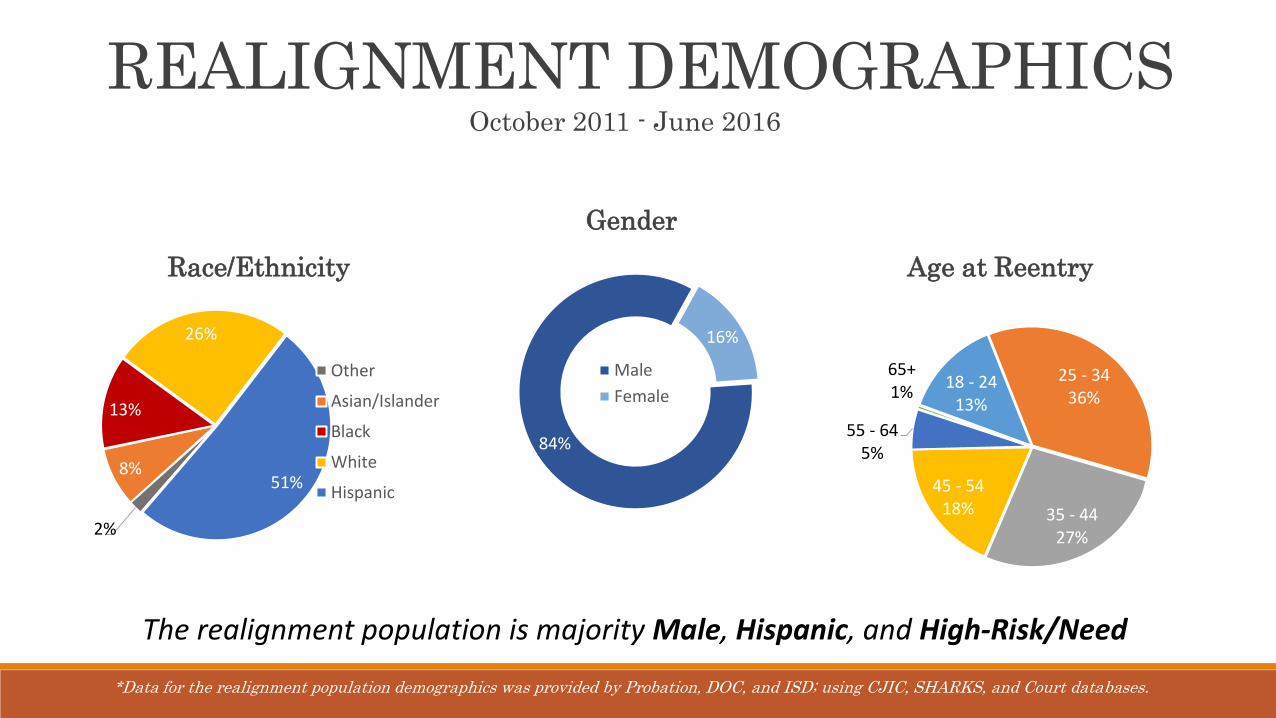
REALIGNMENT DEMOGRAPHICS
The realignment population is majority Male, Hispanic, and High-Risk/Need
*Data for the realignment population demographics was provided by Probation, DOC, and ISD; using CJIC, SHARKS, and Court databases.
October 2011 - June 2016
Race/Ethnicity
Gender
Age at Reentry
84%
16%
Male
Female
2%
8%
13%
26%
51%
Other
Asian/Islander
Black
White
Hispanic
18 - 2413%
25 - 3436%
35 - 4427%
45 - 5418%
55 - 645%
65+1%

REALIGNMENT DEMOGRAPHICS
*Data for the realignment population demographics was provided by Probation, DOC, and ISD; using CJIC, SHARKS, and Court databases.
October 2011 - June 2016
Initial Classification CAIS Risk Level
High52%
Low7%
Moderate13%
NA28%
High Risk ~ 72%
17%
37%
46%1170(H) SPLIT/MS
1170(H) STRAIGHT
PRCS

Supervision CaseloadsAS OF JUNE 30, 2016
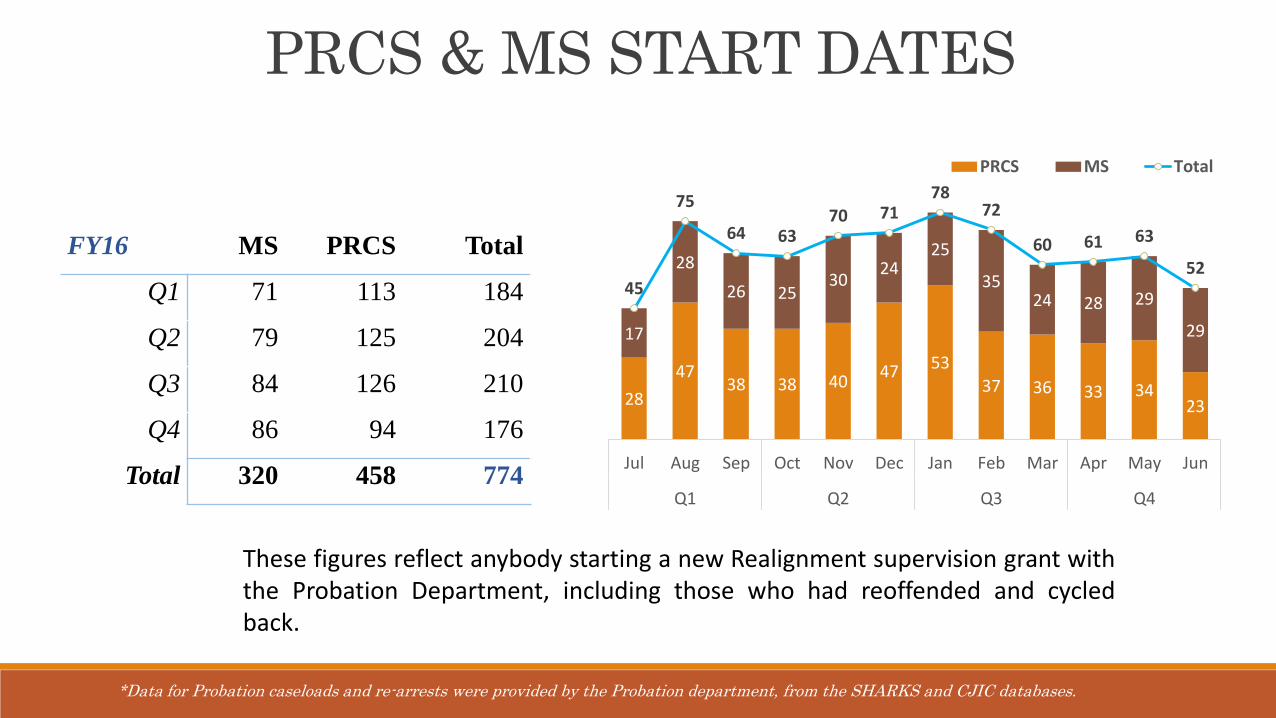
PRCS & MS START DATES
These figures reflect anybody starting a new Realignment supervision grant withthe Probation Department, including those who had reoffended and cycledback.
*Data for Probation caseloads and re-arrests were provided by the Probation department, from the SHARKS and CJIC databases.
FY16 MS PRCS Total
Q1 71 113 184
Q2 79 125 204
Q3 84 126 210
Q4 86 94 176
Total 320 458 774
28
4738 38 40
47 5337 36 33 34
23
17
28
26 2530
2425
3524 28 29
29
45
75
64 6370 71
7872
60 61 63
52
Jul Aug Sep Oct Nov Dec Jan Feb Mar Apr May Jun
Q1 Q2 Q3 Q4
PRCS MS Total

AB109 PROBATION CASELOADPRCS MS Total
Caseload 991 (68%) 469 (32%) 1,460
There were 1,460 AB109 clients on Probation’sRealignment caseload
PRCS was 68% of the caseload, MS was 32% of thecaseload
69% of AB109 cases were active, 31% had benchwarrants
35% of PRCS clients had bench warrants, comparedto 20% for MS clients
640 (65%)
373 (80%) 1,460
(69%)
351 (35%)
96 (20%) 447
(31%)
PRCS MS Total
Active Bench Warrant
n = 1,008 n = 465 n = 1,473
*Data for Probation caseloads and re-arrests were provided by the Probation department, from the SHARKS and CJIC databases.
As of June 30, 2016
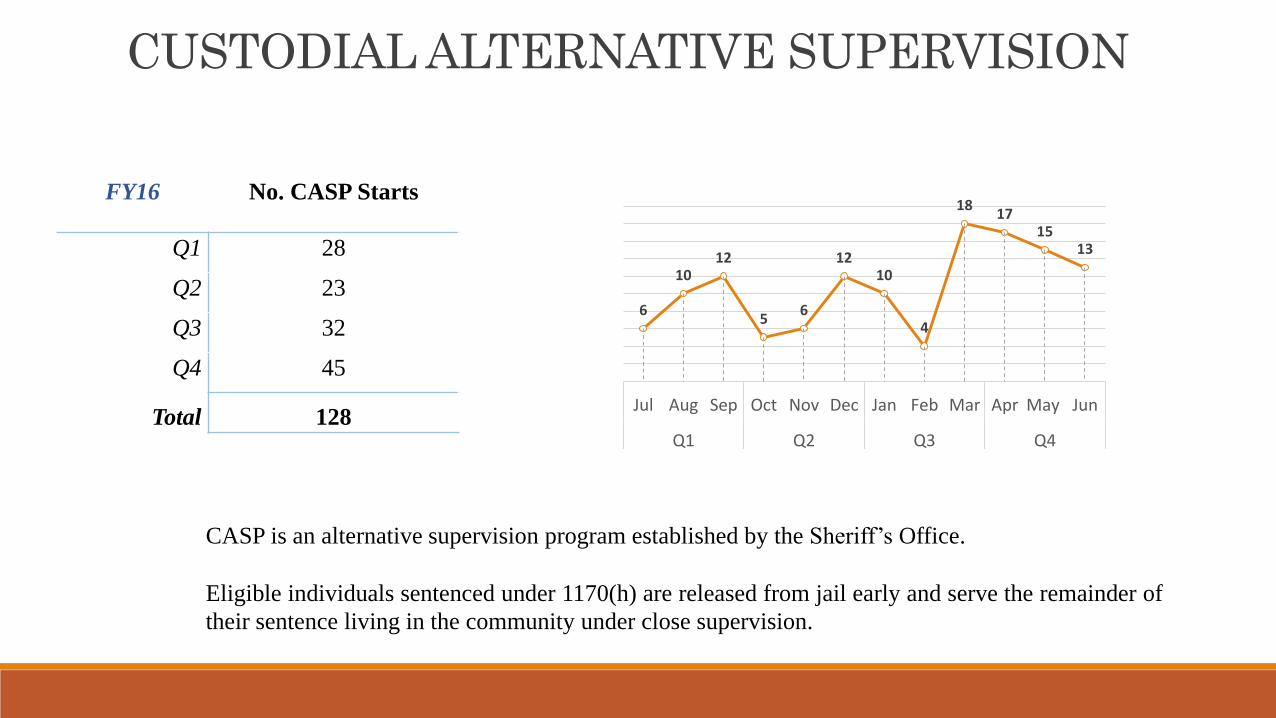
CUSTODIAL ALTERNATIVE SUPERVISION
CASP is an alternative supervision program established by the Sheriff’s Office.
Eligible individuals sentenced under 1170(h) are released from jail early and serve the remainder of
their sentence living in the community under close supervision.
FY16 No. CASP Starts
Q1 28
Q2 23
Q3 32
Q4 45
Total 128
6
1012
56
1210
4
1817
1513
Jul Aug Sep Oct Nov Dec Jan Feb Mar Apr May Jun
Q1 Q2 Q3 Q4

CUSTODIAL ALTERNATIVE SUPERVISION
CASP Outcome No. %
Successful Completion 103 58%
Ongoing (TBD) 37 21%
Program Failure 16 9%
New Law Violation (NLV) - Felony 8 5%
Drug/Alcohol Test Failure 8 5%
Technical/other 4 2%
Absconded** 1 1%
Total 177 100%
Success73%
NLV6%
Other Failure
21%
NLV = New Law Violation (Recidivism)
Known Outcomes

Re-ArrestsJULY 2015 – JUNE 2016
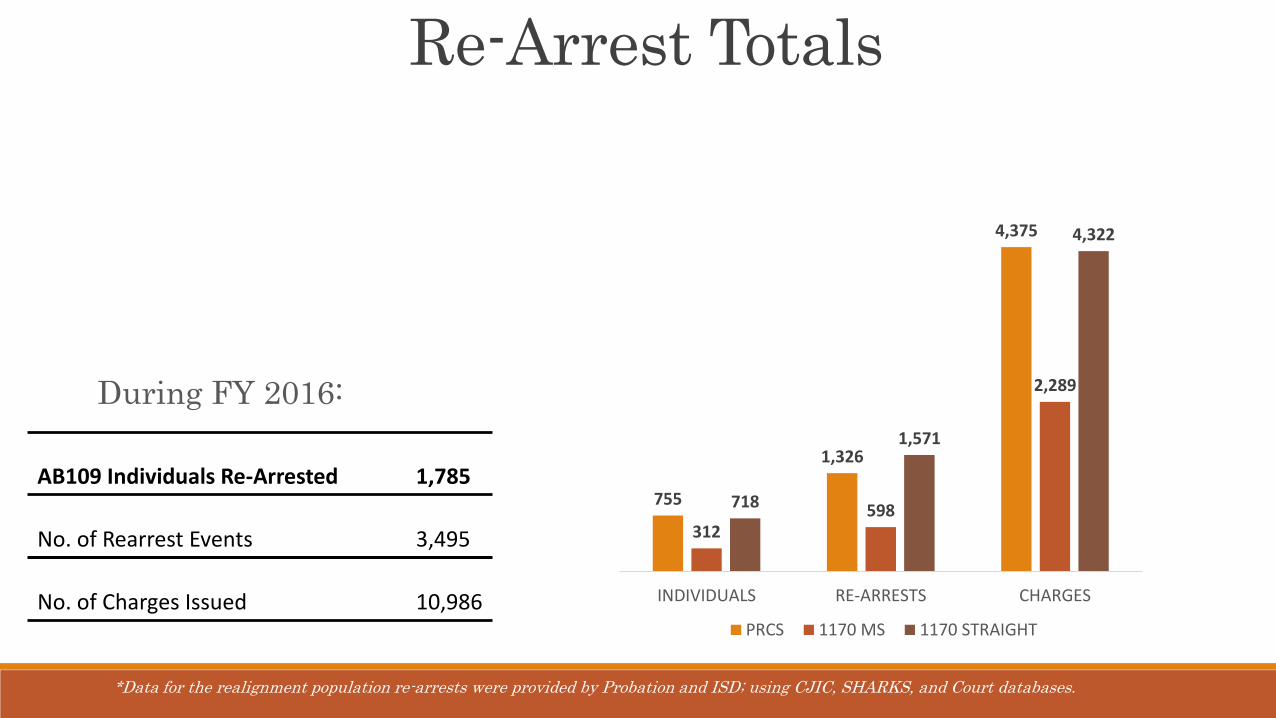
Re-Arrest Totals
During FY 2016:
AB109 Individuals Re-Arrested 1,785
No. of Rearrest Events 3,495
No. of Charges Issued 10,986
*Data for the realignment population re-arrests were provided by Probation and ISD; using CJIC, SHARKS, and Court databases.
755
1,326
4,375
312598
2,289
718
1,571
4,322
INDIVIDUALS RE-ARRESTS CHARGES
PRCS 1170 MS 1170 STRAIGHT
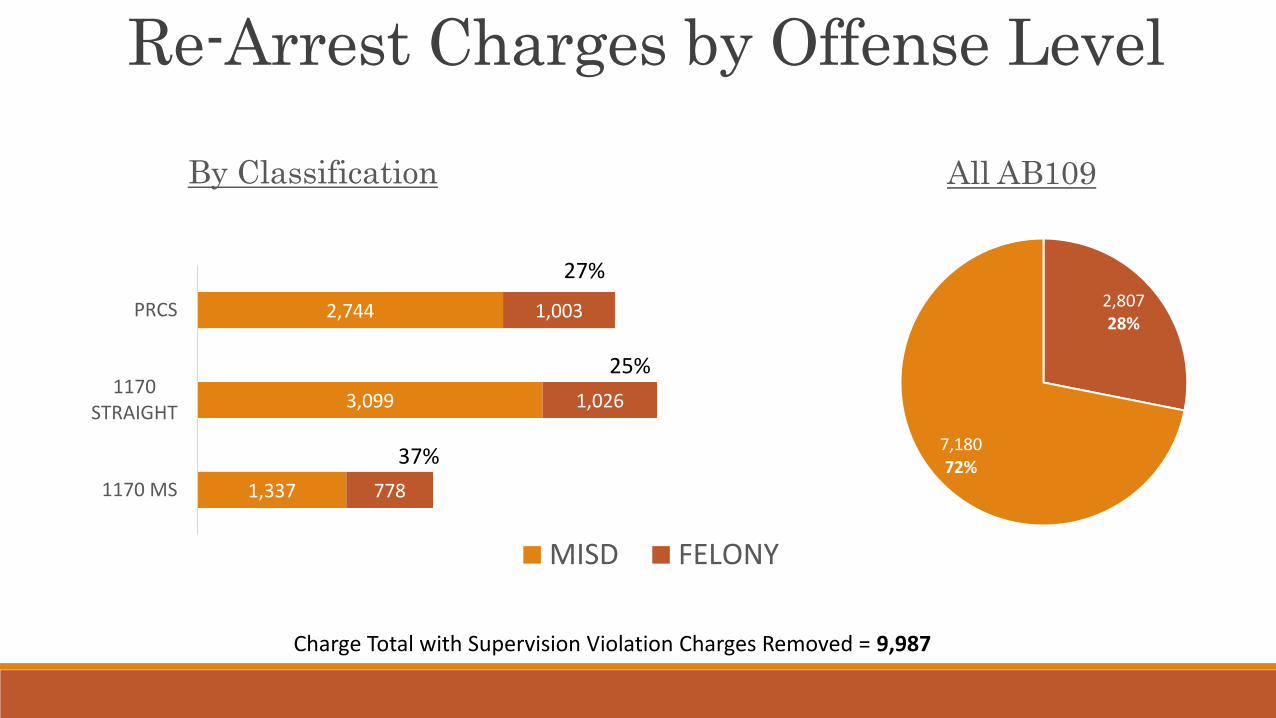
Re-Arrest Charges by Offense Level
By Classification All AB109
1,337
3,099
2,744
778
1,026
1,003
1170 MS
1170STRAIGHT
PRCS
MISD FELONY
27%2,80728%
7,18072%
25%
37%
Charge Total with Supervision Violation Charges Removed = 9,987
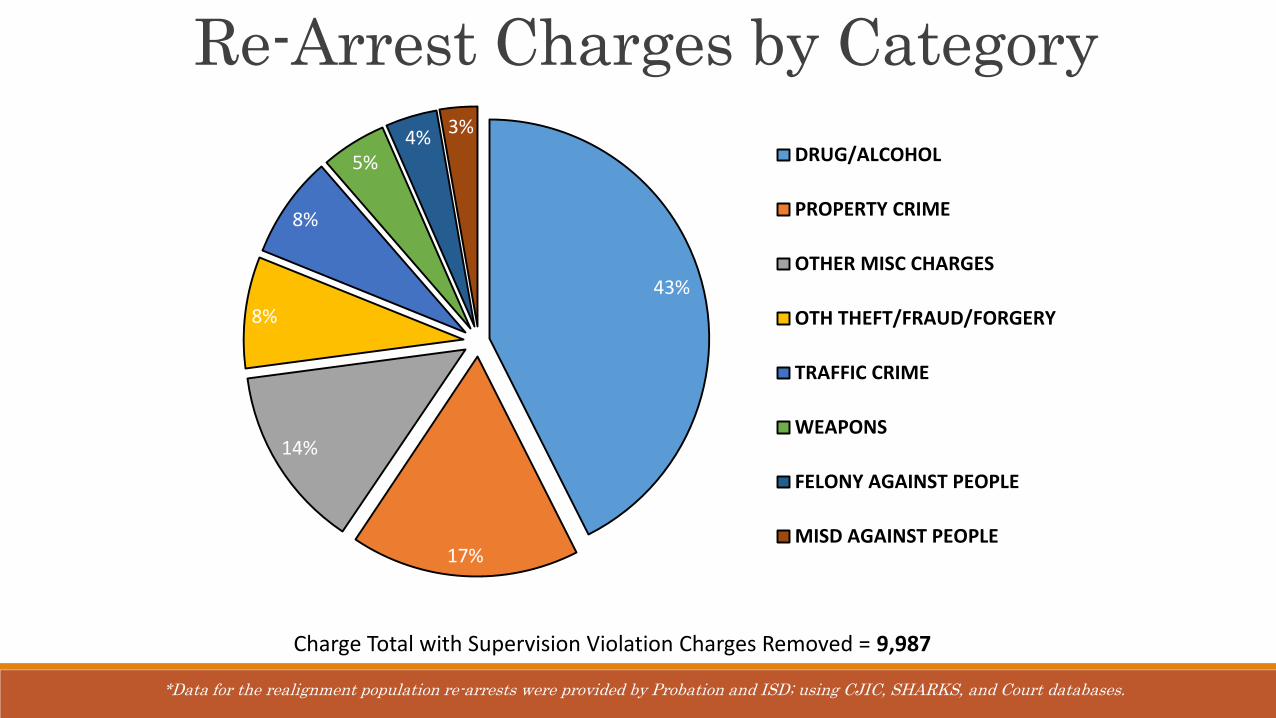
Re-Arrest Charges by Category
Charge Total with Supervision Violation Charges Removed = 9,987
*Data for the realignment population re-arrests were provided by Probation and ISD; using CJIC, SHARKS, and Court databases.
43%
17%
14%
8%
8%
5%4%
3%
DRUG/ALCOHOL
PROPERTY CRIME
OTHER MISC CHARGES
OTH THEFT/FRAUD/FORGERY
TRAFFIC CRIME
WEAPONS
FELONY AGAINST PEOPLE
MISD AGAINST PEOPLE
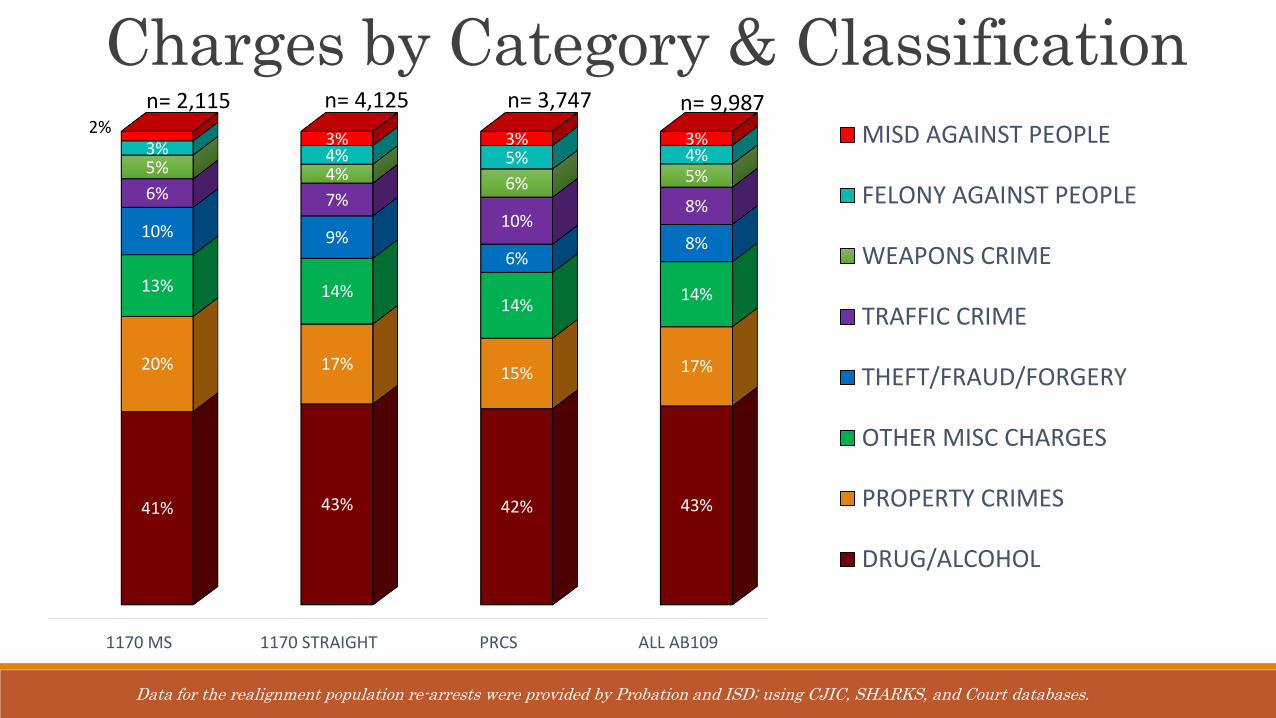
1170 MS 1170 STRAIGHT PRCS ALL AB109
41% 43% 42% 43%
20% 17%15% 17%
13% 14%14%
14%
10% 9%6%
8%
6% 7%10%
8%
5% 4% 6% 5%
3% 4% 5% 4%
2%3% 3% 3% MISD AGAINST PEOPLE
FELONY AGAINST PEOPLE
WEAPONS CRIME
TRAFFIC CRIME
THEFT/FRAUD/FORGERY
OTHER MISC CHARGES
PROPERTY CRIMES
DRUG/ALCOHOL
Charges by Category & Classificationn= 2,115 n= 4,125 n= 3,747 n= 9,987
Data for the realignment population re-arrests were provided by Probation and ISD; using CJIC, SHARKS, and Court databases.

Reentry ServicesJULY 2015 – JUNE 2016

Probation Contracted Services
Data for Probation’s contracted VocEd and CBT service providers were provided by the Probation Department
Vocational Education Services
PROVIDER REFERRED ENROLLED
CC 29 68
CTC 440 103
Total 469 171
10
7
14
9
14
35
20
91
64
11
32
0 20 40 60 80 100 120
GED
Construction Green Focus
Vocational Education
Job Ready Job Placement
Focus for Work
Employment Workshops
Dom Violence Services
CC CTC
9
25
32
45
20
98
78

Probation Contracted Services
Data for Probation’s contracted VocEd and CBT service providers were provided by the Probation Department
Cognitive Behavioral Therapy (CBT)
191 clients enrolled in CBT during the reporting period, July 1, 2015 to June 30, 2016.
78 clients successfully completed the program for this reporting period.
The majority of the referrals originated from PRCS.
This program is reported by FCS as being at 70% capacity and the clients have been fairly consistent in their
attendance
The program has demonstrated an 80% retention rate once the clients have completed their intake. However, it
is reported by FCS a 50% completion rate due to a few factors such as, new jobs, housing issues, family issues,
or re-arrests.
One of the main service gaps between initial referral and enrollment is making contact with clients in order to
follow up with a referral to the program, many clients cannot be reached.
384 Clients successfully completed since the program's inception in September 2011.
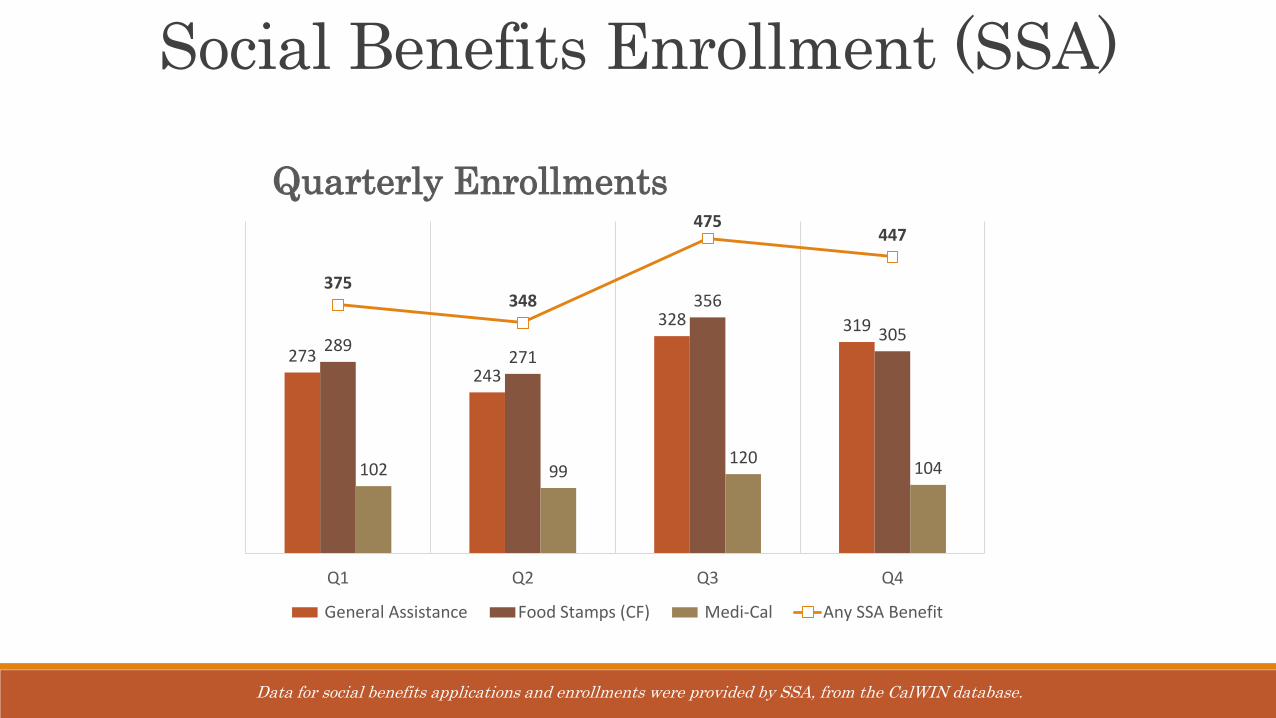
Social Benefits Enrollment (SSA)
Quarterly Enrollments
Data for social benefits applications and enrollments were provided by SSA, from the CalWIN database.
273243
328 319289
271
356
305
102 99120
104
375348
475447
Q1 Q2 Q3 Q4
General Assistance Food Stamps (CF) Medi-Cal Any SSA Benefit
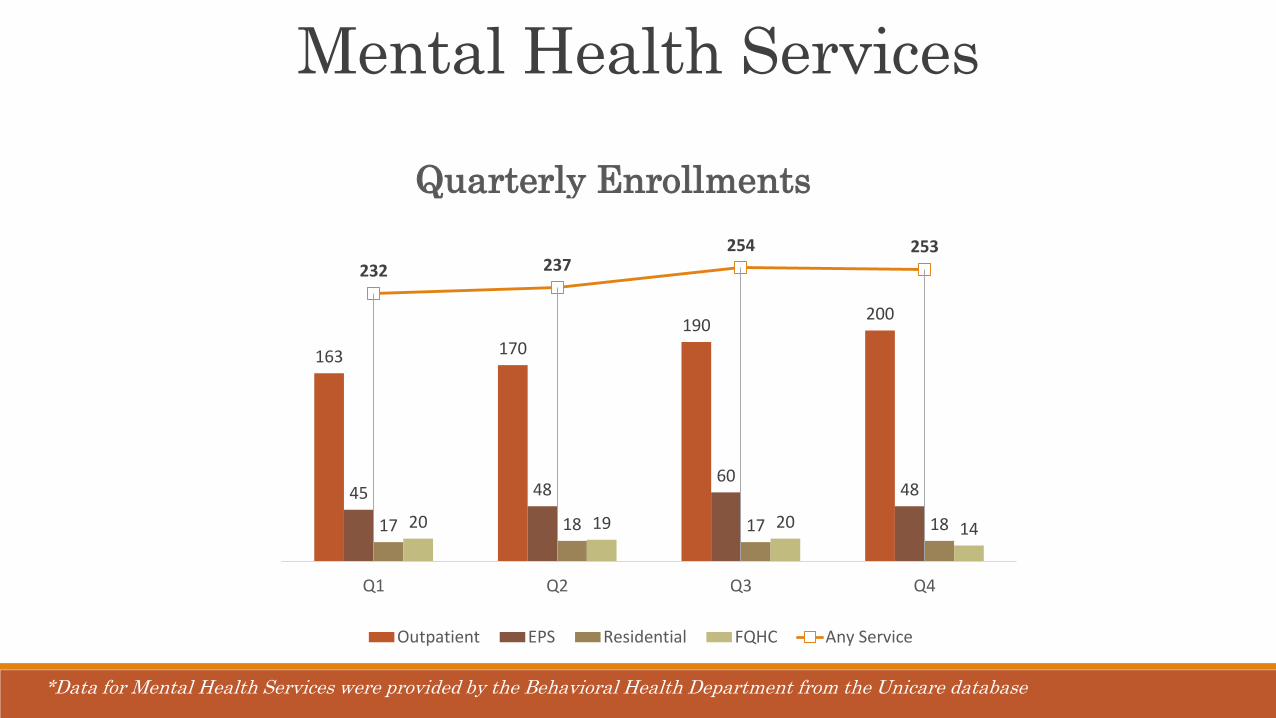
Mental Health Services
*Data for Mental Health Services were provided by the Behavioral Health Department from the Unicare database
Quarterly Enrollments
163 170190
200
45 4860
48
17 18 17 1820 19 20 14
232 237254 253
Q1 Q2 Q3 Q4
Outpatient EPS Residential FQHC Any Service

Substance Use Treatment Services
*Data for Substance Use Treatment Services were provided from Behavioral Health Department’s Unicare database
Quarterly SUTS Admissions
166
321
114
521
169138
102
350
101 113
55
237
76
135
71
243
Residential Outpatient Transitional Housing Any Service
Q1 Q2 Q3 Q4
Reentry Clients Treated 1,057
Admissions (services) 1,684
AB109 Clients Identified 469 (44%)
Admitted Once 686 (65%)
Admitted Multiple Times 373 (35%)

ORS Contracted Services
The Office of Reentry Services contracts with community-based
organizations to provide education, employment, family reunification,
health & well-being, and legal services. AB 109 and non-AB 109 clients
are linked to services based on referrals from the Reentry Resource
Center partners.
* Data Sources: Contracted services from Office of Reentry Services, Office of Supportive Housing and Faith-Based Reentry Collaborative*
Q1 Q2 Q3 Q4
FY
2016
Education Services 0 7 12 3 22
Employment Services 32 40 21 20 113
Family Reunification Services 1 0 0 0 1
Health & Well-Being Services 0 16 10 16 42
Legal Services 8 14 3 8 33

Faith-Based Re-Entry Services
The Faith-Based Reentry Collaborative consists of four faith-based reentry
centers which serve clients who are eligible for reentry services and partners
with the SCC Reentry Resource Center to increase the county’s capacity for
service-linkage.
The FBRC offers a variety of wrap-around services, centered around casemanagement and also provides one-touch referrals and services.
* Data Sources: Contracted services from Office of Reentry Services, Office of Supportive Housing and Faith-Based Reentry Collaborative*
Q1 Q2 Q3 Q4
FY
2016
Bible Way 7 21 8 12 48
Bridges of Hope 2 4 17 3 26
Good Samaritan 14 12 22 22 70
Mission Possible 12 10 16 14 52
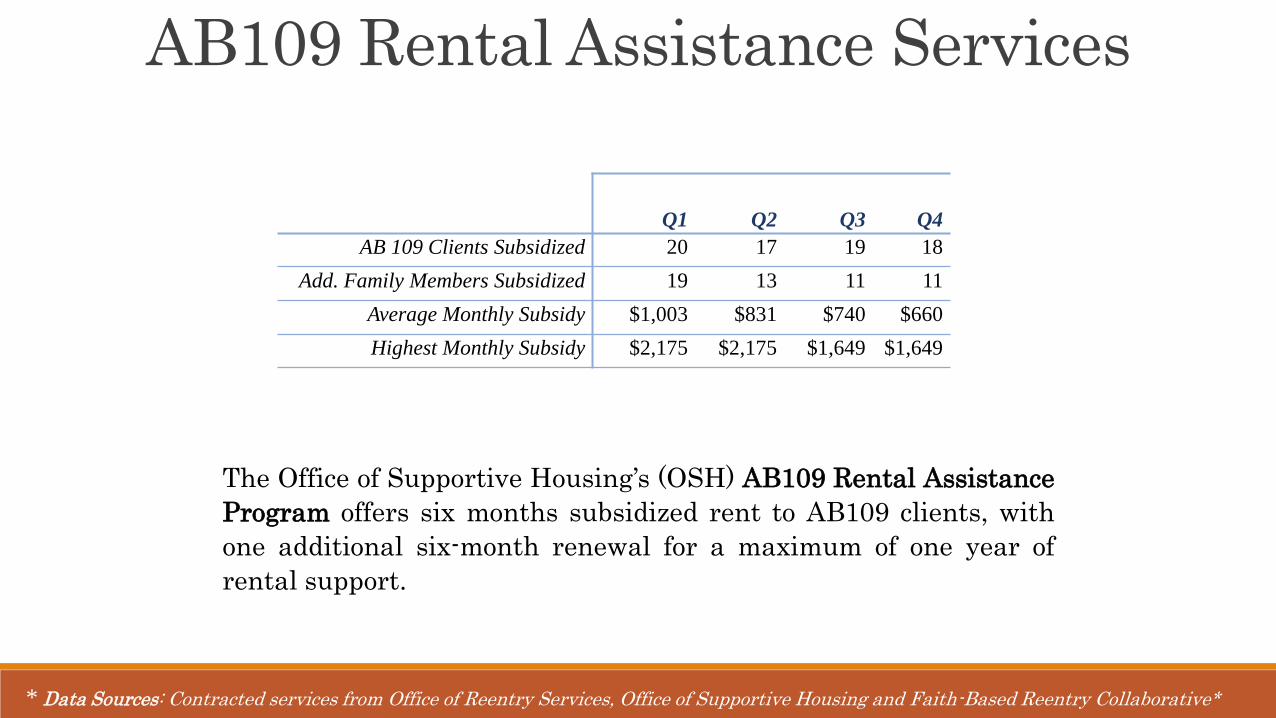
AB109 Rental Assistance Services
The Office of Supportive Housing’s (OSH) AB109 Rental Assistance
Program offers six months subsidized rent to AB109 clients, with
one additional six-month renewal for a maximum of one year of
rental support.
* Data Sources: Contracted services from Office of Reentry Services, Office of Supportive Housing and Faith-Based Reentry Collaborative*
Q1 Q2 Q3 Q4
AB 109 Clients Subsidized 20 17 19 18
Add. Family Members Subsidized 19 13 11 11
Average Monthly Subsidy $1,003 $831 $740 $660
Highest Monthly Subsidy $2,175 $2,175 $1,649 $1,649
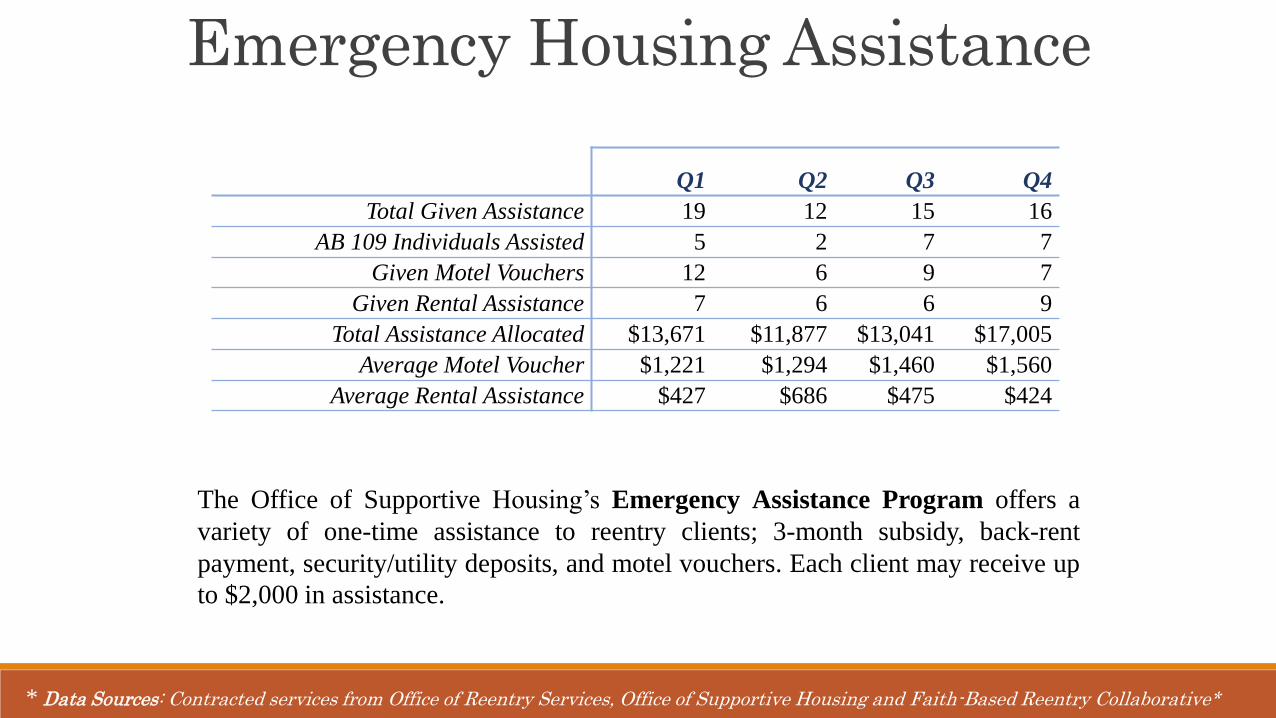
Emergency Housing Assistance
The Office of Supportive Housing’s Emergency Assistance Program offers a
variety of one-time assistance to reentry clients; 3-month subsidy, back-rent
payment, security/utility deposits, and motel vouchers. Each client may receive up
to $2,000 in assistance.
* Data Sources: Contracted services from Office of Reentry Services, Office of Supportive Housing and Faith-Based Reentry Collaborative*
Q1 Q2 Q3 Q4
Total Given Assistance 19 12 15 16
AB 109 Individuals Assisted 5 2 7 7
Given Motel Vouchers 12 6 9 7
Given Rental Assistance 7 6 6 9
Total Assistance Allocated $13,671 $11,877 $13,041 $17,005
Average Motel Voucher $1,221 $1,294 $1,460 $1,560
Average Rental Assistance $427 $686 $475 $424

Other Supportive Housing Services
The Prop 36 and Parolee Special Needs (PSN) programs house individuals released from prison through
subsidized tenant-based rental assistance. Clients hold their own lease and pay part of the rent each
month. These programs also offer one-time assistance (OTA) for expenses similar to the EAP.
Rapid Re-Housing for Families and Children is a shelter program that houses families for up to 90 days
at a family shelter while a case manager works with them locate permanent housing and tackle other
obstacles such as employment.
Community Reintegration has three programs (North, Central, and South) which are housing programs
that utilize case management and partnerships between the County and the cities of Palo Alto, San
Jose, Morgan Hill, and Gilroy.
* Data Sources: Contracted services from Office of Reentry Services, Office of Supportive Housing and Faith-Based Reentry Collaborative*
Q1 Q2 Q3 Q4
Prop 36 1-YR 1 2 2 0
Parole Special Needs 2-YR 1 0 0 1
Parole Special Needs 1-time 0 0 0 0
Rapid Re-Housing (families) 2 3 10 5
Community Reintegration North 12 5 1 0
Community Reintegration Central 29 0 1 0
Community Reintegration South 3 1 3 5
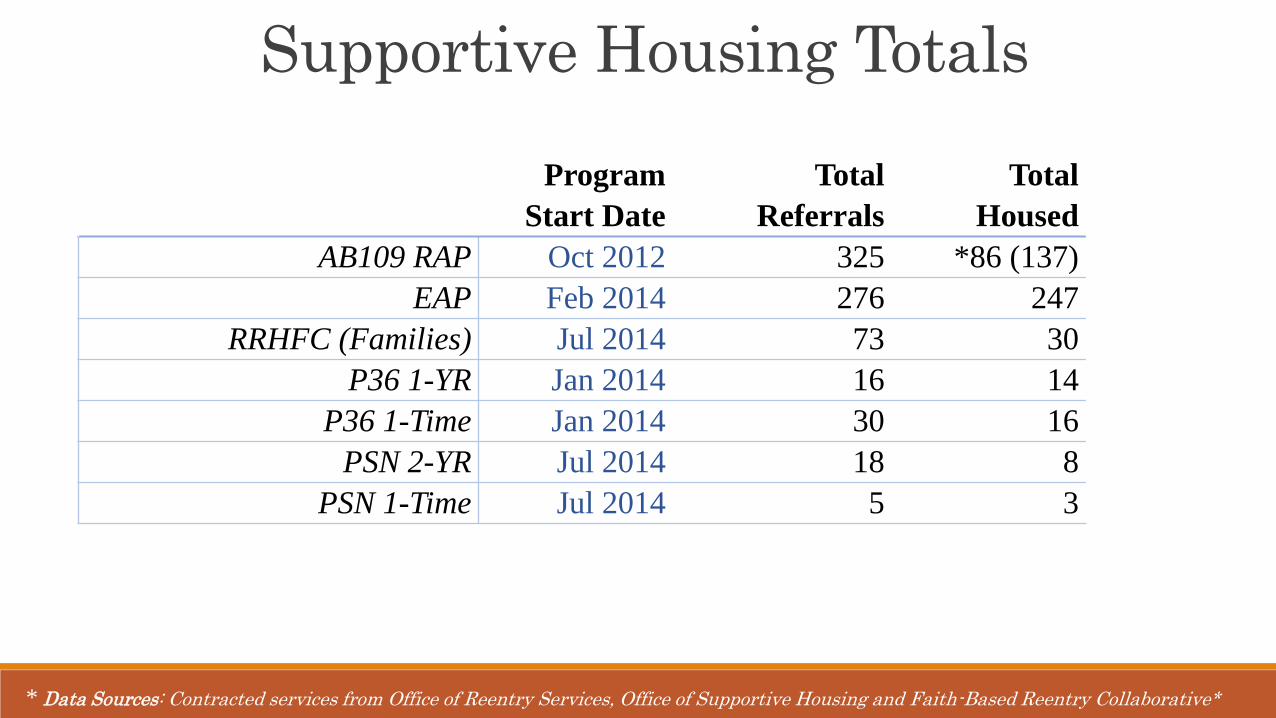
Supportive Housing Totals
* Data Sources: Contracted services from Office of Reentry Services, Office of Supportive Housing and Faith-Based Reentry Collaborative*
Program
Start Date
Total
Referrals
Total
Housed
AB109 RAP Oct 2012 325 *86 (137)
EAP Feb 2014 276 247
RRHFC (Families) Jul 2014 73 30
P36 1-YR Jan 2014 16 14
P36 1-Time Jan 2014 30 16
PSN 2-YR Jul 2014 18 8
PSN 1-Time Jul 2014 5 3
Reentry Center ClientsJULY 2015 – JUNE 2016
4,648 UNIQUE CLIENTS
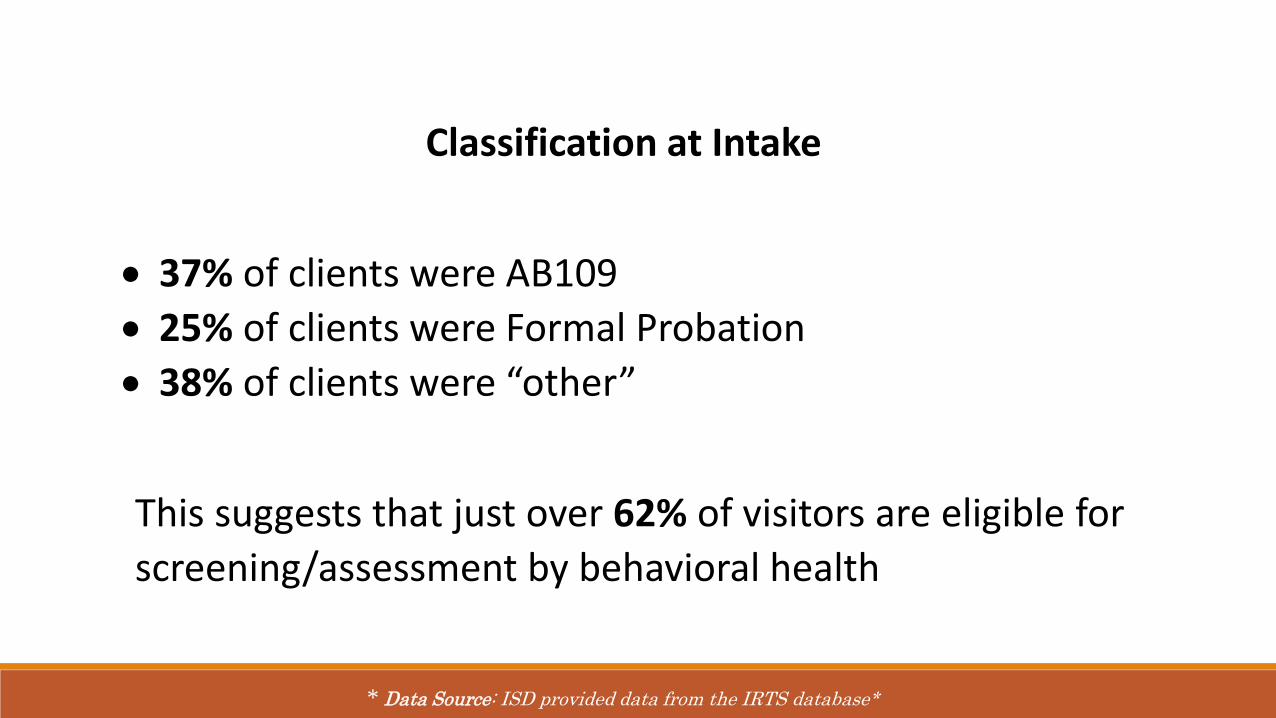
Classification at Intake
37% of clients were AB109
25% of clients were Formal Probation
38% of clients were “other”
This suggests that just over 62% of visitors are eligible for
screening/assessment by behavioral health
* Data Source: ISD provided data from the IRTS database*
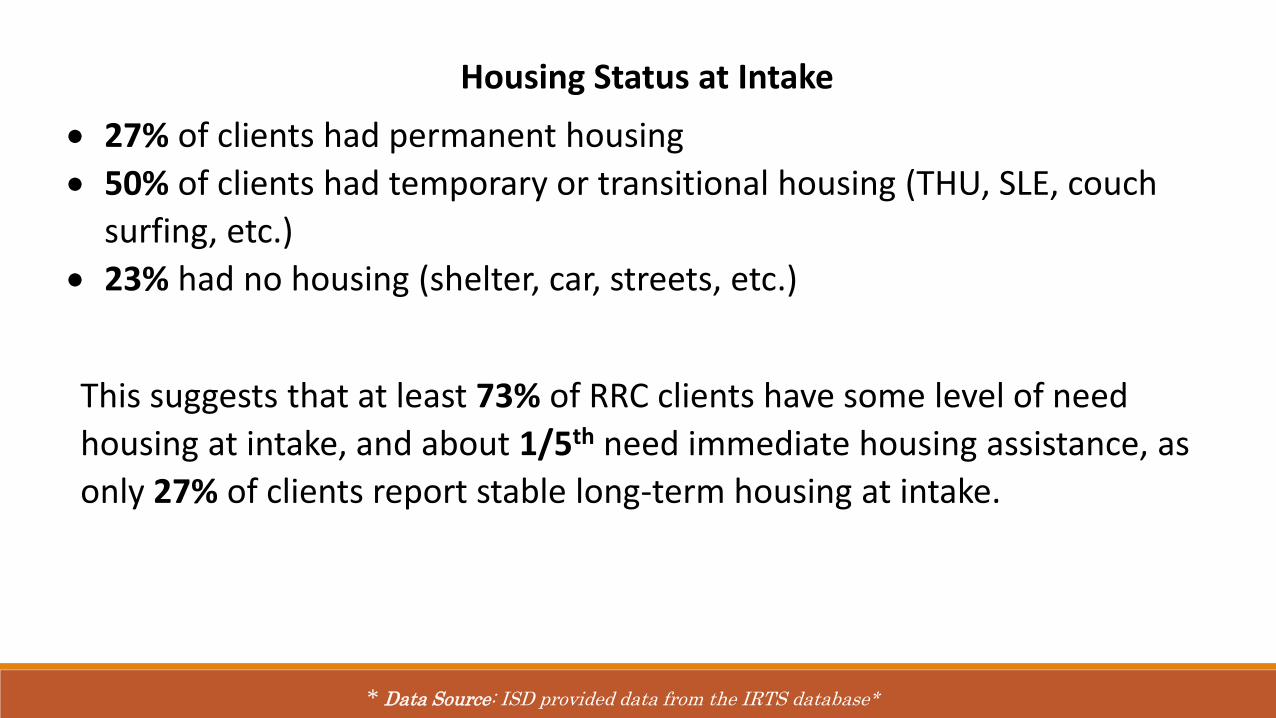
Housing Status at Intake
27% of clients had permanent housing
50% of clients had temporary or transitional housing (THU, SLE, couch
surfing, etc.)
23% had no housing (shelter, car, streets, etc.)
This suggests that at least 73% of RRC clients have some level of need
housing at intake, and about 1/5th need immediate housing assistance, as
only 27% of clients report stable long-term housing at intake.
* Data Source: ISD provided data from the IRTS database*
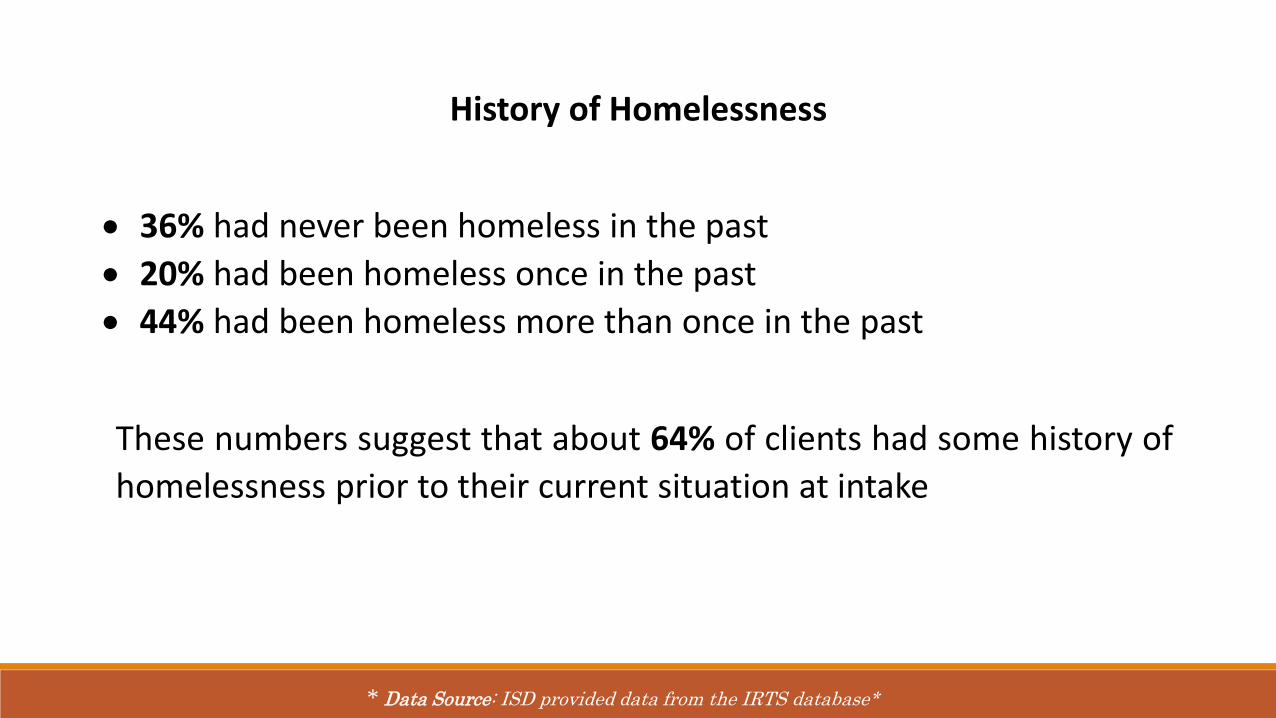
History of Homelessness
36% had never been homeless in the past
20% had been homeless once in the past
44% had been homeless more than once in the past
These numbers suggest that about 64% of clients had some history of
homelessness prior to their current situation at intake
* Data Source: ISD provided data from the IRTS database*
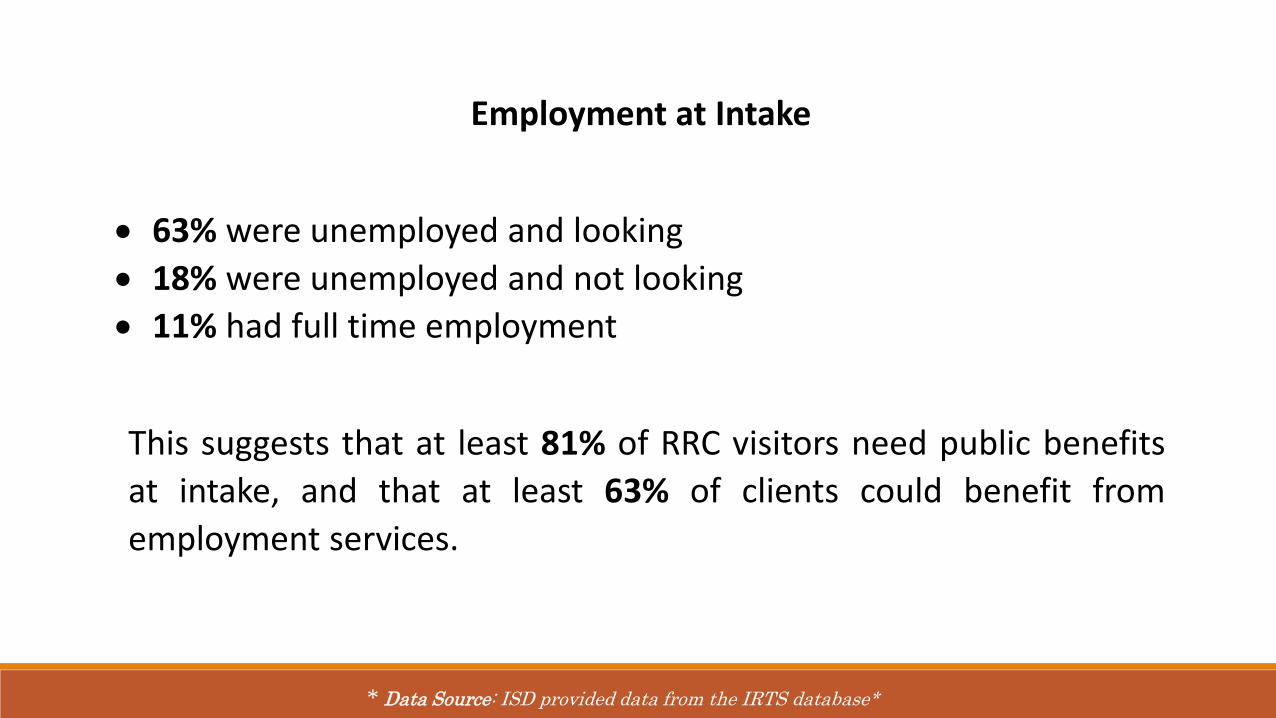
Employment at Intake
63% were unemployed and looking
18% were unemployed and not looking
11% had full time employment
This suggests that at least 81% of RRC visitors need public benefits
at intake, and that at least 63% of clients could benefit from
employment services.
* Data Source: ISD provided data from the IRTS database*

RRC Service Requests
Total
Requests
Individuals
Requesting
General Assistance 5,320 2,356
Food Stamps 4,550 2,306
Medical Mobile Unit 2,374 1,129
Drug/Alcohol Services 1,920 1,217
Healthcare 1,789 1,409
Housing 1,741 1,239
Peer Mentor Support 1,576 1,087
Clothing Assistance 1,518 1,071
ID Voucher 1,309 1,094
Employment 1,281 1,045
* Data Source: ISD provided data from the IRTS database*

RRC Service Requests
Requested Screened Referred/
Linked
Drug and Alcohol Services 401 284 233
Mental Health Services 249 126 99
Housing Services 338 127 127
* Data Source: ISD provided data from the IRTS database*
FY16 Q4
APRIL – JUNE 2016

QUESTIONS