public school teachers’ perspectives of student-based
TRANSCRIPT

i
Public School Teachers’ Perspectives of Student-Based Budgeting:
A Qualitative Case Study
by
Andrea S. Parker
Dissertation Submitted to the Doctoral Program
of the American College of Education
in partial fulfillment of the requirements for the degree of
DOCTOR OF EDUCATION
March 2021

ii
Public School Teachers’ Perspectives of Student-Based Budgeting: A Qualitative Case Study
by
Andrea S. Parker
Approved by:
Dissertation Chair: Doyle Phillips, Ed.D.
Committee Member: Sandra Quiatkowski, Ph.D.

iii
Copyright © 2021
Andrea S. Parker

iv
Abstract
School funding is one strategy to ensure K–12 public education in the United States is equitable.
Access to equitable education is paramount to addressing the achievement gap between White
affluent Americans and low-income students of color. The perception of inequity in the public
school system was apparent before the 1954 Brown v. Board of Education of Topeka case when
segregation in public schools became unconstitutional. School funding models emerged. Under
most models, resources are distributed to schools by providing staff and designating money for
specific purposes. Student-based budgeting is a phenomenon because K–12 public schools are
funded based on the number of students enrolled in a specific school. A set amount of money is
earmarked per student. Under the model, additional funds may be given to low-income students,
students who have special needs, or students who are English language learners. The principal
has authority to allocate dollars for programming which best fits the school’s needs. Literature
addressing student-based budgeting from a quantitative context has highlighted educational and
financial advantages and disadvantages from a political or administrative perspective. A gap
exists regarding the perspectives of Illinois K–12 teachers. The equity theory, developed by John
Stacey Adams, framed the course of the qualitative case study. From the literature review,
themes emerged including education reform, school leadership, and student achievement. A
purposeful random sample of 27 teachers participated in the study. Data collection entailed
preliminary surveys, four online focus groups with transcription and member checking, and a
questionnaire given after the focus group. Using the survey may benefit the credibility of the
study because teachers who were unfamiliar with the budgeting formula were not sought to
participate in the focus group. Findings show inequity in low-income schools and schools with
low enrollment. The study may benefit educators, students, and lawmakers.

v
Dedication
I am dedicating this dissertation to my Lord and Savior Jesus Christ. As a woman of
sound faith, I know I can do nothing without the grace of God--my doctorate included. I
remember when I was younger and I would peruse through dissertations, and I would think that I
could never write a paper with the magnitude a dissertation requires. However, I know God said
He has not given us a spirit of fear, but love, peace and a sound mind. God has never forsaken
me. He has always given me the leverage, wisdom, stamina, and excitement I needed to
complete every goal. Sometimes I forget so fast the obstacles I overcame such as the fear of
buying my first home. Christ has been with me during the doctoral journey. When I got sleepy,
he rejuvenated me. When I got discouraged, he sent someone in my path who just earned their
doctorate and they provided solid advice.
I am additionally dedicating this dissertation to all the black women who have obtained
their doctorate before me. You look like me and your perseverance has bought me to this place. I
knew if you could achieve this level of expertise to bring more awareness in your field, then I
could follow suit. When times were challenging, and the illusion of moving backwards instead of
moving forward in this journey took hold, I thought of you. I said I cannot let my fellow black
queens down. We are a team. Completing my doctoral journey will remind and encourage
another black woman that earning her doctorate is not impossible.
I dedicate this dissertation to my fellow teachers who not only teach our students each
day, but advocate on their behalf. Teaching is a privilege, and I ultimately wrote this dissertation
on behalf of all the K-12 students who deserve a quality education regardless of geography, race,
ethnicity, or socioeconomic status. Our students deserve quality teachers, and educators, who are
probably the smartest and the most talented people in the world.

vi
Acknowledgements
I want to acknowledge all my professors in this endeavor who have given me sound
advice, motivation and convicted me when I was not performing to my fullest potential. You all
have gone above and beyond your call of duty. You did not give up on me even when at times I
wanted to. You felt my pain and heard my tears of anguish. Thankfully, none of it was in vain.
To you, I am forever grateful.
I want to acknowledge my mother who is my biggest supporter. One of my goals in life is
to always make you proud. This will not be the last thing I do either to make you happy either.
My accomplishment is your accomplishment. Thank you, mom, for always believing in me even
when I was unaware of what believing meant.
Next, I want to acknowledge my son who sacrificed along this journey with me. There
have been many days and weekends where our communication was minimal. I had to go back on
promises of going out to dinner, bowling, and weekend vacations. However, you understood my
goals and why I was doing this. Thank you for not judging me and not thinking I was a bad
mother. You are truly a joy and I hope this journey has made our bond stronger than ever before.
Last but never least, I want to acknowledge The American College of Education. You
have provided a space and opportunity for me to excel in the field of leadership. When looking
for credible institutions to earn my doctorate, I initially felt discouraged due to the prices and
how the hours of instruction conflicted with my full-time teaching position. After earning my
Masters in Educational Leadership from ACE, I prayed for the college to expand its course
offerings to include a doctoral program, and you did. The doctoral journey has been longer than
anticipated, but it was worth it. Failure has never been an option in this institution.

vii
Table of Contents
List of Tables ................................................................................................................................. xi
List of Figures ............................................................................................................................... xii
Chapter 1: Introduction ................................................................................................................... 1
Background of the Problem ................................................................................................ 2
Statement of the Problem .................................................................................................... 4
Purpose of the Study ........................................................................................................... 5
Significance of the Study .................................................................................................... 5
Research Questions ............................................................................................................. 6
Theoretical Framework ....................................................................................................... 6
Definitions of Terms ........................................................................................................... 7
Assumptions ........................................................................................................................ 9
Scope and Delimitations ................................................................................................... 10
Limitations ........................................................................................................................ 12
Chapter Summary ............................................................................................................. 13
Chapter 2: Literature Review ...................................................................................................... 14
Research Questions ........................................................................................................... 16
Literature Search Strategy................................................................................................. 20
Theoretical Framework ..................................................................................................... 21
Research Literature Review .............................................................................................. 25
School Reform ...................................................................................................... 26
Other U.S. Funding Models .................................................................................. 27
Laws and Policies ................................................................................................. 30

viii
Leadership Autonomy and Accountability ........................................................... 38
K–12 Equity in the Public School System ............................................................ 42
Student Achievement ............................................................................................ 47
The Gap in Literature ............................................................................................ 48
Chapter Summary ............................................................................................................. 49
Chapter 3: Methodology ............................................................................................................... 52
Research Design and Rationale ........................................................................................ 54
Role of the Researcher ...................................................................................................... 55
Research Procedures ......................................................................................................... 57
Population and Sample Selection.......................................................................... 57
Instrumentation ..................................................................................................... 62
Data Collection ..................................................................................................... 63
Data Preparation.................................................................................................... 64
Data Analysis .................................................................................................................... 65
Reliability and Validity ..................................................................................................... 65
Ethical Procedures ............................................................................................................ 67
Chapter Summary ............................................................................................................. 69
Chapter 4: Research Findings and Data Analysis Results ............................................................ 70
Data Collection ................................................................................................................. 72
Data Analysis and Results ................................................................................................ 78
Theme 1: Teacher Stress ....................................................................................... 79
Theme 2: Inequity in Education ............................................................................ 90
Theme 3: Principal Autonomy and Priorities ....................................................... 99

ix
Theme 4: Lack of Trust in the District................................................................ 108
Theme 5: Collective Teacher Advocacy ............................................................. 110
Questionnaire ...................................................................................................... 113
Reliability and Validity ................................................................................................... 114
Credibility and Dependability ............................................................................. 115
Transferability ..................................................................................................... 116
Dependability ...................................................................................................... 116
Confirmability ..................................................................................................... 116
Chapter Summary ........................................................................................................... 116
Chapter 5: Discussion and Conclusion ....................................................................................... 119
Findings, Interpretations, Conclusions ........................................................................... 119
Limitations ...................................................................................................................... 122
Recommendations ........................................................................................................... 124
Implications for Leadership ............................................................................................ 126
Conclusion ...................................................................................................................... 128
References ................................................................................................................................... 131
Appendix A: Chicago Teachers Union Approval to Recruit Teacher Participants .................... 155
Appendix B: Flyer to Recruit Teacher Participants .................................................................... 158
Appendix C: Preliminary Survey and Participant Demographic Questions ............................... 159
Appendix D: Subject Matter Expert Questions .......................................................................... 161
Appendix E: Consent for Participation in Research Focus Group Interview ............................. 162
Appendix F: Focus Group Questions .......................................................................................... 167
Appendix G: Questionnaire ........................................................................................................ 168

x
Appendix H: Screenshot of District’s Preliminary Permission to Conduct Study ..................... 169
Appendix I: School District Research Review Board Approval to Conduct Research .............. 170
Appendix J: Research Review Board Guidelines for Interviewing Participants ........................ 171

xi
LIST OF TABLES
Table
1. Sample of Student-Based Budgeting Distribution ............................................................ 31
2. Elementary and Middle School Teacher Participants ....................................................... 76
3. High School Teacher Participants ..................................................................................... 77
4. Themes and Subthemes..................................................................................................... 79
5. School District Pay Lanes-Based Education Attainment.................................................. 86
6. Low-, Medium-, and High-Enrollment Elementary School Comparison ......................... 96

xii
LIST OF FIGURES
Figure
1. Teacher perceptions of the advantages of student-based budgeting ............................... 113
2. Teacher perceptions of student-based budgeting’s disadvantages .................................. 114
3. Student-based budgeting teacher satisfaction levels ....................................................... 115

1
Chapter 1: Introduction
Utilizing an equitable K–12 public school funding model in the United States has been
debatable since Brown v. Board of Education of Topeka in 1954 (B. D. Baker, Farrie, & Sciarra,
2018). On average, state and local governments account for more than 90% of K–12 funding.
States provide 47%, while local funding accounts for 45%. The federal government spends about
8% of the budget on K–12 public school education (Partelow, Shapiro, McDaniels, & Brown,
2018). Student-based budgeting is a unique K–12 public school funding formula. Some
lawmakers, school district officials, and administrators say the funding formula eliminates the
inequity in public education, especially when it comes to the nation’s most vulnerable
populations, including low-income, English language learners (ELLs) and those with disabilities
(S. Farmer & Baber, 2019). Overall, federal funding of K–12 public education has decreased
since 2008 (Partelow et al., 2018). Twenty-nine states provided less funding per student in 2015
than in 2008, a year before the Great Recession (Leachman, Masterson, & Figueroa, 2017).
Based on 2016 national data, the amount spent per pupil on public K–12 education
averages $11,762, with Illinois spending an average of $14,180 per student (Maciag, 2020).
Student-based budgeting, also known as weighted student funding and backpack funding, is a
school funding formula whereby each school principal in the district is provided a set amount of
money to fund staff and programs based on the number of students enrolled in each school
(Rosenberg, Gordon, & Hsu, 2019). Extra money, or weight, is given to a particular school if the
school services students from low-income families, students who are ELLs, or students who have
special needs such as an Individualized Education Plan (IEP; Chingos & Blagg, 2017). In some
districts, having a fixed amount of staff and programming paid for by the central office is more
common or a more traditional method of school funding (Travers & Catallo, 2015). A traditional

2
or common education budget formula is known as school-based budgeting or site-based
budgeting (Doyle, Boast, Rosch, & Hassel, 2012). In the traditional site-based budgeting model,
the central or district office provides staffing resources to individual schools rather than a set
budget to each school in the district (Barnard, 2019).
Illinois K–12 teachers in a district implementing student-based budgeting were the focus
of the study. The introduction of the study provides relevant information about student-based
budgeting and the qualitative research instrument in the study. The following major sections
include the background of the problem, statement of the problem, purpose of the study,
significance of the study, research questions, theoretical framework, definitions of terms,
assumptions, scope and delimitations, limitations, and chapter summary.
Background of the Problem
An increasing number of school districts and states have instituted student-based
budgeting models to address inequity in K–12 public school systems (Fogarty, Harris, Morrow,
& Scott, 2015). Nearly 30 U.S. school districts began practicing student-based budgeting since
implementation in the late 1990s (Kelleher, 2015). Of the nearly 30 urban school districts
utilizing the student-based budgeting formula, one urban district in Illinois allocates 30% of its
total budget to schools based on the student-based budgeting formula, compared to about 40% to
45% of Houston, Hartford, and Boston school districts spending of their budgets through
student-based budgeting (Kelleher, 2015). One Illinois school district began implementing the
student-based funding model in 2014 to diminish the achievement gap and programming and
staffing inequities in the school district (Fogarty et al., 2015). To demonstrate educational equity,
policymakers tried to ensure districts across the state had the same access to resources, which
included the same amount of funding per student (Chingos & Blagg, 2017). Also, to help ensure

3
equity among the school systems, lawmakers stated taxpayers would pay the same property tax
rate regardless of residence location (Chingos & Blagg, 2017). Supporters and critics of the
budgeting formula are acknowledged in research (S. Farmer & Baber, 2019). Advocates of
student-based budgeting say it is the most equitable way to fund schools because districts can
eliminate spending money on low-performing schools. Critics of student-based budgeting say
parents transfer children from low performing schools and place the students in high-enrolled
schools, which are more likely to be high achievement schools because the schools receive more
money. In student-based budgeting, more students equal more money, and more money can
equate to more teachers and resources. Low-performing schools are schools with students whose
standardized test scores indicate a lack of grade-level attainment and growth over time and high
schools with high dropout rates (Balnaz, 2019). Additionally, supporters of student-based
budgeting indicate students benefit from the funding model because principals have the
autonomy to fund specific programs to prioritize the specific needs and demographics of the
school’s population (S. Farmer & Baber, 2019).
Critics of the student-based budgeting formula say the model provides the same amount
of resources to all students regardless of income level. The argument is low-income students
have greater needs and need more funding than students from affluent families (Barnard, 2018).
Also, opposers of student-based budgeting are concerned the formula forces low-enrollment
public schools to cut programs, enrichment courses, teachers, and support staff to compensate for
lower budgets (S. Farmer & Baber, 2019). Based on research, supporters and critics of student-
based budgeting are officials, lawmakers, school administrators, and organizational leaders. A
lack of research has explored student-based budgeting’s impact from a teacher’s point of view.

4
The majority of teachers, 53%, believe teachers’ opinions are taken into account most of
the time when school-level decisions are made (Rentner, Kober, Frizzel, & Ferguson, 2016).
Outside of the school level, the majority of teachers believe the opinions of teachers do not
matter; 76% believe teachers’ opinions do not matter at the district level, 94% believe teachers’
opinions do not matter at the state level, and 94% believe teachers’ opinions do not matter on a
national level (Rentner et al., 2016). Educators for Excellence, launched in 2010, is a nonprofit
organization seeking to ensure teachers have an influential voice in policies impacting students
and the profession (Fregni, 2018).
Statement of the Problem
The problem is the lack of teacher input in student-based budgeting implementation in
the school district studied. The lack includes opinions, perceptions, and experiences of K–12
public school teachers with student-based budgeting. Much of the enthusiasm for student-based
budgeting comes from lawmakers and school district officials (S. Farmer & Baber, 2019).
Teaching positions are affected by the funding process. Principals and school administrators
have discretion on how many teachers to utilize in the building (Barnard, 2019). In the Illinois
school district where this study was conducted, the district or central office provides the principal
with only one school clerk, one school counselor, and one assistant principal. The positions are
paid for by the district and do not come from the school budget, which is managed by the
principal. Other district employees are funded by the school’s budget, which is based on the
number of students enrolled (Kelleher, 2015). Some custodians in the schools are outsourced and
are not paid from the school’s budget.

5
Purpose of the Study
The purpose of the qualitative case study was to explore the perceptions, opinions, and
experiences of K–12 public school teachers in an Illinois school district utilizing student-based
budgeting. Exploring the views of teachers in Illinois can reveal the impact the funding formula
has on teachers and the level of equity it provides in education. Teachers are in the classroom
and can see how student-based budgeting affects the school’s staff and students. The Illinois K–
12 teacher participants teach in an urban school district and have experienced the budgeting
formula since 2014.
Significance of the Study
The qualitative case study is significant because it affords decision makers the
opportunity to view student-based budgeting’s impact from another perspective: Illinois K–12
public school teachers. In one Illinois school district, the central office gives the principal a set
budget based on the number of students enrolled in the school (Poiner, 2018). Teachers do not
make decisions on how the funds are utilized. Teachers’ opinions are rarely represented when it
comes to policymaking on school funding on a district, state, or federal level (Shannon &
Saatcioglu, 2018).
The literature suggests teachers have little influence on policy reform (Shannon &
Saatcioglu, 2018). The study could allow for more inclusive dialogue among lawmakers, school
district officials, school administration, and teachers. The outcome of the study can advance the
field of education by allowing more input on school budgeting implementation from a variety of
educational professionals. As a result, future research could present how teacher attitudes on
student-based budgeting or educational policy can impact the teaching profession and student
achievement. The results from the qualitative case study can assist education stakeholders in

6
decision making to help all students succeed by administering equitable funding standards. The
partnership between teachers and policymakers can improve teacher satisfaction, resulting in
more teachers staying in the profession and lessening teacher turnover (Daily, 2018).
Research Questions
Three research questions supported the qualitative case study. The questions are
fundamental to analyzing a specific perspective of a group of Illinois teachers in a large urban
school district on student-based budgeting’s impact on education. A total of 128,000 Illinois K–
12 public schools serve 1,935,195 students (L. Baker, 2017). The school stakeholders may
provide insight into the funding formula’s effectiveness.
Research Question 1: What are teachers’ perspectives of student-based budgeting in a
large Illinois urban school district?
Research Question 2: What are teachers’ experiences with student-based budgeting in a
large Illinois urban school district?
Research Question 3: What are teachers’ views on equity in education in a large Illinois
urban school district?
Theoretical Framework
Equity theory, which originated with American behavioral psychologist John Stacey
Adams (1963), states individuals have a tendency to seek consistency among others’ beliefs or
opinions. Furthermore, Adams explained if inconsistency exists among attitudes and behaviors,
something needs to change to eliminate the dissonance. Originally, the concept appeared in a
business-related article, which focused on the employer–employee relationship. The equity
theory explains why the relationship should not be viewed merely as an economic transaction;
the relationship should involve elements of relative justice which supersede business and provide

7
perceptions of equity and inequity. The theory also enables one to determine whether the
allocation of resources is fair to both relational parties.
Equity theory is the theoretical framework guiding the qualitative case study. The
framework narrows the focus when researching teacher perceptions, experiences, and opinions
regarding student-based budgeting’s impact to be framed around student equity. In relationship
to the study, educational equity is defined as providing the necessary resources for all students to
ensure achievement.
Teachers who are working under student-based budgeting are working under a system
which premiered in the late 1990s established primarily in urban school districts. Some teachers
worked under a previous system and had to adapt to the new system. Because student-based
budgeting was a part of school reform, theories guiding the qualitative case study research
surrounded equity. School reformers, lawmakers, and district officials have made claims to
provide fairness to ensure students make academic gains. One overlying theory emerged
impacting the perspectives of teachers. The theory is equity theory and affects education, gender,
racial, and social equity.
Definitions of Terms
The key terms utilized in the study are necessary and provide relevant connections to the
qualitative case study method. The following definitions are crucial to understand the
background and necessity of the study. The terms are defined as they relate to the qualitative
case study.
Achievement Gap. The ongoing disparity in achievement based on standardized test
scores between minority/low-income students and White students (Ratcliff et al., 2017).

8
Active Classroom Teacher. A teacher who is actively working in a classroom with
students and provides academic instruction (Cox, 2020).
Budgeting. The process of a school district educational plan to utilize resources to
allocate a finite amount of financial resources which prioritize educational and organizational
needs (Pouncey, Ennis, Woolley, & Connell, 2013).
Charter School. A publicly funded private or independent school free from many district
mandates (M. R. Ford & Ihrke, 2019).
Education Initiative. A mandated policy implemented or prescribed either school-wide,
district-wide, locally, statewide, or federally to improve education systems and increase student
achievement (Francom, 2016).
Educational Equity. Providing the necessary resources to students based on academic,
social, and emotional needs to be successful upon graduation from high school (Dean-Coffrey,
2018).
Educational Opportunity. A method of affording students and families the ability to
direct tax dollars designated for education to schools and educational programming to best meet
the needs of the students. Opportunities can include intra- and interdistrict school choice, charter
schooling, school vouchers, tax credit, scholarships, and educational equity (Lueken & Shuls,
2019).
Efficiency. A K–12 public school funding system, supported by taxes, whereby desired
outcomes are expected at a minimal cost. Many taxpayers desire improved education funding but
do not want to pay more taxes (Lueken & Shuls, 2019).
Funding Formula. A school financing system implemented district- or statewide
(Barnett & Kasmin, 2018).

9
Principal Autonomy. A principal’s latitude to manage a school budget to allocate funds
to hire staff, including teachers and school personnel, and create programming (Heffernan,
2018).
Quota System. A system in which the school district allocates employees, including
teachers, school administrators, and staff personnel, to schools based on school need and not
necessarily student enrollment (S. Farmer & Baber, 2019).
School Choice. The freedom of K–12 students and families to select from a variety of
schools and educational programming so limitations to choosing only from assigned schools and
programming based on geographic location are eliminated (Cowen & Creed, 2017).
School Reform. A transformational plan to move education forward with hopes of
systemic change and academic achievement, influenced by educational theory, data, and practice
either locally, statewide, or nationally (Dolph, 2016).
Student-Based Budgeting. A K–12 public school budgeting formula whereby a district
provides a set budget to an individual school based on student population. The principal has the
autonomy to allocate funds for staffing and programming (Travers & Catallo, 2015).
Vouchers. Tuition awarded to students to pay for education in the private sector rather
than attending government-run public schools (Laitsch, 2016).
Assumptions
Student-based budgeting can be polarizing. One assumption was teacher participants
have a range of views of student-based budgeting’s impact. All participants were assumed to be
knowledgeable about student-based budgeting and able to articulate the impact on a variety of
areas. The reason for the rationale all participants had at least three years of experience working
in the school district. The budgeting formula has been fully implemented since 2014. The

10
budgeting formula is discussed in several formal platforms within the school district such as the
monthly school board meeting, local school council meeting, teacher union meetings, which are
also monthly. Teacher assumptions emerge from thoughts, beliefs, and actions performed while
working (Booke & Willment, 2018).
Another assumption was participants would be relatively easy to locate. More than
15,000 teachers work in the school district studied. All participation in the survey, focus group,
and questionnaire was voluntary. Participants were provided a consent form with information
about the purpose of the study and indicating participation is voluntary. Participants were
ensured nobody will be aware of participation and the potential participant could stop
participation at any time. Establishing confidentiality was a priority for the research participants
in the Illinois school district where student-based budgeting is practiced.
Confidentiality was practiced during the focus group by addressing the participant by first
name and enrollment and grade level code (Example, Brandi EA). When writing the results of
the research, only the word Participant and a letter were used to transcribe participant comments
(e.g., Participant A, Participant B). No genders or school affiliations were identified. All
electronic files have been kept on a personal computer accessible only through an encrypted
password, and all printed files were placed in a research folder stored in a locked closet for five
years (Sutton, 2015). After five years, the printed files will be discarded by shredder, put in a
plastic bag, sealed, and put in a receptacle.
Scope and Delimitations
The qualitative case study consisted of active classroom teachers in one urban Illinois
school district. An active classroom teacher works full-time in the classroom, teaching specific
content, and is not retired. The sample involved 15 participants from public schools, comprising

11
five elementary teachers (Grades K–5), five middle school teachers (Grades 6–8), and five high
school teachers (Grades 9–12), with varying levels of experience. A qualitative case study is
appropriate when using a single case involving an organization and the case is unique (Ishak &
Bakar, 2014). Half of the participants in the study were accustomed to a different funding
formula, school-based budgeting, where the central office funded the majority of the school
resources. The teachers are the only educators in the state of Illinois whose positions are based
on the budgeting formula. Studying the perspectives, experiences, and opinions of a variety of
public school teachers has the potential to show a diverse and well-rounded view of the impact
student-based budgeting has on teachers. Teachers’ views may vary based on grade level, subject
taught, years of service, and school of employment. Delimitations must be mentioned in research
to explain why certain research actions were taken and the reasons for rejecting particular
methods for the study (Theofanidis & Fountouki, 2018).
Participants were surveyed online to compile demographic information and to ascertain
the level of understanding each potential participant had on student-based budgeting practices in
the district. The demographics gathered from the survey also afforded a diverse selection of
participants. The diversity included years of service, education level, grade level, content taught,
population of students, and demographics of students, including race, socioeconomic status, and
academic achievement.
Participants selected for the focus group gathered remotely due to the COVID-19
pandemic. Meeting through the Zoom online platform was a way for participants to feel
comfortable and not feel afraid to voice opinions. Based on the consideration of setting, free
from the school environment, participants may be more open to sharing experiences honestly.

12
Conducting a study outside of the school also afforded more convenience as the focus group was
not limited to business hours or location.
Limitations
Limitations of the qualitative case study exist. Limitations allow for possible problems
and bias to be revealed. Additionally, limitations can explain how the problems are addressed in
a study (Olufowote, 2017). The limitations included the participants, background, and setting
utilized in the qualitative case study. The sample was limited to one school district in Illinois
because it is the only school district in the state utilizing the student-based budgeting formula.
The purposeful nonrandom sample encompassed a diverse group of teachers. The
participants came from elementary, middle, and high schools. Participants were selected from
schools with diverse student populations, including schools with low, medium, and high
enrollment. Participants also came from schools with students of varying racial and
socioeconomic backgrounds. Content areas were diverse and included English, math, science,
and extracurricular courses such as library and physical education (P.E.).
Limitations of the study also include bias. Possible bias in the study could be from
veteran teachers with more than 10 years of experience in the district. The bias can occur
because experienced teachers were employed during a time before student-based budgeting when
the district used a quota system. The quota system differs from the student-based budgeting
system because the school district’s central office, rather than the individual school, paid for
positions. Newer teachers with no experience with the previous funding formula could be
influenced by the veteran teachers to believe the previous system was either better or worse than
student-based budgeting. To preempt potential bias, questions were prewritten and given to
participants before the focus group. Additionally, airtime was monitored. Participants were told
13
to discuss only the questions given. Discussions not following the questions were interrupted and
directed back toward the questions.
Chapter Summary
The purpose of the qualitative case study was to use the findings to provide more
inclusivity in the decision-making process to help ensure education funding formulas like
student-based budgeting are equitable among all students. A comprehensive summary of the
issues of student-based budgeting as it relates to the impact of the K–12 public school funding
formula on Illinois teachers was included. The problem identified the gap in research with
student-based budgeting and how to fill the gap. The rationale for using the educational equity
framework in conducting the qualitative case study was explained. The exploration occurred
through an in-depth study of Illinois teachers familiar with and working under the studied
funding formula. Relevant information provided the research questions guiding the qualitative
case study, and the relevant key terms were defined. Also outlined were the assumptions,
delimitations, and limitations. The following sections present a literature review and the
theoretical framework used to guide the qualitative case study.

14
Chapter 2: Literature Review
K–12 public school budgeting models are redefined continuously by states, districts, and
schools to improve school reform (Abdi, 2015). The purpose of the qualitative case study was to
explore the impact of one trending school budgeting model, student-based budgeting, on the
attitudes, opinions, and perspectives of teachers in an Illinois school district. The problem is the
attitudes and perspectives of Illinois teachers, who are an integral part of the school system,
about the impact of student-based budgeting are unknown (Gozali, Claassen Thrush, Soto-Pena,
Whang, & Luschei, 2017).
For the study, budgeting is defined as the procedural and strategic process of allocating
funds and resources to individual school districts (Travis, 2019). According to Schulenburg
(2017), the United States is shifting from funding institutions to funding students, to demonstrate
and maintain equity in K–12 public school systems. More than 80% of school revenue for K–12
public school education in the United States comes from income, sales, and local property taxes
(Chan & Morris, 2018). Despite the central role teachers play in addressing the existing
inequality in school systems, little is known about what teachers think of the inequality and how
to respond from a school budgeting standpoint (Penner, Rochmes, Liu, Solanki, & Loeb, 2019).
Student-based budgeting is a K–12 public school funding formula whereby the school
district allocates money to each school based on the school’s enrollment. The school principal
has the autonomy to allocate a set amount of money to fund school programming based on
priority (Travers & Catallo, 2015). The funding formula differs from the common method of
school funding, usually known as school-based budgeting or site-based budgeting (Doyle et al.,
2012). In the traditional site-based budgeting model, the central or district office provides
staffing resources to individual schools, rather than a set budget to each school in the district

15
(Barnard, 2019). For example, under the traditional school method, the district may provide 25
content teachers, a librarian, a music teacher, an art teacher, and five teacher assistants. In
school-based budgeting, a principal is given a budget and the principal decides what positions
are a priority and affordable. Under a student-based budget, a school may have 25 content
teachers. However, low-enrollment schools may only be able to afford one extracurricular
teacher and three teacher teachers because the principal could have exhausted all the funds in the
budget.
Literature shows student-based budgeting has impacted leadership strategies, education
policy reform, and student achievement, but little research has included active classroom
teachers’ perspectives (Barnard, 2019). Illinois has 852 school districts. The state is the third
largest, behind Texas and California, but has half the population (Murtaza, 2018). There is no
statewide rollout of student-based budgeting in Illinois, but Chicago utilizes the funding model
(Banicki & Murphy, 2014). Illinois school district officials have the latitude of choosing a school
funding formula best suited for the needs of the district (Haider, 2018).
Illinois has a funding formula which includes a system of dispersing money to address
issues of individual districts. The formula is called evidence-based funding, which was approved
in 2017 to improve educational equity in all Illinois school districts (Rhodes, 2019). The
calculation is measured by each district’s financial needs by the economic resource saturation in
the surrounding community (Rhodes, 2019). A comparison revealed a disparity in school funding
in the entire state. The comparison showed some school districts had been working with less than
half of the necessary resources, while other districts were supplied with three times more than
what was needed (Rhodes, 2019). However, the state funding formula differs from how each
school district in Illinois allocates funding to individual schools. Student-based budgeting and

16
evidence-based budgeting are the outcomes of fair funding initiatives dating back to the start of
the 20th century (Banicki & Murphy, 2014).
Research Questions
Three research questions guided the qualitative case study. The questions were
fundamental to discovering perspectives of a group of Illinois teachers on student-based
budgeting’s impact on education. A total of 128,000 Illinois K–12 public schools serve
1,935,195 students (Illinois State Board of Education, 2017). The voices of the school
stakeholders can provide insight into the funding formula’s effectiveness.
Research Question 1: What are teachers’ perspectives of student-based budgeting in a
large Illinois urban school district?
Research Question 2: What are teachers’ experiences with student-based budgeting in a
large Illinois urban school district?
Research Question 3: What are teachers’ views on equity in education in a large Illinois
urban school district?
A significant gap in literature pertains to obtaining Illinois K–12 teacher perspectives of
the student-based budgeting funding formula from an equity lens. The qualitative case study
explored how the trending funding formula impacts teachers’ perceptions of education, including
pedagogy, trust in the system, impact on career stability, and student impact.
Nationally, teachers believe the opinions of classroom educators are not considered in the
decision-making process, with only 7% claiming to have a meaningful impact on school
decisions (T. Hodges, 2018). When focusing on teacher influence on school decisions, only 5.3%
reported having moderate influence on the school budget, while just 0.5% reported having
meaningful input (Ingersoll, Sirinides, & Dougherty, 2018). Also, 65% of K–12 teachers feel the

17
state government had too much control over decisions, including school funding (T. Hodges,
2018). Regarding whether teachers’ opinions matter in the workplace, K–12 public school
teachers in the United States lag behind other professionals. Teachers are stakeholders in the
education sector. Teachers’ perspectives on the impact of student-based budgeting can provide
insight to principals, district officials, and lawmakers on the formula’s effectiveness. The
perspectives of the teachers can expand overall professional engagement and boost inclusive
collaboration.
One reason K–12 public school teachers can be a reliable source is this demographic of
educators experiences the impact of the budgeting system firsthand (Knight, Izquierdo, &
DeMatthews, 2016). Because teachers are in the building, teachers are aware of how the school
allocates funds. Additionally, teachers have an awareness of what students need to increase
achievement (Callingham, Carmichael, & Watson, 2016). Teachers are taught how to ascertain
student needs by conducting diverse assessments such as student self-assessments, learning style
assessments and academic assessments whereby a student can discern one’s abilities (Andrade,
2019).
The student-based budgeting formula is based primarily on student enrollment
(McAllister, 2018). The funding formula has become an increasing trend in many U.S. school
districts, mostly urban, with about 30 school districts using some form of student-based
budgeting (Barnard, 2018). Some cities utilizing a form of student-based budgeting include New
York City, Houston, Newark, Atlanta, Cleveland, Milwaukee, Indianapolis, and New Orleans,
and a few states, including New Jersey and California (Barnard, 2019; Travers & Catallo, 2015).
Other countries, such as the Netherlands, implement a form of student-based budgeting
(Driessen, 2017). The mission of student-based budgeting is to make the funding formula

18
transparent through increased equity and flexibility by allocating extra money to high-needs
students and giving more control to school officials (Travers & Catallo, 2015).
Principals are given a budget at the end of the school year to prepare for staff and
programming in the subsequent school year (Fitzpatrick, 2018). The projected budget is based on
enrollment from the previous school year. Some students with special needs, including ELLs,
students receiving special education services, and low-income students, may receive additional
funds (Fitzpatrick, 2018). As school districts transition to student-based budgeting, there is no
guarantee more money will be distributed to every school, but the formula changes how
principals can spend the allocated money (Poiner, 2018). Each school district and state has a
unique method of instituting the funding formula and allocates the money where most needed (B.
D. Baker et al., 2018; Barnard, 2019; Lee & Polachek, 2018). The qualitative case study
narrowed the focus to how one school district in Illinois utilizes student-based budgeting and the
impact the budgeting formula has on teachers in the district.
Student-based budgeting has grown in popularity among lawmakers and district officials
since the formula was introduced in the late 1990s (Kelleher, 2015). Although student-based
budgeting is increasingly popular in urban school districts, school-based budgeting, or traditional
school budgeting, is still the more popular method of K–12 funding in the United States
(Rosenberg et al., 2019). District officials and lawmakers are vocal on how the trending K–12
budgeting formula provides more student equity than the traditional formula in some urban
school districts (Fogarty et al., 2015). Chicago Public Schools Chief Executive Officer Janice
Jackson (as cited in Fitzpatrick, 2018) said student-based budgeting is the most equitable way to
dole out money.

19
School-based budgeting is different from student-based budgeting because the model
provides resources and money to schools rather than a set budget to schools (Travers & Catallo,
2015). Student-based budgeting is known by other terms such as student-based allocation,
backpack funding, weighted student funding, and fair student funding (Barnard, 2019). The
growing funding formula is also known as results-based budgeting and equitable student funding
(Snell, 2013). Regardless of the various terms used to describe the funding formula, the meaning
is the same: Money is distributed to schools based on student enrollment rather than set based on
school need (Snell, 2013). Principals do not have access to 100% of the school budgets but
generally manage between 40% and 80% of school-level spending, which differs from between
1% and 5% in traditional budgeting models (Travers & Catallo, 2015).
Quantitative and qualitative studies have explored student-based budgeting’s impact on
education in several states (Barnard, 2019; Fogarty et al., 2015). California and New Jersey, for
example, use student-based budgeting statewide. Several cities and counties have implemented a
form of student-based budgeting, including Denver, Colorado, and Clark County School District
in Nevada (Schulenburg, 2017).
Perspectives of the funding formula have been seen from the lens of lawmakers, district
officials, and principals, but little from teachers (Fogarty et al., 2015). Teacher voices have been
rarely heard when focusing on educational perceptions and experiences with the funding model.
In 2013, Chicago switched the school district funding formula from school-based budgeting to
student-based budgeting in the name of funding reform (Kelleher, 2015). The rationale for the
switch included improving transparency, providing a fair funding formula, making student
achievement a priority, and providing principal autonomy, while holding schools accountable for
results (Fogarty et al., 2015).

20
The purpose of the following sections is to provide a general overview of the perspectives
of Illinois teachers stemming from the student-based budgeting funding formula. Historically,
funding formulas have been a hot-button issue in the public school arena (Doyle et al., 2012).
Decision makers on school funding formulas have predominantly involved educators outside of
the classroom, with few to no teachers at the political table (Fogarty et al., 2015).
Literature Search Strategy
The collection of relevant literature involved searching related articles on student-based
budgeting. Relevant terms for the literature review stemmed from the qualitative case study’s
research questions, resulting in one major theme: education reform. Subheadings emerged which
include funding models, laws and policies, leadership autonomy and accountability, equity, and
achievement. The literature search included online databases provided by the American College
of Education (ACE) and Google Scholar. Electronic scholarly articles were peer-reviewed. Other
relevant resources used to comprise research for the study included news articles, non-journal
articles, and historical reports from credible sources. Websites used for the qualitative case study
include ETStrategies.org, AERA Education Research, Reason Foundation, Education Policy
Analysis Archives, and Sage Journals.
Key phrases utilized to find scholarly articles relevant to the study were categorized and
include qualitative case study, qualitative case study in education, case studies in Illinois
education, education reform, achievement gap, standards testing, teacher accountability, school
report card, principal autonomy, school choice, school closings, school turnarounds, teacher
evaluation, teacher equity, social equity in education, racial equity in education, gender equity
in education, education equity theory, equity theory, equity theorists, educational equity
theorists, education theories, equity vs. equality, education reform, corporate reform, education

21
policies, education segregation, No Child Left Behind Act, Race to the Top, private sector, Every
Student Succeeds Act, Brown v. Board of Education, student-based budgeting, fair-student
funding, traditional school funding, equity-based funding, fair funding, education equity and
charter school funding, state-funding of public schools, Illinois school funding law, Illinois
school funding policy, k-12 public school funding, teacher perspectives, teacher attitudes,
teachers and decision making, teacher unions, teacher strikes, teacher hiring, and principal
accountability.
Theoretical Framework
When administering the theoretical framework to the qualitative case study, teacher
perception of student-based budgeting was the focal point. Teachers working under student-
based budgeting are working under a relatively new system established primarily in urban school
districts. Some teachers worked previously under a former system and had to adapt to the new
system. Because student-based budgeting is a part of school reform, theories guiding the research
surrounded equity.
School reformers, lawmakers, and district officials have made claims to provide fairness
to ensure students make academic gains. Based on the literature, one relevant overlying theory
emerged impacting teachers’ perspectives. The theory is equity theory and impacts education,
racial, and social equity.
American behavioral psychologist Adams (1963) developed equity theory. The theory is
based on the dissonance theory, the belief individuals have a tendency to seek consistency
among others’ beliefs or opinions. Furthermore, the theory explains if there is inconsistency
among attitudes and behaviors, something needs to change to eliminate the dissonance. The
original concept appeared in a business-related article. Adams’s focus was on the employer–
22
employee relationship. According to Adams, the relationship between employee and employer
should not be seen only as an economic transaction; the relationship should also involve
elements of relative justice which supersede business and provide perceptions of equity and
inequity. The theory also explains whether the allocation of resources is fair to both relational
parties.
Adams’s (1963) equity theory indicates people perceive and evaluate relationships with
others based on a comparison of one’s input into the relationship and outcomes from the
relationship to another’s inputs and outcomes (Fowler & Brown, 2018). Outputs or outcomes can
encompass positive and negative consequences. Adams theorized if the ratio from the
input/outcomes and comparison relationships lacks balance, an inequitable relationship will be
determined; the level of equity imbalance correlates with the more distress one feels; and the
more distress, the likelihood of restoring equity will increase (Fowler & Brown, 2018). The types
of inputs and outputs can vary based on several ideas, including the motivation of the employee
and employer, and based on the system in which the work was performed (Adams, 1963). An
employee’s input can include time, experience, education, determination. Outcomes can include
job security, salary, recognition, praise, reputation, and benefits.
Carrell and Dittrich (1978), also equity theorists, stated the term fairness is more likely to
be used in common labor law language. The word is more likely to be used when referring to fair
wages or fair disciplinary actions. Carrell and Dittrich claimed the theory has limitations:
Demographic and psychological variables can affect a person’s perception of equity or fairness.
Additionally, equity theory cannot be based merely on the input and output of a relationship but
also on the system determining those inputs and outputs. Carrell and Dittrich said a more
comprehensive approach to measuring one’s perception, and the effects of equity in the

23
workplace, is by the net balance (overall fairness) to the input and output ratios. Instead of
mentioning a compared person, one has the latitude to utilize an internally created standard for
comparison.
The equity theory was the framework that guided the qualitative study. Though the
equity theory originated from relations in the business sector, ideology can transfer to the
education sector (Adams, 1963). Teachers can provide a comprehensive perspective of student-
based budgeting concerning equity among teachers, schools, and students. Teachers can use the
equity theory when perceiving the input and output of students, school administrators, district
officials, and lawmakers (Lucas & Beresford, 2010). Teachers can connect those individual
perspectives to the output based on student achievement, teacher satisfaction, and equity in
resources for teachers and students (Lucas & Beresford, 2010).
The output of average annual teacher salaries in Illinois being $67,000 may have a direct
correlation with the teacher retention rate of about 86% (Illinois Report Card, 2019). Teachers
across the country have gone on strike to protest the lack of school funding. The protest revealed
K–12 teachers’ feelings indicating the output of low school funding does not match the
profession’s input of education level and professional requirements (L. Farmer, 2019). For 18
straight years, Americans said a lack of funding was the top issue facing schools (L. Farmer,
2019). Oklahoma is still funding K–12 education, which is 15% below the prerecession school
funding era (L. Farmer, 2019). The evidence shows lack of funding correlates to teacher
satisfaction.
Equality and equity in education have been used interchangeably, but the terms are
different (Thompson & Thompson, 2018). Equality is the belief everyone has the same access to
education and learns in the same way (Center for Public Education, 2016). Equity, synonymous

24
with fairness, is the belief educators and policymakers develop strategies to support all students,
especially those who are disadvantaged based on lack of access and ability (Center for Public
Education, 2019).
Equity can also be defined as systemic practices and policies which provide accessible
quality education to every student where deep and meaningful learning can take place to
empower students to be independent learners in society (Darling-Hammond, Wilhoit, &
Pittenger, 2014). Equity is demonstrated when all students receive differentiated resources based
on the specific needs of the school and students in preparation for college or a career upon
graduation (Center for Public Education, 2016). Equality implies everyone should receive the
same treatment, resources, and access to those resources.
In an equitable classroom environment, teachers foster the unique needs of each student
to create an environment which is responsive to all students (Center for Public Education, 2016).
An equitable system has no one-size-fits-all standard of a curriculum for teaching and learning;
the curriculum, instruction, services, and resources are differentiated to proactively meet the
diverse needs of each student to reach academic and societal potential (Thompson & Thompson,
2018). For equity to be effective in education, it is the responsibility of teachers to be consistent
in implementing strategies to promote equity (Jurado de los Santos, Moreno-Guerrero, Marin-
Marin, & Solar Costa, 2020). Additionally, teachers must organize with agents in the
community, actively collaborating to fight against inequity (Jurado de los Santos, Moreno-
Guerrero, Marin-Marin, & Solar Costa, 2020).
In public education, evidence shows a disparity in achievement between races,
socioeconomic backgrounds, and genders (Garcia & Weiss, 2017). One example of the equity
disparity in funding is in Pennsylvania (Fogarty et al., 2015). Pennsylvania has one of the most

25
inequitable funding systems in the United States, with an $18,000 spending difference between
the highest and lowest spending districts in the state.
Research Literature Review
Education reform is one theme emerging from the review of literature. The major theme
is categorized into five sections: school funding models, laws and policies, leadership autonomy
and accountability, equity, and student achievement. The first section includes an exploration of
how student-based budgeting was a result of school reform (Barnard, 2019). School budgeting
reform has mainly impacted urban school districts. The first section, a school funding synopsis,
summarizes different U.S. K–12 public school funding models and compares the different
models to student-based budgeting. The comparison focuses on teacher, school, and student
equity. The definitions, advantages, and disadvantages are highlighted.
The section on laws and policies chronicles laws and policies enacted during the 21st
century. Laws and policies have impacted school reform and opened the door for student-based
budgeting (Jankov & Caref, 2017). Policies such as the No Child Left Behind Act (NCLB), Race
to the Top (RTT), and Every Student Succeeds Act (ESSA) were federal initiatives changing
school funding and how resources are distributed (Harman, Boden, Karpenski, & Muchowicz,
2019).
The leadership section provides literature on how principals implement student-based
budgeting in schools. The section includes details on how teachers are impacted by the
principal’s implementation. The section also includes principal accountability and autonomy
measures and how the implementations vary by district.
The section on equity is the broadest of the five sections, detailing the facets of equity.
When researching the literature, student-based budgeting and the perspectives of different levels

26
of equity were discovered. Teacher equity, student equity, and school equity were factors in the
researched budgeting formula.
The section on student-based budgeting research highlights the research on student-based
budgeting from a student achievement lens. Research articles discussed how the nontraditional
school budgeting formula should theoretically bridge the achievement gap. Principals have the
latitude to spend school budgets.
Principals can research what the schools need, resulting in student achievement. The one
theme combined with five subcategories addressed the impact student-based budgeting has on
teacher perspectives regarding educational equity in the school district. The review revealed a
variety of areas in which student-based budgeting laws affect hiring practices. The literature also
showed how much money is spent per pupil in a school or district and how much autonomy a
principal has when allocating funds in a school.
School Reform
The root of student-based budgeting stemmed from school reform (S. Farmer & Baber,
2019). In 2017, the United States spent approximately $620 billion on K–12 public school
education (Kane, 2017). The K–12 public education system serves about 50 million students and
employs 6 million adults, mostly teachers, in over 100,000 public schools in about 14,000 school
districts (Filardo, 2016). Student achievement was not matching educational spending
(McAllister, 2018). The National Assessment of Educational Progress (as cited in DeSilver,
2017) reported 25% of students were proficient in math, 22% were proficient in science, and
only 12% were proficient in U.S. history in 2017. School reform met the 21st century with
various laws and policies incorporating voucher programs, school privatization through charter

27
school expansion, public school closings, change of testing measurements, and changes in school
funding formulas (Jankov & Caref, 2017).
Student-based budgeting was a phenomenon that started in the late 1990s as a result of
reforms to show more equity in schools to bridge, diminish, or eliminate the achievement gap.
According to Doyle et al. (2012), the use of student-based budgeting in Connecticut was the
basis for improving student performance. The improvement in student performance increased
equity in funding, improved budgeting and accountability, and increased transparency. Before
the implementation of student-based budgeting, Connecticut’s 2006 report card showed schools
struggling, with less than half the state’s students showing proficiency in reading and only 63%
of 10th graders showing math proficiency. After three years of implementing student-based
budgeting, the Hartford school district officials discovered the time between when the district
approved of the school budget and the time the school year started, student enrollment size often
fluctuated. Some school had higher or lower enrollment than expected. However, the funding
was not reallocated to match the school enrollment (Doyle et al., 2012). Hartford’s school district
use of student-based budgeting also revealed principal autonomy over the budget allowed for
better use of resources to align with student need rather than the same resources given to each
school before student based budging (Doyle et al., 2012).
Other U.S. Funding Models
To understand the rationale for student-based budgeting, comparing the funding model to
other popular methods of K–12 public school funding in the United States is necessary. Five
traditional forms of funding in the United States are line-item budgeting, percentage add-on
budgeting, zero-based budgeting, performance-based budgeting, and site-based budgeting (Doyle

28
et al., 2012). Each funding model is defined as follows, coupled with the advantages,
disadvantages, and similarities.
Line-item budgeting. Line-item budgeting, which may be the most widely used
approach in K–12 schools, is a historical funding approach which uses a history of expenditure
and revenue data to determine how money is allocated to districts and schools (Doyle et al.,
2012). The advantage of a line-item K–12 school budgeting model is the budget is organized by
specific units and objects (Chan & Morris, 2018). The disadvantage of the formula is it allows
for micromanagement without having adequate performance information.
Percentage add-on budgeting. Percentage add-on budgeting is another budgeting
formula whereby the school district or state may add to the previous year’s funding level. For
example, if last year’s funding for a particular program was $10,000, if funds are available and
proof of a need is shown, an increase in money can be provided. The budgeting formula is
simple because there is no investigation to determine what to take away. One disadvantage of the
funding model is the one-size-fits-all approach, because schools may need a greater increase than
the school allows (Doyle et al., 2012).
Zero-based budgeting. Zero-based budgeting is another funding formula whereby the
budget starts from $0 each year, with no reference to the previous year’s budget (Yan, 2016).
Each item in the zero-based budget is supposed to be justified (Doyle et al., 2012). Staff are
usually involved in choosing the allocation of resources, which builds morale with stakeholders
and builds trust in the community by having a transparent budget process. Additionally, zero-
based budgeting abolishes outdated expenditures while focusing resources where most needed. A
con of zero-based budgeting is neither the districts nor schools have the staff or time to
effectively address the intricacies the budgeting mode requires (Yan, 2016). In addition to

29
needing staffing and timing, much paperwork and planning are necessary for full
implementation, which some schools do not have (Doyle et al., 2012).
Performance-based budgeting. Performance-based budgeting, also known as incentive-
based budgeting, is calculated by the standard cost of inputs multiplied by the number of units of
an activity or program to be provided within a certain time period (Lang, 2016). The budget must
include a detailed narrative of each program or activity. Some lawmakers and district officials
favor performance-based budgeting because performance-based budgeting prioritizes measuring
and evaluating outcomes (Doyle et al., 2012). School administrators are provided with more
information to make analysis and evaluation. Also, individual schools are given budget
flexibility as long as school and district goals are met (Lang, 2016). Critics of performance-based
budgeting claim a lack of reliable standard cost information (Doyle et al., 2012). Research
showed an increased need in student affairs to more effectively align equity objectives
(McCambly & Haley, 2016).
Site-based budgeting. Site-based budgeting is similar to student-based budgeting as both
decentralize the budget authority and process (Sorenson & Goldsmith, 2018). Site-based
budgeting is similar to zero-based budgeting as both require some advisory team to help ensure
school priority and equity (Doyle et al., 2012). Resources are distributed to individual schools
and principals or school administrators to allocate resources based on the alignment of school
goals (Sorenson & Goldsmith, 2018). Site-based budgeting differs from student-based budgeting
because the money does not follow the student but stays at the school or site (Doyle et al., 2012).
Site-based budgeting has been considered most practical for schools because the people who best
understand the needs of the school are distributing the resources, while staff and community

30
have a voice, which allows for public support. The site-based budgeting model has been
criticized because few school-level administrators are trained to implement the model efficiently.
Table 1 presents an example of how student-based budgeting funds are distributed based
on student population and needs of the school. Teacher salaries play a role in the student-based
budgeting formula as principals have to manage positions and programs. As shown in Table 1,
the higher the student enrollment, the more general funding is received, but this does not
guarantee more teachers. Teacher salaries are usually based on experience (Knight, 2019). If
teachers are paid less than the average salary, principals may be apt to hire newer or less
experienced teachers because doing so allows for more money in the budget. Additionally,
allowing teachers to work multiple subjects and grade levels can allow more money to be saved.
If teachers make more than the average salary, schools with low enrollment could be more at a
deficit and may have to lay off more staff, which can mean less programming for students,
resulting in low achievement.
Laws and Policies
Twenty-first-century education reform brought in several reform policies, one of the
earliest being spearheaded by President George W. Bush when he instituted NCLB in 2002.
NCLB, receiving bipartisan support, charged educators with taking accountability for students’
growth, or lack thereof, on standardized tests (Harman et al., 2019). Four principles comprised
the NCLB initiative: stronger accountability for results, more freedom for states and districts,
proven education methods, and more school choice for parents (Daniel & Walker, 2014). The
overall mission policy mandated 100% of public school students demonstrate proficiency in
reading and math by 2014 (Harman et al., 2019). In 2011’s provision of NCLB, waivers were

31
given to states agreeing to tie teachers’ overall evaluation scores to students’ achievement on
standardized or high-stakes tests (Wright, Shields, Black, Banerjee, & Waxman, 2018).
Table 1
Sample of Student-Based Budgeting Distribution
Variable School A School B
Student population 300 1,000
Amount of funding per student $5,000 $5,000
Overall extra “weight” funding (when schools receive extra
funding in budget based on number of English language
learners, low-income students, and special needs students)
$4,000 $2,000
Average annual teacher salary $70,000 $70,000
Number of teaching positions 25 60
School overall budget $1,504,000 $5,002,000
Money left after paying teachers -$246,000 $802,000
NCLB became increasingly criticized by parents, principals, and teachers for the policy’s
stern measurement of achievement (Darrow, 2016). Major drawbacks of the act included
teachers and parents opposing narrowing the curriculum to focus only on test subjects, using the
standardized test as the only criteria for measuring student achievement, and the cost of
implementing the new policy. According to Jankov and Caref (2017), NCLB was responsible for
the expansion of standardized test scores and charter schools.
Federal school reform policies continued with the Race to the Top program. The reform
policy was spearheaded by President Obama in 2009 and received $4.35 billion in federal
funding (Daniel & Walker, 2014). The program was different from NCLB, which focused on

32
school success, because RTT was a competitive-based initiative which awarded additional funds
to school districts and states demonstrating proof of reform strategies to increase achievement.
The reform policy resulted in teacher evaluations based on standardized test scores,
closing or turning around low-performing schools, and including more charter schools (Jankov &
Caref, 2017). During the RTT era, a study was conducted to research teacher perception of
school-level influence, curricular autonomy, pedagogical autonomy, and job satisfaction in RTT
states and non-RTT states (Wright et al., 2018). Teachers in RTT states had a small yet negative
perception of school-level influence and curricular autonomy. No significant correlation was
found with teacher perception of job satisfaction in RTT states versus non-RTT states.
The education reform continued when President Obama passed another federal program,
Elementary and Secondary Education Act In 2015. The program was reauthorized from the
Elementary and Secondary Education Act of 1965 enacted by President Lyndon Johnson to end
the war on poverty (Darrow, 2016). The measure, which replaced NCLB, continued with test-
based accountability even for students with disabilities while giving more control to the states
(Essex, 2015). ESSA served as the nation’s promise to provide equal educational opportunity for
all students, with no exception to race, ethnicity, disability, English language proficiency, or
income.
In 2010, the documentary film Waiting for “Superman” was released in theaters. The
controversial film launched a grassroots campaign, Host A Screening, which ran concurrently
with the 2011 state legislative sessions in several states, including Ohio, Indiana, Wisconsin, and
New Jersey. Bills on the table during the session were teacher merit pay, contracts for teachers
on probationary status, school vouchers, limiting teachers’ bargaining rights, and provisions to
school funding formulas and charter school funding (Wessel-Powell, 2014). The movie

33
producers portrayed teacher unions as barriers to quality education by focusing more on raises
than students. The bulk of people interviewed in the movie were school district administrators,
charter school parents, and students who wanted to go to charter schools. The movie provided
little individual public school teacher voice.
Normally, under student-based budgeting, state and local funds are not intermingled with
federal funds because federal funds have limitations on how the money can be spent. In February
2018, a pilot program instituted under ESSA, allowed up to 50 school districts flexibility with
some earmarked federal money under Title I to use the funds for a student-based budgeting
model. The rationale for the latitude was allocated resources based on the number of students and
the level of need for students (Barnard, 2018). In the 2018–2019 New Orleans Parish general
budget, 98% of the school district’s general fund went toward student-based funding, while
Prince George County schools utilized 23.5% of the school district’s funding in student-based
budgeting (Barnard, 2018).
To promote student-based budgeting, or weighted student funding, ESSA authorized a
pilot student-based budgeting program for school districts having an interest in participating.
Interested districts had to apply to the U.S. Department of Education (Poiner, 2018). The contract
allowed the U.S. Department of Education to enter into three-year agreements with a maximum
of 50 local school districts to consolidate federal and state funds into a specific weighted funding
formula. All monies could be used to directly fund students without limitations. During the initial
application process, five school districts applied but only a school district in Puerto Rico was
accepted.
School funding continued to be an engaging topic in state legislatures and the courts
(Chingos & Blagg, 2017). In many cases, state policy changes were the result of court decisions.

34
From 1971 to 2010, 42 states’ school funding systems were challenged in court; the courts
overturned the existing system in 28 of those states (Jackson, Johnson, & Persico, 2016).
Moreover, state lawmakers usually amended the formula parameters, changing how much money
is given per child and how much extra may be given to schools with low-income students,
special needs students, and English language learners. For example, a state or school district
utilizing student-based budgeting adds or subtracts the percentage given to an ELL by adding
.25% to the weight or subtracting .25% from the weight in order to meet the needs of the student
(Chingos & Blagg, 2017).
How districts decide on student-based budgeting. Before districts decide on student-
based budgeting as the new funding model, research suggests district officials answer
fundamental questions, such as Which costs can be decreased to increase the amount of
unrestricted money available? and How can more money in the school district not related to
students be transferred to focus directly on students? (Snell, 2013).
Cleveland’s implementation of student-based budgeting. Cleveland’s implementation of
student-based budgeting, and the impact on student achievement and leadership, began in 2012
(Poiner, 2018). In Cleveland’s 2016-2017 student-based budgeting plan, principals controlled
nearly 50% of the budget, compared to 14% in 2014. In Cleveland’s student-based budgeting
plan, principals control nearly 50% of the budget, compared to 14% in 2014. Also, in the 2016–
2017 school year, 71% of school budgets were managed by the school administration, compared
to just 1.8% in 2013.
To help principals carry out the planning and budgeting process, network support teams
comprised representatives from several departments, including budgeting, human resources,

35
special education, and academics (Poiner, 2018). Cleveland principals said the network support
teams, not teachers, were the most helpful when developing a school plan.
Student-based budgeting has two fund types: locked funds and unlocked funds. Locked
funds are under central office control, while unlocked funds are available at the principal’s
discretion (Poiner, 2018). Cleveland Metropolitan School District did not unlock special
education because special education is firmly governed by the students’ IEPs and federal policy.
An IEP is a legal document for a student who receives special education services to chart a plan
to achieve academic, physical, and social–emotional goals through modifications and
accommodations in specified content areas (Pounds & Cuevas, 2019).
Baltimore’s and Denver’s implementation of student-based budgeting. Baltimore is one
example of a school district using student-based budgeting aggressively as a way to reform.
Between 2008 and 2011, the school district streamlined the central office by decreasing the
number of full-time employees by 33% (Snell, 2013). As a result, the central office’s priorities
shifted to guiding schools, supporting schools while holding the institutions accountable for
student achievement. As a result, Baltimore claimed growth in graduation rates and test scores,
including national scores on the National Assessment of Educational Progress (Snell, 2013).
Denver is another school district which chose the student-based budgeting formula model
after closing eight underutilized (low-enrollment and low-performing) schools (Snell, 2013).
Denver’s school board estimated transferring students to higher performing schools would save
the district approximately $3.5 million. The extra money would go toward opportunities for the
new school and new programs.
New York City’s and Los Angeles’ implementation of student-based budgeting. While
Baltimore and Denver switched from the traditional model of school funding to student-based

36
budgeting district-wide (Gross & Jochim, 2016), some districts tested the waters by using
student-based budgeting in a pilot program. New York City and Los Angeles Unified are
examples of using a pilot program as a preliminary step to ensure the funding formula is the right
choice (Snell, 2013). The pilot program allowed both districts to fix anticipated problems, design
a more effective school-level budgeting tool, and develop principal leaders and mentors.
Nevada’s implementation of student-based budgeting. Through bipartisan support,
Nevada’s lawmakers reorganized Clark County School District in May 2017 to reform the school
system funding model. The rationale for the reform was based on the belief the amount of money
schools received should be based solely on the number of students enrolled in each school. Every
student receiving the same amount is a fair and equitable system, according to Nevada state
officials (Schulenburg, 2017). In Nevada’s student-based budgeting policy, a local organizational
team is mandated comprising teachers, staff members, parents, and the principal. As a part of the
policy, principals are to include teachers, parents, and community members in the budgeting
process with the idea of promoting a democratic process with all stakeholders (Sinclair & Malen,
2016).
Student-based budgeting globally. Student-based budgeting has also been a phenomenon
outside the United States, in places such as Africa, Latin America, and Asia (Chin & Chuang,
2015). The budgeting formula goal is similar to the goal in the United States, which entails
decentralization and transitioning more authority to schools to decide policy to allocate resources
based on student need. In theory, the funding formula will be successful because the objective is
to solicit the perspectives of those closely connected to the students, such as parents.
Racial impact of education reform. According to Daniel and Walker (2014),
educational reform, including funding, has negatively impacted African Americans since the

37
U.S. Supreme Court’s 1954 Brown v. Board of Education decision, which ordered desegregation
in all public schools. NCLB and RTT led to poor pedagogical practices with an overemphasis on
testing and disciplining students. Jankov and Caref (2017) said reforms are due to the corporate
takeover of public education, branding schools with low standardized test scores as failing.
School closure becomes inevitable and more charter schools are established, which are filled
primarily with African American and Hispanic students. As a result of NCLB, many states
terminated open-ended assessments in subjects such as writing, mathematical problem solving,
scientific inquiry, and research, replacing some parts of the test with low-level multiple-choice
testing, especially in schools serving low-income students of color (Thompson & Thompson,
2018).
The primary strategy for building an equitable education system is access to highly
qualified teachers (Thompson & Thompson, 2018). According to Cook-Harvey and Stosich
(2016), indicators on the school report card would report proportions of teachers with three or
more years of experience, certified teachers in the specified content, and teachers who have
demonstrated a higher level of accomplishment through National Board certification.
Funding formulas. Funding formulas are the result of policies made to finance
education. A funding formula is simply a mathematical equation plugging in numbers and money
affecting a situation (Larkin, 2016). Student-based budgeting can be utilized in an array of ways.
Attendance is also tied to the student budgeting formula. Districts must decide on how to
calculate school attendance. One method of calculation is average daily attendance (Chingos &
Blagg, 2017).
Student-based budgeting formula weights. Weights are a measurement of student-
based budgeting to decide how the money will be allocated to each student. States can have a

38
higher per-student cost if students carry the following attributes: special education, ELL, and low
income. Forty-seven states provide additional funding for special education students, 40 for
ELLs, 28 for low-income students, and 25 for students below grade level (Chingos & Blagg,
2017). One reason for the skyrocketing increases in K–12 education in the United States is the
rising need for services for special education students and ELLs (Russ & Hawthorne, 2018).
Challenges can come with weighting school funding, such as deciding how to determine
the amount of money given to students who fit certain categories such as low-income students,
special needs students, and students who are English language learners. What if students fit into
two or three of the weighted categories. Will the student receive extra for each or one set-
amount? District officials must decide if a student qualifies for two weights, such as being low-
income and special education (Chingos & Blagg, 2017). Weights can also create incentives for
states to increase the number of students who carry additional weight to increase funding.
Leadership Autonomy and Accountability
Traditionally principals have been held accountable for student achievement success and
failure. Before student-based budgeting, principals complained of unfairness as the leadership
position had little control over student-based budgeting (Travers & Catallo, 2015). The financing
mechanism can be implemented by governors, school boards, and superintendents as long as the
measure aligns with the existing state education budgets (Snell, 2013). With student-based
budgeting, principals have more autonomy with the school budget.
The budget is considered the most powerful tool in either supporting or destroying a
principal’s credibility (Travis, 2019). The budget is considered a legal document, a framework
for operations, a financial planner, and a communication device which articulates the priorities
and principles of the school. Areas a principal could address in the budget should be

39
comprehensive, including personnel, curriculum, curricular enrichment, extracurricular activities,
purchasing, building maintenance, and professional development.
According to President Truman (as cited in Travis, 2019), budget figures show more
about proposed policy than any speech can. Under the traditional school-based formula,
principals, on average, have access to only 5% of the money (Barnard, 2018). According to
Barnard, research suggests principal latitude improved student achievement, which student-based
budgeting provides. Principals have more access to money under student-based budgeting, but
the power is never 100%. Depending on the district, the range of principal control varies.
In student-based budgeting, the money follows the student. But once dollars are allocated
to each student, it is not clear how the money is distributed and what factors are taken into
account (Ciolino, Kirylo, Miron, & Frazier, 2014). To make student-based budgeting effective,
principals and other school leaders must receive training in the budget technicalities and how to
distribute resources for student achievement (Rosenberg et al., 2019). Also, principals and the
student-based budgeting team must begin planning before the central office distributes the
budget to the school, which entails recognizing the school’s needs, goals, and resource priorities
(Travers & Catallo, 2015). According to research, the flexibility of student-based budgeting
affords the principal more latitude to maximize student achievement (Smith, 2015).
In a study using Cleveland’s Metropolitan School District, district officials admitted
student-based budgeting alone would not be enough to ensure student achievement (Travers &
Catallo, 2015). To have a greater impact, district officials connected student-based budgeting
with strategic school design, a collaborative practice whereby school administration and teacher
leaders began the school year with a student achievement vision, and used discretion to
reorganize resources, including people, time, technology, and money to support the vision.

40
When leaders practice strategic school design with student-based budgeting, successful
school reform can occur (Travers & Catallo, 2015). Seven critical factors of the student-based
budgeting model are crucial: leadership, flexibility, process, collaboration, preparation, models,
and accountability. Rosenberg et al. (2019) also noted seven critical principles school leaders
must follow for a successful student-based budgeting model: The formula must be student
focused, equitable, transparent, differentiated, predictable, empowering, and aligned with district
strategy.
Challenges with school leaders implementing student-based budgeting. Some teacher
unions have been skeptical of student-based budgeting, arguing more principal control over the
budget will provoke contract violations (Rosenberg et al., 2019). In a report based on the
Principal Engagement Survey (Chicago Public Education Fund, 2015), 40% of principals
responded with the desire more help with student-based budgeting. Practicing two-way
communication and including union representation in the school-wide strategic design team
could help union members gain the trust of the funding formula and the principal making the
decisions (Rosenberg et al., 2019).
In the traditional school funding formula, principals receive support to comply with union
contracts and district, state, and federal policy programs (Rosenberg et al., 2019). More coaching
and support are needed for the school administration to navigate student-based budgeting and
compliance. Even when principals have budgetary autonomy, supervisors of principals still may
disagree on how principals should utilize the funds.
School choice. Student-based budgeting has been popular with education reformers
because, though the funding formula does not provide vouchers to private schools or outside the
district in most cases, the money follows the student to the public school of the student’s choice

41
even if the student transfers to another school in the district or a charter school (Barnard, 2018).
A charter school is a government-funded school run either by individuals or large-scale providers
or educational management organizations (Laitsch, 2016). Charters, one form of school choice,
have disproportionately opened in urban areas, consistently facing teacher shortages and
disparities in teacher quality (Jabbar, 2018) Also, historically, charters face hardships in
attracting and maintaining teachers, for several reasons, one being funding. Many charter schools
exist under student-based budgeting by receiving money from the district where the charter
school is stationed (Ciolino et al., 2014).
Advocates say student-based budgeting works best when students have a variety of
schools from which to choose (Barnard, 2019). The United States is moving away from funding
institutions to funding students, with K–12 education mirroring the higher learning formula
(Snell, 2013). The country is slowly exiting the public school system funded by local resources
and residential assignments and moving toward parent choice and school enrollment. Since
December 2012, at least 32 voucher and tax credit programs have been implemented in 16 states,
totaling more than $1 billion in funding following students to schools.
Even though student-based budgeting has afforded more school choice, in some cities
like Chicago, Black students are still segregated, with school closures and charter school
expansion occurring predominantly in African American and Hispanic neighborhoods (Jankov &
Caref, 2017). One school district in the United States known for the sweeping school choice
reform is New Orleans post-Hurricane Katrina, which killed more than 1,800 people and forced
many others to evacuate (Jabbar, 2018). Some scholars believe policymakers took advantage of
the New Orleans state of emergency.

42
In allocating funds and hiring, charter school principals may have more power and
autonomy than principals of district-run schools (Ciolino et al., 2014). One common perspective
from teachers is, though principals have autonomy with most of the budget, limitations still exist
on capital power, especially pertaining to building repairs. One charter school in the New
Orleans school district stated she was teaching in a substandard classroom. She said the
classroom had mold, and to remove the mold, some ceiling tiles were removed; however, despite
the passage of time, the ceiling tiles were still missing and wires were hanging down from the
ceiling.
Inequity in school facilities funding also exists with the gap based on the socioeconomics
of the students (Filardo, 2016). No federal standards are in place regarding the condition of
school facilities and spending capital on school building construction and maintenance. Facilities
management is still funded by the central office and is not a part of the principal’s discretionary
funds in student-based budgeting (Ciolino et al., 2014). Lower income communities spend a
higher proportion of money for daily upkeep and operations of the school than wealthier
districts.
K–12 Equity in the Public School System
Seventy-five percent of teachers say education funding is too low (L. Farmer, 2019).
Fifty percent of K–12 teachers working in underfunded schools are more likely to consider
leaving the teaching profession. (Gewertz, 2019). Student-based budgeting and general school
funding formulas can show signs of inequity regarding race and socioeconomic status. For
example, funding based on attendance can result in less funding if a school has low attendance.
Schools with low attendance are usually disadvantaged (Chingos & Blagg, 2017). Students living

43
in poverty and at-risk students are rapidly increasing in urban and rural communities in the
United States (Thompson & Thompson, 2018).
When researching Pennsylvania school districts, Fogarty et al. (2015) found the state to
have one of the most inequitable school systems in the nation. Pennsylvania is one of three states
with no basic funding formula. Ranked 43rd in the nation in the amount of state funding
provided to local schools, Pennsylvania has the third widest funding gap between rich and poor
districts. To remedy the inequity in the state, Pittsburgh implemented a form of student-based
budgeting. Even though the student-based budgeting formula requires the money to follow each
student, more funds can be given to students with special circumstances, such as low-income
students, ELLs, and students with special education needs. According to Fogarty et al., a
statistically significant correlation existed between student income level and spending, meaning
schools with higher percentages of low-income students were not necessarily allocated more
funding.
B. D. Baker (2014) said inequity in funding exists between charter schools and public
schools. Baker identified a funding gap of 28%, with the average charter school in the United
States receiving nearly $4,000 less in funding than the average public school student.
Specifically, Lipman (2018) claimed racism was still apparent through segregation, which
impacts schools. Lipman said because Whites and people of color are segregated, school
resources were not distributed equitably. Lipman mentioned that even when Whites and people
of color were attending the same school, overt racism occurred, such as a tracking system where
Blacks and other special programs were usually at the bottom, prolonging segregation.
A tracking system is used by a school system to assign classes to students based on each
student’s perceived ability based on test scores. Students are then placed in classes with other

44
students with similar scores and abilities (Domina et al., 2019). Tracking systems usually include
high, medium, and low tracks. In her research, Lipman (2018) called for transformational reform.
The implementation of student-based budgeting is designed to improve equity between low-
income students of color because the money follows the student to the student’s public school of
choice. Under the student-based budgeting formula, more money, called weights, is given to
students with unique circumstances, including low-income students, ELLs, and students with
special needs (Barnard, 2018).
Average versus actual teacher salaries. A critical factor with student-based budgeting
and equity is teacher salary. When a principal receives the school’s annual budget, teacher salary
is part of the package including teacher raises. In traditional funding, principals did not have to
consider a teacher’s salary because the district provided the staffing, but under student-based
budgeting, the principal is given a set budget to configure how to best fund teachers.
Experienced teachers usually make more than new and inexperienced teachers (Doyle et
al., 2012). When budgeting for teachers, two popular methods exist for charging a school:
average teacher salaries or actual teacher salaries. Average teacher salary means a more
established school with more experienced teachers is subsidized by less popular schools with
new teachers (Snell, 2013). The majority of school districts in the United States charge for
average teacher salaries rather than actual salaries. For example, if the average teacher salary
were $60,000, a school with 10 new teachers and a school with 10 five-year teachers would both
be charged $600,000 on paper. To explain further, schools with less experienced teachers have
more discretionary money for more resources, such as after-school programming, teacher
training, and more curriculum. To demonstrate teacher equity, under the ESSA, a school district

45
is required to provide a budget which would pay for the actual salaries of the teachers and not an
average salary.
Charging schools with actual teacher salaries instead of average teacher salaries increases
equity even though the majority of school districts do not implement this practice (Barnard,
2019). Schools with newer teachers can use discretionary spending on curriculum supplements,
professional development, and more staffing. However, under student-based budgeting, the
potential for discrimination exists in teacher hiring practices (Doyle et al., 2012).
Racial equity in K–12 public education. Achievement equity is not yet a reality in the
American public school system, which could be attributed to the achievement barriers across
race and socioeconomics (Colgren & Sappington, 2015). The United States is more racially
diverse in 2021 than during the 1954 Brown v. Board of Education of Topeka case. In 1960,
Whites comprised 85% of the country’s population, with Blacks being the largest minority at
11%, while Hispanics and Asians made up 5% combined (Center for Public Education, 2016). In
2016, Whites made up about 60% of the of the U.S. population but are expected to make up less
than 50% of the population by 2050.
Equity in education demonstrates students are assigned to schools and programs
regardless of race, including gifted education (Ford, Wright, & Washington, 2016). For example,
Hispanics make up 25% of the U.S. public school population but only 16% of gifted classes, a
40% discrepancy. Also, African Americans make up 19% of the U.S. public school population
but only 10% of gifted classes, a nearly 50% discrepancy (Ford, 2015).
According to Ford (2015), there are 10 ways to remedy the racial inequity in education,
with two heavily involving funding at the principal’s or district’s discretion: provide aggressively
proactive training to staff in gifted education and provide culturally responsive education. In

46
Texas schools, gifted funding is allocated on a per-student basis of up to 5% of the total student
population (J. Hodges, 2018). Based on the total budget, 40% is mandated to be spent directly on
gifted resources, while 60% is discretionary and can be used to pay for anything from electricity
to classroom supplies. Despite the successes of students of color in schools promoting
individualism, evidence still indicates minority students are isolated and marginalized, putting
limits on educational equity and justice (Kohl & Pizarro, 2016).
Many teachers impacted by the implementation of student-based budgeting teach in
urban areas where many students are students of color (S. Farmer & Baber, 2019). Research
focused on the impact an appointed school board has on race, determining if an elected school
board has an impact on communities of color, especially Black and brown communities. The
appointed school board agreed to close 49 schools, which were predominately located in black
neighborhoods, causing students to go to schools farther from home, and causing layoffs or about
5,000 teachers who were mostly black teachers (S. Farmer & Baber, 2019)
Teachers are less likely to remain long term in schools which are predominantly African
American than in schools with students of other racial or ethnic identities (Lipman, Gutstein,
Gutierrez, & Blanche, 2015). In keeping with the equity theory, concerning teachers in New
York, lesser qualified teachers teach poor non-White students (B. D. Baker & Weber, 2016).
Social equity. Higher salaries can draw more quality teachers to the profession. For
example, a teacher with a relatively high salary is less likely to switch districts when near the top
of the salary cap in the district (B. D. Baker & Weber, 2016). In the context of social equity,
student-based budgeting advocates argue the budgeting mechanism is the most equitable way to
fund K–12 public schools, with each student receiving the same amount of funding (S. Farmer &
Baber, 2019). Also, supporters of student-based budgeting assert the funding mechanism is an

47
efficient way to fund schools because the district office no longer must waste money on students
who are not attending. Lastly, student-based budgeting supporters enjoy the shifting of
decentralizing the budget to the principal to decide which enrichment programming (music, arts,
foreign language, etc.) best fits the school as the principal is more aware than district officials of
school needs.
Critics of student-based budgeting argue the funding model treats every student the same
regardless of income (S. Farmer & Baber, 2019). Furthermore, critics believe student-based
budgeting structures force low-enrollment schools to make cuts to programming, extracurricular
courses, teachers, and support staff, including clerks, counselors, and assistant principals. As a
result, low-enrollment schools in a low-income neighborhood begin to look less attractive, and
families exercise the right to school choice, with many parents choosing neighboring privatized
charter schools. Also, small schools have more teaching and staff vacancies due to budget cuts
and disruptions, making small schools in a student-based budgeting system hard to staff.
Student Achievement
While student-based budgeting is used to seek equity, transparency, and flexibility, the
main priority of the model is to increase student achievement (Travers & Catallo, 2015). Student
achievement is an issue in K–12 public education. In the United States, achievement is typically
measured by multiple standards, including standardized test scores, high school dropout rates,
transfer rates, and teacher attrition rates (Lee & Polachek, 2018). Based on the research, student-
based budgeting can limit resources. Students receiving about 10%, or about $1,000 more per
year in school funding have resulted in a 3.0-percentage-point growth in college enrollment and
a 2.3-percentage-point improvement in degree obtainment (Hyman, 2017).

48
Teacher attrition is defined as teachers leaving the profession or changing schools
(Carver-Thomas & Darling-Hammond, 2019). According to Thompson and Thompson (2018),
K–12 education can be achieved when the home, school, and community work as a cohesive unit
to build high self-esteem in the child. When discussing the achievement gap, the comparison is
usually by race (mainly Black and Hispanic students) in comparison to White students. Defining,
measuring, and holding the appropriate people accountable for student achievement continues to
be debated.
According to the literature reviewed, student-based budgeting could remedy the
achievement gap. Under student-based budgeting, the money follows the student wherever the
student goes (Travers & Catallo, 2015). One remedy to combat the perpetuation of poverty in
urban and rural schools is through the installation of collaborative school leadership, which seeks
to provide equitable and quality education where the school, family, and community work in
partnership. (Thompson & Thompson, 2018). According to Jackson et al. (2016), increases in
per-pupil funding by 10% each year over a 12-year span resulted in about 7% higher wages and
over a 3% decrease in poverty for graduates.
The Gap in Literature
A gap in the literature exists regarding teachers’ perspectives on the impact of student-
based budgeting. The federal government is opening the door to involving more teachers in
policymaking (Brown, 2015). The number of teacher opportunities to engage in policy has
grown since the turn of the 21st century. In addition to teacher unions, other educational
organizations help train teachers to get involved in influencing educational policy. Organizations
influencing local, state, and national education policies include National Network of State

49
Teachers of the Year, Teach Plus, Hope Street Group, America Achieves, Educators 4
Excellence, Leadership for Educational Equity, and Teach for America.
Additionally, the U.S. Department of Education provides two Teaching Ambassador
Fellowships, which allow teachers to work collaboratively on a proposed or established
educational policy with lawmakers to provide professional input for one school year part-time
while still teaching full-time (Brown, 2015). The teachers will read bills or proposals and add
opinions to the final bill. Teachers will also analyze and evaluate current educational policies and
make recommendations for modifications if necessary. Teachers can also write opinion-editorials
to newspapers to provide perspectives on educational policies and how the policies impacts some
specific aspect of education. The need for research on teachers’ perspectives of student-based
budgeting’s impact continues because teachers make up the bulk of employees in any school
district. Funding affects the employment of teachers, the resources teachers use in the classroom,
and the number of students teachers teach at one time. Discovering the opinions, attitudes, and
perceptions of teachers can influence how principals, district officials, and lawmakers make
future decisions regarding student-based budgeting. Illinois teachers’ insight can influence
lawmakers to allow teachers to have a permanent place in collaborating with district officials and
policymakers on educational policies. The measure may allow for more balanced decision
making in school districts.
Chapter Summary
The literature related to K–12 public school teachers’ perspectives and experiences with
student-based budgeting, a funding formula rising in popularity, mostly in urban school districts,
was provided. The literature highlighted a variety of implementations in different school
districts, either district-wide or state-wide. Also, the literature revealed a variety of 21st-century

50
laws and policies which prepared the way for student-based budgeting to enter the realm of
education. Furthermore, reasons for support and criticism of student-based budgeting were
detailed from multiple perspectives, including district officials, principals, and lawmakers. Few
qualitative and quantitative studies on student-based budgeting using teachers as subjects exist.
After analyzing the literature, four themes became apparent under the main topic of
school reform: laws and policies, school leadership, school equity, and student achievement.
Subthemes under equity emerged, including racial, social, and gender equity. The literature gave
the reason for why the studied topic is under researched, with a gap in the literature on Illinois
teachers’ perspectives of student-based budgeting and how the school funding model is used to
practice equity in the school system, including equity in resources and funding for students.
The literature revealed many student-based budgeting models are practiced in urban
school districts where the majority of student populations are African American and Hispanic.
Based on the research, teachers are impacted by the funding formula in multiple ways. One
aspect is employment. Because the money follows students rather than schools, a school with
low enrollment can lose positions. Teachers, who work in the district where the qualitative case
study was conducted, can also lose positions if the school closes because there is no guarantee of
being hired at another school in the district. Student-based budgeting, also known as weighted
school funding, is attracting more districts, with some implementing the program district-wide or
beginning with a pilot (Travers & Catallo, 2015).
The purpose of the study was to narrow the gap in literature while expanding the
knowledge and understanding of how teachers experience student-based budgeting’s impact.
Based on the literature and synthesizing information, student-based budgeting is the result of
21st-century school reforms to remedy minimal student achievement by providing equity to all

51
students (Chin & Chuang, 2015). The budgeting method affords principals the latitude to
differentiate fund allocation based on the school’s specific needs (Travers & Catallo, 2015).
Principals are also challenged with the financial task of being compliant when given a set
amount of funds for the school year despite the need being higher than the budget (Kelleher,
2015). Student-based budgeting can be most effective when the school has an inclusive design
team which includes teachers to provide input (Travers & Catallo, 2015).
The following sections address the qualitative case study’s research and design methods
to conduct the study. The three questions which guided the qualitative case study are presented
along with the rationale. Also included are details of the role of the researcher, research
procedures, reliability and validity of the qualitative case study, and ethical procedures. The
strategic instrumentation and permissions to conduct the study are further chronicled.
Additionally, data analysis procedures for the qualitative case study are defined.

52
Chapter 3: Methodology
Student-based budgeting is a K–12 public school funding method whereby school
funding is based on the number of students enrolled in the school (Travers & Catallo, 2015). For
example, if each enrolled student receives $4,000 from the district and the school has 600
students, the school receives $2.4 million. Weights, or additional funds, may be added if the
school has a population of low-income students, ELLs, or special needs learners. The principal
must use the set amount to pay salaries of teachers and other staff members who provide core
and extracurricular programs for students. Each school principal has the autonomy to decide
which programming best fits the school (S. Farmer & Baber, 2019). For instance, one principal
can use funds to pay for a full-time music teacher, while another principal may use funds to pay
for a school librarian. Depending on the amount of money in the fixed budget, a principal may or
may not be able to afford both positions (Vevea, 2014).
In the studied Illinois school district, the central office supplements the schools’ budgets
by paying for certain positions. The positions include one school counselor, one school clerk,
and one assistant principal. Starting in the 2018–2019 school year, special education teachers’
salaries also came from the central office’s budget rather than the school’s budget. According to
Karp (2019), special education teaching positions are one of the hardest teaching positions to fill.
Student-based budgeting is a funding phenomenon in public K–12 schools which
commenced in the late 1990s (Fogarty et al., 2015). The funding trend is practiced primarily in
urban school districts such as Denver, Houston, and Seattle. Student-based budgeting has been
implemented statewide in some states such as Nevada and California.
The student-based budgeting funding model differs from the traditional funding formula
referred to as school-based budgeting or position-based budgeting. In school- or position-based

53
budgeting, the central office pays for school positions and does not give the primary
responsibility to principals to decide how to fund positions. Researchers have evaluated the
benefits of the student-based budgeting funding formula (Hourigan, 2016), as adequate school
funding is paramount for providing quality education (Jackson et al., 2016).
The purpose of the qualitative case study was to explore the impact student-based
budgeting has on teachers. Perspectives and experiences from district leaders and policymakers,
which heavily show support for the student-based budgeting model, have been documented.
Little research on teachers’ views on the topic is presented. Recording teachers’ perspectives and
experiences may provide insight into how student-based budgeting is being implemented.
Teachers are integral stakeholders in the building and may directly see how funds impact
equity in the school (Kahlenberg & Potter, 2014). Though teachers have little to no influence on
how the budgeting formula is utilized in the school or district, teachers influence ways to
fundraise for the school (Abdi, 2015).
The study explored how educational equity is practiced in a school and district. The
following research questions guided the qualitative case study to gain comprehensive
perspectives and experiences of teachers:
Research Question 1: What are teachers’ perspectives of student-based budgeting in a
large Illinois urban school district?
Research Question 2: What are teachers’ experiences with student-based budgeting in a
large Illinois urban school district?
Research Question 3: What are teachers’ views on equity in education in a large Illinois
urban school district?

54
The qualitative research studied the effect of student-based budgeting on teachers. The
following sections describe the research methodology used for the study, including target
population, sampling methods, instrumentation, data collection, and validity and reliability. Also
included are the research design and rationale, role of the researcher, data analysis, and ethical
procedures utilized in the study.
Research Design and Rationale
A qualitative case study was the design of the research, which can be defined as an in-
depth investigation of a single individual, group, or event (Rashid, Rashid, Warraich, Sabir, &
Waseem, 2019). The design is common in social science but is also used in the education field
(Baškarada, 2014). The research design suited the study because its approach provides a specific,
up-close, detailed examination of a subject of a case in its real-life form (Creswell & Gutterman,
2015). The study explored how student-based budgeting is implemented in an urban Illinois
school district and how teachers are affected by the implementation.
The qualitative case study is an appropriate design for the research because it focused on
teachers, a specific group of people working directly inside the school system and in the school
building. Teachers were the chosen demographic of the study because the group of educators do
not make budgeting decisions but is aware of how money is utilized in the school. Teachers’
salaries come from funds allocated to each school from the student-based budgeting method (S.
Farmer & Baber, 2019). Teachers are tasked with teaching students using a set amount of
resources provided by the school based on the principal’s priorities. Teachers were able to offer
an explanation for the observed phenomenon (Gammelgaard, 2017).
The use of a qualitative case study captures the thoughts and feelings of a particular
group of people in a study which is challenging in conventional research approaches (Baškarada,

55
2014). Teacher participants from an Illinois school district expressed the effects of student-based
budgeting on the career chosen as public school teachers in a semistructured focus group setting
(Hammarberg, Kirkman, & de Lacey, 2016). The research design was appropriate and beneficial
for answering the research questions because a diverse group of teachers shared experiences with
other teachers in a nonthreatening environment without fear of retaliation or judgment, which
sets the atmosphere for free exchange.
The type of study focused on why and how observed behaviors occurred (Sutton, 2015).
Focusing on observed behaviors justifies why a focus group format was implemented in the
qualitative study: to help participants identify, share, and clarify viewpoints and specific
experiences. The online focus group promoted synergy and spontaneity and encouraged
participants to comment, explain, share, and disagree (Tausch & Menold, 2016).
Role of the Researcher
The researcher implemented multiple roles for the study, including observer and
facilitator. In qualitative research, it is customary to specify the researcher’s roles in the study
because many researchers are involved in every stage of the research process from concept to
interviewing to coding (Mahnaz, Bahramnezhad, Fomani, Mahnaz, & Cheraghi, 2014). A code is
a detailed concept interpreted by the researcher to ascertain the core meaning of the data
(Theron, 2015).
Participants were observed during the focus group portion of the study while answering
eight questions. The primary purpose of intentional observation was to capture the human
experience without judgment, assumption, or generalization (Ghirotto, 2016). The focus group
was facilitated for continuity, monitoring equity in participant airtime, making clarifications, and
answering questions objectively, if necessary.

56
Encounters with potential participants may have included participating in the same
district professional development sessions or delegate meetings facilitated by the Chicago
Teachers Union. To avoid ethical conflicts over validity or reliability, teachers who were current
or past coworkers or had casual relationships with the researcher, who is a teacher in the school
district, were excluded from the study. No participant of the qualitative case study worked as a
subordinate or immediate colleague to the researcher during the professional workday. The
purpose of the decision was to eliminate the possible false perception of demonstrating power,
control, or bias during any aspect of the study (Padilla-Diaz, 2015). Additionally, no conflicts of
interest were demonstrated during the study. No use of incentives for participation was given to
focus group participants.
To manage variables of participant interaction outside of the study, a focus group meeting
was held in an environment free from any school district or union affiliation and influence. Due
to the COVID-19 pandemic, the focus group took place on Zoom. The school district did not use
Zoom as a virtual platform. Therefore, a personal Zoom account was created to detach the study
from district influence.
Conducting the focus group online was more feasible to ensure participants did not feel
unsafe in the physical environment. After suggesting social distancing in a physical space by
sitting six feet apart, with everyone wearing a mask, two-thirds of participants still felt
uncomfortable. Additionally, wearing a mask during the focus group could have led to errors
during automatic transcription. To avoid ambiguity, words were clearly defined in detail and,
when necessary, read aloud, which enabled participants to ask clarifying or probing questions
(Haines, 2017).

57
Research Procedures
This section highlights the processes used to conduct the study. Case study research has
grown in popularity in the education sector where the planning, preparation, and implementation
of the process afford a unique opportunity for credible research (Harrison, Birks, Franklin, &
Mills, 2017). The section also highlights the rationale for the target population and sample size
(Boddy, 2016). Following professional research protocols promoted efficiency within the
qualitative case study. Further information detailing the instrumentation is provided, including
the use of the following instruments: online survey, in-person focus group, and questionnaire.
Population and Sample Selection
The Illinois school district had over 15,000 teachers who met the qualifications to
participate in the qualitative study. The sample of 21 participants was less than 1% of the target
population. The number of participants was appropriate for the qualitative case study (Vasileiou,
Barnett, Thorpe, & Young, 2018). Qualitative case study samples tend to be small to gain an in-
depth case-focused analysis. One widely used sampling method in qualitative studies is
purposeful sampling. Purposeful sampling is used when a targeted sample needs to be reached
quickly (Ames, Glenton, & Lewis, 2019). For the qualitative case study, maximum
variation/heterogeneity was the chosen method of purposeful sample to provide a diverse range
of cases relevant to a specific phenomenon (Crossman, 2020).
A rigorous process was implemented to determine the participation criteria. Evaluating
who would be included and excluded in the qualitative study was paramount to the validity of the
study. Criteria evaluation was necessary for the qualitative case study because common
participant criteria errors, such as using the same variable to define both the inclusion and
exclusion criteria, can occur (Patino & Ferreira, 2018).

58
Participants must have met specific criteria. The target population of the study included
K–12 active classroom teachers from an Illinois school district. Active classroom teachers are
teachers who are teaching in the classroom during the school year of the study. The teacher must
have been employed for a minimum of three years in the studied school district. The participant
must be a currently employed full-time teacher in the studied school district.
Teachers who demonstrated bias or had little to no knowledge of student-based budgeting
were excluded from the study. The excluded participants included teachers who were laid off,
were on maternity or paternity leave, were on short-term disability, were under investigation, had
a pending lawsuit or complaint against the district, and teachers who had less than three years of
experience with the district. Prekindergarten teachers were also excluded from the qualitative
case study because prekindergarten classes receive funding directly from the state and are not
affected by the district’s student-based budgeting funding formula.
The rationale for the criteria allowed the qualitative study to have participants with ample
experience with student-based budgeting to provide a thorough perspective. Novice teachers and
experienced teachers new to the district were not likely to be knowledgeable enough to have
formulated an opinion of the funding formula. Additionally, new teachers may lack the capacity
to articulate a thorough experience with student-based budgeting. Also, teachers employed with
the district traditionally reach tenure after three years. Teachers with less than three years of
experience have probationary status. Probationary teachers receive little to no protection against
nonrenewal and may fear expressing true feelings and experiences. A teacher is nonrenewed
when the principal does not extend an invitation for the upcoming school year. Probationary
teachers may have apprehension in participating in the study even if confidentiality is provided
and retaliation against a teacher in a study is prohibited by the school district’s policy. To have

59
an array of perspectives from qualified participants, selected teachers ranged in content areas and
grade levels taught.
Participants worked with a variety of student demographics based on student race,
socioeconomic status, academic progress, and school population. The qualitative case study
research method was used to capture participants' subjective experiences centered on a specific
phenomenon (Creswell & Creswell, 2018). The qualitative case study used purposeful sampling
to choose participants. Purposeful sampling includes participants who are familiar with the
phenomenon of study who are willing to express experiences and perspectives in an articulate
manner (Palinkas et al., 2015). Specifically, the participants were chosen to discuss experiences
with student-based budgeting, comparing and contrasting a variety of experiences based on grade
level, subject taught, experiences with other schools, and other budgeting systems such as
school-based budgeting.
Several methods for recruiting members were utilized in the qualitative case study.
Creative measures were used for recruiting participants because doctoral students are limited to
research funding (Rodney, Keller, & Ainsworth, 2016). The Chicago Teachers Union assisted
with recruitment by sending an e-mail of the study to its members soliciting the participation of
eligible teachers, validating the authenticity and validity of the study (see Appendix A). The
Chicago Teachers Union leadership sent the flyer (see Appendix B) about the qualitative case
study via e-mail in the organization’s weekly e-mail updates to members.
Membership to the Chicago Teachers Union is not automatic. Teachers have the choice to
join by filling out a membership card online. Educators who are not a part of the union are less
than one percent, with the majority of the one percent being new teachers with less than three
years of experience. Non-members were not able to be reached because union membership is

60
only known by each school delegate. The teachers union leadership did not provide the
information for the study. Soliciting a nonmember through a personal email presented a
challenge. One challenge with reaching non-members was the study was conducted during the
summer months where reaching out to each school delegate to obtain the personal email of non-
members of the union was an arduous task. Delegates did not respond to emails and no delegate
responded with the names of non-members who were willing to participate. The measures for
participant selection were fully inclusive for eligible candidates who fit the sampling parameters
(Ellard-Gray, Jeffrey, Choubak, & Crann, 2015).
An original online survey was utilized to gather basic statistical information about the
participants, such as age, race, education level, years of service, content taught, and grade level
taught (see Appendix C). The survey was used to prescreen potential participants to ensure the
teachers fit the criteria and to ensure inclusivity to create diversity (Ellard-Gray et al., 2015). The
survey also gathered information on the school demographics where the participant was
employed, including the number of students enrolled, percentage of students who receive free or
reduced lunch, percentage of students with special needs, and percentage of ELLs. The survey
was original because no survey had been created to target the population of participants and
gather particular data. The purpose of a survey is to access important characteristics from a large
sample of people quickly. In qualitative research, a survey often details human behavior (Ponto,
2016).
The method of data collection included subject matter experts (SMEs) providing
professional judgments and suggestions for focus group questions and the questionnaire (see
Appendix D). The four focus groups took place on Zoom and were recorded. The study
participants were asked eight open-ended questions (Weller et al., 2018). Upon completion of the

61
focus groups, participants received a transcript of the respective recording via personal e-mail
addresses. Participants also received a questionnaire via personal e-mail (Bolarinwa, 2015). The
questionnaire was created through Google Forms.
To ensure the accuracy of the qualitative case study, field tests were implemented. SMEs
were utilized. The SMEs had a broad knowledge of the studied subject and the target sample
population to provide effective critiques to the instrumentation and data collection process. A
school district official, teacher union official, teacher with five years of experience, and retired
teacher with 35 years of experience provided feedback on removing bias and loaded wording.
The eight open-ended questions aligned with the research questions. Student-based
budgeting is funds given to schools based on the number of students enrolled. Each student
receives the same amount of money. Exceptions or “weights” are given to students who may be
low-income, ELLs, or have special needs. Each question was based specifically on how student-
based budgeting is designed. The phenomenon of student-based budgeting includes a principal
with one set budget based solely on the number of students, and the principal has the autonomy
to allocate funds where needed. The field test provided feedback on how to modify focus group
questions to ensure objectivity and eliminate subjectivity and assumptions.
To maintain specific and academic standards in the qualitative case study, strict standards
for human protection were incorporated to protect participants against exploitation (Surmiak,
2018). To ensure accuracy, interviews were recorded only with participants’ permission. The
focus group participants viewed the respective transcripts for accuracy. To protect the rights of
the participants, an informed consent form was provided. The form had a written explanation of
the purpose of the study, including design, objectives, procedure, and benefits, and the rights of
the participants (Nusbaum, Douglas, Damus, Paasche-Orlow, & Estrella-Luna, 2017). A signed

62
consent form was collected from each participant before the start of data collection (see
Appendix E).
Participants were safeguarded by using participant IDs and nondisclosure of information
shared during data collection. All research participants participated in the study voluntarily. In
the online Zoom focus groups, participants were protected from online hackers. The Zoom invite
was only sent to participants. The invitations were sent separately. In each e-mail, the first name
along with the grade cluster and school enrollment code were given to the participant to maintain
confidentiality and to assist with coding. Participants were reminded to identify themselves using
the code when speaking in the focus groups to ensure proper transcription. Numbers were coded
by grade level, content taught, and school demographics. A password was issued to each
participant to log on. Once logged on to Zoom, there was a waiting room. E-mails were verified
before entering the Zoom meeting. Once in the meeting, participants were told again
participation was voluntary and exiting the study at any time was allowed without questions.
Instrumentation
Instruments are the tools used to gather information for an eligible study. Instruments
used for the qualitative case study included a survey, focus groups with transcription and field
notes, a questionnaire, and member checking. The instruments were suitable for the qualitative
case study because participants were able to demonstrate unique involvement in the study, and
the instruments allowed for large amounts of data to be coded and categorized (Sutton, 2015).
An original survey was created to access statistical information from participants,
including years of service, grade level and subject taught, level of education, gender, race, school
rating, and student demographics. The purpose of a survey is to access important characteristics

63
from a large sample of people quickly. In qualitative research, a survey often details human
behavior (Ponto, 2016; see Appendix C).
The focus group portion of the study included eight open-ended questions capturing the
views, perspectives, and experiences of the participants. Questions were asked orally. Each
participant received an e-mailed copy of the questions one day in advance to process thoughts
and answer effectively. Unlike a one-on-one interview, participants were the only ones guiding
one another in the course of the conversations (Nyumba, Wilson, Derrick, & Mukherjee, 2018).
The eight open-ended questions were appropriate for the qualitative case study as the
questions allowed the participants to explain the personal and professional effects of student-
based budgeting based on the specified content area, grade level, and years of service (see
Appendix F). Because the teachers had a variety of backgrounds and were employed in schools
with different budgets, the sum of people’s experience can offer more than one single
interpretation in grasping the social phenomenon (Paradis, O’Brien, Nimmon, Bandiera, &
Martimianakis, 2016).
The online questionnaire (see Appendix G) was distributed to all participants
immediately after each focus group. The questionnaire, consisting of four questions, was a
Google Forms document sent to each participant’s e-mail address. The purpose of the
questionnaire was to allow participants one-on-one time to reflect on recently shared ideas, with
no potential influence from other participants.
Data Collection
The data collection section includes a discussion of how data collection occurred in the
qualitative case study. A preliminary survey, virtual focus groups with transcripts and field notes,
and a questionnaire were the instruments used in the qualitative case study, which generated a

64
large amount of data (Sutton, 2015). An online survey was given as an alternative to a physical
survey, as mandated medical quarantine was in place for citizens of the district. Online surveys
were sent to each participant’s e-mail address to select a variety of eligible participants. Surveys
of selected participants were downloaded into Microsoft Word and put into a PDF file. A secure
link where the survey was housed was included in the e-mail for participants to click. After
surveys were conducted, teachers who met the criteria were purposely selected for the focus
groups.
Twenty-seven participants were selected and divided into four heterogeneous focus
groups. The rationale for the number of participants allowed for the absence of two participants
per group while still meeting the minimum number of participants needed for a qualitative case
study. Each focus group was divided into three categories of participants. The three categories of
participants were based on school enrollment. The phenomenon of student-based budgeting
means teacher staffing and programming are based solely on the number of students enrolled.
Gathering perspectives from the teachers working with different school populations was sought
in the qualitative case study. One category of teachers was employed in schools with one to 300
students. The second category of teacher participants was employed in schools with 301 to 700
students. The third category of teachers was employed in schools with more than 700 students.
Focus group questions and questionnaires were approved by the Institutional Review Board
(IRB).
Data Preparation
All documents, including surveys, SMEs’ critiques, focus groups transcripts and field
notes, consent forms, and questionnaires were housed securely in Microsoft Word. Documents
were saved in PDF format to keep from being edited without the express permission of involved

65
parties. To prepare for data analysis and to prevent any distorted data from entering the final
analysis, recorded notes used in the focus group were transcribed through the online transcription
service Rev.com. Field notes were coupled with the transcripts to capture notes on impressions,
behaviors, and nonverbal cues which are not properly captured through audio recording (Sutton,
2015). Field note behaviors included laughing, gestures, long pauses, and looks of discomfort.
Data Analysis
The premise of the qualitative case study was to synthesize the experiences and
perceptions of teachers to interpret the meaning of how teachers are impacted by student-based
budgeting and if student-based budgeting demonstrates educational equity. When analyzing the
data, several categories were used. Narrative analysis was used to summarize the data (Parcell &
Baker, 2017). Narrative analysis was an appropriate method for the qualitative case study
because the method involves focusing on the experiences of each participant and the unique
experience and perspective of student-based budgeting (Parcell & Baker, 2017). The qualitative
case content analysis online focus groups, focus group transcripts, and questionnaires.
Behavioral data were taken only from the focus group portion. Discourse analysis was also
gathered from the focus group portion of the study in order to observe participant interaction.
The data were coded using a list of positive and negative responses.
Reliability and Validity
In a qualitative study, establishing reliability and validity is necessary. Reliability
demonstrates consistency, which means if the same test were performed with another group with
the same demographics, the outcome would be the same. Validity refers to the extent to which
the measurement measures what it is intended to measure (Palinkas et al., 2015). Both reliability
and validity were shown through online surveys, focus groups’ transcripts, and questionnaires.

66
Trustworthiness was proven by using four components: credibility, dependability,
transferability, and confirmability (Fusch, Fusch, & Ness, 2018). Qualitative research differs
from quantitative research because there is no one right answer in qualitative research, no
absolutes, and not just one reality as in quantitative research (Anney, 2014). Therefore, ensuring
qualitative practices are not measured through quantitative measures was enforced.
Credibility and dependability were established in the qualitative study through
triangulation implementation and discussing and clarifying potential research bias. The study
was executed in three ways—SMEs’ analysis of questions, semistructured focus groups, and a
questionnaire after the focus group—ensuring triangulation. Member checking was also utilized
in the qualitative case study to establish credibility and dependability (Birt, Scott, Cavers,
Campbell, & Walter, 2016). Member checking affords each voluntary participant an opportunity
to review the recorded data, including a transcript of the audio recording, which occurred
through the Zoom online platform. The categories of teachers were based on school enrollment.
The phenomenon of student-based budgeting involves schools funding based on student
enrollment, which is how teachers are hired and salary is determined.
The first category of teachers in the online focus groups was from low-enrollment
schools with one to 300 students. The second category of teachers was from medium-enrollment
schools with 301 to 700 students. The third category of teachers was from high-enrollment
schools with more than 700 students.
Participants reviewed a copy of the respective transcribed focus group interview for
accuracy. Having participants check data validated the collection process, increasing credibility
and participation involvement (Varpio, Ajjawi, Monrouxe, O’Brien, & Rees, 2017). Having

67
participants view transcripts also ensured the ethics of the research were preserved (Saunders,
Kitzinger, & Kitzinger, 2015).
Transferability in qualitative research means the same as generalizability or external
validity in quantitative research (Korstjens & Moser, 2018). Transferability cannot prove a
study’s findings will be applicable, but transferability demonstrates the research findings could
be relevant in other contexts, situations, settings, and populations. Transferability applies to the
qualitative study because other teachers’ experiences and perspectives on how the profession is
affected by student-based budgeting would be similar. The findings, variables, and instruments
from the qualitative study may be useful in other urban school districts using student-based
budgeting. Transferability is an imperative factor in a qualitative case study because many school
districts in other cities outside Illinois can use the study to better help district and political
officials analyze for similarities in perspectives and experiences in order to improve or maintain
the funding formula.
Confirmability is the final aspect of trustworthiness, which means the results of the
research can be corroborated with others and validated by others. The interpretations from the
qualitative case study were solely based on the data gained from the online surveys, focus groups
with transcription and field notes, a questionnaire, and member checking (Anney, 2014). Based
on the variety of responses from study group participants by grade level, subject taught, and
student demographics taught, confirmability was evidenced in the qualitative case study.
Ethical Procedures
Qualitative researchers can face ethical challenges different from those faced by
quantitative researchers because, unlike quantitative research in which data are numerical and
more concise, qualitative research relies on the interpretation and synthesis of participants’

68
information (Mahnaz et al., 2014). Following ethical standards is the highest priority of the study
to ensure participants are protected and valid and reliable research can occur. For the study to be
bias-free, strict standards and procedures were demonstrated in each step. To further decrease
bias, interaction with participants for the qualitative case study was professional and not casual.
Dialogue only occurred among participants, with no outside influence.
An informed consent form required participants to indicate only professional conduct was
instituted during participation in research, there was no coercion to respond in a certain way, and
all experiences, perceptions, and opinions were original with no outside influence (Haines,
2017). Participants were informed orally and in written form of the purpose of the research and
that participation was voluntary and anonymous. Written and oral notification occurred before
the virtual groups. Participants were told study participation could end at any time during the
study with no questions asked. To protect the identities of participants and schools, fictitious
names were used.
To protect adult participants’ information and the credible reputation of the research, the
ACE IRB reviewed the qualitative case study proposal to ensure the study met requirements for
interviewing adult participants. The school district research review board provided preliminary
permission to conduct the study (see Appendix H) contingent upon approval of the ACE IRB.
Once the ACE IRB approved the instruments for the qualitative case study, the school district
research review board provided full permission to conduct the study (see Appendix I).
A comprehensive proposal of the qualitative case study was sent to the school district’s
research review board seeking approval to interview teacher employees. The ACE IRB also
approved the proposal to interview study participants in an ethical manner. Appendix J is

69
evidence of the Illinois school district’s guidelines for doctoral candidates and other researchers
who wish to study employees, students, or parents in the district.
Chapter Summary
The rationale for the research methodology, selection process, instruments, and ethical
procedures for the qualitative case study were detailed. The qualitative case study acquired
teacher perspectives and experiences of the impact of student-based budgeting on teachers.
Included were the selection process for participants and selection rationale, the types of
instruments used in the study to demonstrate triangulation, and the rationale for the chosen
instruments. The data collection process and ethical procedures also were highlighted. The
following sections outline the results of the qualitative case study.

70
Chapter 4: Research Findings and Data Analysis Results
The purpose of the qualitative case study was to explore Illinois K–12 public school
teachers’ perceptions, opinions, and experiences with student-based budgeting regarding equity
in education. Active classroom teachers from an Illinois school district where the student-based
budgeting formula is practiced were the voluntary participants of the study. Online focus groups
through Zoom made up the primary data collection for Illinois teacher participants to articulate
perspectives of the budgeting formula based on experiences and perceptions in the workplace.
The results section of the qualitative case study commences with the participant selection
process, followed by the focus group procedures. The research questions of the qualitative case
study were guided by the equity theory developed by Adams (1963). The four semistructured
focus groups provided detailed information leading to valid outcomes and themes, which are
detailed in the following sections.
The qualitative case study was guided by the equity theory, which is considered a justice
theory. The theory was originated by American behavioral psychologist Adams (1963). The
theory was used to ascertain if the allocation of resources is fair between relational parties.
Adams likened equity to the correlation between ratios: the contributions the individual makes to
the rewards for each individual. Adams, when describing equity, referenced the dissonance
theory, the belief individuals have a tendency to seek consistency among others’ beliefs or
opinions. The equity theory states if inconsistency exists among attitudes and behaviors,
something needs to change to eliminate the dissonance (Adams, 1963). Additionally, the
foundation of the justice theory is the belief individuals enjoy fair treatment. The original
concept appeared in a business-related article. The behavioral psychologist’s focus was the
employer–employee relationship. Adams said the relationship should not be seen as just an

71
economic transaction, but the relationship should also involve elements of relative justice, which
supersedes business and provides perceptions of equity and inequity. The theory also explains
whether the allocation of resources is fair to both relational parties.
The qualitative case study was guided by three research questions. The questions were
integral to the study and were integrated into the focus group questions and the questionnaire.
The research questions were created with guidance from the equity theory, providing a
framework for the qualitative case study.
Research Question 1 asked, What are teachers’ perspectives of student-based budgeting
in a large Illinois urban school district? The question examined teachers’ opinions of the
rationale for student-based budgeting by the school district and how the formula has affected the
quality of education of K–12 students. Additionally, comparing and contrasting the budgeting
formula to another variation of student-based budgeting was examined to ascertain which
budgeting formula is more beneficial for district stakeholders. The question also asked why the
former budgeting formula may have been abandoned in order to implement student-based
budgeting.
Research Question 2 asked, What are teachers’ experiences with student-based budgeting
in a large Illinois urban school district? The question asked participants to examine day-to-day
realities of student-based budgeting in the classroom, school, and district. The question also
explored how student-based budgeting impacted interactions with school administration,
colleagues, students, families, the teachers union, community members, and district and political
officials. Analyzing the experiences of the participants revealed if the budgeting formula
impacted teachers in different ways based on grade level, years of service, content area, school
enrollment, school location, or socioeconomic status of students’ families.

72
Research Question 3 asked, What are teachers’ views on equity in education in a large
Illinois urban school district? The question provided participants the opportunity to detail the
meaning of equity. The way participants perceive equity can vary according to the level of equity
student-based budgeting provides. Additionally, the question asked teachers to explore feelings
about the budgeting formula’s impact on the educational quality of students in the district.
Furthermore, participants’ knowledge of equity was examined and how equity can exist in a K–
12 public school system.
Data Collection
Data collection included using a survey, four focus groups with transcription and field
notes, a questionnaire, and member checking. The use of instruments is common in qualitative
studies. The procedural use of the instruments demonstrated triangulation, which is necessary to
demonstrate the validity and reliability of the qualitative case study (Dikko, 2016).
The qualitative case study included 27 teachers in an Illinois school district. The
voluntary participants were purposely chosen to be a part of a focus group. Approximately
15,000 eligible candidates received an official e-mail from the district’s teachers union. Two e-
mail blasts were sent in the same week, on June 10 and June 13, 2020. The e-mail articulated the
purpose of the study, the criteria, the name and contact information of the researcher, and the
primary method of the study, which was a virtual focus group. The flyer for the study was also
included in the e-mail (see Appendix B). Forty-three interested people responded by e-mail or
phone. After prescreening the candidates for years of service, grade taught, and school
enrollment, 30 candidates were eligible and invited to participate in the focus group.
Twenty-one was a sufficient number for the selected qualitative case study for evidence
of saturation (Vasileiou et al., 2018). Thirty candidates were selected in case some of the

73
teachers chose to exit the study. Three participants did not complete the study. The first
participant had to exit due to having a baby earlier than expected, the second participant could
not continue with the study due to illness, and the third participant was unable to finish the study
while on vacation because Internet connectivity was not strong enough to stay connected to the
focus group.
After the 30 participants were deemed eligible for the study, participants received
separate e-mails with next steps. Three actions were given to participants: completing a statistical
survey through Google Forms (see Appendix C); reading, signing, and returning the informed
voluntary participant consent form; and selecting dates and times available for a focus group.
Each participant responded by the June 30, 2020, deadline. Schedules for the virtual focus
groups were sent out on July 1, 2020. The dates and times of the four focus groups were
Tuesday, July 7, 2020, at 3:00 p.m.; Saturday, July 11, 2020, at 11:00 a.m.; Sunday, July 12,
2020, at noon; and Friday, July 17, 2020, at 5:00 p.m. To maintain strict online security, a
username and passcode were given to each participant. Participants were stationed in a virtual
waiting room before entry until names and e-mails were verified. Data collection began on June
28 and ended on July 20, 2020.
The 27 participants were divided into four heterogenous focus groups. Heterogenous
grouping was selected to have participants hear and glean information from other perspectives
and experiences so comparisons and contrasts could be made. Each focus group was asked to
choose four dates and time of best availability. Each participant was aware the focus group
would be online. The goal of the research was to complete the focus groups within five weeks
after participant selection in order to begin data analysis in a timely manner. The time frame
between collecting data from the first focus group to the fourth was 10 days.

74
Each virtual focus group session comprised eight questions. Each focus group had seven
participants, with the exception of the first focus group, which had six participants. Three to 10
participants per focus group is a rational number for discussions lasting up to 90 minutes to
afford each participant the opportunity to engage (Nyumba et al., 2018). Each focus group was
recorded with the permission of the participants. After the recording of each focus group, an
automated transcript was completed. Each participant received an e-mailed copy of the
transcribed version of the focus group with each participant's comments highlighted so the
participant could easily locate responses in order to analyze for accuracy. Participants also
received a questionnaire (see Appendix G) to gather new perspectives and information as a result
of the focus group.
Of the 27 study participants, 10 were male and 17 were female. Seven teachers worked at
low-enrollment schools, 10 at medium-enrollment schools, and 10 at high-enrollment schools.
Twenty-three teachers had earned advanced degrees, either a master’s degree or above.
To maintain participant confidentiality during the focus groups, each teacher was
identified by first name and school enrollment code. The first name was followed by two letter
codes. The first letter represented the grade cluster. Grades K–5 used the letter E, middle school
grades used the letter M, and high school grades used the letter H. The second code represented
the category of school enrollment where the participant worked. For example, participants in
low-enrollment schools with one to 350 students used the letter A, participants in medium-
enrollment schools with 350 to 700 students used the letter B, and participants in high-
enrollment schools with more than 700 students used the letter C. For example, “Mary EB”
reveals Mary works in a medium-enrollment elementary school. Using the codes helped identify
participants and code the experiences and themes.

75
The first focus group took place on July 7, 2020. The seven participants had agreed on
the time. An hour before the focus group, one participant asked to be rescheduled due to an
emergency. The first focus group lasted 70 minutes. The second focus group took place on July
11, 2020, at 11:00 a.m. and lasted 64 minutes. Seven participants were present at the second
focus group. The third focus group took place on July 12, 2020, at noon and lasted 67 minutes.
Seven participants were present during the third focus group. The fourth focus group took place
on July 17, 2020, at 4:30 p.m. and lasted 71 minutes. Seven participants were present during the
fourth focus group.
Unusual circumstances occurred during the focus groups. One participant who was
scheduled for the first focus group had to reschedule and participated in the second focus group.
Another participant was scheduled for the third focus group but rescheduled for the fourth focus
group. Participant AZ came to the fourth focus group 18 minutes late due to technical issues
logging in to Zoom. The same participant exited the focus group 11 minutes before the
conclusion due to an emergency. In the fourth focus group, Participant Y had an unstable
Internet connection; due to the technical difficulty, the participant was asked to repeat comments
two times. Some of the participant’s original responses were not fully transcribed by the Rev
transcription service. A subsequent private conversation with Participant Y obtained clarity from
the transcript to ensure accuracy. As a result, Participant Y responded to the questions through e-
mail which were not picked up by transcription. Table 2 describes the demographics of the
elementary and middle school focus group participants in the qualitative case study. The
diversity of teacher participants added a variety of perspectives, experiences, and opinions to
ascertain similarities and differences among low-, medium-, and high-enrollment schools.

76
Table 2
Elementary and Middle School Teacher Participants
Participant
ID
School
enrollment
Grades taught
Content taught
% students receiving
free or reduced lunch
% students
of color
A 277 K–4 All 76–100 76–100
B 468 K–8 Physical education 76–100 76–100
C 831 6–8 Science 26–50 26–50
D 750 K All 26–50 26–50
F 460 K–5 ELA, social studies 76–100 76–100
H 375 K–5 ELA 76–100 76–100
I 300 6–8 SPED, math 76–100 76–100
J 291 6–8 Math 76–100 76–100
K 625 6–8 ELA, social studies 76–100 76–100
M 571 K–5 ELA, social studies 76–100 76–100
O 850 6–8 Science, ESL 76–100 76–100
P 337 6–8 SPED, ELA 76–100 76–100
T 341 K–5 ELA 76–100 76–100
U 550 K–5 Math 76–100 76–100
V 1,360 K–5 All 76–100 76–100
X 500 6–8 Science 76–100 76–100
Y 465 6–8 ELA 0–25 0–25
Z 265 K–5 SPED, ELA, math 76–100 76–100
Note: ELA = English language arts; SPED = special education; ESL = English as a second language.
Table 3 provides a demographic description of the teacher participants in high school. All
teachers are tenured with more than three years of experience; the average high school teacher

77
had 13 years’ experience. To preserve the confidentiality of participants, the experience level is
not provided.
Table 3
High School Teacher Participants
Participant
ID
School
enrollment
Grades taught
Content taught
% students receiving
free or reduced lunch
% students
of color
E 1,036 9–12 Librarian 76–100 76–100
G 500 9–12 Social studies 51–75 76–100
L 652 9–12 SPED, ELA, science 51–75 76–100
N 2,250 9–12 Business, computer
science, math
51–75 51–75
Q 1,349 9–12 Math 76–100 76–100
R 1,000 9–12 Social studies 76–100 76–100
S 450 9–12 Social studies 76–100 76–100
W 753 9–12 Math 76–100 76–100
AZ 143 9–12 Theater, digital media
76–100 76–100
Note: ELA = English language arts; SPED = special education.
All participants met the requirements for the study. All participants had been employed
for a minimum of three years in the district studied. Additionally, teachers were able to articulate
an accurate definition of student-based budgeting in the preliminary survey. Demonstrating an
understanding of student-based budgeting was vital to participating in the focus group because
teachers could have candid discourse regarding general perceptions and personal experiences.
Each of the four focus groups was audio recorded on Zoom. Before each focus group, the
voluntary participation form was summarized, and participants were told participation was

78
voluntary and the participant could exit the focus group at any time without explanation or
feeling pressure to remain. Each participant was assured of confidentiality. Additionally, detailed
notes were taken, including verbal and nonverbal cues and the probing and clarifying questions
which arose from the original open-ended questions.
Data Analysis and Results
Analyzing and making interpretations of the data proved to be a lengthy process. To
maintain confidentiality of data, the following security procedures were practiced. Raw data,
including participant selection surveys, focus group recordings, questionnaires, transcripts, and
informed consent forms, were stored electronically. The focus groups were completed using the
proper protocols and guided by the purpose of the qualitative case study. Proper protocols
included informing participants participation was voluntary, participation will remain
confidential, and first names were used in the focus groups for participants and the researcher to
better identify one another. The names of schools were not mentioned, nor years of experience,
neither the subject level or grades taught. Letters were used to identify the participants in the
written and oral defense of the dissertation. Participants were told the focus groups would be
recorded, the estimated time of the focus group, and the number of questions which would be
asked. Table 4 presents the themes and subthemes gathered from the qualitative case study. Five
major themes emerged, and each theme had a minimum of two subthemes.
After listening to the response of participants from all four focus groups, data was
synthesized by writing down repeated experiences and perspectives of participants. The
repetition of certain topics transcended all of the focus groups including grade levels of
participants, years of service, and content taught. The number of participants and how often the
topic was spoken in detail were tallied with the top five discussion topics becoming themes. The

79
differing points of view were categorized based on the demographics of the participants. For
example, teacher stress stemming from the consequence of student-based budgeting was
mentioned by 25 out of 27 participants and accounted for approximately 25 percent of the
discussion time in each focus group.
Table 4
Themes and Subthemes
Theme Subthemes
Theme 1: Teacher stress • Work overload
• Understaffed
• Teaching undesirable subjects
• Fear of losing position
• Pressure to fundraise
Theme 2: Inequity in education • Loss of Black educators
• Lack of morale
• Teacher mobility
• Imbalance of content and grade-level resources
• Competition
• Housing
• School closures
Theme 3: Principals’ priorities • Attendance and enrollment
• Staffing practices
• Test scores
Theme 4: Lack of trust in the district • The 20th day rule
• De-professionalization of teachers
Theme 5: Teacher advocacy • Active participation in school organizations
• Parent communication
Theme 1: Teacher Stress
Teachers are reporting more stress in the workplace. Ninety-four percent of middle
school teachers are stressed, and the burden needs to be reduced to improve student outcomes
(Herman, Prewitt, Eddy, Savale, & Reinke, 2020). Based on responses from the 27 teacher

80
participants, teacher stress was an impact from student-based budgeting. Differing reasons were
given to stress. High school teachers’ stress was based more on teaching more subjects than
contracted for while elementary and middle school teachers attributed stress teaching more
subjects without ample resources.
Work overload. Because the bulk of student-based budgeting goes toward school staff
salaries, little money is left for instructional materials. Lack of books was the main instructional
concern participants faced in the schools. Teachers perceived administrators use the lack of
funding for instructional materials to criticize textbooks and workbooks, claiming the books
hinder creative instruction. Teachers are then pressured with the task of finding and vetting more
online instructional materials, which takes approximately two hours weekly. In addition, the
educators said once high-quality materials are located, another two hours per week are spent
making copies and compiling instructional materials. “Even with making copies, that is
sometimes an issue. The administration may say that we are making too many copies. Last
school year, in the 2018–2019 school year, we ran out of copy paper in February,” stated
Participant C.
Understaffed. Of the 12 high school teachers among the four focus groups, all 12
admitted to teaching an extra class which was not a part of the original schedule for the school
year. At least one class was added to the participants’ schedules after the start of the school year.
The action was implemented rather than hiring an extra teacher. The action resulted in four
participants teaching a class without proper certification. According to participants, the Illinois
State Board of Education notes a teacher can teach a class without proper certification as long as
the class is not 50% of the teacher’s caseload. Some high school teachers, who teach five classes
daily, are pressured to teach a sixth class because there is not enough money in the budget to hire

81
a full-time teacher. “It is cheaper to pay just an extra hour per day rather than hire a full-time
teacher,” according to Participant Q.
Teaching undesirable subjects. Some teaching positions are covered by the school
district and not under the jurisdiction of the principal in the individual school. For example,
special education and preschool teacher positions come from the central office’s budget. The two
positions are unique and have certain mandates by the state. As a result, the principal does not
have to consider the salary of a pre-K or special education teacher. Three participants (two from
the second focus group, one from the third focus group) stated veteran teachers with
certifications in special education or preschool are at risk of being removed from teaching a
subject enjoyed by the educator. In order for principals to balance the fixed school budgets,
veteran teachers have been switched from teaching science to teaching special education.
Participant H was told, “‘Even though you are the greatest ELA [English language arts]
teacher, I can’t afford to keep you in my budget.’” Participant H was told about the change at the
end of the school year and was placed as a special education teacher the following school year.
Participant U, who works in a low-enrollment school, shared a similar experience:
As we lose students, we have less and less resources for the things we need. The librarian
got pulled from being a librarian to be a special education teacher because it was cheaper
and because she was certified in that area. So, staff don’t teach what they love, and arts
education has to be sacrificed because they are deemed as less important.
Fear of losing position. Each year, most teachers earn two raises. One raise is a cost-of-
living raise which every teacher in the district receives July 1, the start of the fiscal year. The
second raise is a step raise which teachers earn for years of service. The raise is earned on the
anniversary of the teacher’s start date. As a teacher’s salary increases, the fear of losing the

82
position increases. The fear comes from the set amount of funding schools receive annually for
student-based budgeting. Teachers’ salary raises must also be accounted for in the budget.
According to participants, principals use several strategies to force teachers to leave the
school or transfer into a position which is covered by the district rather than the school. If the
strategies do not work, principals may seek to fire the veteran teachers by providing low
evaluations based on classroom observations. According to six participants, one strategy
principals have used to provoke a veteran teacher to transfer schools in order to have more
funding is to switch a teacher’s grade or content assignment. For example, a teacher who has
taught kindergarten for 12 years could be forced by the principal to teach middle school science
with only a week’s notice. Principals have the power to change the grade and subject taught by
teachers if the educators have the appropriate credentials.
Though Participant L has credentials in pre-K–12, the teacher has always taught middle
and high school students in a departmentalized fashion. The veteran teacher said the principal
was accustomed to switching veteran teachers annually. Participant L said,
After teaching fifth grade for three years, they [veteran teachers] would be moved to
kindergarten. . . . My principal said, “Oh, if you are here next year, I will need you in pre-
K,” so I went back to [teaching] high school because I never taught anyone below
seventh grade. That was her [the principal] signal to get me to leave. I knew it would take
a couple of years to be a good pre-K teacher.
Participant J also was forced to leave middle school math, which comprises Grades 6–8
and 11- to 14-year-old students. The veteran teacher had 21 years in education but had never
taught third-grade math. Participant J said the summer vacation was spent learning effective
strategies on teaching lower-level math content to 7- and 8-year-old students. When the

83
following school year began, the teacher received low ratings from the principal for low student
engagement and lack of content knowledge of third-grade math. Participant J received an overall
unsatisfactory rating, which can be grounds for layoff, according to the district, even if a teacher
was tenured but the teacher failed the remediation process.
Tenure is normally obtained by the district after three years of service. Remediation
because of Participant J’s unsatisfactory rating was completed. Remediation occurs when the
principal places the low-rated teacher on an improvement plan. The principal creates goals for
the teacher to meet by a specified time. A consulting teacher is provided by the school district to
advise the teacher under remediation on strategies to improve teacher practices and student
learning. The consulting entails weekly in-person observations for approximately half the school
year and a recommendation made by the consulting teacher to the principal regarding whether
the teacher should be considered proficient or still unsatisfactory. A consulting teacher is a
teacher with at least three years of experience who received a high rating on the last evaluation.
Even with a positive recommendation from the consulting teacher, the principal still chose to fire
Participant J. If a teacher does not pass the remediation process, the teacher is not only let go
from the school but also fired from the district. At the time of layoff, Participant J made an
annual salary of $99,000. A new teacher with a bachelor’s degree makes an average of $54,000
annually in the school district.
After the layoff by the principal’s recommendation, Participant J spent two years in
arbitration, challenging the layoff, claiming the unsatisfactory rating was unjustified and was
only a result of having a high salary. Participant J showed evidence of student growth and proof
of meeting goals the principal had set during the remediation process. Participant J won the case,
was hired back by the district, and received a check for lost wages.

84
Participant J subsequently interviewed with three schools for a middle school math
position. The teacher thought the experience as not only a math teacher but also a math coach
would compel principals to offer the teacher a position. The first two principals were leaders of
low-enrollment schools. Participant J said,
I received an offer from each one. And about two days after the offer, the principals said
they really liked me, but they had to rescind their offer because I cost too much for their
budgets. I thought, here we go again.
After the third interview, in a medium-enrollment school, Participant J was finally offered a
seventh-grade math teaching position.
Participant H perceived veteran teachers are punished because if a teacher wants to
switch schools to be closer to home or desires a change in environment, the teacher is hesitant
because the teacher likely will not be hired despite expertise. The teacher will cost more than
principals are willing to spend. Participant C stated, “I am the cost of two teachers.”
Besides veteran teachers with a decade or more of experience, art teachers and librarians
seem most at risk of losing teaching positions. The positions are perceived to be more of a luxury
than a necessity. Participant E said, “Less than a third of schools in the district have a librarian.”
Participant E is a high school librarian who has managed to keep the librarian position when
more than half of librarian positions have been eliminated from the school district in the last 10
years. Participant E said,
I only have a bachelor’s degree. Once I figured out how student-based budgeting works, I
chose not to go back to school to earn anymore degrees. I do not want to cost too much so
the principal will be tempted to get rid of me if the budget gets cut.

85
Participant E was referring to teachers’ salaries increasing based on their level of
education. Participant D had a different perspective than Participant E. Participant D felt
compelled to go back to school to earn as many degrees and certifications as possible to remain
relevant and marketable to maintain employment in her school and across the district. Participant
D has a bachelor’s degree, two master’s degrees, an English language arts (ELA) endorsement, a
math endorsement, a science endorsement, a social studies endorsement, an English as a second
language endorsement, and is currently earning an endorsement in special education. “This way I
will not be fired even if they close my current position. I would have to be placed somewhere
else in the school building because I also have the most seniority,” Participant D said. Table 5
presents the six pay lanes categorized by the school district studied based on education
attainment. The table is a comparison between a first-year teacher and a teacher with 10 years of
experience. When referring to salary compensation in the third column, the data show the
teacher’s annual salary including the pension pickup by the district.
The responses from the veteran teachers answered Research Question 2: What are
teachers’ experiences with student-based budgeting in a large Illinois urban school district? The
participants’ experiences illustrated the fears of veteran teachers. From the participants’
experiences, experience and dedication are deemed less valuable by the district and some school
principals than maintaining a strict school budget. The responses about veteran teachers’ fears of
losing teaching positions also showed schools with higher enrollment may have greater
flexibility in hiring more experienced teachers because more students mean more money. As a
result, low-enrollment schools may be more likely to have less experienced teachers than
medium- or high-enrollment schools. Additionally, based on the responses, teachers at low-

86
enrollment schools are more likely to teach multiple grade levels and subjects, causing more
stress than departmentalized teachers who teach one grade level and have one content focus.
Table 5
School District Pay Lanes-Based Education Attainment
Lane
Educational attainment
Salary compensation based on
1 year of experience for the
2019–2020 school year
Salary compensation based on
10 years of experience for the
2019–2020 school year
1 Bachelor’s degree $58,365 $80,528
2 Master’s degree $62,408 $84,570
3 Master’s + 15 credit hours $64,429 $86,592
4 Master’s + 30 credit hours $66,450 $88,612
5 Master’s + 45 credit hours $68,472 $90,633
6 Doctoral degree $70,494 $92,655
Note: When referring to salary compensation in the third column, the data show the teacher’s annual salary
including the pension pickup by the district. The data are from The 2019–2024 Tentative Agreement. Agreement
Between the Board of Education of the City of Chicago and the Chicago Teachers Union, Local No. 1, American
Federation of Teachers, AFL-CIO, by Chicago Teachers Union, 2019. Retrieved from https://www.ctulocal1.org/wp
-content/uploads/2019/11/PSRPAllTablesforCTUvote2019.pdf
Pressure to fundraise. Participants said the bulk of student-based budgeting goes toward
paying staff salaries, predominantly teacher salaries. As a result, instructional materials and
extracurricular programming may be lacking. Teachers admitted to asking parents for support to
obtain resources. According to participants, teachers who teach in affluent neighborhoods tend to
ask parents for class supplies. School fundraisers are often the norm where parents write a check
for resources. Teachers who service the students of affluent families said parents do not mind
helping because they know the donations are cheaper than paying for private school. Participant
B stated, “One year, parents donated about $150,000. The fundraising paid for an extra teacher,

87
teacher aide, and instructional materials such as copy paper, ink for printers, and other
stationery.”
The schools with the lowest budgets are in the neighborhoods of Black students,
according to Participant U:
The schools have higher needs because they have a higher need population. Those
parents don’t have enough time or energy to fundraise. Many of our parents are focused
on housing, and we have many mobile families, which causes our enrollment to fluctuate.
Sometimes our enrollment is at a medium level and we seem to do okay with providing
resources, and other times we are low, which causes us to cut staff, and we are back
struggling again,
The third-year teacher continued: “You have people who need the most but provided the least,”
according to Participant U.
Teachers of low-income students admit fundraising does not help garner enough money
to cause a tangible change. Participants who teach low-income students stated it is a challenge to
even have parents pay for field trips. Participant H said the school initiated a fundraiser by
partnering with a restaurant chain. The fundraiser, called Family School Night, encouraged
families to visit the restaurant at a specified time, buy a meal, and mingle with the school staff.
The restaurant chain allowed the school to keep 20% of the revenue made during the four hours
of the event, which equaled $600. The money was used to buy copy paper and art supplies.
Teachers also are asked by school administrators to use preparation periods and free time
outside of work hours to seek donations through Donors Choose or to apply for grants. Donors
Choose is a website teachers utilize to solicit the general public, businesses, and nonprofit
organizations for financial contributions or tangible resources for classroom or school needs. The

88
educator creates an online profile describing school demographics, school need and rationale,
and may include a visual to provoke sympathy from potential donors. Participant T teaches at a
low-income and low-enrollment school. She completed a Donors Choose proposal and received
a wireless listening center and flexible seating. (Flexible seating replaces the traditional seating
arrangement where students sit in a set space. The format provides different seating options and
allows students to choose where they sit. The purpose is to reduce the amount of time sitting in
one location). Participant T said,
It took me about two hours to complete the grant, and about five months to get fully
funded. . . . My students and I were excited to get fully funded, but I felt we had to wait
too long to get 21st-century resources to improve academics. These resources should
already be a part of budgeting.
In the district studied, elementary teachers are afforded four self-directed preparation
periods per week, with one principal-directed preparation period per week. The preparation
periods are an hour in length. Teachers can use the time to lesson plan, assess student work,
collaborate with colleagues, communicate with parents, and do research. Adding fundraising to
the preparation schedule can increase stress among teachers. Normally, students are participating
in extracurricular courses while teachers are self-directed. Participant G said 97% of the school’s
budget went to staff salaries and no money was in the budget to purchase uniforms for the high
school’s soccer team. Participant G commented,
I had to buy food, uniforms, and safety equipment. I had to go out and beg people that I
know for money. I know a lot of people in business, and those who have money that are
tied to education. . . . My school is always running out of hand soap. I did not get a

89
document camera, and no adapter cords to go with technology. Though we are a selective
enrollment [high] school, there is no extra money.
A selective enrollment school is a school where a student must complete an application
and take a test to be considered or accepted to attend the school. At the time of the study, the
district studied had 11 selective enrollment high schools (Barrow, Sartain, & Torre, 2018). In the
2015–2016 school year, about 13,400 students applied for 3,600 seats in the selective enrollment
high schools, with high-achieving students believing the selective enrollment schools would
provide a challenging academic education (Barrow et al., 2018). Critics have claimed the schools
disproportionately enroll affluent students and take money away from neighborhood schools.
Only 8% of students from the lowest socioeconomic status attend the most competitive
selective enrollment schools. Eighteen percent of students from the lowest socioeconomic status
attend the most competitive selective enrollment high schools (Barrow et al., 2018). The data
answered Research Question 3: What are teachers’ views on equity in education in a large
Illinois urban school district? The facts can be interpreted as quality education is skewed toward
affluent students at the elementary school level, increasing chances in gaining acceptance at a
highly coveted selective enrollment school.
Three participants stated teachers should not have to write grants for resources or
programs the district should automatically provide. Participant J and colleagues wrote a grant to
obtain one laptop for each student, totaling 291. The district did not provide the laptops, and,
according to Participant J, not enough money was in the school’s budget to pay for instructional
resources of that magnitude, which was nearly $200,000. “If it were not for generous donations
from businesses and nonprofit organizations, I do not know how far behind our students would
be,” Participant J said.

90
Participant K perceived student-based budgeting is not the problem, the amount of money
provided per pupil by the district is the issue. The veteran teacher stated, since the onset of
student-based budgeting, the perception has been the amount of funding per pupil from the
district has plummeted. The participant said because of the lack of funding, constant visits are
being made to websites such as Donors Choose to seek donations for the class. According to
Participant K,
I am not a grant writer, but the lack of money students are receiving forces me to go
beyond my job assignment and spend hours writing grants and researching when I could
be focusing on lesson plans. It is just not fair.
The responses regarding Theme 1: teacher stress answered Research Question 1—What
are teachers’ perspectives of student-based budgeting in a large Illinois urban school district?—
and revealed how teachers perceive student-based budgeting as a hindrance to quality education.
The responses showed teachers are working hours outside of the classroom in roles as grant
writers and fundraisers in order to obtain foundational resources for student learning.
Theme 2: Inequity in Education
Teachers were asked what inequity in education looks like. Inequity is the unequal
allotment of school or district resources, which include experienced teachers, school
programming, and school funding. Inequity in education impacts a variety of stakeholders,
including students, teachers, school administration, families, and communities. College
attainment by children of families of the nation’s lowest income bracket has increased from 6%
to 9% in 45 years (Inequity Is the Problem in Education, 2016). Additionally, the education
inequity stemming from student-based budgeting promotes unfair competition among districts

91
and charter schools, causing instability in some school enrollments. Other impacts of inequities
in the district studied include high teacher mobility.
Loss of Black educators. Black educators have been decimated from the school district,
according to Participant D. The teacher participant said when 50+ schools closed in 2013, the
majority of the school closures were in predominantly African American communities and the
teachers were Black and have not been replenished. Twenty-one percent of teachers in the
district studied are African American, down from 41% in 2000 (Emmanuel, 2018). The schools
were closed mainly because of low enrollment. Participant D stated, “The district punishes
school with declining enrollments, which primarily affects African Americans students and
teachers.”
Lack of morale. Inequities can cause dissension among the teaching staff. Inequity can
also cause competitiveness and jealousy because, depending on the principal’s priorities, more
money can be spent on a certain grade level, grade cluster, or subject area. For example,
Participant B said the elementary school principal pours money into the primary grades (K–3)
and ensures no overcrowding occurs. According to Participant B, the administration would be
willing to hire more teachers and teacher assistants if the need surfaced. However, Participant B
perceived the principal does not have the same passion for intermediate and middle school
grades. According to Participant B,
Sixth- through eighth-grade classes have over 30 students, but primary does not go past
25. Upper grade teachers have complained of working harder than the primary teachers,
and when primary teachers complain about an issue, the upper grade teachers think they
are spoiled.

92
Another example came from Participant Z, who said principals should not continue to
pour money into one grade band or subject area each year. The teacher said the unequal
distribution has and will continue to cause a strain in teacher trust and administration. The
imbalance can tear down morale among teachers. Participant X stated when the principal
prioritizes reading and math because of high-stakes testing, the bias causes teachers to compete
for the principal’s attention and explain why one content area is more important than another.
“Teachers stop collaborating and they stop sharing resources. Instead, they start having private
meetings with the principal, asking for things they need without another teaching opposing,” said
Participant X. Participant AZ believes student-based budgeting does not have the capacity to
meet the needs of all students:
It [student-based budgeting] is not equitable. It cannot be equitable. There are fixed costs
to running a school building, whether it is electricity, lunch, or breakfast. This will be
true no matter the size of the school. If you have more students, you have more money to
spend for the things you need. If you have 50 students, you don’t have enough money to
pay for the fixed costs it takes to run a building. There is no way this approach to funding
can be equitable to schools across our city.
Participant W agreed with Participant AZ’s perception and said,
It’s [student-based budgeting] not equitable; it’s built more on equality, an equal amount
of funds per child. There should be a floor-level basis so all schools should give their
student body a high-quality education even if you have 50 students. You still should have
reading, writing, arithmetic at a high level, and equality doesn’t work because our
students are so different. We are taught as educators to differentiate, but the funding is
not differentiated.

93
Teacher mobility. Teachers may voluntarily leave a school due to a lack of support in
schools with low enrollment. Participant O stated,
I was a middle school science teacher in a tiny school, under enrolled. I didn’t want to be
the only science teacher in the whole school. After a while, there was no professional
opportunity for growth. I wanted to be at a school where I could bounce ideas off of
another science teacher. Now I am at a large school where there are sixth-grade, seventh-
grade, and eighth-grade science teachers. This larger school also has a reading, math, and
science coach. The smaller school I was at did not have that.
Participant V, who teaches at an elementary school with 1,200 students and 94 staff
members, admitted, “We always lose teachers at the end of the school year either voluntarily or
because a position is cut or because we lose students to charters, [or] students move out of the
neighborhood or the district.” Participant V said three to five staff members are cut annually;
“some are lucky to get back after the 20th day.” The 20th day is the time frame the school district
allows before cutting or adding positions and funding to individual schools. In the focus groups,
17 of the 27 participants (63%) said student-based budgeting was the reason for staff loss and
teacher mobility.
When elementary school principals select programming for the school year, tested core
subjects such as reading and math normally take precedence. Non tested core subjects are next in
priority, such as social studies, science, and writing. Extracurricular subjects are third tier, based
on participants’ perceptions. PE takes precedence over other extracurricular classes because the
district has placed mandates on the number of minutes students should spend in physical activity.
Technology is second tier because the technology teacher can have dual roles: providing a class
for students and supporting the staff in troubleshooting hardware and software issues. Next on

94
the priority list, according to participants, is art. Art has precedence over music because music
requires instruments, music books, and music stands, according to Participant U. Music and
library are the last priorities, according to Participant F. Participant H said,
Our school never has art and music in the same school year. We have music for three
years. When he [music teacher] was asked not to come back by our principal, we
received an art teacher. Now we have a music room full of instruments and music stands,
but no music teacher. They are really hard to come by now. They have been chased out of
the system.
The practice of prioritizing some programming over other programming results in the
perception extracurricular teachers, such as art, music, and library teachers, are the least
essential, according to Participant U. Teachers who teach core subjects which are not tested, such
as social studies and science, are next. Having a low priority for non tested subjects has resulted
in teachers leaving low-enrollment and low-income schools to work in high-enrollment schools
with high-income students. The actions can perpetuate the achievement gap for Black and
Hispanic students.
Participant K had experience with the district’s previous funding formula:
We used to have quota positions where every school was given a certain number of
positions based on the enrollment. The individual schools did not have to budget teacher
salaries, but with the transition of student-based budgeting, principals are not given a
certain amount of positions, instead a certain amount of money which has to be divided
among the teachers, and other resources they [the school] need.
Participant K said the entire concept shows inequity and diminishes the value of veteran
teachers: “There is no way a principal should have to think about the salary of a teacher. I am
95
sure principals are hurting by this process as well.” More new teachers in schools and few
veteran teachers to provide mentorship, Participant E said, can increase discipline problems,
adding more teacher stress and contributing to increased teacher mobility. Table 6 displays an
average comparison of low-, medium-, and high-enrollment elementary schools in the school
district. The table shows resources the school may provide based on student enrollment and how
often. The information was gathered and synthesized from the four focus groups participants.
Data was also taken from the school district’s website by viewing the profile and programming
information of each school.
Imbalance or content and grade-level resources. Based on focus group discussions,
some schools have a certain priority focus. For Participant F, technology, science curriculum,
and one-to-one technology for third, sixth, and eighth grades are high priorities for the school’s
principal. Participant F said,
There was so much time we had to dedicate to this initiative. Teachers had to drop
everything and do science challenges. That time took away from social studies, and even
some reading lacked because the focus on science, and they ran out of time. . . . This
[mandate] went for those that were not science or technology teachers. All classes had to
incorporate lessons including typing or learning how to operate a computer. Even though
we had a technology teacher, all teachers were responsible for teaching some sort of
technology in the classroom. Social studies instruction completely went and reading
instruction lacked.

96
Table 6
Low-, Medium-, and High-Enrollment Elementary School Comparison
Position and program
250 students
Low-enrollment school
500 students
Medium-enrollment school
1,000 students
High-enrollment school
English language arts
(ELA)
1 (Grades 3–5)
1 (Grades 6–8)
1 per grade level 1 per grade level
Science teacher No (filled by a substitute
teacher)
Yes Yes
Social studies teacher No (taught by ELA
teacher)
No (taught by ELA
teacher)
Yes
Math teacher Yes Yes Yes
Teacher assistant 2 3 5
Librarian No No Yes
Art teacher Yes No Yes
Music teacher No Yes Yes
Dance No No Yes
Nurse Once a week Twice a week Daily
Psychologist Twice a week Twice a week Daily
Social worker Twice a week Twice a week Daily
After-school sports No Boys’ and girls’ basketball Boys’/girls’ basketball,
volleyball, soccer,
gymnastics, band, ballet,
photography, theater
Participant B agreed with Participant F’s assessment of the impact of principals’
priorities, stating those who teach social studies have no social studies workbooks. Participant B
said each year reading and math seem to have priority for resources because the subjects are
tested and high stakes. Both Participant B and Participant F said have been told by each principal

97
to focus on nonfiction text as a way of teaching social studies. Practicing the strategy was just
another way of teaching another reading course since nonfiction texts account for at least a third
of the reading questions on the school district’s standardized tests.
Competition. Participant X perceived student-based budgeting was implemented to
create competition, similar to the business world, to compete for students. Schools with more
students receive more funding, hire more staff, add more programming, and attract more
students. Participant W said there was one full-time position to pay someone to advertise for the
school. “We also had a recruitment director, but he was ineffective, causing a cascading effect of
enrollment [decreasing enrollment] in our school.”
According to six participants from the four focus groups, student-based budgeting was
designed to give parents more choices, which will ultimately put low-enrollment schools at an
even greater disadvantage. The competition can put more pressure on low-enrollment schools to
accept students outside the neighborhood boundaries who may be disruptive. The students may
have been kicked out of previous schools due to behavioral issues and a low-enrollment school
would accept the child and tolerate the disruptive behavior because the school needs the money.
In 2018, the district enrollment had dropped 18%, or 80,000 students, since 2000 (Szalinski,
2019). According to Participant X,
SBB [student-based budgeting] drives the school choice agenda. The majority of charter
schools are stationed in neighborhoods of Black and brown students. They [charter
schools] are funneling money away from neighborhood schools that are underenrolled.
Then schools will close themselves. This way the district does not get blamed. It’s a nasty
agenda but masking it under student-based budgeting.

98
Participant M had similar feelings about student-based budgeting as Participant Y.
Participant M referred to the implementation of student-based budgeting as a “scheme” three
times during the second focus group. Participant M said,
Budgets are going to get cut, so the rationale is to appear cuts are being done in a fair
way. The public got sold on the student-based budgeting scheme by neoliberal-policy
institutions as way of creating rationale for their harmful policies.
Participants perceived student-based budgeting was also implemented to transfer
financial responsibility to the local level with administration rather than the district. According to
Participant AZ,
With student-based budgeting, the district was able to create a level of chaos in schools to
promote charter schools as an alternative. It plays into an agenda to reduce the size of the
district and to eliminate schools that are already struggling. Student-based budgeting was
part of reform in the business institutions. Schools can’t run like that. They were not
meant to run like that.
Participant X said, “We lost art and computer teachers. The middle school ELA teacher
just got endorsed in special ed that has been vacant for three years, so now we don’t have an
ELA [teacher] for the upper grades.”
Housing. Participant U believed the school of employment is under enrolled because of
the lack of housing regulations in the state of Illinois. Participant U said, “Students have to leave
schools in their neighborhood due to gentrification. They are forced out because they cannot
afford the high rent.” Gentrification policies implemented by former Chicago mayors have
pushed many African Americans out of the city, which affected the school enrollment in
communities where African Americans predominantly live. The statements regarding the
99
subtheme answered Research Question 3—What are teachers’ views on equity in education in a
large Illinois urban school district?—demonstrating teachers’ views on equity in the district and
how student-based budgeting impacts equity.
School closures. If schools are low-enrollment, students will not receive the staffing and
programming necessary to have a quality education. According to Participant I, who has taught
high school history for 18 years, if a student attends a high school with a population of less than
400, the student will not be well serviced. Participant I said, “It’s impossible. The student will
want to leave and find a better option, and if they leave, experienced teachers will lose their job,
because who will hire them?”
Four high schools, set in one predominantly low-income African American
neighborhood, were closed in 2018 due to low enrollments (Masterson, 2018). Ninety percent of
the students living in the neighborhood of school closures traveled outside the community to
attend high school (Masterson, 2018). However, a new $85 million high school was built in the
same neighborhood the same year (Masterson, 2018).
Theme 3: Principal Autonomy and Priorities
What differentiates student-based budgeting from other K–12 public school funding
models is the principal’s autonomy when managing school funds. In other budgeting models, the
district or central office manages the majority of the school budgets. During the focus groups,
participants revealed perceptions on how principal autonomy and priorities impacted the school
culture and climate.
Enrollment and attendance. Based on the conversations in all four focus groups,
student enrollment is the primary way schools received money under the funding formula.
According to participants, student recruitment has evolved to a business model. Participants

100
perceived school administrators do not mind trying to convince parents to transfer students out of
schools whether inside or outside the attendance boundaries. Principals who are anxious to
increase enrollment sometimes make negative comments about another school, according to
Participant W. Administration in School A, for example, may mention a lack of programs or lack
of disciplined students in School B, motivating a parent to unenroll their child from School B
and enroll the child in School A. The more students School A has, the happier the principal. The
school receives more money, but the temptation of gaining more money from student-based
budgeting can cause a school administrator to behave unethically. According to Participant W,
“We would send flyers of our schools to residents who had their child in private school. It did
not matter if our school was already overcrowded, principals wanted more students.”
Attendance incentives are a part of the school culture. Five elementary teacher
participants said part of the job is creating attendance plans. Participant O stated,
I have to think of weekly classroom incentives, call parents daily when a child is absent,
write the daily attendance on the door, and write a weekly reflection on how attendance
affected my instruction. This is a lot of work in addition to my content lesson plans.
Additionally, six elementary and three high school teachers had to put a halt on instruction once
a month because students were pulled from class to participate in school-wide attendance
incentives. The monthly attendance incentive time could range from 45 minutes to about three
hours, which equated to half the school day for students. Teachers would take turns on who
would chaperone and stay behind to watch students who did not have perfect attendance for the
month. In Participant J’s point of view, the incentives get out of hand: “We have game buses,
movie time, field trips during the school day.”

101
Participant Z said attendance seems to be more of a priority than academics. The views
were echoed by Participant J, who said academic incentives are not given at his school either.
Participant Z said,
Students who are on the honor roll but don’t have perfect attendance have to wait until
the end of the quarter to be recognized at an assembly where they are just given a
certificate, and sometimes we may not have an assembly. There is no game bus for our
honor roll students. Students who get good get grades and may be absent for a legitimate
reason, such as going to the dentist to tighten their braces or staying home because they
actually feel sick, [are] overlooked. How can we motivate them in academics?
Participant Z said more work than planning and chaperoning is involved with attendance
incentives; sometimes the work entails putting food together: “Parties, DJs, movie days—which
means we had to pop popcorn and pour pop into cups.” Participant V perceived some principals
abuse the autonomy of student-based budgeting:
Teachers in my building were let go because my boss felt that he owed someone at the
network [group of schools in a district] a favor. The network downsized. We lost three
teaching positions for the network people. At one point we had five network people to
work as teacher leaders. They were not in the classroom. They were close to retirement. It
was stressful for a lot of people in the building. They would just reprimand people. They
would treat teachers and students like commodities.
The schools in the district studied are placed in 17 networks. The network leaders
typically provide administrative development, strategic support, and leadership guidance to the
schools which are part of the network. Additionally, network offices have a chief officer who

102
leads the office. Networks also provide instructional support leaders who make school visits
throughout the year to monitor learning and the climate and culture of the school.
Elementary and primary teachers perceived, because so much emphasis was put on
attendance, negative behavior was overlooked. Students who did not live in the school
attendance area and were misbehaving would still be accepted. Participant M stated,
This put more stress on teachers with teaching in overcrowded classroom and added
discipline issues. So instead of hiring more [teachers] for the overcrowding issue or
providing relief for students with repeated disciplinary issues, I was just told to improve
my classroom management.
Participant U said, “Principals have had conversations with me on how to convince
parents to stay in the school when they want to leave. One parent said they were out of here
because they didn’t like the way we were planning graduation.” Participant U said the parent had
to be appeased to keep four children enrolled in the school. Attendance and enrollment were a
big deal because both affect the school rating. Lack of student attendance can knock a school’s
rating down, which can make the school look less attractive to parents. According to Participant
D, “Our school cannot run without 800 students in it, so we lottery students outside the
attendance area. Without our 1+ rating, parents will not seek to want to put their [students] on the
waiting list.” Participant C agreed:
My school’s rating went from a 1+ to a 1 simply because of attendance. This meant the
loss of 20 students, the loss of a lot of money—and the loss of a whole lot of money
means the loss of a teacher position at our school every year. That’s what happens when
you play this game. There are so many impacts of it.

103
COVID-19 impact. Participant V stated the COVID-19 pandemic revealed more
inequities in student-based budgeting:
We lost 500 students. We went from 1,700 to 1,200 students this year. We had to lay off
five teachers and two support staff. Students went back to their native lands such as
Mexico, India, and Pakistan between March and May. We don’t know if they are coming
back.
Participant V said the school leaders were researching ways to recruit students in the surrounding
area who attend private and charter schools, and even the daycares, in the school’s attendance
proximity. Participant V continued, “We lost $350,000, so we may be losing more if we have
students bleed out and leave the building.”
According to Participant X, COVID-19 meant less need for physical materials due to
remote learning: “COVID-19 allowed teachers to take home materials, and money was spent on
remote learning for professional development.” Participants said money was spent so all students
can receive laptops in order for the students to learn at home. However, Participant X perceived
ancillary or extracurricular staff would be laid off the subsequent school year because the art
teacher just earned a certification in special education and school administrators expressed more
special education teachers are needed in the school, while indicating low attendance was
evidenced in the extracurricular classes during remote learning.
Based on the information about COVID-19’s impact on student-based budgeting,
enrollment and attendance correlates with the quality of education students receive as well as
whether a teacher retains a position. If the school has high enrollment, students are likely to have
a variety of teachers and programming. If a school has low enrollment, the likelihood students
would be in a fully staffed school with experienced teachers decreases.
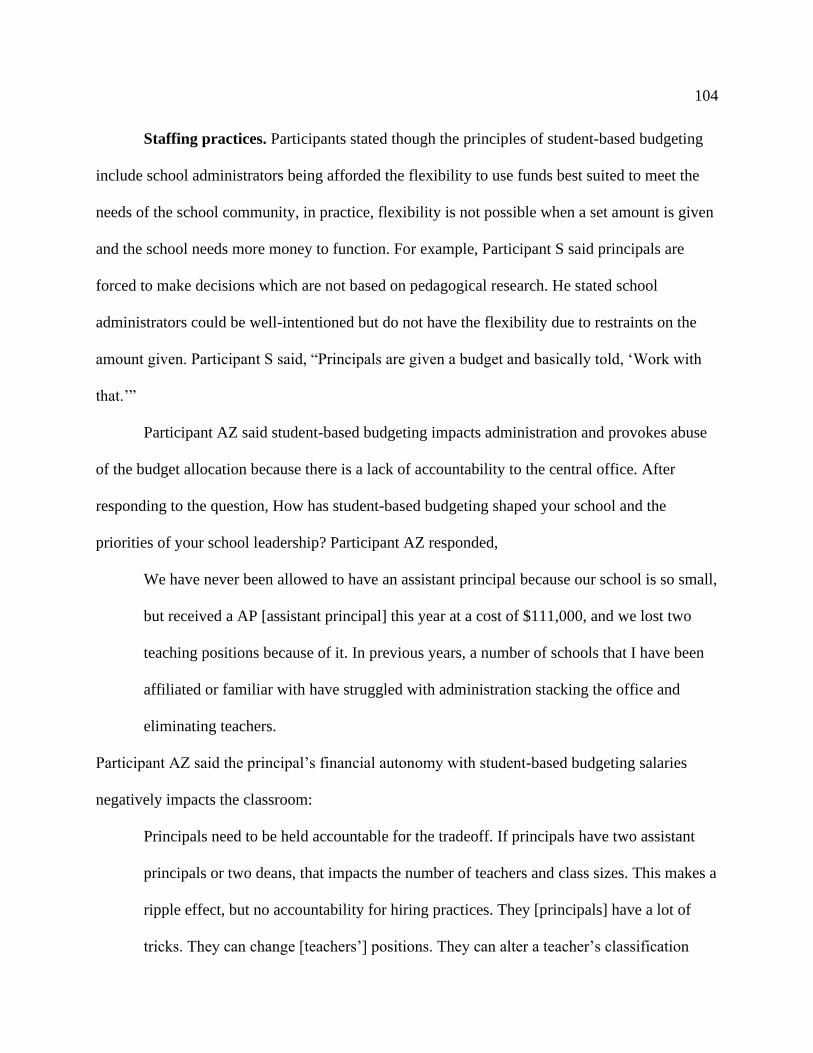
104
Staffing practices. Participants stated though the principles of student-based budgeting
include school administrators being afforded the flexibility to use funds best suited to meet the
needs of the school community, in practice, flexibility is not possible when a set amount is given
and the school needs more money to function. For example, Participant S said principals are
forced to make decisions which are not based on pedagogical research. He stated school
administrators could be well-intentioned but do not have the flexibility due to restraints on the
amount given. Participant S said, “Principals are given a budget and basically told, ‘Work with
that.’”
Participant AZ said student-based budgeting impacts administration and provokes abuse
of the budget allocation because there is a lack of accountability to the central office. After
responding to the question, How has student-based budgeting shaped your school and the
priorities of your school leadership? Participant AZ responded,
We have never been allowed to have an assistant principal because our school is so small,
but received a AP [assistant principal] this year at a cost of $111,000, and we lost two
teaching positions because of it. In previous years, a number of schools that I have been
affiliated or familiar with have struggled with administration stacking the office and
eliminating teachers.
Participant AZ said the principal’s financial autonomy with student-based budgeting salaries
negatively impacts the classroom:
Principals need to be held accountable for the tradeoff. If principals have two assistant
principals or two deans, that impacts the number of teachers and class sizes. This makes a
ripple effect, but no accountability for hiring practices. They [principals] have a lot of
tricks. They can change [teachers’] positions. They can alter a teacher’s classification

105
within the school without accountability. Prior to student-based budgeting [in the
district], principals did not enter into that kind of game playing with teachers’ jobs and
livelihoods because they didn’t have mechanisms to move teachers in and out of
buildings that student-based budgeting affords them.
Hiring more inexperienced teachers. Student-based budgeting is different from school-
based budgeting, also known as position-based budgeting. Position-based budgeting required the
district or central office to pay for teaching staff, and the salary did not come from the principal’s
school budget. The principal did not have to consider how much a teacher will cost, in position-
based budgeting. When the Illinois school district implemented student-based budgeting,
principals started viewing salaries, not just experience, before making a decision to hire.
Participant C said, “I am the cost of two teachers.” Based on Participant C’s 19 years of
service, the experienced educator can make a minimum base salary of $94,353 for the 2019–
2020 school year based on the district’s pay schedule.
Participant D mentioned, “Our school suffered low enrollment over the last two years.
Our school recruits students in a selective enrollment process. We lost 411,000 [dollars] in
funding, resulting in layoff of teachers.” Principals lay teachers off and shift them into roles or
subjects they do not want to teach. Administration hires inexperienced teachers because they are
low-cost, and principals do not engage and support experienced teachers. “It’s like teachers are
no longer valued for their experience. Student-based budgeting just puts somebody in the
classroom so it can function,” Participant D said. Participant Y stated,
A trend is when a teacher retires, we are able to hire someone with high experience
because the previous school year budget covered it. However, we wanted to hire an art
teacher. We only had enough money to hire a teacher straight out of college. Because

106
principals had to pay raises in the budget, the budget could not cover all the positions in
the school.
Participant Y mentioned the art position went from a full-time to a half-time position.
When an ancillary or extracurricular activity is cut, principals have the option to keep the teacher
half-time if the budget allows. Having a half-time position allows the teacher to work two to
three days a week in one school. The teacher is then tasked with looking for a position at another
school in the district to obtain full-time employment. Participant X said,
I have been a victim of having my position cut, but my principal finagled the budget to
get me hired back. You have to hope somebody retires. When veteran teachers retire, we
were able to hire two teachers on her salary, but it came with a cost. A lot of training was
involved with trying to get other staff members to take on mentoring. It was a hassle
because of time and effort it took. We all took on the responsibility of guiding the new
teacher so they would not be fired so we can have continuity at our school. This lowered
morale in the building.
Participant W said,
My school was at an uptick in its population and I was able to teach just geometry. Now
that the student population is going down, we have to lose positions. I’m tenure, so I
don’t fear losing my position [but] now I must teach three different maths because of a
lack of positions. You can’t focus as much because you have to teach more subjects.
Participant B stated, “We have two PE teachers because we have to provide [physical
activity] minutes to 830 students, and all over, our class sizes are over 30, every single class. The
money is used on staffing. We don’t have anything extra.” The statement revealed even when

107
some schools have a lot of students, there is still little extra funding going to programming
outside of core instruction.
Participant S stated when the high school received a new principal about six years ago,
the perception was the administration tried to empty the building of veteran teachers. Participant
S said he had 13 years of experience at the time. “The only teachers who did not make a
proficient rating were the veteran teachers. All those that did earn a proficient rating or better
were teachers under 10 years, most were under seven,” according to Participant S. In the district,
four ratings are given to teachers based on observations and student performance based on test
scores. The four ratings are unsatisfactory, satisfactory, proficient, and distinguished. Even if a
teacher is tenured, if given an unsatisfactory rating, the teacher can be laid off if the teacher fails
the remediation process. If the tenured teacher receives a satisfactory rating for two consecutive
years, the rating equates to an unsatisfactory, and layoff can be an option after the remediation
process.
Based on Participant U’s professional school experience, the principal hired two
expensive people to work in the school, and two staff were dismissed. “It disrupted the flow of
our school. She [principal] hired two administrators. People let go were security and teacher
assistants,” Participant U said. Participant Z said the principal’s priority was retaining staff, who
were mostly veteran teachers; however, the principal had enough funding to outsource an art
teacher. Participant Z said,
The principal had to contract out and find companies and organizations that were willing
to come in and do art for a low cost. It was hard, and some parts of the year there was not
art. They [students] had to repeat gym or technology.

108
Test scores. According to the focus group participants, a priority of school administrators
is test scores. Participant D said, “It [test scores] was a priority in our professional development,
and it is priority in our evaluation. The test scores affect the rating of a school and a teacher. The
principal tells us [teachers] to keep those scores up.” In Participant D’s reference of a school
rating, all schools in the district receive a rating based on the School Quality Rating Policy
(SQRP; Walker Burke & Kunichoff, 2018). The five-tiered ratings are as follows: Level 1+,
Level 1, Level 2+, Level 2, and Level 3. Level 1+ is the highest rating a school can receive,
while Level 3 is the lowest rating. The indicators, which influence the SQRP ratings include
students’ performance on standardized tests, student academic growth, attendance, graduation
rates, and school culture and climate. The majority of Level 1+ schools are in affluent White
neighborhoods, while the majority of Level 3 schools are in low-income neighborhoods of
predominantly African American and Latino students. Participant I said,
The ratings are geared towards parents, and it causes a wait list to get into certain schools.
If a school has anything lower than a Level 1, parents do not want their children to attend
that school. The school looks unattractive and the perception is the school is a “bad
school.”
Theme 4: Lack of Trust in the District
Based on the focus group conversations and participant questionnaires, student-based
budgeting methods have caused teachers to mistrust the school district’s priority in providing
quality education for all students. Participant C labeled student-based budgeting an “austerity
budget” because the implementation of the funding formula is a way of manipulating the general
public to support defunding schools because the schools are not meeting district expectations and
hurt low-income families. Participant R added, “Every school is not given what they need to

109
meet district expectations. It is a Hunger Games system, and students lose out.” Without
prompting, seven participants (25%) stated student-based budgeting only looks equitable on
paper or in theory, but is not equitable in practice.
The 20th day rule. At the end of the school year, principals are given a budget for the
upcoming school year based on projected enrollment. The money does not follow the student if
the student transfers after the 20th day; the money stays at the first school unless the transfer
happened prior to the 20th school day. Participants perceive overcrowded public schools and
charter schools try to wait until the 20th day to officially transfer a student out of the school
because the school keeps the funds from student-based budgeting for the entire school year. The
school receiving the transferred student does not receive the money for the child after the 20th
day. Principals can advocate for more money in the school year to resource the students, but no
guarantees are made.
According to teacher participants, the 20th day rule puts low-enrollment and low-rated
schools at a greater disadvantage to provide quality education, becoming more susceptible to
school closure. Four participants experienced students enrolling in school after the 20th day or
even in the middle of the school year from another district school, or charter school, or even
from out of state. Participants said class sizes increase, causing more time spent on acclimating
new pupils to the new environment, rearranging seating in already-overcrowded classrooms, and
more student work for teachers to grade, increasing teacher stress. Based on Participant T’s
experience, many new students have special needs and may not receive instructional minutes
mandated by the state because of a lack of special education teachers in the school. The lack of
special education teachers is likely to impact predominantly African American students who are
more likely to be at low-enrollment and low-rated schools.

110
De-professionalization of teachers. According to Participant D, more veteran teachers
are pushed out and new ones are hired to save money. Additionally, according to three
participants, the district is seeking one-to-one technology where each student is provided a
Chromebook. “This is just another tactic to put technology in front of every student so you can
shove more kids into a classroom. There is deep de-professionalization and it devalues what the
human contact can give to a child,” Participant D added.
Theme 5: Collective Teacher Advocacy
While discussing the impact of student-based budgeting, participants agreed one way to
fight inequity in education is teacher advocacy. Voicing inequities to parents, students, and on
multiple media platforms can help provide the general public with a holistic view of how school
budgeting correlates with student achievement. Two primary strategies of teacher advocacy arose
as a result of the four focus group discussions.
Active participation in school organizations. Participant V said teachers must become
more active in school community organizations. Three of the school organizations Participant V
mentioned were the Professional Problems Committee, the Professional Personnel Leadership
Committee, and the Local School Council (LSC) as well as content departments. The
Professional Problems Committee is headed by the school delegate and elected members to
discuss working conditions with the school administration. The Professional Personnel
Leadership Committee is a state-mandated committee whose purpose is to develop and
recommend educational programming matters to the principal and LSC. The LSC is a governing
body made up of school staff, parents of students, and community members. The group monitors
the school improvement plan and school budget and selects and renews a principal’s contract
(Swanson, 2005).

111
Participant V said, “I tell teachers to meet with their school teams, then make needs
known to the school delegate, and then make it known to the principal with the LSC.” The
delegate ensures the contract is enforced and not violated by school administrators. The delegate
holds monthly meetings with staff members who are members of the Chicago Teachers Union to
keep members abreast of the latest information. The delegate also represents the teachers’ wants
when a vote is taken at the monthly union meeting. Participant X said teachers need to have a
plan in place and bring the plan to the principal with solutions and not wait for the principal to
make the judgment. Participant Z recommended teachers organize by creating grade-level and
subject-matter committees to discuss curriculum needs. “We are not going to be intimidated by
the principal. People should not just represent themselves; [they should] operate as one and
become more verbal,” Participant Z said as a way to remedy the imbalance of power between
administration and teaching staff. Participant V said the district and state should be held
accountable to listen to teachers regarding what the basic needs are:
We should have a seat at the table and not just leave it on the leaders of the teacher union
though they do great work. The district needs to include teachers and the process of
creating and formulating a criterion.
Three of the 27 participants said student-based budgeting should not be considered the
only culprit for the lack of human and material resources in a school. Principal mismanagement
is more harmful than student-based budgeting itself. Participant H said, “Though I work in a
low-income school, there is nothing I asked for that I was denied. There were always enough
supplies for my classroom.” Participant H advises teachers to look more closely at the budget to
ensure the school goals are aligned with how the money is spent.

112
Parent and community communication. To improve the quality of education for all
students, focus group participants said collaboration with the parents is necessary to create a
needs assessment of the school. Participants agreed consistent meetings with parents, whether in
person or online, are necessary to maintain a positive relationship in order to work and advocate
together with school administration, district officials, and potential donors for quality education
for all schools regardless of the number of students in each school. “We are told as teachers to
differentiate our instruction based on the student need, but the district does not differentiate
funding based on the needs of the school,” according to Participant K. Participant W said,
Community has to be looked at. You have to consider schools located in a high-crime
neighborhood. What does that school need to function well and to educate students? Are
the students below, at, or above grade level? The questions help determine the type of
staff and programming needed for the school. This is also in addition to the teachers.
Participant Z added, “We may need more intervention specialists, art, counseling, social workers,
nursing services, and homeless coordinators. This is why we have to know our families, talk with
them, get them involved and keep them involved.”
Figure 1 displays teacher participants’ perceived advantages of student-based budgeting.
Advantages were few compared to the perceived disadvantages. The benefits were more geared
toward the flexibility of parents and principal choices.

113
Figure 1: Teacher perceptions of the advantages of student-based budgeting.
Figure 2 presents disadvantages of student-based budgeting practices in the district. The
majority of participants cited more disadvantages than advantages. The figure shows the answer
to Research Question 1: What are teachers’ perspectives of student-based budgeting in a large
Illinois urban school district? Figures 1 and 2 are evidence of participants’ displeasure with the
budgeting formula and a variety of negative outcomes.
Questionnaire
The four-question questionnaire was given to participants upon completion of the virtual
focus group (see Appendix G). The responses from the focus group revealed the majority of
participants were displeased with one or more areas of student-based budgeting. Participants said
professional opinions of the budgeting formula did not change as a result of the focus group, but
participants stated having a heterogenous group provided a comprehensive view on how student-
based budgeting has impacted K–12 teachers.
43%
57%

114
Figure 2: Teacher perceptions of student-based budgeting’s disadvantages.
Figure 3 highlights participants’ satisfaction with student-based budgeting on a scale of 1
to 10, with 10 being most satisfied. Based on the figure, the majority of participants were
dissatisfied, with most marks at or below 5. The participants’ perceptions of student-based
budgeting could mirror those of the population of teachers in the district.
Reliability and Validity
The reliability and validity section emphasizes the credibility of the qualitative case study
whereby threats were eliminated or controlled. Removing or minimizing threats is paramount to
safeguarding the in-depth dependability of research outcomes (Souza, Alexandre, & Guirardello,
2017). Additionally, the process of how transferability and reliability strategies were practiced in
the qualitative case study was described.
26%
16%
16%
10%
32%
Loss of Fully Staffed School Overcrowded Classes
Princpal Abuse of Budget Lack of Central Office Accountability
Low enrolled schools

115
Figure 3: Student-based budgeting teacher satisfaction levels.
Credibility and Dependability
To demonstrate credibility and dependability in the study, member checking was
implemented. Member checking was the final piece to the triangulation method of the qualitative
case study (Darawsheh, 2014). Within four days following each focus group, an e-mail was sent
to each focus group participant with an automated transcript. The transcript was downloaded
through Rev.com. The member checking afforded participants the opportunity to review and
provide feedback on errors (Cohen, Manion, & Morrison 2017). Member checking increases the
level of credibility and trustworthiness, which are the backbone of high-quality qualitative
research (Birt et al., 2016).
116
Transferability
The outcomes of the qualitative research are inherently transferable. The research
findings could be applicable in similar environments. Triangulation was instituted in the
qualitative case study to justify identified themes. Additionally, participants were K–12 teachers
who taught a variety of content areas and grade levels, had varying years of service, and taught
in different school cultures and environments across the district.
Dependability
The results from the qualitative case study confirm dependability because research
procedures were clearly explained in multiple settings. Procedures were explained thoroughly
through an e-mail to participants. Additionally, the procedures and purpose were explained
through the informed consent form. Furthermore, protocols were explained at the start of the
virtual focus group once all participants were present.
Confirmability
The outcomes of the data demonstrated confirmability with the use of SMEs. The variety
of teachers used in the research and checking the transcript for accuracy also demonstrated
confirmability. Confirmability was established by proving findings, and the findings’
interpretations were acquired strictly from empirical data and not made from assumptions.
Chapter Summary
The theory of student-based budgeting versus the reality of student-based budgeting was
described. On paper, providing the same amount of money per student, with some extra funds for
low-income, special education, and ELL populations, seems to demonstrate equity in addition to
equality. However, in practice, the budgeting formula paints a complicated picture which shows
many schools are struggling to provide basic educational services to all K–12 learners. Some

117
schools are without full-time teachers. Day-to-day substitute teachers can teach a middle school
science class for part of or even the entire school year even if not endorsed because the budget
does not allow for a full-time endorsed science teacher. Some students can go without art or
music for the duration the students’ entire elementary tenure.
Based on the teachers’ perceptions of student-based budgeting, the common feeling is the
budgeting model hurts veteran teachers. The budgeting formula hinders the quality of education
for all students, especially African American and Hispanic students who are educated in low-
enrollment schools. Additionally, the teachers perceive the district is provoking too much
competition among schools. Whichever schools can obtain the most students after the 20th day
of school are mostly likely to have sufficient resources to provide a quality education. A quality
education would occur if the school administrator utilized the budget ethically, not using
nepotism or cronyism. However, even when trying to compete for students, low-enrollment
schools usually have fewer resources to recruit students and provide a comprehensive education.
Additionally, the SQRP can impede schools with low ratings to enroll new students because the
rating can provide the perception the school is failing students (Walker Burke, 2019).
Teachers have observed school leadership using assertive measures to gain as many
resources as possible, such as gymnastics, a content teacher per grade level, after-school tutoring,
and sports. The cost comes with overcrowded classrooms, with 30 or more students, and added
pressure of teachers to spend more time on fundraising projects such as writing grants or creating
a fundraiser involving family, staff, and community commitments. Much of a teacher’s time
involved in fundraising occurs outside of the seven-hour school day.
Upon synthesizing and analyzing data from the 27 teacher participants, the fiscal
responsibility of schools has shifted from the central office to the school principal, who is only

118
one person. As a result, the blame for school failure could also be shifted to the school
administration and not the district. The transition of responsibility could influence stakeholders
to perceive if or when problems occur in school, the problems would be considered an individual
school issue and not a district-wide systemic issue. If the situation becomes routine, little to no
demand would be made of the school district to make reforms.
Following are discussions and conclusions from the qualitative case study. The chapter
includes findings, interpretations, conclusions, limitations, recommendations, implications for
leadership, and a conclusion. Also included is a summary of the research.

119
Chapter 5: Discussion and Conclusion
The purpose of the qualitative case study was to explore active classroom teachers’
perspectives, experiences, and opinions of the impact of student-based budgeting practices in an
Illinois school district. A significant gap in the literature indicated the lack of teachers’ points of
view of the K–12 budgeting formula nationwide. Scholarly research has shown the advantages
and disadvantages of student-based budgeting from a quantitative angle. The review of literature
also showed political and district officials’ mostly positive views of student-based budgeting.
The study provided an in-depth analysis of the effect of student-based budgeting on
student equity and laid the groundwork for future studies of the effectiveness of student-based
budgeting and the impact the budgeting model has on student achievement and teacher practice.
The following sections include the findings, interpretations, and conclusions from the qualitative
case study. The following sections also include limitations, recommendations, implications for
leadership, and a conclusion.
Findings, Interpretations, Conclusions
Based on the responses and themes from the four focus groups of K–12 teachers, student-
based budgeting sounds equitable on paper, but the funding formula demonstrates inequity in
practice. Generally, in the student-based budgeting formula, schools are funded with an equal
amount of dollars per pupil. Equality and equity are not the same. According to participants’
definitions, equality means providing everyone with the same resources, while equity means
providing the necessary resources to ensure success.
Student-based budgeting has a set amount of money in the school budget even before
considering and assessing the diverse needs of each school, with the exception of extra funding
for special education, low-income, and ELL students. As a result, many students in low-

120
enrollment schools lack resources for a well-rounded education, which perpetuates the
achievement gap especially among students of color.
Based on participants’ perception of low-quality and inequitable education in the district,
the school district loses over 1,000 students annually, which leads to teachers and school support
staff being laid off. The loss of students has led to school closures; some school buildings remain
abandoned in residential areas. The school district has used limited methods to remedy the lack
of education quality. Special education teachers, who service about 15% of the district’s student
population, were no longer a part of student-based budgeting beginning in the 2018–2019 school
year. The position was paid for by the district. As a result, more students received a qualified and
experienced special education teacher, and the schools had fewer special education vacancies.
The responses of focus group participants confirmed the equity theory by psychologist
Adams (1963). Teachers, who are workers, perceive systemic unequal distribution of resources
allocated to individual schools by the Illinois school district. The perceived inequity has made
teachers feel professional contributions to the school district outweigh the benefits received from
the school district. Based on the perceptions and experiences of participants, the high amount of
stress due to teaching extra courses in overcrowded classrooms, spending hours outside of work
fundraising, and being in constant fear of losing one’s position after reaching 10 years of
experience are not equal to the benefits of a biweekly paycheck.
Additionally, teachers must observe some students, predominantly African Americans
and Hispanics, receive a low-quality education due to a lack of programming, lack of
experienced and passionate teachers, and school closures. According to Adams’s (1963) equity
theory, the structures and results have caused unhappy teachers who seek to become education
advocates to reform systemic inequity stemming from student-based budgeting. According to

121
participants, examples of teacher advocacy include creating and participating in school
committees, becoming actively involved in the local teachers union, and becoming a part of the
LSC to see and approve how money is being allocated by principals.
DeSilver (2017) reported 25% of students were proficient in math, 22% in science, and
just 12% in U.S. history in 2017. The lack of students reaching grade-level attainment on
standardized test scores can stem from school funding inequities in the school district. As study
participants mentioned, equity is not practiced in the school district studied. Schools are
essentially given the same amount of money per student, with added weights based on low-
income, special needs, and ELL students.
Some schools do not have enough programming to provide a comprehensive education
because the student enrollment is low. Students can go without a science teacher, social studies
teacher, math teacher, or even a reading teacher. The class can be taught by a substitute teacher
or remain vacant for the year. Going without a content teacher does not prevent a student from
having to take the annual standardized test, which ascertains the student’s proficiency level.
The results support the evidence stating quality teachers are paramount in improving the
proficiency levels of students (Thompson & Thompson, 2018). Quality teachers are teachers
with three or more years of experience, certified in the content taught, and those who have
achieved National Board certification status. To assist students with achievement, experienced
teachers need to be accounted for in the budget. Schools with low achievement have a need for
experienced teachers, but the opposite seems to occur in the student-based budgeting system in
Illinois. Low-achievement schools are likely to have low enrollment, with a greater chance of
having a smaller staff and more inexperienced teachers.

122
Limitations
Limitations of the study include lack of variety in nonverbal behavior cues. Using an
online platform limited the amount of movement and facial expressions of the participants. Ten
of the 27 participants did not have cameras on 50% to 100% of the time during the focus groups.
This was a limitation because facial expresses can help ascertain confusion, disagreement or
disagreement to a comment. Another limitation included the lack of full participation of one
participant due to technical difficulties in logging on to the Zoom platform; the participant
participated for only 30 minutes, although the focus group lasted more than an hour.
The qualitative case study was also limited to one set of teachers. The qualitative case
study excluded principals, teacher assistants, school clerks, and clinicians. School administrators,
or principals, are the leaders who finalize the budget. Gathering the perspectives of
administrators could have provided insight into the impact student-based budgeting has on
students, teachers, and administration. Gathering information from school clerks could have
answered the following budget questions: What materials was the most money spent on? How
often do teachers ask the clerk for materials? How often does the office run out of materials?
How quickly are resources replenished?
All of the aforementioned groups are inside the school daily and see the outcomes of
funding. Based on the data analyses, teachers perceived principals’ priorities to be imbalanced,
which impacts the quality of education. Some of the perceived imbalances include prioritizing
newer teachers over veteran teachers, attendance and enrollment over discipline, benchmark
grades (grades students can repeat: 3, 6, 8) over non benchmark grades, and tested subjects over
non tested subjects. Further, responses from principals or school administrators could show areas

123
of agreement or disagreement. The variety of voices could provide more of an inclusive insight
into how student-based budgeting impacts educators and education.
Another limitation in the qualitative case study was most of the teacher participants were
veteran teachers. Only three participants had less than 10 years of experience, including two
participants with eight years with the district and one participant with three years. New teachers,
especially teachers who are recent college graduates, have shown limited to no knowledge of the
district’s funding formula. The lack of experience with and knowledge of how student-based
budgeting works made participating in the qualitative case study challenging. Also, based on the
preliminary survey, novice teachers had little to no knowledge of the district’s previous funding
formulas or budgeting formulas of other states and school districts to make meaningful
comparisons.
Focus group participants mentioned perceptions of how extracurricular teachers, such as
librarians, art, and music teachers are impacted by student-based budgeting. However, no art or
music teacher was a participant in the study. The one art teacher who responded to the study was
a first-year teacher in the district and a recent college graduate who showed no knowledge in the
preliminary survey of how student-based budgeting works. The two music teachers who
responded to participate in the study had close business and personal ties with the researcher,
which prevented the teachers from participating in the study, to prevent bias and credibility
concerns. Garnering the experiences and perceptions from music and art teachers may have
strengthened the study either by describing the personal experiences or validating the
perspectives of other participants during the focus group portion of the qualitative case study.
The general perceptions were art and music teachers are dispensable and the least essential
teachers because some schools in the district do not fill one or both of the positions in the school.

124
Recommendations
As school systems strive to ensure education is equitable, student need, not a set budget,
must be the priority when implementing a fair funding formula. For an equitable funding formula
to exist, more inclusivity needs to occur when creating an extensive budgeting formula. The
school board needs to involve all educator stakeholders: teachers, principals, clinicians, and
teacher assistants. Budget formula creation should also include families and community
members. Each school, even in the same district, has unique needs requiring specific rather than
general dialogue on what positions, programs, and structures should be put in place to ensure
academic progress.
To hold the district’s school board more accountable, the school board should become an
elected body, not appointed by the mayor. The school district studied is the only school district in
Illinois without an elected school board. The practice of appointing school board members
occurred in 1995 (Lipman et al., 2015). Based on the focus groups, teachers perceived the school
board members are more accountable to the mayor than to the general public, students, teachers,
or families. School board members have been known to make unanimous votes on major school
policy issues.
Providing school resources based only on student enrollment does not demonstrate equity
when some schools need more. Participants suggested schools cannot provide a quality education
if the school population falls below a certain threshold. The statement suggests staffing will be
too minimal to require the minimum number of courses needed for a well-rounded education
especially in a high school setting. Technical careers, magnet programs, International
Baccalaureate programs, and Advanced Placement courses cannot be offered if student
enrollment is low.

125
Based on the focus group discussions, student-based budgeting is not an equitable
budgeting formula. Students may receive the same amount of money per enrollment, but the
money does not equate to a diverse supply of quality resources, a diverse teaching staff, or
extracurricular activities which meet the unique needs of each specific school population. If
student-based budgeting is not equal, then the budgeting model is still far from equitable. Equity
entails providing the resources necessary for achievement. Equity sometimes provides some
schools with more and others with less based on need. No student or school should have to go
without resources because school enrollment is low.
More inclusive communication among district and school staff, families, and
communities could ensure each student receives the funding necessary for the school to function.
Participants agreed schools are a function of the community. Districts and school administration
having meaningful conversations with neighborhoods and communities before setting a budget is
prerequisite for success.
The amount of money per student provided by the district is low and can be increased.
The amount of money per pupil spent by the district in the 2019–2020 school year was $4,506.93
(Quig, 2019). The recommendation calls for the district to review other school districts and how
much money is spent per pupil. Additionally, property taxes are the main source of school
funding in the district. If a neighborhood has either inexpensive homes or few homes and
residents, schools will continue to be under resourced. The money given to the school district by
federal, state, and local governments should be distributed in an equitable manner, ensuring all
schools, regardless of size, are fully staffed with comprehensive programming during school and
after school.

126
Implications for Leadership
The results from the research can change how districts fund education to ensure equity
across income levels, racial demographics, and low-enrollment schools. Based on the district’s
data and participants’ perspectives and experiences, declining student enrollment in the district is
an annual occurrence, especially in neighborhoods with students of color. Also, some subjects
are hard to staff, such as science, advanced math, foreign language, and technology.
Families living in communities with declining public school enrollment have transferred
from neighborhood public schools into charter schools in the same neighborhoods, private
schools, or schools outside the district. Families who have chosen to send children to charter
schools do so with the perception the students will receive a higher quality education because
district officials have branded many charter schools as high-quality options (Ali & Watson,
2017). Low-income families will leave a neighborhood or the state due to gentrification, lacking
the ability to afford increased rent in a state with a ban on rent control (Dukmasova, 2019).
About 400,000 residents left Illinois from 2009 to 2019 due to housing (Loury, 2020).
Housing advocacy must occur in order to keep families stabilized and children in the schools.
Partnerships with the school district, housing department, or nonprofit organizations focusing on
affordable housing are needed.
The results of the qualitative case study present an opportunity for school districts
implementing student-based budgeting to view education with a comprehensive lens and the
different variables which affect a student’s quality of education before deciding on a school
budgeting model. Based on the data analysis of the research, factors impacting K–12 public
education in Illinois include lack of affordable housing; lack of fully staffed schools to meet the

127
academic, social, emotional, physical, and mental needs of students; and lack of competent
principals who practice ethics and advocacy when hiring and prioritizing programming.
Research-based decisions with empirical data need to be in place before considering how
much money to provide to a school. Neighborhood and community needs must be investigated
by the school and the district because schools exist for the growth and empowerment of a
community. For example, schools in neighborhoods with many families living in temporary
housing may need to staff a housing liaison who can connect families to affordable housing
options. Schools in neighborhoods where many languages are spoken should have multiple
bilingual teachers in place. Schools in high-crime areas should earmark funding for before- and
after-school programming to keep students safe and off the streets.
One way to stop an unfair advantage of competing for students is to eliminate the SQRP
school ratings. The majority of Level 1 and Level 1+ schools are situated in affluent White
neighborhoods, while the majority of Level 2 and Level 3 schools are in low-income African
American and Hispanic neighborhoods. Instead, displaying a school’s strength and showing how
weaknesses are being addressed can show families the district is invested in all schools rather
than displaying punitive ratings. School ratings can be perceived as punitive because any rating
under a Level 1 reveals where a school is weak, such as test scores, parent engagement, and
programs. Additionally, some schools with a rating lower than a Level 1 can be on probation.
Probation means the school needs additional supports because the school is not fully
meeting the needs of students. Families seeing a school is on probation can cause a negative
perception of the school, causing the family to look for other educational options for the school-
age child. As a result, the school on probation can lose more students and receive even less
funding under the student-based budgeting model. The low ratings, which are in predominantly

128
African American communities, can compel families to travel outside of communities to other
schools in the district.
Another opportunity for leadership in the district is to not punish schools based on
attendance, which also impacts SQRP ratings. The district no longer provides truant officers. The
primary role of truant officers, who were assigned to schools in the district, was to investigate
chronic absence and tardiness of enrolled students. The investigations involved calling and
visiting the homes of the truant students and observing the children’s neighborhoods (O’Brien,
2017). A student was considered truant if the student missed nine or more days without an
excuse. Reinstating truant officers as a support system to students and families could decrease
chronic truancy while increasing attendance and possibly increasing test scores and student
achievement. Truant officers should be staffed by the district and not the principal’s budget
because a principal can deem the position as nonessential or too costly and may place funds
elsewhere.
If truant officers appear and low SQRP ratings disappear, schools can look more
attractive to families. Quality schools are one reason families move to certain neighborhoods.
Using quality schools to attract families can increase the population of the city and increase
school enrollment. If student-based budgeting is to continue, student enrollment must increase as
well as the per-pupil amount. Providing equity can decrease teacher stress, and the educators can
spend fewer or even no hours on fundraising, affording teachers more time to focus on classroom
instruction.
Conclusion
The purpose of the qualitative case study was to gather participants’ perspectives of the
effect student-based budgeting has on teachers to ascertain whether inequity exists in the

129
formula. Based on findings from the qualitative case study, the student-based budgeting formula
model puts low-income schools and low-enrollment schools, students of color, veteran teachers,
and extracurricular teachers at a disadvantage.
Based on the experiences and perceptions of the teacher participants, students from low-
income families are suffering the most because of the school district’s implementation of
student-based budgeting. Low-income students, especially students in low-enrollment schools,
are most likely to attend schools with teacher vacancies, with a lack of programming options.
These students are likely not to receive a comprehensive education. The students are
likely to be without an art teacher, a music teacher, a librarian, a science teacher, and a special
education teacher. As a result, staff are stressed because substitute teachers and teachers without
certification may be hired instead. Teachers in the school building take on extra classes or the
position goes unfilled.
African Americans and Hispanics account for more than 80% of the students in the
school district, but are likely unable to compete in sports or academics with school district’s
affluent counterparts due to a lack of staffing, overworked staff, and lack of funding due to
student-based budgeting. Many low- and medium-enrollment neighborhood schools in African
American and Hispanic neighborhoods have limited to no competitive sports programs
sanctioned by the district. Since the implementation of student-based budgeting, experienced
teachers are viewed more as a liability to the school and district rather than an asset to student
achievement.
Principals making statements such as, “I need a second-grade teacher but with no more
than four years of experience,” shows student-based budgeting forces principals to put budget
over achievement. Experienced teachers are not honored, and the district provides incentives for

130
veteran teacher to take early retirement while receiving fewer annual step (experience) raises
than a new teacher. Once a teacher reaches 14 years of experience in the district, a three-year halt
in step raises occurs until the teacher reaches the 17th year.
After special education teachers were no longer counted as part of the student-based
budgeting and were paid for by the district, more special education teachers have been hired by
school principals. Many of the special education teachers who were hired were veterans with
more than 10 years of experience. Hiring more special education teachers allowed for students
with IEPs to meet state-required instructional minutes and allowed the school to be compliant
when audits take place. Students with IEPs were also able to achieve goals and build more
trusting relationships with staff.
Any time academic achievement is not a priority in a school budget, deficiencies in
funding will occur. The implementation of student-based budgeting has presented flaws which
have impacted the district since 2014. More per-pupil funding must occur. The district needs to
reallocate property taxes to be divided equitably among all schools in the district, not just by
neighborhoods. Schools should be fully staffed, and no teacher should be overlooked and not
hired due to years of experience and education attainment, which would require a higher salary
than an inexperienced teacher. Principals must be held accountable to ensure schools are fully
staffed, and annual professional development on budgeting must be provided to ensure principals
know how to allocate funds properly.
Public education should no longer be synonymous with low quality. All students, rich,
poor, or middle-class, deserve a high-quality education which will cultivate gifts, skills, and
passions. To make quality education a reality, a needs assessment should be made. The money
must be found, and budgeted around student needs.

131
References
Abdi, E. (2015). The effects of reducing school budget approaches to proceed toward successful
educational programs in era of budget disparity with concentrating on New Jersey public
education. Elixir International Journal, 88, 36248–36253. Retrieved from http://works
.bepress.com/ellie-abdi/20/
Adams, J. S. (1963). Toward an understanding of inequity. Journal of Abnormal and Social
Psychology, 67(5), 422–436. doi:10.1037/h0040968
Ali, T., & Watson, A. (2017). Less than 25 percent of Chicago kids go to “neighborhood high
schools.” Retrieved from Chicago Visualized website: https://www.dnainfo.com/chicago
/20170619/englewood/chicago-public-schools-neighborhood-high-school-enrollment
-attendance-charter/
Ames, H., Glenton, C., & Lewis, S. (2019). Purposeful sampling in a qualitative evidence
synthesis: A worked example from a synthesis on parental perceptions of vaccination
communication. BMC Medical Research Methodology, 19, Article 26. doi:10.1186
/s12874-019-0665-4
Andrade, H. (2019). A critical review of research on student self-assessment. Educational
Psychology and Methodology, 4, Article 87. doi:10.3389/feduc.2019.00087
Anney, V. N. (2014). Ensuring the quality of the findings of qualitative research: Looking for
trustworthiness criteria. Journal of Emerging Trends in Educational Research and Policy
Studies, 5(2), 272–281. Retrieved from https://pdfs.semanticscholar.org/1419
/f7b54e6b7f1215717a5056e0709f8946745b.pdf

132
Baker, B. D. (2014). Review of “Charter school funding: Inequity expands.” Retrieved from
National Education Policy Center website: https://nepc.colorado.edu/thinktank/review
-charter-funding-inequity
Baker, B. D., Farrie, D., & Sciarra, D. (2018). Is school funding fair? A national report card.
Retrieved from Education Law Center, Rutgers Graduate School of Education website:
https://edlawcenter.org/assets/files/pdfs/publications/Is_School_Funding_Fair_7th_Editi
Baker, B. D., & Weber, M. (2016). State school finance inequities and the limits of pursuing
teacher equity through departmental regulation. Education Policy Analysis Archives, 24.
doi:10.14507/epaa.24.2230
Baker, L. (2017). A letter to White women teachers: An urgent plea for change. International
Journal of Progressive Education, 13(2), 180–192. Retrieved from https://ijpe
.penpublishing.net/makale/245
Balnaz, R. (2019). New in-depth analysis of high school graduation rates reveals progress is
real, but slowing, indicating urgency to double down on equity gaps. Retrieved from John
Hopkins School of Education website: https://education.jhu.edu/2019/06/new-in-depth
-analysis-of-high-school-graduation-rates-reveals-progress-is-real-but-slowing-indicating
-urgency-to-double-down-on-equity-gaps/
Banicki, G., & Murphy, G. (2014). Adequacy model for school funding. Journal of Modern
Education Review, 4(8), 587–597. doi:10.15341/jmer(2155-7993)/08.04.2014/003
Barnard, C. (2018). Examining what went wrong with the student-based budgeting pilot
program. Retrieved from Reason Foundation website: https://reason.org/commentary
/essa-student-based-budgeting-pilot-what-went-wrong/

133
Barnard, C. (2019). Weighted student funding yearbook, 2019. Retrieved from Reason
Foundation website: https://reason.org/policy-study/weighted-student-formula-yearbook
-2019/
Barnett, W. S., & Kasmin, R. (2018). Fully funding pre-K through K–12 funding formulas. State
Education Standard, 18(1), 22–28. Retrieved from https://www.researchconnections.org
/childcare/resources/38086
Barrow, L., & Sartain, L., & Torre, M. (2018). Selective enrollment high schools in Chicago:
Admission and impacts. Retrieved from University of Chicago Consortium on School
Research website: https://consortium.uchicago.edu/sites/default/files/2018-10/Selective
%20Enrollment%20HS%20Snapshot-Feb%202018-Consortium.pdf
Baškarada, S. (2014). Qualitative case study guidelines. The Qualitative Report, 19(40), 1–18.
Retrieved from http://nsuworks.nova.edu/tqr/vol19/iss40/3
Birt, L., Scott, S., Cavers, D., Campbell, C., & Walter, F. (2016). Member checking: A tool to
enhance trustworthiness or merely a nod to validation? Sage Journals, 26(13), 1802–
1811. doi:10.1177/1049732316654870
Boddy, C. (2016). Sample size for qualitative research. Qualitative Market Research, 19(4),
426–432. doi:10.1108/QMR-06-2016-0053
Bolarinwa, O. (2015). Principles and methods of validity and reliability testing of questionnaires
used in social and health sciences researches. Nigerian Postgraduate Medical Journal,
22(3), 195–201. Retrieved from https://www.npmj.org/article.asp?issn=1117-1936;year
=2015;volume=22;issue=4;spage=195;epage=201;aulast=Bolarinwa
Booke, J., & Willment, J. (2018). Teaching assumptions within a university faculty development
program. Teaching and Learning Journal, 11(1), 1–18. Retrieved from https://www.kpu

134
.ca/sites/default/files/Transformative%20Dialogues/TD.11.1.7_Booke%26Willment
_Teaching_Assumptions.pdf
Brown, C. (2015, June 24). Making classrooms work: Why teachers need to be involved in
education policy decisions. U.S. News and World Report. Retrieved from https://www
.usnews.com/opinion/knowledge-bank/2015/06/24/why-teachers-should-be-involved-in
-education-policy-decisions
Callingham, R., Carmichael, C., & Watson, J. M. (2016). Explaining student achievement: The
influence of teachers’ pedagogical content knowledge in statistics. International Journal
of Science and Mathematics Education, 14(7), 1339–1357. doi:10.1007/s10763-015-9653
-2
Carrell, M. R., & Dittrich, J. E. (1978). Equity theory: The recent literature, methodological
considerations, and new directions. Academy of Management Review, 3(2), 202–210. doi:
10.5465/amr.1978.4294844
Carver-Thomas, D., & Darling-Hammond, L. (2019). The trouble with teacher turnover: How
teacher attrition affects students and schools. Education Policy Analysis Archives, 27(36).
doi:10.14507/epaa.27.3699
Center for Public Education. (2016). Educational equity: What does it mean? How do we know
when we reach it? Retrieved from https://cdn-files.nsba.org/s3fs-public/reports/10901
-4496-16_CPE_%20Equity%20Symposium_FINAL.pdf
Chan, T. K., & Morris, R. (2018). Meeting the challenges of financial difficulties. How metro-
Atlanta school districts act. Educational Planning, 24(4), 59–66. Retrieved from https://
isep.info/educational-planning-journal/

135
Chicago Teachers Union. (2019). Salary schedule for full-time appointed teachers. Retrieved
from https://www.ctulocal1.org/wp-content/uploads/2019/11
/TeacherTablesforCTUvote2019-web.pdf
Chin, J., & Chuang, C. (2015). The relationships among school-based budgeting, innovative
management, and school effectiveness: A study on specialist schools in Taiwan. Asia-
Pacific Education Researcher, 25(4), 679–693. doi:10.1007/s40299-014-0220-3
Chingos, M. M., & Blagg, K. (2017). Making sense of the state school funding policy. Retrieved
from Urban Institute website: https://www.urban.org/sites/default/files/publication/94961
/making-sense-of-state-school-funding-policy_0.pdf
Ciolino, M., Kirylo, J., Miron, L., & Frazier, K. (2014). Education reform in New Orleans:
Voices from the Recovery School District. Policy Futures in Education, 12(4), 463–468.
doi:10.2304/pfie.2014.12.4.463
Cohen, L., Manion, L., & Morrison, K. (2017). Research methods in education (8th ed.).
Retrieved from https://books.google.com/
Colgren, C., & Sappington, N. E. (2015). Closing the achievement gap means transformation.
Education Leadership of Doctoral Research, 2(1), 24–33. Retrieved from https://journals
.sagepub.com/doi/pdf/10.2304/pfie.2014.12.4.463
Cook-Harvey, C., & Stosich, E. L. (2016). Redesigning school accountability and support:
Progress in pioneering states. Retrieved from Learning Policy Institute and Stanford
Center for Opportunity Policy in Education website: https://learningpolicyinstitute.org
/sites/default/files/product-files/Redesigning_School_Accountability_and_Support.pdf

136
Cowen, J. M., & Creed, B. (2017). Public school choice and student achievement: Evidence from
Michigan’s interdistrict open enrollment system. Sage Journals, 3(3), 1–12. doi:10.1177
/2332858417731555
Cox, J. (2020). What is the role of a teacher. Retrieved from ThoughtCo website: https://www
.thoughtco.com/what-is-the-role-of-a-teacher-2081511
Creswell, J. W., & Creswell, J. D. (2018). Research design: Qualitative, quantitative, and mixed
method approaches (5th ed.). doi:10.1080/00918369.2017.1321386
Creswell, J. W., & Gutterman, T. C. (2015). Educational research: Planning, conducting, and
evaluating quantitative and qualitative research (6th ed.). Retrieved from https://www
.pearson.com/
Crossman, A. (2020). Understanding purposive sampling. Retrieved from ThoughtCo website:
https://www.thoughtco.com/purposive-sampling-3026727
Daily, A. (2018). Teacher job satisfaction and principal leadership styles: A qualitative study
(Doctoral dissertation). Retrieved from ProQuest Dissertations and These Global.
(Publication No. 2170671132)
Daniel, P., & Walker, T. (2014). Fulfilling the promise of Brown: Examining laws and policies
for remediation. Journal of Negro Education, 83(3), 256–273. doi:10.7709
/jnegroeducation.83.3.0256
Darawsheh, W. (2014). Reflexivity in research: Promoting rigor, reliability and validity in
qualitative research. International Journal of Therapy & Rehabilitation, 21(12), 560–568.
doi:10.12968/ijtr.2014.21.12.560
Darling-Hammond, L., Wilhoit, G., & Pittenger, L. (2014). Accountability for college and career
readiness: Developing a new paradigm. Education Policy Analysis Archives, 22(86), 1–

137
45. Retrieved from https://edpolicy.stanford.edu/sites/default/files/publications
/accountability-college-and-career-readiness-developingnew-paradigm.pdf
Darrow, A. (2016). The Every Student Succeeds Act (ESSA): What it means for students with
disabilities and music educators. General Music Today, 30(1), 41–44. doi:10.1177
/1048371316658327
Dean-Coffrey, J. (2018). What’s race got to do with it? Equity and philanthropic evaluation
process. American Journal of Evaluation, 39(4), 527–542. doi:10.1177
/1098214018778533
DeSilver, D. (2017, February 15). U.S. students’ academic achievement still lags that of their
peers in many other countries. Retrieved from Pew Research Center website: https://
www.pewresearch.org/fact-tank/2017/02/15/u-s-students-internationally-math-science/
Dikko, M. (2016). Establishing construct validity and reliability: Pilot testing of a qualitative
interview of a qualitative interview for research in takaful (Islamic insurance). The
Qualitative Report, 21(3), 1–10. Retrieved from https://nsuworks.nova.edu/tqr/vol21/iss3
/6/
Dolph, D. A. (2016). To plan or not to plan, that is the question. Journal of Cases in
Educational Leadership, 19(3), 100–109. doi:10.1177/1555458916657124
Domina, T., McEachin, A., Hanselman, P., Agarwal, P., Hwang, N., & Lewis, R. W. (2019).
Beyond tracking and detracking: The dimensions of organizational differentiation in
schools. Sage Journals, 92(3), 293–322. doi:10.1177%2F0038040719851879
Doyle, D., Boast, L., Rosch, J., & Hassel, B. (2012). Funding a better education: Conclusions
from the first three years of student-based budgeting in Hartford. Retrieved from Public
Impact website: https://publicimpact.com/funding-a-better-education/

138
Driessen, G. (2017). The validity of educational disadvantage policy indicators. Educational
Policy Analysis and Strategic Research, 12(2), 93–110. doi:10.29329/epasr
Dukmasova, M. (2019, October 16). Chicago tenants continue to demand “rent control now.”
The Chicago Reader. Retrieved from https://www.chicagoreader.com/chicago/illinois
-rent-control-ban-repeal/Content?oid=74775767
Ellard-Gray, A., Jeffrey, N. K., Choubak, M., & Crann, S. (2015). Finding the hidden
participant: Solutions for hidden, hard-to-reach, and vulnerable populations. Sage
Journals, 14(5), 1–29. doi:10.1177/1609406915621420
Emmanuel, A. (2018, November 5). Beyond hiring. The struggle to diversify Chicago’s teaching
ranks. Chalkbeat. Retrieved from https://chicago.chalkbeat.org/2018/11/5/21106168
/beyond-hiring-the-struggle-to-diversify-chicago-s-teaching-ranks
Essex, N. L. (2015). School law and the public schools: A practical guide for educational
leaders (6th ed.). Retrieved from https://www.pearson.com/
Farmer, L. (2019). The K–12 conundrum: Americans wants more education funding, but not
higher taxes. Retrieved from Governing website: https://www.governing.com/topics
/education/gov-raising-funding-public-schools.html
Farmer, S., & Baber, A. (2019). Student based budgeting concentrates low budget schools in
Chicago’s Black neighborhoods. Retrieved from http://publish.illinois.edu
/projectformiddleclassrenewal/files/2019/09/Student-Based-Budgeting-report.pdf
Filardo, M. (2016). State of our schools: America’s K–12 facilities. Retrieved from https://
centerforgreenschools.org/state-our-schools
Fitzpatrick, L. (2018, April 17). CPS budgeting enough money so schools can maintain current
staffing levels. Chicago Sun-Times. Retrieved from https://chicago.suntimes.com/2018/4

139
/17/18406061/cps-budgeting-enough-money-so-schools-can-maintain-current-staffing
-levels
Fogarty, J., Harris, C., Morrow, D., & Scott, A. (2015). Student-based budgeting: Getting to
equitable funding. Retrieved from A + Schools website: http://www.aplusschools.org/wp
-content/uploads/2015-Budget-Brief-Design-FINAL.pdf
Ford, D. (2015). Multicultural issues: Recruiting and retaining Black and Hispanic students in
gifted education: Equality versus equity schools. Gifted Child Today, 38(3), 187–191.
doi:10.1177/1076217515583745
Ford, D., Wright, B., & Washington, A. (2016). Access and equity denied: Key theories for
school psychologists to consider when assessing Black and Hispanic students in gifted
education. School Psychology Forum, 10(3), 265–267. Retrieved from http://www
.nasponline.org/publications/periodicals/spf/volume-10/volume-10-issue-3-(fall-2016)
/access-and-equity-denied-key-theories-for-school-psychologists-to-consider-when
-assessing-black-and-hispanic-students-for-gifted-education
Ford, M. R., & Ihrke, D. M. (2019). Bridging the charter school accountability divide: Defining a
role for nonprofit charter school boards. Education and Urban Society, 51(5), 640–658.
doi:10.1177/0013124517747365
Fowler, D., & Brown, K. (2018). Data-driven decisions: Using equity theory to highlight
implications for underserved students. AASA Journal of Scholarship & Practice, 14(4),
18–28. Retrieved from http://www.aasa.org/jsp.aspx
Francom, J. A. (2016). Roles high school principals play in establishing a successful character
education initiative. Journal of Character Education, 12(1), 17–34. Retrieved from http://
www.infoagepub.com/jrce-issue.html?i=p593e6fa9f20da

140
Fregni, J. (2018). What teachers would change about education. Retrieved from Teach for
America website: https://www.teachforamerica.org/stories/what-teachers-would-change
-about-education
Fusch, P., Fusch, G., & Ness, L. (2018). Denzin’s paradigm shift: Revisiting triangulation in
qualitative research. Journal of Social Change, 10(1), 19–32. doi:10.5590/JOSC.2018.10
.1.02
Gammelgaard, B. (2017). Editorial: The qualitative case study. International Journal of Logistics
Management, 28(4), 910–913. doi:10.1108/IJLM-09-2017-0231
Garcia, E., & Weiss, E. (2017). Education inequalities at the school starting gate: Gaps, trends,
and strategies to address them. Retrieved from Economic Policy Institute website:
https://www.epi.org/publication/education-inequalities-at-the-school-starting-gate/#epi
-toc-23
Gewertz, C. (2019, August 5). “I am a fool to do this job”: Half of teachers say they’ve
considered quitting. Education Week. Retrieved from https://www.edweek.org/ew/articles
/2019/08/05/half-of-teachers-considered-quitting.html?cmp=soc-edit-tw
Ghirotto, L. (2016). Research method and phenomenological pedagogy: Reflections from Piero
Bertolini. Encyclopaideia, 20(45), 82–95. doi:10.6092/issn.1825-8670/6326
Gozali, C., Claassen Thrush, E., Soto-Pena, M., Whang, C., & Luschei, T. F. (2017). Teacher
voice in global conversations around education access, equity, and quality. Forum for
International Research in Education, 4(1), 32–51. Retrieved from http://preserve.lehigh
.edu/fire/vol4/iss1/2

141
Gross, B., & Jochim, A. (2016). Incomplete reform in Baltimore: A shift in authority to school
leaders fall short. Education Next, 16(4), 26–35. Retrieved from https://www
.educationnext.org/incomplete-reform-in-baltimore-city-public-schools/
Haider, A. (2018). School funding: Explaining Illinois’ school funding gap, how state determines
funding for each district, and more. Retrieved from Better Government Association
website: https://www.bettergov.org/backstory/school-funding/
Haines, D. (2017). Ethical considerations in qualitative case study research recruiting
participants with profound intellectual disabilities. Sage Journals, 13(3–4), 219–232. doi:
10.1177%2F1747016117711971
Hammarberg, K., Kirkman, M., & de Lacey, S. (2016). Qualitative research methods: When to
use them and how to judge them. Human Reproduction, 31(3), 498–501. doi:10.1093
/humrep/dev334
Harman, W. G., Boden, C., Karpenski, J., & Muchowicz, N. (2019). No Child Left Behind: A
postmortem for Illinois. Education Policy Analysis Archives, 24(48). doi:10.14507/epaa
.v24.2186
Harrison, H., Birks, M., Franklin, R., & Mills, J. (2017). Case study research: Foundations and
methodologies orientations. Forum: Qualitative Social Research, 18, Article 1. doi:10
.17169/fqs-18.1.2655
Heffernan, A. (2018). Power and the “autonomous” principal: Autonomy, teacher development,
school leaders’ work. Journal of Educational Administration and History, 50(4), 379–
396. doi:10.1080/00220620.2018.1518318

142
Herman, K., Prewitt, S., Eddy, C., Savale, A., & Reinke, W. (2020). Profiles of middle school
teacher stress and coping: Concurrent and prospective correlates. Journal of School
Psychology, 78, 54–78. doi:10.1016/j.jsp.2019.11.003
Hodges, J. (2018). The effect of the 2008 recession on gifted funding across the state of Texas.
AERA Open, 4(3), 1–11. doi:10.1177/2332858418786224
Hodges, T. (2018). Teachers seek more input in the decision-making process. Retrieved from
Gallup website: https://news.gallup.com/poll/232142/teachers-seek-input-school-decision
-making.aspx
Hourigan, M. (2016). The benefits and challenges of student-based budgeting. Retrieved from
Connecticut Council for Education Reform website: http://ctedreform.org/wp-content
/uploads/2016/05
Hyman, J. (2017). Does money matter in the long run? Effects of school spending on educational
attainment. American Economic Journal: Economic Policy, 9(4), 256–280. doi:10.1257
/pol.20150249
Illinois Report Card. (2019). Illinois report card 2019–2020. Retrieved from https://www
.illinoisreportcard.com/state.aspx?source=teachers&source2=teachersalary&Stateid=I
Illinois State Board of Education. (2017). Annual statistical report. Retrieved from https://www
.isbe.net/Pages/Annual-Statistical-Report.aspx
Inequity is the problem in education. (2016). Retrieved from William and Flora Hewlett
Foundation website: https://hewlett.org/inequity-is-the-problem-in-education/
Ingersoll, R. M., Sirinides, P., & Dougherty, P. (2018). Leadership matters: Teachers’ role in
school decision making and school performance. American Educator, 42(1), 13–17.
Retrieved from https://www.aft.org/ae/spring2018/ingersoll_sirinides_dougherty139

143
Ishak, N. M., & Bakar, A. (2014). Developing sampling frame for case study: Challenges and
conditions. World Journal of Education, 4(3), 29. doi:10.5430/wje.v4n3p29
Jabbar, H. (2018). Recruiting “talent”: School choice and teacher hiring in New Orleans.
Educational Administration Quarterly, 54(1), 115–151. doi:10.1177/0013161X17721607
Jackson, C. K., Johnson, R. C., & Persico, C. (2016). The effects of school spending on
educational outcomes: Evidence from school finance reforms. Quarterly Journal of
Economics, 131(1), 157–218. doi:10.1093/qje/qjv036
Jankov, P., & Caref, C. (2017). Segregation and inequality in Chicago Public Schools,
transformed and intensified under corporate education reform. Education Policy and
Analysis Archives, 25, 56. doi:10.14507/epaa.25.2631
Jurado de los Santos, P., Moreno-Guerrero, A. J., Marin-Marin, J. A., & Solar Coster, R. (2020).
The term equity in education: A literature review with scientific mapping in web of
science. International Journal of Environmental Research and Public Health, 17(10),
Article 3526. doi:10.3390%2Fijerph17103526
Kahlenberg, R. D., & Potter, H. (2014). Why teacher voice matters. American Educator, 38(4),
6–7. Retrieved from http://www.aft.org/sites/default/files/kahlenberg.pdf
Kane, T. J. (2017). Making evidence locally: Rethinking education research under the Every
Student Succeeds Act. Education Next, 17(2), 52–58. Retrieved from https://www
.educationnext.org/journal/spring-2017-vol-17-no-2/
Karp, S. (2019, August 5). 1 in 3 Chicago public schools went without a teacher for year. NPR
WBEZ 91.5. Retrieved from https://www.npr.org/local/309/2019/08/05/748114048/1-in
-3-chicago-public-schools-went-without-a-teacher-for-a-year

144
Kelleher, M. (2015, August 14). Student-based budgeting in the works for a decade. The
Chicago Reporter. Retrieved from https://www.chicagoreporter.com/student-based
-budgeting-in-the-works-for-a-decade/
Knight, D. S. (2019). Are school districts allocating resources equitably? The Every Student
Succeeds Act, teacher experience gaps, and equitable resource allocation. Educational
Policy, 33(4), 615–649. doi:10.1177/0895904817719523
Knight, D. S., Izquierdo, E., & DeMatthews, D. E. (2016). A balancing act: School budgets and
resource allocation on a new dual language campus. Journal of Educational Leadership,
19(4), 32–46. doi:10.1177/1555458916664766
Kohl, R., & Pizarro, M. (2016). Fighting to educate our own: Teachers of color, relational
accountability, and the struggle for racial justice. Equity & Excellence in Education,
49(1), 72–84. doi:10.1080/10665684.2015.1121457
Korstjens, I., & Moser, A. (2018). Series: Practical guidance to qualitative research. Part 4:
Trustworthiness and publishing. European Journal of General Practice, 24(1), 120–124.
doi:10.1080/13814788.2017.1375092
Laitsch, D. (2016). After 60 years, do the arguments for K–12 vouchers still hold? Global
Educational Review, 3(2), 23–32. Retrieved from https://www.academia.edu/28802593
/After_60_Years_Do_The_Arguments_For_K_12_Vouchers_Still_Hold
Lang, D. (2016). Incentive funding meets incentive-based budgeting: Can they coexist?
Canadian Journal of Higher Education, 46(4), 1–22. Retrieved from http://journals.sfu.ca
/cjhe/index.php/cjhe/article/view/186434/pdf
Larkin, B. (2016). Funding students, not units: Moving Alabama from a regressive public school
funding state to a progressive public-school funding state. Alabama Journal of

145
Educational Leadership, 3, 15–37. Retrieved from https://www.icpel.org/state-affiliate
-journals.html
Leachman, M., Masterson, K., & Figueroa, E. (2017). A punishing decade for school funding.
Retrieved from Center on Budget and Policy Priorities website: https://www.cbpp.org
/research/state-budget-and-tax/a-punishing-decade-for-school-funding
Lee, K. G., & Polachek, S. W. (2018). Do school budgets matter? The effect of budget referenda
on student dropout rates. Education Economics, 26(2), 129–144. doi:10.1080/09645292
.2017.1404966
Lipman, P. (2018). Segregation, the “Black spatial imagination,” and racial social
transformation. Democracy & Education, 26(2), Article 9. Retrieved from https://
democracyeducationjournal.org/home/vol26/iss2/9/
Lipman, P., Gutstein, E., Gutierrez, R., & Blanche, T. (2015). Should Chicago have an elected
representative school board? A review of the evidence. Retrieved from Collaborative for
Equity & Justice in Education website: https://ceje.uic.edu/wp-content/uploads/2013/11
/CEJE_ERSB_Report_2MB.pdf
Loury, A. (2020, January 8). Five charts that show who’s leaving Illinois and why. NPR WBEZ
Chicago. Retrieved from https://www.npr.org/local/309/2020/01/08/794320135/five
-charts-that-show-who-s-leaving-illinois-and-why
Lucas, S. R., & Beresford, L. (2010). Naming and classifying: Theory, evidence, and equity in
education. Sage Journals, 34(1), 25–84. doi:10.3102/0091732X09353578
Lueken, M. F., & Shuls, J. V. (2019). The future of K–12 funding: How states can equalize
opportunity and make K–12 funding more equitable. Retrieved from Ed Choice website:
https://www.edchoice.org/research/the-future-of-k-12-funding

146
Maciag, M. (2020). Education spending per student per state. Retrieved from Governing
website: https://www.governing.com/gov-data/education-data/state-education-spending
-per-pupil-data.html
Mahnaz, S., Bahramnezhad, F., Fomani, F., Mahnaz, S., & Cheraghi, M. (2014). Ethical
challenges of researchers in qualitative studies: The necessity to develop a specific
guideline. Journal of Medical Ethics and the History of Medicine, 7(14), 1–6. Retrieved
from https://www.ncbi.nlm.nih.gov/pmc/articles/PMC4263394/
Masterson, M. (2018, February 28). CPS board votes unanimously to close 4 Englewood high
schools. WTTW. Retrieved from https://news.wttw.com/2018/02/28/cps-board-votes
-unanimously-close-4-englewood-high-schools
McAllister, P. (2018). A teacher’s perspective on what’s wrong with our schools. Cato Journal,
38(1), 1–21. Retrieved from https://www.cato.org/cato-journal/winter-2018/teachers
-perspective-whats-wrong-our-schools
McCambly, H. N., & Haley, K. J. (2016). Equity and the “B” word: Budgeting and professional
capacity in student affairs. Journal of Student Affairs Research and Practice, 53(2), 205–
217. doi:10.1080/19496591.2016.1147358
Murtaza, D. (2018). Too many school districts in Illinois? What should you know about school
consolidation. Retrieved from Better Government Association website: https://www
.bettergov.org/news/too-many-school-districts-in-illinois-what-you-should-know-about
-school-consolidation/
Nusbaum, L., Douglas, B., Damus, K., Paasche-Orlow, M., & Estrella-Luna, N. (2017).
Communicating risks and benefits in informed consent for research: A qualitative study.
Global Qualitative Nursing Research, 4(3), 1–13. doi:10.1177/2333393617732017143

147
Nyumba, T. O., Wilson, K., Derrick, C., & Mukherjee, N. (2018). The use of focus group
discussion methodology: Insights from two decades of application in conservation.
Methods in Ecology and Evolution, 9(1), 20–32. doi:10.1111/2041-210X.12860
O’Brien, K. (Executive Producer and Reporter). (2017). Could truant officers return to Chicago
Public Schools? [Podcast]. Retrieved from https://www.wbez.org/stories/could-truant
-officers-return-to-chicago-public-schools/1ea70d7e-ede4-41da-88f4-d02d4b1d556f
Olufowote, J. O. (2017). Limitations of research. In M. Allen (Ed.), The Sage encyclopedia of
communication research methods (pp. 863–864). doi:10.4135/9781483381411.n297
Padilla-Diaz, M. (2015). Phenomenology in qualitative research: Philosophy as a science or
philosophical science. International Journal of Educational Excellence, 1(2), 101–110.
Retrieved from http://www.anagmendez.net/cupey/pdf/ijee_padilla_diaz_1_2_101-110
Palinkas, L., Horwitz, S., Green, C., Wisdom, J., Duan, N., & Hoagwood, K. (2015). Purposeful
sampling for qualitative data collection and analysis in mixed method implementation
research. Administration and Policy in Mental Health and Mental Health Research,
42(5), 533–544. doi:10.1007/s10488-013-0528-y
Paradis, E., O’Brien, B., Nimmon, L., Bandiera, G., & Martimianakis, M. A. (2016). Design:
Selection of data collection methods. Journal of Graduate Medical Selection, 8(2), 263–
264. doi:10.4300/JGME-D-16-00098.1
Parcell, E. S., & Baker, B. M. A. (2017). Narrative analysis. In M. Allen (Ed.), The Sage
encyclopedia of communication research methods. doi:10.4135/9781483381411.n368144

148
Partelow, L., Shapiro, S., McDaniels, A., & Brown, C. (2018). Fixing chronic disinvestment in
K–12 schools. Retrieved from Ed Choice website: https://www.edchoice.org/research/the
-future-of-k-12-funding/
Patino, C. E., & Ferreira, J. C. (2018). Inclusion and exclusion criteria in research studies:
Definitions and why they matter. Journal Brasilerio de Pneumologia, 44(2), Article 84.
doi:10.1590/s1806-37562018000000088
Penner, E., Rochmes, J., Liu, J., Solanki, S., & Loeb, S. (2019). Differing views of equity: How
prospective educators perceive their role in closing achievement gaps. The Russell Sage
Foundation Journal of Social Sciences, 5(3), 103–127. doi:10.7758/RSF.2019.5.3.06
Poiner, J. (2018). Supporting student-based budgeting in Cleveland. Retrieved from Education
Resource Strategies website: https://www.erstrategies.org/news/student_based_budgeting
_in_cleveland
Ponto, J. (2016). Understanding and evaluating survey research. Journal of the Advanced
Practitioner in Oncology, 6(2), 168–171. Retrieved from https://www.ncbi.nlm.nih.gov
/pmc/articles/PMC4601897/
Pouncey, W. C., Ennis, L. S., Woolley, T. W., & Connell, P. H. (2013). School funding issues:
State legislators and school superintendents—Adversaries or allies? Sage Journals, 3(2).
doi:10.1177%2F2158244013486492
Pounds, L., & Cuevas, J. (2019). Student involvement IEPs. Georgia Educational Researcher,
16(1), 23–47. doi:10.20429/ger.2019.160104
Profiles in school leadership: Leveraging student-based budgeting. (2015). Retrieved from
Chicago Public Education Fund website: http://thefundchicago.org/wp-content/uploads

149
/2017/07/Profiles-in-School-Leadership_Leveraging-Student-Based-Budgeting_Report-1
Quig, A. D. (2019, August 8). Mayor Lightfoot: “No reason” CPS, union can’t reach a deal.
Crain’s Chicago Business. Retrieved from https://www.chicagobusiness.com/education
/mayor-lightfoot-no-reason-cps-union-cant-reach-deal
Rashid, Y., Rashid, A., Warraich, M., Sabir, S., & Waseem, A. (2019). Case study method: A
step-by-step guide for business researchers. International Journal of Qualitative
Methods, 18, 1–13. doi:10.1177/1609406919862424
Ratcliff, N. J., Carroll, K. L., Jones, C. R., Costner, R. H., Sheehan, H. C., & Hunt, G. H. (2017).
Behaviors of teachers and their students in schools with and without an achievement gap:
An observational study. Teacher Educators’ Journal, 10, 118–141. Retrieved from
https://www.ateva.org/journal-1
Rentner, D., Kober, N., Frizzel, M., & Ferguson, M. (2016). Listen to us: Teacher views and
voices. Retrieved from Center of Education Policy website: https://www.cep-dc.org
/displayDocument.cfm?DocumentID=1456
Rhodes, D. (2019, January 16). It doesn’t hurt to ask: ISBE wants equity now. NPR Illinois.
Retrieved from https://www.nprillinois.org/post/it-doesnt-hurt-ask-isbe-wants-equity
-now
Rodney, P. J., Keller, C., & Ainsworth, B. E. (2016). Recruiting participants into pilot trials:
Techniques for researchers with shoestring budgets. California Journal of Health
Promotion, 14(2), 81–89. Retrieved from https://www.ncbi.nlm.nih.gov/pmc/articles
/PMC5231400/

150
Rosenberg, D., Gordon, J., & Hsu, B. (2019). Transforming school funding: A guide to
implementing student-based budgeting (SBB). Retrieved from https://www.future-ed.org
/transforming-school-funding-a-guide-to-implementing-student-based-budgeting/
Russ, P., & Hawthorne, M. (2018). Special education expenditures in south Texas public schools
during a period of changing enrollment. Research of Higher Education Journal, 35, 1–9.
Retrieved from http://www.aabri.com/manuscripts/172761.pdf
Saunders, B., Kitzinger, J., & Kitzinger, C. (2015). Anonymising interview data: Challenges and
compromise in practice. Sage Journals, 15(5), 616–632. doi:10.1177/1468794114550439
Schulenburg, L. (2017). What states can learn from Nevada’s student-based budgeting.
Retrieved from The Heartland Institute website: https://www.heartland.org/publications-
resources/publications/what-states-can-learn-from-nevadas-student-based-budgeting
?source=policybot
Shannon, E. W., & Saatcioglu, A. (2018). School characteristics and teacher policy influence:
Evidence from New York City. Educational Policy, 32(7), 1041–1069. doi:10.1177
/0895904816682318
Sinclair, K., & Malen, B. (2016). Student-based budgeting as a mechanism for promoting
democratic decision making: Testing the theory of action. doi:10.1177
%2F0895904819843601
Smith, A. G. (2015). Student-based budgeting helps principals be more effective educators.
Reason Foundation. Retrieved from https://reason.org/policy-brief/student-based
-budgeting-helps-princ/

151
Snell, L. (2013). A handbook for student-based budgeting, principal autonomy and school
choice. Retrieved from Reason Foundation website: https://reason.org/wp-content
/uploads/files/student_based_budgeting_handbook.pdf
Sorenson, R. D., & Goldsmith, L. M. (2018). The principal’s guide to school budgeting.
Retrieved from https://us.corwin.com/
Souza, A., Alexandre, N. C., & Guirardello, E. B. (2017). Psychometric properties in instruments
evaluation of reliability and validity. Epidemiologia e Servicos de Saudee: Revista do
Sistema Unico de Saude de Brasil, 26(3), 649–659. doi:10.5123/s1679
-49742017000300022
Surmiak, A. (2018). Confidentiality in qualitative research involving vulnerable participants:
Researchers’ perspectives. Forum: Qualitative Social Research, 19(3), Article 3099. doi:
10.17169/fqs-19.3.3099
Sutton, J. (2015). Qualitative research: Data collection, analysis, and management. Canadian
Journal of Hospital Pharmacy, 68(3), 226–231. Retrieved from https://www.ncbi.nlm.nih
.gov/pmc/articles/PMC4485510/
Swanson, E. (2005). Anchors of the community: Community schools in Chicago. New
Directions for Youth Development, 2005(107), 55–64. doi:10.1002/yd.129
Szalinski, B. (2019). The new contract continues to put a moratorium on school closings despite
plummeting student enrollment. Retrieved from Illinois Policy website: https://www
.illinoispolicy.org/chicago-student-enrollment-dropped-by-6000-but-union-blocks
-closing-schools/

152
Tausch, P., & Menold, N. (2016). Methodological aspects of focus groups in health research:
Results of qualitative interviews with focus group moderators. Sage Journals, 3(1). doi:
10.1177/2333393616630466
Theofanidis, D., & Fountouki, A. (2018). Limitations and delimitations in the research process.
Perioperative Nursing, 7(3), 155–162. doi:10.5281/zenodo.2552022
Theron, P. (2015). Coding and data analysis during qualitative empirical research in practical
theology. In die Skriflig, 49(3), Article 1880. doi:10.4102/ids.v49i3.1880148
Thompson, D., & Thompson, S. (2018). Educational equity and quality in K–12 schools:
Meeting the needs of all students. Journal of Advancement of Educational Research
International, 12(1), 34–46. Retrieved from https://www.semanticscholar.org/paper
/Educational-Equity-and-Quality-in-K-12-Schools%3A-the-Thompson-Thompson
/450b4cde75bc7ebb703b44f08f72cabc8bce8feb
Travers, J., & Catallo, C. (2015). Following the dollars to the classroom door: Why and how
effective student-based budgeting must be linked with strategic school design. Retrieved
from Education Resource Strategies website: https://www.erstrategies.org/tap/following
_the_dollars_to_the_classroom_door
Travis, T. (2019). School budgets: The most powerful instrument for building trust in school
leadership. Retrieved from TrustEd website: https://trustedschool.com/2019/02/24/school
-budgets/
Varpio, L., Ajjawi, R., Monrouxe, L. V., O’Brien, B. C., & Rees, C. E. (2017). Shedding the
cobra effect: Problematizing thematic emergence, triangulation, saturation and member
checking. Medical Education, 51(1), 40–50. doi:10.1111/medu.13124

153
Vasileiou, K., Barnett, J., Thorpe, S., & Young, T. (2018). Characterising and justifying sample
size sufficiency in interview-based studies: Systematic analysis of qualitative health
research over a 15-year period. BMC Medical Research Methodology, 18(1), Article 148.
doi:10.1186/s12874-018-0594-7
Vevea, B. (Reporter). (2014). Librarians are a luxury Chicago Public Schools can’t afford
[Radio broadcast]. Retrieved from https://www.npr.org/sections/ed/2014/09/01
/344905087/librarians-are-a-luxury-chicago-public-schools-cant-afford
Walker Burke, C. (2019, November 9). Fewer Chicago schools earn the city’s top 1-plus school
rating. See how your school fared. Chalkbeat. Retrieved from https://chicago.chalkbeat
.org/2019/11/8/21109185/fewer-chicago-schools-earn-the-city-s-top-1-plus-rating-see
-how-your-school-fared
Walker Burke, C., & Kunichoff, Y. (2018, October 30). Illinois report card: 94 Chicago schools
earn low performance rating. Chalkbeat. Retrieved from https://chalkbeat.org/posts
/chicago/2018/10/30/xx-high-schools-earn-low-performance-rating-on-new-illinois
-report-card/
Weller, S., Vickers, B., Bernard, H., Blackburn, A., Borgatti, S., Gravlee, C., & Johnson, J.
(2018). Open-ended interview questions and saturation. PLOS ONE, 13(6). doi:10.1371
/journal.pone.0198606
Wessel-Powell, C. (2014). School, activism, and politics at the movies: Educator reactions to the
film, “Waiting for ‘Superman.’” Teachers College Record, 116(3), 1–28. Retrieved from
http://www.elegantbrain.com/edu4/classes/readings/333readings/review_Waiting
_Superman.pdf

154
Wright, K., Shields, S. M., Black, K., Banerjee, M., & Waxman, H. C. (2018). Teacher
perceptions of influence, autonomy, and satisfaction in the early Race to the Top era.
Education Policy Analysis Archives, 26(62). doi:10.14507/epaa.26.3449
Yan, B. (2016). Cycle-based budgeting toolkit. Retrieved from http://cyclebasedbudgeting.org
/wp-content/uploads/2016/09/CBB_A-primer.pdf

155
Appendix A: Chicago Teachers Union Approval to Recruit Teacher Participants

156

157

158
Appendix B: Flyer to Recruit Teacher Participants
Teacher Participants
Needed!!!
Your voice is needed on your views and experiences of student-based
budgeting
In order to participate in the study, candidates must be:
▪ Knowledgeable of student-based budgeting
▪ An active classroom teacher
▪ Wiling to participate in an online survey, focus group, and
questionnaire
Online Focus group dates and times are flexible
Please contact Andrea Parker by phone at 773.807.1126 by email
Your participation is 100 percent voluntary and confidential

159
Appendix C: Preliminary Survey and Participant Demographic Questions
1. How long have you been employed with the current school district?
2. What is your gender?
a. Male b. female
3. What subject and grade level to you teach?
4. What is your highest level of education?
5. Currently, is the academic level of your school?
a. 1+
b. 1
c. 2+
d. 2
e. 3
6. In your current school, what percentage of students are eligible for free lunch?
7. What is the geographic location of your school?
a. North
b. Northwest
c. South Loop
d. West
e. Southwest
f. Southeast
g. Far south
8. How many schools have you worked for while in the district?

160
9. Have you ever been laid off due to budget cuts? If so how many?
10. What is the number of enrolled students at your school?
11. What percentage of students at your school receive free or reduced lunch?
12. What is your school’s percentage of English Language Learners?
13. What is your schools percentage of students with special needs?
14. On a scale from 1-10, how familiar are you with student-based budgeting, with 1 being the
least knowledgeable and 10 being the most knowledgeable?

161
Appendix D: Subject Matter Expert Questions
1. What are your experiences with student-based budgeting?
2. How does student-based budgeting impact your day-to-day workload?
3. How does student-based budgeting compare to the district’s previous budgeting formula?
4. What are the benefits and disadvantages of student-based budgeting?

162
Appendix E: Consent for Participation in Research Focus Group Interview
Prospective Research Participant: Read this consent form carefully and ask as many questions
as you like before you decide whether you want to participate in this research study. You are free
to ask questions at any time before, during, or after your participation in this research.
Project Information
Project Title: Public School Teachers’ Perspective of Student Based Budgeting A Qualitative
Case Study
Researcher: Andrea Parker
Organization: The American College of Education
Email: [email protected] Telephone: 773.807.1126
Researcher’s Faculty Member: Dr. Howard Moskowitz
Organization and Position: The American College of Education/Doctoral Dissertation
Coordinator
Email: [email protected]
Introduction
I am Andrea Parker and I am a doctoral candidate at American College of Education. I am doing research under the guidance and supervision of my Chair, Dr. Howard Moskowitz. I will give you some information about the project and invite you to be part of this research. Before you decide, you can talk to anyone you feel comfortable with about the research. This consent form may contain words you do not understand. Please ask me to stop as we go through the information and I will explain. If you have questions later, you can ask them then.
Purpose of the Research
You are being asked to participate in a qualitative case research study which seeks to understand the
beliefs and perceptions of student-based budgeting from teachers and the impact the funding formula

163
has had on their career. This qualitative study will closely examine how viewpoints, behaviors and
experiences of k-12 classroom teachers from an Illinois urban school district.
Research Design and Procedures
The study will use a qualitative methodology and case study research design. Survey questions
will be disseminated to potential participants to discover eligibility. The study will comprise of 20
participants, randomly selected, who will participate in a focus group and a questionnaire. The
27 participants will be divided into three groups based on school enrollment: school with low
enrollment from 0-300 students, medium enrollment 301-700, and high enrollment from 701 and
up. The study will involve online interaction among participants to be conducted on Zoom. After
the focus group, a debrief session will occur which will include a questionnaire sent electronically
through Google Forms. Participants will also be given a transcript of the focus group. The data
from the research will be reviewed five other individuals who are part of my college’s Institutional
Review Board. The Institutional Review Board will review and assess that researcher followed
guidelines implemented by the American College of Education.
Participant selection
You are being invited to take part in this research because of your experience as an experienced k-12
teacher, who can contribute much to the knowledge and understanding of student-based budgeting,
which meets the criteria for this study. Participant selection criteria:
1. Active K-12 classroom teacher in a public school
2. At least 3 years of experience in current school district
3. Able to clearly define and explain student-based budgeting
Voluntary Participation
Your participation in this research is entirely voluntary. It is your choice whether to participate. If you
choose not to participate, there will be no punitive repercussions and you do not have to participate. If
you select to participate in this study, you may change your mind later and stop participating even if
you agreed earlier.
Procedures
We are inviting you to participate in this research study. If you agree, you will be asked to participate.
The type of questions asked will be direct open-ended questions based on your personal experience or
perceptions.
Duration
The focus group portion of the research study will require approximately 60 minutes to complete. If
you are selected to participate in the focus group, the time expected will be a maximum of 60. If you
are chosen to complete the questionnaire immediately after the focus group, the time allotted
for completing the questionnaire will be approximately 10 minutes. The questionnaire will be
emailed to your secure email address upon completion of the focus group.

164
Risks
You will be asked to share personal and confidential information, and you may feel uncomfortable
talking about some of the topics. You do not have to answer any question or take part in the discussion
if you don’t wish to do so. You do not have to give any reason for not responding to any question. The
focus portion of the study will take place through a Zoom online platform. Meeting identification
number and passcodes will be sent to the secure email addresses of potential participants. On the day
of the focus group, once participants have entered the identification and passcode for the focus group,
participants will sent in a virtual waiting room until credentials are verified.
Benefits
While there will be no direct financial benefit to you, your participation is likely to help us find out more
about how student-based budgeting has impacted teachers. The potential benefits of this study will aid
the furthering discussions among stakeholders including educators, district officials, and lawmakers.
This will help in improving equitable funding formulas to districts the implement student-based
budgeting.
Reimbursement
There will be no financial reimbursement for the focus group study.
Confidentiality
I will not share information about you or anything you say to anyone. During the defense of the
doctoral dissertation, data collected will be presented to the dissertation committee. The data
collected will be kept in a locked file cabinet or encrypted computer file. Any information about you
will be coded and will not have a direct correlation, which directly identifies you as the
participant, your school or colleagues. Only I will know what your number is, and I will secure your
information.
Sharing the Results
At the end of the research study, the results will be available for each participant. It is anticipated to
publish the results so other interested people may learn from the research.
Right to Refuse or Withdraw
Participation is voluntary. At any time, you wish to end your participation in the research study, you
may do so without repercussions.
Questions About the Study

165
If you have any questions, you can ask them now or later. If you wish to ask questions later, you may
contact my cell phone number at 773.807.1126. This research plan has been reviewed and approved by
the Institutional Review Board of American College of Education. This is a committee whose role is to
make sure research participants are protected from harm. If you wish to ask questions of this group,
email [email protected].
Certificate of Consent
I have read the information about this study, or it has been read to me. I acknowledge why I have been
asked to be a participant in the research study. I have been provided the opportunity to ask questions
about the study, and any questions have been answered to my satisfaction. I certify I am at least 18
years of age. I consent voluntarily to be a participant in this study.
Print or Type Name of Participant:
Signature of Participant:
Date:
I confirm that the participant was given an opportunity to ask questions about the study, and all the
questions asked by the participant have been answered to the best of my ability. I confirm that the
individual has not been coerced into giving consent, and the consent has been given freely and
voluntarily. A copy of this Consent Form has been provided to the participant.
Print or type name of lead researcher:
Signature of lead researcher:
I have accurately read or witnessed the accurate reading of the assent form to the potential participant,
and the individual has had the opportunity to ask questions. I confirm the individual has freely given
assent.
Print or type name of lead researcher:
Signature of lead researcher:

166
Date:
Signature of faculty member:
Date:
PLEASE KEEP THIS INFORMED CONSENT FORM FOR YOUR RECORDS

167
Appendix F: Focus Group Questions
1. What do you know about student-based budgeting and how it compares to other K-12 school
budgeting formulas?
2. How has student-based budgeting impacted your teaching conditions?
3. How does student-based budgeting impact staffing at your school?
4. How has student-based budgeting shaped your school and the priorities of your school
leadership ?
5. In what ways do you think student-based budgeting is equitable or inequitable?
6. Why do you believe student-based budgeting was implemented in your district and why is it
still being practiced?
7. What role should teachers play in school formulating budget criteria?
8. What should be considered before implementing a budgeting formula?

168
Appendix G: Questionnaire
1. What did you gain as a participant in this focus group?
2. Has your perspective of student-based budgeting changed as a result of this focus group?
3. Was there a student-based budgeting experience or perspective that you were not able to
share? If so please explain.
4. On a scale of 1-10, with 10 being the most pleasing, how pleased are you with student-based
budgeting. Explain

169
Appendix H: Screenshot of District’s Preliminary Permission to Conduct Study

170
Appendix I: School District Research Review Board Approval to Conduct Research

171
Appendix J: Research Review Board Guidelines for Interviewing Participants

172