public sector property forum
TRANSCRIPT
Public Sector Property Forum
Gavin Hulcombe – Southeast Queensland Market Overview
David Hyne – Queensland Market Overview
27 August 2021

The National Perspective
Source: Corelogic Hedonic Home Value Index – August 2021
Brisbane
15.9%
Sydney
18.2%
Canberra
20.5%
Melbourne
10.4% Hobart
21.9%
Perth
10.8%
Darwin
23.4%
Adelaide
15.7%
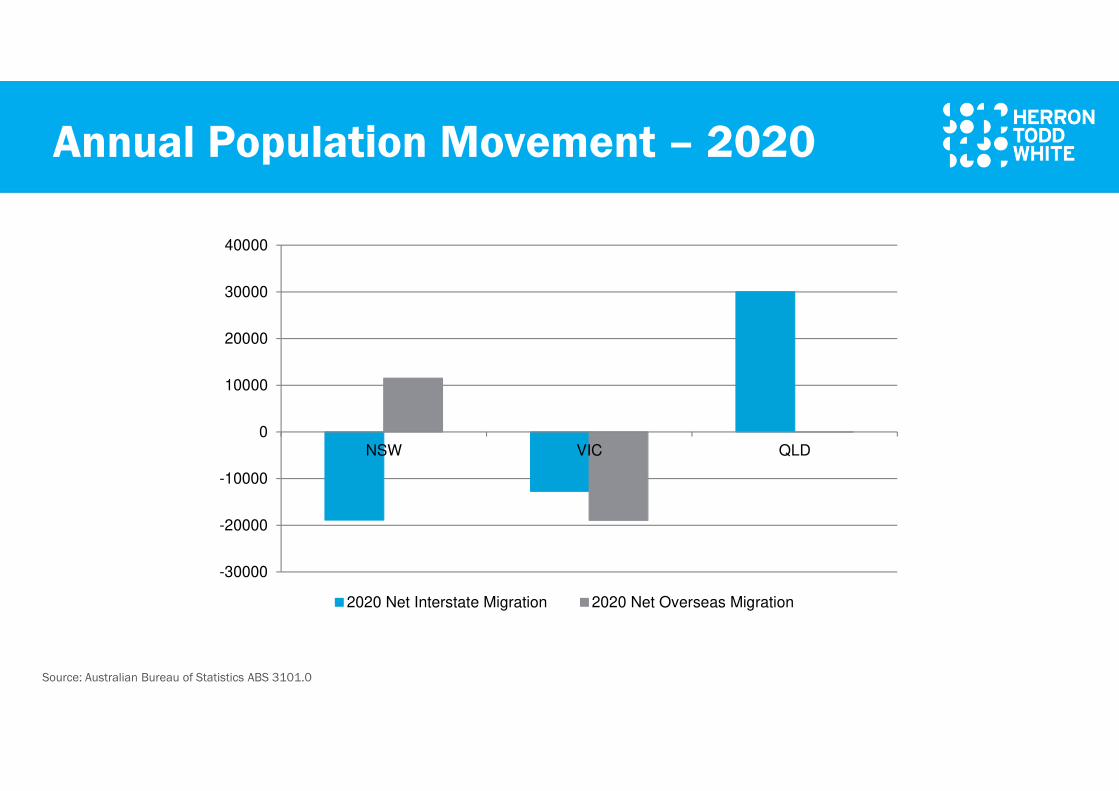
Annual Population Movement – 2020
Source: Australian Bureau of Statistics ABS 3101.0
-30000
-20000
-10000
0
10000
20000
30000
40000
NSW VIC QLD
2020 Net Interstate Migration 2020 Net Overseas Migration
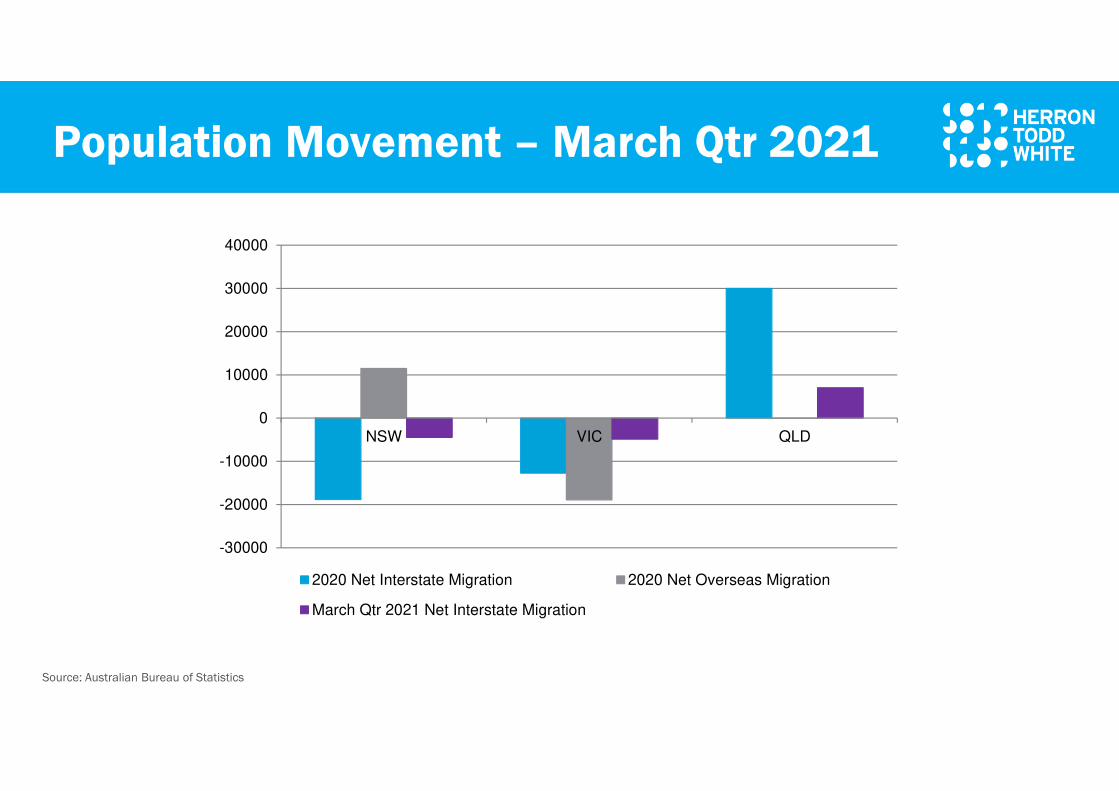
Population Movement – March Qtr 2021
Source: Australian Bureau of Statistics
-30000
-20000
-10000
0
10000
20000
30000
40000
NSW VIC QLD
2020 Net Interstate Migration 2020 Net Overseas Migration
March Qtr 2021 Net Interstate Migration
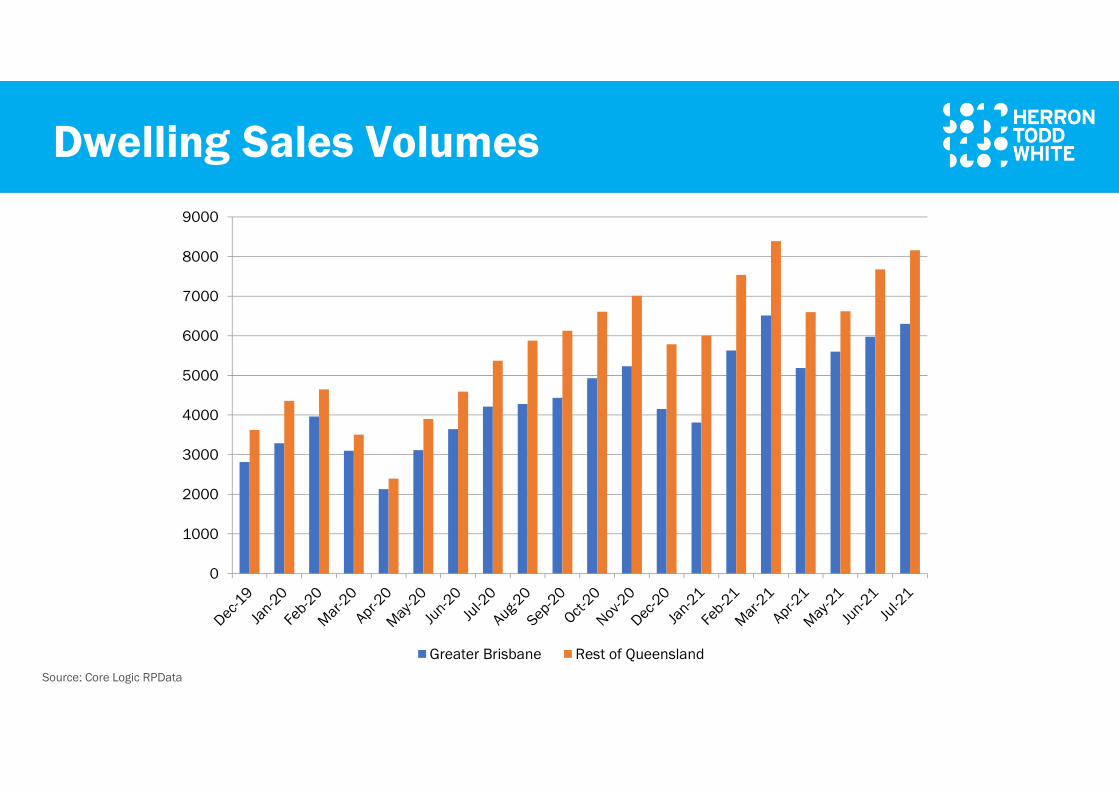
Dwelling Sales Volumes
Source: Core Logic RPData
0
1000
2000
3000
4000
5000
6000
7000
8000
9000
Greater Brisbane Rest of Queensland

Lifestyle
Image Source: Queensland.com.au

Key Olympic Sites
Image Source: Brisbane Development
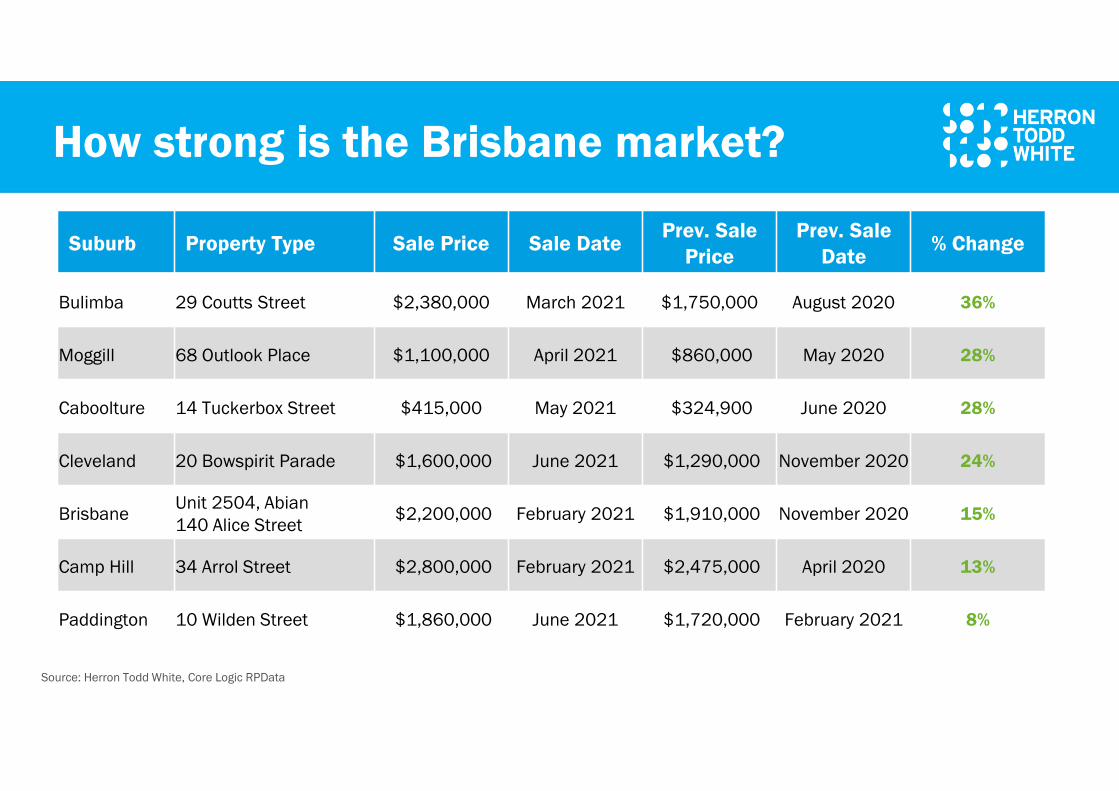
How strong is the Brisbane market?
Source: Herron Todd White, Core Logic RPData
Suburb Property Type Sale Price Sale DatePrev. Sale
Price
Prev. Sale
Date% Change
Bulimba 29 Coutts Street $2,380,000 March 2021 $1,750,000 August 2020 36%
Moggill 68 Outlook Place $1,100,000 April 2021 $860,000 May 2020 28%
Caboolture 14 Tuckerbox Street $415,000 May 2021 $324,900 June 2020 28%
Cleveland 20 Bowspirit Parade $1,600,000 June 2021 $1,290,000 November 2020 24%
BrisbaneUnit 2504, Abian
140 Alice Street$2,200,000 February 2021 $1,910,000 November 2020 15%
Camp Hill 34 Arrol Street $2,800,000 February 2021 $2,475,000 April 2020 13%
Paddington 10 Wilden Street $1,860,000 June 2021 $1,720,000 February 2021 8%
Source: Herron Todd White
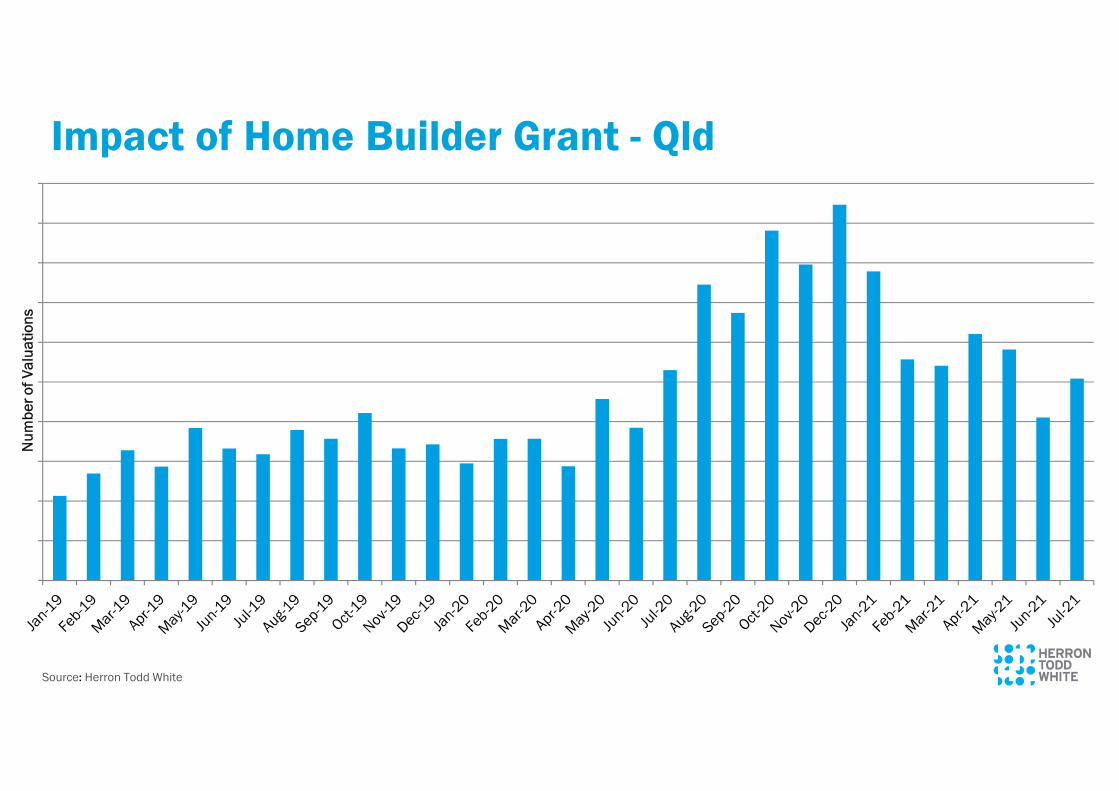
Impact of Home Builder Grant - Qld
Nu
mb
er
of
Va
lua
tio
ns
Source: Core Logic RPData, Herron Todd White Research
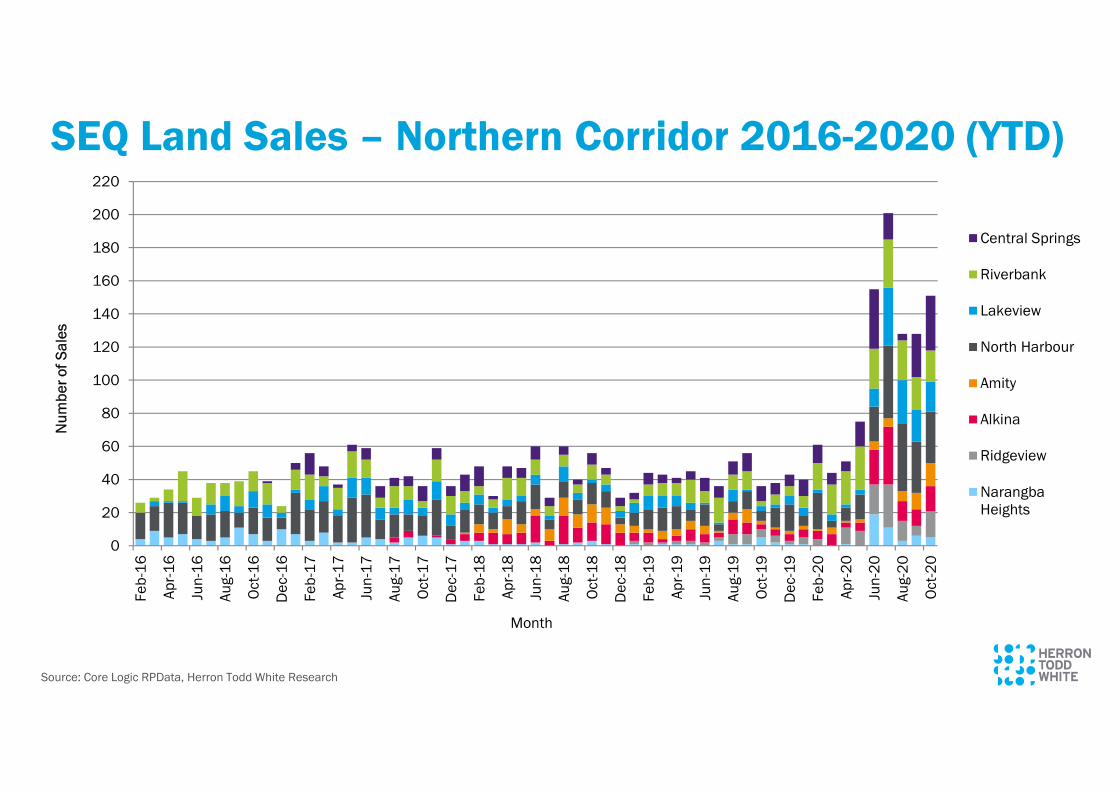
SEQ Land Sales – Northern Corridor 2016-2020 (YTD)
0
20
40
60
80
100
120
140
160
180
200
220
Fe
b-1
6
Ap
r-1
6
Jun
-16
Au
g-1
6
Oct-
16
De
c-1
6
Fe
b-1
7
Ap
r-1
7
Jun
-17
Au
g-1
7
Oct-
17
De
c-1
7
Fe
b-1
8
Ap
r-1
8
Jun
-18
Au
g-1
8
Oct-
18
De
c-1
8
Fe
b-1
9
Ap
r-1
9
Jun
-19
Au
g-1
9
Oct-
19
De
c-1
9
Fe
b-2
0
Ap
r-2
0
Jun
-20
Au
g-2
0
Oct-
20
Nu
mb
er
of
Sa
les
Month
Central Springs
Riverbank
Lakeview
North Harbour
Amity
Alkina
Ridgeview
NarangbaHeights

Rental Vacancy Rates – Brisbane
Source: SQM Research, Herron Todd White
0
2
4
6
8
10
12
14
Pe
rce
nta
ge
Oct-18 Oct-20 Jul-21
Construction Costs
Source: UDIA Qld, Domain.com.au, Courier Mail
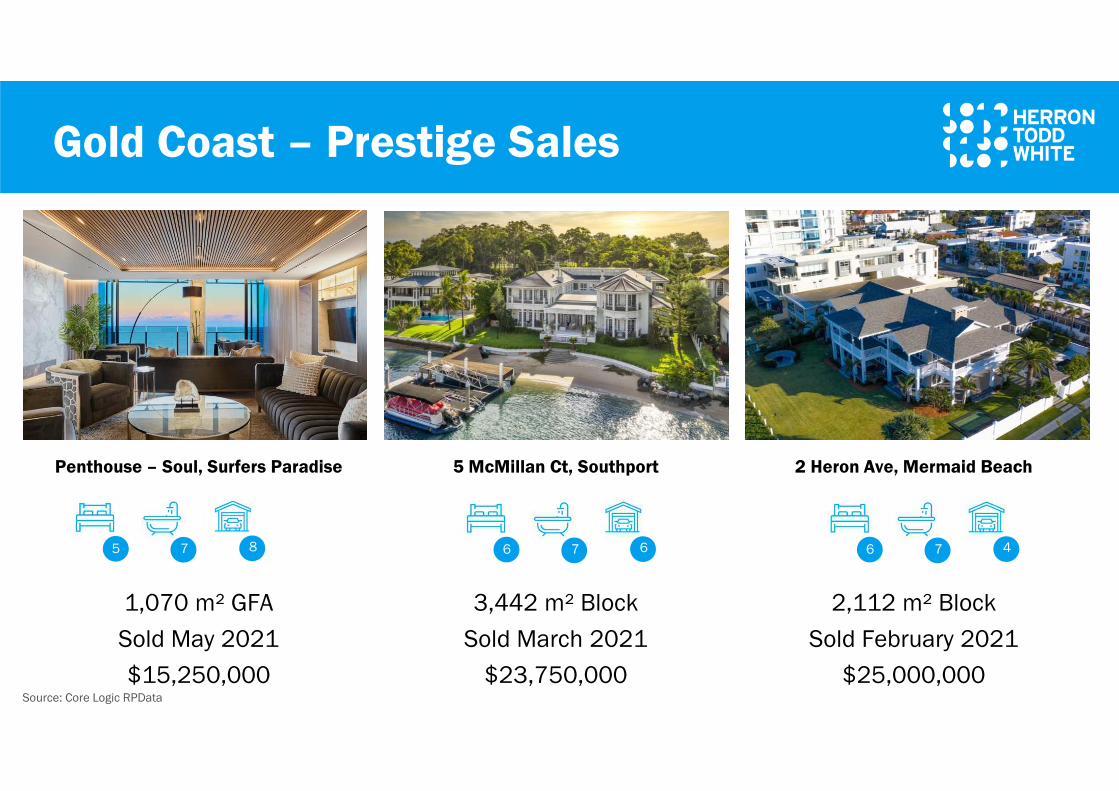
Penthouse – Soul, Surfers Paradise 5 McMillan Ct, Southport 2 Heron Ave, Mermaid Beach
1,070 m² GFA
Sold May 2021
$15,250,000
3,442 m² Block
Sold March 2021
$23,750,000
2,112 m² Block
Sold February 2021
$25,000,000
875 676 476
Gold Coast – Prestige Sales
Source: Core Logic RPData

2 Belmore Terrace, Sunshine Beach Webb Road, Sunshine Beach Unit 11 ‘La Mer’ Hastings St, Noosa
1,258 m² Block
Sold Mar 2021
$21,000,000
2,015 m² block
Reportedly sold July 2021
$34,000,000
183 m²
Sold Nov 2020: $9,800,000
$53,488/m²
265 34 123
Sunshine Coast – Prestige Sales
Source: Core Logic RPData

What are the risks?
• The broader economy
• Migration
• Interest rates
• Affordability
• Availability of funds

Key Office Takeaways
• Very few institutional transactions…capital markets at a
standstill with uncertainty
• Leasing predominantly smaller fitted out spaces…Very few major
new leasing deals have been done
• Sub-Lease accommodation on the rise
• Incentives increasing
• Yields generally stagnant
• Owner occupiers a bright spot. Strong demand for good strata
space and sub $5 million freestanding buildings.

• The retail market is undergoing significant upheaval but not
even across the sector
• COVID relief has essentially ended
• Rents in CBD have fallen
• Rents in suburban convenience complexes stable
• Investors are highly scrutinizing lease covenants and income
security.
• Still good demand for well leased assets but limited stock
• Two tiered market?
Key Retail Takeaways

Key Industrial Takeaways
• Prime industrial not badly COVID affected
• Prime Industrial yields have tightened by up to 100bp
• Industrial rental rates are remaining stable
• Very strong investment demand…strongest sector
• Shortage of good investment stock
• Shortage of well priced land, especially larger parcels. Prices
increasing

The Road Ahead
• Strong growth future across
SEQ as Infrastructure and
Olympic projects ramp up
• Increasing migration
• Affordable gap relative to
Sydney and Melbourne.

Queensland Regions and Rural
Image Sources: Wikipedia, Queensland Times, Herron Todd White
Mining Tourism Agriculture

Disclaimer
The information contained in this report is provided in good faith and
has been derived from sources believed to be reliable and accurate.
However, the report is not intended to be comprehensive or render
advice and neither Herron Todd White nor any persons involved in the
preparation of this report accepts any form of liability for its contents.
This report has copyright and cannot be reproduced without written
permission of Herron Todd White.