public service enterprise group · 2020-07-31 · *see slides a and b for items excluded from net...
TRANSCRIPT

Public Service Enterprise Group
PSEG Earnings Conference Call2nd Quarter 2020
July 31, 2020
Certain of the matters discussed in this presentation about our and our subsidiaries’ future performance, including, without limitation, future revenues, earnings, strategies, prospects, consequences and all other statements that are not purely historical constitute “forward-looking statements” within the meaning of the Private Securities Litigation Reform Act of 1995. Such forward-looking statements are subject to risks and uncertainties, which could cause actual results to differ materially from those anticipated. Such statements are based on management’s beliefs as well as assumptions made by and information currently available to management. When used herein, the words “anticipate,” “intend,” “estimate,” “believe,” “expect,” “plan,” “should,” “hypothetical,” “potential,” “forecast,” “project,” variations of such words and similar expressions are intended to identify forward-looking statements. Factors that may cause actual results to differ are often presented with the forward-looking statements themselves. Other factors that could cause actual results to differ materially from those contemplated in any forward-looking statements made by us herein are discussed in filings we make with the United States Securities and Exchange Commission (SEC), including our Annual Report on Form 10-K and subsequent reports on Form 10-Q and Form 8-K. These factors include, but are not limited to:
• fluctuations in wholesale power and natural gas markets, including the potential impacts on the economic viability of our generation units;• our ability to obtain adequate fuel supply;• market risks impacting the operation of our generating stations;• increases in competition in wholesale energy and capacity markets;• changes in technology related to energy generation, distribution and consumption and customer usage patterns;• economic downturns;• third-party credit risk relating to our sale of generation output and purchase of fuel;• adverse performance of our nuclear decommissioning and defined benefit plan trust fund investments and changes in funding requirements;• the impact of changes in state and federal legislation and regulations on our business, including PSE&G’s ability to recover costs and earn returns on authorized investments;• PSE&G’s proposed investment programs may not be fully approved by regulators and its capital investment may be lower than planned;• the impact on our New Jersey nuclear plants if such plants are not awarded Zero Emission Certificates (ZEC) in future periods, there is an adverse change in the amount of future ZEC
payments, the ZEC program is overturned or modified through legal proceedings or if adverse changes are made to the capacity market construct;• adverse changes in energy industry laws, policies and regulations, including market structures and transmission planning;• the impact of state and federal actions aimed at combating climate change on our natural gas assets;• risks associated with our ownership and operation of nuclear facilities, including regulatory risks, such as compliance with the Atomic Energy Act and trade control, environmental and
other regulations, as well as financial, environmental and health and safety risks;• changes in federal and state environmental regulations and enforcement;• delays in receipt of, or an inability to receive, necessary licenses and permits;• the impact of any future rate proceedings;• adverse outcomes of any legal, regulatory or other proceeding, settlement, investigation or claim applicable to us and/or the energy industry;• changes in tax laws and regulations;• the impact of our holding company structure on our ability to meet our corporate funding needs, service debt and pay dividends;• lack of growth or slower growth in the number of customers or changes in customer demand;• any inability of PSEG Power to meet its commitments under forward sale obligations;• reliance on transmission facilities that we do not own or control and the impact on our ability to maintain adequate transmission capacity;• any inability to successfully develop, obtain regulatory approval for, or construct generation, transmission and distribution projects;• any equipment failures, accidents, severe weather events or other incidents, including pandemics such as the ongoing coronavirus pandemic, that may impact our ability to provide safe
and reliable service to our customers;• our inability to exercise control over the operations of generation facilities in which we do not maintain a controlling interest;• any inability to recover the carrying amount of our long-lived assets and leveraged leases;• any inability to maintain sufficient liquidity;• any inability to realize anticipated tax benefits or retain tax credits;• challenges associated with recruitment and/or retention of key executives and a qualified workforce;• the impact of our covenants in our debt instruments on our operations;• the impact of the ongoing coronavirus pandemic; • the impact of acts of war, terrorism, cybersecurity attacks or intrusions; and• failure to sell or otherwise dispose of all or a portion of PSEG Power’s non-nuclear generating fleet on terms that are favorable to us, or at all, or any delay of such transaction or
transactions due to market conditions, the failure to satisfy conditions to closing or otherwise.
All of the forward-looking statements made in this presentation are qualified by these cautionary statements and we cannot assure you that the results or developments anticipated by management will be realized or even if realized, will have the expected consequences to, or effects on, us or our business, prospects, financial condition, results of operations or cash flows. Readers are cautioned not to place undue reliance on these forward-looking statements in making any investment decision. Forward-looking statements made in this presentation apply only as of the date of this presentation. While we may elect to update forward-looking statements from time to time, we specifically disclaim any obligation to do so, even in light of new information or future events, unless otherwise required by applicable securities laws.
The forward-looking statements contained in this presentation are intended to qualify for the safe harbor provisions of Section 27A of the Securities Act of 1933, as amended, and Section 21E of the Securities Exchange Act of 1934, as amended.
Forward-Looking Statements
2

PSEG presents Operating Earnings and Adjusted Earnings Before Interest, Taxes, Depreciation and Amortization (EBITDA) in addition to its Net Income reported in accordance with accounting principles generally accepted in the United States (GAAP). Operating Earnings and Adjusted EBITDA are non-GAAP financial measures that differ from Net Income. Non-GAAP Operating Earnings exclude the impact of returns (losses) associated with the Nuclear Decommissioning Trust (NDT), Mark-to-Market (MTM) accounting and material one-time items. Non-GAAP Adjusted EBITDA excludes the same items as our non-GAAP Operating Earnings measure as well as income tax expense, interest expense and depreciation and amortization. The last two slides in this presentation (Slides A and B) include a list of items excluded from Net Income/(Loss) to reconcile to non-GAAP Operating Earnings and non-GAAP Adjusted EBITDA with a reference to those slides included on each of the slides where the non-GAAP information appears.
Management uses non-GAAP Operating Earnings in its internal analysis, and in communications with investors and analysts, as a consistent measure for comparing PSEG’s financial performance to previous financial results. Management believes non-GAAP Adjusted EBITDA is useful to investors and other users of our financial statements in evaluating operating performance because it provides them with an additional tool to compare business performance across companies and across periods. Management also believes that non-GAAP Adjusted EBITDA is widely used by investors to measure operating performance without regard to items such as income tax expense, interest expense and depreciation and amortization, which can vary substantially from company to company depending upon, among other things, the book value of assets, capital structure and whether assets were constructed or acquired. Non-GAAP Adjusted EBITDA also allows investors and other users to assess the underlying financial performance of our fleet before management’s decision to deploy capital. The presentation of non-GAAP Operating Earnings and non-GAAP Adjusted EBITDA is intended to complement, and should not be considered an alternative to, the presentation of Net Income/(Loss), which is an indicator of financial performance determined in accordance with GAAP. In addition, non-GAAP Operating Earnings and non-GAAP Adjusted EBITDA as presented in this release may not be comparable to similarly titled measures used by other companies.
Due to the forward looking nature of non-GAAP Operating Earnings and non-GAAP Adjusted EBITDA guidance, PSEG is unable to reconcile these non-GAAP financial measures to the most directly comparable GAAP financial measure. Management is unable to project certain reconciling items, in particular MTM and NDT gains (losses), for future periods due to market volatility.
GAAP Disclaimer
These materials and other financial releases can be found on the PSEG website at https://investor.pseg.com. From time to time, PSEG, PSE&G and PSEG Power release important information via postings on their corporate website at https://investor.pseg.com. Investors and other interested parties are encouraged to visit the corporate website to review new postings. The “Email Alerts” link at https://investor.pseg.com may be used to enroll to receive automatic email alerts regarding new postings.
3

PSEG Q2 2020 Review
Ralph IzzoChairman, President and Chief Executive Officer

PSEG Q2 2020 Second Quarter Highlights Net Income per share of $0.89 in Q2 2020 vs. $0.30 in Q2 2019
Non-GAAP Operating Earnings* per share of $0.79 in Q2 2020 vs. $0.58 in Q2 2019
PSE&G results benefited from ongoing investment in utility infrastructure
PSEG Power results benefited from cost control and the settlement of tax audits partly offset by lower capacity revenues
Operational Excellence Nuclear operations achieved a capacity factor of 93.4% for the first half of 2020
Disciplined Capital Investment PSEG on track to invest ~$2.9 billion in 2020: ~$2.7 billion at PSE&G comprised primarily of
reliability investments in Transmission and Distribution including the second phases of Energy Strong and the GSMP
$2.5 billion Clean Energy Future (CEF) – Energy Efficiency (EE) filing settlement discussions continuing
Remaining $1 billion of CEF filings continuing through procedural schedules
GSMP=Gas System Modernization Program*See Slides A and B for Items excluded from Net Income/(Loss) to reconcile to Operating Earnings (non-GAAP).
5

PSEG powering New Jersey’s response to COVID-19New Jersey Gradually “Re-Opens” from COVID-19 Stay-at-Home Order
On June 9, Governor Murphy lifted the stay-at-home order in effect since March 21, gradually re-opening NJ economy
NJ Board of Public Utilities (NJBPU) approved restart of in-home utility services with COVID-19 safety protocols
PSEG Response to COVID-19
Utility and power work continued in NJ with capital plan largely intact, given the essential nature of the businesses
Ongoing senior-level, cross-functional team remains engaged in overseeing dynamic pandemic response plan
Voluntary suspension of electric and gas service shut-offs extended
Donated 50,000 N95 masks and 200,000 pairs of gloves to NJ health care organizations
PSEG Foundation announced commitment of $2.5 million to regional food banks, medical and communityorganizations, including a $1 million donation to the NJ Pandemic Relief Fund
PSE&G and PSEG-LI assisting with electricity provisioning for emergency medical facilities construction
PSEG Operations
Planning phased approach to “responsible re-entry” that will incorporate re-imagined, better ways to operate the business
Employees operating effectively with latest COVID-19 health and safety protocols; PPE for all field associates
Safety protocols have protected employees: Confirmed COVID-19 incidence rates among PSEG employees areabout half of those of the NJ and LI general populations
Utility has resumed on-premises work
Salem 2 nuclear refueling outage successfully de-scoped non-critical work and reduced outage days
Over half of all employees continue to work from home in NJ and on LI
Dedicated workforce maintaining high service quality during recent storms
6
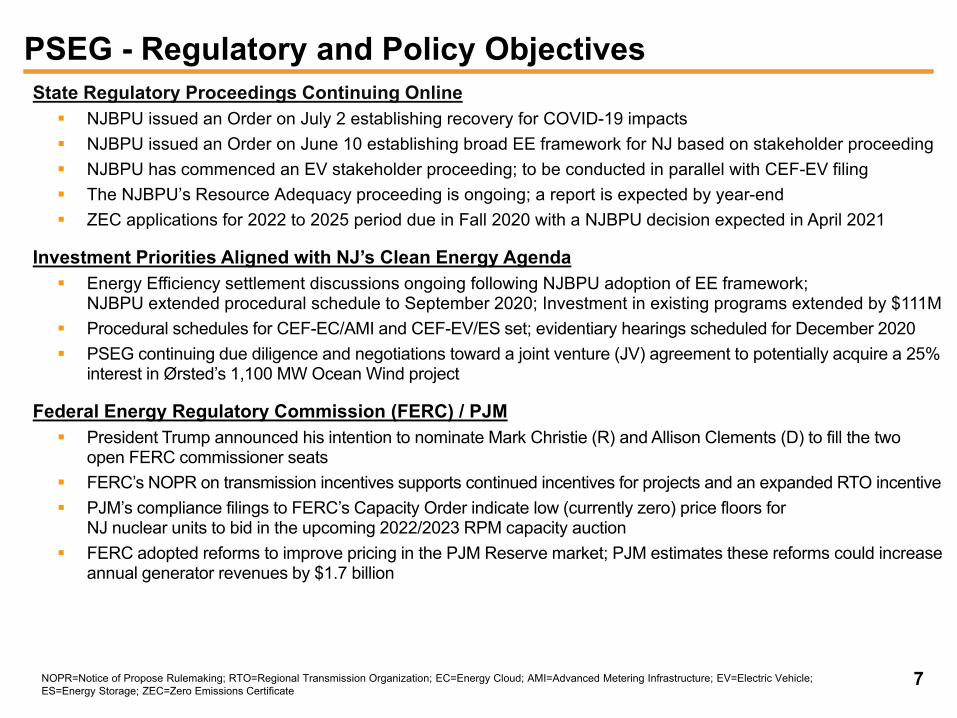
PSEG - Regulatory and Policy ObjectivesState Regulatory Proceedings Continuing Online NJBPU issued an Order on July 2 establishing recovery for COVID-19 impacts NJBPU issued an Order on June 10 establishing broad EE framework for NJ based on stakeholder proceeding NJBPU has commenced an EV stakeholder proceeding; to be conducted in parallel with CEF-EV filing The NJBPU’s Resource Adequacy proceeding is ongoing; a report is expected by year-end ZEC applications for 2022 to 2025 period due in Fall 2020 with a NJBPU decision expected in April 2021
Investment Priorities Aligned with NJ’s Clean Energy Agenda Energy Efficiency settlement discussions ongoing following NJBPU adoption of EE framework;
NJBPU extended procedural schedule to September 2020; Investment in existing programs extended by $111M Procedural schedules for CEF-EC/AMI and CEF-EV/ES set; evidentiary hearings scheduled for December 2020 PSEG continuing due diligence and negotiations toward a joint venture (JV) agreement to potentially acquire a 25%
interest in Ørsted’s 1,100 MW Ocean Wind project
Federal Energy Regulatory Commission (FERC) / PJM President Trump announced his intention to nominate Mark Christie (R) and Allison Clements (D) to fill the two
open FERC commissioner seats FERC’s NOPR on transmission incentives supports continued incentives for projects and an expanded RTO incentive PJM’s compliance filings to FERC’s Capacity Order indicate low (currently zero) price floors for
NJ nuclear units to bid in the upcoming 2022/2023 RPM capacity auction FERC adopted reforms to improve pricing in the PJM Reserve market; PJM estimates these reforms could increase
annual generator revenues by $1.7 billion
7NOPR=Notice of Propose Rulemaking; RTO=Regional Transmission Organization; EC=Energy Cloud; AMI=Advanced Metering Infrastructure; EV=Electric Vehicle; ES=Energy Storage; ZEC=Zero Emissions Certificate

ESG & Sustainability Summary
ESG Leadership ESG Policies & Goals
• Clean Energy Future PSE&G’s $3.5B proposal for significant investments in energy efficiency, advanced metering infrastructure, electric vehicle charging infrastructure and energy storage
• Powering Progress Initiative PSEG announced commitment to reduce GHG emissions from PSEG Power’s fleet by 80% from 2005 levels by 2046
PSEG has no plans to buy/build fossil generation
PSEG Power is already at half the CO2intensity of PJM/U.S. averages
PSEG Power is coal-free by mid-2021 with the planned early retirement of Bridgeport 3
• A vision for Net-Zero emissions by2050 with advances in technology, public policy and consumer behavior
• Invested ~$1.9B in Solar Energy projects
• 2020 Climate Report follows the TCFD framework and our 2019 Sustainability Report is SASB compliant
• Named to the Dow Jones Sustainability Index North America 12 years in a row
• Named one of America’s Most JUST 100 Companiesby Forbes and JUST Capital
• Named to the Forbes 2020 List of Best Employers for Diversity
• PSEG ESG Scores
MSCI AAISS 2,3 (S,E)Bloomberg 53.6%Sustainalytics 71.1%SSGA R-Factor 59%
ESG Recognition & Scores
• PSEG is a vocal advocate for an economy-wide price on CO2 emissions and preserving nuclear power plants for their favorable zero carbon attributes
• Diversity & Inclusion Commitment
• Human Rights Policy (2018)
• PSEG’s long-term ESG goals and business strategy are aligned with many of the U.N.’s SustainableDevelopment Goals intended to stimulate action to set the world on a sustainable path by 2030
TCFD=Task Force on Climate-Related Financial Disclosures; SASB=Sustainability Accounting Standards BoardNote: PSEG ESG 2020 scores as of June 30, 2020. 8

$0.01 ($0.01)
$0.81$0.68
To$0.86
$2.46$2.58
To$2.70
2019 2020E**PSEG Power PSE&G
$3.28
Drivers in 2020 include rate base growth, Q1 weather headwinds, impacts of COVID-19 on sales and load, and cost control
Non-GAAP Operating Earnings* Contribution by Subsidiary2019 Actual and 2020E Guidance
*See Slides A and B for Items excluded from Net Income/(Loss) to reconcile to Operating Earnings (non-GAAP). **Based on the mid-point of 2020 non-GAAP Operating Earnings guidance of $3.30 - $3.50 per share. E = Estimate.
$3.30 - $3.50E
PSEG – Re-affirming 2020 Guidance
9

PSEG Q2 2020 Operating Company Review
Dan CreggEVP and Chief Financial Officer
PSEG – Q2 Results by Subsidiary
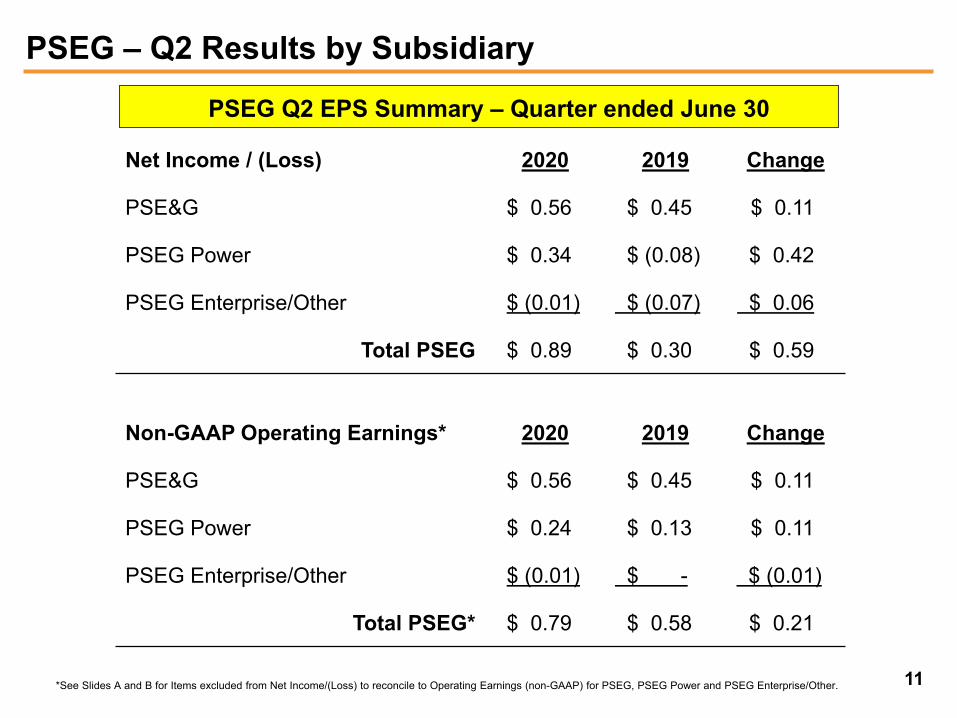
Net Income / (Loss) 2020 2019 Change
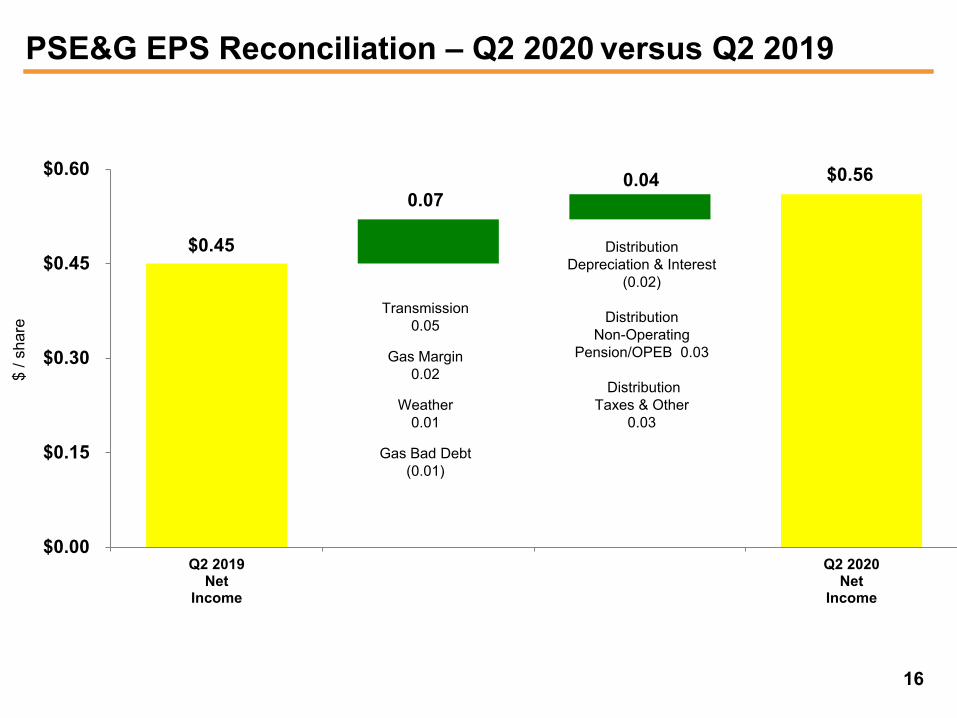
PSE&G $ 0.56 $ 0.45 $ 0.11
PSEG Power $ 0.34 $ (0.08) $ 0.42
PSEG Enterprise/Other $ (0.01) $ (0.07) $ 0.06
Total PSEG $ 0.89 $ 0.30 $ 0.59
Non-GAAP Operating Earnings* 2020 2019 Change
PSE&G $ 0.56 $ 0.45 $ 0.11
PSEG Power $ 0.24 $ 0.13 $ 0.11
PSEG Enterprise/Other $ (0.01) $ - $ (0.01)
Total PSEG* $ 0.79 $ 0.58 $ 0.21
*See Slides A and B for Items excluded from Net Income/(Loss) to reconcile to Operating Earnings (non-GAAP) for PSEG, PSEG Power and PSEG Enterprise/Other.
PSEG Q2 EPS Summary – Quarter ended June 30
11
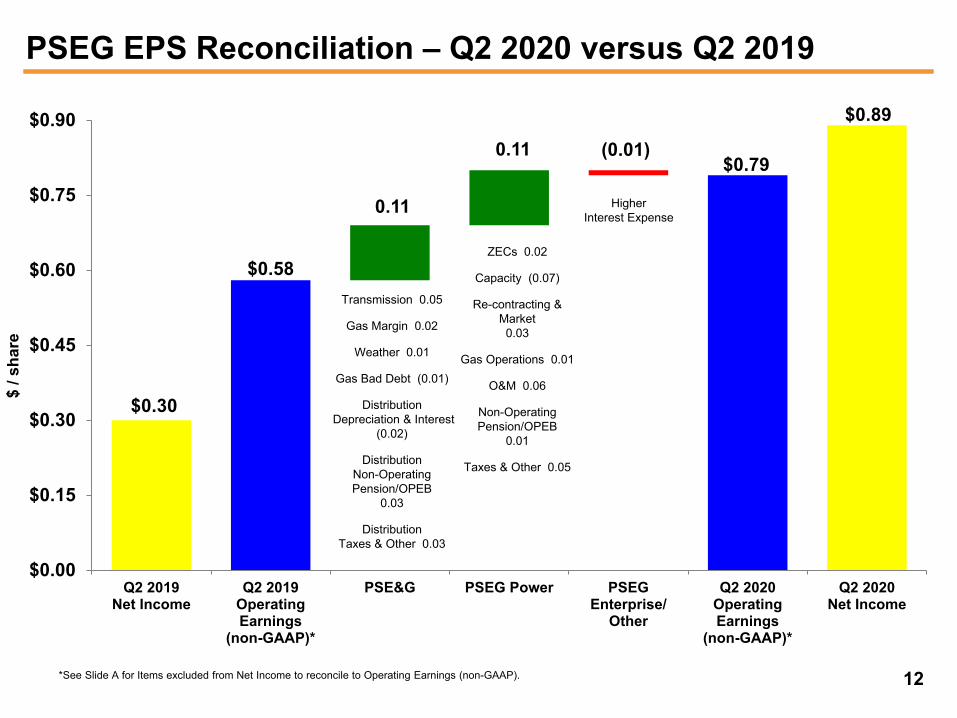
$0.30
$0.58
$0.79
$0.89
0.11
0.11 (0.01)
$0.00
$0.15
$0.30
$0.45
$0.60
$0.75
$0.90
Q2 2019Net Income
Q2 2019OperatingEarnings
(non-GAAP)*
PSE&G PSEG Power PSEGEnterprise/
Other
Q2 2020OperatingEarnings
(non-GAAP)*
Q2 2020Net Income
$ / s
hare
PSEG EPS Reconciliation – Q2 2020 versus Q2 2019
ZECs 0.02
Capacity (0.07)
Re-contracting & Market
0.03
Gas Operations 0.01
O&M 0.06
Non-Operating Pension/OPEB
0.01
Taxes & Other 0.05
Transmission 0.05
Gas Margin 0.02
Weather 0.01
Gas Bad Debt (0.01)
DistributionDepreciation & Interest
(0.02)
DistributionNon-Operating Pension/OPEB
0.03
DistributionTaxes & Other 0.03
HigherInterest Expense
*See Slide A for Items excluded from Net Income to reconcile to Operating Earnings (non-GAAP). 12

PSEG – First Half Results by Subsidiary
Net Income/(Loss) 2020 2019 Change
PSE&G $ 1.43 $ 1.24 $ 0.19
PSEG Power $ 0.36 $ 0.51 $ (0.15)
PSEG Enterprise/Other $ (0.02) $ (0.07) $ 0.05
Total PSEG $ 1.77 $ 1.68 $ 0.09
Non-GAAP Operating Earnings* 2020 2019 Change
PSE&G $ 1.43 $ 1.24 $ 0.19
PSEG Power $ 0.41 $ 0.42 $ (0.01)
PSEG Enterprise/Other $ (0.02) $ - $ (0.02)
Total PSEG* $ 1.82 $ 1.66 $ 0.16
*See Slides A and B for Items excluded from Net Income/(Loss) to reconcile to Operating Earnings (non-GAAP) for PSEG, PSEG Power and PSEG Enterprise/Other.
PSEG First Half EPS Summary – Six Months ended June 30
13

$1.68 $1.66$1.82 $1.77
0.19 (0.01) (0.02)
$0.00
$0.40
$0.80
$1.20
$1.60
$2.00
YTD 2019Net Income
YTD 2019OperatingEarnings
(non-GAAP)*
PSE&G PSEG Power PSEGEnterprise/
Other
YTD 2020OperatingEarnings
(non-GAAP)*
YTD 2020Net Income
$ / s
hare
PSEG EPS Reconciliation – First Half 2020 versus First Half 2019
ZECs 0.09
Capacity (0.18)
Re-contracting & Market
0.02
Volume (0.01)
Gas Operations (0.02)
O&M 0.05
Interest Expense (0.01)
Taxes & Other 0.05
14
Transmission 0.11
Gas Margin 0.06
Gas Bad Debt (0.02)
Weather (0.02)
DistributionO&M 0.01
DistributionDepreciation & Interest
(0.02)
DistributionNon-Operating Pension/OPEB
0.05
DistributionTaxes & Other 0.02
Higher Taxes &
Interest Expense
*See Slide A for Items excluded from Net Income to reconcile to Operating Earnings (non-GAAP).
Note: Prior quarter results may not add due to rounding.

PSE&G Q2 2020 Review
$0.45
$0.560.07
0.04
$0.00
$0.15
$0.30
$0.45
$0.60
Q2 2019Net
Income
Q2 2020Net
Income
$ / s
hare
PSE&G EPS Reconciliation – Q2 2020 versus Q2 2019
Transmission 0.05
Gas Margin 0.02
Weather0.01
Gas Bad Debt (0.01)
Distribution Depreciation & Interest
(0.02)
Distribution Non-Operating
Pension/OPEB 0.03
DistributionTaxes & Other
0.03
16

2
610
3,412
169791
2,814
184937
3,027
0
500
1,000
1,500
2,000
2,500
3,000
3,500
4,000
April May June2020 2019 normal
PSE&G – Q2 Weather Summary
Q2 2020 vs. Q2 2019 vs. Normal
PSE&G Monthly Weather Summary
17
Monthly Temperature Humidity Index (THI)
446
182
3
303
127
2
358
124
130
100
200
300
400
500
April May June2020 2019 normal
Monthly Heating Degree Days (HDD)
Q2 2020 heating degree days were~46% higher than Q2 2019
and ~28% higher than normal
Q2 2020 temperature-humidity indexwas ~7% higher than Q2 2019
and ~3% lower than normal
PSE&G T&D Margin Allocation
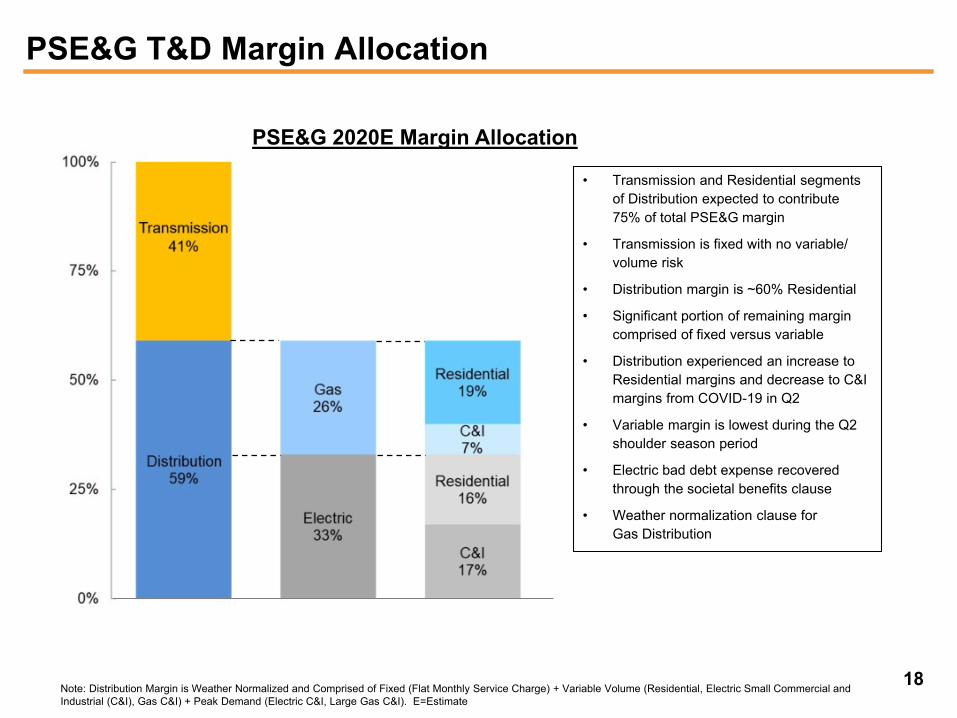
Note: Distribution Margin is Weather Normalized and Comprised of Fixed (Flat Monthly Service Charge) + Variable Volume (Residential, Electric Small Commercial and Industrial (C&I), Gas C&I) + Peak Demand (Electric C&I, Large Gas C&I). E=Estimate
• Transmission and Residential segments of Distribution expected to contribute 75% of total PSE&G margin
• Transmission is fixed with no variable/ volume risk
• Distribution margin is ~60% Residential
• Significant portion of remaining margin comprised of fixed versus variable
• Distribution experienced an increase to Residential margins and decrease to C&I margins from COVID-19 in Q2
• Variable margin is lowest during the Q2 shoulder season period
• Electric bad debt expense recovered through the societal benefits clause
• Weather normalization clause for Gas Distribution
PSE&G 2020E Margin Allocation
18
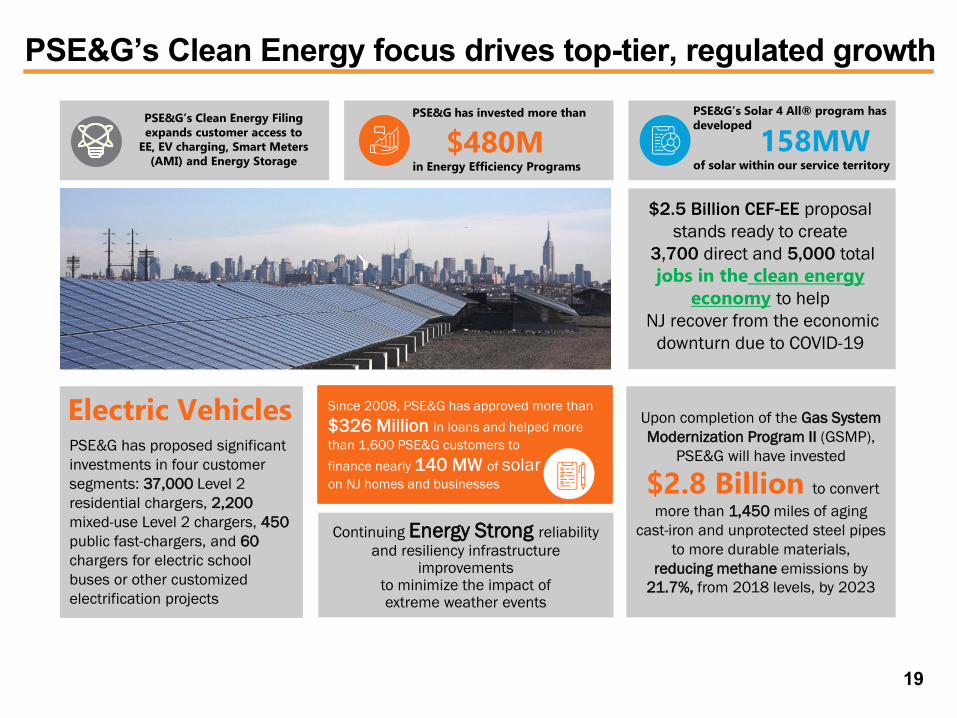
PSE&G has proposed significant investments in four customer segments: 37,000 Level 2 residential chargers, 2,200mixed-use Level 2 chargers, 450public fast-chargers, and 60 chargers for electric school buses or other customized electrification projects
Continuing Energy Strong reliability and resiliency infrastructure
improvements to minimize the impact of extreme weather events
Upon completion of the Gas System Modernization Program II (GSMP),
PSE&G will have invested
$2.8 Billion to convert more than 1,450 miles of aging
cast-iron and unprotected steel pipes to more durable materials,
reducing methane emissions by 21.7%, from 2018 levels, by 2023
PSE&G’s Clean Energy Filing expands customer access to
EE, EV charging, Smart Meters (AMI) and Energy Storage
PSE&G has invested more than PSE&G’s Solar 4 All® program hasdeveloped
$480M 158MW
PSE&G’s Clean Energy focus drives top-tier, regulated growth
in Energy Efficiency Programs of solar within our service territory
$2.5 Billion CEF-EE proposal stands ready to create
3,700 direct and 5,000 total jobs in the clean energy
economy to helpNJ recover from the economic
downturn due to COVID-19
Electric Vehicles Since 2008, PSE&G has approved more than $326 Million in loans and helped more than 1,600 PSE&G customers tofinance nearly 140 MW of solaron NJ homes and businesses
19

Weather-normalized electric sales decreased by 7% in Q2 as an increase in residential sales of 8% was more than offset by a decrease in commercial and industrial sales of 14%
For the trailing 12 months ended June 30, weather-normalized electric sales were ~3% lower and gas sales were flat
Ranked 1st among combined gas and electric utilities surveyed in the East Region Utilities Brand Trust Performance in the 2020 Escalent and the Cogent Syndicated Utility Trusted Brand and Customer Engagement study
PSE&G – Q2 Highlights
FERC formula rate 2019 true-up adjustment filed in June NJBPU authorized deferral accounting treatment for prudently incurred COVID-19 incremental impacts
after March 9
Operations
Regulatory and Market Environment
PSE&G invested ~$1.2 billion in the first half of 2020, on track to spend ~$2.7 billion in 2020 on reliability investments in T&D
PSE&G issued $375 million of 30-year Medium-Term Notes at 2.70% PSE&G 2020 earnings guidance re-affirmed at $1,310 million to $1,370 million
Financial
20

PSEG Power Q2 2020 Review

($0.08)
$0.13
$0.24
$0.34
(0.01)
0.12
($0.10)
($0.05)
$0.00
$0.05
$0.10
$0.15
$0.20
$0.25
$0.30
PSEG Power EPS Reconciliation – Q2 2020 versus Q2 2019
Q2 2019 Net
Loss
Q2 2019 Operating Earnings
(non-GAAP)*
Q2 2020 Net
Income
Q2 2020 Operating Earnings
(non-GAAP)*
ZECs 0.02
Capacity (0.07)
Re-contracting & Market 0.03
Gas Operations 0.01
O&M 0.06
Non-Operating Pension/OPEB
0.01
Taxes & Other 0.05
*See Slide B for Items excluded from Net Income/(Loss) to reconcile to Operating Earnings (non-GAAP).
$ / s
hare
22
~~
$0.35

7,144 7,781
1,187
4,8044,964
0
2,500
5,000
7,500
10,000
12,500
15,000
2019 2020
PSEG Power – Q2 Generation Measures
Total Nuclear Total Coal**** Natural Gas & Oil
*Indicates Period Net Generation, negative value reflects more GWh required to operate plants than were generated. Excludes Solar, Kalaeloa and pumped storage.**Excludes peaking and steam generation.***Includes Oil Fuel Costs of $1 million each in 2019 and 2020.****PSEG Power completed the sale of its ownership interests in Keystone and Conemaugh generation, labeled as PA Coal in the Capacity Factor table, in September 2019.
PSEG Power – Generation (GWh)*
13,135 12,739
PSEG Power – Capacity Factors (%)*
Quarter endedJune 30
($ millions) 2019 2020
Gas*** $ 93 $ 103
Coal 23 -
Total Fossil 116 103
Nuclear 42 46
Total Fuel Cost $ 158 $ 149
Total Generation
(GWh)*13,135 12,739
$ / MWh 12.03 11.70
PSEG Power – Fuel Costs*
Quarter ended June 30
2019 2020CombinedCycle** 46.2% 43.7%
Coal
PA 70.8% N/A
CT 0.0% 0.0%
Nuclear 84.4% 91.9%
23
(6)

15,360 15,816
2,618
9,25210,114
0
5,000
10,000
15,000
20,000
25,000
30,000
2019 2020
PSEG Power – First Half Generation Measures
Total Nuclear Total Coal**** Natural Gas & Oil
PSEG Power – Generation (GWh)*
27,23025,917
PSEG Power – Capacity Factors (%)* PSEG Power – Fuel Costs*
24
*Indicates Period Net Generation, negative value reflects more GWh required to operate plants than were generated. Excludes Solar, Kalaeloa and pumped storage. **Excludes peaking and steam generation.***Includes Oil Fuel Costs of $4 million and $2 million in 2019 and 2020, respectively.****PSEG Power completed the sale of its ownership interests in Keystone and Conemaugh generation, labeled as PA Coal in the Capacity Factor table, in September 2019.
(13)
Six Months endedJune 30
($ millions) 2019 2020
Gas*** $ 250 $ 196
Coal 55 -
Total Fossil 305 196
Nuclear 89 93
Total Fuel Cost $ 394 $ 289
Total Generation
(GWh)*27,230 25,917
$ / MWh 14.47 11.15
Six Months ended June 30
2019 2020CombinedCycle** 44.9% 44.3%
Coal
PA 76.4% N/A
CT 3.7% 0.0%
Nuclear 91.1% 93.4%
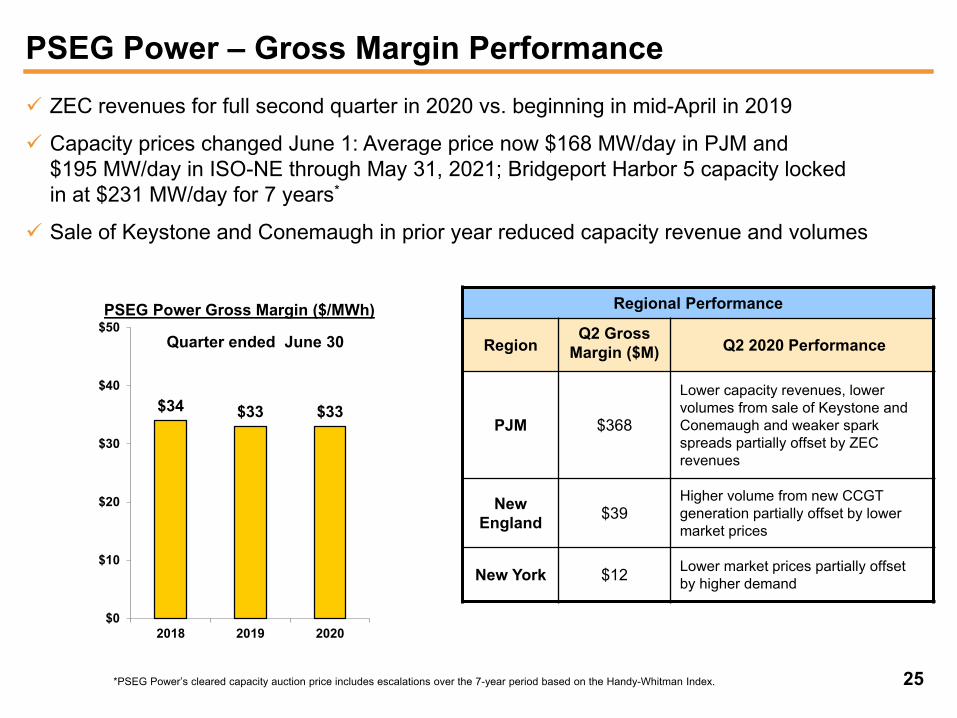
PSEG Power – Gross Margin Performance ZEC revenues for full second quarter in 2020 vs. beginning in mid-April in 2019
Capacity prices changed June 1: Average price now $168 MW/day in PJM and $195 MW/day in ISO-NE through May 31, 2021; Bridgeport Harbor 5 capacity lockedin at $231 MW/day for 7 years*
Sale of Keystone and Conemaugh in prior year reduced capacity revenue and volumes
Regional Performance
Region Q2 Gross
Margin ($M) Q2 2020 Performance
PJM $368
Lower capacity revenues, lower volumes from sale of Keystone and Conemaugh and weaker spark spreads partially offset by ZEC revenues
New England $39
Higher volume from new CCGT generation partially offset by lower market prices
New York $12 Lower market prices partially offset by higher demand
PSEG Power Gross Margin ($/MWh)
$34 $33 $33
$0
$10
$20
$30
$40
$50
2018 2019 2020
Quarter ended June 30
25*PSEG Power’s cleared capacity auction price includes escalations over the 7-year period based on the Handy-Whitman Index.

Hedging Update Contracted Energy*
*Volumes reflect management’s view of hedge percentages and prices as of June 30, 2020 and reflect revenues of full requirement load deals based on contract price including renewable energy credits, ancillary and transmission components but excluding capacity. Hedges include positions with MTM accounting treatment and options.
26
Jul - Dec
2020 2021 2022
Nuclear
Volume TWh 15 31 31
% Hedged 100% 100% 45-50%
Price $/MWh $36 $35 $35
Combined Cycle
Volume TWh 8-10 18-20 19-21
% Hedged 95-100% 5-10% 0%
Price $/MWh $36 $35 $ -
Total
Volume TWh 23-25 49-51 50-52
% Hedged 95-100% 65-70% 25-30%
Price $/MWh $36 $35 $35
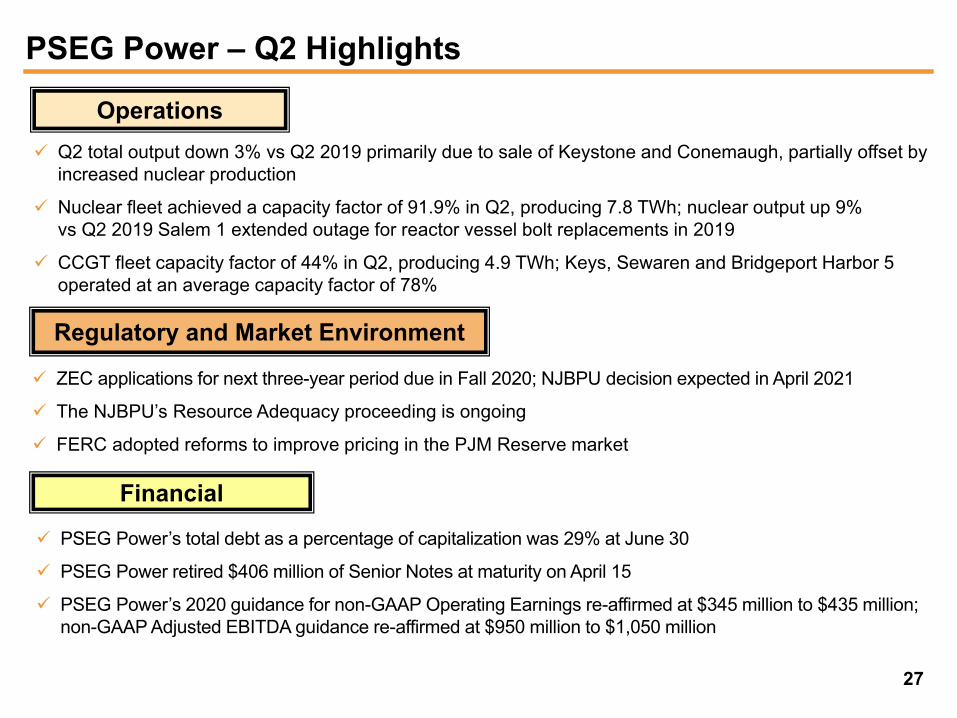
PSEG Power – Q2 Highlights
Q2 total output down 3% vs Q2 2019 primarily due to sale of Keystone and Conemaugh, partially offset by increased nuclear production
Nuclear fleet achieved a capacity factor of 91.9% in Q2, producing 7.8 TWh; nuclear output up 9% vs Q2 2019 Salem 1 extended outage for reactor vessel bolt replacements in 2019
CCGT fleet capacity factor of 44% in Q2, producing 4.9 TWh; Keys, Sewaren and Bridgeport Harbor 5 operated at an average capacity factor of 78%
Operations
Regulatory and Market Environment
Financial
ZEC applications for next three-year period due in Fall 2020; NJBPU decision expected in April 2021
The NJBPU’s Resource Adequacy proceeding is ongoing
FERC adopted reforms to improve pricing in the PJM Reserve market
PSEG Power’s total debt as a percentage of capitalization was 29% at June 30
PSEG Power retired $406 million of Senior Notes at maturity on April 15
PSEG Power’s 2020 guidance for non-GAAP Operating Earnings re-affirmed at $345 million to $435 million; non-GAAP Adjusted EBITDA guidance re-affirmed at $950 million to $1,050 million
27

PSEG

PSEG Financial Highlights Re-affirming 2020 non-GAAP Operating Earnings guidance of $3.30 - $3.50 per share
reflecting rate base growth, Q1 weather headwinds, impacts of COVID-19 on sales and load, and cost control
Business mix anticipates PSE&G contribution approaches 80% of Operating Earnings in 2020
PSEG’s 5-year capital spending forecast of $12 billion - $16 billion, with over 90% directed at PSE&G, expected to produce 6.5% - 8% compound annual growth in rate base over 2020 - 2024
Over 70% of PSEG Power’s 2020 gross margin secured via energy hedges, capacity revenues, ZECs and ancillary services payments
Increased 2020 indicative annual common dividend by $0.08 to $1.96 per share
Financial position remains strong:
Cash from PSEG Power and increasing cash from operations at PSE&G fund 2020 - 2024 capital spending program and support opportunity for dividend growth without the need to issue equity
PSEG debt as a percentage of capitalization was 52% at June 30
PSEG entered into three 364-day term loan agreements in March and April totaling $800 million
PSEG, PSEG Power and PSE&G extended $4 billion of credit facilities through March 2024
PSEG credit measures remain solid
29

PSEG 2020 Guidance Re-affirmed - By Subsidiary
$ millions (except EPS) 2020E 2019
PSE&G (Net Income) $1,310 - $1,370 $1,250
PSEG Power $345 - $435 $409
PSEG Enterprise/Other ($5) $7
Operating Earnings (non-GAAP)* $1,675 - $1,775 $1,666
Operating EPS (non-GAAP)* $3.30 - $3.50 $3.28
Segment Operating Earnings Guidance and Prior Year Results(non-GAAP, except as noted)*
$ millions 2020E 2019PSEG Power $950 - $1,050 $1,035
PSEG Power Adjusted EBITDA (non-GAAP) *,**
*See Slide A for Items excluded from Net Income to reconcile to Operating Earnings (non-GAAP) for PSEG and Slide B for Items excluded from Net Income/(Loss) to reconcile to Operating Earnings (non-GAAP) and Adjusted EBITDA (non-GAAP) for PSEG Power and PSEG Enterprise/Other. **Adjusted EBITDA for the first half of 2020 includes pre-tax expenses of $36 million related to the purchase of NJ tax credits as part of the 2019 NJ Technology Tax Benefit Transfer Program. The benefit from the program’s tax credits is included in the income tax expense line item and more than offsets the expenses incurred for the purchase. The net benefit for the quarter is $5 million. There were no similar tax credit transactions in the first half of 2019. E = Estimate.
30

PSEG Liquidity as of June 30, 2020
31
Expiration Total AvailableCompany Facility Date Facility Usage Liquidity
($ Millions)
PSE&G 5-year Credit Facility Mar-24 $600 (A) $17 $583
PSEG Money PoolPSEG / PSEG Power 5-year Credit Facilities (PSEG) Mar-24 $1,500 (B) $408 $1,092
5-year Credit Facilities (PSEG Power) Mar-24 $1,900 (C) $40 $1,8603-year LC Facilities (PSEG Power) Sep-21 $200 $96 $104
Total Money Pool $3,600 $544 $3,056
Total $4,200 $561 $3,639
(A) PSE&G facility will be reduced by $4 million in March 2022. $147
(B) PSEG facilities will be reduced by $9 million in March 2022. PSE&G ST Investment $258
(C) PSEG Power facilities will be reduced by $12 million in March 2022. Total Liquidity Available $4,044 Total Money Pool Liquidity Available $3,203
PSEG Money Pool ST Investment

Reconciliation of Non-GAAP Operating Earnings
Please see Slide 3 for an explanation of PSEG’s use of Operating Earnings as a non-GAAP financial measure and how it differs from Net Income.
(a) Includes the financial impact from positions with forward delivery months.(b) Income tax effect calculated at the statutory rate except for lease related activity which is calculated at a combined leveraged lease effective tax
rate, and NDT related activity which is calculated at the statutory rate plus a 20% tax on income (loss) from qualified NDT funds.
A
2020 2019 2020 2019
Net Income 451$ 153$ 899$ 853$ 1,693$ (Gain) Loss on Nuclear Decommissioning Trust (NDT)
Fund Related Activity, pre-tax (PSEG Power) (192) (41) 27 (168) (255) (Gain) Loss on Mark-to-Market (MTM), pre-tax (a) (PSEG Power) 107 (210) - (316) (285) Plant Retirements and Dispositions, pre-tax (PSEG Power) - 395 - 395 402 Oil Lower of Cost or Market (LOCOM) adjustment, pre-tax (PSEG Power) (9) - 11 - - Goodwill Impairment, pre-tax (PSEG Power) - - - - 16 Lease Related Activity, pre-tax (PSEG Enterprise/Other) - 58 - 58 58 Income Taxes related to Operating Earnings (non-GAAP) reconciling items(b) 47 (61) (13) 19 37
Operating Earnings (non-GAAP) 404$ 294$ 924$ 841$ 1,666$
PSEG Fully Diluted Average Shares Outstanding (in millions) 507 507 507 507 507
Net Income 0.89$ 0.30$ 1.77$ 1.68$ 3.33$ (Gain) Loss on NDT Fund Related Activity, pre-tax (PSEG Power) (0.39) (0.08) 0.05 (0.33) (0.50) (Gain) Loss on MTM, pre-tax (a) (PSEG Power) 0.21 (0.41) - (0.62) (0.56) Plant Retirements and Dispositions, pre-tax (PSEG Power) - 0.78 - 0.78 0.79 Oil LOCOM adjustment, pre-tax (PSEG Power) (0.02) - 0.02 - - Goodwill Impairment, pre-tax (PSEG Power) - - - - 0.03 Lease Related Activity, pre-tax (PSEG Enterprise/Other) - 0.11 - 0.11 0.11 Income Taxes related to Operating Earnings (non-GAAP) reconciling items(b) 0.10 (0.12) (0.02) 0.04 0.08
Operating Earnings (non-GAAP) 0.79$ 0.58$ 1.82$ 1.66$ 3.28$
($ millions, Unaudited)
($ Per Share Impact - Diluted, Unaudited)
June 30,June 30,
PUBLIC SERVICE ENTERPRISE GROUP INCORPORATEDConsolidated Operating Earnings (non-GAAP) Reconciliation
Year EndedDecember 31,
2019
Three Months EndedReconciling Items
Six Months Ended

Reconciliation of Non-GAAP Operating Earnings and Non-GAAP Adjusted EBITDA
Please see Slide 3 for an explanation of PSEG’s use of Operating Earnings and Adjusted EBITDA as non-GAAP financial measures and how they differ from Net Income/(Loss).B(a) Income tax effect calculated at a combined leveraged lease effective tax rate.
(a) Includes the financial impact from positions with forward delivery months.(b) Income tax effect calculated at the statutory rate except for NDT related activity which is calculated at the statutory rate plus a
20% tax on income (loss) from qualified NDT funds.(c) Excludes amounts related to Operating Earnings (non-GAAP) reconciling items.(d) Net of capitalized interest.
2020 2019 2020 2019
Net Income (Loss) 170$ (40)$ 183$ 256$ 468$ (Gain) Loss on NDT Fund Related Activity, pre-tax (192) (41) 27 (168) (255) (Gain) Loss on MTM, pre-tax (a) 107 (210) - (316) (285) Plant Retirements and Dispositions, pre-tax - 395 - 395 402 Oil LOCOM adjustment, pre-tax (9) - 11 - - Goodwill Impairment, pre-tax - - - - 16 Income Taxes related to Operating Earnings (non-GAAP) reconciling items(b) 47 (35) (13) 45 63
Operating Earnings (non-GAAP) 123$ 69$ 208$ 212$ 409$ Depreciation and Amortization, pre-tax (c) 89 94 182 187 372 Interest Expense, pre-tax (c) (d) 29 24 62 48 114 Income Taxes (c) 17 24 7 68 140
Adjusted EBITDA (non-GAAP) 258$ 211$ 459$ 515$ 1,035$
PSEG Fully Diluted Average Shares Outstanding (in millions) 507 507 507 507 507
Three Months Ended Six Months EndedJune 30,Reconciling Items June 30,
PSEG Power Operating Earnings (non-GAAP) and Adjusted EBITDA (non-GAAP) Reconciliation
($ millions, Unaudited)
Year EndedDecember 31,
2019
2020 2019 2020 2019
Net Income (Loss) (2)$ (34)$ (7)$ (33)$ (25)$ Lease Related Activity, pre-tax - 58 - 58 58 Income Taxes related to Lease related activity(a) - (26) - (24) (26)
Operating Earnings (non-GAAP) (2)$ (2)$ (7)$ 1$ 7$
PSEG Fully Diluted Average Shares Outstanding (in millions) 507 507 507 507 507
Year EndedDecember 31,Reconciling Items
Three Months Ended Six Months Ended
2019($ millions, Unaudited)
PSEG Enterprise/Other Operating Earnings (non-GAAP) Reconciliation
June 30, June 30,