public service media nordic ministers of culture have made globalization as one of their top...
TRANSCRIPT

Public Service Media in the Nordic Countries
FACTS & FIGURES

Nordic Public Service Media Map 1/2012
Public Service Media in the Nordic Countries
FACTS & FIGURES
Compiled by
Eva Harrie
NORDICOM

Nordic Public Service Media Map. Volume 1/2012Public Service Media in the Nordic Countries. Facts & Figures
Compiled by: Eva Harrie
Country contributors: Christian Edelvold Berg and Lykke Nordblom (Danish Agency for Culture / Centre for Libraries, Media and Digitalization), Tuomo Sauri (Statistics Finland), Ragnar Karlsson (Statistics Iceland), Nina Bjørnstad and Knut A. Tornes (medianorway), Ulrika Facht (Nordicom-Sweden)
The Nordic Ministers of Culture have made globalization as one of their top priorities, unified in the strategy: “Creativity – the Nordic response to globalization”. The aim is to create a more visible Nordic Region, a more knowledge-based Nordic Region and a more prosperous Nordic Region. This publication is part of “Creativity – the Nordic response to globalization”.
© Nordicom, University of Gothenburg
ISBN 978-91-86523-37-4
Published by:NORDICOMUniversity of GothenburgP O Box 713SE 405 30 GöteborgSwedenwww.nordicom.gu.se
Cover by: Daniel ZachrissonPrinted by: Ale Tryckteam AB, Bohus, Sweden, 2012
Contents
Foreword 7
Introduction 9
Facts & Figures
The Nordic Media Market 13
Financing 31
Television 53
Radio 107
Internet 145
Appendix 157
Country Contributors 165


7
Foreword
In television, there has long been a tendency to seek ‘role models’ among the major channels in big television markets in big countries. In the realm of public service broadcasting, the BBC has long been the paragon par excellence. Today, however, economic reality is such that few public service channels can realistically aspire to emulate ‘the BBC standard’. As a conse-quence, smaller channels in smaller countries are looked to for inspiration, and among these, the public service media in the Nordic countries have attracted considerable and widespread interest – as have our models of social organization over the years.
This, in short, is the background behind Nordicom’s project, A Nordic Public Service Media Map. Nordicom has long been part of the Nordic knowledge society. One of our principal objectives is to ensure the visibility of these five northerly countries, in Europe and further afield. In recent years, we have done quite a lot of work on media in the digital and globalized age: the conditions under which media operate and the changing roles the media play in society, viewed from a Nordic perspective. The project, A Nordic Public Service Media Map, is undertaken as a part of ‘Creative Norden’, one of the globalization strategies of the Nordic Council of Ministers.
It is our hope that the Nordic Public Service Media Map will make a meaningful contri-bution to the work being done on the role media play in democratic societies around the world. At the same time, Nordic media, too, are involved in a learning process, evolving – as always – in response to the changing environments they operate in.
The present publication is the first from this project entitled, Public Service Media in the Nordic Countries. Facts and Figures. There is a wealth of information in the overviews and statistics presented here. The contents form the basis of the next volume – the actual ‘Nor-dic Public Service Media Map’. We also look forward to publishing a number of qualified analyses from Nordic media scholars regarding public service media.
Göteborg in May 2012
Ulla CarlssonDirectorNordicom

9
This publication focuses on public service media in the Nordic region. The five Nordic countries – Denmark, Finland, Iceland, Norway and Sweden – are kindred in many respects, including their media systems and an integrated media market. A long tradition of public service broadcasting is one common trait, including strong support around it, as well as public service mod-els that have developed characterised by the fact that the five countries are small and have relatively small populations.
The Nordic public service broadcasters all have rights granted through legislation and accompanying regula-tions or agreements, with the role of supporting demo-cratic values, national culture and language, and of serving the whole population, through a broad range of programmes, national coverage and availability on several platforms. An important feature they all share is editorial freedom, meaning no interference from the state. Added to this are the many years of cooperation between the Nordic public service organisations con-cerning co-production and programme exchange.
For the media systems, technology shifts throughout the past decades have brought far-reaching changes. In the 1980s communication satellites in combination with liberalisation trends made new means of TV dis-tribution possible – and the Nordic countries, with na-tional public service organisations as single broadcasters, saw a new commercial and regional audiovisual market emerging. Pan-Scandinavian initiatives were launched by private interests, with MTG starting TV3 in Sweden, Denmark and Norway and SBS Broadcasting follow-ing suit with pan-Scandinavian establishment. Today, 20-25 years down the line, both MTG and SBS have important positions in the Nordic television and radio landscape, side by side with other large Nordic media companies such as Bonnier, Egmont and Sanoma, as well as the national public service organisations.
With digitalisation, new technology has again cre-ated new possibilities, challenges and debates. With all media companies meeting in the same arena – the web – competition for audiences and revenues has sharpened. All companies struggle to master the challenges, but the public service actors more so, since development has brought up fundamental questions about their “rai-
son d’être”. In today’s abundance of media output on multiple platforms, what is the role of the public service media? What is public service content? And how should public service operations be organised and financed?
Though mainly Nordic similarities, there have been different paths over the years concerning public service issues, such as type of organisation, ownership struc-tures and how public service rights and obligations can apply to private broadcasters. Also new challenges brought about by the changing landscapes have met different answers. The funding of public service broad-casting is one such issue. The traditional financing system via television licenses – i.e. a fee connected to a household’s or organization’s possession of a TV set – has been, and still is, much discussed. Countries have chosen different solutions. Denmark has introduced a household fee on all equipment that is able to receive programming, while Iceland and Finland are abandon-ing the license fee system altogether. Iceland replaced the license fee payment with an individual media fee (tax) in 2009, and Finland’s parliament has approved a new income-linked tax, replacing the TV license as of 2013. In Sweden, the financing question is the sub-ject of an ongoing government commission on public service.
Another pending issue is the digitalisation of radio. For a few years now terrestrial television has been fully digitalized in all Nordic countries, except Iceland, while radio shows a varied situation. Throughout the region, public service has been locomotive in the digital de-velopment, but otherwise the countries show different strategies concerning choice of technical systems, the rights and obligations of private broadcasters and the future shutdown of the analogue systems. Sofar, only Norway has proposed a closing year, 2017, for its ana-logue net.
The time span of this publication is the past decade in the light of digitalisation trends, with time series starting mostly during year 2000. During this period the Nordic public service broadcasters have lost view-ers and listeners, but more importantly, they still have many users. In order to understand the development of public service media it is necessary to consider the context of the general media landscape – in all its com-
Introduction
Eva Harrie
10
plexity, variety and great offer. Therefore, our aim has been to provide a description of each country’s media landscape today as well as the trends to date, and to offer a coherent overview of the Nordic region.
This publication is the start of our project, Nordic Public Service Media Map, which is part of ‘Creative Norden’ – a globalisation strategy of the Nordic Coun-cil of Ministers, and is intended for an international audience. This first volume concentrates on similarities and differences between the countries when it comes to structure – the public service media’s position on the Nordic media market, their political and financial con-ditions, and the overall output in the form of channels and stations, etc. – and on basic content and audience data. The facts and figures provide a basis for the series’ forthcoming publications, which will look more into the Nordic public service model – if there indeed is such a model – and its role in democracy and citizenship.
Invaluable for the work with this volume has been our longtime experience with the Nordic Media Trends series, with its broad overview of Nordic media devel-opments – and the team of knowledgeable contributors behind it. As in that series, the information and data presented here, were collected and collated in a joint effort by the Danish Agency for Culture (Centre for Libraries, Media and Digitalization), Statistics Fin-land, Statistics Iceland, medianorway and Nordicom-Sweden. Other experts, researchers and people in the industry have also contributed knowledge. We would like to thank all of you who have in any way been in-volved in this publication.
This said, we hope Public Service Media in the Nordic Countries will serve as a great source of information about the Nordic media landscape in general – and the Nordic public service media in particular.

11
Facts & Figures

12
Explanation of Symbols
– Magnitude zero
0 Magnitude less than half of unit employed
.. Data not available
* Category not applicable

13
The largest media companies on the Nordic market
Figure 1 The 25 largest media companies in the Nordic countries 2010 by company revenue 14
Table 2 The 25 largest media companies in the Nordic countries 2010: Company revenue, results and margins 15
Table 3 The 25 largest media companies in the Nordic countries 2010: Company revenue 2000-2010 16
Table 4 The 20 largest Nordic media companies’ total revenue and public service broadcasters’ share 1995-2010 18
Figure 5 The 20 largest Nordic media companies’ and public service broadcasters’ total revenue 1995-2010 18
The largest media companies on the Nordic and respective national markets
Table 6 The 20 largest media companies by media revenue on the Nordic media market 2010 19
Table 7 The ten largest media companies by revenue on the Finnish market 2010 20
Table 8 The six largest media companies by revenue on the Icelandic market 2010 21
Table 9 The ten largest media companies by revenue on the Norwegian market 2010 22
Table 10 The ten largest media companies by revenue on the Swedish market 2010 23
Nordic public service companies
Figure 11 DR (December 2010) 24
Figure 12 TV 2 / Danmark (December 2010) 25
Figure 13 Yleisradio Oy, YLE (Spring 2011) 26
Figure 14 Ríkisútvarpið ohf., RÚV (December 2010) 27
Figure 15 Norsk rikskringkasting AS, NRK (February 2012) 28
Figure 16 The Swedish public service group: SR, SVT and UR (February 2011) 29
The Nordic Media Market

NORDICOM 14 Nordic Public Service Media Map 1/2012
THE NORDIC MEDIA MARKET
1. The 25 largest media companies in the Nordic countries 2010 by company revenue (EUR millions)
0 500 1 000 1 500 2 000 2 500 3 000 3 500
Bonnier
Sanoma
Schibsted Media Group
MTG/Metro 1
Egmont 2
Telenor Broadcast 2,3
SVT/SR/UR 4
Mecom Group 5
NRK
A-pressen 2
Stampen
TDC: YouSee 6
Aller 7
DR
Com Hem
JP/Politikens Hus
Teracom
ProSiebenSat.1 Group 8
YLE
TV 2 Group 2
KF 9
Alma Media
TV 2/Danmark
Otava-Kuvalehdet
TS Group
EUR mill ions
Public service companies shown in colour.
Italics: Companies with domicile outside the Nordic countries. Included due to substantial revenue and activities on the Nordic market (data cover their Nordic opera-tions only).
1 The media holdings of the Stenbeck sphere: Modern Times Group MTG AB and Metro International S.A. The Group’s internet retailing business CDON Group AB was demerged at the end of 2010 and its shares were distributed to MTG’s shareholders. CDON’s revenue of 231 Meuro is not included in MTG’s income statement for 2010, nor in the Stenbeck collected revenue above.
2 On the Norwegian media market there is some cross-ownership: Telenor ASA owns 44% of A-pressen, which in its turn owns 50% of the TV 2 Group. The other 50% of the TV2 Group is owned by Danish Egmont. TV 2 Group’s revenue is included in A-pressen’s and Egmont’s accounts according to share of ownership. (In January 2012 A-pressen sold its share in the TV 2 Group to Egmont, which is now full owner of the group.)
3 Telenor’s broadcasting division. Telenor ASA’s total volume 2010 was 11 826 MEuro.4 Data refer to Förvaltningsstiftelsen, i.e. the owner foundation of Sweden’s three public service programme companies: SR (radio), SVT (television) and UR (educational
programmes, turnover 37 Meuro in 2010). Data exclude transactions within the group. 5 Nordic market only, which represents 47% of Mecom’s total revenue in 2010 (1 415 MEuro).6 TDC’s broadcasting subsidiary YouSee A/S. TDC’s total volume for 2010 was 3 512 MEuro.7 Financial year 1 October 2009 – 30 September 2010.8 Nordic market only, which represents 13% of ProSiebenSat.1’s total revenue in 2010 (3 000 MEuro).9 The media holdings of KF, Kooperativa Förbundet (The Swedish Cooperative Union). KF’s total revenue for 2010 was 3 835 MEuro.
Note: The public service companies in colour, i.e. SR/SVT/UR in Sweden, NRK in Norway, DR in Denmark, YLE in Finland and TV 2/Danmark (only its main channel, TV 2, is public service, but economic data above refer to the whole company).
Sources: Company annual reports and websites
THE NORDIC MEDIA MARKET
NORDICOM 15 Nordic Public Service Media Map 1/2012
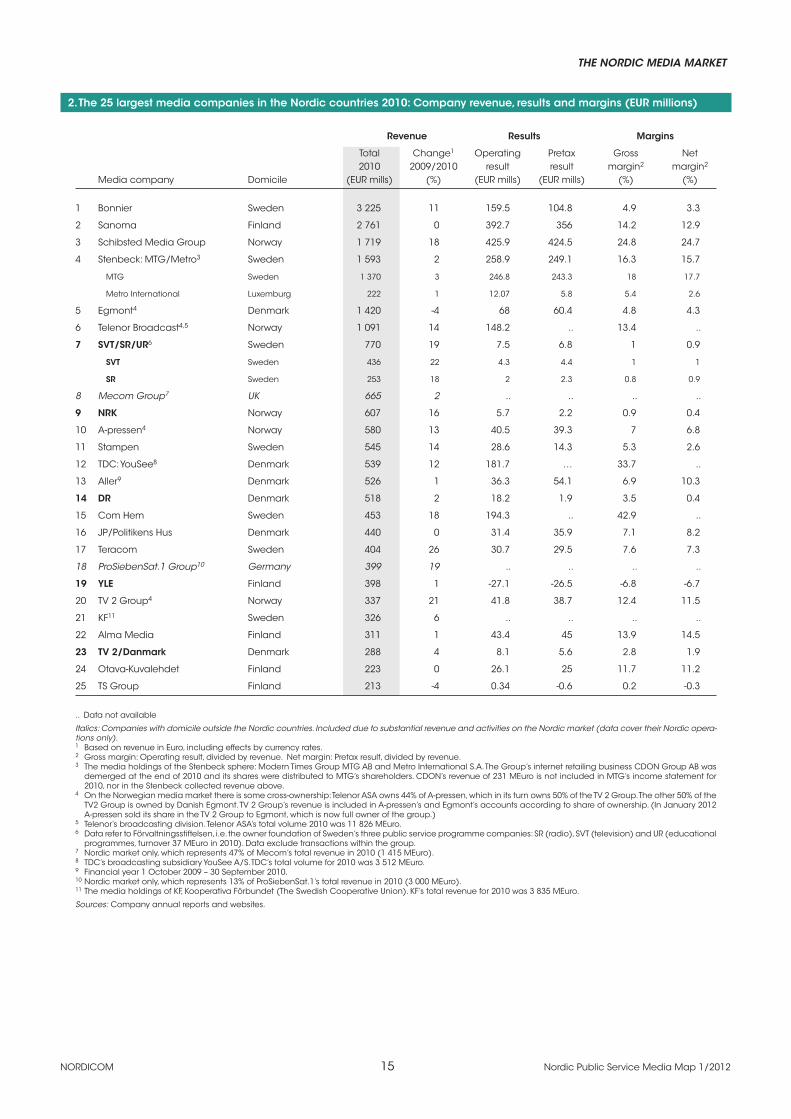
2. The 25 largest media companies in the Nordic countries 2010: Company revenue, results and margins (EUR millions)
Revenue Results Margins
Total Change1 Operating Pretax Gross Net 2010 2009/2010 result result margin2 margin2
Media company Domicile (EUR mills) (%) (EUR mills) (EUR mills) (%) (%)
1 Bonnier Sweden 3 225 11 159.5 104.8 4.9 3.3
2 Sanoma Finland 2 761 0 392.7 356 14.2 12.9
3 Schibsted Media Group Norway 1 719 18 425.9 424.5 24.8 24.7
4 Stenbeck: MTG/Metro3 Sweden 1 593 2 258.9 249.1 16.3 15.7
MTG Sweden 1 370 3 246.8 243.3 18 17.7
Metro International Luxemburg 222 1 12.07 5.8 5.4 2.6
5 Egmont4 Denmark 1 420 -4 68 60.4 4.8 4.3
6 Telenor Broadcast4,5 Norway 1 091 14 148.2 .. 13.4 ..
7 SVT/SR/UR6 Sweden 770 19 7.5 6.8 1 0.9
SVT Sweden 436 22 4.3 4.4 1 1
SR Sweden 253 18 2 2.3 0.8 0.9
8 Mecom Group7 UK 665 2 .. .. .. ..
9 NRK Norway 607 16 5.7 2.2 0.9 0.4
10 A-pressen4 Norway 580 13 40.5 39.3 7 6.8
11 Stampen Sweden 545 14 28.6 14.3 5.3 2.6
12 TDC: YouSee8 Denmark 539 12 181.7 … 33.7 ..
13 Aller9 Denmark 526 1 36.3 54.1 6.9 10.3
14 DR Denmark 518 2 18.2 1.9 3.5 0.4
15 Com Hem Sweden 453 18 194.3 .. 42.9 ..
16 JP/Politikens Hus Denmark 440 0 31.4 35.9 7.1 8.2
17 Teracom Sweden 404 26 30.7 29.5 7.6 7.3
18 ProSiebenSat.1 Group10 Germany 399 19 .. .. .. ..
19 YLE Finland 398 1 -27.1 -26.5 -6.8 -6.7
20 TV 2 Group4 Norway 337 21 41.8 38.7 12.4 11.5
21 KF11 Sweden 326 6 .. .. .. ..
22 Alma Media Finland 311 1 43.4 45 13.9 14.5
23 TV 2/Danmark Denmark 288 4 8.1 5.6 2.8 1.9
24 Otava-Kuvalehdet Finland 223 0 26.1 25 11.7 11.2
25 TS Group Finland 213 -4 0.34 -0.6 0.2 -0.3
.. Data not available
Italics: Companies with domicile outside the Nordic countries. Included due to substantial revenue and activities on the Nordic market (data cover their Nordic opera-tions only).1 Based on revenue in Euro, including effects by currency rates. 2 Gross margin: Operating result, divided by revenue. Net margin: Pretax result, divided by revenue. 3 The media holdings of the Stenbeck sphere: Modern Times Group MTG AB and Metro International S.A. The Group’s internet retailing business CDON Group AB was
demerged at the end of 2010 and its shares were distributed to MTG’s shareholders. CDON’s revenue of 231 MEuro is not included in MTG’s income statement for 2010, nor in the Stenbeck collected revenue above.
4 On the Norwegian media market there is some cross-ownership: Telenor ASA owns 44% of A-pressen, which in its turn owns 50% of the TV 2 Group. The other 50% of the TV2 Group is owned by Danish Egmont. TV 2 Group’s revenue is included in A-pressen’s and Egmont’s accounts according to share of ownership. (In January 2012 A-pressen sold its share in the TV 2 Group to Egmont, which is now full owner of the group.)
5 Telenor’s broadcasting division. Telenor ASA’s total volume 2010 was 11 826 MEuro.6 Data refer to Förvaltningsstiftelsen, i.e. the owner foundation of Sweden’s three public service programme companies: SR (radio), SVT (television) and UR (educational
programmes, turnover 37 MEuro in 2010). Data exclude transactions within the group. 7 Nordic market only, which represents 47% of Mecom’s total revenue in 2010 (1 415 MEuro).8 TDC’s broadcasting subsidiary YouSee A/S. TDC’s total volume for 2010 was 3 512 MEuro.9 Financial year 1 October 2009 – 30 September 2010.10 Nordic market only, which represents 13% of ProSiebenSat.1’s total revenue in 2010 (3 000 MEuro).11 The media holdings of KF, Kooperativa Förbundet (The Swedish Cooperative Union). KF’s total revenue for 2010 was 3 835 MEuro.
Sources: Company annual reports and websites.

NORDICOM 16 Nordic Public Service Media Map 1/2012
THE NORDIC MEDIA MARKET3.
Th
e 2
5 la
rge
st m
ed
ia c
om
pa
nie
s in
th
e N
ord
ic c
ou
ntr
ies
2010
: Co
mp
any
reve
nue
200
0-20
10 (
EUR
mill
ion
s)
Re
ven
ue
(EU
R m
illio
ns)
C
ha
ng
e (
%)1
M
ed
ia c
om
pa
ny
2000
20
01
2002
20
03
2004
20
05
2006
20
07
2008
20
09
2010
20
00-2
010
2009
-201
0
1 Bo
nn
ier
1 97
4 1
840
1 90
7 2
063
2 15
6 2
253
2 23
3 3
211
3 09
2 2
910
3 22
5 63
11
2 Sa
no
ma
1
448
1 73
4 2
358
2 39
6 2
505
2 62
2 2
742
2 92
6 3
030
2 76
8 2
761
91
0
3 Sc
hib
ste
d M
ed
ia G
rou
p
1 02
0 99
0 1
048
1 06
9 1
158
1 22
7 1
447
1 69
7 1
674
1 45
9 1
719
69
18
4 St
en
be
ck:
MTG
/Me
tro2
765
833
836
899
1 01
3 1
178
1 45
2 1
558
2 95
3 1
555
1 59
3 10
8 2z
MTG
64
3 69
2 65
6 69
2 74
5 86
3 1
096
1 22
7 1
371
1 33
4 1
370
114
3
Me
tro
84
98
125
180
243
289
331
331
295
220
222
164
1
5 Eg
mo
nt
1 06
6 1
169
1 23
0 1
126
1 08
8 1
119
1 25
4 1
514
1 58
2 1
478
1 42
0 33
-4
6 Te
len
or B
roa
dc
ast
3 ..
301
448
580
623
689
763
872
851
970
1 09
1 ..
11
7 SV
T/SR
/UR4
693
709
726
740
760
765
762
764
719
648
770
11
19
SVT
424
410
411
420
445
450
443
436
411
358
436
3 22
SR
195
222
234
240
231
235
245
240
228
214
253
30
18
8 M
eco
m G
rou
p5
* *
* *
* *
839
847
805
652
665
* 2
Ork
la M
ed
ia6
867
926
943
922
989
1 08
3 *
* *
* *
* *
9 N
RK
391
402
456
431
441
461
482
500
530
522
607
55
16
10
A-p
ress
en
(N
orw
ay)
27
8 28
6 32
2 30
5 31
9 37
1 42
1 59
1 59
6 51
3 58
0 10
9 13
11
Sta
mp
en
18
7 15
6 16
0 17
8 17
8 19
2 32
6 54
7 53
2 47
8 54
5 19
1 14
12
TDC
: Yo
uSe
e7
147
160
180
205
237
283
329
380
427
483
539
267
12
13
Alle
r8 42
8 44
2 46
9 47
1 48
3 51
1 53
1 54
6 57
7 51
9 52
6 23
1
14
DR
392
392
402
425
442
454
453
481
488
508
518
32
2
15
Co
m H
em
9 81
95
11
7 14
3 17
3 24
1 25
6 38
2 39
8 38
5 45
3 46
2 18
16
JP/P
olit
ike
ns
Hu
s10
* *
* 39
9 41
8 45
1 47
3 49
7 48
1 44
1 44
0 *
0
Polit
ike
n
216
216
215
* *
* *
* *
* *
* *
Jylla
nd
s-Po
ste
n
159
149
140
* *
* *
* *
* *
* *
17
Tera
co
m
183
175
194
206
235
291
325
358
332
321
404
120
26
18
Pro
Sieb
enSa
t.1 G
rou
p11
*
* *
* *
* *
* 49
1 33
5 39
9 *
19
SB
S Br
oa
dc
ast
ing
12
190
183
193
219
241
.. 48
1 *
* *
* *
*
19
YLE13
36
2 38
1 37
5 33
0 35
9 37
5 38
4 38
5 38
1 39
4 39
8 10
1
20
TV 2
Gro
up
(N
orw
ay)
18
6 18
7 20
8 20
2 21
2 24
3 28
7 32
6 33
4 27
9 33
7 81
21
21
KF14
14
8 16
4 21
1 21
7 24
4 28
9 31
7 36
4 35
8 30
9 32
6 12
0 6
22
Alm
a M
ed
ia
484
478
486
461
465
286
302
329
341
308
311
-36
1
23
TV 2
/Da
nm
ark
22
0 21
6 22
3 20
6 21
3 22
8 26
3 29
7 29
0 27
7 28
8 31
4
24
Ota
va-K
uva
leh
de
t 18
5 20
9 21
9 22
0 23
0 23
3 24
6 23
4 23
7 22
3 22
3 21
0
25
TS G
rou
p
247
276
293
279
272
309
339
336
306
222
213
-14
-4

THE NORDIC MEDIA MARKET
NORDICOM 17 Nordic Public Service Media Map 1/2012
* N
ot a
pp
lica
ble
(c
om
pa
ny d
id n
ot e
xist
, or h
ad
no
ac
tiviti
es
on
the
No
rdic
ma
rke
t)
.. D
ata
no
t ava
ilab
le
Italic
s: C
om
pa
nie
s w
ith d
om
icile
ou
tsid
e th
e N
ord
ic c
ou
ntr
ies.
Incl
ud
ed
du
e to
su
bst
an
tial r
eve
nue
an
d a
ctiv
itie
s o
n th
e N
ord
ic m
ark
et (
da
ta c
ove
r th
eir
No
rdic
op
era
tion
s o
nly
).
1 B
ase
d o
n re
ven
ue
in E
uro
, in
clu
din
g e
ffec
ts b
y c
urre
nc
y ra
tes.
2 M
ed
ia h
old
ing
s o
f th
e S
ten
be
ck
sph
ere
: Mo
de
rn Ti
me
s G
rou
p M
TG A
B, M
etro
Inte
rna
tion
al S
.A. p
lus
the
me
dia
ho
ldin
gs
of T
ele
2 A
B (2
000-
2006
). A
ll c
om
pa
nie
s a
re c
on
trolle
d b
y th
e S
ten
be
ck
fam
ily.
Fro
m 2
007
on
th
e m
ed
ia h
old
ing
s o
f Te
le2
AB,
i.e
. ca
ble
TV
op
era
tion
s in
Sw
ed
en
, are
no
t d
iffe
ren
tiate
d in
th
e c
om
pa
ny’s
ac
co
un
ts a
nd
are
th
ere
fore
no
t in
clu
de
d t
he
rea
fter
(rev
en
ue
200
6 w
as
24 M
Euro
). Th
e G
rou
p’s
inte
rne
t re
taili
ng
bu
sin
ess
CD
ON
Gro
up
AB
wa
s d
em
erg
ed
at
the
en
d o
f 201
0 a
nd
its
sha
res
we
re d
istr
ibu
ted
to M
TG’s
sh
are
ho
lde
rs. C
DO
N’s
reve
nu
e o
f 231
MEu
ro is
no
t in
clu
de
d in
MTG
’s in
co
me
sta
tem
en
t fo
r 201
0, n
or i
n th
e c
olle
cte
d S
ten
be
ck
reve
nu
e a
bo
ve.
3 T
ele
no
r’s b
roa
dc
ast
ing
div
isio
n. T
ele
no
r ASA
’s to
tal v
olu
me
for 2
010
wa
s 11
826
MEu
ro.
4 D
ata
refe
r to
Fö
rva
ltnin
gss
tifte
lse
n, i
.e. t
he
ow
ne
r fo
un
da
tion
of S
we
de
n’s
th
ree
pu
blic
se
rvic
e p
rog
ram
me
co
mp
an
ies:
SR
(ra
dio
), SV
T (t
ele
visi
on
) a
nd
UR
(ed
uc
atio
na
l pro
gra
mm
es,
turn
ove
r 37
M
Euro
in 2
010)
. Da
ta e
xclu
de
tra
nsa
ctio
ns
with
in th
e g
rou
p.
5 N
ord
ic m
ark
et o
nly
, wh
ich
rep
rese
nts
47%
of M
ec
om
’s to
tal r
eve
nu
e in
201
0 (1
415
MEu
ro).
The
op
era
tion
s, fo
rme
rly p
art
of t
he
No
rwe
gia
n c
om
pa
ny, O
rkla
Me
dia
, we
re s
old
to th
e B
ritis
h c
om
pa
ny
Me
co
m G
rou
p P
lc in
Fa
ll 20
06. O
pe
ratio
ns
in N
orw
ay
we
re re
na
me
d E
dd
a M
ed
ia A
S; th
e D
an
ish
op
era
tion
s w
ere
inte
gra
ted
into
De
t Be
rlin
gsk
e O
ffic
in (
tod
ay
Berli
ng
ske
Me
dia
). (I
n D
ec
em
be
r 201
1 M
ec
om
an
d A
-pre
sse
n re
ac
he
d a
n a
gre
em
en
t wh
ere
by
A-p
ress
en
will
ac
qu
ire E
dd
a M
ed
ia. T
he
ag
ree
me
nt i
s p
en
din
g a
pp
rova
l by
No
rwe
gia
n c
om
pe
titio
n a
uth
orit
ies.
)6
Ork
la M
ed
ia a
cq
uire
d th
e D
an
ish
new
spa
pe
r co
mp
any
De
t Be
rlin
gsk
e O
ffic
in in
late
200
0, ju
ridic
ally
1 J
an
ua
ry 2
001.
Rev
en
ue
for 2
000
is p
ro fo
rma
an
d in
clu
de
s D
et B
erli
ng
ske
Offi
cin
. In
200
6 O
rkla
M
ed
ia’s
pa
ren
t co
mp
any
, Ork
la A
SA, s
old
Ork
la M
ed
ia to
the
Brit
ish
co
mp
any
Me
co
m G
rou
p P
lc (
see
no
te 5
). 7
Da
ta fo
r TD
C’s
su
bsi
dia
ry Y
ou
See
A/S
(c
ab
le-T
V p
rovi
de
r). Y
ou
See
is th
e n
am
e fr
om
200
7 o
n; p
revi
ou
s n
am
e w
as
TDC
Ka
be
l-TV.
TD
C G
rou
p’s
tota
l vo
lum
e 2
010
wa
s 3
512
MEu
ro.
8 2
000=
1999
/200
0 e
tc.
9 D
ata
for 2
000-
2005
an
d 2
009-
2010
rep
rese
nt C
om
He
m A
B; 2
006-
2008
No
rdic
Ca
ble
Ac
qu
isiti
on
Ho
ldin
g A
B (t
he
the
n o
wn
er o
f Co
m H
em
). 10
Po
litik
en
an
d J
ylla
nd
s-Po
ste
n m
erg
ed
1 J
an
200
3 to
form
JP/
Polit
ike
ns
Hu
s A
/S.
11 P
roSi
eb
en
Sa
t.1 G
rou
p a
cq
uire
d m
ed
ia h
old
ing
s in
the
No
rdic
co
un
trie
s in
200
7 b
y p
urc
ha
sin
g S
BS B
roa
dc
ast
ing
, co
nso
lida
ted
into
Pro
Sie
be
nSa
t.1 a
s o
f 1 J
uly
200
7. D
ata
ab
ove
inc
lud
e th
e N
ord
ic
ma
rke
t on
ly, w
hic
h re
pre
sen
ts 1
3% o
f Pro
Sie
be
nSa
t.1’s
tota
l rev
en
ue
in 2
010
(3 0
00 M
Euro
).
12
No
rdic
Ma
rke
t on
ly, w
hic
h in
200
6 re
pre
sen
ted
48%
of S
BS B
roa
dc
ast
ing
’s to
tal v
olu
me
.13
Da
ta fo
r 200
3 a
nd
the
rea
fter r
ep
rese
nt Y
leis
rad
io O
y; e
arli
er d
ata
rep
rese
nt Y
LE G
rou
p, w
hic
h in
clu
de
d th
e T
V n
etw
ork
op
era
tor D
igita
Oy.
14 T
he
me
dia
ho
ldin
gs
of
KF, K
oo
pe
rativ
a F
örb
un
de
t (t
he
Sw
ed
ish
Co
op
era
tive
Un
ion
). D
ata
200
0-20
05, 2
010:
exc
lud
ing
tra
nsa
ctio
ns
with
in t
he
gro
up
, 200
6-20
09: i
nc
lud
ing
tra
nsa
ctio
ns
with
in t
he
g
rou
p. K
F’s
tota
l rev
en
ue
for 2
010
wa
s 3
835
MEu
ro.
Sou
rce
s: C
om
pa
ny a
nn
ua
l re
po
rts
an
d w
eb
site
s.

NORDICOM 18 Nordic Public Service Media Map 1/2012
THE NORDIC MEDIA MARKET
5. The 20 largest Nordic media companies’ and public service broadcasters’ total revenue 1995-2010 (EUR millions)
1 DR, YLE, NRK and SVT/SR/UR (all of which are also included in top 20 total). Not including TV 2 / Danmark.
Note: Data for 2005 and 2007 include some estimates. TV distribution companies are not included.
Sources: Company annual reports, Nordicom.
0
2 000
4 000
6 000
8 000
10 000
12 000
14 000
16 000
18 000
20 000
1995 1996 1997 1998 1999 2000 2001 2002 2003 2004 2005 2006 2007 2008 2009 2010
EUR
mill
ion
s
Top 20 total Public service broadcasters1
4. The 20 largest Nordic media companies’ total revenue and public service broadcasters’ share 1995-2010 (EUR millions)
Revenue (EUR millions)
1995 1996 1997 1998 1999 2000 2001 2002 2003 2004 2005 2006 2007 2008 2009 2010
Top 20 total 7 583 8 326 8 467 9 125 10 580 11 611 12 013 13 122 13 367 13 995 14 818 15 744 18 046 18 204 16 570 17 623
Public service broadcasters1 1 544 1 656 1 665 1 674 1 752 1 837 1 884 1 958 1 926 2 002 2 056 2 081 2 129 2 118 2 072 2 293
PSBs’ share of all (%) 20 20 20 18 17 16 16 15 14 14 14 13 12 12 13 13
1 DR, YLE, NRK and SVT/SR/UR (all of which are also included in top 20 total). Not including TV 2 / Danmark.
Note: Data for 2005 and 2007 include some estimates. TV distribution companies are not included.
Sources: Company annual reports, Nordicom.

THE NORDIC MEDIA MARKET
NORDICOM 19 Nordic Public Service Media Map 1/2012
6. T
he
20
larg
est
me
dia
co
mp
an
ies
by
me
dia
reve
nue
on
th
e N
ord
ic m
ed
ia m
ark
et
2010
(EU
R m
illio
ns)
Me
dia
reve
nu
e
Ch
an
ge
in m
ed
ia
In
the
No
rdic
To
tal c
om
pa
ny
No
rdic
sh
are
of
reve
nu
e in
the
To
tal c
om
pa
ny
Me
dia
sh
are
of
c
ou
ntr
ies
me
dia
reve
nu
e
tota
l me
dia
reve
nu
e
No
rdic
co
un
trie
s re
ven
ue
to
tal c
om
pa
ny
Me
dia
co
mp
any
D
om
icile
(E
UR
mill
ion
s)
(EU
R m
illio
ns)
(%
) 20
09/2
010
(%)
(EU
R m
illio
ns)
re
ven
ue
(%
)
1 Bo
nn
ier
Swe
de
n
2 66
2 3
225
83
13
3 22
5 10
0
2 Sa
no
ma
Fi
nla
nd
1
433
2 76
1 52
0
2 76
1 10
0
3 Sc
hib
ste
d M
ed
ia G
rou
p
No
rwa
y 1
432
1 71
9 83
21
1
719
100
5 Eg
mo
nt1
De
nm
ark
1
169
1 42
0 82
-1
1
420
100
4 St
en
be
ck:
MTG
/Me
tro2
Swe
de
n
1 11
2 1
593
70
9 9
897
16
6 Te
len
or B
roa
dc
ast
1,3
No
rwa
y 1
091
1 09
1 10
0 12
11
826
9
7 SV
T/SR
/UR
(Fö
rva
ltnin
gss
tifte
lse
n)4
Swe
de
n
770
770
100
19
770
100
8 M
ec
om
Gro
up
U
K 66
5 1
415
47
2 1
415
100
9 N
RK
No
rwa
y 60
7 60
7 10
0 16
60
7 10
0
10
Sta
mp
en
Sw
ed
en
54
5 54
5 10
0 14
54
5 10
0
11
TDC
: Yo
uSe
e5
De
nm
ark
53
9 53
9 10
0 12
3
512
15
12
A-p
ress
en
1 N
orw
ay
532
580
92
11
580
100
13
Alle
r6 D
en
ma
rk
526
526
100
1 52
6 10
0
14
DR
De
nm
ark
51
8 51
8 10
0 3
518
100
15
Co
m H
em
Sw
ed
en
45
3 45
3 10
0 18
45
3 10
0
16
JP/P
olit
ike
ns
Hu
s D
en
ma
rk
440
440
100
0 44
0 10
0
17
Tera
co
m
Swe
de
n
404
404
100
27
404
100
18
Pro
Sie
be
nSa
t.1 G
rou
p
Ge
rma
ny
399
3 00
0 13
19
3
000
100
19
YLE
Fin
lan
d
398
398
100
1 39
8 10
0
20
TV 2
Gro
up
1 N
orw
ay
337
337
100
21
337
100
1 O
n t
he
No
rwe
gia
n m
ed
ia m
ark
et
the
re is
so
me
cro
ss o
wn
ers
hip
: Te
len
or A
SA o
wn
s 44
% o
f A-p
ress
en
, wh
ich
in
its tu
rn o
wn
s 50
% o
f th
e T
V 2
Gro
up
. Th
e o
the
r 50%
of t
he
TV
2 G
rou
p is
ow
ne
d b
y D
an
ish
Eg
mo
nt.
TV 2
Gro
up
’s
reve
nu
e is
inc
lud
ed
in
A-p
ress
en
’s a
nd
Eg
mo
nt’s
ac
co
un
ts a
cc
ord
ing
to s
ha
re o
f ow
ne
rsh
ip. (
In J
an
ua
ry 2
012
A-p
ress
en
so
ld it
s sh
are
in th
e T
V 2
Gro
up
to E
gm
on
t, w
hic
h is
no
w fu
ll o
wn
er o
f th
e g
rou
p.)
2 Th
e m
ed
ia h
old
ing
s o
f th
e S
ten
be
ck
sph
ere
: Mo
de
rn T
ime
s G
rou
p M
TG A
B a
nd
Me
tro In
tern
atio
na
l S.A
. Th
e
Gro
up
’s in
tern
et
reta
ilin
g b
usi
ne
ss C
DO
N G
rou
p A
B w
as
de
me
rge
d a
t th
e e
nd
of
2010
an
d it
s sh
are
s w
ere
d
istr
ibu
ted
to M
TG’s
sh
are
ho
lde
rs. C
DO
N’s
reve
nu
e o
f 231
Me
uro
is n
ot i
nc
lud
ed
in M
TG’s
inc
om
e s
tate
me
nt f
or
2010
, no
r in
the
co
llec
ted
Ste
nb
ec
k m
ed
ia re
ven
ue
ab
ove
.
3 T
ele
no
r’s b
roa
dc
ast
ing
div
isio
n. T
ele
no
r ASA
’s to
tal v
olu
me
201
0 w
as
11 8
26 M
Euro
.4
Da
ta re
fer t
o F
örv
altn
ing
sstif
tels
en
, i e
the
ow
ne
r fo
un
da
tion
of S
we
de
n’s
thre
e p
ub
lic s
erv
ice
pro
gra
mm
e c
om
-p
an
ies:
SR
(ra
dio
), S
VT
(te
levi
sio
n)
an
d U
R (e
du
ca
tion
al p
rog
ram
me
s). D
ata
exc
lud
e t
ran
sac
tion
s w
ithin
th
e
gro
up
.5
TD
C’s
bro
ad
ca
stin
g s
ub
sid
iary
Yo
uSe
e A
/S. T
DC
’s to
tal v
olu
me
201
0 w
as
3 51
2 M
Euro
.6
Fin
an
cia
l ye
ar 1
Oc
tob
er 2
009
– 30
Se
pte
mb
er 2
010.
Sou
rce
s: C
om
pa
ny a
nn
ua
l re
po
rts
an
d w
eb
site
s.

NORDICOM 20 Nordic Public Service Media Map 1/2012
THE NORDIC MEDIA MARKET7.
Th
e te
n la
rge
st m
ed
ia c
om
pa
nie
s b
y re
venu
e o
n t
he
Fin
nis
h m
ark
et
2010
(EU
R m
illio
ns)
Fi
nn
ish
Re
ven
ue
in
sha
re o
f to
tal
Tota
l M
ain
me
dia
ac
tiviti
es
C
om
pa
ny
Do
mic
ile
Ow
ne
r (sh
are
%)
Fin
lan
d
reve
nu
e (
%)
reve
nu
e
(in
cl.
larg
e m
ed
ia c
om
pa
nie
s o
r bra
nd
s) in
Fin
lan
d
1 Sa
no
ma
Oyj
Fi
nla
nd
Er
kko
fam
ily (
41)
1 41
7 51
2
761
Da
ily n
ewsp
ap
ers
(in
cl.
He
lsin
gin
Sa
no
ma
t, Ilt
a-S
an
om
at)
, we
b-o
nly
new
spa
pe
r (Ta
lou
sssa
no
ma
t.fi),
free
da
ily n
ewsp
ap
er (
Me
tro),
ma
ga
zin
es
(Sa
no
ma
Ma
ga
zin
es)
, le
arn
ing
ma
teria
ls a
nd
so
lutio
ns,
TV c
ha
nn
els
(in
cl.
Ne
lon
en
, Jim
, Liv
), ra
dio
ch
an
ne
ls (
inc
l. Ra
dio
Ro
ck,
Rad
io A
alto
), w
eb
ma
rke
tpla
ce
s
2 YL
E, Y
leis
rad
io O
y Fi
nla
nd
Th
e F
inn
ish
sta
te
398
100
398
TV c
ha
nn
els
(YL
E TV
1, Y
LE T
V2,
YLE
Tee
ma
, YLE
FST
5), r
ad
io c
ha
nn
els
(in
cl. Y
LE R
ad
io1,
YLE
Ra
dio
Su
om
i, YLE
Ra
dio
Ve
ga
)
3 Bo
nn
ier A
B Sw
ed
en
Bo
nn
ier f
am
ily
375
12
3 22
5 TV
ch
an
ne
ls (
inc
l. M
TV3,
Su
b, A
va, C
Mo
re -
Ca
na
l Plu
s), r
ad
io
c
ha
nn
el (
Rad
io N
ova
), b
oo
ks (
Tam
mi,
WSO
Y), m
ag
azi
ne
s (B
on
nie
r
Pub
lica
tion
s), p
ho
no
gra
ms,
vid
eo
4 A
lma
Me
dia
Oyj
Fi
nla
nd
Ilk
ka-Y
hty
mä
(30
) 29
8 96
31
1 D
aily
new
spa
pe
rs (
inc
l. A
am
ule
hti,
Ilta
leh
ti, K
au
pp
ale
hti)
, lo
ca
l
new
spa
pe
rs, c
ust
om
er m
ag
azi
ne
s (A
lma
Me
dia
Le
hd
en
teki
jät)
,
we
b m
ark
etp
lac
es
6 TS
-Yh
tym
ä O
y Fi
nla
nd
Ke
ton
en
fam
ily
190
89
213
Da
ily n
ewsp
ap
ers
(in
cl. T
uru
n S
an
om
at)
, lo
ca
l new
spa
pe
rs, l
oc
al
ra
dio
ch
an
ne
ls, p
rintin
g
5 O
tava
Oy
Fin
lan
d
Ree
np
ää
fam
ily
222
99
223
Boo
ks (
Kust
an
nu
sosa
keyh
tiö O
tava
, Lik
e K
ust
an
nu
s), c
on
sum
er
m
ag
azi
ne
s (O
tava
me
dia
), c
ust
om
er m
ag
azi
ne
s, b
oo
k c
lub
s
(i
nc
l. Su
uri
Suo
ma
lain
en
Kirj
ake
rho
)
8 Ke
skis
uo
ma
lain
en
Oyj
Fi
nla
nd
N
o m
ajo
r ow
ne
r 10
2 10
0 10
2 D
aily
new
spa
pe
rs (
inc
l. Ke
skis
uo
ma
lain
en
, Sa
von
Sa
no
ma
t), l
oc
al
n
ewsp
ap
ers
7 Ed
ita O
y Fi
nla
nd
Th
e F
inn
ish
sta
te
57
52
110
Boo
ks, c
ust
om
er m
ag
azi
ne
s, m
ark
etin
g c
om
mu
nic
atio
ns
serv
ice
s,
p
rintin
g
9 A
-leh
de
t Oy
Fin
lan
d
Lyyt
ikä
ine
n fa
mily
91
10
0 91
C
on
sum
er m
ag
azi
ne
s (A
-leh
de
t, Im
ag
e K
ust
an
nu
s), c
ust
om
er
m
ag
azi
ne
s (M
ark
kin
oin
tivie
stin
tä D
ialo
gi)
10
Poh
jois
-Ka
rjala
n k
irja
pa
ino
Fi
nla
nd
La
akk
on
en
fam
ily
85
100
85
Da
ily n
ewsp
ap
er (
Karja
lain
en
), lo
ca
l new
spa
pe
rs, p
rintin
g
Sou
rce
s: C
om
pa
ny a
nn
ua
l re
po
rts
an
d w
eb
site
s, St
atis
tics
Fin
lan
d.
THE NORDIC MEDIA MARKET
NORDICOM 21 Nordic Public Service Media Map 1/2012
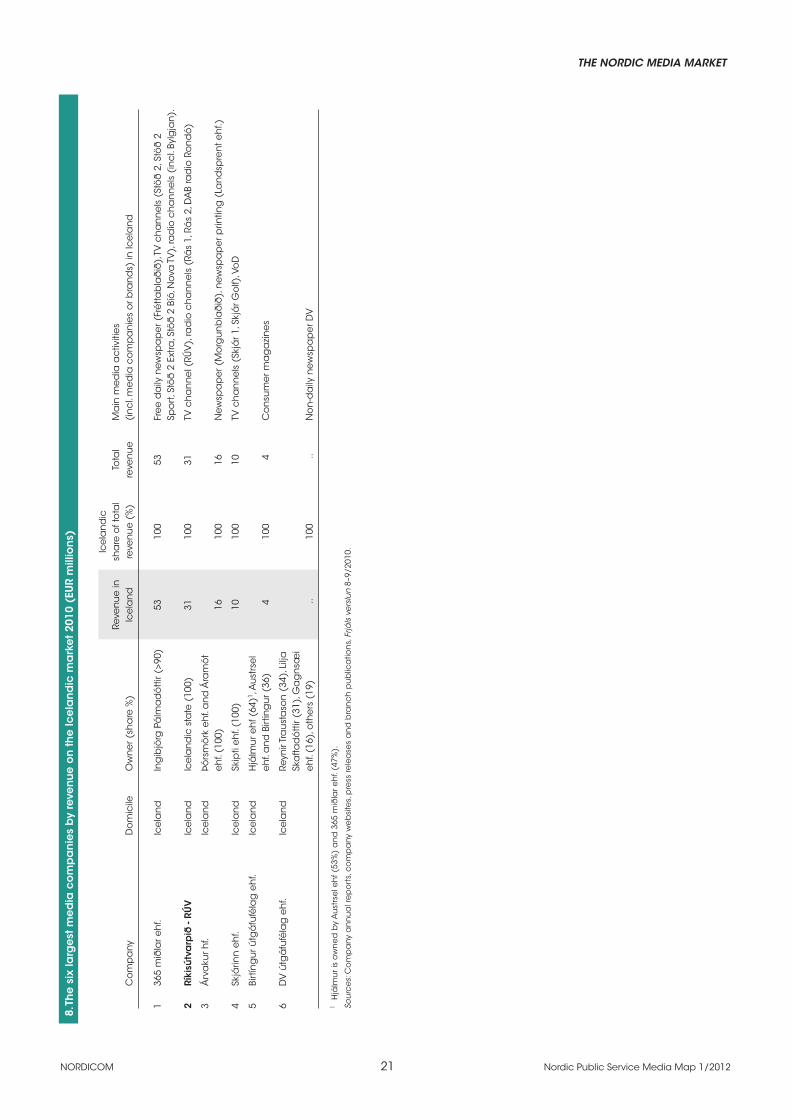
8. T
he
six
larg
est
me
dia
co
mp
an
ies
by
reve
nue
on
th
e Ic
ela
nd
ic m
ark
et
2010
(EU
R m
illio
ns)
Ic
ela
nd
ic
Reve
nu
e in
sh
are
of t
ota
l To
tal
Ma
in m
ed
ia a
ctiv
itie
s
Co
mp
any
D
om
icile
O
wn
er (
sha
re %
) Ic
ela
nd
re
ven
ue
(%
) re
ven
ue
(i
nc
l. m
ed
ia c
om
pa
nie
s o
r bra
nd
s) in
Ice
lan
d
1 36
5 m
iðla
r eh
f. Ic
ela
nd
In
gib
jörg
Pá
lma
dó
ttir
(>90
) 53
10
0 53
Fr
ee
da
ily n
ewsp
ap
er (
Fré
ttab
lað
ið),
TV c
ha
nn
els
(St
öð
2, S
töð
2
Sp
ort
, Stö
ð 2
Ext
ra, S
töð
2 B
íó, N
ova
TV
), ra
dio
ch
an
ne
ls (
inc
l. By
lgja
n).
2 Rí
kisú
tva
rpið
- RÚ
V
Ice
lan
d
Ice
lan
dic
sta
te (
100)
31
10
0 31
TV
ch
an
ne
l (RÚ
V),
rad
io c
ha
nn
els
(Rá
s 1,
Rá
s 2,
DA
B ra
dio
Ro
nd
ó)
3 Á
rva
kur h
f. Ic
ela
nd
Þó
rsm
örk
eh
f. a
nd
Ára
mó
t
eh
f. (1
00)
16
100
16
New
spa
pe
r (M
org
un
bla
ðið
), n
ewsp
ap
er p
rintin
g (
Lan
dsp
ren
t eh
f.)
4 Sk
járin
n e
hf.
Ice
lan
d
Skip
ti e
hf.
(100
) 10
10
0 10
TV
ch
an
ne
ls (
Skjá
r 1, S
kjá
r Go
lf), V
oD
5 Bi
rtín
gu
r útg
áfu
féla
g e
hf.
Ice
lan
d
Hjá
lmu
r eh
f (64
)1 , A
ust
rse
l
eh
f. a
nd
Birt
ing
ur (
36)
4 10
0 4
Co
nsu
me
r ma
ga
zin
es
6 D
V ú
tgá
fufé
lag
eh
f. Ic
ela
nd
Re
ynir
Tra
ust
aso
n (
34),
Lilja
Ska
ftad
ótt
ir (3
1), G
ag
nsæ
i
eh
f. (1
6), o
the
rs (
19)
.. 10
0 ..
No
n-d
aily
new
spa
pe
r DV
1 H
jálm
ur i
s o
wn
ed
by
Au
strs
el e
hf (
53%
) a
nd
365
mið
lar e
hf.
(47%
).
Sou
rce
s: C
om
pa
ny a
nn
ua
l re
po
rts,
co
mp
any
we
bsi
tes,
pre
ss re
lea
ses
an
d b
ran
ch
pu
blic
atio
ns,
Frjá
ls v
ers
lun
8–9
/201
0.

NORDICOM 22 Nordic Public Service Media Map 1/2012
THE NORDIC MEDIA MARKET9.
Th
e te
n la
rge
st m
ed
ia c
om
pa
nie
s b
y re
venu
e o
n t
he
No
rwe
gia
n m
ark
et
2010
(EU
R m
illio
ns)
N
orw
eg
ian
Re
ven
ue
in
sha
re o
f to
tal
Tota
l M
ain
me
dia
ac
tiviti
es
C
om
pa
ny
Do
mic
ile
Ow
ne
r (sh
are
%)
No
rwa
y re
ven
ue
(%
) re
ven
ue
(i
nc
l. m
ed
ia c
om
pa
nie
s o
r bra
nd
s) in
No
rwa
y
1 Sc
hib
ste
d M
ed
ia G
rou
p
No
rwa
y Bl
om
me
nh
olm
Ind
ust
rier
918
53
1 72
0 N
ewsp
ap
ers
(in
cl. V
G, A
ften
po
ste
n, B
erg
en
s Ti
de
nd
e, S
tava
ng
er
(S
tifte
lse
n T
iniu
s) (
26),
Afte
nb
lad
), o
nlin
e c
lass
ifie
ds
(Fin
n.n
o),
bo
oks
/ma
ga
zin
es
Fo
lke
tryg
dfo
nd
et (
8)
(S
ch
ibst
ed
Fo
rlag
).
2 Te
len
or G
rou
p
No
rwa
y N
orw
eg
ian
sta
te (
54),
62
5 57
1
091
TV a
nd
rad
io d
istr
ibu
tion
via
ca
ble
, sa
telli
te a
nd
DTT
(in
cl.
Ca
na
l
(Te
len
or B
roa
dc
ast
)1,2
Fo
lke
tryg
dfo
nd
et (
5)
D
igita
l, N
ork
ring
, Rik
sTV
33%
), TV
ch
an
ne
ls (
TV 2
Ze
bra
45%
, TV
2 S
po
rt
45
%, C
an
al+
/C M
ore
Gro
up
35%
)
3 N
RK A
S N
orw
ay
No
rwe
gia
n s
tate
60
7 10
0 60
7 TV
(in
cl.
NRK
1, N
RK2,
NRK
3), r
ad
io (
inc
l. P1
, P2,
P3)
, TV
dis
trib
utio
n
(R
iksT
V 3
3%)
4 Eg
mo
nt F
ou
nd
atio
n2
De
nm
ark
Se
lf-o
wn
ing
fou
nd
atio
n
585
41
1 42
0 Bo
oks
& m
ag
azi
ne
s (C
ap
pe
len
Da
mm
50%
, Eg
mo
nt H
jem
me
t
Mo
rte
nse
n, E
gm
on
t Se
riefo
rlag
et)
, film
dis
trib
utio
n (
No
rdis
k Fi
lm),
TV (
TV 2
Gru
pp
en
50%
)
5 A
-pre
sse
n A
S2 N
orw
ay
Tele
no
r (44
), LO
an
d c
on
ne
cte
d
532
92
580
49 lo
ca
l new
spa
pe
rs, N
etta
vise
n (
50%
), TV
2 G
rou
p (
50%
)
lab
ou
r un
ion
s (4
5), A
-pre
sse
n (
8),
Th
e F
ree
do
m o
f Exp
ress
ion
Fou
nd
atio
n (
3)
6 TV
2 G
rou
p A
S2 N
orw
ay
A-p
ress
en
(50
), Eg
mo
nt (
50)
338
100
338
TV (
inc
l. TV
2, T
V 2
Blis
s, TV
2 N
yhe
tska
na
len
, TV
2 F
ilmka
na
len
, TV
2
Ze
bra
55%
, TV
2 S
po
rt 5
5%),
TV d
istr
ibu
tion
(Ri
ksTV
33%
)
7 Bo
nn
ier A
B Sw
ed
en
Bo
nn
ier f
am
ily
302
9 3
225
Boo
ks &
ma
ga
zin
es
(Ca
pp
ele
n D
am
m 5
0%, B
on
nie
r Me
dia
), fil
m
d
istr
ibu
tion
(SF
No
rge
), c
ine
ma
s (S
F Ki
no
)
8 M
ec
om
Gro
up
Plc
U
K A
viva
Plc
(19
), Le
ga
l & G
en
era
l 26
1 18
1
415
Edd
a M
ed
ia (
21 lo
ca
l new
spa
pe
rs)
G
rou
p P
lc (
16),
Jup
iter A
sse
t
Ma
na
ge
me
nt L
imite
d (
8)
9 M
od
ern
Tim
es
Gro
up
Sw
ed
en
St
en
be
ck
fam
ily (
>50
thro
ug
h
252
18
1 37
0 TV
(TV
3, V
iasa
t 4, T
V10
00),
rad
io (
P4, P
5), T
V p
rod
uc
tion
MTG
AB
d
irec
t an
d in
dire
ct o
wn
ers
hip
)
(Str
ix Te
levi
sjo
n),
TV d
istr
ibu
tion
(V
iasa
t).
10
Pola
ris M
ed
ia A
SA3
No
rwa
y SE
B En
skild
a (
32),
Roll
Seve
rin
226
100
226
24 re
gio
na
l an
d lo
ca
l new
spa
pe
rs
C
o A
S’b
an
kru
ptc
y e
sta
te (
19),
Mu
st In
vest
(15
%),
Sch
ibst
ed
Me
dia
Gro
up
(7%
)
1 T
ele
no
r’s m
ed
ia re
ven
ue
in N
orw
ay
is m
ed
ian
orw
ay’
s e
stim
ate
. Th
e w
eb
po
rta
l ABC
Sta
rtsi
de
n in
clu
de
d, r
eve
nu
e
in N
orw
ay
2010
am
ou
nts
to 6
42 M
Euro
, an
d Te
len
or B
roa
dc
ast
’s to
tal (
all
co
un
trie
s) to
1 1
09 M
Euro
. Th
e Te
len
or
gro
up
’s to
tal r
eve
nu
e w
as
11 8
45 M
Euro
. 2
On
th
e N
orw
eg
ian
me
dia
ma
rke
t, th
ere
is s
om
e c
ross
ow
ne
rsh
ip: T
ele
no
r ASA
ow
ns
44%
of A
-pre
sse
n, w
hic
h in
its
tu
rn o
wn
s 50
% o
f th
e T
V 2
Gro
up
. Th
e o
the
r 50
% o
f th
e T
V2
Gro
up
is o
wn
ed
by
Da
nis
h E
gm
on
t. TV
2 G
rou
p’s
re
ven
ue
is in
clu
de
d in
A-p
ress
en
’s a
nd
Eg
mo
nt’s
ac
co
un
ts a
cc
ord
ing
to s
ha
re o
f ow
ne
rsh
ip. (
In J
an
ua
ry 2
012
A-p
ress
en
so
ld it
s sh
are
in th
e T
V 2
Gro
up
to E
gm
on
t, w
hic
h is
no
w fu
ll o
wn
er o
f th
e g
rou
p.)
3 P
ola
ris M
ed
ia is
th
e re
sult
of a
fusi
on
of r
eg
ion
al m
ed
ia h
ou
ses
in 2
008,
with
Sc
hib
ste
d a
s la
rge
st o
wn
er.
In
2009
Sc
hib
ste
d d
ep
osi
ted
mo
st o
f its
sh
are
s in
Po
laris
at
SEB
Ensk
ilda
. Th
e r
ea
son
wa
s th
at
Sch
ibst
ed
wa
s o
rde
red
by
the
Me
dia
Au
tho
rity
to s
ell
do
wn
in P
ola
ris in
co
nn
ec
tion
with
th
e e
sta
blis
hm
en
t o
f new
spa
pe
r g
rou
p M
ed
ia N
org
e. T
he
sh
are
s d
ep
osi
ted
at
SEB
Ensk
ilda
wa
s so
ld in
201
1 to
th
ree
Sw
ed
ish
ne
wsp
ap
er
gro
up
s a
nd
an
inve
stm
en
t co
mp
any
.
Sou
rce
s: C
om
pa
ny a
nn
ua
l re
po
rts,
me
dia
no
rwa
y.
THE NORDIC MEDIA MARKET
NORDICOM 23 Nordic Public Service Media Map 1/2012
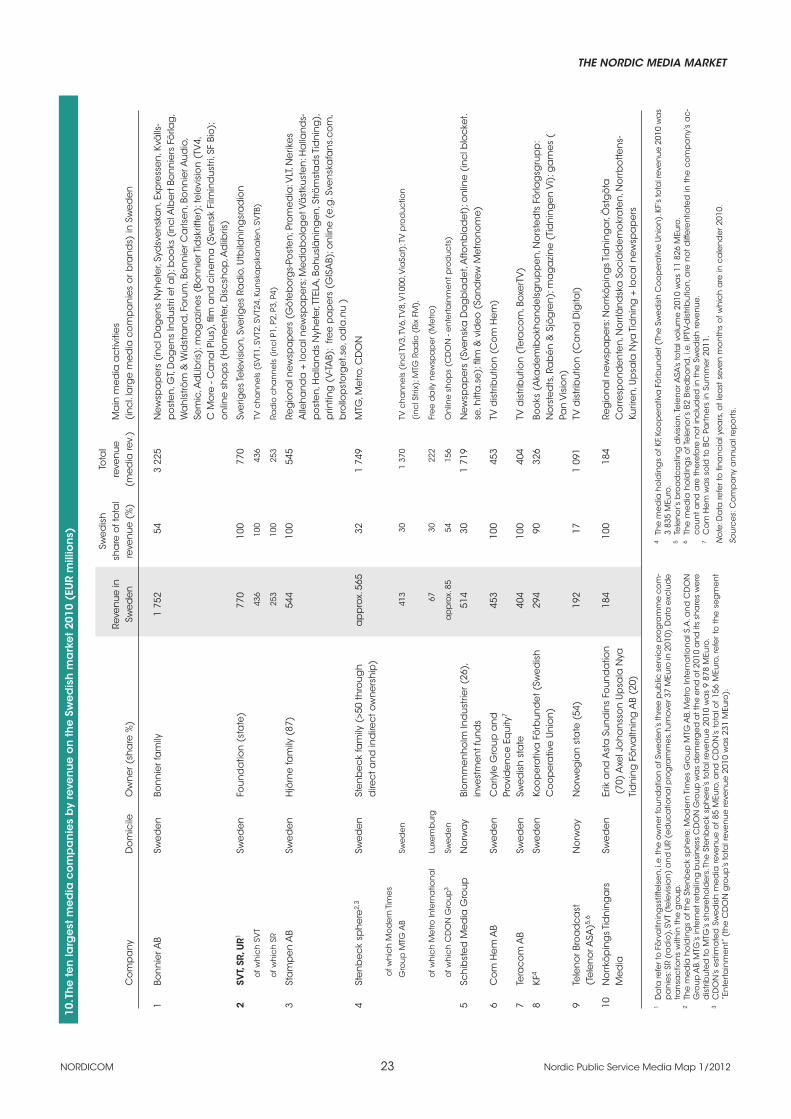
10. T
he
ten
larg
est
me
dia
co
mp
an
ies
by
reve
nue
on
th
e S
we
dis
h m
ark
et
2010
(EU
R m
illio
ns)
Sw
ed
ish
To
tal
Reve
nu
e in
sh
are
of t
ota
l re
ven
ue
M
ain
me
dia
ac
tiviti
es
C
om
pa
ny
Do
mic
ile
Ow
ne
r (sh
are
%)
Swe
de
n
reve
nu
e (
%)
(me
dia
rev.
) (i
nc
l. la
rge
me
dia
co
mp
an
ies
or b
ran
ds)
in S
we
de
n
1 Bo
nn
ier A
B Sw
ed
en
Bo
nn
ier f
am
ily
1 75
2 54
3
225
New
spa
pe
rs (
inc
l Da
ge
ns
Nyh
ete
r, Sy
dsv
en
ska
n, E
xpre
sse
n, K
välls
-
po
ste
n, G
T, D
ag
en
s In
du
stri
et a
l); b
oo
ks (
inc
l Alb
ert
Bo
nn
iers
Fö
rlag
,
Wa
hls
tröm
& W
idst
ran
d, F
oru
m, B
on
nie
r Ca
rlse
n, B
on
nie
r Au
dio
,
Sem
ic, A
dLi
bris
); m
ag
azi
ne
s (B
on
nie
r Tid
skrif
ter)
; te
levi
sio
n (
TV4,
C M
ore
- C
an
al P
lus)
, film
an
d c
ine
ma
(Sv
en
sk F
ilmin
du
stri,
SF
Bio
);
o
nlin
e s
ho
ps
(Ho
me
en
ter,
Dis
csh
op
, Ad
libris
)
2 SV
T, SR
, UR1
Swe
de
n
Fou
nd
atio
n (
sta
te)
770
100
770
Sve
rige
s Te
levi
sio
n, S
verig
es
Rad
io, U
tbild
nin
gsr
ad
ion
of w
hic
h S
VT
436
100
436
TV c
ha
nn
els
(SV
T1, S
VT2
, SV
T24,
Ku
nsk
ap
ska
na
len
, SV
TB)
of w
hic
h S
R
25
3 10
0 25
3 Ra
dio
ch
an
ne
ls (
inc
l P1,
P2,
P3,
P4)
3 St
am
pe
n A
B Sw
ed
en
H
jörn
e fa
mily
(87
) 54
4 10
0 54
5 Re
gio
na
l new
spa
pe
rs (
Gö
teb
org
s-Po
ste
n; P
rom
ed
ia: V
LT, N
erik
es
Alle
ha
nd
a +
loc
al n
ewsp
ap
ers
; Me
dia
bo
lag
et V
äst
kust
en
: Ha
llan
ds-
po
ste
n, H
alla
nd
s N
yhe
ter, T
TELA
, Bo
hu
slä
nin
ge
n, S
tröm
sta
ds
Tid
nin
g),
prin
ting
(V-
TAB)
; fre
e p
ap
ers
(G
ISA
B); o
nlin
e (
e.g
. Sve
nsk
afa
ns.
co
m,
b
rollo
pst
org
et.s
e, o
dla
.nu
)
4 St
en
be
ck
sph
ere
2,3
Swe
de
n
Ste
nb
ec
k fa
mily
(>5
0 th
rou
gh
a
pp
rox.
565
32
1
749
MTG
, Me
tro, C
DO
N
d
irec
t an
d in
dire
ct o
wn
ers
hip
)
of w
hic
h M
od
ern
Tim
es
Gro
up
MTG
AB
Swe
de
n
41
3 30
1
370
TV c
ha
nn
els
(in
cl T
V3,
TV
6, T
V8,
V10
00, V
iaSa
t); T
V p
rod
uc
tion
(i
nc
l Str
ix);
MTG
Ra
dio
(Ri
x FM
),
of w
hic
h M
etro
Inte
rna
tion
al
Luxe
mb
urg
67
30
222
Fre
e d
aily
new
spa
pe
r (M
etro
)
of w
hic
h C
DO
N G
rou
p3
Swe
de
n
a
pp
rox.
85
54
156
On
line
sh
op
s (C
DO
N -
en
tert
ain
me
nt p
rod
uc
ts)
5 Sc
hib
ste
d M
ed
ia G
rou
p
No
rwa
y Bl
om
me
nh
olm
Ind
ust
rier (
26),
51
4 30
1
719
New
spa
pe
rs (
Sve
nsk
a D
ag
bla
de
t, A
fton
bla
de
t); o
nlin
e (
inc
l blo
cke
t.
inve
stm
en
t fu
nd
s
se, h
itta
.se
); fi
lm &
vid
eo
(Sa
nd
rew
Me
tron
om
e)
6 C
om
He
m A
B Sw
ed
en
C
arly
le G
rou
p a
nd
45
3 10
0 45
3 TV
dis
trib
utio
n (
Co
m H
em
)
Pro
vid
en
ce
Eq
uity
7
7 Te
rac
om
AB
Swe
de
n
Swe
dis
h s
tate
40
4 10
0 40
4 TV
dis
trib
utio
n (
Tera
co
m, B
oxe
rTV
)
8 KF
4 Sw
ed
en
Ko
op
era
tiva
Fö
rbu
nd
et (
Swe
dis
h
294
90
326
Boo
ks (
Aka
de
mib
okh
an
de
lsg
rup
pe
n, N
ors
ted
ts F
örla
gsg
rup
p:
C
oo
pe
rativ
e U
nio
n)
N
ors
ted
ts, R
ab
én
& S
jög
ren
); m
ag
azi
ne
(Ti
dn
ing
en
Vi)
; ga
me
s (
Pa
n V
isio
n)
9 Te
len
or B
roa
dc
ast
N
orw
ay
No
rwe
gia
n s
tate
(54
) 19
2 17
1
091
TV d
istr
ibu
tion
(C
an
al D
igita
l)
(T
ele
no
r ASA
)5,6
10
No
rrkö
pin
gs
Tid
nin
ga
rs
Swe
de
n
Erik
an
d A
sta
Su
nd
ins
Fou
nd
atio
n
184
100
184
Reg
ion
al n
ewsp
ap
ers
: No
rrkö
pin
gs
Tid
nin
ga
r, Ö
stg
öta
Me
dia
(70
) A
xel J
oh
an
sso
n U
psa
la N
ya
C
orre
spo
nd
en
ten
, No
rrlä
nd
ska
So
cia
lde
mo
kra
ten
, No
rrb
otte
ns-
Tid
nin
g F
örv
altn
ing
AB
(20)
Kurir
en
, Up
sala
Nya
Tid
nin
g +
loc
al n
ewsp
ap
ers
1 D
ata
refe
r to
Fö
rva
ltnin
gss
tifte
lse
n, i
.e. t
he
ow
ne
r fo
un
da
tion
of S
we
de
n’s
thre
e p
ub
lic s
erv
ice
pro
gra
mm
e c
om
-p
an
ies:
SR
(ra
dio
), SV
T (t
ele
visi
on
) a
nd
UR
(ed
uc
atio
na
l pro
gra
mm
es,
turn
ove
r 37
MEu
ro in
201
0). D
ata
exc
lud
e
tran
sac
tion
s w
ithin
the
gro
up
. 2
Th
e m
ed
ia h
old
ing
s o
f th
e S
ten
be
ck
sph
ere
: Mo
de
rn T
ime
s G
rou
p M
TG A
B, M
etro
Inte
rna
tion
al S
.A. a
nd
CD
ON
G
rou
p A
B. M
TG’s
inte
rne
t re
taili
ng
bu
sin
ess
CD
ON
Gro
up
wa
s d
em
erg
ed
at t
he
en
d o
f 201
0 a
nd
its
sha
res
we
re
dis
trib
ute
d to
MTG
’s s
ha
reh
old
ers
. Th
e S
ten
be
ck
sph
ere
’s to
tal r
eve
nu
e 2
010
wa
s 9
878
MEu
ro.
3 C
DO
N’s
est
ima
ted
Sw
ed
ish
me
dia
reve
nu
e o
f 85
MEu
ro, a
nd
CD
ON
’s to
tal o
f 156
MEu
ro, r
efe
r to
th
e s
eg
me
nt
”En
tert
ain
me
nt”
(th
e C
DO
N g
rou
p’s
tota
l rev
en
ue
reve
nu
e 2
010
wa
s 23
1 M
Euro
).
4 T
he
me
dia
ho
ldin
gs
of K
F, Ko
op
era
tiva
Fö
rbu
nd
et (
The
Sw
ed
ish
Co
op
era
tive
Un
ion
). KF
’s to
tal r
eve
nu
e 2
010
wa
s 3
835
MEu
ro.
5 T
ele
no
r’s b
roa
dc
ast
ing
div
isio
n. T
ele
no
r ASA
’s to
tal v
olu
me
201
0 w
as
11 8
26 M
Euro
.6
Th
e m
ed
ia h
old
ing
s o
f Te
len
or’s
B2
Bre
db
an
d, i
.e. I
PTV-
dis
trib
utio
n, a
re n
ot
diff
ere
ntia
ted
in t
he
co
mp
any
’s a
c-
co
un
t an
d a
re th
ere
fore
no
t in
clu
de
d in
the
Sw
ed
ish
reve
nu
e.
7 C
om
He
m w
as
sold
to B
C P
art
ne
rs in
Su
mm
er 2
011.
No
te: D
ata
refe
r to
fin
an
cia
l ye
ars
, at l
ea
st s
eve
n m
on
ths
of w
hic
h a
re in
ca
len
de
r 201
0.
Sou
rce
s: C
om
pa
ny a
nn
ua
l re
po
rts.

NORDICOM 24 Nordic Public Service Media Map 1/2012
THE NORDIC MEDIA MARKET
11. DR (December 2010)
Note: Unless otherwise indicated, the company is wholly owned (100%). Where no country is specified, the company is located in the same country as the parent company.
Source: Company annual report.
66.6
DR The Danish Broadcasting Corporation in Denmark
Public service broadcaster
(self-governing public institution)
DR Radio Nationwide FM radio channels: P1, P2, P3, P4 11 regional DR-channels (P4) Digital channels via DAB: P1, P2, P3, DR Rock, DR Boogieradio, DR Jazz, DR Nyheder, DR P5, DR Politik/Kulturweekend, DR Oline, DR Dansktop, DR Klassisk, DR Hit, DR Pop DK, DR P5000 A number of web-only channels - - - - - - - - - DR TV Nationwide TV channels: DR1 DR2 DR K (culture, history) DR Ramasjang (children's TV) DR HD (high definition channel) DR Update (news) - - - - - - - - - Website www.dr.dk
I/S Digi-TV Operates the DTT-distribution in the public service multiplexes: MUX1 and MUX2 (co-ownedwith TV 2 Danmark A/S)
© NORDICOM

THE NORDIC MEDIA MARKET
NORDICOM 25 Nordic Public Service Media Map 1/2012
12. TV 2 / Danmark (December 2010)
1 Eight regional windows in TV 2, based on independent stations (independent legal persons).2 The main channel TV 2 has a public service obligation. Other channels are no part of TV 2 / Danmark’s public service activities.3 Part of TV 2 / Danmark’s operations; not separate companies.
Note: Unless otherwise indicated, the company is wholly owned (100%). Where no country is specified, the company is located in the same country as the parent company.
Sources: Company annual report and other company data.
Main channel
33.3
Pay TV channels
51
Other services3
20
TV channels Distribution
Regional TV (public service)1
Other
TV 2 / DANMARK A/S
Denmark
TV 2 2
Nationwide TV channel (public service)
TV 2 / Bornholm TV 2 / Fyn TV 2 / Lorry TV 2 / Nord TV 2 / Østjylland TV 2 Øst TV / Midtvest
TV Networks A/S: • TV 2 Zulu • TV 2 Charlie • TV 2 FILM • TV 2 FILM HD
I/S Digi-TV Operates the DTT distribution in the public service multiplexes: MUX1 and MUX2 (co-owned with DR)
TV 2 DTT A/S
TV 2 / Bornholm TV 2 / Fyn TV 2 / Lorry TV 2 / Nord TV 2 / Østjylland TV 2 Øst TV / Midtvest TV Syd
TV News A/S:
• TV 2 NEWS
TV 2 Sport A/S: • TV 2 SPORT • TV 2 SPORT HD (joint venture with MTG)
TV on demand: TV 2 Sputnik Website www. tv2.dk
East Production A/S Satellite transmission - SNG, Satellite News Gathering
Associated companies (e.g. BilZonen A/S,Vi med hund A/S)
Radio 2 A/S Nationwide radio channel NOVA FM
The Danish state
© NORDICOM

NORDICOM 26 Nordic Public Service Media Map 1/2012
THE NORDIC MEDIA MARKET
13. Yleisradio Oy, YLE (Spring 2011)
1 YLE is a state-owned (99.98%) limited company.
Note: Unless otherwise indicated, the company is wholly owned (100%). Where no country is specified, the company is located in Finland.
Sources: Company annual reports, press releases and other company data
25
YLEISRADIO OY, YLE The Finnish Broadcasting
Company
Public service broadcaster
Radio Nationwide radio channels: YLE Radio 1 YleX YLE Radio Suomi (20 regional windows) YLE Puhe (coverage 90%) YLE Radio Vega (5 regional windows) YLE X3M (Swedish- language, coverage 48%) YLE Sàmi Radio (12 stations in Lapland) DVB radio channels: Ylen Klassinen YLE Mondo Foreign service radio: Radio Finland (YLESAT1 & YLESAT2) Television Nationwide TV channels: YLE TV1 YLE TV2 YLE FST5 (Swedish-language) YLE Teema Satellite TV channel:
TV Finland (in Europe; composed of a selection of YLE and MTV3 domestic programmes) Website: www.yle.fi
Platco Oy Applications and services to digital TV operators
The Finnish state1
© Tuomo Sauri

THE NORDIC MEDIA MARKET
NORDICOM 27 Nordic Public Service Media Map 1/2012
14. Ríkisútvarpið ohf., RÚV (December 2010)
Note: Unless otherwise indicated, the company is wholly owned (100%). Where no country is specified, the company is located in the same country as the parent company. Simplified picture.
Sources: Company annual reports, press releases and other company data.
Radio Television Web media
The Icelandic State
2 nationwide radio general interest channels: Rás 1 Rás 2 Digital channel: Rondó (classical and jazz music)
Nationwide TV channel: Sjónvarpið (RÚV TV)
Web and teletext service: ruv.is Textavarp
RÍKISÚTVARPIÐ ohf., RÚV The National Broadcasting
Corporation in Iceland
Public service broadcaster
© Ragnar Karlsson

NORDICOM 28 Nordic Public Service Media Map 1/2012
THE NORDIC MEDIA MARKET
15. Norsk rikskringkasting AS, NRK (February 2012)
1 Of which NRK Alltid Nyheter (news) and NRK mp3 (youth radio) also have widespread FM distribution.2 Co-owners are TV 2 Group and Telenor, with one-third each.3 Co-owners are TV 2 Group and MTG (Modern Times Group), with one-third each.4 Co-owners are P4 (MTG) and SBS Radio (ProSiebenSat.1), with one-third each.
Note: Unless otherwise indicated, the company is wholly owned (100%). Where no country is specified, the company is located in the same country as the parent company.
Sources: NRK, company annual report and website.
33.3
33.3
33.3
33.3
10.5
The Norwegian state
NORSK RIKSKRING- KASTING AS, NRK
The Norwegian Broadcasting Corporation in Norway
Public service broadcaster
NRK Aktivum AS NRK 's company for commercial activities (e.g. sales of programmes, book publishing & interactive activities)
NTB, Norsk Telegrambyrå News service
Radio Nationwide radio channels: NRK P1 NRK P2 NRK P3 16 regional windows in P1 A number of digital (DAB and web) channels1 Television Nationwide TV channels: NRK 1 NRK 2 NRK 3 / NRK Super (youth's / children's TV) 12 regional windows in NRK 1 and NRK 2 Website: www.nrk.no
(incl. weather service yr.no)
Norges Televisjon AS 2 (NTV) Owns and operates the digital terrestrial network
RiksTV AS 2
Pay-tv operator in the digital terrestrial network
Norges mobil-tv AS 3 (NMTV) Mobile-TV services
Digitalradio Norge AS 4 Digital radio development
© NORDICOM

THE NORDIC MEDIA MARKET
NORDICOM 29 Nordic Public Service Media Map 1/2012
16. The Swedish public service group: SR, SVT and UR (February 2011)
1 The board of the Foundation (Förvaltningsstyrelsen) is appointed by the Government. The boards and chairpersons of of SR, SVT and UR are appointed by shareholders’ general meeting.
2 The TV-channel Kunskapskanalen is operated jointly by SVT and UR.3 Simulcast.
Note: Unless otherwise indicated, the company is wholly owned (100%). Where no country is specified, the company is located in the same country as the parent company.
Sources: Company annual reports and websites.
24
1643
5
Sveriges Radio AB, SR
The Swedish Broadcasting Corporation
Nationwide TV channels:SVT1SVT2 SVT24SVTB (children's TV)Kunskapskanalen2
SVT HD3
11 regional windows in SVT2
SVT World (satellite channel for viewers outside Sweden)
www.svt.se
Mediamätning i Skandinavien AB (MMS)TV ratings
Nationwide radio channels:P1, P2, P3, P4
28 regional/local channels
A number of digital channels (DAB & web) plus special web-only channels
www.sverigesradio.se
Radio and TV production (broadcast by SVT and SR)
TV: Kunskapskanalen2
www.ur.se
Radiotjänst i Kiruna AB (RIKAB)Collects TV licence fees
Sveriges Radio Förvaltnings ABService and support functions to SR, SVT and UR
Förvaltningsstiftelsen för Sveriges Radio AB,
Sveriges Television AB andSveriges Utbildningsradio AB1
Owner foundation for the public service broadcasting companies in Sweden
Sveriges Television AB, SVT
Swedish Television
Sveriges Utbildnings-radio AB, UR
The Swedish Educational Broadcasting Company
© NORDICOM

31
Public service funding
Table 1 The public service funding systems in Denmark, Finland, Iceland, Norway and Sweden 2011 32
Table 2 Distribution of licence fee to different organisations, projects or departments (per cent)
2.1 Denmark: Distribution of licence fee between DR, TV 2 Danmark regional TV and other organisations 2009-2011 33
2.2 Iceland: Distribution of media tax revenue between RÚV radio and RÚV TV operations 2010 33
2.3 Sweden: Distribution of licence fee between the public service companies SVT, SR and UR 2010 33
Table 3 Total licence fee revenue by organization 2000-2010 (millions in Euro and national currencies) 34
Table 4 TV and radio annual licence fee 2000-2011 (in Euro and national currencies) 35
Public service companies’ economy
Table 5 Nordic public service broadcasters’ revenue, costs and results 2000-2010 in Euro
5.1 Danish public service broadcasters’ revenue, costs and results 2000-2010 36
5.2 The Finnish public service broadcaster’s revenue, costs and result 2000-2010 37
5.3 The Icelandic public service broadcaster’s revenue, costs and result 2000-2010 37
5.4 The Norwegian public service broadcaster’s revenue, costs and result 2000-2010 38
5.5 Swedish public service broadcasters’ revenue, costs and results 2000-2010 38
Table 6 Nordic public service broadcasters’ revenue, costs and results 2000-2010 in national currencies
6.1 Danish public service broadcasters’ revenue, costs and results 2000-2010 39
6.2 The Finnish public service broadcaster’s revenue, costs and result 2000-2010 40
6.3 The Icelandic public service broadcaster’s revenue, costs and result 2000-2010 40
6.4 The Norwegian public service broadcaster’s revenue, costs and result 2000-2010 41
6.5 Swedish public service broadcasters’ revenue, costs and results 2000-2010 41
Table 7 Public service broadcasters’ operating revenue by source of revenue 2000-2010 (per cent) 42
Advertising revenue
Table 8 Media advertising revenue the Nordic countries 2000-2010 (Euro, national currency and market shares)
8.1 Media advertising revenue in Denmark 2000-2010 44
8.2 Media advertising revenue in Finland 2000-2010 45
8.3 Media advertising revenue in Iceland 2000-2010 46
8.4 Media advertising revenue in Norway 2005-2010 47
8.5 Media advertising revenue in Sweden 2000-2010 48
Revenue trends
Table 9 Trends in TV and radio revenue in the Nordic countries 2005-2010 (EUR millions) 49
Figure 10 Trends in TV and radio revenue in the Nordic countries 2005-2010 (EUR millions) 50
Financing
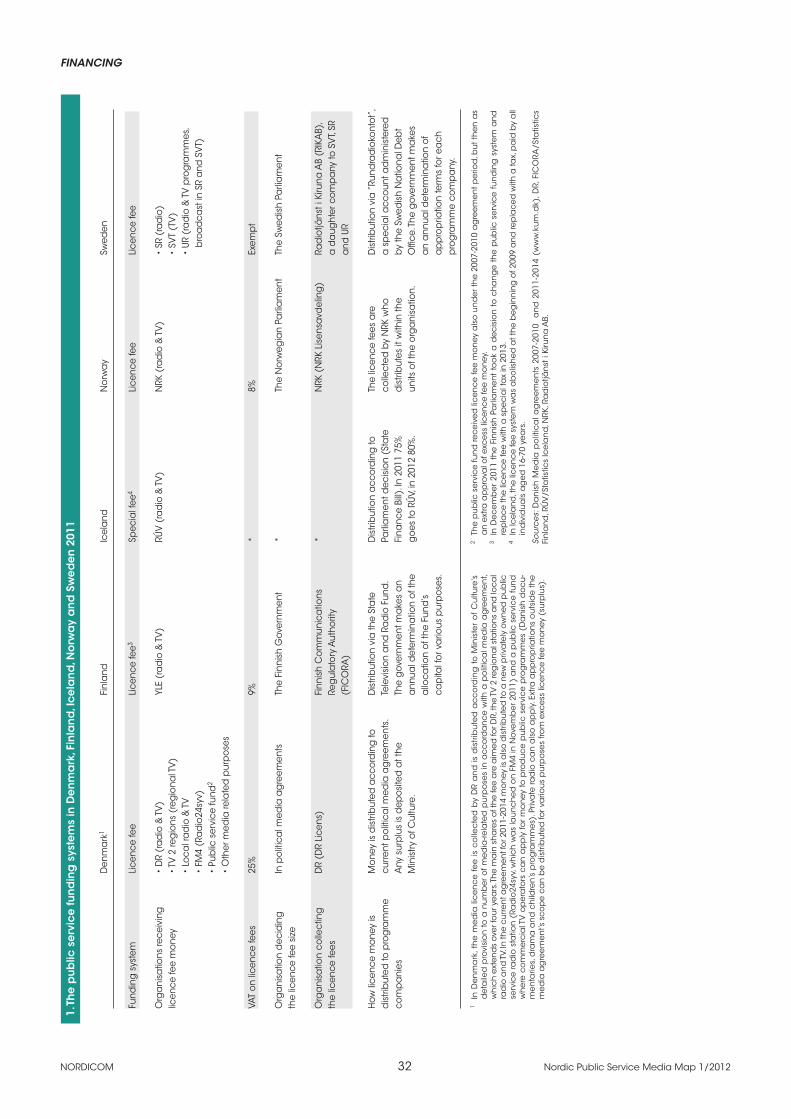
NORDICOM 32 Nordic Public Service Media Map 1/2012
FINANCING1.
Th
e p
ub
lic s
erv
ice
fun
din
g s
yste
ms
in D
en
ma
rk, F
inla
nd
, Ic
ela
nd
, No
rwa
y a
nd
Sw
ed
en
201
1
D
enm
ark
1 Fi
nla
nd
Icel
and
N
orw
ay
Swed
en
Fund
ing
sys
tem
Li
cenc
e fe
e Li
cenc
e fe
e3 Sp
ecia
l fee
4 Li
cenc
e fe
e Li
cenc
e fe
e
Org
ani
satio
ns re
ceiv
ing
•
DR
(ra
dio
& T
V)
YLE
(ra
dio
& T
V)
RÚV
(ra
dio
& T
V)
NRK
(ra
dio
& T
V)
• SR
(ra
dio
)lic
ence
fee
mon
ey
• TV
2 re
gio
ns (
reg
iona
l TV
)
• SV
T (T
V)
•
Loca
l ra
dio
& T
V
•
UR (
rad
io &
TV
pro
gra
mm
es,
•
FM4
(Ra
dio
24sy
v)
bro
ad
cast
in S
R a
nd S
VT)
•
Pub
lic s
ervi
ce fu
nd2
•
Oth
er m
edia
rela
ted
pur
pos
es
VAT
on li
cenc
e fe
es
25%
9%
*
8%
Exem
pt
Org
ani
satio
n d
ecid
ing
In
pol
itica
l med
ia a
gre
emen
ts
The
Finn
ish
Gov
ernm
ent
* Th
e N
orw
egia
n Pa
rlia
men
t Th
e Sw
edis
h Pa
rlia
men
tth
e lic
ence
fee
size
Org
ani
satio
n co
llect
ing
D
R (D
R Li
cens
) Fi
nnis
h C
omm
unic
atio
ns
* N
RK (
NRK
Lis
ensa
vdel
ing
) Ra
dio
tjäns
t i K
iruna
AB
(RIK
AB)
,th
e lic
ence
fees
Reg
ula
tory
Aut
horit
y
a
da
ught
er c
omp
any
to S
VT,
SR
(F
ICO
RA)
and
UR
How
lice
nce
mon
ey is
M
oney
is d
istri
but
ed a
ccor
din
g to
D
istri
but
ion
via
the
Sta
te
Dis
trib
utio
n a
ccor
din
g to
Th
e lic
ence
fees
are
D
istri
but
ion
via
”Ru
ndra
dio
kont
ot”,
dis
trib
uted
to p
rog
ram
me
curre
nt p
oliti
cal m
edia
ag
reem
ents
. Te
levi
sion
and
Ra
dio
Fun
d.
Parli
am
ent d
ecis
ion
(Sta
te
colle
cted
by
NRK
who
a
sp
ecia
l acc
ount
ad
min
iste
red
com
pa
nies
A
ny s
urp
lus
is d
epos
ited
at t
he
The
gov
ernm
ent m
ake
s a
n Fi
nanc
e Bi
ll). I
n 20
11 7
5%
dis
trib
utes
it w
ithin
the
by
the
Swed
ish
Na
tiona
l Deb
t
Min
istr
y of
Cul
ture
. a
nnua
l det
erm
ina
tion
of th
e g
oes
to R
ÚV, i
n 20
12 8
0%.
units
of t
he o
rga
nisa
tion.
O
ffice
. The
gov
ernm
ent m
ake
s
a
lloca
tion
of th
e Fu
nd’s
a
n a
nnua
l det
erm
ina
tion
of
ca
pita
l for
va
rious
pur
pos
es.
ap
pro
pria
tion
term
s fo
r ea
ch
p
rog
ram
me
com
pa
ny.
1 In
De
nm
ark
, th
e m
ed
ia li
ce
nc
e f
ee
is c
olle
cte
d b
y D
R a
nd
is d
istr
ibu
ted
ac
co
rdin
g t
o M
inis
ter
of
Cu
lture
’s
de
taile
d p
rovi
sio
n to
a n
um
be
r o
f me
dia
-rela
ted
pu
rpo
ses
in a
cc
ord
an
ce
with
a p
olit
ica
l me
dia
ag
ree
me
nt,
wh
ich
ext
en
ds
ove
r fo
ur y
ea
rs. T
he
ma
in s
ha
res
of t
he
fee
are
aim
ed
for D
R, th
e T
V 2
reg
ion
al s
tatio
ns
an
d lo
ca
l ra
dio
an
d T
V. In
the
cu
rren
t ag
ree
me
nt f
or 2
011-
2014
mo
ney
is a
lso
dis
trib
ute
d to
a n
ew p
riva
tely
ow
ne
d p
ub
lic
serv
ice
rad
io s
tatio
n (
Rad
io24
syv,
wh
ich
wa
s la
un
ch
ed
on
FM
4 in
No
vem
be
r 20
11)
an
d a
pu
blic
se
rvic
e fu
nd
w
he
re c
om
me
rcia
l TV
op
era
tors
ca
n a
pp
ly fo
r m
on
ey to
pro
du
ce
pu
blic
se
rvic
e p
rog
ram
me
s (D
an
ish
do
cu
-m
en
tarie
s, d
ram
a a
nd
ch
ildre
n’s
pro
gra
mm
es)
. Priv
ate
rad
io c
an
als
o a
pp
ly. E
xtra
ap
pro
pria
tion
s o
uts
ide
th
e
me
dia
ag
ree
me
nt’s
sc
op
e c
an
be
dis
trib
ute
d fo
r va
riou
s p
urp
ose
s fro
m e
xce
ss li
ce
nc
e fe
e m
on
ey (
surp
lus)
.
2 T
he
pu
blic
se
rvic
e fu
nd
rec
eiv
ed
lic
en
ce
fee
mo
ney
als
o u
nd
er
the
200
7-20
10 a
gre
em
en
t pe
riod
, bu
t th
en
as
an
ext
ra a
pp
rova
l of e
xce
ss li
ce
nc
e fe
e m
on
ey.
3 I
n D
ec
em
be
r 20
11 t
he
Fin
nis
h P
arli
am
en
t to
ok
a d
ec
isio
n t
o c
ha
ng
e t
he
pu
blic
se
rvic
e f
un
din
g s
yste
m a
nd
re
pla
ce
the
lic
en
ce
fee
with
a s
pe
cia
l ta
x in
201
3.4
In
Ice
lan
d, t
he
lic
en
ce
fee
sys
tem
wa
s a
bo
lish
ed
at t
he
be
gin
nin
g o
f 200
9 a
nd
rep
lac
ed
with
a ta
x, p
aid
by
all
ind
ivid
ua
ls a
ge
d 1
6-70
ye
ars
.
Sou
rce
s: D
an
ish
Me
dia
po
litic
al a
gre
em
en
ts 2
007-
2010
a
nd
201
1-20
14 (
ww
w.k
um
.dk)
, DR,
FIC
ORA
/Sta
tistic
s Fi
nla
nd
, RÚ
V/S
tatis
tics
Ice
lan
d, N
RK, R
ad
iotjä
nst
i Ki
run
a A
B.

FINANCING
NORDICOM 33 Nordic Public Service Media Map 1/2012
2. Distribution of licence fee to different organisations, projects or departments (per cent)
2.1 Denmark: Distribution of licence fee between DR, TV 2 Danmark regional TV and other organisations 2009-2011
Shares (%)
Organisation/Project 2009 2010 2011
DR 87.1 87.7 83.3
TV 2/Danmark regional TV stations 10.8 10.8 11.1
Local radio and TV (non-commercial) 1.3 1.3 1.1
Public service fund1 – – 0.9
Operating grants to FM4 (Radio24syv) - upper frame2 – – 2.4
Public value tests of DR new media services – – 0.2
Other3 0.8 0.3 0.9
Total 100 100 100
1 The public service fund received license fee money even before 2011, but then as an extra approval of excess license fee money.2 Private public service radio channel, which started in November 2011.3 The Danish Agency for Libraries and Media, Media Statistics Project, The Danish Film Institute, etc.
Note: Distribution as agreed on in the political media agreements. Extra appropriation of excess licence fee money can be made during the period.
Sources: Media political agreements 2007-2010 and 2011-2014.
2.2 Iceland: Distribution of media tax revenue between RÚV radio and RÚV TV operations 2010
Organisation Shares (%)
RÚV TV 67
RÚV Radio 33
Total 100
Source: RÚV/Statistics Iceland.
2.3 Sweden: Distribution of licence fee between the public service companies SVT, SR and UR 2010
Organisation Shares (%)
SVT (television) 58
SR (radio) 37
UR (radio and TV programmes) 5
Total 100
Note: Distribution of licence fee according to the government’s allocation decision.
Source: Radiotjänst i Kiruna AB.
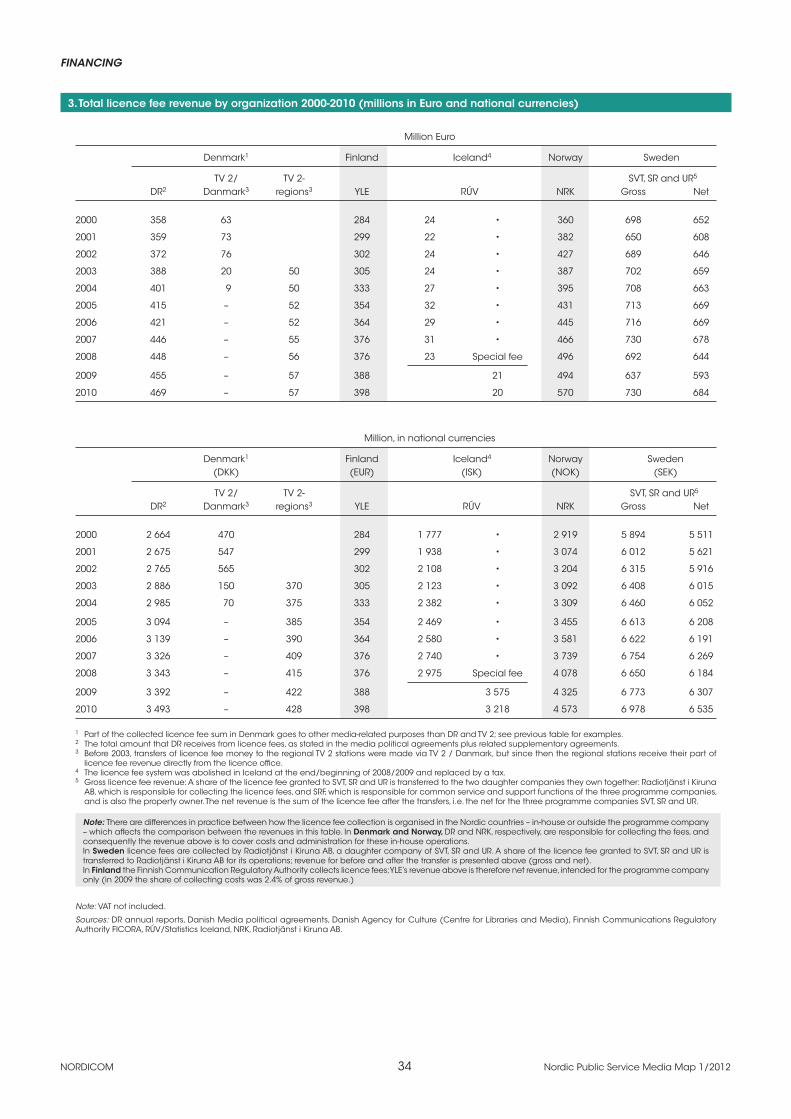
NORDICOM 34 Nordic Public Service Media Map 1/2012
FINANCING
3. Total licence fee revenue by organization 2000-2010 (millions in Euro and national currencies)
Million Euro
Denmark1 Finland Iceland4 Norway Sweden
TV 2/ TV 2- SVT, SR and UR5
DR2 Danmark3 regions3 YLE RÚV NRK Gross Net
2000 358 63 284 24 • 360 698 652
2001 359 73 299 22 • 382 650 608
2002 372 76 302 24 • 427 689 646
2003 388 20 50 305 24 • 387 702 659
2004 401 9 50 333 27 • 395 708 663
2005 415 – 52 354 32 • 431 713 669
2006 421 – 52 364 29 • 445 716 669
2007 446 – 55 376 31 • 466 730 678
2008 448 – 56 376 23 Special fee 496 692 644
2009 455 – 57 388 21 494 637 593
2010 469 – 57 398 20 570 730 684
Million, in national currencies
Denmark1 Finland Iceland4 Norway Sweden (DKK) (EUR) (ISK) (NOK) (SEK)
TV 2/ TV 2- SVT, SR and UR5
DR2 Danmark3 regions3 YLE RÚV NRK Gross Net
2000 2 664 470 284 1 777 • 2 919 5 894 5 511
2001 2 675 547 299 1 938 • 3 074 6 012 5 621
2002 2 765 565 302 2 108 • 3 204 6 315 5 916
2003 2 886 150 370 305 2 123 • 3 092 6 408 6 015
2004 2 985 70 375 333 2 382 • 3 309 6 460 6 052
2005 3 094 – 385 354 2 469 • 3 455 6 613 6 208
2006 3 139 – 390 364 2 580 • 3 581 6 622 6 191
2007 3 326 – 409 376 2 740 • 3 739 6 754 6 269
2008 3 343 – 415 376 2 975 Special fee 4 078 6 650 6 184
2009 3 392 – 422 388 3 575 4 325 6 773 6 307
2010 3 493 – 428 398 3 218 4 573 6 978 6 535
1 Part of the collected licence fee sum in Denmark goes to other media-related purposes than DR and TV 2; see previous table for examples.2 The total amount that DR receives from licence fees, as stated in the media political agreements plus related supplementary agreements.3 Before 2003, transfers of licence fee money to the regional TV 2 stations were made via TV 2 / Danmark, but since then the regional stations receive their part of
licence fee revenue directly from the licence office. 4 The licence fee system was abolished in Iceland at the end/beginning of 2008/2009 and replaced by a tax.5 Gross licence fee revenue: A share of the licence fee granted to SVT, SR and UR is transferred to the two daughter companies they own together: Radiotjänst i Kiruna
AB, which is responsible for collecting the licence fees, and SRF, which is responsible for common service and support functions of the three programme companies, and is also the property owner. The net revenue is the sum of the licence fee after the transfers, i.e. the net for the three programme companies SVT, SR and UR.
Note: There are differences in practice between how the licence fee collection is organised in the Nordic countries – in-house or outside the programme company – which affects the comparison between the revenues in this table. In Denmark and Norway, DR and NRK, respectively, are responsible for collecting the fees, and consequently the revenue above is to cover costs and administration for these in-house operations.In Sweden licence fees are collected by Radiotjänst i Kiruna AB, a daughter company of SVT, SR and UR. A share of the licence fee granted to SVT, SR and UR is transferred to Radiotjänst i Kiruna AB for its operations; revenue for before and after the transfer is presented above (gross and net).In Finland the Finnish Communication Regulatory Authority collects licence fees; YLE’s revenue above is therefore net revenue, intended for the programme company only (in 2009 the share of collecting costs was 2.4% of gross revenue.)
Note: VAT not included.
Sources: DR annual reports, Danish Media political agreements, Danish Agency for Culture (Centre for Libraries and Media), Finnish Communications Regulatory Authority FICORA, RÚV/Statistics Iceland, NRK, Radiotjänst i Kiruna AB.

FINANCING
NORDICOM 35 Nordic Public Service Media Map 1/2012
4. T
V a
nd
rad
io a
nnu
al l
ice
nc
e fe
e 2
000-
2011
(in
Eu
ro a
nd
na
tion
al c
urr
en
cie
s)
Eu
ro
Na
tion
al c
urre
nc
ies
D
en
ma
rk1
Fin
lan
d2
Ic
ela
nd
3
No
rwa
y4 Sw
ed
en
Yea
r D
en
ma
rk1
Fin
lan
d2
Ice
lan
d3
N
orw
ay4
Swe
de
n
(DKK
) (E
UR)
(IS
K)
(N
OK)
(S
EK)
2000
25
4 15
7 34
7 *
202
195
1 89
4 15
7 25
200
*
1 64
0 1
644
2001
26
6 16
5 30
9 *
213
180
1 97
8 16
5 27
000
*
1 71
5 1
668
2002
27
7 16
5 31
3 *
236
190
2 05
8 16
5 27
000
*
1 77
5 1
740
2003
28
0 16
5 33
3 *
231
198
2 08
0 16
5 28
896
*
1 85
0 1
812
2004
28
4 18
7 37
2 *
228
205
2 11
0 18
7 32
460
*
1 91
0 1
872
2005
27
4 19
4 41
5 *
246
207
2 04
0 19
4 32
460
*
1 96
9 1
920
2006
28
0 20
1 40
0 *
253
213
2 09
0 20
1 35
052
*
2 03
9 1
968
2007
28
9 20
8 37
6 *
262
216
2 15
0 20
8 32
904
*
2 10
4 1
996
2008
29
4 21
5 28
2 Sp
ec
ial f
ee
26
8 21
1 2
190
215
35 9
40
Spe
cia
l fe
e
2 20
2 2
032
2009
29
8 22
4 *
100
267
195
2 22
0 22
4 *
17 2
00
2 33
5 2
076
2010
30
3 23
1 *
106
305
217
2 26
0 23
1 *
17 2
00
2 43
4 2
076
2011
30
9 24
5 *
111
318
230
2 30
0 24
5 *
17 9
00
2 47
8 2
076
1 F
ee
for c
olo
ur T
V u
ntil
200
6. F
rom
200
7: m
ed
ia li
ce
nc
e fe
e, w
hic
h c
ove
rs a
ll d
evic
es
in a
po
sitio
n to
rec
eiv
e p
ictu
re
pro
gra
mm
es
an
d s
erv
ice
s, in
clu
din
g c
om
pu
ters
an
d c
ert
ain
ce
ll p
ho
ne
s. Th
e ’r
ad
io o
nly
’ fe
e is
320
DKK
/ye
ar
(43
Euro
) si
nc
e 2
004.
VA
T in
clu
de
d (
25%
).2
VA
T in
clu
de
d: 2
000-
2008
8%
, fro
m 2
010
9%.
3 L
ice
nc
e f
ee
fo
r c
olo
ur T
V u
ntil
200
8, p
aid
pe
r h
ou
seh
old
. VA
T in
clu
de
d: 1
4%, f
rom
Ma
rch
200
7-20
08 7
%. T
he
lic
en
ce
fee
sys
tem
wa
s a
bo
lish
ed
in Ic
ela
nd
at
the
be
gin
nin
g o
f 200
9 a
nd
rep
lac
ed
by
a ta
x, p
aid
by
all
ind
i-vi
du
als
ag
ed
16-
70 y
ea
rs.
4 V
AT
inc
lud
ed
fro
m 2
003
on
(fro
m 1
2 to
8%
). TV
-lic
en
ce
fee
wa
s p
revi
ou
sly
VAT-
exe
mp
t in
No
rwa
y.
No
te: Y
ea
rly fe
e. V
AT
inc
lud
ed
, exc
ep
t fo
r Sw
ed
en
wh
ere
th
e fe
e is
VA
T-ex
em
pt.
For
de
tails
, se
e c
ou
ntr
y n
ote
s. Fe
e
is p
aid
for a
ll d
evic
es
in a
po
sitio
n to
rec
eiv
e T
V b
roa
dc
ast
s.
Sou
rce
s: D
R, F
ICO
RA/S
tatis
tics
Fin
lan
d, R
ÚV
/Sta
tistic
s Ic
ela
nd
, NRK
, Ra
dio
tjän
st i
Kiru
na
AB.

NORDICOM 36 Nordic Public Service Media Map 1/2012
FINANCING
5. Nordic public service broadcasters’ revenue, costs and results 2000-2010 in Euro
5.1 Danish public service broadcasters’ revenue, costs and results 2000-2010 (EUR millions)
2000 2001 2002 2003 2004 2005 2006 2007 2008 2009 2010
DR TV and radio
Operating revenue
Licence fees1 358 359 372 388 401 415 421 446 448 455 469
Other 35 33 30 37 41 43 36 39 44 49 49
Total 392 392 403 425 442 458 457 486 492 505 518
Operating costs2
Programme acquisitions 29 25
Other costs 120 129
Production costs, royalties, etc. 97 101 128 119 114 117 124 129 123
Other external costs 61 61 59 57 77 66 82 74 77
Personnel 222 213 230 223 235 241 241 257 240 246 247
Write-offs, depreciation 19 13 20 20 28 28 42 47 50 52 53
Total 390 381 407 405 449 446 475 487 496 500 500
Operating result 2 12 -4 21 -7 12 -18 -1 -4 5 18
TV 2/Danmark3
Operating revenue
Advertising, net 146 135 138 161 176 191 213 226 214 164 177
Licence fee 60 72 75 20 9 0 0 0 0 0 0
Cable revenue4 * * * 14 16 26 34 57 62 83 86
Other revenue 13 9 10 9 12 12 19 22 20 26 25
Total 220 216 223 204 213 5 229 265 305 296 272 288
Operating costs
Transfers to TV 2 regional stations6 45 46 47 * * * * * * * *
Programme costs 92 89 93 92 111 113 126 139 137 139 148
Personnel 38 41 43 47 49 57 63 90 78 79 83
Other 26 23 24 27 29 31 46 55 46 38 33
Repayment of excess compensation * * * * 144 0 0 0 0 0 0
Total 201 199 206 165 333 201 231 285 261 256 265
Operating result 19 17 17 39 -120 28 31 20 35 16 23
The regional TV 2 stations7
Revenue: Licence fee6 * * * 50 50 52 52 55 56 57 58
1 The total amount that DR receives from licence fees, as stated in the media political agreements plus related supplementary agreements. 2 Accounting procedures changed in 2002.3 Data through 2002 refer to the self-governing institution TV 2/Danmark; data from 2003 on refer to the state-owned limited company TV 2/Danmark A/S. Only TV 2/
Danmark’s main channel,TV 2, is public service, but economic data above refer to the whole company.4 Revenue from TV 2’s pay-TV channels TV 2/NEWS, TV 2/ZULU, TV 2/CHARLIE, TV 2/SPORT and TV 2/FILM.5 The revenue figures from 2004 are not entirely comparable to earlier data due to a change in accounting procedures. The adjusted (comparable) figure for 2003 is
205.7 million Euro.6 Before 2003 transfers of licence fee money were made via TV 2/Danmark, but since then the regional stations receive their part of licence fee revenue directly via
the licence office.7 Eight regional TV 2 stations, which are independent legal persons.
Sources: DR annual reports, TV 2/Danmark annual reports, Media political agreements 2001-2006 and 2007-2010, Danish Agency for Culture (Centre for Libraries and Media).
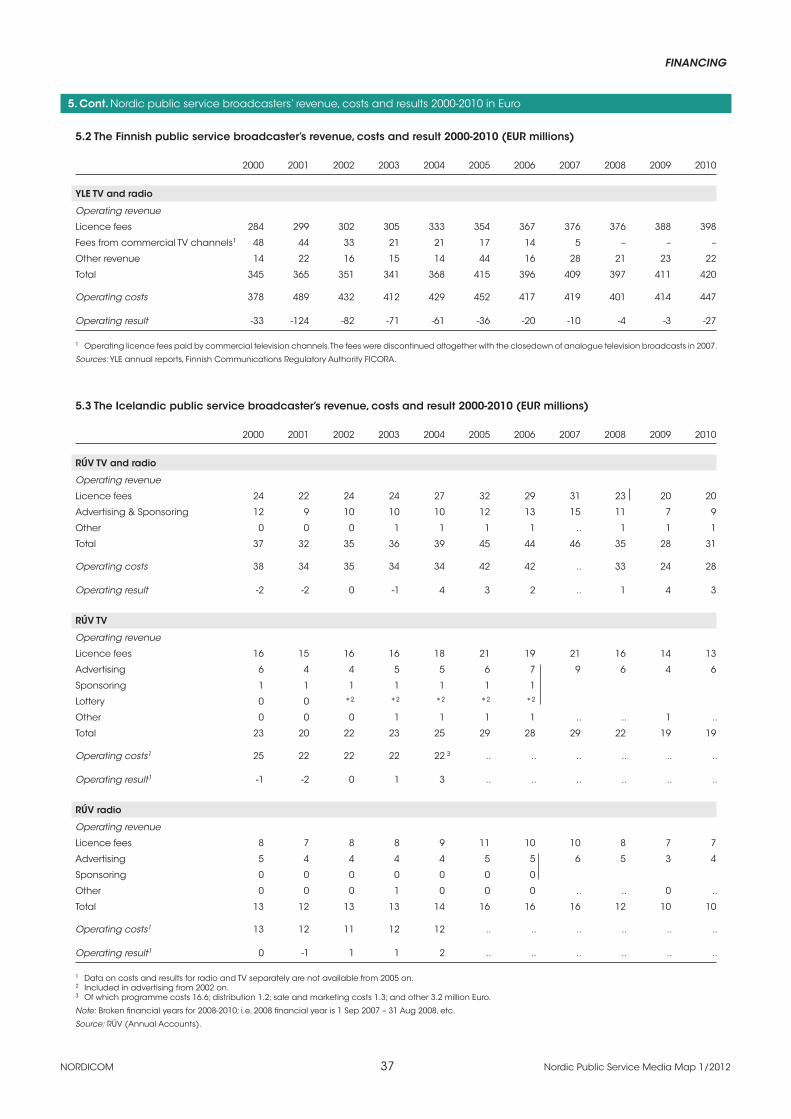
FINANCING
NORDICOM 37 Nordic Public Service Media Map 1/2012
5. Cont. Nordic public service broadcasters’ revenue, costs and results 2000-2010 in Euro
5.2 The Finnish public service broadcaster’s revenue, costs and result 2000-2010 (EUR millions)
2000 2001 2002 2003 2004 2005 2006 2007 2008 2009 2010
YLE TV and radio
Operating revenue
Licence fees 284 299 302 305 333 354 367 376 376 388 398
Fees from commercial TV channels1 48 44 33 21 21 17 14 5 – – –
Other revenue 14 22 16 15 14 44 16 28 21 23 22
Total 345 365 351 341 368 415 396 409 397 411 420
Operating costs 378 489 432 412 429 452 417 419 401 414 447
Operating result -33 -124 -82 -71 -61 -36 -20 -10 -4 -3 -27
1 Operating licence fees paid by commercial television channels. The fees were discontinued altogether with the closedown of analogue television broadcasts in 2007.
Sources: YLE annual reports, Finnish Communications Regulatory Authority FICORA.
5.3 The Icelandic public service broadcaster’s revenue, costs and result 2000-2010 (EUR millions)
2000 2001 2002 2003 2004 2005 2006 2007 2008 2009 2010
RÚV TV and radio
Operating revenue
Licence fees 24 22 24 24 27 32 29 31 23 20 20
Advertising & Sponsoring 12 9 10 10 10 12 13 15 11 7 9
Other 0 0 0 1 1 1 1 .. 1 1 1
Total 37 32 35 36 39 45 44 46 35 28 31
Operating costs 38 34 35 34 34 42 42 .. 33 24 28
Operating result -2 -2 0 -1 4 3 2 .. 1 4 3
RÚV TV
Operating revenue
Licence fees 16 15 16 16 18 21 19 21 16 14 13
Advertising 6 4 4 5 5 6 7 9 6 4 6
Sponsoring 1 1 1 1 1 1 1
Lottery 0 0 *2 *2 *2 *2 *2
Other 0 0 0 1 1 1 1 .. .. 1 ..
Total 23 20 22 23 25 29 28 29 22 19 19
Operating costs1 25 22 22 22 22 3 .. .. .. .. .. ..
Operating result1 -1 -2 0 1 3 .. .. .. .. .. ..
RÚV radio
Operating revenue
Licence fees 8 7 8 8 9 11 10 10 8 7 7
Advertising 5 4 4 4 4 5 5 6 5 3 4
Sponsoring 0 0 0 0 0 0 0
Other 0 0 0 1 0 0 0 .. .. 0 ..
Total 13 12 13 13 14 16 16 16 12 10 10
Operating costs1 13 12 11 12 12 .. .. .. .. .. ..
Operating result1 0 -1 1 1 2 .. .. .. .. .. ..
1 Data on costs and results for radio and TV separately are not available from 2005 on.2 Included in advertising from 2002 on.3 Of which programme costs 16.6; distribution 1.2; sale and marketing costs 1.3; and other 3.2 million Euro.
Note: Broken financial years for 2008-2010; i.e. 2008 financial year is 1 Sep 2007 – 31 Aug 2008, etc.
Source: RÚV (Annual Accounts).

NORDICOM 38 Nordic Public Service Media Map 1/2012
FINANCING
5. Cont. Nordic public service broadcasters’ revenue, costs and results 2000-2010 in Euro
5.4 The Norwegian public service broadcaster’s revenue, costs and result 2000-2010 (EUR millions)
2000 2001 2002 2003 2004 2005 2006 2007 2008 2009 2010
NRK TV and radio
Operating revenue
Licence fees 360 382 427 387 395 431 445 466 496 494 570
Other revenue 31 21 29 44 46 30 38 34 33 28 36
Total 391 402 456 431 441 461 482 500 529 522 606
Operating costs 413 411 466 432 430 463 485 523 1 541 524 600
Operating result -23 -9 -11 -1 11 -2 -2 -23 -11 -2 6
1 The apparent rise in costs in 2007 is due in part to changes in accounting rules pertaining to pensions.
Note: Figures refer to the NRK group, which means that NRK’s subsidiary NRK Aktivum is included. NRK Aktivum handles all commercial activities within NRK, e.g. royalties and sale of production resources, sales of archive material and programmes, etc.
Source: NRK annual reports.
5.5 Swedish public service broadcasters’ revenue, costs and results 2000-2010 (EUR millions)
2000 2001 2002 2003 2004 2005 2006 2007 2008 2009 2010
SVT
Operating revenue
Licence fees 383 377 382 389 411 420 402 405 380 332 405
Other revenue, of which: 41 33 29 31 34 29 40 30 31 26 30
royalties 16 15 13 13 19 13 19 11 10 13 12
technical services 6 5 4 5 3 3 5 3 4 2 4
sponsoring 4 3 5 3 5 3 5 4 4 2 4
miscellaneous 15 9 7 10 7 10 11 12 14 9 10
Total 424 410 411 419 445 450 443 435 411 358 435
Operating costs 404 415 417 424 450 444 444 431 409 357 430
Operating result 20 -5 -6 -5 -5 6 -1 4 2 1 4
SR
Operating revenue
Licence fees 189 216 229 235 224 230 239 233 221 208 246
Other revenue 6 6 5 5 6 6 6 7 7 6 6
Total 195 222 234 240 231 235 245 240 228 214 252
Operating costs 201 1 221 234 237 234 237 246 244 230 225 239
Operating result -6 1 0 3 -3 -2 0 -5 -2 -11 14
UR
Operating revenue
Licence fees 30 28 30 32 31 33 32 33 30 28 35
Other revenue 6 4 4 3 2 2 2 2 2 2 2
Total 36 32 34 35 34 35 35 36 33 30 37
Operating costs 35 33 34 34 34 35 35 36 33 30 35
Operating result 0 0 0 0 0 0 0 -1 -1 0 3
1 The figure includes a major extraordinary (non-comparable) item: repayment of accumulated excessive pension premiums totalling 39 million Euro.
Note: UR produces radio and TV programmes to be transmitted in SR (radio) and SVT (television).
Sources: SVT, SR and UR annual reports (processed).

FINANCING
NORDICOM 39 Nordic Public Service Media Map 1/2012
6. Nordic public service broadcasters’ revenue, costs and results 2000-2010 in national currencies
6.1 Danish public service broadcasters’ revenue, costs and results 2000-2010 (DKK millions)
2000 2001 2002 2003 2004 2005 2006 2007 2008 2009 2010
DR TV and radio
Operating revenue
Licence fees1 2 664 2 675 2 765 2 886 2 985 3 094 3 139 3 326 3 343 3 392 3 493
Other 259 249 226 274 307 319 270 293 330 368 368
Total 2 923 2 924 2 991 3 160 3 292 3 413 3 409 3 619 3 674 3 760 3 861
Operating costs2
Programme acquisitions 214 185
Other costs 895 963
Production costs, royalties, etc. 717 747 952 890 854 871 922 960 913
Other external costs 453 453 440 424 576 493 615 548 574
Personnel 1 656 1 590 1 707 1 656 1 745 1 798 1 795 1 913 1 793 1 831 1 841
Write-offs, depreciation 143 100 146 150 207 210 316 352 370 389 397
Total 2 908 2 838 3 023 3 006 3 344 3 322 3 541 3 630 3 700 3 727 3 725
Operating result 15 86 -33 155 -52 91 -132 -11 -26 34 134
TV 2/Danmark3
Operating revenue
Advertising, net 1 090 1 007 1 028 1 193 1308 1 425 1 586 1 687 1 597 1 219 1 318
Licence fee 449 537 556 151 70 0 0 0 0 0 0
Cable revenue4 * * * 107 116 192 251 422 462 618 643
Other revenue 98 67 74 69 92 86 143 162 147 192 186
Total 1 637 1 611 1 658 1 519 1 586 5 1 703 1 980 2 272 2 206 2 029 2 147
Operating costs
Transfers to TV 2 regional stations6 335 344 346 * * * * * * * *
Programme costs 685 662 693 680 827 845 941 1 036 1 023 1 038 1 105
Personnel 281 307 316 347 362 422 469 673 581 591 620
Other 197 173 178 200 219 228 342 412 341 281 249
Repayment of excess compensation * * * * 1 073 0 0 0 0 0 0
Total 1 498 1 486 1533 1 227 2 481 1 495 1 725 2 121 1 945 1 910 1 974
Operating result 139 125 125 292 -895 208 228 151 261 119 173
The regional TV 2 stations7
Revenue: Licence fee6 * * * 370 375 385 390 409 415 422 428
1 The total amount that DR receives from licence fees, as stated in the media political agreements plus related supplementary agreements. 2 Accounting procedures changed in 2002.3 Data through 2002 refer to the self-governing institution TV 2/Danmark; data from 2003 on refer to the state-owned limited company TV 2/Danmark A/S. Only TV 2/
Danmark’s main channel, TV 2, is public service, but economic data above refer to the whole company.4 Revenue from TV 2’s pay-TV channels TV 2/NEWS, TV 2/ZULU, TV 2/CHARLIE, TV 2/SPORT and TV 2/FILM.5 The revenue figures from 2004 are not entirely comparable to earlier data due to a change in accounting procedures. The adjusted (comparable) figure for 2003 is
MDKK 1 528.6 Before 2003 transfers of licence fee money were made via TV 2/Danmark, but since then the regional stations receive their part of licence fee revenue directly via
the licence office.7 Eight regional TV 2 stations, which are independent legal persons.
Sources: DR annual reports, TV 2/Danmark annual reports, Media political agreements 2001-2006 and 2007-2010, Danish Agency for Culture (Centre for Libraries and Media).

NORDICOM 40 Nordic Public Service Media Map 1/2012
FINANCING
6. Cont. Nordic public service broadcasters’ revenue, costs and results 2000-2010 in national currencies
6.2 The Finnish public service broadcaster’s revenue, costs and result 2000-2010 (EUR millions)
2000 2001 2002 2003 2004 2005 2006 2007 2008 2009 2010
YLE TV and radio
Operating revenue
Licence fees 284 299 302 305 333 354 367 376 376 388 398
Fees from commercial TV channels1 48 44 33 21 21 17 14 5 – – –
Other revenue 14 22 16 15 14 44 16 28 21 23 22
Total 345 365 351 341 368 415 396 409 397 411 420
Operating costs 378 489 432 412 429 452 417 419 401 414 447
Operating result -33 -124 -82 -71 -61 -36 -20 -10 -4 -3 -27
1 Operating licence fees paid by commercial television channels. The fees were discontinued altogether with the closedown of analogue television broadcasts in 2007.
Sources: YLE annual reports, Finnish Communications Regulatory Authority FICORA.
6.3 The Icelandic public service broadcaster’s revenue, costs and result 2000-2010 (ISK millions)
2000 2001 2002 2003 2004 2005 2006 2007 2008 2009 2010
RÚV TV and radio
Operating revenue
Licence fees 1 777 1 938 2 108 2 123 2 382 2 469 2 580 2 740 2 874 3 407 3 249
Advertising & Sponsoring 864 801 825 852 912 971 1 166 1 271 1 364 1 246 1 504
Other 22 32 42 117 77 116 121 .. 160 176 216
Total 2 662 2 771 2 976 3 087 3 371 3 555 3 867 4 011 4 399 4 829 4 970
Operating costs 2 784 2 944 3 014 2 954 2 980 3 284 3 671 .. 4 215 4 201 4 482
Operating result -122 -173 -38 -107 391 271 196 .. 184 628 488
RÚV TV
Operating revenue
Licence fees 1 184 1 292 1 405 1 416 1 588 1 646 1 708 1 830 1 984 2 383 2 145
Advertising 450 392 377 407 431 454 572 746 818 711 1 004
Sponsoring 53 54 79 79 92 95 101
Lottery 12 8 *2 *2 *2 *2 *2
Other 1 7 34 66 60 78 86 .. .. 135 ..
Total 1 700 1 753 1 895 1 968 2 171 2 272 2 468 2 576 2 802 3 229 3 149
Operating costs1 1 787 1 932 1 920 1 906 1 937 3 .. .. .. .. .. ..
Operating result1 -87 -179 -25 62 234 .. .. .. .. .. ..
RÚV radio
Operating revenue
Licence fees 592 646 703 708 794 823 872 910 991 1 192 1 073
Advertising 349 343 353 347 363 392 471 525 588 556 624
Sponsoring 12 12 16 18 26 30 22
Other 8 8 8 46 16 38 35 .. .. 67 ..
Total 962 1 009 1 080 1 119 1 199 1 283 1 399 1 435 1 579 1 815 1 697
Operating costs1 983 1 055 989 1 048 1 043 .. .. .. .. .. ..
Operating result1 -21 -46 91 72 156 .. .. .. .. .. ..
1 Data on costs and results for radio and TV separately are not available from 2005 on.2 Included in advertising from 2002 on.3 Of which programme costs 1 445; distribution 101; sale and marketing costs 111; and other 280 ISK millions.
Note: Broken financial years for 2008-2010; i.e. 2008 financial year is 1 Sep 2007 – 31 Aug 2008, etc.
Source: RÚV (Annual Accounts).

FINANCING
NORDICOM 41 Nordic Public Service Media Map 1/2012
6. Cont. Nordic public service broadcasters’ revenue, costs and results 2000-2010 in national currencies
6.4 The Norwegian public service broadcaster’s revenue, costs and result 2000-2010 (NOK millions)
2000 2001 2002 2003 2004 2005 2006 2007 2008 2009 2010
NRK TV and radio
Operating revenue
Licence fees 2 919 3 074 3 204 3 092 3 309 3 455 3 581 3 739 4 078 4 325 4 573
Other revenue 248 167 218 355 381 239 302 270 273 243 289
Total 3 167 3 240 3 421 3 447 3 689 3 693 3 882 4 009 4 351 4 568 4 862
Operating costs 3 352 3 312 3 503 3 453 3 602 3 710 3 901 4 193 1 4 444 4 586 4 816
Operating result -184 -71 -82 -6 88 -17 -18 -184 -93 -18 46
1 The apparent rise in costs in 2007 is due in part to changes in accounting rules pertaining to pensions.
Note: Figures refer to the NRK group, which means that NRK’s subsidiary NRK Aktivum is included. NRK Aktivum handles all commercial activities within NRK, e.g. royalties and sale of production resources, sales of archive material and programmes, etc.
Source: NRK annual reports.
6.5 Swedish public service broadcasters’ revenue, costs and results 2000-2010 (SEK millions)
2000 2001 2002 2003 2004 2005 2006 2007 2008 2009 2010
SVT
Operating revenue
Licence fees 3 238 3 488 3 500 3 549 3 748 3 900 3 722 3 748 3 654 3 526 3 872
Other revenue, of which: 344 301 265 280 314 271 372 280 298 278 284
royalties 136 140 118 118 174 118 177 105 97 137 111
technical services 48 44 39 43 25 26 42 30 35 25 38
sponsoring 34 32 43 26 50 31 47 38 35 16 38
miscellaneous 127 85 65 93 66 96 105 107 131 99 97
Total 3 582 3 789 3 765 3 829 4 062 4 172 4 094 4 028 3 952 3 804 4 156
Operating costs 3 415 3 839 3 818 3 873 4 111 4 118 4 103 3 988 3 929 3 795 4 115
Operating result 167 -50 -53 -44 -50 54 -9 41 23 9 41
SR
Operating revenue
Licence fees 1 594 2 002 2 102 2 143 2 048 2 130 2 210 2 151 2 127 2 208 2 353
Other revenue 51 53 43 48 58 55 59 67 63 67 60
Total 1 646 2 055 2 145 2 191 2 106 2 185 2 269 2 218 2 191 2 275 2 413
Operating costs 1 696 1 2 045 2 147 2 162 2 137 2 203 2 271 2 260 2 212 2 394 2 283
Operating result -50 10 -2 28 -31 -18 -3 -42 -21 -119 130
UR
Operating revenue
Licence fees 251 263 279 289 286 307 298 309 291 300 339
Other revenue 49 37 34 27 21 22 23 19 23 20 18
Total 300 300 313 316 307 329 321 328 314 320 357
Operating costs 299 304 311 313 309 329 325 333 321 323 331
Operating result 1 -4 2 3 -2 0 -4 -5 -7 -3 26
1 The figure includes a major extraordinary (non-comparable) item: repayment of accumulated excessive pension premiums totalling 330 MSEK.
Note: UR produces radio and TV programmes to be transmitted in SR (radio) and SVT (television).
Sources: SVT, SR and UR annual reports (processed).
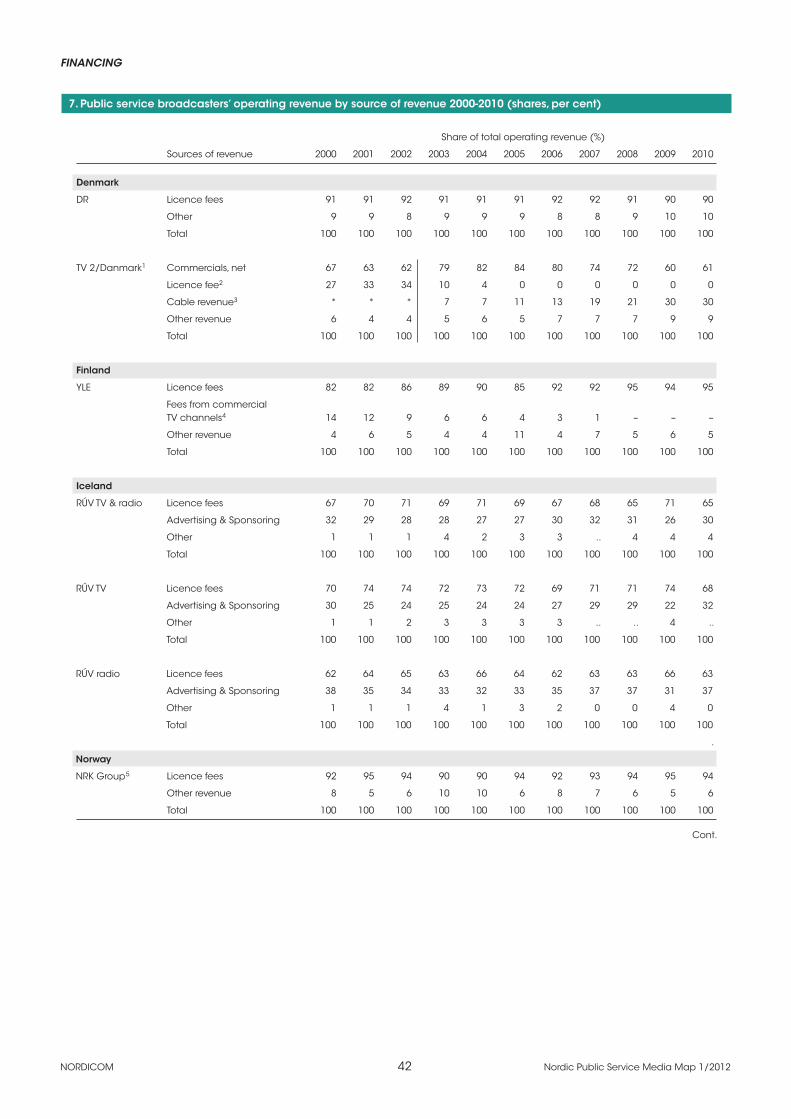
NORDICOM 42 Nordic Public Service Media Map 1/2012
FINANCING
7. Public service broadcasters’ operating revenue by source of revenue 2000-2010 (shares, per cent)
Share of total operating revenue (%)
Sources of revenue 2000 2001 2002 2003 2004 2005 2006 2007 2008 2009 2010
Denmark
DR Licence fees 91 91 92 91 91 91 92 92 91 90 90
Other 9 9 8 9 9 9 8 8 9 10 10
Total 100 100 100 100 100 100 100 100 100 100 100
TV 2/Danmark1 Commercials, net 67 63 62 79 82 84 80 74 72 60 61
Licence fee2 27 33 34 10 4 0 0 0 0 0 0
Cable revenue3 * * * 7 7 11 13 19 21 30 30
Other revenue 6 4 4 5 6 5 7 7 7 9 9
Total 100 100 100 100 100 100 100 100 100 100 100
Finland
YLE Licence fees 82 82 86 89 90 85 92 92 95 94 95
Fees from commercial TV channels4 14 12 9 6 6 4 3 1 – – –
Other revenue 4 6 5 4 4 11 4 7 5 6 5
Total 100 100 100 100 100 100 100 100 100 100 100
Iceland
RÚV TV & radio Licence fees 67 70 71 69 71 69 67 68 65 71 65
Advertising & Sponsoring 32 29 28 28 27 27 30 32 31 26 30
Other 1 1 1 4 2 3 3 .. 4 4 4
Total 100 100 100 100 100 100 100 100 100 100 100
RÚV TV Licence fees 70 74 74 72 73 72 69 71 71 74 68
Advertising & Sponsoring 30 25 24 25 24 24 27 29 29 22 32
Other 1 1 2 3 3 3 3 .. .. 4 ..
Total 100 100 100 100 100 100 100 100 100 100 100
RÚV radio Licence fees 62 64 65 63 66 64 62 63 63 66 63
Advertising & Sponsoring 38 35 34 33 32 33 35 37 37 31 37
Other 1 1 1 4 1 3 2 0 0 4 0
Total 100 100 100 100 100 100 100 100 100 100 100
.
Norway
NRK Group5 Licence fees 92 95 94 90 90 94 92 93 94 95 94
Other revenue 8 5 6 10 10 6 8 7 6 5 6
Total 100 100 100 100 100 100 100 100 100 100 100
Cont.

FINANCING
NORDICOM 43 Nordic Public Service Media Map 1/2012
7. Cont. Public service broadcasters’ operating revenue by source of revenue 2000-2010 (shares, per cent)
Share of total operating revenue (%)
Sources of revenue 2000 2001 2002 2003 2004 2005 2006 2007 2008 2009 2010
Sweden
SVT Licence fees 90 92 93 93 92 93 91 93 92 93 93
Other revenue, of which: 10 8 7 7 8 6 9 7 8 7 7
royalties 4 4 3 3 4 3 4 3 2 4 3
technical services 1 1 1 1 1 1 1 1 1 1 1
sponsoring 1 1 1 1 1 1 1 1 1 0 1
miscellaneous 4 2 2 2 2 2 3 3 3 3 2
Total 100 100 100 100 100 100 100 100 100 100 100
SR Licence fees 97 97 98 98 97 97 97 97 97 97 97
Other revenue 3 3 2 2 3 3 3 3 3 3 3
Total 100 100 100 100 100 100 100 100 100 100 100
UR6 Licence fees 84 88 89 91 93 93 93 94 93 94 95
Other revenue 16 12 11 9 7 7 7 6 7 6 5
Total 100 100 100 100 100 100 100 100 100 100 100
1 Data through 2002 refer to the self-governing institution TV 2/Danmark; data from 2003 on refer to the state-owned limited company, TV 2/Danmark A/S.2 Before 2003 transfers of licence fee money were made via TV 2/Danmark to eight regional TV 2 stations, but hence the regional stations receive their part of licence
fee revenue directly from the licence office. 3 Revenue from TV 2’s pay-TV-channels TV 2/NEWS, TV 2/ZULU, TV 2/CHARLIE, TV 2/SPORT and TV 2/FILM.4 Operating licence fees paid by commercial television channels. The fees were discontinued altogether with the closedown of analogue television broadcasts in 2007.5 Figures refer to the NRK Group, which means that NRK’s subsidiary NRK Aktivum is included. NRK Aktivum handles all commercial activities within NRK, e.g. royalties
and sale of production resources, sales of archive material and programmes, etc.6 UR produces radio and TV programmes for transmissions in SR and SVT.
Sources: DR annual reports, TV 2/Danmark annual reports, Media political agreements 2001-2006 and 2007-2010, Danish Agency for Culture (Centre for Libraries and Media), YLE annual reports, Finnish Communications Regulatory Authority FICORA, RÚV (Annual Accounts and unpublished information), NRK annual reports, SVT, SR and UR annual reports (processed).

NORDICOM 44 Nordic Public Service Media Map 1/2012
FINANCING
8. Media advertising revenue in the Nordic countries 2000-2010 (Euro, national currency and market shares)
8.1 Media advertising revenue in Denmark 2000-2010
News- Magazines Printed Direct TV Radio Internet papers & periodicals Cinema Outdoor directories1 mail Total
EUR millions
2000 245 29 42 749 242 6 45 183 334 1 875
2001 234 31 42 703 242 7 46 177 307 1 789
2002 225 30 56 645 207 9 45 176 331 1 725
2003 259 29 65 634 193 7 46 159 345 1 738
2004 286 28 78 674 202 7 50 158 372 1 855
2005 303 38 100 733 217 8 51 127 390 1 965
2006 331 37 240 799 242 7 54 122 403 2 236
2007 338 38 336 796 251 8 63 117 349 2 297
2008 326 34 392 709 248 8 69 111 399 2 295
2009 276 29 407 565 179 7 66 84 367 1 980
2010 303 31 468 534 174 8 67 80 361 2 026
DKK millions
2000 1 823 213 316 5 580 1 801 46 338 1 361 2 490 13 968
2001 1 747 234 310 5 238 1 800 50 343 1 321 2 285 13 328
2002 1 675 222 418 4 794 1 537 70 336 1 305 2 462 12 819
2003 1 927 216 486 4 708 1 434 55 345 1 181 2 562 12 914
2004 2 125 211 582 5 013 1 505 51 375 1 176 2 765 13 803
2005 2 254 280 742 5 462 1 616 57 383 945 2 902 14 641
2006 2 471 279 1 794 5 960 1 804 55 405 911 3 003 16 682
2007 2 516 285 2 502 5 933 1 871 56 473 873 2 600 17 109
2008 2 431 250 2 926 5 289 1 849 56 516 829 2 977 17 123
2009 2 059 217 3 030 4 208 1 336 53 491 624 2 735 14 753
2010 2 256 232 3 484 3 979 1 298 59 499 597 2 686 15 090
Shares (%)
2000 13 2 2 40 13 0 2 10 18 100
2001 13 2 2 39 14 0 3 10 17 100
2002 13 2 3 37 12 1 3 10 19 100
2003 15 2 4 36 11 0 3 9 20 100
2004 15 2 4 36 11 0 3 9 20 100
2005 15 2 5 37 11 0 3 6 20 100
2006 15 2 11 36 11 0 2 5 18 100
2007 15 2 15 35 11 0 3 5 15 100
2008 14 1 17 31 11 0 3 5 17 100
2009 14 1 21 29 9 0 3 4 19 100
2010 15 2 23 26 9 0 3 4 18 100
1 Yearbooks.
Note 1: The public service broadcaster DR does not carry advertising, while TV 2 Danmark’s main channel TV 2, which is public service, is mainly financed by advertising (and from 2012 also by pay-TV revenue).
Note 2: Information based on IRM’s Nordic advertising report, which in turn is based on various national sources (in Denmark’s case, the Danish Audit Bureau of Cir-culations). Although the reported media categories in the Nordic countries are generally the same, the statistics vary to a degree as regards definitions and divisions. IRM has therefore grouped the media into main media categories, to enable comparison between countries to the highest degree possible. For an overview of which national categories belong to the respective main media above, see the appendix.
Source: Den nordiska reklammarknaden. Juni 2011 [The Nordic Advertising Market. June 2011] by IRM Institute for Advertising and Media Statistics.
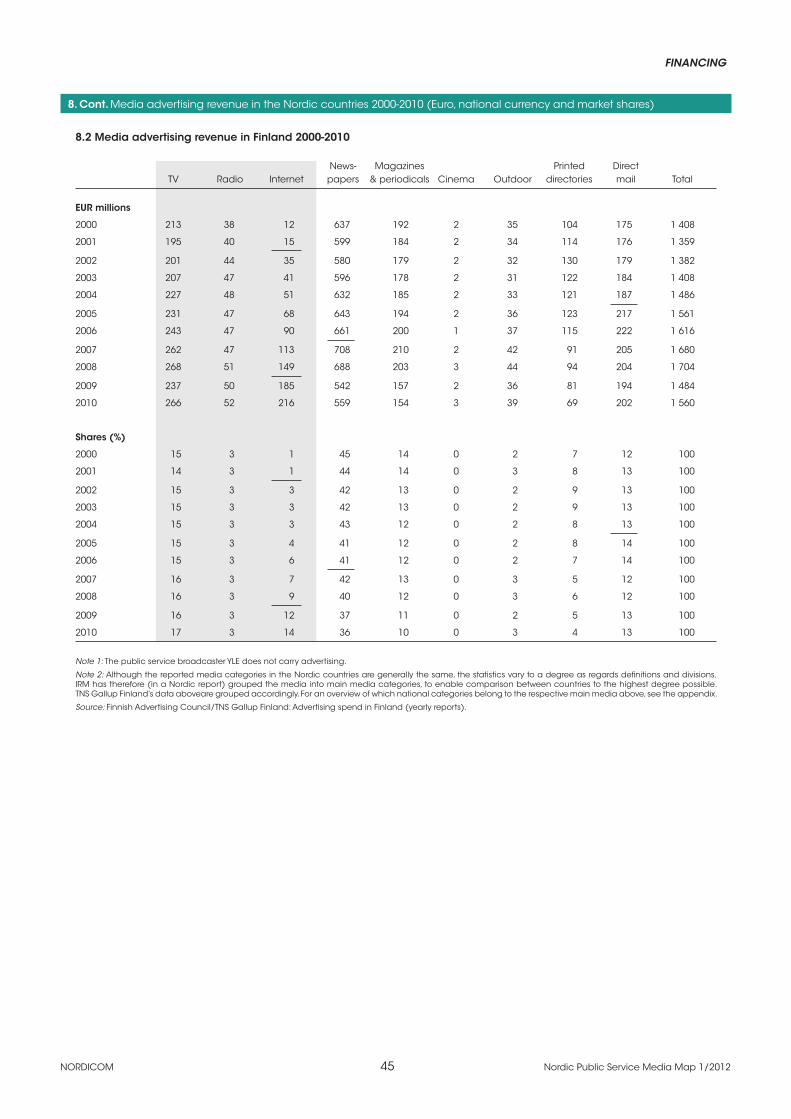
FINANCING
NORDICOM 45 Nordic Public Service Media Map 1/2012
8. Cont. Media advertising revenue in the Nordic countries 2000-2010 (Euro, national currency and market shares)
8.2 Media advertising revenue in Finland 2000-2010
News- Magazines Printed Direct TV Radio Internet papers & periodicals Cinema Outdoor directories mail Total
EUR millions
2000 213 38 12 637 192 2 35 104 175 1 408
2001 195 40 15 599 184 2 34 114 176 1 359
2002 201 44 35 580 179 2 32 130 179 1 382
2003 207 47 41 596 178 2 31 122 184 1 408
2004 227 48 51 632 185 2 33 121 187 1 486
2005 231 47 68 643 194 2 36 123 217 1 561
2006 243 47 90 661 200 1 37 115 222 1 616
2007 262 47 113 708 210 2 42 91 205 1 680
2008 268 51 149 688 203 3 44 94 204 1 704
2009 237 50 185 542 157 2 36 81 194 1 484
2010 266 52 216 559 154 3 39 69 202 1 560
Shares (%)
2000 15 3 1 45 14 0 2 7 12 100
2001 14 3 1 44 14 0 3 8 13 100
2002 15 3 3 42 13 0 2 9 13 100
2003 15 3 3 42 13 0 2 9 13 100
2004 15 3 3 43 12 0 2 8 13 100
2005 15 3 4 41 12 0 2 8 14 100
2006 15 3 6 41 12 0 2 7 14 100
2007 16 3 7 42 13 0 3 5 12 100
2008 16 3 9 40 12 0 3 6 12 100
2009 16 3 12 37 11 0 2 5 13 100
2010 17 3 14 36 10 0 3 4 13 100
Note 1: The public service broadcaster YLE does not carry advertising.
Note 2: Although the reported media categories in the Nordic countries are generally the same, the statistics vary to a degree as regards definitions and divisions. IRM has therefore (in a Nordic report) grouped the media into main media categories, to enable comparison between countries to the highest degree possible. TNS Gallup Finland’s data aboveare grouped accordingly. For an overview of which national categories belong to the respective main media above, see the appendix.
Source: Finnish Advertising Council/TNS Gallup Finland: Advertising spend in Finland (yearly reports).
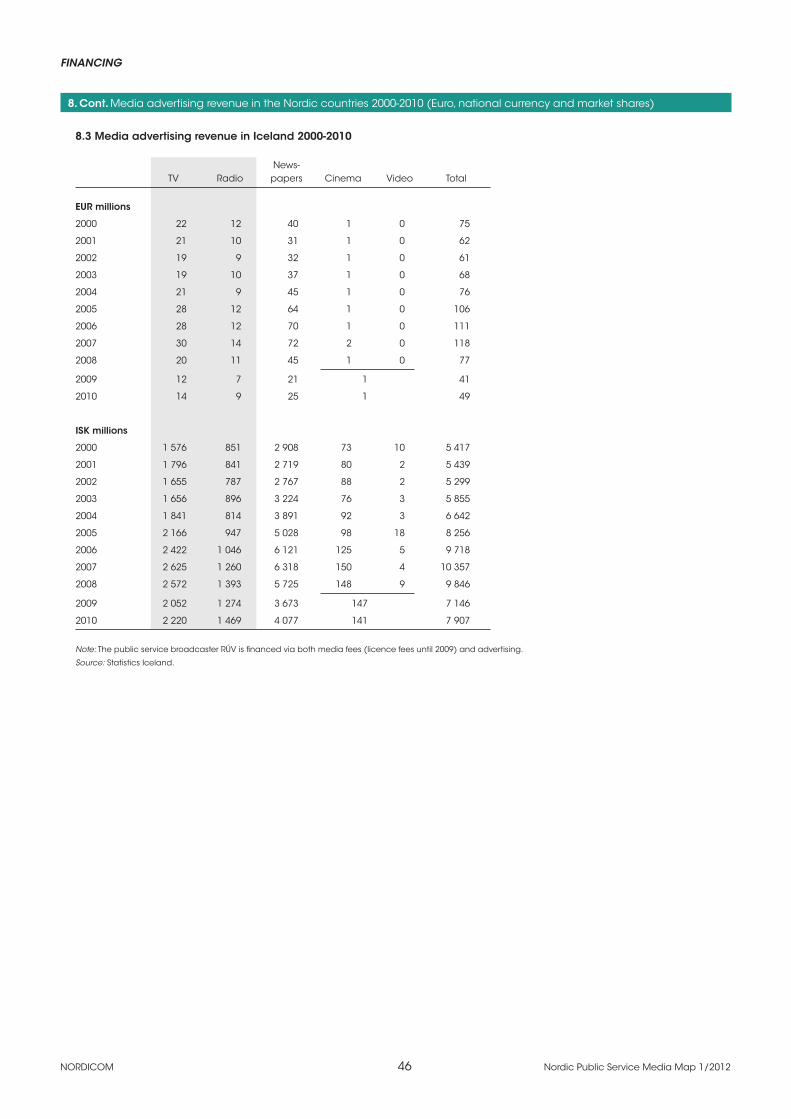
NORDICOM 46 Nordic Public Service Media Map 1/2012
FINANCING
8. Cont. Media advertising revenue in the Nordic countries 2000-2010 (Euro, national currency and market shares)
8.3 Media advertising revenue in Iceland 2000-2010
News- TV Radio papers Cinema Video Total
EUR millions
2000 22 12 40 1 0 75
2001 21 10 31 1 0 62
2002 19 9 32 1 0 61
2003 19 10 37 1 0 68
2004 21 9 45 1 0 76
2005 28 12 64 1 0 106
2006 28 12 70 1 0 111
2007 30 14 72 2 0 118
2008 20 11 45 1 0 77
2009 12 7 21 1 41
2010 14 9 25 1 49
ISK millions
2000 1 576 851 2 908 73 10 5 417
2001 1 796 841 2 719 80 2 5 439
2002 1 655 787 2 767 88 2 5 299
2003 1 656 896 3 224 76 3 5 855
2004 1 841 814 3 891 92 3 6 642
2005 2 166 947 5 028 98 18 8 256
2006 2 422 1 046 6 121 125 5 9 718
2007 2 625 1 260 6 318 150 4 10 357
2008 2 572 1 393 5 725 148 9 9 846
2009 2 052 1 274 3 673 147 7 146
2010 2 220 1 469 4 077 141 7 907
Note: The public service broadcaster RÚV is financed via both media fees (licence fees until 2009) and advertising.
Source: Statistics Iceland.

FINANCING
NORDICOM 47 Nordic Public Service Media Map 1/2012
8. Cont. Media advertising revenue in the Nordic countries 2000-2010 (Euro, national currency and market shares)
8.4 Media advertising revenue in Norway 2005-2010
News- Magazines Printed Direct TV Radio Internet papers & periodicals Cinema Outdoor directories mail Total
EUR millions
2005 331 62 191 831 142 14 53 155 341 2 121
2006 362 62 273 882 146 14 53 140 325 2 257
2007 380 68 388 976 152 16 62 109 327 2 476
2008 385 71 426 918 150 17 65 87 313 2 432
2009 319 58 402 714 120 13 55 65 262 2 008
2010 382 70 500 808 138 17 63 42 283 2 303
NOK millions
2005 2 648 500 1 532 6 658 1 140 111 424 1 238 2 735 16 986
2006 2 912 498 2 200 7 101 1 174 112 427 1 127 2 620 18 171
2007 3 049 547 3 109 7 825 1 217 127 494 871 2 619 19 858
2008 3 162 581 3 500 7 549 1 235 143 532 716 2 572 19 990
2009 2 793 504 3 518 6 250 1 047 115 481 571 2 293 17 572
2010 3 061 563 4 014 6 479 1 103 139 506 338 2 271 18 474
Shares (%)
2005 16 3 9 39 7 1 2 7 16 100
2006 16 3 12 39 6 1 2 6 14 100
2007 15 3 16 39 6 1 2 4 13 100
2008 16 3 18 38 6 1 3 4 13 100
2009 16 3 20 36 6 1 3 3 13 100
2010 17 3 22 35 6 1 3 2 12 100
Note 1: The public service broadcaster NRK does not carry advertising.
Note 2: Information based on IRM’s Nordic advertising report, which in turn is based on various national sources (in Norway’s case, IRM Norway, INMA and MBL/Nettfo-rum). Although the reported media categories in the Nordic countries are generally the same, the statistics vary to a degree as regards definitions and divisions. IRM has therefore grouped the media into main media categories, to enable comparison between countries to the highest degree possible. For an overview of which national categories belong to the respective main media above, see the appendix.
Source: Den nordiska reklammarknaden. Juni 2011 [The Nordic Advertising Market. June 2011] by IRM Institute for Advertising and Media Statistics.

NORDICOM 48 Nordic Public Service Media Map 1/2012
FINANCING
8. Cont. Media advertising revenue in the Nordic countries 2000-2010 (Euro, national currency and market shares)
8.5 Media advertising revenue in Sweden 2000-2010
News- Magazines Printed Direct TV Radio Internet papers & periodicals Cinema Outdoor directories mail Total
EUR millions
2000 478 70 132 .. .. 9 106 310 366 ..
2001 387 55 104 .. .. 9 86 300 367 ..
2002 383 52 134 1 017 295 9 92 264 372 2 618
2003 391 49 127 1 022 294 8 96 249 393 2 629
2004 417 54 159 1 073 303 6 107 234 438 2 791
2005 452 55 213 1 124 311 7 113 221 463 2 960
2006 496 70 325 1 213 330 8 121 220 483 3 267
2007 511 76 441 1 251 340 10 119 225 478 3 450
2008 520 76 509 1 165 330 11 118 197 447 3 372
2009 415 59 475 875 219 10 96 147 371 2 667
2010 545 72 609 1 075 258 12 122 117 415 3 225
SEK millions
2000 4 038 592 1 113 .. .. 78 898 2 622 3 096 ..
2001 3 579 508 963 .. .. 79 792 2 774 3 395 ..
2002 3 509 480 1 225 9 313 2 706 79 845 2 414 3 407 23 978
2003 3 571 447 1 164 9 332 2 688 70 873 2 272 3 587 24 004
2004 3 804 491 1 455 9 795 2 769 59 977 2 135 3 998 25 483
2005 4 190 515 1 974 10 432 2 883 68 1049 2 055 4 299 27 465
2006 4 589 643 3 009 11 221 3 056 74 1122 2 036 4 471 30 221
2007 4 726 701 4 075 11 572 3 143 91 1102 2 081 4 417 31 908
2008 4 996 728 4 888 11 200 3 169 104 1134 1 890 4 293 32 402
2009 4 414 628 5 048 9 298 2 326 103 1024 1 564 3 940 28 345
2010 5 213 688 5 821 10 275 2 465 119 1165 1 116 3 970 30 832
Shares (%)
2000 .. .. .. .. .. .. .. .. .. ..
2001 .. .. .. .. .. .. .. .. .. ..
2002 15 2 5 39 11 0 4 10 14 100
2003 15 2 5 39 11 0 4 9 15 100
2004 15 2 6 38 11 0 4 8 16 100
2005 15 2 7 38 10 0 4 7 16 100
2006 15 2 10 37 10 0 4 7 15 100
2007 15 2 13 36 10 0 3 7 14 100
2008 15 2 15 35 10 0 3 6 13 100
2009 16 2 18 33 8 0 4 6 14 100
2010 17 2 19 33 8 0 4 4 13 100
Note 1: The public service broadcasters SVT, SR and UR do not carry advertising.
Note 2: Information based on IRM’s Nordic advertising report, which in turn is based on various national sources (in Sweden’s case, IRM). Although the reported media categories in the Nordic countries are generally the same, the statistics vary to a degree as regards definitions and divisions. IRM has therefore grouped the media into main media categories, to enable comparison between countries to the highest degree possible. For an overview of which national categories belong to the respective main media above, see the appendix.
Source: Den nordiska reklammarknaden. Juni 2011 [The Nordic Advertising Market. June 2011] by IRM Institute for Advertising and Media Statistics.
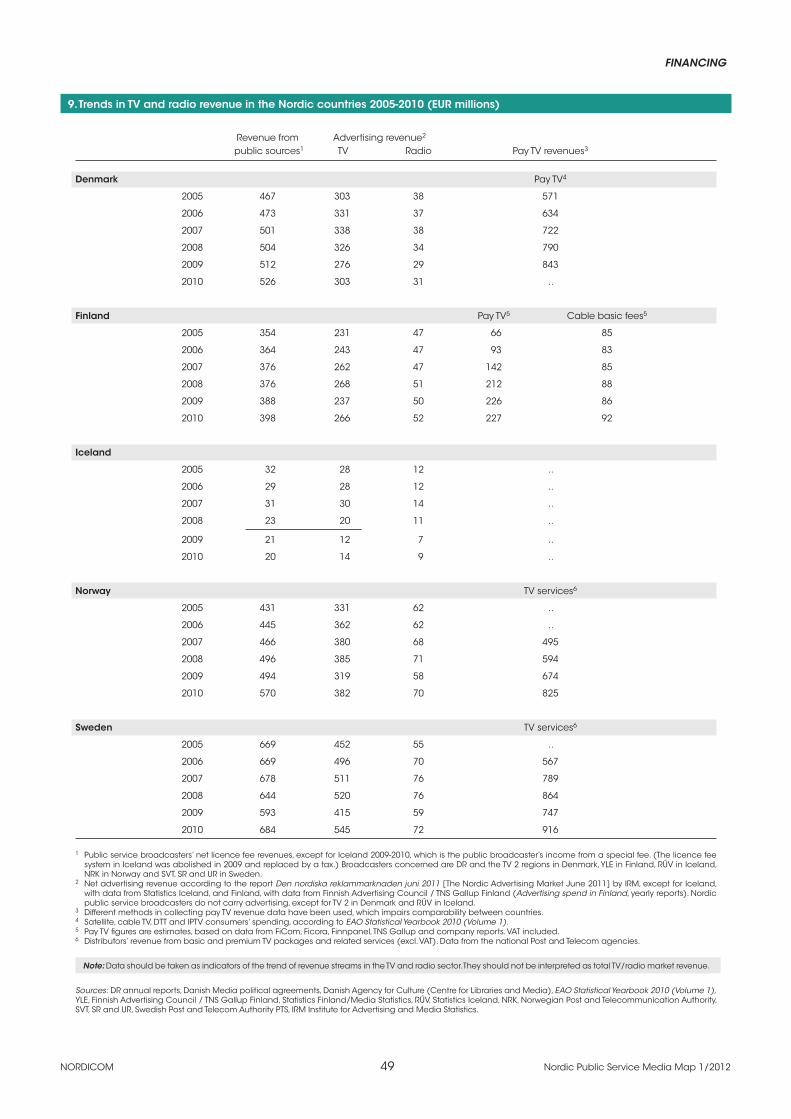
FINANCING
NORDICOM 49 Nordic Public Service Media Map 1/2012
9. Trends in TV and radio revenue in the Nordic countries 2005-2010 (EUR millions)
Revenue from Advertising revenue2
public sources1 TV Radio Pay TV revenues3
Denmark Pay TV4
2005 467 303 38 571
2006 473 331 37 634
2007 501 338 38 722
2008 504 326 34 790
2009 512 276 29 843
2010 526 303 31 ..
Finland Pay TV5 Cable basic fees5
2005 354 231 47 66 85
2006 364 243 47 93 83
2007 376 262 47 142 85
2008 376 268 51 212 88
2009 388 237 50 226 86
2010 398 266 52 227 92
Iceland
2005 32 28 12 ..
2006 29 28 12 ..
2007 31 30 14 ..
2008 23 20 11 ..
2009 21 12 7 ..
2010 20 14 9 ..
Norway TV services6
2005 431 331 62 ..
2006 445 362 62 ..
2007 466 380 68 495
2008 496 385 71 594
2009 494 319 58 674
2010 570 382 70 825
Sweden TV services6
2005 669 452 55 ..
2006 669 496 70 567
2007 678 511 76 789
2008 644 520 76 864
2009 593 415 59 747
2010 684 545 72 916
1 Public service broadcasters’ net licence fee revenues, except for Iceland 2009-2010, which is the public broadcaster’s income from a special fee. (The licence fee system in Iceland was abolished in 2009 and replaced by a tax.) Broadcasters concerned are DR and the TV 2 regions in Denmark, YLE in Finland, RÚV in Iceland, NRK in Norway and SVT, SR and UR in Sweden.
2 Net advertising revenue according to the report Den nordiska reklammarknaden juni 2011 [The Nordic Advertising Market June 2011] by IRM, except for Iceland, with data from Statistics Iceland, and Finland, with data from Finnish Advertising Council / TNS Gallup Finland (Advertising spend in Finland, yearly reports). Nordic public service broadcasters do not carry advertising, except for TV 2 in Denmark and RÚV in Iceland.
3 Different methods in collecting pay TV revenue data have been used, which impairs comparability between countries.4 Satellite, cable TV, DTT and IPTV consumers’ spending, according to EAO Statistical Yearbook 2010 (Volume 1).5 Pay TV figures are estimates, based on data from FiCom, Ficora, Finnpanel, TNS Gallup and company reports. VAT included. 6 Distributors’ revenue from basic and premium TV packages and related services (excl. VAT). Data from the national Post and Telecom agencies.
Note: Data should be taken as indicators of the trend of revenue streams in the TV and radio sector. They should not be interpreted as total TV/radio market revenue.
Sources: DR annual reports, Danish Media political agreements, Danish Agency for Culture (Centre for Libraries and Media), EAO Statistical Yearbook 2010 (Volume 1), YLE, Finnish Advertising Council / TNS Gallup Finland, Statistics Finland/Media Statistics, RÚV, Statistics Iceland, NRK, Norwegian Post and Telecommunication Authority, SVT, SR and UR, Swedish Post and Telecom Authority PTS, IRM Institute for Advertising and Media Statistics.

NORDICOM 50 Nordic Public Service Media Map 1/2012
FINANCING10
. Tre
nd
s in
TV
an
d ra
dio
reve
nue
in t
he
No
rdic
co
un
trie
s 20
05-2
010
(EU
R m
illio
ns)
De
nm
ark
N
orw
ay
Fin
lan
d
Swe
de
n
0
100
200
300
400
500
600
700
800
900
1 00
0
2005
2006
2007
2008
2009
2010
EUR millions
Re
ven
ue
fro
m p
ub
lic s
ou
rce
s1TV
ad
vert
isin
g2
Rad
io a
dve
rtis
ing
2Pa
y TV
3,7
0
100
200
300
400
500
600
700
800
900
1 00
0
2005
2006
2007
2008
2009
2010
EUR millions
Re
ven
ue
fro
m p
ub
lic s
ou
rce
s1TV
ad
vert
isin
g2
Rad
io a
dve
rtis
ing
2Re
ven
ue
fro
m T
V s
erv
ice
s6,7
0
100
200
300
400
500
600
700
800
900
1 00
0
2005
2006
2007
2008
2009
2010
EUR millions
Re
ven
ue
fro
m p
ub
lic s
ou
rce
s1TV
ad
vert
isin
g2
Rad
io a
dve
rtis
ing
2Re
ven
ue
fro
m T
V s
erv
ice
s6,7
Re
ven
ue
fro
m p
ub
lic s
ou
rce
s1TV
ad
vert
isin
g4
Rad
io a
dve
rtis
ing
4Pa
y TV
5,7
Ca
ble
ba
sic
fee
s5,7
0
100
200
300
400
500
600
700
800
900
1 00
0
2005
2006
2007
2008
2009
2010
EUR millions

FINANCING
NORDICOM 51 Nordic Public Service Media Map 1/2012
Re
ven
ue
fro
m p
ub
lic s
ou
rce
s8TV
ad
vert
isin
g9
Rad
io a
dve
rtis
ing
9
0102030405060708090100
2005
2006
2007
2008
2009
2010
EUR millions
10. C
on
t. Tr
en
ds
in T
V a
nd
rad
io re
ven
ue
in th
e N
ord
ic c
ou
ntr
ies
2005
-201
0 (E
UR
mill
ion
s)
Ice
lan
d*
* N
ote
: Ic
ela
nd
ic d
ata
are
ba
sed
on
a d
iffe
ren
t sc
ale
tha
n th
e o
the
r co
un
trie
s.
1 P
ub
lic s
erv
ice
bro
ad
ca
ste
rs’ n
et
lice
nc
e fe
e r
eve
nu
es.
Bro
ad
ca
ste
rs c
on
ce
rne
d a
re D
R a
nd
th
e T
V 2
re
gio
ns
in D
en
ma
rk, Y
LE in
Fin
lan
d, R
ÚV
in
Ice
lan
d,
NRK
in N
orw
ay
an
d S
VT,
SR a
nd
UR
in S
we
de
n.
2 N
et a
dve
rtis
ing
reve
nu
e a
cc
ord
ing
to th
e re
po
rt D
en
no
rdis
ka re
kla
mm
ark
na
de
n ju
ni 2
011
[Th
e N
ord
ic A
dve
rtis
ing
Ma
rke
t Ju
ne
201
1] b
y IR
M3
Ne
t ad
vert
isin
g re
ven
ue
ac
co
rdin
g to
Fin
nis
h A
dve
rtis
ing
Co
un
cil
/ TN
S G
allu
p F
inla
nd
(A
dve
rtis
ing
sp
en
d in
Fin
lan
d, y
ea
rly re
po
rts)
.4
Sa
telli
te, c
ab
le T
V, D
TT a
nd
IPTV
co
nsu
me
rs’ s
pe
nd
ing
, ac
co
rdin
g to
EA
O S
tatis
tica
l Ye
arb
oo
k 20
10 (
Volu
me
1).
5 P
ay
TV fi
gu
res
are
est
ima
tes,
ba
sed
on
da
ta fr
om
FiC
om
, Fic
ora
, Fin
np
an
el, T
NS
Ga
llup
an
d c
om
pa
ny re
po
rts.
VAT
inc
lud
ed
. 6
Dis
trib
uto
rs’ r
eve
nu
e fr
om
ba
sic
an
d p
rem
ium
TV
pa
cka
ge
s a
nd
rela
ted
se
rvic
es
(exc
l. VA
T). D
ata
fro
m th
e n
atio
na
l Po
st a
nd
Tele
co
m a
ge
nc
ies.
7 D
iffe
ren
t me
tho
ds
in c
olle
ctin
g p
ay
TV re
ven
ue
da
ta h
ave
be
en
use
d, w
hic
h im
pa
irs c
om
pa
rab
ility
be
twe
en
co
un
trie
s.8
Pu
blic
se
rvic
e b
roa
dc
ast
er R
ÚV
’s n
et l
ice
nc
e fe
e re
ven
ue
s, ex
ce
pt f
or 2
009-
2010
, wh
ich
is R
ÚV
’s in
co
me
fro
m a
sp
ec
ial f
ee
. (Th
e li
ce
nc
e fe
e s
yste
m
in Ic
ela
nd
wa
s a
bo
lish
ed
in 2
009
an
d re
pla
ce
d b
y a
tax.
)9
Ne
t ad
vert
isin
g re
ven
ue
. Da
ta fr
om
Sta
tistic
s Ic
ela
nd
.
No
te: D
ata
sh
ou
ld b
e ta
ken
as
ind
ica
tors
of t
he
tre
nd
of r
eve
nu
e s
trea
ms
in th
e T
V a
nd
rad
io s
ec
tor. T
hey
sh
ou
ld n
ot b
e in
terp
rete
d a
s to
tal T
V/
rad
io m
ark
et r
eve
nu
e. D
ata
inc
lud
e e
ffec
ts b
y c
urre
nc
y ra
tes.
Sou
rce
s: D
R a
nn
ua
l re
po
rts,
Da
nis
h M
ed
ia p
olit
ica
l ag
ree
me
nts
, Da
nis
h A
ge
nc
y fo
r Cu
lture
(C
en
tre fo
r Lib
rarie
s a
nd
Me
dia
), EA
O S
tatis
tica
l Ye
arb
oo
k 20
10 (
Volu
me
1),
YLE
, Fin
nis
h A
dve
rtis
ing
Co
un
cil
/ TN
S G
allu
p F
inla
nd
, Sta
tistic
s Fi
nla
nd
/Me
dia
Sta
tistic
s, R
ÚV,
Sta
tistic
s Ic
ela
nd
, NRK
, No
rwe
gia
n
Post
an
d Te
lec
om
mu
nic
atio
n A
uth
orit
y, SV
T, SR
an
d U
R, S
we
dis
h P
ost
an
d Te
lec
om
Au
tho
rity
PTS,
IRM
Inst
itute
for A
dve
rtis
ing
an
d M
ed
ia S
tatis
tics.


53
Television
Structure & Ownership
Table 1 Number of TV channels in terrestrial networks 2000-2011 55
Table 2 Must-carry channels in cable TV networks 2011 56
Table 3 The largest TV companies and their channels
3.1 The largest TV companies in Denmark and their channels 2010 57
3.2 The three largest TV companies in Finland and their channels 2011 (Spring) 58
3.3 The largest TV companies in Iceland and their channels 2010 (end-of-year) 59
3.4 The largest TV companies in Norway and their channels in 2011 (Summer) 60
3.5 The largest TV companies in Sweden and their channels in 2011 (Spring) 61
Table 4 TV channels in each country
4.1 Danish TV channels 2010 62
4.2 TV channels in Finland 2011 (Spring) 64
4.3 Icelandic TV channels 2010 (end-of-year) 65
4.4 Norwegian TV channels 2011 (Summer) 66
4.5 Swedish TV channels 2011 (Spring) 67
Content
Table 5 Public service television programming by content 2000-2010 (per cent)
5.1 Public service television programming in Denmark by content 2000-2010 69
5.2 Public service television programming in Finland by content 2000-2010 70
5.3 Public service television programming in Iceland by content 2000-2010 71
5.4 Public service television programming in Norway by content 2000-2010 72
5.5 Public service television programming in Sweden by content 2000-2010: SVT1 and SVT2 73
5.6 Public service television programming in Sweden by content 2009-2010: SVT24, SVTB, Kunskapskanalen and UR 74
Table 6 Public service television programming: Content by channel 2010 (per cent)
6.1 Public service television programming in Denmark: Content by channel 2010 75
6.2 Public service television programming in Finland: Content by channel 2010 75
6.3 Public service television programming in Iceland: Content by channel 2010 76
6.4 Public service television programming in Norway: Content by channel 2010 76
6.5 Public service television programming in Sweden: Content by channel 2010 77
Table 7 Public service television programming by origin 2000-2010 (per cent)
7.1 DR TV and TV 2 programming in Denmark by origin 2000-2010 78
7.2 YLE television programming in Finland by origin 2000-2010 78
7.3 RÚV television programming in Iceland by origin 2000-2010 79
7.4 NRK television programming in Norway by origin 2000-2010 79
7.5 SVT programming in Sweden by origin 2000-2010 79
Table 8 Public service television programming: In-house and acquired production 2005-2010 (per cent) 80
Table 9 Public service television broadcasting in minority languages 2000-2010 (hours/year)
9.1 YLE television broadcasting in Swedish and Sámi 2000-2010 82
9.2 NRK television broadcasting in Sámi 2000-2010 82
9.3 SVT television broadcasting in minority and sign languages 2001-2010 82

NORDICOM 54 Nordic Public Service Media Map 1/2012
TELEVISION
Table 10 Nordvision’s programme cooperation 2007-2010 among the Nordic public service broadcasters
10.1 Number of TV programmes and hours generated by co-production 2007-2010 83
10.2 TV programme hours generated by co-production, by genre 2007-2010 83
10.3 Number of TV programmes and hours generated by programme exchange 2007-2010 83
10.4 Number of TV programmes generated by programme exchange, by genre 2009-2010 84
Table 11 Private television programming by content 2000-2010 (per cent)
11.1 Private television programming in Denmark by content 2000-2010 85
11.2 Private television programming in Finland by content 2000-2010 86
11.3 Private television programming in Iceland by content 2000-2010 87
11.4 Private television programming in Norway by content 2000-2010 87
11.5 Private television programming in Sweden by content 2000-2010 88
Table 12 Private television programming by origin 2000-2010 (per cent)
12.1 Private television programming in Finland by origin 2000-2010 89
12.2 Private television programming in Iceland by origin 2000-2010 89
12.3 Private television programming in Norway by origin 2000-2010 90
12.4 Private television programming in Sweden by origin 2000–2010 90
Viewing
Table 13 Television daily reach 2000-2011 (per cent) 91
Table 14 Public service television daily reach 2000-2010 (per cent) 91
Figure 15 Public service television daily reach 2000-2010 (per cent) 92
Table 16 Public service television daily reach by age 2000-2010 (per cent) 93
Table 17 The five TV channels with largest daily reach 2011. Reach 2000-2011 (per cent) 94
Figure 18 The five TV channels with largest daily reach per country 2011 95
Table 19 The five TV channels with largest daily reach 2010/2011. Reach by sex and age (per cent) 95
Table 20 Total daily TV viewing time 2000-2011 (minutes) 97
Table 21 Public service TV audience shares 2000-2011 (per cent) 97
Figure 22 Public service TV audience shares 2000-2011 (per cent) 98
Table 23 Public service TV audience shares by age 2000-2011 (per cent) 99
Table 24 The TV channel families with the largest audience shares 2011. Shares 2000-2011 (per cent) 100
Figure 25 The TV channel families with the largest audience shares 2010/2011 102
Table 26 The five TV channels with the largest audience shares 2011. Shares 2000-2011 (per cent) 103
Table 27 The five TV channels with the largest audience shares 2010/2011. Shares by sex and age (per cent) 105
Definitions & Abbreviations 106

TELEVISION
NORDICOM 55 Nordic Public Service Media Map 1/2012
1. Number of TV channels in terrestrial networks 2000-2011
2000 2001 2002 2003 2004 2005 2006 2007 2008 2009 2010 2011
Finland1
Public Nationwide 2 5 5 5 5 5 5 6 5 5 5 4 - of which free-to-air 2 5 5 5 5 5 5 5 4 4 4 4
Private Nationwide 2 5 5 5 8 13 14 22 22 23 23 27 - of which free-to-air 2 4 4 4 4 5 5 6 6 9 9 8
Regional/local .. .. .. .. .. .. .. .. .. .. .. .. - of which free-to-air ~20 ~20 ~20 ~20 ~20 ~20 ~20 ~20 ~20 ~20 ~20 ~20
Iceland2
Public Nationwide 1 1 1 1 1 1 1 1 1 1 1 1 - of which free-to-air 1 1 1 1 1 1 1 1 1 1 1 1
Private Nationwide 3 3 3 3 3 3 3 3 3 3 3 3 - of which free-to-air 1 1 1 1 1 1 1 1 1 1 – –
Regional/local 5 5 5 7 7 8 5 5 5 5 5 5 - of which free-to-air 4 4 4 4 4 5 3 2 2 2 2 2
Norway3
Public Nationwide 2 2 2 2 2 2 2 3 3 3 3 3 - of which free-to-air 2 2 2 2 2 2 2 3 3 3 3 3
Regional windows 9 9 10 10 10 10 10 10 10 12 12 12
Nationwide, foreign4 – – – – – – – 1 1 1 3 3
Private Nationwide 1 1 1 1 1 1 1 18 18 19 25 27 - of which free-to-air 1 1 1 1 1 1 1 1 1 2 1 3
Local5 59 60 56 53 37 37 34 24 21 13 12 14 - of which free-to-air 59 60 56 53 37 37 34 24 21 13 12 14
Sweden6
Public Nationwide 3 3 4 5 4 5 5 5 5 5 5 5 - of which free-to-air 3 3 4 5 4 5 5 5 5 5 5 5
Regional windows 11 11 11 11 11 11 11 11 11 11 11 11
Private Nationwide 12 16 12 16 25 27 33 32 32 28 35 40 - of which free-to-air 1 1 1 1 4 1 5 5 3 2 2 1
Local 2 2 2 2 2 2 6 4 4 5 5 7 - of which free-to-air7 2 2 2 2 2 2 6 4 4 5 5 7
1 Channels in terrestrial networks by the end of each year. DTT broadcasts started in Finland in August 2001, and analogue broadcasting was discontinued by the end of August 2007.
2 End-of-year data. Terrestrial analogue only until 2005, when DTT broadcasts started late 2005. The analogue distribution system is operating until end-of-year 2012.3 Channels in terrestrial networks by September 2011. DTT broadcasts started in Norway Fall 2007 and analogue broadcasting was discontinued by the end of 2009.4 Swedish SVT1 and SVT2 plus BBC World Service.5 Number of operating local TV stations registered as members of the Norwegian Media Businesses’ Association.6 Channels in terrestrial networks in Spring (March-May) each year. DTT broadcasts started in Sweden Fall 1999 and the analogue switch-off took place in December
2007.7 The local channels do not have the option for encrypted transmissions.
Note 1: Excluding simulcast HD channels.
Note 2: Time series for Denmark not available. DTT broadcasts started in Denmark in April 2006 and analogue broadcasting was switched off November 1 2009.
Sources: Statistics Finland, Ministry of Transport and Communications (Finland), Statistics Iceland, www.medienorge.uib.no, Swedish Broadcasting Authority, Nordicom.
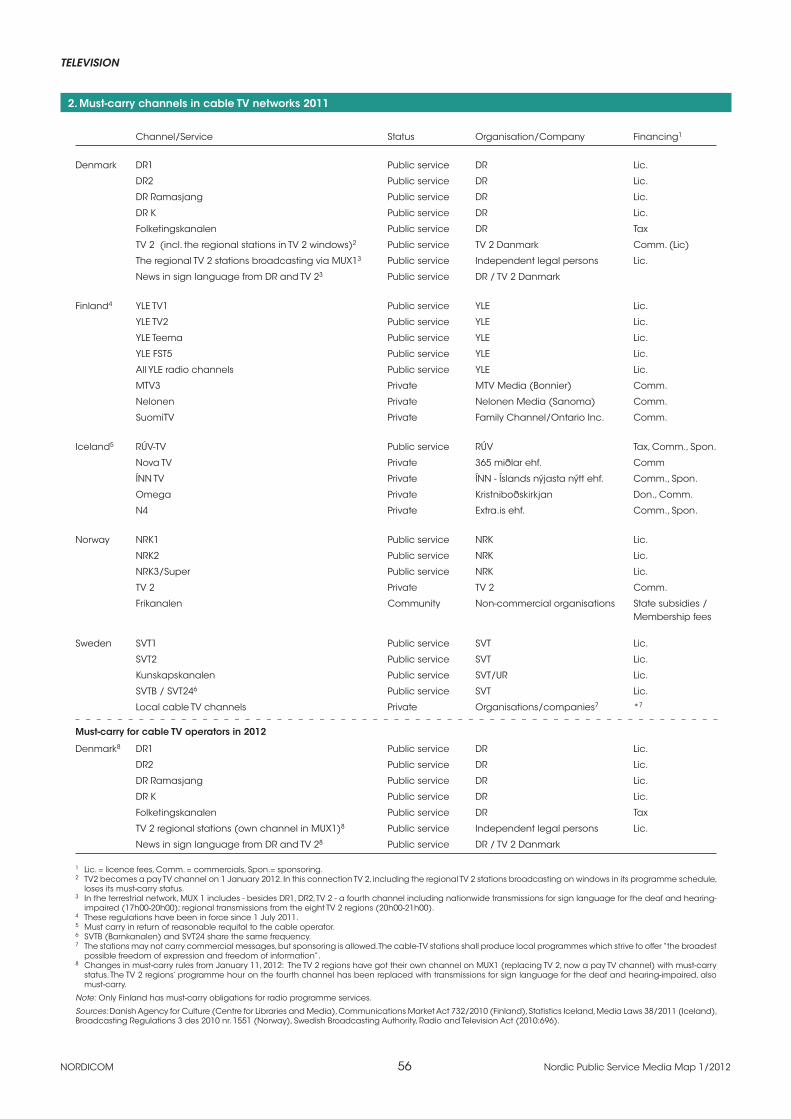
NORDICOM 56 Nordic Public Service Media Map 1/2012
TELEVISION
2. Must-carry channels in cable TV networks 2011
Channel/Service Status Organisation/Company Financing1
Denmark DR1 Public service DR Lic.
DR2 Public service DR Lic.
DR Ramasjang Public service DR Lic.
DR K Public service DR Lic.
Folketingskanalen Public service DR Tax
TV 2 (incl. the regional stations in TV 2 windows)2 Public service TV 2 Danmark Comm. (Lic)
The regional TV 2 stations broadcasting via MUX13 Public service Independent legal persons Lic.
News in sign language from DR and TV 23 Public service DR / TV 2 Danmark
Finland4 YLE TV1 Public service YLE Lic.
YLE TV2 Public service YLE Lic.
YLE Teema Public service YLE Lic.
YLE FST5 Public service YLE Lic.
All YLE radio channels Public service YLE Lic.
MTV3 Private MTV Media (Bonnier) Comm.
Nelonen Private Nelonen Media (Sanoma) Comm.
SuomiTV Private Family Channel/Ontario Inc. Comm.
Iceland5 RÚV-TV Public service RÚV Tax, Comm., Spon.
Nova TV Private 365 miðlar ehf. Comm
ÍNN TV Private ÍNN - Íslands nýjasta nýtt ehf. Comm., Spon.
Omega Private Kristniboðskirkjan Don., Comm.
N4 Private Extra.is ehf. Comm., Spon.
Norway NRK1 Public service NRK Lic.
NRK2 Public service NRK Lic.
NRK3/Super Public service NRK Lic.
TV 2 Private TV 2 Comm.
Frikanalen Community Non-commercial organisations State subsidies / Membership fees
Sweden SVT1 Public service SVT Lic.
SVT2 Public service SVT Lic.
Kunskapskanalen Public service SVT/UR Lic.
SVTB / SVT246 Public service SVT Lic.
Local cable TV channels Private Organisations/companies7 *7
Must-carry for cable TV operators in 2012
Denmark8 DR1 Public service DR Lic.
DR2 Public service DR Lic.
DR Ramasjang Public service DR Lic.
DR K Public service DR Lic.
Folketingskanalen Public service DR Tax
TV 2 regional stations (own channel in MUX1)8 Public service Independent legal persons Lic.
News in sign language from DR and TV 28 Public service DR / TV 2 Danmark
1 Lic. = licence fees, Comm. = commercials, Spon.= sponsoring.2 TV2 becomes a pay TV channel on 1 January 2012. In this connection TV 2, including the regional TV 2 stations broadcasting on windows in its programme schedule,
loses its must-carry status. 3 In the terrestrial network, MUX 1 includes - besides DR1, DR2, TV 2 - a fourth channel including nationwide transmissions for sign language for the deaf and hearing-
impaired (17h00-20h00); regional transmissions from the eight TV 2 regions (20h00-21h00). 4 These regulations have been in force since 1 July 2011.5 Must carry in return of reasonable requital to the cable operator.6 SVTB (Barnkanalen) and SVT24 share the same frequency. 7 The stations may not carry commercial messages, but sponsoring is allowed. The cable-TV stations shall produce local programmes which strive to offer ”the broadest
possible freedom of expression and freedom of information”.8 Changes in must-carry rules from January 11, 2012: The TV 2 regions have got their own channel on MUX1 (replacing TV 2, now a pay TV channel) with must-carry
status. The TV 2 regions’ programme hour on the fourth channel has been replaced with transmissions for sign language for the deaf and hearing-impaired, also must-carry.
Note: Only Finland has must-carry obligations for radio programme services.
Sources: Danish Agency for Culture (Centre for Libraries and Media), Communications Market Act 732/2010 (Finland), Statistics Iceland, Media Laws 38/2011 (Iceland), Broadcasting Regulations 3 des 2010 nr. 1551 (Norway), Swedish Broadcasting Authority, Radio and Television Act (2010:696).

TELEVISION
NORDICOM 57 Nordic Public Service Media Map 1/2012
3. The largest TV companies and their channels
3.1 The largest TV companies in Denmark and their channels 2010
Company Penetration Year audience Company (Owner) Channels Financing1 Free-to-air (%)2 Distribution3 established share (%)
Public service
DR DR1 Lic. x 99 T/C/S 1951 28
(State) DR2 Lic. x 99 T/C/S 1996
DR Update4 Lic. x 59 T/C/S 2008
DR Ramasjang Lic. x 78 T/C/S 2009
DR K Lic. x 76 T/C/S 2009
DR HD Lic. x 38 T/C/S 2009
TV 2 / Danmark TV 25 Comm., Sub. x 99 T/C/S 1988 385
(State) TV 2: 8 regional stations5,6 Lic. x .. T/C 1989-1991 (2009)6
Publicly owned – not public service
TV 2 / Danmark TV 2 Zulu Comm., Sub. 73 T/C/S 2000 385
(State) TV 2 Charlie Comm., Sub. 72 T/C/S 2004
TV 2 Film Sub. 59 T/C/S 2005
TV 2 News Comm., Sub. 63 T/C/S 2006
TV 2 Sport7 Comm., Sub. 50 T/C/S 2007
TV 2 Sport HD7 Comm., Sub. 9 T/C/S 2008
The largest private TV groups
MTG7,8,9 TV3 Comm., Sub. 70 C/S 1987 10
TV3+ Comm., Sub. 63 C/S 1996
TV 3+ HD Comm., Sub. 10 C/S 2010
TV3 PULS Comm., Sub. 48 C/S 2009
SBS TV9 Kanal 4 Comm., Sub. 66 T/C/S 1997 7
(ProSiebenSat.1 Media) Kanal 5 Comm., Sub. 62 T/C/S 2000
Kanal 5 HD Comm., Sub. 9 C/S 2009
6’eren Comm., Sub. 55 T/C/S 2009
The Voice TV Comm., Sub. 36 T/C/S 2004
C More Entertainment
(Bonnier/Telenor)10 Canal 9 Comm., Sub. .. T/C/S 2009 ..
1 Lic. = licence fees, Comm. = commercials, Sub. = subscription fees.2 Data are based on sample surveys and describe channel penetration awareness among the population for weeks 13-25 2010 (April-June).3 T = terrestrial, C = cable, S = satellite.4 DR Update started as a web channel in 2007, but since 2008 it has also been available via the digital terrestrial network, cable and satellite.5 Only TV 2’s main channel and the TV 2 regions are public service; the other channels have no public service obligations. The audience share of 38% includes all TV
2 channels.6 The TV 2 regions are eight independent stations (independent legal persons), transmitting in regional windows in the TV 2 main channel, and since 2009 also on the
4th channel in MUX1 (20h00-21h00). From 2012 the eight regional TV stations will have their own channel in MUX 1. 7 TV 2 Sport is a joint venture between TV 2/Danmark (51%) and MTG (49%). 8 MTG’s channels of more pan-Nordic character (pay-TV channels TV1000 and other Viasat channels) are not included here.9 All these channels are registered in London/Ofcom, and are thus under UK jurisdiction.10 C More Entertainment is owned by Bonnier’s subsidiary TV4 AB (65%) and Telenor (35%).
Sources: Danish Agency for Culture (Centre for Libraries and Media), www.boxertv.dk, TNS Gallup Denmark.

NORDICOM 58 Nordic Public Service Media Map 1/2012
TELEVISION
3. Cont. The largest TV companies and their channels
3.2 The three largest TV companies in Finland and their channels 2011 (Spring) Company audience Penetration Year share Company (Owner) Channels Financing1 Free-to-air (%)2 Distribution3 established 2010 (%)
Public service
YLE YLE TV1 Lic. x 100 T/C/S 1958 45
(State) YLE TV2 Lic. x 100 T/C/S 1956/1965
YLE Teema Lic. x 100 T/C/S 2001
FST5 Lic. x 100 T/C/S 2001
The largest private TV groups
MTV Media MTV3 Comm. x 100 T/C/S 1957 30
(Bonnier) Sub Comm. x 100 T/C/S 2001
AVA Comm. x – C 2008
MTV3 Max Sub. & Comm. 100 T/C/S 2001/2006
MTV3 Juniori Sub. & Comm. 100 T/C/S 2006
MTV3 Leffa Sub. & Comm. 100 T/C/S 2006
MTV3 Fakta Sub. & Comm. 95 T/C/S 2007
MTV3 Komedia Sub. & Comm. – C 2011
MTV3 Sarja Sub. & Comm. – C 2008
MTV3 Scifi Sub. & Comm. – C 2008
Canal+ (4 –12 channels)4 Sub. 90 T/C/S 2004
Nelonen Media Nelonen Comm. x 100 T/C/S 1997 15
(Sanoma) JIM Comm. x 100 T/C/S 2001/2007
Liv Comm. x 95 T/C/S 2009
KinoTV Sub. 95 T/C/S 2007
Nelonen Pro1 Sub. & Comm. 90 T/C/S 2001
Nelonen Pro2 Sub. & Comm. 78 T/C/S 2007
Nelonen Perhe Sub. & Comm. 95 T/C 2011
Nelonen Maailma Sub. & Comm. 95 T/C 2011
1 Lic. = licence fees, Comm. = commercials, Sub. = subscription fees. 2 Technical penetration in terrestrial networks.3 T = terrestrial, C = cable, S = satellite.4 The Canal+ channels are operated by C More Entertainment AB, which is owned by Bonnier’s subsidiary TV4 AB (65%) and Telenor (35%).
Sources: www.digitv.fi, company websites, Ministry of Transport and Communications, Finnish Mass Media 2009 (Statistics Finland, 2010).

TELEVISION
NORDICOM 59 Nordic Public Service Media Map 1/2012
3. Cont. The largest TV companies and their channels
3.3 The largest TV companies in Iceland and their channels 2010 (end-of-year)
Company Penetration Year audience Company (Owner) Channels Coverage1 Financing2 Free-to-air (%)3 Distribution3 established share (%)4
Public service
RÚV RÚV Nationwide Tax, Comm., Spon. x 100 T/C/DSL 1966 48
(State)
The largest private TV groups
365 miðlar ehf. Stöð 2 Nationwide Sub., Comm., Spon. <100 T/C/DSL/DTT 1986 42
Stöð 2 Sport Nationwide Sub., Comm., Spon. 95> DSL/DTT 1995 (including the windows Stöð 2 Sport 2, 3, 4, 5, 6)
Stöð 2 Bíó Nationwide Sub., Comm. 90> DSL/DTT 1998
Stöð 2 Extra Nationwide Sub., Comm. 90> DSL/DTT 2005
Nova TV Nationwide Comm. x 90> DSL/DTT 2008
Skjárinn ehf. Skjár 15 Nationwide Sub., Comm., Spon. 90> T/C/DSL/DTT 1998 10
(Skipti ehf.) Skjár Golf Nationwide Sub., Comm., Spon. 90> DSL/DTT 2010
1 A ’nationwide channel’ should reach at least 90% of the population.2 Tax = a special fee imposed on all individuals and legal persons, Comm. = commercials, Sub. = subscription fees. Spon. = sponsoring.3 T= analogue terrestrial, DTT= digital terrestrial, C = cable, DSL = digital subscriber line.4 Audience share for week 42, October 2010.5 Skjár 1 is a pay channel since 17th November 2009 (previously free-to-air).
Source: Statistics Iceland.

NORDICOM 60 Nordic Public Service Media Map 1/2012
TELEVISION
3. Cont. The largest TV companies and their channels
3.4 The largest TV companies in Norway and their channels in 2011 (Summer) Company audience Penetration Year share Company (Owner) Channels Financing1 Free-to-air (%)2 Distribution3 established 2010 (%)
Public service
NRK NRK1 Lic. x 98 T/C/S 1960 41
(State) NRK2 Lic. x 98 T/C/S 1996
NRK3/Super Lic. x 96 T/C/S 2007
12 regional NRK-windows Lic. x .. T/C/S From 1985
The largest private TV groups
TV 2 Group TV 2 Comm. 96 T/C/S 1992 27
(Egmont/A-pressen)4 TV 2 Zebra5 Comm. 84 T/C/S 2004
TV 2 Filmkanalen Sub. 54 T/C/S 2006
TV 2 Nyhetskanalen Sub. 82 T/C/S 2007
TV 2 Sport5 Sub. .. T/C/S 2007
TV 2 Bliss Comm. 54 T/C/S 2010
TV 2 Barclay Premier League Sub. .. T/C/S 2010
SBS Broadcasting TVNorge Comm. 93 T/C/S 1988 10
(ProSiebenSat.1 Media) Fem Comm. 69 T/C/S 2007
Max Comm. 53 T/C/S 2010
MTG6 TV3 Comm. 90 T/C/S 1988 10
Viasat4 Comm. 73 T/C/S 2007
Viasat Sport Sub. .. C/S 2008
Viasat Fotball Sub. .. C/S 2009
1 Lic. = licence fees, Comm. = commercials, Sub. = subscription fees.2 Data describe channel penetration awareness among the population, August 2011.3 T = terrestrial, C = cable, S = satellite. 4 The TV 2 Group is wholly owned by Egmont (including 100% of TV 2 Zebra and TV 2 Sport) since January 2012.5 Co-owned with Telenor Broadcast (Norwegian state) until early 2012, when Telenor sold its shares to the TV 2 Group.6 MTG’s channels of more pan-Nordic character (pay-TV channels TV1000 and other Viasat channels) are not included here.
Note: Norwegian channels only.
Sources: NRK, TV 2, TNS Gallup (processed), medianorway.
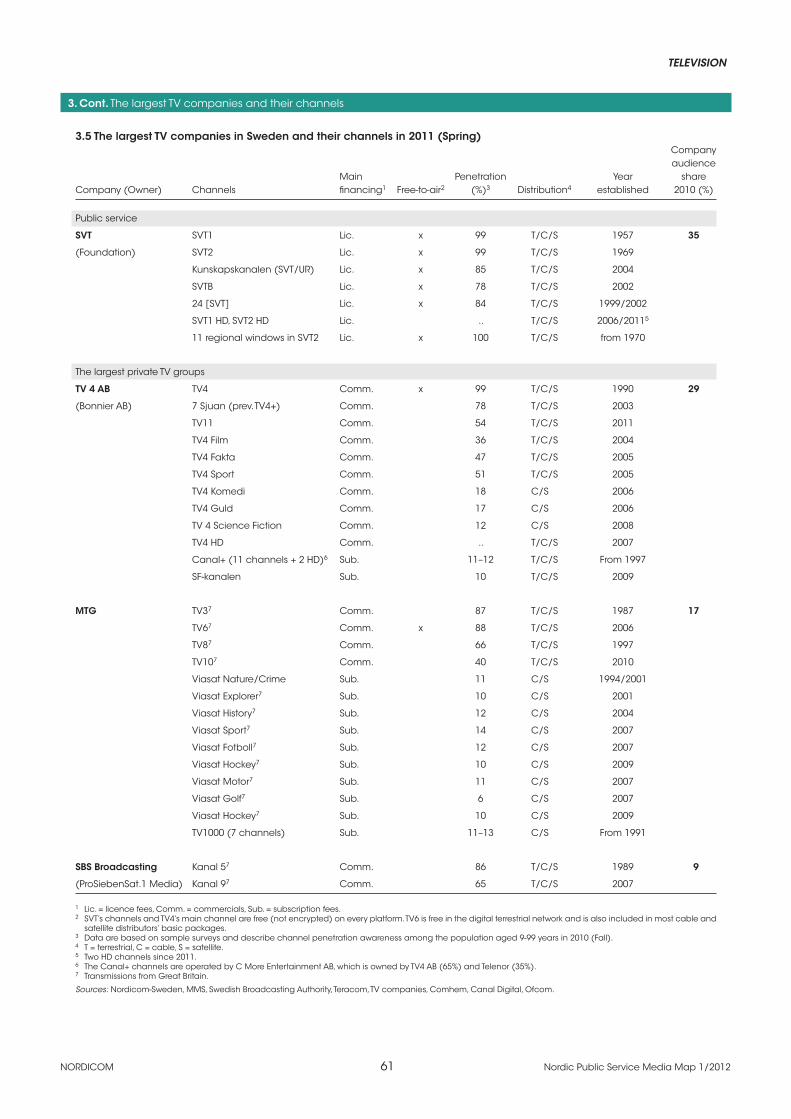
TELEVISION
NORDICOM 61 Nordic Public Service Media Map 1/2012
3. Cont. The largest TV companies and their channels
3.5 The largest TV companies in Sweden and their channels in 2011 (Spring) Company audience Main Penetration Year share Company (Owner) Channels financing1 Free-to-air2 (%)3 Distribution4 established 2010 (%)
Public service
SVT SVT1 Lic. x 99 T/C/S 1957 35
(Foundation) SVT2 Lic. x 99 T/C/S 1969
Kunskapskanalen (SVT/UR) Lic. x 85 T/C/S 2004
SVTB Lic. x 78 T/C/S 2002
24 [SVT] Lic. x 84 T/C/S 1999/2002
SVT1 HD, SVT2 HD Lic. .. T/C/S 2006/20115
11 regional windows in SVT2 Lic. x 100 T/C/S from 1970
The largest private TV groups
TV 4 AB TV4 Comm. x 99 T/C/S 1990 29
(Bonnier AB) 7 Sjuan (prev. TV4+) Comm. 78 T/C/S 2003
TV11 Comm. 54 T/C/S 2011
TV4 Film Comm. 36 T/C/S 2004
TV4 Fakta Comm. 47 T/C/S 2005
TV4 Sport Comm. 51 T/C/S 2005
TV4 Komedi Comm. 18 C/S 2006
TV4 Guld Comm. 17 C/S 2006
TV 4 Science Fiction Comm. 12 C/S 2008
TV4 HD Comm. .. T/C/S 2007
Canal+ (11 channels + 2 HD)6 Sub. 11–12 T/C/S From 1997
SF-kanalen Sub. 10 T/C/S 2009
MTG TV37 Comm. 87 T/C/S 1987 17
TV67 Comm. x 88 T/C/S 2006
TV87 Comm. 66 T/C/S 1997
TV107 Comm. 40 T/C/S 2010
Viasat Nature/Crime Sub. 11 C/S 1994/2001
Viasat Explorer7 Sub. 10 C/S 2001
Viasat History7 Sub. 12 C/S 2004
Viasat Sport7 Sub. 14 C/S 2007
Viasat Fotboll7 Sub. 12 C/S 2007
Viasat Hockey7 Sub. 10 C/S 2009
Viasat Motor7 Sub. 11 C/S 2007
Viasat Golf7 Sub. 6 C/S 2007
Viasat Hockey7 Sub. 10 C/S 2009
TV1000 (7 channels) Sub. 11–13 C/S From 1991
SBS Broadcasting Kanal 57 Comm. 86 T/C/S 1989 9
(ProSiebenSat.1 Media) Kanal 97 Comm. 65 T/C/S 2007
1 Lic. = licence fees, Comm. = commercials, Sub. = subscription fees.2 SVT’s channels and TV4’s main channel are free (not encrypted) on every platform. TV6 is free in the digital terrestrial network and is also included in most cable and
satellite distributors’ basic packages. 3 Data are based on sample surveys and describe channel penetration awareness among the population aged 9-99 years in 2010 (Fall).4 T = terrestrial, C = cable, S = satellite. 5 Two HD channels since 2011.6 The Canal+ channels are operated by C More Entertainment AB, which is owned by TV4 AB (65%) and Telenor (35%). 7 Transmissions from Great Britain.
Sources: Nordicom-Sweden, MMS, Swedish Broadcasting Authority, Teracom, TV companies, Comhem, Canal Digital, Ofcom.

NORDICOM 62 Nordic Public Service Media Map 1/2012
TELEVISION4.
TV
ch
an
ne
ls in
ea
ch
co
un
try
4.1
Da
nis
h T
V c
ha
nn
els
201
0
Pen
etra
tion
Yea
r St
atu
s C
ove
rag
e
Ch
an
ne
l M
ajo
r ow
ne
r Fi
na
nc
ing
1 Fr
ee
-to-a
ir (%
)2 D
istr
ibu
tion
3 e
sta
blis
he
d
Pub
lic s
erv
ice
N
atio
nw
ide
D
R1
Sta
te
Lic
. x
99
T/C
/S
1951
DR2
St
ate
Li
c.
x 99
T/
C/S
19
96
DR
Up
da
te4
Sta
te
Lic
. x
59
T/C
/S
2008
DR
Ram
asj
an
g
Sta
te
Lic
. x
78
T/C
/S
2009
(N
ov.
)
DR
K St
ate
Li
c.
x 76
T/
C/S
20
09 (
No
v.)
DR
HD
St
ate
Li
c.
x 38
T/
C/S
20
09 (
No
v.)
Folk
etin
gsk
an
ale
n
Sta
te
Tax
x ..
T/C
20
09 (
No
v.)
TV 2
5 St
ate
C
om
m.
x 99
T/
C/S
19
88
MU
X 1,
the
4th
ch
an
nel
:6 St
ate
Li
c.
x ..
T/C
20
09 (
No
v.)
Fro
m 1
7h00
-20h
00:
Sig
n la
ng
ua
ge
for d
ea
f an
d
he
arin
g-im
pa
ired
Fr
om
20h
00-2
1h00
:
TV
2 re
gio
ns
(se
e b
elo
w)
Fro
m 2
1h00
-17h
00:
No
n-c
om
me
rcia
l re
gio
na
l or
na
tion
al T
V s
tatio
ns
Re
gio
na
l4 TV
2: 8
reg
ion
al s
tatio
ns7
Sta
te
Lic
. x
.. T/
C
1989
-199
1
Pub
licly
ow
ne
d,
Na
tion
wid
e
TV 2
Zu
lu
Sta
te
Co
mm
., Su
b.
73
T/
C/S
20
00n
ot p
ub
lic s
erv
ice
TV 2
Ch
arli
e
Sta
te
Co
mm
., Su
b.
72
T/
C/S
20
04
TV 2
Film
St
ate
Su
b.
59
T/
C/S
20
05
TV 2
New
s St
ate
C
om
m.,
Sub
.
63
T/C
/S
2006
TV 2
Sp
ort
8 St
ate
/MTG
C
om
m.,
Sub
.
50
T/C
/S
2007
TV 2
Sp
ort
HD
8 St
ate
/MTG
C
om
m.,
Sub
.
9 T/
C/S
20
08
Priv
ate
, co
mm
. N
atio
nw
ide
TV
39 M
TG
Co
mm
., Su
b.
70
C
/S
1987
TV3+
9 M
TG
Co
mm
., Su
b.
63
C
/S
1996
TV 3
+ H
D9
MTG
C
om
m.,
Sub
.
10
C/S
20
10
TV3
PULS
9 M
TG
Co
mm
., Su
b.
48
C
/S
2009
Kan
al 4
9 SB
S TV
(Pr
oSi
eb
en
) C
om
m.,
Sub
.
66
T/C
/S
1997
Kan
al 5
9 SB
S TV
(Pr
oSi
eb
en
) C
om
m.,
Sub
.
62
T/C
/S
2000
Kan
al 5
HD
9 SB
S TV
(Pr
oSi
eb
en
) C
om
m.,
Sub
.
9 C
/S
2009
6’e
ren
9 SB
S TV
(Pr
oSi
eb
en
) C
om
m.,
Sub
.
55
T/C
/S
2009
The
Vo
ice
TV
9 SB
S TV
(Pr
oSi
eb
en
) C
om
m.,
Sub
.
36
C/S
20
04
Ca
na
l 910
C
Mo
re E
nte
rta
inm
en
t
(Bo
nn
ier/
TV4
AB
65%
, Te
len
or 3
5%)
Co
mm
., Su
b.
..
T/C
/S
2009
Co
nt.

TELEVISION
NORDICOM 63 Nordic Public Service Media Map 1/2012
4.1
Co
nt.
Da
nis
h T
V c
ha
nn
els
201
0
Pen
etra
tion
Yea
r St
atu
s C
ove
rag
e
Ch
an
ne
l M
ajo
r ow
ne
r Fi
na
nc
ing
1 Fr
ee
-to-a
ir (%
)2 D
istr
ibu
tion
3 e
sta
blis
he
d
Priv
ate
, N
atio
nw
ide
44
sta
tion
s6 Pr
iva
te, n
on
-co
mm
erc
ial
Sub
sid
ies/
gra
nts
fro
m th
e s
tate
.. T/
C
no
n-c
om
m.
Reg
ion
al
171
sta
tion
s6 Pr
iva
te, n
on
-co
mm
erc
ial
Sub
sid
ies/
gra
nts
fro
m th
e s
tate
.. T/
C
Re
gio
na
l/lo
ca
l 12
6 st
atio
ns
Priv
ate
, no
n-c
om
me
rcia
l Su
bsi
die
s/g
ran
ts fr
om
the
sta
te
..
C
1983
(tr
ial p
erio
d)
1987
(p
erm
an
en
t
la
w)
1 L
ic. =
lic
en
ce
fee
s, C
om
m. =
co
mm
erc
ials
, Su
b. =
su
bsc
riptio
n fe
es.
2 D
ata
are
ba
sed
on
sa
mp
le s
urv
eys
an
d d
esc
ribe
ch
an
ne
l pe
ne
tratio
n a
wa
ren
ess
am
on
g th
e p
op
ula
tion
.3
T =
terre
stria
l, C
= c
ab
le, S
= s
ate
llite
.4
DR
Up
da
te w
as
lau
nc
he
d a
s a
we
b c
ha
nn
el i
n 2
007,
bu
t sin
ce
200
8 it
ha
s a
lso
be
en
ava
ilab
le v
ia th
e d
igita
l te
rrest
rial n
etw
ork
, ca
ble
an
d s
ate
llite
.5
On
ly T
V 2
’s m
ain
ch
an
ne
l is
pu
blic
se
rvic
e; t
he
oth
ers
ha
ve n
o p
ub
lic s
erv
ice
ob
liga
tion
s.6
In
th
e t
err
est
rial n
etw
ork
, MU
X 1
an
d 2
are
for
pu
blic
se
rvic
e t
ele
visi
on
. MU
X 1
inc
lud
es
DR1
, DR2
, TV
2, p
lus
a fo
urt
h c
ha
nn
el i
nc
lud
ing
na
tion
wid
e t
ran
smis
sio
ns
for
sig
n la
ng
ua
ge
for
the
de
af
an
d h
ea
ring
-imp
aire
d
(17h
00-2
0h00
); re
gio
na
l tra
nsm
issi
on
s fro
m th
e e
igh
t TV
2 re
gio
ns
(20h
00-2
1h00
); a
nd
priv
ate
no
n-c
om
me
rcia
l n
atio
nw
ide
an
d re
gio
na
l TV
(21
h00
-17h
00).
Na
tion
wid
e n
on
-co
mm
erc
ial T
V b
roa
dc
ast
s to
tal t
hre
e h
ou
rs in
this
tim
e fr
am
e, a
nd
the
rem
ain
ing
ho
urs
are
reg
ion
al n
on
-co
mm
erc
ial t
ele
visi
on
.
7 E
igh
t re
gio
na
l win
do
ws
in T
V 2
, ba
sed
on
ind
ep
en
de
nt
sta
tion
s (i
nd
ep
en
de
nt
leg
al p
ers
on
s). T
hey
ca
rry
co
m-
me
rcia
ls, f
rom
wh
ich
TV
2 re
ce
ive
s th
e re
ven
ue
. Th
e e
igh
t re
gio
ns
ha
ve a
lso
be
en
gra
nte
d a
n a
dd
itio
na
l ho
ur
in M
UX
1 (2
0h00
-21h
00),
an
d b
eg
inn
ing
in 2
012
they
will
ha
ve th
eir
ow
n c
ha
nn
el i
n M
UX
1.
8 T
V 2
Sp
ort
is a
join
t ve
ntu
re b
etw
ee
n T
V 2
De
nm
ark
(51
%)
an
d M
TG (
49%
). 9
All
the
se c
ha
nn
els
are
reg
iste
red
in L
on
do
n/O
fco
m, a
nd
are
thu
s u
nd
er U
K ju
risd
ictio
n.
10 R
eg
iste
red
in S
we
de
n (
The
Sw
ed
ish
Bro
ad
ca
stin
g A
uth
orit
y).
Sou
rce
s: D
an
ish
Ag
en
cy
for C
ultu
re (
Ce
ntre
for L
ibra
ries
an
d M
ed
ia),
ww
w.b
oxe
rtv.
dk,
TN
S G
allu
p D
en
ma
rk.

NORDICOM 64 Nordic Public Service Media Map 1/2012
TELEVISION4.
2 TV
ch
an
ne
ls in
Fin
lan
d 2
011
(Sp
ring
)
Sta
tus
Ch
an
ne
l O
wn
er
Fin
an
cin
g1
Pen
etra
tion
(%
)2 D
istr
ibu
tion
3 Ye
ar e
sta
blis
he
d
Fre
e-T
V
Pub
lic s
erv
ice
YL
E TV
1 St
ate
Li
c.
100
T/C
/S
1958
YL
E TV
2 St
ate
Li
c.
100
T/C
/S
1956
/196
5
YL
E Te
em
a
Sta
te
Lic
. 10
0 T/
C/S
20
01
FS
T5
Sta
te
Lic
. 10
0 T/
C/S
20
01
Priv
ate
M
TV3
MTV
Me
dia
(Bo
nn
ier)
C
om
m.
100
T/C
/S
1957
Su
b
MTV
Me
dia
(Bo
nn
ier)
C
om
m.
100
T/C
/S
2001
AV
A
MTV
Me
dia
(Bo
nn
ier)
C
om
m.
– C
20
08
N
elo
ne
n
Ne
lon
en
Me
dia
(Sa
no
ma
) C
om
m.
100
T/C
/S
1997
JI
M
Ne
lon
en
Me
dia
(Sa
no
ma
) C
om
m.
100
T/C
/S
2001
/200
7
Li
v N
elo
ne
n M
ed
ia (
San
om
a)
Co
mm
. 95
T/
C/S
20
09
Th
e V
oic
e
SBS
Bro
ad
ca
stin
g (
Pro
Sie
be
nSa
t.1 M
ed
ia)
Co
mm
. 95
T/
C
2004
/201
1
TV
Viis
i SB
S Br
oa
dc
ast
ing
(Pr
oSi
eb
en
Sat.1
Me
dia
) C
om
m.
90
T/C
20
08/2
011
Su
om
iTV
Fa
mily
Ch
an
ne
l/O
nta
rio In
c.
Co
mm
. 10
0 T/
C
2009
Pay-
TV
Pub
lic s
erv
ice
SV
T W
orld
SV
T (S
we
dis
h s
tate
) Li
c. &
Su
b.
100
T/C
/S
1988
Priv
ate
M
TV3
Ma
x M
TV M
ed
ia (
Bon
nie
r)
Sub
. & C
om
m.
100
T/C
/S
2001
/200
6
M
TV3
Jun
iori
MTV
Me
dia
(Bo
nn
ier)
Su
b. &
Co
mm
. 10
0 T/
C/S
20
06
M
TV3
Leffa
M
TV M
ed
ia (
Bon
nie
r)
Sub
. & C
om
m.
100
T/C
/S
2006
M
TV3
Fakt
a
MTV
Me
dia
(Bo
nn
ier)
Su
b. &
Co
mm
. 95
T/
C/S
20
07
M
TV3
Kom
ed
ia
MTV
Me
dia
(Bo
nn
ier)
Su
b. &
Co
mm
. –
C
2011
M
TV3
Sarja
M
TV M
ed
ia (
Bon
nie
r)
Sub
. & C
om
m.
– C
20
08
M
TV3
Scifi
M
TV M
ed
ia (
Bon
nie
r)
Sub
. & C
om
m.
– C
20
08
C
an
al+
(4
- 12
ch
an
ne
ls)
C M
ore
En
tert
ain
me
nt (
Bon
nie
r/TV
4 65
%, T
ele
no
r 35%
) Su
b.
90
T/C
/S
2004
Ki
no
TV
Ne
lon
en
Me
dia
(Sa
no
ma
) Su
b.
95
T/C
/S
2007
N
elo
ne
n P
ro1
Ne
lon
en
Me
dia
(Sa
no
ma
) Su
b. &
Co
mm
. 90
T/
C/S
20
01
N
elo
ne
n P
ro2
Ne
lon
en
Me
dia
(Sa
no
ma
) Su
b. &
Co
mm
. 90
T/
C/S
20
07
N
elo
ne
n P
erh
e
Ne
lon
en
Me
dia
(Sa
no
ma
) Su
b. &
Co
mm
. 95
T/
C
2011
N
elo
ne
n M
aa
ilma
N
elo
ne
n M
ed
ia (
San
om
a)
Sub
. & C
om
m.
95
T/C
20
11
D
isc
ove
ry
Dis
co
very
Co
mm
un
ica
tion
s Eu
rop
e
Co
mm
. & S
ub
. 95
T/
C/S
20
07
Co
nt.

TELEVISION
NORDICOM 65 Nordic Public Service Media Map 1/2012
4.3
Ice
lan
dic
TV
ch
an
ne
ls 2
010
(en
d-o
f-ye
ar)
Te
ch
nic
al
Yea
r St
atu
s C
ove
rag
e
Ch
an
ne
l M
ajo
r ow
ne
r Fi
na
nc
ing
1 p
en
etra
tion
(%
) D
istr
ibu
tion
2 Fr
ee
-to-a
ir e
sta
blis
he
d
Pub
lic s
erv
ice
N
atio
nw
ide
3 RÚ
V
Ríki
sútv
arp
ið o
hf.
(Th
e S
tate
) Ta
x, C
om
m.,
Spo
n.
100
T/C
/DSL
/DTT
x
1966
Priv
ate
N
atio
nw
ide
3 St
öð
2
365
mið
lar e
hf.
Sub
., C
om
m.,
Spo
n.
<100
T/
C/D
SL/D
TT
19
86
Stö
ð 2
Sp
ort
(in
clu
din
g th
e
win
do
ws
Stö
ð 2
Sp
ort
2, 3
, 4, 5
, 6)
365
mið
lar e
hf.
Sub
., C
om
m.,
Spo
n.
95>
DSL
/DTT
1995
Stö
ð 2
Bíó
36
5 m
iðla
r eh
f. Su
b.,
Co
mm
. 90
> D
SL/D
TT
19
98
Stö
ð 2
Ext
ra
365
mið
lar e
hf.
Sub
., C
om
m.
90>
DSL
/DTT
2005
No
va T
V
365
mið
lar e
hf.
Co
mm
. 90
> D
SL/D
TT
x 20
08
Skjá
r 14
Skjá
rinn
eh
f. (S
kip
ti e
hf.)
Su
b.,
Co
mm
., Sp
on
. 90
> T/
CD
SL/D
TT
19
98
Skjá
r Go
lf Sk
járin
n e
hf.
(Ski
pti
eh
f.)
Sub
., C
om
m.,
Spo
n.
90>
DSL
/DTT
2010
ÍNN
ÍN
N -
Ísla
nd
s ný
jast
a n
ýtt e
hf.
Co
mm
., Sp
on
. 90
> D
TT/D
SL
x 20
07
Om
eg
a
Kris
tnib
oð
skirk
jan
D
on
., C
om
m.
90>
T/C
/DSL
/DTT
x
1995
N45
Extra
.is e
hf.
Co
mm
., Sp
on
. 90
> T/
C/D
SL/D
TT
x 19
97
1 T
ax
= a
sp
ec
ial f
ee
imp
ose
d o
n a
ll in
div
idu
als
an
d le
ga
l pe
rso
ns,
Co
mm
. = c
om
me
rcia
ls, S
ub
. = s
ub
scrip
tion
fee
s, Sp
on
. = s
po
nso
ring
.2
T=
terre
stria
l, D
TT=
dig
ital t
erre
stria
l, C
= c
ab
le, D
SL =
dig
ital s
ub
scrib
er l
ine
.3
Th
e c
ha
nn
el s
ho
uld
rea
ch
at l
ea
st 9
0% o
f th
e p
op
ula
tion
.4
Skj
ár 1
is a
pa
y c
ha
nn
el s
inc
e 1
7th
No
vem
be
r 200
9 (p
revi
ou
sly
free
-to-a
ir).
5 P
revi
ou
sly
Aks
jón
.
Sou
rce
: Sta
tistic
s Ic
ela
nd
.
4.2
Co
nt.
TV c
ha
nn
els
in F
inla
nd
201
1 (S
prin
g)
Sta
tus
Ch
an
ne
l O
wn
er
Fin
an
cin
g1
Pen
etra
tion
(%
)2 D
istr
ibu
tion
3 Ye
ar e
sta
blis
he
d
Priv
ate
co
nt.
Euro
spo
rt
Euro
spo
rt S
A/T
F1 G
rou
p
Co
mm
. & S
ub
. 95
T/
C/S
20
07
M
TV N
ord
ic (
Fin
lan
d)
MTV
Ne
two
rks
Euro
pe
/Via
co
m
Co
mm
. & S
ub
. 95
T/
C/S
20
07
N
icke
lod
eo
n
Nic
kelo
de
on
Inte
rna
tion
al L
td/V
iac
om
Su
b.
95
T/C
/S
2007
D
isn
ey C
ha
nn
el
The
Wa
lt D
isn
ey C
om
pa
ny
Sub
. 90
T/
C/S
20
05
U
RHO
tv
Pars
ifal I
nte
rna
tion
al
Sub
. & C
om
m.
100
T/C
/S
2009
D
igiv
iihd
e
Fia
ma
x Su
b. &
Co
mm
. 90
T
2005
A
du
ltTV
A
TV-tu
ota
nto
/Un
ich
oic
e
Sub
. & C
om
m.
100
T ..
C
irca
20
loc
al T
V s
tatio
ns
Vario
us
Co
mm
. ..
T/C
..
1 L
ic. =
lic
en
ce
fee
s, C
om
m. =
co
mm
erc
ials
, Su
b. =
su
bsc
riptio
n fe
es.
2 T
ec
hn
ica
l pe
ne
tratio
n in
terre
stria
l ne
two
rks.
3 T
= te
rrest
rial,
C =
ca
ble
, S =
sa
telli
te.
Sou
rce
s: w
ww
.dig
itv.fi
, Min
istr
y o
f Tra
nsp
ort
an
d C
om
mu
nic
atio
ns,
Sta
tistic
s Fi
nla
nd
, co
mp
any
we
b p
ag
es.

NORDICOM 66 Nordic Public Service Media Map 1/2012
TELEVISION4.
4 N
orw
eg
ian
TV
ch
an
ne
ls 2
011
(Su
mm
er)
Pen
etra
tion
Yea
r St
atu
s C
ove
rag
e
Ch
an
ne
l M
ajo
r ow
ne
r Fi
na
nc
ing
1 Fr
ee
-to-a
ir (%
)2 D
istr
ibu
tion
3 e
sta
blis
he
d
Pub
lic s
erv
ice
N
atio
nw
ide
N
RK1
St
ate
Li
c.
x 98
T/
C/S
19
60
NRK
2
Sta
te
Lic
. x
98
T/C
/S
1996
NRK
3/Su
pe
r St
ate
Li
c.
x 96
T/
C/S
20
07
Re
gio
na
l 12
reg
ion
al N
RK-w
ind
ow
s St
ate
Li
c.
x ..
T/C
/S
from
198
5
Priv
ate
N
atio
nw
ide
TV
2
Egm
on
t/A
-pre
sse
n5
Co
mm
.
96
T/C
/S
1992
TV 2
Ze
bra
4 Eg
mo
nt/
A-p
ress
en
& Te
len
or5
Co
mm
.
84
T/C
/S
2004
TV 2
Film
kan
ale
n
Egm
on
t/A
-pre
sse
n5
Sub
.
54
T/C
/S
2006
TV 2
Nyh
ets
kan
ale
n
Egm
on
t/A
-pre
sse
n5
Sub
.
82
T/C
/S
2007
TV 2
Sp
ort
4 Eg
mo
nt/
A-p
ress
en
& Te
len
or5
Sub
.
.. T/
C/S
20
07
TV 2
Blis
s Eg
mo
nt/
A-p
ress
en
5 C
om
m.
54
T/
C/S
20
10
TV 2
Ba
rcla
ys P
rem
ier L
ea
gu
e
Egm
on
t/A
-pre
sse
n5
Sub
.
.. T/
C/S
20
10
TVN
org
e
SBS
Bro
ad
ca
stin
g (
Pro
Sie
be
nSa
t.1)
Co
mm
.
93
T/C
/S
1988
Fem
SB
S Br
oa
dc
ast
ing
(Pr
oSi
eb
en
Sat.1
) C
om
m.
69
T/
C/S
20
07
Ma
x SB
S Br
oa
dc
ast
ing
(Pr
oSi
eb
en
Sat.1
) C
om
m.
53
T/
C/S
20
10
TV3
MTG
C
om
m.
90
T/
C/S
19
88
Via
sat4
M
TG
Co
mm
.
73
T/C
/S
2007
Via
sat S
po
rt
MTG
Su
b.
..
C/S
20
08
Via
sat F
otb
all
MTG
Su
b.
..
C/S
20
09
Frik
an
ale
n
No
n-c
om
me
rcia
l org
an
isa
tion
s St
ate
su
bsi
die
s /
M
em
be
rsh
ip fe
es
x ..
T 20
09
Lo
ca
l 14
loc
al T
V s
tatio
ns6
Vario
us
Co
mm
. x
45
T/C
fro
m 1
982
1 L
ic. =
lic
en
ce
fee
s, C
om
m. =
co
mm
erc
ials
, Su
b. =
su
bsc
riptio
n fe
es.
2 D
ata
de
scrib
e c
ha
nn
el p
en
etra
tion
aw
are
ne
ss a
mo
ng
the
po
pu
latio
n, A
ug
ust
201
1.3
T =
terre
stria
l, C
= c
ab
le, S
= s
ate
llite
. 4
Th
e T
V 2
Gro
up
(Eg
mo
nt/
A-p
ress
en
) c
o-o
wn
ed
TV
2 Z
eb
ra a
nd
TV
2 S
po
rt w
ith Te
len
or B
roa
dc
ast
(N
orw
eg
ian
sta
te),
un
til e
arly
201
2 (s
ee
no
te 5
).5
Eg
mo
nt i
s fu
ll o
wn
er o
f th
e T
V 2
Gro
up
(in
clu
din
g 1
00%
of T
V 2
Ze
bra
an
d T
V 2
Sp
ort
) si
nc
e J
an
ua
ry 2
012.
6 N
um
be
r of o
pe
ratin
g lo
ca
l TV
sta
tion
s re
gis
tere
d a
s m
em
be
rs o
f th
e N
orw
eg
ian
Me
dia
Bu
sin
ess
es’
Ass
oc
iatio
n.
Sou
rce
s: N
RK, T
V 2
, TN
S G
allu
p (
pro
ce
sse
d),
No
rwe
gia
n M
ed
ia B
usi
ne
sse
s’ A
sso
cia
tion
, Sta
tistic
s N
orw
ay,
ww
w.m
ed
ien
org
e.u
ib.n
o.
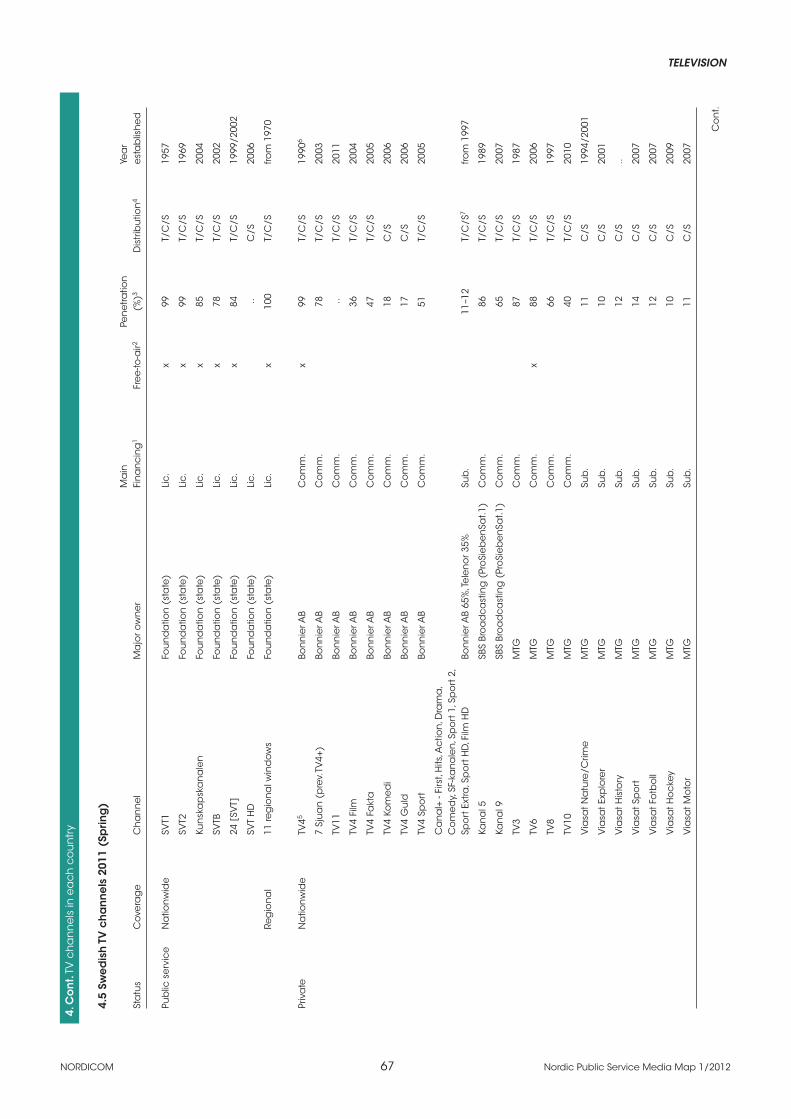
TELEVISION
NORDICOM 67 Nordic Public Service Media Map 1/2012
4. C
on
t. TV
ch
an
ne
ls in
ea
ch
co
un
try
4.5
Swe
dis
h T
V c
ha
nn
els
201
1 (S
prin
g)
Ma
in
Pe
ne
tratio
n
Ye
ar
Sta
tus
Co
vera
ge
C
ha
nn
el
Ma
jor o
wn
er
Fin
an
cin
g1
Fre
e-to
-air2
(%)3
Dis
trib
utio
n4
est
ab
lish
ed
Pub
lic s
erv
ice
N
atio
nw
ide
SV
T1
Fou
nd
atio
n (
sta
te)
Lic
. x
99
T/C
/S
1957
SVT2
Fo
un
da
tion
(st
ate
) Li
c.
x 99
T/
C/S
19
69
Kun
ska
psk
an
ale
n
Fou
nd
atio
n (
sta
te)
Lic
. x
85
T/C
/S
2004
SVTB
Fo
un
da
tion
(st
ate
) Li
c.
x 78
T/
C/S
20
02
24 [
SVT]
Fo
un
da
tion
(st
ate
) Li
c.
x 84
T/
C/S
19
99/2
002
SVT
HD
Fo
un
da
tion
(st
ate
) Li
c.
..
C/S
20
06
Re
gio
na
l 11
reg
ion
al w
ind
ow
s Fo
un
da
tion
(st
ate
) Li
c.
x 10
0 T/
C/S
fro
m 1
970
Priv
ate
N
atio
nw
ide
TV
45 Bo
nn
ier A
B C
om
m.
x 99
T/
C/S
19
906
7 Sj
ua
n (
pre
v. TV
4+)
Bon
nie
r AB
Co
mm
.
78
T/C
/S
2003
TV11
Bo
nn
ier A
B C
om
m.
..
T/C
/S
2011
TV4
Film
Bo
nn
ier A
B C
om
m.
36
T/
C/S
20
04
TV4
Fakt
a
Bon
nie
r AB
Co
mm
.
47
T/C
/S
2005
TV4
Kom
ed
i Bo
nn
ier A
B C
om
m.
18
C
/S
2006
TV4
Gu
ld
Bon
nie
r AB
Co
mm
.
17
C/S
20
06
TV4
Spo
rt
Bon
nie
r AB
Co
mm
.
51
T/C
/S
2005
Ca
na
l+ -
Firs
t, H
its, A
ctio
n, D
ram
a,
Co
me
dy,
SF-k
an
ale
n, S
po
rt 1
, Sp
ort
2,
Spo
rt E
xtra
, Sp
ort
HD
, Film
HD
Bo
nn
ier A
B 65
%, T
ele
no
r 35%
Su
b.
11
–12
T/C
/S7
from
199
7
Kan
al 5
SB
S Br
oa
dc
ast
ing
(Pr
oSi
eb
en
Sat.1
) C
om
m.
86
T/
C/S
19
89
Kan
al 9
SB
S Br
oa
dc
ast
ing
(Pr
oSi
eb
en
Sat.1
) C
om
m.
65
T/
C/S
20
07
TV3
MTG
C
om
m.
87
T/
C/S
19
87
TV6
MTG
C
om
m.
x 88
T/
C/S
20
06
TV8
MTG
C
om
m.
66
T/
C/S
19
97
TV10
M
TG
Co
mm
.
40
T/C
/S
2010
Via
sat N
atu
re/C
rime
M
TG
Sub
.
11
C/S
19
94/2
001
Via
sat E
xplo
rer
MTG
Su
b.
10
C
/S
2001
Via
sat H
isto
ry
MTG
Su
b.
12
C
/S
..
Via
sat S
po
rt
MTG
Su
b.
14
C
/S
2007
Via
sat F
otb
oll
MTG
Su
b.
12
C
/S
2007
Via
sat H
oc
key
MTG
Su
b.
10
C
/S
2009
Via
sat M
oto
r M
TG
Sub
.
11
C/S
20
07
Co
nt.

NORDICOM 68 Nordic Public Service Media Map 1/2012
TELEVISION
1 L
ic. =
lic
en
ce
fee
s, C
om
m. =
co
mm
erc
ials
, Su
b. =
su
bsc
riptio
n fe
es,
Do
n.=
do
na
tion
s, Sp
on
.= s
po
nso
ring
.2
SV
T’s
ch
an
ne
ls a
nd
TV
4’s
ma
in c
ha
nn
el a
re f
ree
on
eve
ry p
latfo
rm. T
V6,
is f
ree
(n
ot
en
cry
pte
d)
in t
he
dig
ital
terre
stria
l ne
two
rk a
nd
is a
lso
inc
lud
ed
in m
ost
ca
ble
an
d s
ate
llite
dis
trib
uto
rs’ b
asi
c p
ac
kag
es.
3
Da
ta a
re b
ase
d o
n s
am
ple
su
rvey
s a
nd
de
scrib
e c
ha
nn
el p
en
etra
tion
aw
are
ne
ss a
mo
ng
the
po
pu
latio
n a
ge
d
9-99
ye
ars
in 2
010
(Au
tum
n).
4 T
= te
rrest
rial,
C =
ca
ble
, S =
sa
telli
te.
5 T
V4
als
o b
roa
dc
ast
s lo
ca
l new
s in
loc
al w
ind
ow
s. 6
Sa
telli
te-d
istr
ibu
ted
199
0-19
92; s
ate
llite
an
d te
rrest
rial d
istr
ibu
tion
fro
m 1
992
on
. 7
Fiv
e C
an
al+
ch
an
ne
ls h
ave
co
nc
ess
ion
s to
bro
ad
ca
st in
the
terre
stria
l ne
two
rk.
8 A
ltho
ug
h in
trod
uc
ed
in t
he
te
rrest
rial n
etw
ork
in 2
009,
th
e c
ha
nn
el h
as
bro
ad
ca
st in
loc
al c
ab
le-T
V n
ets
for
ma
ny y
ea
rs.
9 O
wn
ers
of c
ab
le n
etw
ork
s a
nd
IP-T
V o
pe
rato
rs c
om
pris
ing
mo
re th
an
100
ho
use
ho
lds
are
req
uire
d to
ca
rry
the
lo
ca
l ca
ble
pro
gra
mm
ing
of c
om
pa
nie
s a
uth
oriz
ed
by
the
Sw
ed
ish
Ra
dio
an
d T
V A
uth
orit
y. C
ab
le-T
V s
tatio
ns
sha
ll p
rod
uc
e lo
ca
l pro
gra
mm
es
wh
ich
str
ive
to o
ffer ”
the
bro
ad
est
po
ssib
le fr
ee
do
m o
f exp
ress
ion
an
d fr
ee
do
m
of i
nfo
rma
tion
”.10
Th
e s
tatio
ns
ma
y n
ot c
arr
y c
om
me
rcia
l me
ssa
ge
s, b
ut s
po
nso
ring
is a
llow
ed
.
No
te: A
nu
mb
er
of c
ha
nn
els
of m
ore
pa
n-N
ord
ic o
r g
lob
al c
ha
rac
ter
(MTG
’s V
iasa
t-ch
an
ne
ls)
are
inc
lud
ed
du
e
to S
we
dis
h o
wn
ers
hip
.
Sou
rce
s: N
ord
ico
m-S
we
de
n, M
MS,
Sw
ed
ish
Bro
ad
ca
stin
g A
uth
orit
y, T
era
co
m, T
V c
om
pa
nie
s, C
om
he
m, C
an
al
Dig
ital,
SES-
Siriu
s, Te
len
or S
ate
llite
Bro
ad
ca
stin
g.
4.5
Co
nt.
Swe
dis
h T
V c
ha
nn
els
201
1 (S
prin
g)
Ma
in
Pe
ne
tratio
n
Ye
ar
Sta
tus
Co
vera
ge
C
ha
nn
el
Ma
jor o
wn
er
Fin
an
cin
g1
Fre
e-to
-air2
(%)3
Dis
trib
utio
n4
est
ab
lish
ed
Priv
ate
N
atio
nw
ide
V
iasa
t Go
lf M
TG
Sub
.
6 C
/S
2007
Via
sat H
oc
key
MTG
Su
b.
10
C
/S
2009
TV10
00 -
TV10
00,
No
rdic
, Ac
tion
,
Fa
mily
, Cla
ssic
, Dra
ma
, HD
M
TG
Sub
.
11–1
3 C
/S
from
199
1
Axe
ss T
V
Axe
ss P
ub
lish
ing
AB
Co
mm
. x
13
T/C
/S
2006
Ca
na
l 7
SIM
S C
om
m.,
Do
n.
15
T/
C/S
20
05
Kan
al 1
0 Kr
iste
n T
V i
Sve
rige
AB
Do
n.
x ..
S 20
06
Life
styl
e T
V
Thre
e A
ng
els
Life
styl
e Te
levi
sio
n
Do
n.
x ..
S ..
Lo
ca
l 24
No
rrb
otte
n, 2
4Co
rren
, 24n
t N
orr
köp
ing
s Ti
dn
ing
ar A
B C
om
m.
x ..
T/C
20
09
24 U
NT
AB
Up
sala
Nya
Tid
nin
g
Co
mm
., Sp
on
. x
.. T/
C
2010
Kan
al 1
2 Ka
na
l 12
i Ka
rlsta
d A
B
x ..
T/C
20
098
TV F
inla
nd
Sv
erig
efin
ska
Rik
sfö
rbu
nd
et
x
.. T/
C
2009
8
25 lo
ca
l TV
sta
tion
s9
*10
..
C
from
198
4

TELEVISION
NORDICOM 69 Nordic Public Service Media Map 1/2012
5. Public service television programming by content 2000-2010
5.1 Public service television programming in Denmark by content 2000-2010 (share of programming time, per cent)1
Channel Content 2000 2001 2002 2003 2004 2005 2006 2007 2008 2009 2010
DR1 News2 8 11 16 16 12 13 12 7 7 7 6
Current affairs and debate 15 14 13 13 15 14 13 13 12 14 14
Information and culture 26 29 23 25 27 27 24 25 23 22 23
Music and entertainment 10 8 13 14 13 12 10 11 9 12 12
Drama and fiction 26 28 25 26 25 30 32 39 41 41 39
Sports 11 6 6 3 7 3 5 2 5 2 3
Education 4 4 3 3 2 3 3 3 2 2 2
Total 100 100 100 100 100 100 100 100 100 100 100
Total programming hours 5 314 5 439 6 049 6 406 6 273 6 176 6 312 6 421 6 657 6 655 6 824
DR2 News2 7 7 6 6 6 7 7 7 10 11 11
Current affairs and debate 11 11 11 11 15 19 19 15 19 19 8
Information and culture 38 36 38 38 38 38 37 39 35 37 38
Music and entertainment 10 10 11 5 3 2 4 1 2 3 3
Drama and fiction 23 24 25 31 29 28 27 30 27 25 29
Sports 4 5 4 4 6 2 2 3 3 1 2
Education 7 7 5 5 3 4 4 5 4 4 10
Total 100 100 100 100 100 100 100 100 100 100 100
Total programming hours 2 980 3 048 3 364 3 504 3 927 3 979 4 315 4 232 4 496 4 298 4 150
TV 2 News2 9 10 9 10 10 10 10 10 10 11 11
Current affairs and debate 14 13 15 14 13 13 13 14 13 16 16
Information and culture 9 11 6 6 7 10 7 7 7 6 6
Music and entertainment 9 8 5 5 6 6 5 4 6 7 9
Drama and fiction 41 45 47 48 46 46 48 52 48 47 42
Sports 14 9 13 9 11 7 9 6 10 6 10
Regional transmissions 4 4 3 7 8 8 7 7 7 7 7
Total 100 100 100 100 100 100 100 100 100 100 100
Total programming hours 5 496 5 510 5 895 6 070 6 532 6 652 7 130 7 136 7 335 7 547 7 477
1 Categorized programme hours only. For total programme hours, see Table 6.1.2 Includes Sports news.
Source: TNS Gallup Denmark.

NORDICOM 70 Nordic Public Service Media Map 1/2012
TELEVISION
5. Cont. Public service television programming by content 2000-2010
5.2 Public service television programming in Finland by content 2000-2010 (share of programming time, per cent)
Channel Content 2000 2001 2002 2003 2004 2005 2006 2007 2008 2009 2010
YLE TV1 News 9 9 9 9 9 9 8 9 8 7 7
Current affairs 22 22 21 22 22 21 21 23 21 21 21
Non-fiction/information 11 12 14 15 17 19 19 20 27 29 34
Culture 4 7 6 6 4 4 6 6 .. .. ..
Hobby and personal interest 2 3 3 3 4 3 3 5 .. .. ..
Education 12 10 13 13 13 9 7 2 3 4 –
Domestic fiction 3 2 2 2 2 2 2 2 2 2 4
Imported fiction 12 14 13 13 14 19 16 24 31 30 27
Feature film 6 7 6 7 5 5 6 3 4 3 3
Entertainment 4 3 2 3 3 4 3 2 4 3 3
Sports 7 4 7 3 3 3 5 1 1 1 1
Children 9 6 6 5 3 3 3 2 0 – –
Other 0 1 0 0 0 2 2 2 .. .. ..
Total 100 100 100 100 100 100 100 100 100 100 100
YLE TV2 News 3 4 5 5 5 6 4 9 8 8 8
Current affairs 13 12 10 10 11 10 7 5 3 4 3
Non-fiction/information 14 15 16 16 12 13 10 12 16 17 20
Culture 7 3 2 3 3 3 3 6 .. .. ..
Hobby and personal interest 5 7 7 9 7 6 3 7 .. .. ..
Education 0 1 1 2 0 1 – – 0 0 –
Domestic fiction 2 2 1 2 2 2 1 2 2 4 6
Imported fiction 16 16 14 10 11 10 12 14 15 20 22
Feature film 13 6 7 9 9 6 3 9 7 7 7
Entertainment 7 5 6 8 8 10 6 9 13 9 5
Sports 13 19 20 15 14 17 37 12 16 13 12
Children 6 10 9 11 15 16 12 14 19 19 17
Other 1 0 2 2 2 1 – 1 .. .. ..
Total 100 100 100 100 100 100 100 100 100 100 100
YLE FST5 1 News * .. 11 10 10 10 9 9 8 7 7
Current affairs * .. 6 5 7 5 3 7 6 5 18
Non-fiction/information * .. 16 17 17 17 23 22 31 39 35
Culture * .. 10 10 10 10 9 7 .. .. ..
Hobby and personal interest * .. 9 8 7 6 6 4 .. .. ..
Education * .. 5 6 6 2 3 7 7 6 1
Domestic fiction * .. 2 2 2 2 – – 1 1 1
Imported fiction * .. 15 12 10 14 12 11 10 12 15
Feature film * .. 6 6 9 8 7 4 3 4 5
Entertainment * .. 6 6 8 11 9 5 6 5 5
Sports * .. 3 5 5 3 5 7 13 8 6
Children * .. 10 12 11 12 14 16 15 13 8
Other * .. 1 1 1 1 1 2 .. .. ..
Total * .. 100 100 100 100 100 100 100 100 100
Cont.

TELEVISION
NORDICOM 71 Nordic Public Service Media Map 1/2012
5.2 Cont. Public service television programming in Finland by content 2000-2010 (share of programming time, per cent)
Channel Content 2000 2001 2002 2003 2004 2005 2006 2007 2008 2009 2010
YLE Teema1 News * .. – – – – – – – – –
Current affairs * .. – – – – – – – – –
Non-fiction/information * .. 33 26 30 27 31 28 40 41 53
Culture * .. 21 21 21 23 22 19 .. .. ..
Hobby and personal interest * .. 3 1 1 0 – 1 .. .. ..
Education * .. 23 37 33 26 27 22 23 22 12
Domestic fiction * .. 4 0 1 1 2 2 1 3 2
Imported fiction * .. 6 5 5 6 7 12 14 18 17
Feature film * .. 9 9 8 15 1 11 13 13 15
Entertainment * .. 1 1 1 2 – 5 9 3 2
Sports * .. – – – – – – – 0 –
Children * .. – – – 0 – 1 1 1 –
Other * .. – – 0 0 1 0 .. .. ..
Total * .. 100 100 100 100 100 100 100 100 100
1 YLE FST5 and YLE Teema were launched in 2001.
Note: Data based on 4 to 7 sample weeks for each year.
Sources: YLE, Finnpanel, Ministry of Transport and Communications.
5.3 Public service television programming in Iceland by content 2000-2010 (share of transmission time, per cent)
Channel Content 2000 2001 2002 2003 2004 2005 2006 2007 2008 2009 2010
RÚV TV News 10 17 17 15 14 13 7 7 7 8 8
Non-fiction1 9 7 11 12 10 11 14 15 16 18 16
Fiction 31 34 30 30 28 30 35 38 38 39 34
Entertainment 2 5 4 5 4 3 3 3 5 4 4
Music 3 1 1 1 1 2 2 2 1 2 2
Sports 22 13 14 14 21 16 18 12 13 9 15
Children and youth 13 14 13 12 11 15 11 11 11 11 11
Other2 10 8 10 10 10 10 10 11 9 9 10
Total 100 100 100 100 100 100 100 100 100 100 100
Total transmission hours 3 691 3 461 3 850 4 080 4 264 4 187 5 020 4 885 5 130 5 002 4 981
1 Documentaries and informative, religious, arts and culture programmes.2 Advertising, tele-shopping, and unspecified.
Source: Statistics Iceland.
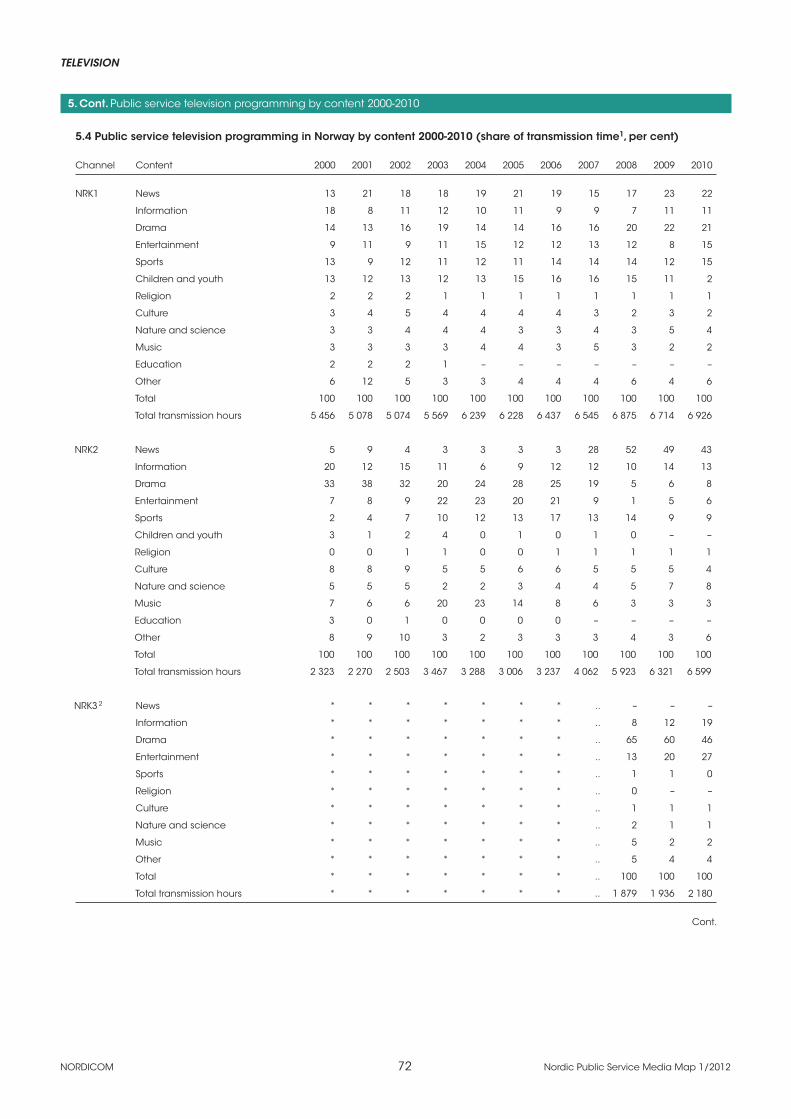
NORDICOM 72 Nordic Public Service Media Map 1/2012
TELEVISION
5. Cont. Public service television programming by content 2000-2010
5.4 Public service television programming in Norway by content 2000-2010 (share of transmission time1, per cent)
Channel Content 2000 2001 2002 2003 2004 2005 2006 2007 2008 2009 2010
NRK1 News 13 21 18 18 19 21 19 15 17 23 22
Information 18 8 11 12 10 11 9 9 7 11 11
Drama 14 13 16 19 14 14 16 16 20 22 21
Entertainment 9 11 9 11 15 12 12 13 12 8 15
Sports 13 9 12 11 12 11 14 14 14 12 15
Children and youth 13 12 13 12 13 15 16 16 15 11 2
Religion 2 2 2 1 1 1 1 1 1 1 1
Culture 3 4 5 4 4 4 4 3 2 3 2
Nature and science 3 3 4 4 4 3 3 4 3 5 4
Music 3 3 3 3 4 4 3 5 3 2 2
Education 2 2 2 1 – – – – – – –
Other 6 12 5 3 3 4 4 4 6 4 6
Total 100 100 100 100 100 100 100 100 100 100 100
Total transmission hours 5 456 5 078 5 074 5 569 6 239 6 228 6 437 6 545 6 875 6 714 6 926
NRK2 News 5 9 4 3 3 3 3 28 52 49 43
Information 20 12 15 11 6 9 12 12 10 14 13
Drama 33 38 32 20 24 28 25 19 5 6 8
Entertainment 7 8 9 22 23 20 21 9 1 5 6
Sports 2 4 7 10 12 13 17 13 14 9 9
Children and youth 3 1 2 4 0 1 0 1 0 – –
Religion 0 0 1 1 0 0 1 1 1 1 1
Culture 8 8 9 5 5 6 6 5 5 5 4
Nature and science 5 5 5 2 2 3 4 4 5 7 8
Music 7 6 6 20 23 14 8 6 3 3 3
Education 3 0 1 0 0 0 0 – – – –
Other 8 9 10 3 2 3 3 3 4 3 6
Total 100 100 100 100 100 100 100 100 100 100 100
Total transmission hours 2 323 2 270 2 503 3 467 3 288 3 006 3 237 4 062 5 923 6 321 6 599
NRK3 2 News * * * * * * * .. – – –
Information * * * * * * * .. 8 12 19
Drama * * * * * * * .. 65 60 46
Entertainment * * * * * * * .. 13 20 27
Sports * * * * * * * .. 1 1 0
Religion * * * * * * * .. 0 – –
Culture * * * * * * * .. 1 1 1
Nature and science * * * * * * * .. 2 1 1
Music * * * * * * * .. 5 2 2
Other * * * * * * * .. 5 4 4
Total * * * * * * * .. 100 100 100
Total transmission hours * * * * * * * .. 1 879 1 936 2 180
Cont.

TELEVISION
NORDICOM 73 Nordic Public Service Media Map 1/2012
5.4 Cont. Public service television programming in Norway by content 2000-2010 (share of transmission time1, per cent)
Channel Content 2000 2001 2002 2003 2004 2005 2006 2007 2008 2009 2010
NRK Super2 Music * * * * * * * .. 1 0 0
Animated drama3 * * * * * * * .. 48 48 –
Drama * * * * * * * .. 22 22 76
Entertainment * * * * * * * .. 15 18 14
Magasin * * * * * * * .. 6 3 1
Documentary * * * * * * * .. 3 2 3
Education * * * * * * * .. 1 2 1
News * * * * * * * .. – – 0
Other * * * * * * * .. 4 4 5
Total * * * * * * * .. 100 100 100
Total transmission hours * * * * * * * .. 4 452 4 631 4 753
1 Programme information and promotion (trailers, etc.) are included.2 NRK3 and NRK Super were launched in 2007. All content on NRK Super are children’s programmes.3 Animated drama included in Drama in 2010.
Note: The categories are not totally comparable between the channels.
Sources: NRK (processed).
5.5 Public service television programming in Sweden by content 2000-2010: SVT1 and SVT2 (share of transmission time1, per cent)
Channel Content 2000 2001 2002 2003 2004 2005 2006 2007 2008 2009 2010
SVT12 News 5 9 13 14 14 13 14 14 15 14 11
Current affairs 8 10 8 10 8 9 10 8 9 7 11
Culture 10 6 4 3 5 4 3 3 2 3 3
Non-Fiction 16 19 18 17 15 17 19 20 15 26 31
Entertainment 7 7 8 9 10 7 9 9 11 14 12
Fiction 7 11 11 9 8 10 8 11 9 12 13
Feature films 13 13 10 11 12 12 12 11 11 10 9
Sports 12 8 10 9 9 10 7 7 14 10 9
Children and youth 19 16 17 16 16 17 16 16 12 2 1
Other 3 2 2 2 2 1 1 0 0 0 0
Total 100 100 100 100 100 100 100 100 100 100 100
Hours per week 89 96 105 108 104 106 106 104 114 118 157
SVT22 News 14 15 13 14 12 13 13 13 10 8 8
Current affairs 11 13 12 11 11 9 10 10 13 13 15
Culture 5 12 13 16 14 13 15 11 11 11 8
Non-Fiction 27 20 17 17 17 15 15 16 13 17 22
Entertainment 10 8 6 10 12 13 11 9 13 12 18
Fiction 12 8 9 6 7 7 7 7 10 11 7
Feature films 3 4 7 7 9 7 7 7 7 6 7
Sports 9 8 12 13 10 10 10 13 8 8 7
Children and youth 2 4 3 1 2 0 2 1 2 3 3
Other 6 8 9 7 7 12 11 12 12 12 7
Total 100 100 100 100 100 100 100 100 100 100 100
Hours per week 80 68 72 74 75 83 81 81 85 81 79
1 Transmission time (including announcers and self-promotion). Data based on 17 sample weeks for each year. 2 Educational programmes (UR) excluded.
Sources: SVT, Swedish Broadcasting Commission/Swedish Broadcasting Authority .

NORDICOM 74 Nordic Public Service Media Map 1/2012
TELEVISION
5. Cont. Public service television programming by content 2000-2010
5.6 Public service television programming in Sweden by content 2009-2010: SVT24, SVTB, Kunskapskanalen and UR (share of transmission time1, per cent)
Channel Content 2009 2010 Channel Content 2009 2010
SVT24 News 32 45 UR1 Current affairs 24 28
Current affairs 6 8 Culture/handicraft 4 5
Culture 4 3 Language 22 19
Non-fiction 15 12 History 9 7
Entertainment 8 15 Religion/philosophy 0 2
Fiction 7 9 School/education 9 6
Feature films 1 0 Human relations 8 7
Sports 7 8 Housing 0 0
Children and youth 0 0 Economics 1 2
Other 19 0 Health/medication 8 8
Total 100 100 Nature/environment 4 3
Hours per week 115 55 ICT 0 0
Science/engineering 9 7
SVTB Cartoons/animations 71 62 Other 2 7
Children’s programmes, other 21 30 Total 100 100
Minority children’s programmes 2 1 Hours per week 13 13
News and current affairs/non-fiction 7 7
Total 100 100
Hours per week 82 92
Kunskaps- Current affairs 30 27kanalen Culture 16 25
Non-fiction 52 33
Other – 15
Total 100 100
Hours per week 35 63
1 UR (Utbildningsradion) transmits educational programmes in SVT1, SVT2 and Kunskapskanalen.
Note: SVT24 was launched in 1999/2002, SVTB (Barnkanalen) in 2002, and Kunskapskanalen in 2004. SVTB (Barnkanalen) shared channels with Kunskapskanalen until 2010, while SVT24 had its own channel. From 2010 SVTB instead shares channel with SVT24, while Kunskapskanalen braodcasts on its own channel.
Sources: SVT, Swedish Broadcasting Commission/Swedish Broadcasting Authority .

TELEVISION
NORDICOM 75 Nordic Public Service Media Map 1/2012
6. Public service television programming: Content by channel 2010
6.1 Public service television programming in Denmark: Content by channel 2010 (share of programming time, per cent)
DR DR Content DR1 DR2 Update DR K Ramasjang DR HD TV 21
News including Sports news 6 11 100 0 0 0 11
Current affairs and debate 13 8 0 2 0 7 16
Information and culture 23 37 0 47 18 54 6
Domestic fiction 5 2 0 6 12 2 3
Imported fiction 32 26 0 26 60 27 38
Music 8 2 0 8 1 0 0
Entertainment 3 0 0 9 4 0 9
Sports 3 2 0 0 0 7 10
Education 2 9 0 0 0 0 0
Other2 4 3 0 3 4 3 7
Total 100 100 100 100 100 100 100
Total programming hours 7 126 4 276 8 760 3 902 5 369 3 029 7 477
1 Categorized programmes in TV 2 main channel. The regional TV 2 programmes, broadcast in windows in TV 2, is included in ’Other’. 2 Total programming hours minus sum of categorized programme hours.
Sources: Yearly Public Service Accounts from DR and TV 2.
6.2 Public service television programming in Finland: Content by channel 2010 (share of programming time, per cent)
Content YLE TV1 YLE TV2 YLE FST5 YLE Teema
News 7 8 7 -
Current affairs 21 3 18 -
Non-fiction/information 34 20 35 53
Culture .. .. .. ..
Hobby and personal interest .. .. .. ..
Education - - 1 12
Domestic fiction 4 6 1 2
Imported fiction 27 22 15 17
Feature film 3 7 5 15
Entertainment 3 5 5 2
Sports 1 12 6 -
Children - 17 8 -
Other .. .. .. ..
Total 100 100 100 100
Note: Data based on 4 to 7 sample weeks for each year.
Sources: YLE, Finnpanel.

NORDICOM 76 Nordic Public Service Media Map 1/2012
TELEVISION
6. Cont. Public service television programming: Content by channel 2010
6.3 Public service television programming in Iceland: Content by channel 2010 (share of transmission time, per cent)
Content RÚV TV
News 8
Non-fiction/information1 16
Films (feature and TV films) 12
Series and serials 22
Entertainment 4
Music 2
Sports 15
Children and youth 11
Advertising 3
Other2 7
Total 100
Total transmission hours 4 981
1 Documentaries and informative, religious, arts and culture programmes.2 Inserts, slots, programme announcements and unspecified.
Source: Statistics Iceland.
6.4 Public service television programming in Norway: Content by channel 2010 (share of transmission time, per cent)
Content NRK1 NRK2 NRK3 NRK Super1
News 22 43 - -
Information 11 13 19 -
Drama 21 8 46 -
Entertainment 15 6 27 -
Sports 15 9 0 -
Children and youth 2 - - 100
Religion 1 1 - -
Culture 2 4 1 -
Nature and science 4 8 1 -
Music 2 3 2 -
Education - - - -
Other 6 6 4 -
Total 100 100 100 100
Total hours 6 926 6 599 2 180 4 753
1 NRK’s children channel.
Note: Programme information and promotion (trailers, etc.) are included. The categories are not totally comparable between the channels.
Source: NRK.

TELEVISION
NORDICOM 77 Nordic Public Service Media Map 1/2012
6. Cont. Public service television programming: Content by channel 2010
6.5 Public service television programming in Sweden: Content by channel 2010 (share of transmission time, per cent)
Kunskaps- Content SVT11 SVT21 kanalen SVTB2 SVT24
News 11 8 - 7 45
Current affairs 11 15 27 - 8
Culture 3 8 25 - 3
Non-Fiction 31 22 33 - 12
Entertainment 12 18 - - 15
Fiction 13 7 - - 9
Feature films 9 7 - 62 0
Sports 9 7 - - 8
Children and youth 1 3 - 30 0
Other 0 7 18 1 0
Total 100 100 100 100 100
Hours per week 157 79 63 92 55
1 Educational programmes (UR, Utbildningsradion) excluded.2 SVT’s children channel. ’News’ refers to news and current affairs/non-fiction, ’Fiction’ refers to cartoons/animations, ’Children and youth’ refers to ’Children’s programmes, other’ and category ’Other’ consists of minority children’s programmes.
Note: Transmission time (including announcers and self-promotion). Data based on 17 sample weeks for each year.
Source: Swedish Broadcasting Authority.

NORDICOM 78 Nordic Public Service Media Map 1/2012
TELEVISION
7. Public service television programming by origin 2000-2010
7.1 DR TV and TV 2 programming in Denmark by origin 2000-2010 (share of transmission time, per cent)
Channel Origin 2000 2001 2002 2003 2004 2005 2006 2007 2008 2009 2010
DR and TV 2 Domestic 59 50 49 46 43 41 36 41 40 42 46
Other Nordic 3 4 4 4 4 3 2 2 2 2 2
Other Europe 13 15 14 16 20 18 16 14 14 15 15
USA 20 27 28 30 30 34 43 32 32 31 25
Asia 0 1 1 1 1 1 1 1 1 1 1
Other 5 5 5 4 2 3 3 11 11 10 11
Total 100 100 100 100 100 100 100 100 100 100 100
Note: Data include television programming on all DR and TV 2 channels.
Sources: DR and TV 2/Danmark.
7.2 YLE television programming in Finland by origin 2000-2010 (share of transmission time, per cent)
Channel Origin 2000 2001 2002 2003 2004 2005 2006 2007 2008 2009 2010
YLE TV1 Domestic 62 62 67 64 67 65 67 60 59 55 54
Other Nordic 4 3 3 4 4 3 3 2 2 3 3
Other Europe 21 20 23 21 20 23 23 29 34 36 36
North America 10 9 6 8 10 8 6 8 5 7 6
Other 3 5 1 2 1 1 1 1 - 0 2
Total 100 100 100 100 100 100 100 100 100 100 100
YLE TV2 Domestic
Other Nordic 53 64 66 69 63 68 78 59 62 51 53
Other Europe 7 4 4 4 5 3 2 1 2 5 4
North America 18 15 12 14 17 14 10 21 18 24 23
Other 20 13 18 9 12 11 8 16 13 16 16
Total 2 3 0 4 4 4 2 3 5 3 4
100 100 100 100 100 100 100 100 100 100 100
YLE FST5 Domestic * .. 54 60 56 52 59 62 66 46 82
Other Nordic * .. 17 17 16 17 14 21 21 34 12
Other Europe * .. 22 14 17 24 19 13 8 13 2
North America * .. 5 8 7 5 6 3 4 5 3
Other * .. 2 1 4 2 2 2 1 2 1
Total * .. 100 100 100 100 100 100 100 100 100
YLE Teema Domestic * .. 52 51 48 37 42 44 37 25 27
Other Nordic * .. 3 3 2 4 4 2 3 7 9
Other Europe * .. 24 33 34 42 38 42 42 50 42
North America * .. 8 9 9 11 10 8 13 12 11
Other * .. 13 4 7 5 7 4 7 7 10
Total * .. 100 100 100 100 100 100 100 100 100
Note: Data based on 4 to 7 sample weeks for each year. YLE FST5 and YLE Teema were launched in 2001.
Sources: YLE, Finnpanel.
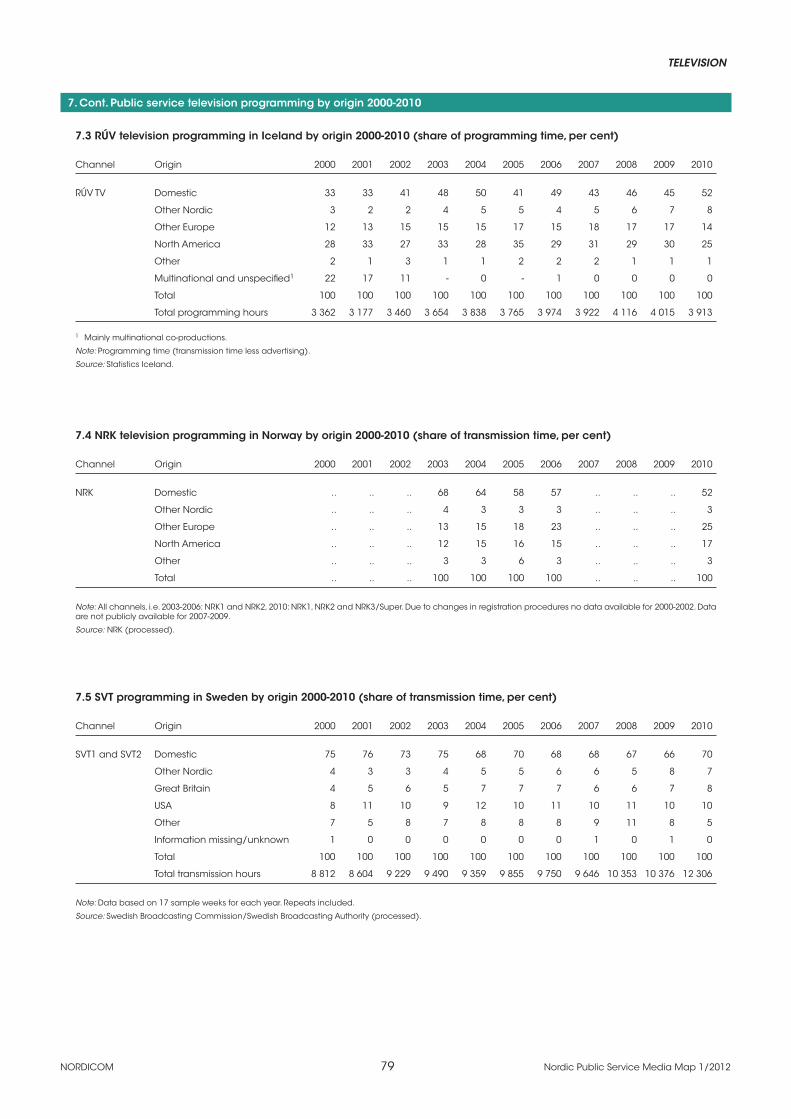
TELEVISION
NORDICOM 79 Nordic Public Service Media Map 1/2012
7. Cont. Public service television programming by origin 2000-2010
7.3 RÚV television programming in Iceland by origin 2000-2010 (share of programming time, per cent)
Channel Origin 2000 2001 2002 2003 2004 2005 2006 2007 2008 2009 2010
RÚV TV Domestic 33 33 41 48 50 41 49 43 46 45 52
Other Nordic 3 2 2 4 5 5 4 5 6 7 8
Other Europe 12 13 15 15 15 17 15 18 17 17 14
North America 28 33 27 33 28 35 29 31 29 30 25
Other 2 1 3 1 1 2 2 2 1 1 1
Multinational and unspecified1 22 17 11 - 0 - 1 0 0 0 0
Total 100 100 100 100 100 100 100 100 100 100 100
Total programming hours 3 362 3 177 3 460 3 654 3 838 3 765 3 974 3 922 4 116 4 015 3 913
1 Mainly multinational co-productions.
Note: Programming time (transmission time less advertising).
Source: Statistics Iceland.
7.4 NRK television programming in Norway by origin 2000-2010 (share of transmission time, per cent)
Channel Origin 2000 2001 2002 2003 2004 2005 2006 2007 2008 2009 2010
NRK Domestic .. .. .. 68 64 58 57 .. .. .. 52
Other Nordic .. .. .. 4 3 3 3 .. .. .. 3
Other Europe .. .. .. 13 15 18 23 .. .. .. 25
North America .. .. .. 12 15 16 15 .. .. .. 17
Other .. .. .. 3 3 6 3 .. .. .. 3
Total .. .. .. 100 100 100 100 .. .. .. 100
Note: All channels, i.e. 2003-2006: NRK1 and NRK2, 2010: NRK1, NRK2 and NRK3/Super. Due to changes in registration procedures no data available for 2000-2002. Data are not publicly available for 2007-2009.
Source: NRK (processed).
7.5 SVT programming in Sweden by origin 2000-2010 (share of transmission time, per cent)
Channel Origin 2000 2001 2002 2003 2004 2005 2006 2007 2008 2009 2010
SVT1 and SVT2 Domestic 75 76 73 75 68 70 68 68 67 66 70
Other Nordic 4 3 3 4 5 5 6 6 5 8 7
Great Britain 4 5 6 5 7 7 7 6 6 7 8
USA 8 11 10 9 12 10 11 10 11 10 10
Other 7 5 8 7 8 8 8 9 11 8 5
Information missing/unknown 1 0 0 0 0 0 0 1 0 1 0
Total 100 100 100 100 100 100 100 100 100 100 100
Total transmission hours 8 812 8 604 9 229 9 490 9 359 9 855 9 750 9 646 10 353 10 376 12 306
Note: Data based on 17 sample weeks for each year. Repeats included.
Source: Swedish Broadcasting Commission/Swedish Broadcasting Authority (processed).
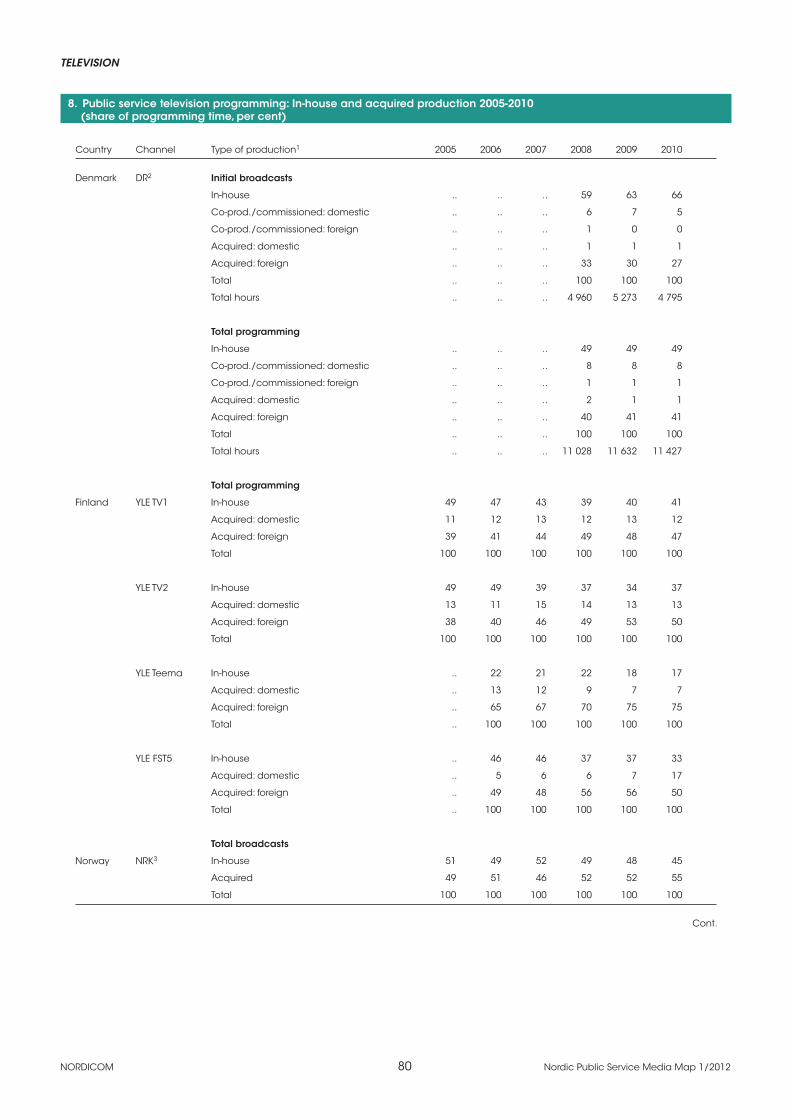
NORDICOM 80 Nordic Public Service Media Map 1/2012
TELEVISION
8. Public service television programming: In-house and acquired production 2005-2010 (share of programming time, per cent)
Country Channel Type of production1 2005 2006 2007 2008 2009 2010
Denmark DR2 Initial broadcasts
In-house .. .. .. 59 63 66
Co-prod./commissioned: domestic .. .. .. 6 7 5
Co-prod./commissioned: foreign .. .. .. 1 0 0
Acquired: domestic .. .. .. 1 1 1
Acquired: foreign .. .. .. 33 30 27
Total .. .. .. 100 100 100
Total hours .. .. .. 4 960 5 273 4 795
Total programming
In-house .. .. .. 49 49 49
Co-prod./commissioned: domestic .. .. .. 8 8 8
Co-prod./commissioned: foreign .. .. .. 1 1 1
Acquired: domestic .. .. .. 2 1 1
Acquired: foreign .. .. .. 40 41 41
Total .. .. .. 100 100 100
Total hours .. .. .. 11 028 11 632 11 427
Total programming
Finland YLE TV1 In-house 49 47 43 39 40 41
Acquired: domestic 11 12 13 12 13 12
Acquired: foreign 39 41 44 49 48 47
Total 100 100 100 100 100 100
YLE TV2 In-house 49 49 39 37 34 37
Acquired: domestic 13 11 15 14 13 13
Acquired: foreign 38 40 46 49 53 50
Total 100 100 100 100 100 100
YLE Teema In-house .. 22 21 22 18 17
Acquired: domestic .. 13 12 9 7 7
Acquired: foreign .. 65 67 70 75 75
Total .. 100 100 100 100 100
YLE FST5 In-house .. 46 46 37 37 33
Acquired: domestic .. 5 6 6 7 17
Acquired: foreign .. 49 48 56 56 50
Total .. 100 100 100 100 100
Total broadcasts
Norway NRK3 In-house 51 49 52 49 48 45
Acquired 49 51 46 52 52 55
Total 100 100 100 100 100 100
Cont.

TELEVISION
NORDICOM 81 Nordic Public Service Media Map 1/2012
8. Cont. Public service television programming: In-house and acquired production 2005-2010 (share of programming time, per cent)
Country Channel Type of production1 2005 2006 2007 2008 2009 2010
Initial broadcasts
Sweden SVT4 In-house .. .. 65 64 63 59
Commissioned productions .. .. 1 2 2 2
Co-productions: domestic .. .. 2 3 3 3
Co-productions: foreign .. .. 2 1 1 1
Total production .. .. 70 69 69 64
Acquired: domestic .. .. 2 1 2 2
Acquired: foreign .. .. 28 30 29 34
Acquired: total .. .. 30 31 31 36
Total .. .. 100 100 100 100
Total hours .. .. 8 342 8 652 7 408 8 262
1 Initial broadcasts only - repeats excluded; total programming or transmission time – repeats included.2 DR1 and DR2.3 2005-2006: NRK1 and NRK2. 2007-2010: NRK1, NRK2 and NRK3/Super.4 Including all SVT channels. Nationwide programming only.
Sources: DR annual reports, YLE, NRK, SVT database on public service.

NORDICOM 82 Nordic Public Service Media Map 1/2012
TELEVISION
9. Public service television broadcasting in minority languages 2000-2010 (hours/year)
9.1 YLE television broadcasting in Swedish and Sámi 2000-2010
Hours/year
Broadcasting in 2000 2001 2002 2003 2004 2005 2006 2007 2008 2009 2010
Swedish 1 830 1 981 3 024 2 925 3 105 3 233 3 238 2 873 3 285 3 058 3 420
Sámi .. .. .. .. .. .. .. .. .. 130 122
Source: YLE.
9.2 NRK television broadcasting in Sámi 2000-2010
Hours/year
Broadcasting in 2000 2001 2002 2003 2004 2005 2006 2007 2008 2009 2010
Sámi 58 61 .. 112 .. 120 .. 127 127 248 223
Source: NRK Sápmi.
9.3 SVT television broadcasting in minority and sign languages 2001-2010
Hours/year
Broadcasting in 2001 2002 2003 2004 2005 2006 2007 2008 2009 2010
Minority languages
Finnish 117 105 109 115 139 131 137 156 183 239
Tornedal-Finnish/meänkieli 4 4 7 5 6 10 7 25 12 11
Samí 40 52 66 65 67 59 73 109 106 90
Romani chib 0 0 3 0 3 0 2 1 6 8
Total 161 161 185 185 215 202 220 291 307 348
Sign language 77 86 78 105 91 110 122 137 111 128
Note: The ”minority languages” are officially recognized as indigenous to Sweden. (Yiddish is also accorded status, but there are no radio services in Yiddish.) The SVT charter incites SVT to observe the needs of linguistic and ethnic minorities and calls for an increase in the extent of service to all minority groups, the above-mentioned in particular.
Sources: SVT public service reports, SVT database on public service.

TELEVISION
NORDICOM 83 Nordic Public Service Media Map 1/2012
10. Nordvision’s programme cooperation 2007-2010 among the Nordic public service broadcasters
Nordvision is a cooperation between public service broadcasters in the Nordic countries (established in 1959). The collaboration between the partners, DR in Denmark, YLE in Finland, RÚV in Iceland, NRK in Norway and SVT in Sweden, stands on three legs: co-production, pro-gram exchanges and sharing knowledge and experience. Associated members of the partnership are UR (Sweden), KNR (Greenland) and KVF (Faroe Islands).
10.1 Number of TV programmes and hours generated by co-production 2007-2010
2007 2008 2009 2010
Number of TV programmes 2 472 1 690 1 340 1 210
Number of programme hours 1 020 872 570 497
Note: In total among Nordvision broadcasters: DR, YLE, RÚV, NRK, SVT and UR.
Sources: Nordvision annual reports 2007-2010.
10.2 TV programme hours generated by co-production, by genre 2007-2010
Hours
Genre 2007 2008 2009 2010
Drama 440 393 162 246
Children 147 219 123 115
Education 111 89 115 44
Factual programmes 198 74 77 64
Investigative journalism1 - 14 40 28
Music2,3 - 15 18 ..
Youth2,3 9 21 22 ..
Culture3 46 28 2 ..
Entertainment3 69 19 11 ..
Total programme hours 1 020 872 570 497
1 Investigative journalism category as of 2008. 2 Music and Youth categories first set up in August 2007.3 Categories omitted in 2010, some programmes of which are now classified as Factual programmes.
Note: In total among Nordvision broadcasters DR, YLE, RÚV, NRK, SVT and UR.
Sources: Nordvision annual reports 2007-2010.
10.3 Number of TV programmes and hours generated by programme exchange 2007-2010
2007 2008 2009 2010
Number of TV programmes 1 759 2 362 2 049 2 781
Number of programme hours .. .. 1 059 1 306
Note: In total among Nordvision broadcasters DR, YLE, RÚV, NRK, SVT and UR. A new method for calculating number of hours generated by programme exchange was introduced in 2009. Comparable data for previous years are not available.
Sources: Nordvision annual reports 2007-2010.

NORDICOM 84 Nordic Public Service Media Map 1/2012
TELEVISION
10. Cont. Nordvision’s programme cooperation 2007-2010 among the Nordic public service broadcasters
10.4 Number of TV programmes generated by programme exchange, by genre 2009-2010
Genre 2009 2010
Factual programmes screening 1 697 2 207
Children 96 338
Educational programmes 161 111
Other1 95 125
Total number of programmes 2 049 2 781
1 Includes Science, Music, Archive and Factual programmes between screenings.
Sources: Nordvision annual reports 2009-2010.

TELEVISION
NORDICOM 85 Nordic Public Service Media Map 1/2012
11. Private television programming by content 2000-2010
11.1 Private television programming in Denmark by content 2000-2010 (share of programming time, per cent)
Channel Content 2000 2001 2002 2003 2004 2005 2006 2007 2008 2009 2010
TV3 News1 1 1 .. .. .. .. .. .. .. .. ..
Current affairs and debate 1 1 .. 1 .. .. .. .. .. .. ..
Information and culture 3 1 2 3 2 4 7 7 6 9 18
Music and entertainment 11 16 18 18 21 21 28 23 27 31 26
Drama and fiction 83 80 76 76 75 75 64 70 66 60 56
Sports 1 2 4 2 1 0 1 0 0 0 0
Total 100 100 100 100 100 100 100 100 100 100 100
Total programming hours 7 091 7 588 7 626 7 975 8 047 7 771 7 867 7 987 7 642 7 806 8 150
Kanal 42 News1 4 4 4 3 3 3 3 .. .. .. ..
Current affairs and debate .. 1 1 .. .. .. .. .. 1 2 1
Information and culture 5 7 9 4 4 .. 1 15 19 17 20
Music and entertainment 33 35 20 29 29 34 44 38 35 35 25
Drama and fiction 58 53 66 64 64 64 52 47 45 46 54
Sports .. .. .. .. .. .. .. .. .. ..
Total 100 100 100 100 100 100 100 100 100 100 100
Total programming hours .. 7 299 7 208 7 241 7 241 7 051 6 843 8 332 7 640 7 783 8 619
Kanal 53 Current affairs and debate 1 2 .. .. .. .. .. .. .. 0 2
Information and culture .. 2 .. 1 2 .. .. 1 3 6 7
Music and entertainment 27 21 15 12 17 19 26 29 30 25 22
Drama and fiction 67 71 78 79 74 76 70 66 64 66 67
Sports 6 4 7 8 6 5 5 4 3 2 1
Total 100 100 100 100 100 100 100 100 100 100 100
Total programming hours 5 005 6 554 7 011 7 124 7 674 .. .. .. .. .. 8 653
6eren News1 * * * * * * * * * 2 ..
Current affairs and debate * * * * * * * * * 4 1
Information and culture * * * * * * * * * 13 9
Music and entertainment * * * * * * * * * 30 23
Drama and fiction * * * * * * * * * 47 60
Sports * * * * * * * * * 5 7
Total * * * * * * * * * 100 100
Total programming hours * * * * * * * * * 7 546 7 852
1 Includes Sports news. 2 Data 2000- 2004: TvDanmark 2, which from Spring 2004 was called TvDanmark. In Spring 2006 TvDanmark was closed down and replaced by Kanal 4. 3 The channel was established as TvDanmark 1 in 2000. In Spring 2004 the channel changed its name to Kanal 5.
Source: TNS Gallup Denmark.

NORDICOM 86 Nordic Public Service Media Map 1/2012
TELEVISION
11. Cont. Private television programming by content 2000-2010
11.2 Private television programming in Finland by content 2000-2010 (share of programming time, per cent)
Channel Content 2000 2001 2002 2003 2004 2005 2006 2007 2008 2009 2010
MTV3 News 5 6 7 6 7 7 7 7 8 7 7
Current affairs 19 16 16 17 15 16 16 13 13 15 12
Non-fiction/information 2 2 3 3 2 1 3 4 8 10 18
Culture 1 2 0 0 0 1 – 0 .. .. ..
Hobby and personal interest 4 6 4 3 5 6 7 9 .. .. ..
Education 1 0 0 – – – – – – – –
Domestic fiction 4 4 5 5 6 6 5 6 7 6 5
Imported fiction 23 27 30 30 27 27 28 28 29 31 27
Feature film 8 9 9 8 10 12 14 11 12 8 9
Entertainment 16 17 13 14 16 11 8 7 10 12 12
Sports 8 9 8 8 10 9 8 10 9 7 6
Children 2 3 5 4 4 6 6 5 5 4 4
Other 6 1 0 0 0 0 – 1 .. .. ..
Total 100 100 100 100 100 100 100 100 100 100 100
Nelonen News 4 4 5 4 4 4 4 5 4 3 3
Current affairs 2 2 1 1 0 0 – 1 – – 0
Non-fiction/information 5 5 4 7 9 10 9 5 23 24 31
Culture 1 0 0 0 0 0 1 0 .. .. ..
Hobby and personal interest 1 5 4 4 5 10 9 11 .. .. ..
Education 3 2 0 – – – – – – – –
Domestic fiction 1 1 1 1 1 1 2 – 1 1 1
Imported fiction 42 43 44 37 33 25 31 38 31 27 25
Feature film 9 9 15 15 15 16 15 13 13 15 13
Entertainment 14 10 11 15 14 18 14 13 17 21 22
Sports 11 14 12 11 11 9 6 8 7 5 0
Children 5 3 4 6 7 8 10 6 4 4 4
Other 2 0 0 0 0 0 – 0 .. .. ..
Total 100 100 100 100 100 100 100 100 100 100 100
Sub News * .. – – 0 – – – 2 1 1
Current affairs * .. – – 4 – – – – – –
Non-fiction/information * .. 14 21 16 15 15 12 8 7 21
Culture * .. 0 3 2 2 2 0 .. .. ..
Hobby and personal interest * .. 7 2 2 4 4 5 .. .. ..
Education * .. – – – – – – – – –
Domestic fiction * .. – – 1 0 – – – – 0
Imported fiction * .. 48 41 37 45 45 42 54 46 48
Feature film * .. 7 4 4 3 3 3 4 4 4
Entertainment * .. 23 28 33 31 31 33 27 37 20
Sports * .. 1 2 1 – – – – – –
Children * .. – – – – 1 5 5 4 6
Other * .. 0 0 0 0 – 0 .. .. ..
Total * .. 100 100 100 100 100 100 100 100 100
Note: Data based on 4 to 7 sample weeks for each year.
Sources: MTV3, Channel Four (Nelonen), Finnpanel, Ministry of Transport and Communications.
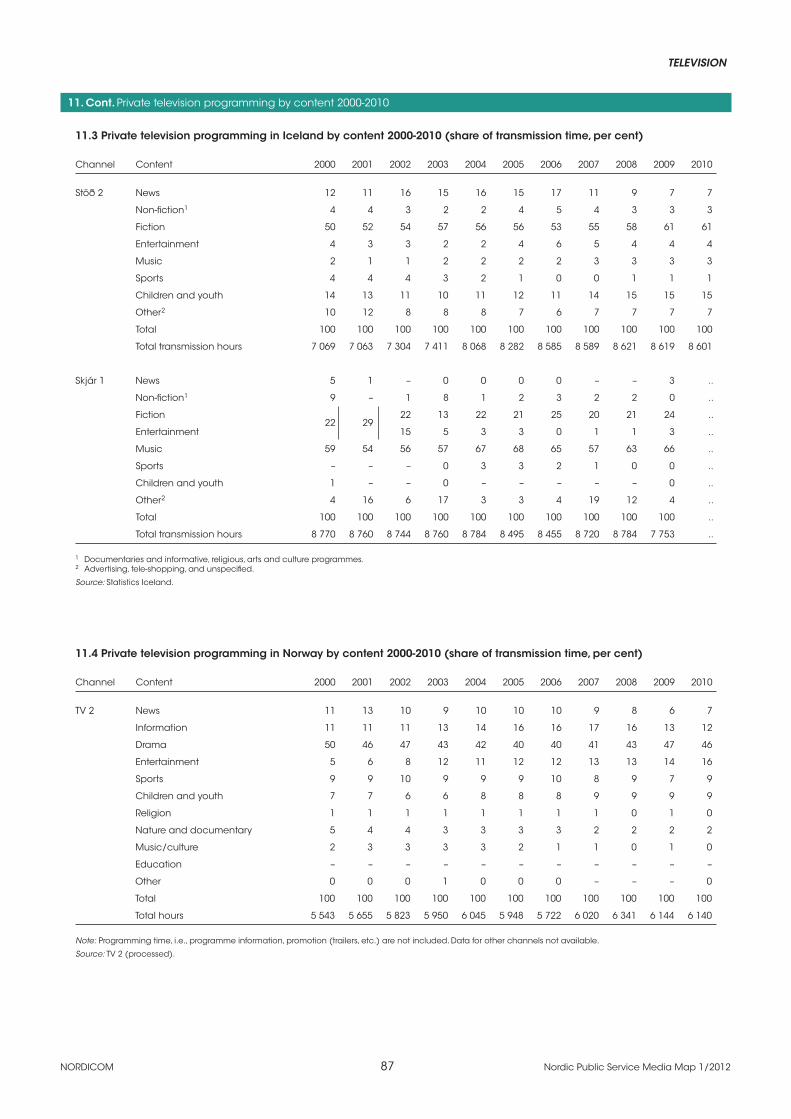
TELEVISION
NORDICOM 87 Nordic Public Service Media Map 1/2012
11. Cont. Private television programming by content 2000-2010
11.3 Private television programming in Iceland by content 2000-2010 (share of transmission time, per cent)
Channel Content 2000 2001 2002 2003 2004 2005 2006 2007 2008 2009 2010
Stöð 2 News 12 11 16 15 16 15 17 11 9 7 7
Non-fiction1 4 4 3 2 2 4 5 4 3 3 3
Fiction 50 52 54 57 56 56 53 55 58 61 61
Entertainment 4 3 3 2 2 4 6 5 4 4 4
Music 2 1 1 2 2 2 2 3 3 3 3
Sports 4 4 4 3 2 1 0 0 1 1 1
Children and youth 14 13 11 10 11 12 11 14 15 15 15
Other2 10 12 8 8 8 7 6 7 7 7 7
Total 100 100 100 100 100 100 100 100 100 100 100
Total transmission hours 7 069 7 063 7 304 7 411 8 068 8 282 8 585 8 589 8 621 8 619 8 601
Skjár 1 News 5 1 – 0 0 0 0 – – 3 ..
Non-fiction1 9 – 1 8 1 2 3 2 2 0 ..
Fiction 22 29
22 13 22 21 25 20 21 24 ..
Entertainment 15 5 3 3 0 1 1 3 ..
Music 59 54 56 57 67 68 65 57 63 66 ..
Sports – – – 0 3 3 2 1 0 0 ..
Children and youth 1 – – 0 – – – – – 0 ..
Other2 4 16 6 17 3 3 4 19 12 4 ..
Total 100 100 100 100 100 100 100 100 100 100 ..
Total transmission hours 8 770 8 760 8 744 8 760 8 784 8 495 8 455 8 720 8 784 7 753 ..
1 Documentaries and informative, religious, arts and culture programmes.2 Advertising, tele-shopping, and unspecified.
Source: Statistics Iceland.
11.4 Private television programming in Norway by content 2000-2010 (share of transmission time, per cent)
Channel Content 2000 2001 2002 2003 2004 2005 2006 2007 2008 2009 2010
TV 2 News 11 13 10 9 10 10 10 9 8 6 7
Information 11 11 11 13 14 16 16 17 16 13 12
Drama 50 46 47 43 42 40 40 41 43 47 46
Entertainment 5 6 8 12 11 12 12 13 13 14 16
Sports 9 9 10 9 9 9 10 8 9 7 9
Children and youth 7 7 6 6 8 8 8 9 9 9 9
Religion 1 1 1 1 1 1 1 1 0 1 0
Nature and documentary 5 4 4 3 3 3 3 2 2 2 2
Music/culture 2 3 3 3 3 2 1 1 0 1 0
Education – – – – – – – – – – –
Other 0 0 0 1 0 0 0 – – – 0
Total 100 100 100 100 100 100 100 100 100 100 100
Total hours 5 543 5 655 5 823 5 950 6 045 5 948 5 722 6 020 6 341 6 144 6 140
Note: Programming time, i.e., programme information, promotion (trailers, etc.) are not included. Data for other channels not available.
Source: TV 2 (processed).

NORDICOM 88 Nordic Public Service Media Map 1/2012
TELEVISION
11. Cont. Private television programming by content 2000-2010
11.5 Private television programming in Sweden by content 2000-2010 (share of transmission time, per cent)
Channel Content 2000 2001 2002 2003 2004 2005 2006 2007 2008 2009 2010
TV3 News 2 2 2 1 1 1 0 1 0 0 0
Current affairs 1 1 0 1 1 1 2 0 0 0 0
Culture 0 0 1 0 0 0 1 0 0 0 0
Non-fiction 1 1 1 1 1 0 0 2 5 1 0
Entertainment 17 16 16 15 17 21 28 26 31 40 39
Fiction 49 47 43 48 49 48 42 46 40 41 42
Feature films 14 19 19 16 13 17 17 17 21 16 17
Sports 4 2 6 2 3 0 1 1 0 0 0
Children and youth 12 11 13 12 8 8 8 4 1 0 2
Other 0 0 0 4 6 2 2 2 2 0 0
Total 100 100 100 100 100 100 100 100 100 100 100
Hours per week 147 151 151 154 152 155 157 158 157 151 163
TV4 News 12 13 12 13 10 10 10 11 12 12 11
Current affairs 3 3 3 3 3 3 3 2 5 2 3
Culture 1 1 1 1 1 0 0 0 1 0 0
Non-fiction 13 14 12 12 14 21 19 20 17 18 19
Entertainment 15 14 10 17 19 16 16 11 10 20 25
Fiction 36 36 36 27 29 28 20 27 28 26 21
Feature films 6 8 11 8 10 9 11 9 12 11 10
Sports 7 7 10 9 7 7 7 8 8 6 7
Children and youth 5 5 4 6 4 3 5 5 4 4 4
Other 1 1 1 4 4 3 10 7 3 1 0
Total 100 100 100 100 100 100 100 100 100 100 100
Hours per week 136 137 135 134 148 160 161 161 159 161 163
Kanal 5 News 0 0 0 0 0 0 0 0 0 0 0
Current affairs 0 0 0 0 0 0 0 0 2 0 0
Culture 0 2 0 2 3 3 2 2 0 1 2
Non-fiction 3 6 5 7 5 5 5 3 9 4 9
Entertainment 25 27 22 23 25 23 27 28 31 37 37
Fiction 45 36 46 42 40 44 40 43 41 43 40
Feature films 13 17 19 16 14 13 13 9 8 7 10
Sports 1 1 0 0 2 3 1 2 0 0 1
Children and youth 13 10 6 7 7 7 10 6 2 3 3
Other 0 1 0 3 4 2 2 6 7 5 0
Total 100 100 100 100 100 100 100 100 100 100 100
Hours per week 136 141 150 152 150 158 162 162 162 163 160
Note: Transmission time (including announcers, self-promotion and advertising). Data based on 17 sample weeks for each year.
Sources: Swedish Broadcasting Commission/Swedish Broadcasting Authority.

TELEVISION
NORDICOM 89 Nordic Public Service Media Map 1/2012
12. Private television programming by origin 2000-2010
12.1 Private television programming in Finland by origin 2000-2010 (share of transmission time, per cent)
Channel Origin 2000 2001 2002 2003 2004 2005 2006 2007 2008 2009 2010
MTV3 Finland 66 60 50 53 57 52 52 51 53 48 49
Other Nordic 0 3 1 1 1 1 0 1 1 0 1
Other Europe 5 7 8 7 6 7 7 11 8 11 14
North America 28 30 38 39 37 39 40 37 37 40 35
Other 1 2 3 1 1 1 1 1 1 1 1
Total 100 100 100 100 100 100 100 100 100 100 100
Nelonen Finland 38 40 30 32 32 32 27 29 22 17 19
Other Nordic 1 0 1 2 4 1 1 – 1 2 1
Other Europe 21 20 22 17 15 13 5 11 13 12 6
North America 39 37 48 47 48 53 65 59 62 66 69
Other 2 3 0 2 2 1 2 1 4 3 5
Total 100 100 100 100 100 100 100 100 100 100 100
Sub Finland * .. .. .. .. 7 10 14 15 25 16
Other Nordic * .. .. .. .. 3 0 1 – 0 –
Other Europe * .. .. .. .. 7 6 9 24 23 21
North America * .. .. .. .. 80 76 68 55 49 62
Other * .. .. .. .. 3 8 9 5 3 1
Total * .. .. .. .. 100 100 100 100 100 100
Note: Data based on 4 to 7 sample weeks for each year.
Sources: MTV3, Channel Four (Nelonen), Finnpanel, Ministry of Transport and Communications.
12.2 Private television programming in Iceland by origin 2000-2010 (share of programming time, per cent)
Channel Origin 2000 2001 2002 2003 2004 2005 2006 2007 2008 2009 2010
Stöð 2 Iceland 24 21 25 20 20 22 29 20 17 14 14
Other Nordic 1 1 1 .. .. 1 0 1 0 0 0
Other Europe 15 15 14 .. .. 11 11 12 9 11 10
North America 51 51 52 51 46 47 50 57 63 65 67
Other 5 4 4 .. .. 6 8 9 9 8 8
Multinational and unspecified2 4 8 5 29 34 13 2 1 2 1 2
Total 100 100 100 100 100 100 100 100 100 100 100
Total programming hours 6 350 6 219 6 735 6 785 7 422 7 866 8 210 8 068 8 104 8 035 7 954
Skjár 11 Iceland 46 30 24 25 14 18 20 15 12 15 ..
Other Nordic - - - - 0 - - - - 0 ..
Other Europe - - 3 - 9 10 10 10 12 11 ..
North America 54 70 73 75 77 71 70 75 76 73 ..
Other - - - - - 0 - 1 1 0 ..
Multinational and unspecified2 - - - - - - - - - - ..
Total 100 100 100 100 100 100 100 100 100 100 ..
Total programming hours 3 272 2 615 3 319 2 343 2 919 3 515 4 000 2 020 2 140 2 195 ..
1 Music excluded (at night and before beginning of daily programme schedule in the afternoon).2 Mainly multinational co-productions.
Note: Programming time (transmission time less advertising and teleshopping). General interest channels only.
Source: Statistics Iceland.
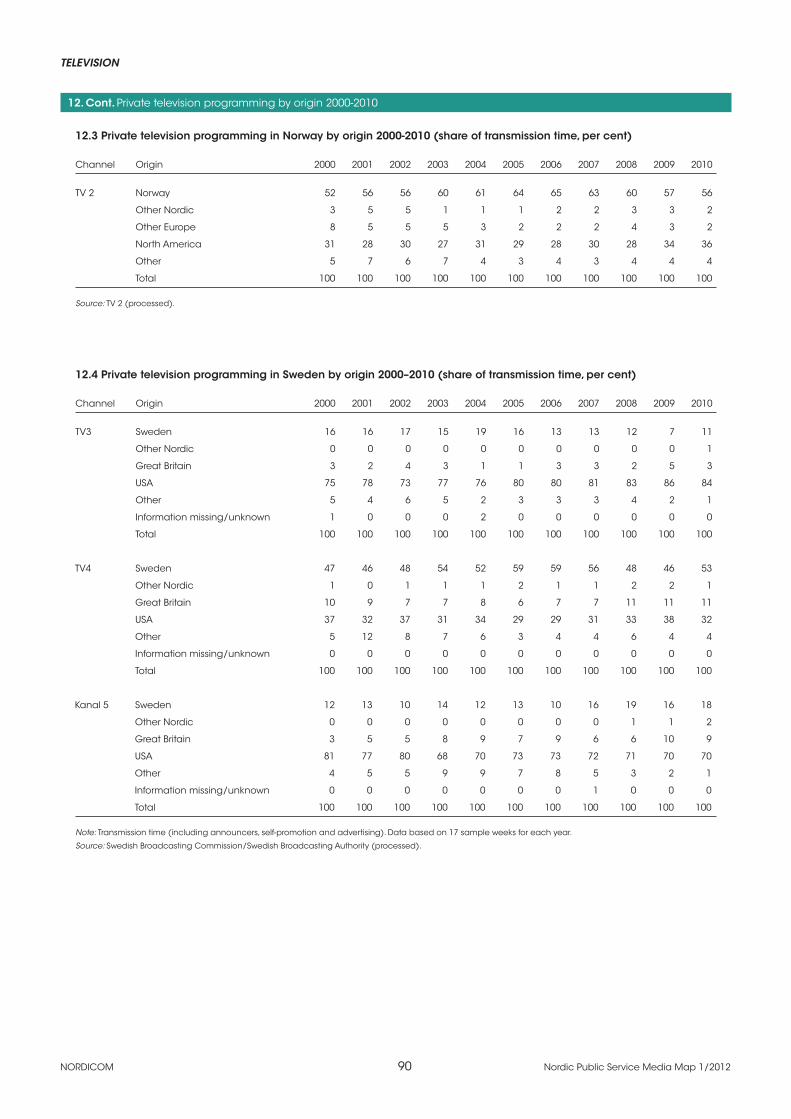
NORDICOM 90 Nordic Public Service Media Map 1/2012
TELEVISION
12. Cont. Private television programming by origin 2000-2010
12.3 Private television programming in Norway by origin 2000-2010 (share of transmission time, per cent)
Channel Origin 2000 2001 2002 2003 2004 2005 2006 2007 2008 2009 2010
TV 2 Norway 52 56 56 60 61 64 65 63 60 57 56
Other Nordic 3 5 5 1 1 1 2 2 3 3 2
Other Europe 8 5 5 5 3 2 2 2 4 3 2
North America 31 28 30 27 31 29 28 30 28 34 36
Other 5 7 6 7 4 3 4 3 4 4 4
Total 100 100 100 100 100 100 100 100 100 100 100
Source: TV 2 (processed).
12.4 Private television programming in Sweden by origin 2000–2010 (share of transmission time, per cent)
Channel Origin 2000 2001 2002 2003 2004 2005 2006 2007 2008 2009 2010
TV3 Sweden 16 16 17 15 19 16 13 13 12 7 11
Other Nordic 0 0 0 0 0 0 0 0 0 0 1
Great Britain 3 2 4 3 1 1 3 3 2 5 3
USA 75 78 73 77 76 80 80 81 83 86 84
Other 5 4 6 5 2 3 3 3 4 2 1
Information missing/unknown 1 0 0 0 2 0 0 0 0 0 0
Total 100 100 100 100 100 100 100 100 100 100 100
TV4 Sweden 47 46 48 54 52 59 59 56 48 46 53
Other Nordic 1 0 1 1 1 2 1 1 2 2 1
Great Britain 10 9 7 7 8 6 7 7 11 11 11
USA 37 32 37 31 34 29 29 31 33 38 32
Other 5 12 8 7 6 3 4 4 6 4 4
Information missing/unknown 0 0 0 0 0 0 0 0 0 0 0
Total 100 100 100 100 100 100 100 100 100 100 100
Kanal 5 Sweden 12 13 10 14 12 13 10 16 19 16 18
Other Nordic 0 0 0 0 0 0 0 0 1 1 2
Great Britain 3 5 5 8 9 7 9 6 6 10 9
USA 81 77 80 68 70 73 73 72 71 70 70
Other 4 5 5 9 9 7 8 5 3 2 1
Information missing/unknown 0 0 0 0 0 0 0 1 0 0 0
Total 100 100 100 100 100 100 100 100 100 100 100
Note: Transmission time (including announcers, self-promotion and advertising). Data based on 17 sample weeks for each year.
Source: Swedish Broadcasting Commission/Swedish Broadcasting Authority (processed).

TELEVISION
NORDICOM 91 Nordic Public Service Media Map 1/2012
13. Television daily reach 2000-2011 (per cent)
Share of population (%)
Denmark Finland Iceland Norway Sweden
Year (Age 3+) (Age 10+) (Age 12-80) (Age 12+) (Age 3+)
2000 71 77 88 72 76
2001 71 78 90 71 74
2002 72 78 91 71 73
2003 71 77 91 71 73
2004 72 75 88 71 72
2005 71 76 71 71 70
2006 70 75 87 69 71
2007 69 74 83 68 71
2008 72 73 .. 71 69
2009 74 73 .. 71 70
2010 75 74 .. 71 71
2011 75 74 .. 69 71
Note: Definition of daily reach in Denmark and Sweden: share of viewers who have watched at least five consecutive minutes; in Finland and Norway: based on one minute’s viewing; in Iceland: share of respondents who tuned in to the stations per day on average. TV-meter rating figures and yearly averages, except for Iceland with data according to diary surveys Oct/Nov (except for 2007: June). Time shift within 7 days included in Finland and Norway from 2008 on, in Sweden in 2010.
Sources: TNS Gallup Denmark, Finnpanel and YLE Audience Research, Social Science Institute at the University of Ice-land, Capacent, TNS Gallup Norway, MMS.
14. Public service television daily reach 2000-2010 (per cent)
Share of population (%)
Denmark Finland Iceland Norway Sweden
Year (Age 3+) (Age 10+) (Age 12-80) (Age 12+) (Age 3+)
DR TV 21 YLE RÚV NRK SVT
2000 52 54 68 64 61 61
2001 52 53 69 68 59 58
2002 53 53 69 70 60 57
2003 55 53 67 68 62 56
2004 55 53 66 62 62 56
2005 52 52 65 67 61 53
2006 51 50 64 67 58 53
2007 48 49 62 66 55 51
2008 50 50 61 .. 59 49
2009 52 51 61 .. 59 49
2010 53 51 61 .. 59 51
1 TV 2 Danmark’s main channel only (the other TV 2 channels have no public service obligations).
Note: Definition of daily reach in Denmark and Sweden: share of viewers who have watched at least five consecutive minutes; in Finland and Norway: based on one minute’s viewing; in Iceland: share of respondents who tuned in to the stations per day on average. TV-meter rating figures and yearly averages, except for Iceland with data according to diary surveys Oct/Nov (except for 2007: June). Time shift within 7 days included in Finland and Norway from 2008 on, in Sweden in 2010.
Sources: TNS Gallup Denmark, Finnpanel and YLE Audience Research, Social Science Institute at the University of Iceland, Capacent, TNS Gallup Norway, SVT database on public service.
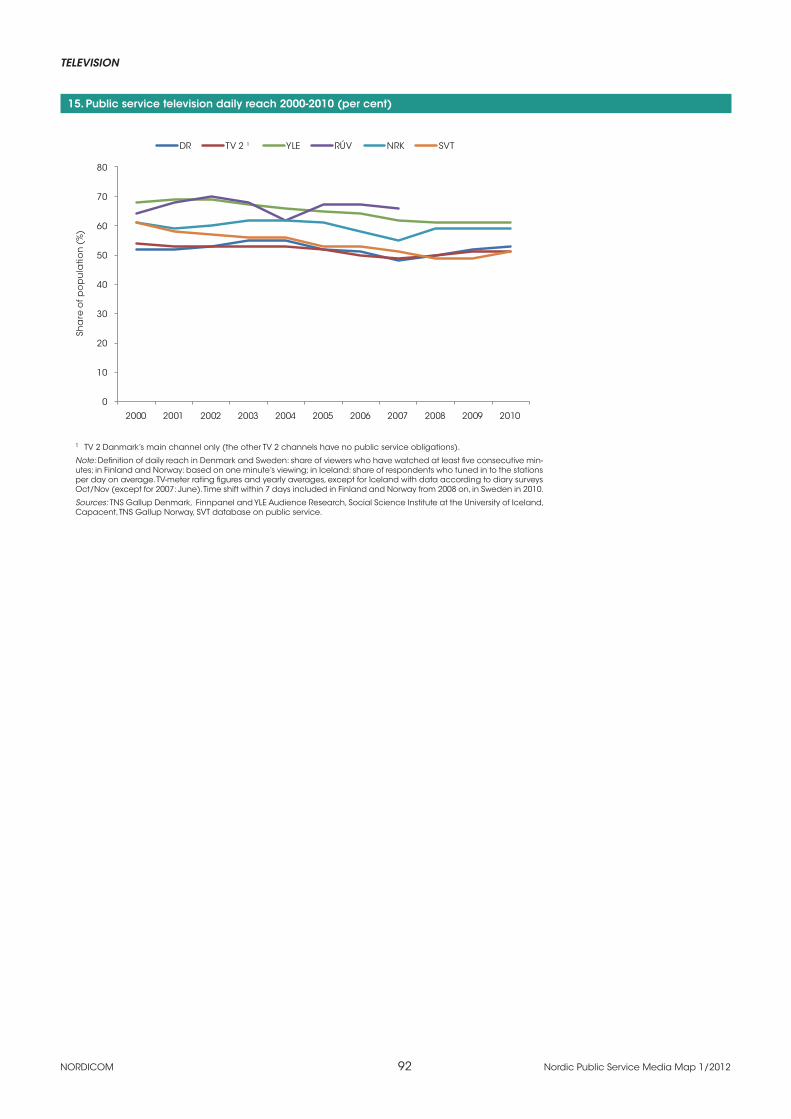
NORDICOM 92 Nordic Public Service Media Map 1/2012
TELEVISION
15. Public service television daily reach 2000-2010 (per cent)
1 TV 2 Danmark’s main channel only (the other TV 2 channels have no public service obligations).
Note: Definition of daily reach in Denmark and Sweden: share of viewers who have watched at least five consecutive min-utes; in Finland and Norway: based on one minute’s viewing; in Iceland: share of respondents who tuned in to the stations per day on average. TV-meter rating figures and yearly averages, except for Iceland with data according to diary surveys Oct/Nov (except for 2007: June). Time shift within 7 days included in Finland and Norway from 2008 on, in Sweden in 2010.
Sources: TNS Gallup Denmark, Finnpanel and YLE Audience Research, Social Science Institute at the University of Iceland, Capacent, TNS Gallup Norway, SVT database on public service.
0
10
20
30
40
50
60
70
80
2000 2001 2002 2003 2004 2005 2006 2007 2008 2009 2010
Sha
re o
f po
pu
latio
n (
%)
DR TV 2 1 YLE RÚV NRK SVT
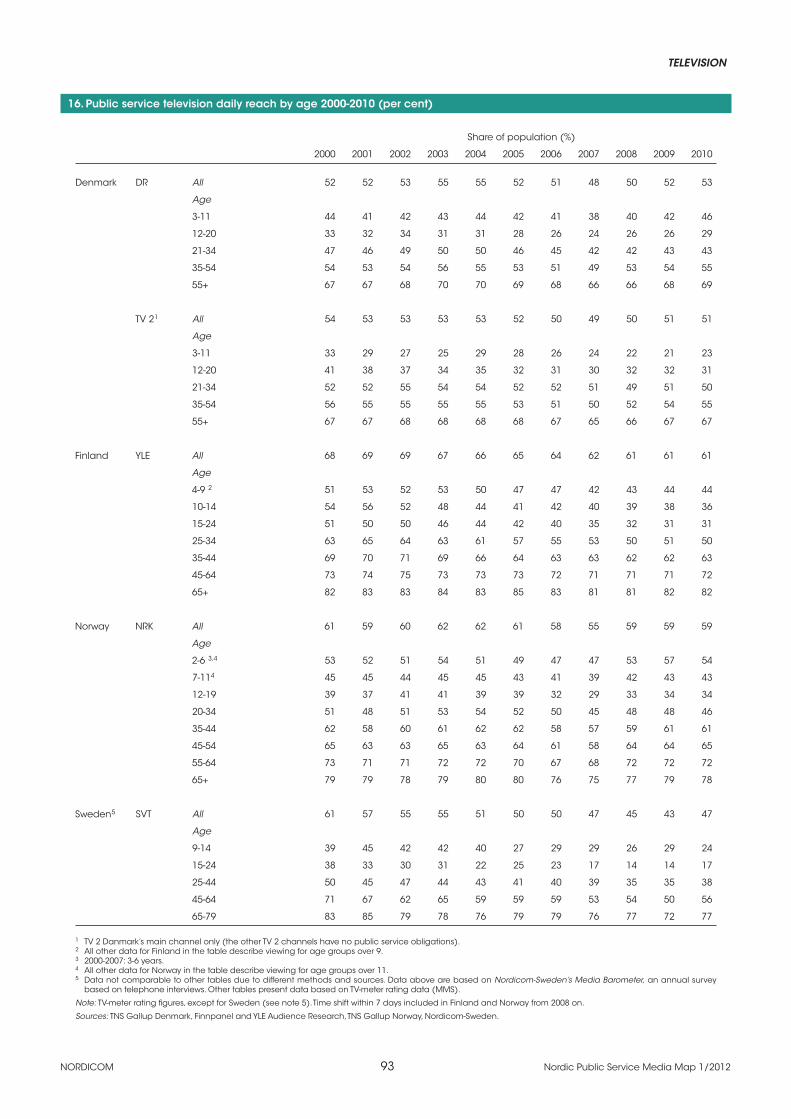
TELEVISION
NORDICOM 93 Nordic Public Service Media Map 1/2012
16. Public service television daily reach by age 2000-2010 (per cent)
Share of population (%)
2000 2001 2002 2003 2004 2005 2006 2007 2008 2009 2010
Denmark DR All 52 52 53 55 55 52 51 48 50 52 53
Age
3-11 44 41 42 43 44 42 41 38 40 42 46
12-20 33 32 34 31 31 28 26 24 26 26 29
21-34 47 46 49 50 50 46 45 42 42 43 43
35-54 54 53 54 56 55 53 51 49 53 54 55
55+ 67 67 68 70 70 69 68 66 66 68 69
TV 21 All 54 53 53 53 53 52 50 49 50 51 51
Age
3-11 33 29 27 25 29 28 26 24 22 21 23
12-20 41 38 37 34 35 32 31 30 32 32 31
21-34 52 52 55 54 54 52 52 51 49 51 50
35-54 56 55 55 55 55 53 51 50 52 54 55
55+ 67 67 68 68 68 68 67 65 66 67 67
Finland YLE All 68 69 69 67 66 65 64 62 61 61 61
Age
4-9 2 51 53 52 53 50 47 47 42 43 44 44
10-14 54 56 52 48 44 41 42 40 39 38 36
15-24 51 50 50 46 44 42 40 35 32 31 31
25-34 63 65 64 63 61 57 55 53 50 51 50
35-44 69 70 71 69 66 64 63 63 62 62 63
45-64 73 74 75 73 73 73 72 71 71 71 72
65+ 82 83 83 84 83 85 83 81 81 82 82
Norway NRK All 61 59 60 62 62 61 58 55 59 59 59
Age
2-6 3,4 53 52 51 54 51 49 47 47 53 57 54
7-114 45 45 44 45 45 43 41 39 42 43 43
12-19 39 37 41 41 39 39 32 29 33 34 34
20-34 51 48 51 53 54 52 50 45 48 48 46
35-44 62 58 60 61 62 62 58 57 59 61 61
45-54 65 63 63 65 63 64 61 58 64 64 65
55-64 73 71 71 72 72 70 67 68 72 72 72
65+ 79 79 78 79 80 80 76 75 77 79 78
Sweden5 SVT All 61 57 55 55 51 50 50 47 45 43 47
Age
9-14 39 45 42 42 40 27 29 29 26 29 24
15-24 38 33 30 31 22 25 23 17 14 14 17
25-44 50 45 47 44 43 41 40 39 35 35 38
45-64 71 67 62 65 59 59 59 53 54 50 56
65-79 83 85 79 78 76 79 79 76 77 72 77
1 TV 2 Danmark’s main channel only (the other TV 2 channels have no public service obligations). 2 All other data for Finland in the table describe viewing for age groups over 9.3 2000-2007: 3-6 years.4 All other data for Norway in the table describe viewing for age groups over 11.5 Data not comparable to other tables due to different methods and sources. Data above are based on Nordicom-Sweden’s Media Barometer, an annual survey
based on telephone interviews. Other tables present data based on TV-meter rating data (MMS).
Note: TV-meter rating figures, except for Sweden (see note 5). Time shift within 7 days included in Finland and Norway from 2008 on.
Sources: TNS Gallup Denmark, Finnpanel and YLE Audience Research, TNS Gallup Norway, Nordicom-Sweden.
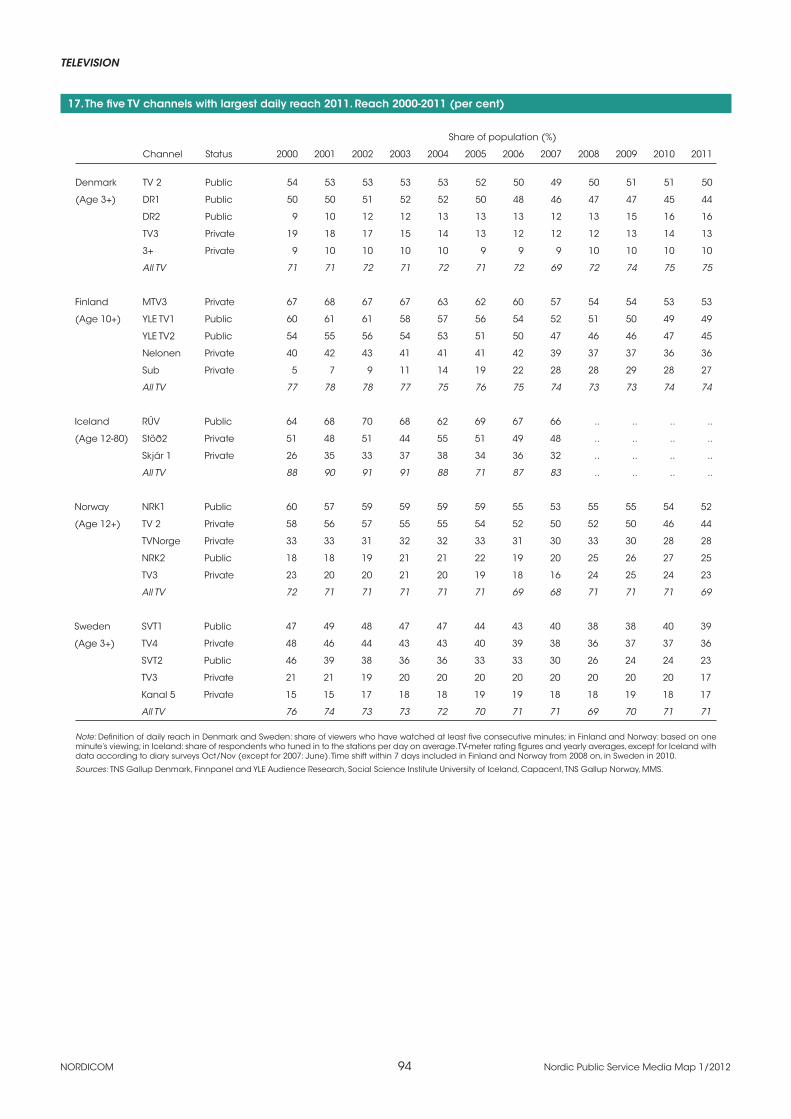
NORDICOM 94 Nordic Public Service Media Map 1/2012
TELEVISION
17. The five TV channels with largest daily reach 2011. Reach 2000-2011 (per cent)
Share of population (%)
Channel Status 2000 2001 2002 2003 2004 2005 2006 2007 2008 2009 2010 2011
Denmark TV 2 Public 54 53 53 53 53 52 50 49 50 51 51 50
(Age 3+) DR1 Public 50 50 51 52 52 50 48 46 47 47 45 44
DR2 Public 9 10 12 12 13 13 13 12 13 15 16 16
TV3 Private 19 18 17 15 14 13 12 12 12 13 14 13
3+ Private 9 10 10 10 10 9 9 9 10 10 10 10
All TV 71 71 72 71 72 71 72 69 72 74 75 75
Finland MTV3 Private 67 68 67 67 63 62 60 57 54 54 53 53
(Age 10+) YLE TV1 Public 60 61 61 58 57 56 54 52 51 50 49 49
YLE TV2 Public 54 55 56 54 53 51 50 47 46 46 47 45
Nelonen Private 40 42 43 41 41 41 42 39 37 37 36 36
Sub Private 5 7 9 11 14 19 22 28 28 29 28 27
All TV 77 78 78 77 75 76 75 74 73 73 74 74
Iceland RÚV Public 64 68 70 68 62 69 67 66 .. .. .. ..
(Age 12-80) Stöð2 Private 51 48 51 44 55 51 49 48 .. .. .. ..
Skjár 1 Private 26 35 33 37 38 34 36 32 .. .. .. ..
All TV 88 90 91 91 88 71 87 83 .. .. .. ..
Norway NRK1 Public 60 57 59 59 59 59 55 53 55 55 54 52
(Age 12+) TV 2 Private 58 56 57 55 55 54 52 50 52 50 46 44
TVNorge Private 33 33 31 32 32 33 31 30 33 30 28 28
NRK2 Public 18 18 19 21 21 22 19 20 25 26 27 25
TV3 Private 23 20 20 21 20 19 18 16 24 25 24 23
All TV 72 71 71 71 71 71 69 68 71 71 71 69
Sweden SVT1 Public 47 49 48 47 47 44 43 40 38 38 40 39
(Age 3+) TV4 Private 48 46 44 43 43 40 39 38 36 37 37 36
SVT2 Public 46 39 38 36 36 33 33 30 26 24 24 23
TV3 Private 21 21 19 20 20 20 20 20 20 20 20 17
Kanal 5 Private 15 15 17 18 18 19 19 18 18 19 18 17
All TV 76 74 73 73 72 70 71 71 69 70 71 71
Note: Definition of daily reach in Denmark and Sweden: share of viewers who have watched at least five consecutive minutes; in Finland and Norway: based on one minute’s viewing; in Iceland: share of respondents who tuned in to the stations per day on average. TV-meter rating figures and yearly averages, except for Iceland with data according to diary surveys Oct/Nov (except for 2007: June). Time shift within 7 days included in Finland and Norway from 2008 on, in Sweden in 2010.
Sources: TNS Gallup Denmark, Finnpanel and YLE Audience Research, Social Science Institute University of Iceland, Capacent, TNS Gallup Norway, MMS.

TELEVISION
NORDICOM 95 Nordic Public Service Media Map 1/2012
18. The five TV channels with largest daily reach per country 2011
19. The five TV channels with largest daily reach 2010/2011. Reach by sex and age (per cent)
Share of population (%)
Denmark 2011 TV 2 DR1 DR2 TV3 TV3+ All TV
Status Public service Public service Public service Private Private
All 50 44 16 13 10 75
Sex
Men 48 42 16 11 12 74
Women 52 45 15 15 7 75
Age
3-11 21 31 3 4 3 65
12-20 31 21 5 12 10 59
21-34 48 31 11 22 17 74
35-54 54 46 16 15 11 77
55+ 65 61 26 9 6 82
Note: Definition of daily reach in Denmark and Sweden: share of viewers who have watched at least five consecutive minutes; in Finland and Norway: based on one minute’s viewing. TV-meter rating figures and yearly averages; time shift within 7 days included in Finland, Norway and Sweden. Public service TV shown in colour.
Sources: TNS Gallup Denmark, Finnpanel and YLE Audience Research, TNS Gallup Norway, MMS.
50
44
16
13
10
53
49
45
36
27
52
44
28
2523
39
36
23
17 17
0
10
20
30
40
50
60
TV 2
DR1
DR2 TV
3 3+
MTV
3
YLE
TV
1
YLE
TV
2
Nel
on
en
Sub
NRK
1
TV 2
TVN
org
e
NRK
2
TV3
SVT1
TV4
SVT2
TV3
Kan
al 5
Sha
re o
f po
pu
latio
n (
%)
DenmarkFinland Norway Sweden

NORDICOM 96 Nordic Public Service Media Map 1/2012
TELEVISION
19. Cont. The five TV channels with largest daily reach 2010/2011. Reach by sex and age (per cent)
Share of population (%)
Finland 2010 MTV3 YLE TV1 YLE TV2 Nelonen Subtv All TV
Status Private Public service Public service Private Private
All 53 49 47 36 28 74
Sex
Men 51 49 47 35 29 72
Women 55 49 46 37 28 75
Age
4-91 25 14 40 19 13 61
10-14 34 17 27 28 27 60
15-24 33 17 22 28 26 51
25-34 50 32 36 40 35 70
35-44 55 48 45 42 34 76
45-64 60 62 56 40 28 80
65+ 63 76 67 32 22 85
Norway 2011 NRK1 TV 2 TVNorge NRK2 TV3 All TV
Status Public service Private Private Public service Private
All 52 44 28 25 23 69
Sex
Men 51 42 27 26 21 68
Women 52 46 30 23 24 71
Age
2-62 17 17 7 4 5 60
7-112 24 22 13 6 9 62
12-19 25 26 21 8 16 51
20-34 33 37 30 15 27 62
35-44 51 48 32 21 27 72
45-54 50 31 27 24 73
55-64 68 52 27 35 20 76
65+ 75 51 24 44 18 80
Sweden 2011 SVT1 TV4 SVT2 TV3 Kanal 5 All TV
Status Public service Private Public service Private Private
All 39 36 23 17 17 71
Sex
Men 38 33 23 15 15 69
Women 40 40 22 20 19 73
Age
3-14 14 18 6 8 8 68
15-24 14 19 7 14 16 47
25-39 30 34 15 22 24 71
40-59 43 41 25 20 19 73
60+ 69 52 43 17 14 83
1 All other data for Finland in the table describe viewing for age groups over 9.2 All other data for Norway in the table describe viewing for age groups over 11.
Note: Definition of daily reach in Denmark and Sweden: share of viewers who have watched at least five consecutive minutes; in Finland and Norway: based on one minute’s viewing. TV-meter rating figures and yearly averages. Time shift included in Finland, Norway and Sweden.
Sources: TNS Gallup Denmark, Finnpanel and YLE Audience Research, TNS Gallup Norway, MMS.
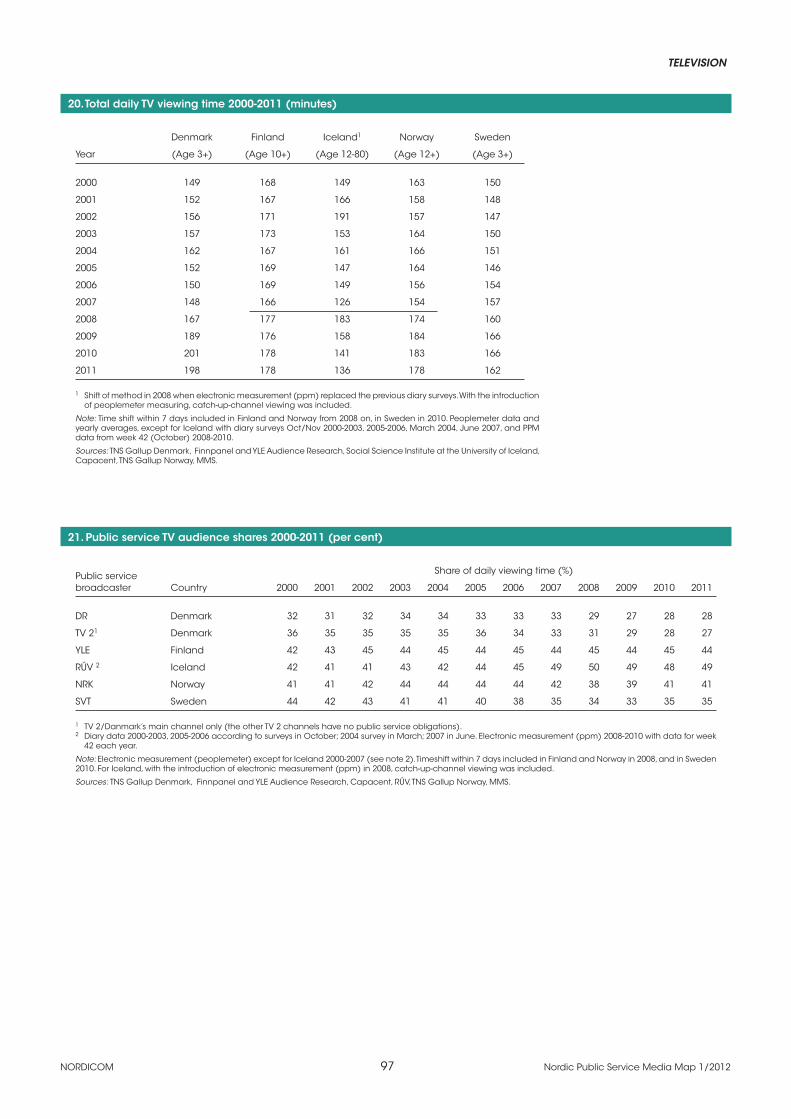
TELEVISION
NORDICOM 97 Nordic Public Service Media Map 1/2012
20. Total daily TV viewing time 2000-2011 (minutes)
Denmark Finland Iceland1 Norway Sweden
Year (Age 3+) (Age 10+) (Age 12-80) (Age 12+) (Age 3+)
2000 149 168 149 163 150
2001 152 167 166 158 148
2002 156 171 191 157 147
2003 157 173 153 164 150
2004 162 167 161 166 151
2005 152 169 147 164 146
2006 150 169 149 156 154
2007 148 166 126 154 157
2008 167 177 183 174 160
2009 189 176 158 184 166
2010 201 178 141 183 166
2011 198 178 136 178 162
1 Shift of method in 2008 when electronic measurement (ppm) replaced the previous diary surveys. With the introduction of peoplemeter measuring, catch-up-channel viewing was included.
Note: Time shift within 7 days included in Finland and Norway from 2008 on, in Sweden in 2010. Peoplemeter data and yearly averages, except for Iceland with diary surveys Oct/Nov 2000-2003, 2005-2006, March 2004, June 2007, and PPM data from week 42 (October) 2008-2010.
Sources: TNS Gallup Denmark, Finnpanel and YLE Audience Research, Social Science Institute at the University of Iceland, Capacent, TNS Gallup Norway, MMS.
21. Public service TV audience shares 2000-2011 (per cent)
Public service Share of daily viewing time (%)
broadcaster Country 2000 2001 2002 2003 2004 2005 2006 2007 2008 2009 2010 2011
DR Denmark 32 31 32 34 34 33 33 33 29 27 28 28
TV 21 Denmark 36 35 35 35 35 36 34 33 31 29 28 27
YLE Finland 42 43 45 44 45 44 45 44 45 44 45 44
RÚV 2 Iceland 42 41 41 43 42 44 45 49 50 49 48 49
NRK Norway 41 41 42 44 44 44 44 42 38 39 41 41
SVT Sweden 44 42 43 41 41 40 38 35 34 33 35 35
1 TV 2/Danmark’s main channel only (the other TV 2 channels have no public service obligations). 2 Diary data 2000-2003, 2005-2006 according to surveys in October; 2004 survey in March; 2007 in June. Electronic measurement (ppm) 2008-2010 with data for week
42 each year.
Note: Electronic measurement (peoplemeter) except for Iceland 2000-2007 (see note 2). Timeshift within 7 days included in Finland and Norway in 2008, and in Sweden 2010. For Iceland, with the introduction of electronic measurement (ppm) in 2008, catch-up-channel viewing was included.
Sources: TNS Gallup Denmark, Finnpanel and YLE Audience Research, Capacent, RÚV, TNS Gallup Norway, MMS.

NORDICOM 98 Nordic Public Service Media Map 1/2012
TELEVISION
22. Public service TV audience shares 2000-2011 (per cent)
1 TV 2/Danmark’s main channel only (the other TV 2 channels have no public service obligations). 2 Diary data 2000-2003, 2005-2006 according to surveys in October; 2004 survey in March; 2007 in June. Electronic measurement (ppm) 2008-2010 with data for week
42 each year.
Note: Electronic measurement (peoplemeter) except for Iceland 2000-2007 (see note 2). Timeshift within 7 days included in Finland and Norway in 2008, and in Sweden 2010. For Iceland, with the introduction of electronic measurement (ppm) in 2008, catch-up-channel viewing was included.
Sources: TNS Gallup Denmark, Finnpanel and YLE Audience Research, Capacent, RÚV, TNS Gallup Norway, MMS.
0
10
20
30
40
50
60
2000 2001 2002 2003 2004 2005 2006 2007 2008 2009 2010 2011
Sha
re o
f vie
win
g ti
me
(%)
DR TV 21 YLE RÚV2 NRK SVT

TELEVISION
NORDICOM 99 Nordic Public Service Media Map 1/2012
23. Public service TV audience shares by age 2000-2011 (per cent)
Share of daily viewing time (%)
2000 2001 2002 2003 2004 2005 2006 2007 2008 2009 2010 2011
Denmark DR All 32 31 32 34 34 33 33 31 29 27 28 28
Age
3-11 38 38 39 42 39 39 37 36 33 32 35 39
12-20 21 20 23 24 23 22 21 18 18 16 17 18
21-34 26 23 25 26 25 23 22 21 19 18 19 17
35-54 33 32 33 34 35 34 34 31 29 27 26 26
55+ 36 36 37 38 40 38 39 38 36 34 35 35
TV 21 All 36 35 35 35 35 36 34 33 31 29 28 27
Age
3-11 27 25 22 19 23 23 20 19 15 13 13 13
12-20 33 38 29 32 31 32 28 28 26 24 22 21
21-34 33 31 33 33 33 32 32 32 29 28 25 25
35-54 39 38 37 36 37 38 36 35 32 30 29 28
55+ 39 38 39 39 38 39 38 37 36 34 33 31
Finland YLE All 42 43 45 44 45 44 45 44 45 44 45 ..
Age
4-92 47 47 48 45 48 45 41 33 38 42 41 ..
10-14 27 30 29 25 27 24 23 20 19 21 21 ..
15-24 27 25 25 21 23 20 19 17 19 18 19 ..
25-34 34 34 33 29 23 24 25 24 25 24 25 ..
35-44 42 42 43 41 41 39 39 36 37 34 35 ..
45-64 48 49 52 51 51 50 51 48 48 48 49 ..
65+ 48 49 54 54 56 58 61 62 62 61 62 ..
Norway NRK All 41 41 42 44 44 44 44 42 38 39 41 41
Age
2-63,4 45 47 53 54 52 48 46 46 45 52 55 57
7-114 31 34 39 43 42 38 37 31 26 31 32 35
12-19 21 20 24 25 26 24 23 20 19 21 23 23
20-34 27 26 29 29 28 28 29 26 22 21 24 23
35-44 38 39 40 40 40 39 38 35 32 33 34 33
45-54 44 46 46 49 49 47 46 46 42 43 44 43
55-64 52 53 52 53 52 53 53 52 47 49 50 52
65+ 54 56 57 61 62 63 60 57 54 59 62 60
Sweden SVT All 44 42 43 41 40 40 36 32 33 31 35 35
Age
3-14 32 40 37 37 36 34 26 22 31 28 33 38
15-24 24 20 23 20 20 16 17 14 13 12 15 15
25-39 35 34 35 31 31 29 25 20 21 20 24 23
40-59 42 41 44 41 41 39 35 30 29 27 31 30
60+ 57 54 54 53 52 55 51 47 45 47 49 47
1 TV 2/Danmark’s main channel only (the other TV 2 channels have no public service obligations). 2 All other data for Finland in the table describe viewing for age groups over 9.3 2000-2007: 3-6 years.4 All other data for Norway in the table describe viewing for age groups over 11.
Note: Peoplemeter data and yearly averages. Time shift within 7 days included in Finland and Norway from 2008 on, in Sweden in 2010.
Sources: TNS Gallup Denmark, Finnpanel and YLE Audience Research, TNS Gallup Norway, MMS.

NORDICOM 100 Nordic Public Service Media Map 1/2012
TELEVISION
24. The TV channel families with the largest audience shares 2011. Shares 2000-2011 (per cent)
Share of daily viewing time (%)
Channel family 2000 2001 2002 2003 2004 2005 2006 2007 2008 2009 2010 2011
Denmark TV 21 36 37 38 37 38 40 40 40 39 39 38 38
(Age 3+) (No. of channels) (2) (2) (2) (2) (3) (4) (5) (5) (5) (5) (5) (5)
DR 32 31 32 34 34 33 33 31 29 27 28 28
(No. of channels) (2) (2) (2) (2) (2) (2) (2) (2) (3) (6) (6) (6)
MTG/Viasat1,2 12 12 11 11 10 9 9 9 9 9 10 10
(No. of channels) (2) (2) (3) (3) (3) (3) (3) (2) (2) (3) (3) (3)
SBS (ProSiebenSat.1) 7 9 7 7 7 6 6 5 6 6 7 7
(No. of channels) (2) (2) (2) (2) (2) (2) (3) (4) (4) (4) (4) (4)
Other 13 11 12 11 11 12 12 15 17 19 17 15
Total 100 100 100 100 100 100 100 100 100 100 100 100
Daily viewing time (minutes) 149 152 156 157 162 152 150 148 167 189 201 198
Finland YLE 42 43 45 44 45 44 45 44 45 44 45 44
(Age 10+) (No. of channels) (2) (5) (5) (5) (5) (5) (5) (5) (4) (4) (4) (4)
MTV Media 41 40 38 40 38 37 34 33 31 32 30 30
(No. of channels) (2) (2) (2) (2) (2) (2) (6) (6) (9) (9) (10) (10)
Nelonen Media 12 12 12 11 12 11 12 12 14 15 15 15
(No. of channels) (1) (1) (1) (1) (1) (1) (1) (5) (5) (6) (6) (8)
Other 5 5 5 5 5 8 8 11 10 9 11 10
Total 100 100 100 100 100 100 100 100 100 100 100 100
Daily viewing time (minutes) 168 167 171 173 167 169 169 166 177 176 178 178
Iceland3 RÚV-TV 42 41 41 43 42 44 45 49 50 49 48 49
(Age 12-80) (No. of channels) (1) (1) (1) (1) (1) (1) (1) (1) (1) (1) (1) (1)
365 ehf. 43 40 38 36 41 39 34 32 33 36 42 43
(No. of channels) (2) (3) (3) (3) (3) (3) (2) (2) (5) (5) (5) (5)
Other 15 19 21 21 17 17 21 19 17 15 10 9
Total 100 100 100 100 100 100 100 100 100 100 100 100
Daily viewing time (minutes) 149 166 191 153 161 147 149 126 183 158 141 136
Norway NRK 41 41 42 44 44 44 44 42 38 39 41 41
(Age 12+) (No. of channels) (2) (2) (2) (2) (2) (2) (2) (3) (3) (3) (3) (3)
TV 24 32 31 32 30 30 30 32 32 30 28 27 26
(No. of channels) (1) (1) (1) (1) (2) (2) (3) (4) (4) (4) (5) (5)
SBS (ProSiebenSat.1)5 10 10 10 10 10 11 10 10 10 10 10 12
(No. of channels) (1) (1) (1) (1) (1) (2) (2) (3) (2) (2) (3) (3)
MTG/Viasat6 8 7 6 6 6 6 7 6 9 10 10 8
(No. of channels) (1) (1) (1) (1) (1) (1) (2) (2) (2) (2) (2) (2)
Other 9 11 10 10 10 9 7 10 14 14 13 13
Total 100 100 100 100 100 100 100 100 100 100 100 100
Daily viewing time (minutes) 163 158 157 164 166 164 156 154 174 184 183 178
Cont.

TELEVISION
NORDICOM 101 Nordic Public Service Media Map 1/2012
24. Cont. The TV channel families with the largest audience shares 2011. Shares 2000-2011 (per cent)
Share of daily viewing time (%)
Channel family 2000 2001 2002 2003 2004 2005 2006 2007 2008 2009 2010 2011
Sweden SVT 44 42 43 41 41 40 38 35 34 33 35 35
(Age 3+) (No. of channels)7 (2) (2) (3) (4) (5) (5) (5) (5) (5) (5) (6) (5)
TV4 27 28 25 26 26 26 26 27 29 29 29 30
(No. of channels) (1) (1) (1) (3) (3) (5) (6) (8) (16) (16) (18) (20)
MTG/Viasat 14 14 13 14 13 14 15 16 16 17 17 18
(No. of channels) (7) (7) (7) (9) (11) (13) (13) (14) (15) (15) (19) (18)
SBS (ProSiebenSat.1) 6 7 8 8 9 10 10 10 10 9 9 9
(No. of channels) (1) (1) (1) (1) (1) (6) (7) (9) (3) (2) (2) (2)
Other 9 10 11 11 11 11 11 11 10 12 10 9
Total 100 100 100 100 100 100 100 100 100 100 100 100
Daily viewing time (minutes) 150 148 147 150 151 146 154 157 160 166 166 162
1 TV 2 Sport, a joint venture between TV 2 Denmark and MTG, is not included. The channel started in Spring 2007 replacing MTG’s Viasat Sport. Its share for 2010 was 1%.
2 2000-2001: TV3, 3+; 2002-2006: TV3, 3+ and Viasat Sport; 2007-2008: TV3, 3+; 2009-2010: TV3, 3+, TV3 PULS. The Gallup TV-meter survey presents viewing time also for some TV1000 & Viasat channels which are not included here. The MTG market share would, however, be at approximately the same level if included, since their weekly viewing time is quite low.
3 Diary data 2000-2003, 2005-2006 according to surveys in October; 2004 survey in March; 2007 in June. Electronic measurement (ppm) 2008-2010 with data for week 42 each year.
4 Excluding TV2 Sport (launched in 2007) and TV2 Barclay Premier League (launched in 2010).5 2000-2004: TVNorge; 2005-2006: TVNorge, The Voice; 2007: TVNorge, The Voice, Fem; 2008- 2009: TVNorge, Fem; 2010: TVNorge, Fem, Max.6 2000-2005: TV3; 2006: TV3, ZTV; 2007: TV3, ZTV/Viasat 4; 2008-2010: TV3, Viasat4. MTG’s sport channel SportN (2005-2009), MTG’s pay-TV channels TV1000 and other
Viasat channels are not included. 7 2010: including SVT HD, which was established in 2006, but presented in TV measures first time in 2010 (with a share of 0.3%). SVT HD is not included in 2011.
Note: Electronic measurement (peoplemeter) except for Iceland 2000-2007 (see note 3). Timeshift within 7 days included in Finland and Norway in 2008, and in Sweden 2010. For Iceland, with the introduction of electronic measurement (ppm) in 2008, catch-up-channel viewing was included. If not specified in notes, all channels per family are included.
Sources: TNS Gallup Denmark, Danish Agency for Culture (Centre for Libraries and Media), Finnpanel and YLE Audience Research, Ministry of Transport and Communi-cations (Finland), Capacent (Iceland), TNS Gallup Norway, medianorway, MMS, Nordicom-Sweden.

NORDICOM 102 Nordic Public Service Media Map 1/2012
TELEVISION
25. The TV channel families with the largest audience shares 2011
Denmark Norway
Finland Sweden
Iceland
1 Only TV 2 Danmark’s main channel TV 2 has public service obligations.2 TV 2 Sport, a joint venture between TV 2/Danmark and MTG, is not included.3 Included are TV3, 3+, TV3 PULS. MTG’s pay-TV channels TV1000 and other Viasat channels are not included.4 Included are TV2, TV2 Zebra, TV2 Nyheter, TV2 Film and TV2 Bliss.5 Including TVNorge, Fem, Max.6 MTG’s pay-TV channels TV1000 and other Viasat channels are not included.
Note: Electronic measurement, timeshift within 7 days included in Finland, Norway and Sweden. For Iceland, catch-up-channel viewing is included. Public service TV shown in colour.
Sources: TNS Gallup Denmark, Danish Agency for Culture (Centre for Libraries and Media), Finnpanel and YLE Audience Research, Ministry of Transport and Communi-cations (Finland), Capacent (Iceland), TNS Gallup Norway, medianorway, MMS, Nordicom-Sweden.
TV 2 other
11%
TV 2 main
channel
(public service)
27%
DR 28%
MTG/Viasat2,3 10%
SBS (ProSieben) 7%
Other 15%TV 2 total1,2
38%
YLE 44%
MTV Media 30%
Nelonen
Media 15%
Other 10%
RÚV-TV 49%
365 ehf. 43%
Other 9%
SVT 35%
TV4 30%
MTG/Viasat 18%
SBS (ProSieben) 9%
Other 9%
NRK 41%
TV24 26%
SBS (ProSieben)5
12%
MTG/Viasat6 8%
Other 13%
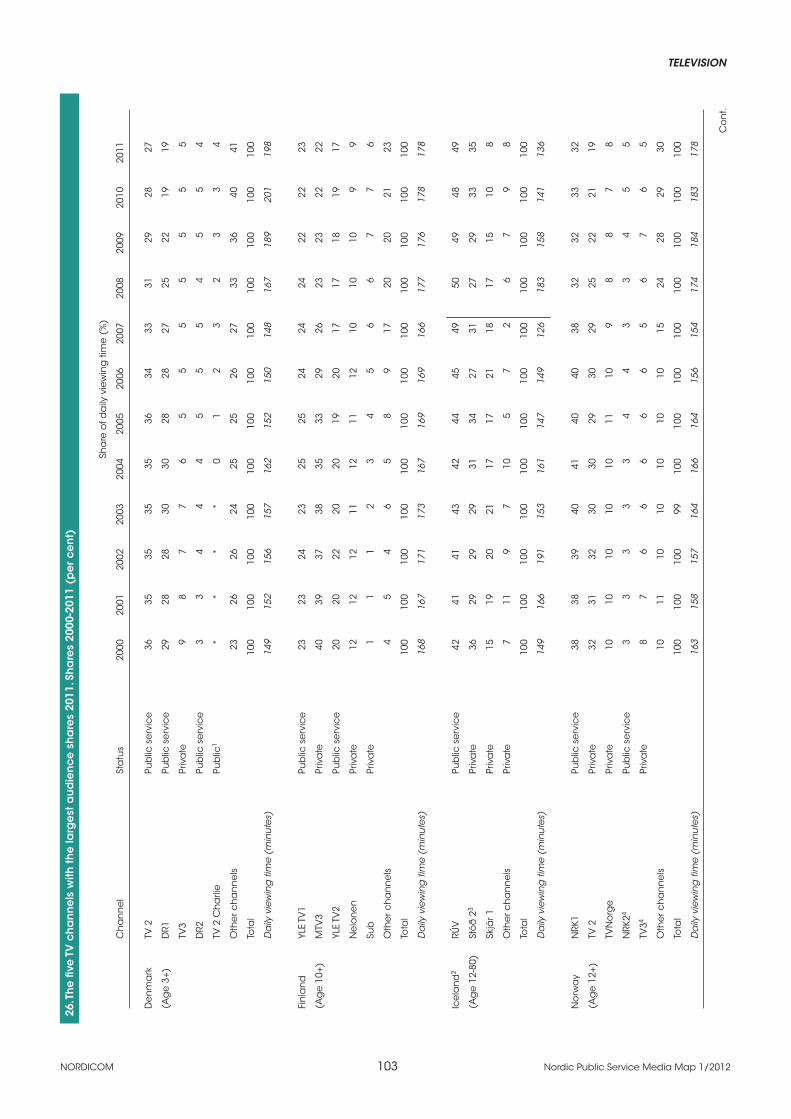
TELEVISION
NORDICOM 103 Nordic Public Service Media Map 1/2012
26. T
he
five
TV
ch
an
ne
ls w
ith t
he
larg
est
au
die
nc
e s
ha
res
2011
. Sh
are
s 20
00-2
011
(pe
r c
en
t)
Sh
are
of d
aily
vie
win
g ti
me
(%
)
C
ha
nn
el
Sta
tus
2000
20
01
2002
20
03
2004
20
05
2006
20
07
2008
20
09
2010
20
11
De
nm
ark
TV
2
Pub
lic s
erv
ice
36
35
35
35
35
36
34
33
31
29
28
27
(Ag
e 3
+)
DR1
Pu
blic
se
rvic
e
29
28
28
30
30
28
28
27
25
22
19
19
TV
3 Pr
iva
te
9 8
7 7
6 5
5 5
5 5
5 5
D
R2
Pub
lic s
erv
ice
3
3 4
4 4
5 5
5 4
5 5
4
TV
2 C
ha
rlie
Pu
blic
1 *
* *
* 0
1 2
3 2
3 3
4
O
the
r ch
an
ne
ls
23
26
26
24
25
25
26
27
33
36
40
41
To
tal
10
0 10
0 10
0 10
0 10
0 10
0 10
0 10
0 10
0 10
0 10
0 10
0
D
aily
vie
win
g ti
me
(min
ute
s)
14
9 15
2 15
6 15
7 16
2 15
2 15
0 14
8 16
7 18
9 20
1 19
8
Fin
lan
d
YLE
TV1
Pub
lic s
erv
ice
23
23
24
23
25
25
24
24
24
22
22
23
(Ag
e 1
0+)
MTV
3 Pr
iva
te
40
39
37
38
35
33
29
26
23
23
22
22
YL
E TV
2 Pu
blic
se
rvic
e
20
20
22
20
20
19
20
17
17
18
19
17
N
elo
ne
n
Priv
ate
12
12
12
11
12
11
12
10
10
10
9
9
Su
b
Priv
ate
1
1 1
2 3
4 5
6 6
7 7
6
O
the
r ch
an
ne
ls
4
5 4
6 5
8 9
17
20
20
21
23
To
tal
10
0 10
0 10
0 10
0 10
0 10
0 10
0 10
0 10
0 10
0 10
0 10
0
D
aily
vie
win
g ti
me
(min
ute
s)
16
8 16
7 17
1 17
3 16
7 16
9 16
9 16
6 17
7 17
6 17
8 17
8
Ice
lan
d2
RÚV
Pu
blic
se
rvic
e
42
41
41
43
42
44
45
49
50
49
48
49
(Ag
e 1
2-80
) St
öð
23
Priv
ate
36
29
29
29
31
34
27
31
27
29
33
35
Sk
jár 1
Pr
iva
te
15
19
20
21
17
17
21
18
17
15
10
8
O
the
r ch
an
ne
ls
Priv
ate
7
11
9 7
10
5 7
2 6
7 9
8
To
tal
10
0 10
0 10
0 10
0 10
0 10
0 10
0 10
0 10
0 10
0 10
0 10
0
D
aily
vie
win
g ti
me
(min
ute
s)
14
9 16
6 19
1 15
3 16
1 14
7 14
9 12
6 18
3 15
8 14
1 13
6
No
rwa
y N
RK1
Pub
lic s
erv
ice
38
38
39
40
41
40
40
38
32
32
33
32
(Ag
e 1
2+)
TV 2
Pr
iva
te
32
31
32
30
30
29
30
29
25
22
21
19
TV
No
rge
Pr
iva
te
10
10
10
10
10
11
10
9 8
8 7
8
N
RK24
Pub
lic s
erv
ice
3
3 3
3 3
4 4
3 3
4 5
5
TV
34 Pr
iva
te
8 7
6 6
6 6
6 5
6 7
6 5
O
the
r ch
an
ne
ls
10
11
10
10
10
10
10
15
24
28
29
30
To
tal
10
0 10
0 10
0 99
10
0 10
0 10
0 10
0 10
0 10
0 10
0 10
0
D
aily
vie
win
g ti
me
(min
ute
s)
16
3 15
8 15
7 16
4 16
6 16
4 15
6 15
4 17
4 18
4 18
3 17
8
Co
nt.

NORDICOM 104 Nordic Public Service Media Map 1/2012
TELEVISION26
. Co
nt.
The
five
TV
ch
an
ne
ls w
ith th
e la
rge
st a
ud
ien
ce
sh
are
s 20
11. S
ha
res
2000
-201
1 (p
er c
en
t)
Sh
are
of d
aily
vie
win
g ti
me
(%
)
C
ha
nn
el
Sta
tus
2000
20
01
2002
20
03
2004
20
05
2006
20
07
2008
20
09
2010
20
11
Swe
de
n
SVT1
Pu
blic
se
rvic
e
20
25
27
25
25
24
22
19
19
21
23
23
(Ag
e 3
+)
TV4
Priv
ate
27
28
25
25
25
23
22
22
20
19
19
20
TV
3 Pr
iva
te
11
11
10
10
10
10
10
9 9
8 8
7
SV
T2
Pub
lic s
erv
ice
24
17
16
15
15
14
14
13
10
8
7 7
Ka
na
l 5
Priv
ate
6
7 8
8 9
9 9
8 8
7 7
7
O
the
r ch
an
ne
ls
12
12
14
17
16
20
23
29
33
37
37
37
To
tal
10
0 10
0 10
0 10
0 10
0 10
0 10
0 10
0 10
0 10
0 10
0 10
0
D
aily
vie
win
g ti
me
(min
ute
s)
15
0 14
8 14
7 15
0 15
1 14
6 15
4 15
7 16
0 16
6 16
6 16
2
1 T
V 2
Ch
arli
e is
pa
rt o
f TV
2/D
an
ma
rk, w
hic
h is
sta
te-o
wn
ed
. Th
e c
ha
nn
el h
as,
ho
wev
er,
no
pu
blic
se
rvic
e o
blig
a-
tion
s.2
Dia
ry d
ata
200
0-20
03, 2
005-
2006
ac
co
rdin
g to
su
rvey
s in
Oc
tob
er;
2004
su
rvey
in M
arc
h; 2
007
in J
un
e. E
lec
tron
ic
me
asu
rem
en
t (p
pm
) 20
08-2
010
with
da
ta fo
r we
ek
42 e
ac
h y
ea
r.3
In
clu
din
g v
iew
ing
sh
are
s to
Stö
ð 2
+, w
hic
h b
roa
dc
ast
s th
e tr
an
smis
sio
ns
of S
töð
2 o
ne
ho
ur l
ate
r. St
öð
2+
sta
rte
d
ea
rly 2
004.
4
NRK
2 a
nd
TV3
bo
th h
ave
a 5
.3%
au
die
nc
e s
ha
re in
201
1. R
an
kin
g h
ere
is d
ue
to N
RK2
ha
vin
g h
igh
er d
aily
rea
ch
(2
5%)
in 2
011
tha
n T
V3
(23%
).
No
te: E
lec
tron
ic m
ea
sure
me
nt (
pe
op
lem
ete
r) e
xce
pt f
or I
ce
lan
d 2
000-
2007
(se
e n
ote
2).
Tim
esh
ift w
ithin
7 d
ays
in
clu
de
d in
Fin
lan
d a
nd
No
rwa
y in
200
8, a
nd
in S
we
de
n 2
010.
Fo
r Ic
ela
nd
, with
th
e in
trod
uc
tion
of
ele
ctro
nic
m
ea
sure
me
nts
(p
pm
) in
200
8, c
atc
h-u
p-c
ha
nn
el v
iew
ing
wa
s in
clu
de
d.
Sou
rce
s: T
NS
Ga
llup
De
nm
ark
, Fi
nn
pa
ne
l an
d Y
LE A
ud
ien
ce
Re
sea
rch
, Min
istr
y o
f Tra
nsp
ort
an
d C
om
mu
nic
atio
ns
(Fin
lan
d),
Soc
ial S
cie
nc
e In
stitu
te a
t th
e U
niv
ers
ity o
f Ic
ela
nd
, Ca
pa
ce
nt,
TNS
Ga
llup
No
rwa
y, M
MS.

TELEVISION
NORDICOM 105 Nordic Public Service Media Map 1/2012
27. The five TV channels with the largest audience shares 2010/2011. Shares by sex and age (per cent)
DailyDenmark 2011 TV 2 DR1 TV3 DR2 TV 2 Charlie Other Total viewing time
Status Public service Public service Private Public Public1 Minutes
All 27 19 5 4 4 41 100 198
Sex
Men 25 18 4 4 3 46 100 196
Women 30 20 6 4 5 35 100 201
Age
3-11 13 19 2 1 1 64 100 112
12-20 21 11 7 2 1 58 100 137
21-34 25 11 9 3 1 51 100 200
35-54 28 18 5 4 3 42 100 206
55+ 31 25 2 6 7 29 100 245
DailyFinland 2010 YLE TV1 MTV3 YLE TV2 Nelonen Subtv Other Total viewing time
Status Public service Private Public service Private Private Minutes
All 22 22 19 9 7 22 100 178
Sex
Men 22 18 21 8 6 25 100 172
Women 22 24 17 10 7 19 100 184
Age
4-92 5 16 34 9 5 31 100 78
10-14 5 22 15 14 14 30 100 80
15-24 5 21 11 16 14 33 100 95
25-34 9 22 13 15 12 29 100 137
35-44 16 23 15 13 9 24 100 156
45-64 25 22 20 8 5 20 100 212
65+ 34 21 23 5 3 14 100 264
DailyNorway 2011 NRK1 TV 2 TVNorge NRK24 TV34 Other TV Total viewing time
Status Public service Private Private Public service Private Minutes
All 32 19 8 5 5 30 100 178
Sex
Men 32 17 7 6 4 34 100 174
Women 32 21 9 5 6 27 100 182
Age
2-63 10 9 3 1 2 76 100 94
7-113 12 11 4 1 2 69 100 102
12-19 15 17 11 2 8 47 100 102
20-34 15 19 12 3 9 43 100 159
35-44 23 22 10 3 6 36 100 170
45-54 35 21 8 5 5 27 100 184
55-64 43 20 5 7 3 22 100 208
65+ 49 18 4 9 2 18 100 240
Cont.
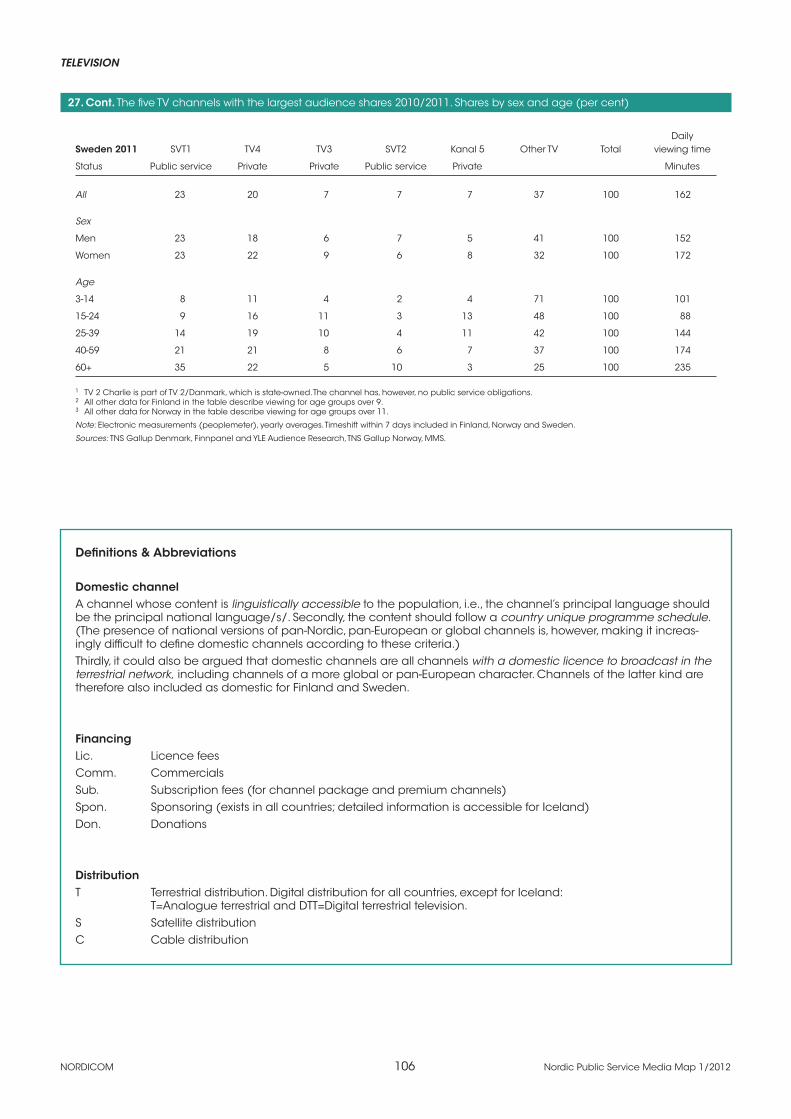
NORDICOM 106 Nordic Public Service Media Map 1/2012
TELEVISION
27. Cont. The five TV channels with the largest audience shares 2010/2011. Shares by sex and age (per cent)
DailySweden 2011 SVT1 TV4 TV3 SVT2 Kanal 5 Other TV Total viewing time
Status Public service Private Private Public service Private Minutes
All 23 20 7 7 7 37 100 162
Sex
Men 23 18 6 7 5 41 100 152
Women 23 22 9 6 8 32 100 172
Age
3-14 8 11 4 2 4 71 100 101
15-24 9 16 11 3 13 48 100 88
25-39 14 19 10 4 11 42 100 144
40-59 21 21 8 6 7 37 100 174
60+ 35 22 5 10 3 25 100 235
1 TV 2 Charlie is part of TV 2/Danmark, which is state-owned. The channel has, however, no public service obligations.2 All other data for Finland in the table describe viewing for age groups over 9.3 All other data for Norway in the table describe viewing for age groups over 11.
Note: Electronic measurements (peoplemeter), yearly averages. Timeshift within 7 days included in Finland, Norway and Sweden.
Sources: TNS Gallup Denmark, Finnpanel and YLE Audience Research, TNS Gallup Norway, MMS.
Definitions & Abbreviations
Domestic channelA channel whose content is linguistically accessible to the population, i.e., the channel’s principal language should be the principal national language/s/. Secondly, the content should follow a country unique programme schedule. (The presence of national versions of pan-Nordic, pan-European or global channels is, however, making it increas-ingly difficult to define domestic channels according to these criteria.)Thirdly, it could also be argued that domestic channels are all channels with a domestic licence to broadcast in the terrestrial network, including channels of a more global or pan-European character. Channels of the latter kind are therefore also included as domestic for Finland and Sweden.
Financing Lic. Licence feesComm. CommercialsSub. Subscription fees (for channel package and premium channels)Spon. Sponsoring (exists in all countries; detailed information is accessible for Iceland)Don. Donations
Distribution T Terrestrial distribution. Digital distribution for all countries, except for Iceland: T=Analogue terrestrial and DTT=Digital terrestrial television.S Satellite distributionC Cable distribution
107
Radio
Structure & OwnershipTable 1 Number of radio channels 2000-2011 108Table 2 FM radio channels and stations 2011 109Table 3 Digital radio channels in DAB or DVB 2010/2011 112Table 4 The largest radio companies and their channels 4.1 The largest radio companies in Denmark and their channels in 2011 (Fall) 113 4.2 The largest radio companies in Finland and their channels in 2010 114 4.3 The largest radio companies in Iceland and their channels 2010 (end-of-year) 115 4.4 The largest radio companies in Norway and their channels in 2011 116 4.5 The largest radio companies in Sweden and their channels 2011 (Spring) 117
Content Table 5 Public service radio programming by content 2000-2010 (per cent) 118Figure 6 Public service radio programming by content 2010 (per cent) 121Table 7 Public service radio content by channel (per cent) 7.1 DR radio content by channel 2007-2010 122 7.2 YLE radio content by channel 2002-2010 123 7.3 RÚV radio content by channel 2010 125 7.4 NRK radio content by channel 2010 125Table 8 Public service radio broadcasting in minority languages 2000-2010 (hours/year) 8.1 YLE radio broadcasting in Swedish and Sámi 2000-2010 126 8.2 NRK radio broadcasting in Sámi 2000-2010 126 8.3 SR radio broadcasting in minority and immigrant languages 2001-2010 126Table 9 Private radio content in Finland, Iceland and Norway 2009/2010 (per cent) 9.1 Private radio in Finland: Content 2009 127 9.2 Bylgjan in Iceland: Content 2009-2010 127 9.3 P4 in Norway: Content 2010 128 9.4 Radio Norge in Norway: Content 2010 128
Listening Table 10 Radio listening: Daily reach 2000-2010 (per cent) 129Table 11 Public service radio daily reach 2000-2010 (per cent) 129Figure 12 Public service radio daily reach 2000-2010 (per cent) 130Table 13 Public service radio: Daily reach by age 2000-2010 (per cent) 131Table 14 Radio listening: Daily channel reach 2000-2010 (per cent) 132Table 15 Radio listening: Daily channel reach by sex and age in 2010 (per cent) 134Figure 16 Radio listening: The largest radio channel per country by daily reach 2010 (per cent) 135Table 17 Total daily radio listening time 2000-2011 (minutes) 136Table 18 Public service radio audience shares 2000-2011 (per cent) 136Figure 19 Public service radio audience shares 2000-2011 (per cent) 137Table 20 Public service radio audience shares by age 2000-2010 (per cent) 138Table 21 Radio channel audience shares 2000-2010 (per cent) 139Figure 22 Radio channel audience shares 2010 (per cent) 141Table 23 Radio audience shares by sex and age in 2010 (per cent) 142
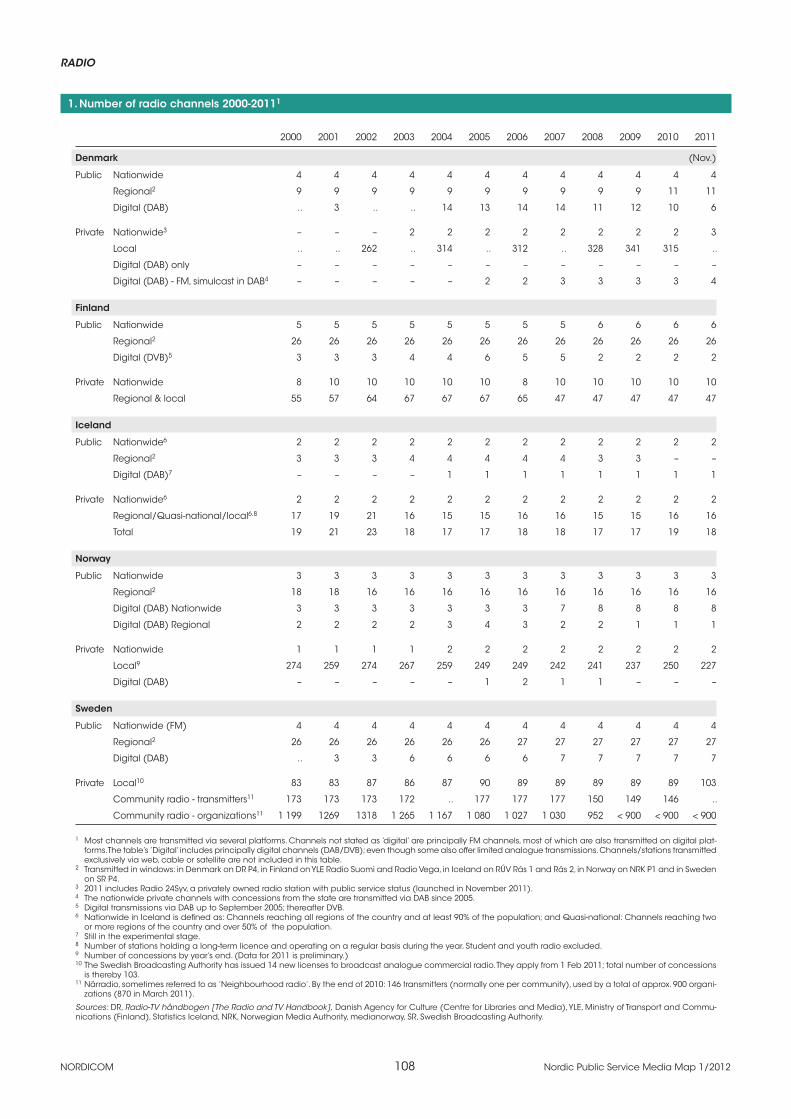
NORDICOM 108 Nordic Public Service Media Map 1/2012
RADIO
1. Number of radio channels 2000-20111
2000 2001 2002 2003 2004 2005 2006 2007 2008 2009 2010 2011
Denmark (Nov.)
Public Nationwide 4 4 4 4 4 4 4 4 4 4 4 4
Regional2 9 9 9 9 9 9 9 9 9 9 11 11
Digital (DAB) .. 3 .. .. 14 13 14 14 11 12 10 6
Private Nationwide3 – – – 2 2 2 2 2 2 2 2 3
Local .. .. 262 .. 314 .. 312 .. 328 341 315 ..
Digital (DAB) only – – – – – – – – – – – –
Digital (DAB) - FM, simulcast in DAB4 – – – – – 2 2 3 3 3 3 4
Finland
Public Nationwide 5 5 5 5 5 5 5 5 6 6 6 6
Regional2 26 26 26 26 26 26 26 26 26 26 26 26
Digital (DVB)5 3 3 3 4 4 6 5 5 2 2 2 2
Private Nationwide 8 10 10 10 10 10 8 10 10 10 10 10
Regional & local 55 57 64 67 67 67 65 47 47 47 47 47
Iceland
Public Nationwide6 2 2 2 2 2 2 2 2 2 2 2 2
Regional2 3 3 3 4 4 4 4 4 3 3 – –
Digital (DAB)7 – – – – 1 1 1 1 1 1 1 1
Private Nationwide6 2 2 2 2 2 2 2 2 2 2 2 2
Regional/Quasi-national/local6,8 17 19 21 16 15 15 16 16 15 15 16 16
Total 19 21 23 18 17 17 18 18 17 17 19 18
Norway
Public Nationwide 3 3 3 3 3 3 3 3 3 3 3 3
Regional2 18 18 16 16 16 16 16 16 16 16 16 16
Digital (DAB) Nationwide 3 3 3 3 3 3 3 7 8 8 8 8
Digital (DAB) Regional 2 2 2 2 3 4 3 2 2 1 1 1
Private Nationwide 1 1 1 1 2 2 2 2 2 2 2 2
Local9 274 259 274 267 259 249 249 242 241 237 250 227
Digital (DAB) – – – – – 1 2 1 1 – – –
Sweden
Public Nationwide (FM) 4 4 4 4 4 4 4 4 4 4 4 4
Regional2 26 26 26 26 26 26 27 27 27 27 27 27
Digital (DAB) .. 3 3 6 6 6 6 7 7 7 7 7
Private Local10 83 83 87 86 87 90 89 89 89 89 89 103
Community radio - transmitters11 173 173 173 172 .. 177 177 177 150 149 146 ..
Community radio - organizations11 1 199 1269 1318 1 265 1 167 1 080 1 027 1 030 952 < 900 < 900 < 900
1 Most channels are transmitted via several platforms. Channels not stated as ’digital’ are principally FM channels, most of which are also transmitted on digital plat-forms. The table’s ’Digital’ includes principally digital channels (DAB/DVB); even though some also offer limited analogue transmissions. Channels/stations transmitted exclusively via web, cable or satellite are not included in this table.
2 Transmitted in windows: in Denmark on DR P4, in Finland on YLE Radio Suomi and Radio Vega, in Iceland on RÚV Rás 1 and Rás 2, in Norway on NRK P1 and in Sweden on SR P4.
3 2011 includes Radio 24Syv, a privately owned radio station with public service status (launched in November 2011).4 The nationwide private channels with concessions from the state are transmitted via DAB since 2005.5 Digital transmissions via DAB up to September 2005; thereafter DVB.6 Nationwide in Iceland is defined as: Channels reaching all regions of the country and at least 90% of the population; and Quasi-national: Channels reaching two
or more regions of the country and over 50% of the population.7 Still in the experimental stage.8 Number of stations holding a long-term licence and operating on a regular basis during the year. Student and youth radio excluded. 9 Number of concessions by year’s end. (Data for 2011 is preliminary.)10 The Swedish Broadcasting Authority has issued 14 new licenses to broadcast analogue commercial radio. They apply from 1 Feb 2011; total number of concessions
is thereby 103.11 Närradio, sometimes referred to as ’Neighbourhood radio’. By the end of 2010: 146 transmitters (normally one per community), used by a total of approx. 900 organi-
zations (870 in March 2011).
Sources: DR, Radio-TV håndbogen [The Radio and TV Handbook], Danish Agency for Culture (Centre for Libraries and Media), YLE, Ministry of Transport and Commu-nications (Finland), Statistics Iceland, NRK, Norwegian Media Authority, medianorway, SR, Swedish Broadcasting Authority.
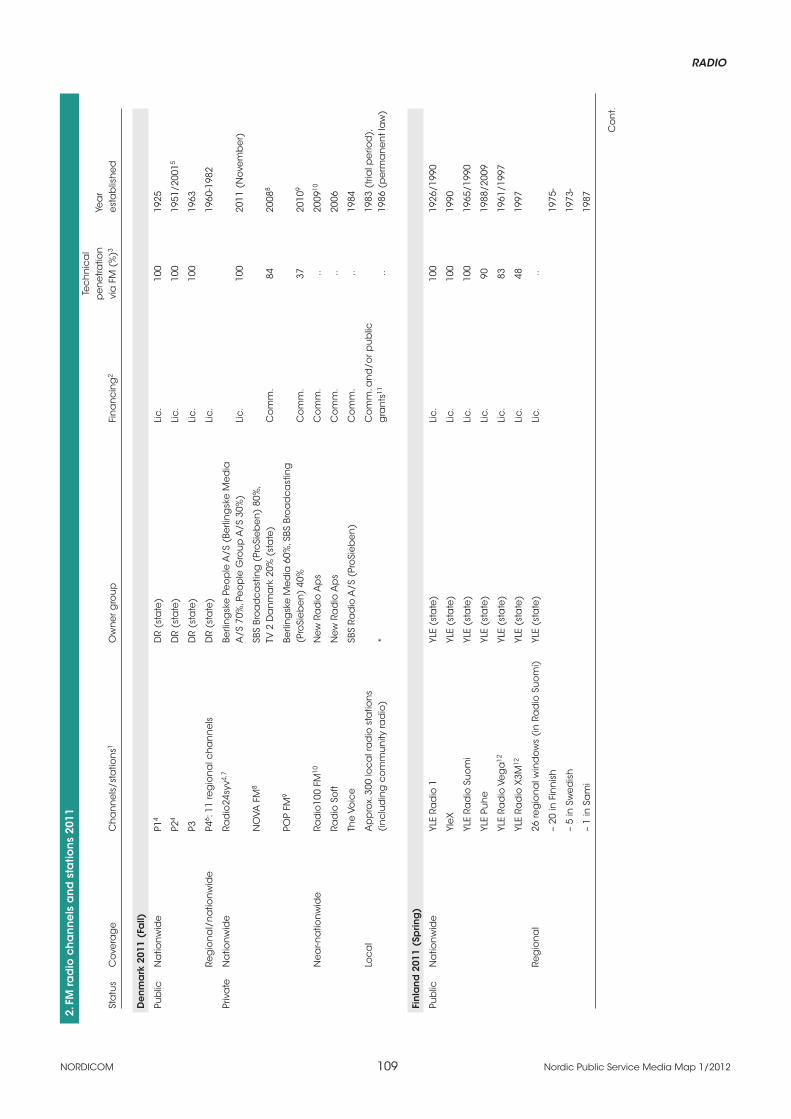
RADIO
NORDICOM 109 Nordic Public Service Media Map 1/2012
2. F
M ra
dio
ch
an
ne
ls a
nd
sta
tion
s 20
11
Te
ch
nic
al
p
en
etra
tion
Ye
ar
Sta
tus
Co
vera
ge
C
ha
nn
els
/sta
tion
s1 O
wn
er g
rou
p
Fin
an
cin
g2
via
FM
(%
)3 e
sta
blis
he
d
De
nm
ark
201
1 (F
all)
Pub
lic
Na
tion
wid
e
P14
DR
(sta
te)
Lic
. 10
0 19
25
P24
DR
(sta
te)
Lic
. 10
0 19
51/2
0015
P3
DR
(sta
te)
Lic
. 10
0 19
63
Re
gio
na
l/n
atio
nw
ide
P4
6 : 11
reg
ion
al c
ha
nn
els
D
R (s
tate
) Li
c.
19
60-1
982
Priv
ate
N
atio
nw
ide
Ra
dio
24sy
v4,7
Berli
ng
ske
Pe
op
le A
/S (
Berli
ng
ske
Me
dia
A/S
70%
, Pe
op
le G
rou
p A
/S 3
0%)
Lic
. 10
0 20
11 (
No
vem
be
r)
NO
VA F
M8
SBS
Bro
ad
ca
stin
g (
Pro
Sie
be
n)
80%
,
TV 2
Da
nm
ark
20%
(st
ate
) C
om
m.
84
2008
8
POP
FM9
Berli
ng
ske
Me
dia
60%
, SBS
Bro
ad
ca
stin
g
(P
roSi
eb
en
) 40
%
Co
mm
. 37
20
109
N
ea
r-na
tion
wid
e
Rad
io10
0 FM
10
New
Ra
dio
Ap
s C
om
m.
.. 20
0910
Rad
io S
oft
New
Ra
dio
Ap
s C
om
m.
.. 20
06
The
Vo
ice
SB
S Ra
dio
A/S
(Pr
oSi
eb
en
) C
om
m.
.. 19
84
Lo
ca
l A
pp
rox.
300
loc
al r
ad
io s
tatio
ns
Co
mm
. an
d/o
r pu
blic
1983
(tr
ial p
erio
d),
(in
clu
din
g c
om
mu
nity
rad
io)
*
gra
nts
11
.. 19
86 (
pe
rma
ne
nt l
aw
)
Fin
lan
d 2
011
(Sp
ring
)
Pub
lic
Na
tion
wid
e
YLE
Rad
io 1
YL
E (s
tate
) Li
c.
100
1926
/199
0
Yle
X
YLE
(sta
te)
Lic
. 10
0 19
90
YLE
Rad
io S
uo
mi
YLE
(sta
te)
Lic
. 10
0 19
65/1
990
YLE
Puh
e
YLE
(sta
te)
Lic
. 90
19
88/2
009
YLE
Rad
io V
eg
a12
YL
E (s
tate
) Li
c.
83
1961
/199
7
YLE
Rad
io X
3M12
YL
E (s
tate
) Li
c.
48
1997
Re
gio
na
l 26
reg
ion
al w
ind
ow
s (i
n R
ad
io S
uo
mi)
YL
E (s
tate
) Li
c.
..
– 20
in F
inn
ish
1975
-
– 5
in S
we
dis
h
19
73-
– 1
in S
am
i
1987
Co
nt.

NORDICOM 110 Nordic Public Service Media Map 1/2012
RADIO2.
Co
nt.
FM ra
dio
ch
an
ne
ls a
nd
sta
tion
s 20
11
Te
ch
nic
al
p
en
etra
tion
Ye
ar
Sta
tus
Co
vera
ge
C
ha
nn
els
/sta
tion
s1 O
wn
er g
rou
p
Fin
an
cin
g2
via
FM
(%
)3 e
sta
blis
he
d
Co
nt.
Fin
lan
d 2
011
(Sp
ring
)
Priv
ate
N
atio
nw
ide
Ra
dio
No
va
Suo
me
n U
utis
rad
io (
Bon
nie
r 74%
an
d
M
TG 2
2%)
Co
mm
. 98
19
97
Gro
ove
FM
C
om
mu
nic
orp
Gro
up
C
om
m.
62
1999
Rad
io A
alto
Sa
no
ma
C
om
m.
73
2007
Rad
io D
ei
Kris
tillin
en
Me
dia
C
om
m.
78
1997
Rad
io N
RJ
NRJ
C
om
m.
87
1995
Rad
io R
oc
k Sa
no
ma
C
om
m.
85
1995
Rad
io S
pu
tnik
Ra
dio
Sa
telli
te F
inla
nd
C
om
m.
.. 19
99
Ron
do
FM
C
lass
icu
s C
om
m.
68
2010
Suo
mi P
OP
Co
mm
un
ico
rp G
rou
p
Co
mm
. 87
20
07
The
Vo
ice
SB
S Br
oa
dc
ast
ing
(Pr
oSi
eb
en
) C
om
m.
99
2007
O
the
r priv
ate
Is
kelm
ä-c
ha
in, 1
6 st
atio
ns13
SB
S Br
oa
dc
ast
ing
(Pr
oSi
eb
en
) &
oth
ers
13
Co
mm
. 92
20
01
28 o
the
r sta
tion
s *
Ma
inly
co
mm
. ..
1985
-
Ice
lan
d 2
011
(Fa
ll)
Pub
lic
Na
tion
wid
e14
Rá
s 1
Ríki
sútv
arp
ið o
hf.
(sta
te)
Gra
nts
, Co
mm
., Sp
on
. 10
0 19
30
Rás
2 Rí
kisú
tva
rpið
oh
f. (s
tate
) G
ran
ts, C
om
m.,
Spo
n.
100
1983
Priv
ate
N
atio
nw
ide
14
Bylg
jan
36
5 m
iðla
r eh
f. C
om
m.,
Spo
n.
99
1986
15
FM 9
5.7
365
mið
lar e
hf.
Co
mm
., Sp
on
. 95
19
8915
Re
gio
na
l/Q
ua
si-n
atio
na
l14
15 s
tatio
ns
60–7
0 fro
m 1
986
– 6
sta
tion
s 36
5 m
iðla
r eh
f. C
om
m.,
Spo
n.
65–7
0
– 4
ind
ep
en
de
nt s
tatio
ns
* C
om
m.,
Spo
n.
15–7
0
– 2
relig
iou
s st
atio
ns
* D
on
., C
om
m.,
Spo
n.
60–7
0
– 2
serv
ice
sta
tion
s *
Do
n.,
Spo
n.
60–7
0
Lo
ca
l 1
sta
tion
*
Co
mm
., Sp
on
. ..
from
199
3
No
rwa
y 20
11 (
Sum
me
r)
Pub
lic
Na
tion
wid
e
P1
NRK
(st
ate
) Li
c.
100
1933
P2
NRK
(st
ate
) Li
c.
99
1984
P3
NRK
(st
ate
) Li
c.
96
1993
Re
gio
na
l 16
reg
ion
al w
ind
ow
s (i
n P
1)
NRK
(st
ate
) Li
c.
fro
m 1
957
Priv
ate
N
atio
nw
ide
P4
M
TG
Co
mm
. 80
19
93
Rad
io N
org
e
SBS
Bro
ad
ca
stin
g (
Pro
Sie
be
n)
Co
mm
. 93
20
04
Lo
ca
l 24
8 16
Pr
iva
te c
om
pa
nie
s &
co
mm
un
ity ra
dio
s C
om
m. a
llow
ed
from
198
2
Co
nt.

RADIO
NORDICOM 111 Nordic Public Service Media Map 1/2012
2. C
on
t. FM
rad
io c
ha
nn
els
an
d s
tatio
ns
2011
Tec
hn
ica
l
pe
ne
tratio
n
Yea
r St
atu
s C
ove
rag
e
Ch
an
ne
ls/s
tatio
ns1
Ow
ne
r gro
up
Fi
na
nc
ing
2 vi
a F
M (
%)3
est
ab
lish
ed
Swe
de
n 2
011
(Sp
ring
)
Pub
lic
Na
tion
wid
e
P117
SR
(st
ate
) Li
c.
100
1925
P217
SR
(st
ate
) Li
c.
100
1955
P3
SR (
sta
te)
Lic
. 10
0 19
64
P4 R
iks
SR (
sta
te)
Lic
. 10
0 19
93
Re
gio
na
l P4
Lo
kal:
25 re
gio
na
l ch
an
ne
ls
SR (
sta
te)
Lic
. 10
0 19
87-1
98918
SR M
etro
po
l (St
oc
kho
lm, l
oc
al)
SR
(st
ate
) Li
c.
.. 20
07
Din
ga
ta 1
00,6
(M
alm
ö, l
oc
al)
SR
(st
ate
) Li
c.
.. 20
06
Priv
ate
Lo
ca
l 10
3 lo
ca
l sta
tion
s *
Co
mm
. ..
allo
we
d fr
om
199
3
ab
ou
t 146
co
mm
un
ity ra
dio
sta
tion
s19
loc
al n
on
-pro
fit o
rga
niz
atio
ns20
C
om
m. &
sp
on
. allo
we
d
.. a
llow
ed
fro
m 1
986
1 P
rinc
ipa
lly a
na
log
ue
ch
an
ne
ls (
via
FM
ne
ts);
mo
st a
re a
lso
tra
nsm
itte
d d
igita
lly (
on
line
, DA
B, D
VB)
, an
d s
om
e v
ia c
ab
le a
nd
sa
telli
te. F
or a
n o
verv
iew
of t
he
DA
B/D
VB
ch
an
ne
ls o
nly
, se
e s
ep
ara
te ta
ble
.2
Lic
.=lic
en
ce
fee
s, C
om
m.=
co
mm
erc
ials
, Sp
on
.=sp
on
sorin
g, D
on
.=d
on
atio
ns.
3 S
ha
re o
f po
pu
latio
n h
avi
ng
po
ten
tial a
cc
ess
. (Fi
nla
nd
: Sh
are
of p
op
ula
tion
9+
ha
vin
g p
ote
ntia
l ac
ce
ss.)
4 I
n N
ove
mb
er
2011
a n
ew n
atio
nw
ide
rad
io c
ha
nn
el,
Rad
io24
syv,
sta
rte
d a
irin
g o
n t
he
fou
rth
FM
ne
two
rk (
FM4)
, wh
ich
wa
s p
revi
ou
sly
use
d b
y D
R P2
. DR’
s so
lutio
n to
th
e lo
ss o
f an
FM
fre
qu
en
cy
ha
s b
ee
n to
let
P1 a
nd
P2
sha
re t
he
fre
qu
en
cy
(FM
1) p
revi
ou
sly
use
d b
y P1
. P1
bro
ad
ca
sts
mo
rnin
gs
an
d d
urin
g th
e d
ay,
an
d P
2 ev
en
ing
s a
nd
nig
hts
. Bo
th P
1 a
nd
P2
are
full
ch
an
ne
ls, i
.e. w
ith b
roa
dc
ast
s 24
/7, o
n D
AB
an
d In
tern
et.
5 D
R a
cq
uire
d a
fou
rth
na
tion
wid
e ra
dio
fre
qu
en
cy,
FM4,
in 2
001
(th
e fo
rme
r P2-
ch
an
ne
l sh
are
d a
fre
qu
en
cy
with
P4)
. Fro
m 1
No
v 20
11 P
2 sh
are
s FM
-fre
qu
en
cy
with
P1
(no
te 4
).6
Ca
rrie
s b
oth
reg
ion
al a
nd
na
tion
wid
e p
rog
ram
min
g.
7 F
M4:
A n
ew n
atio
nw
ide
rad
io c
ha
nn
el,
Rad
io24
syv,
sta
rte
d a
irin
g 1
st N
ove
mb
er 2
011
on
FM
4 (u
ntil
the
n u
sed
by
DR
P2, s
ee
no
te 4
). Ra
dio
24sy
v h
as
pu
blic
se
rvic
e s
tatu
s a
nd
lic
en
ce
fee
fin
an
cin
g.
8 F
M5:
Th
e c
on
ce
ssio
n w
as
issu
ed
in 2
003,
with
Sky
Ra
dio
as
the
firs
t co
nc
ess
ion
ho
lde
r. Sk
y Ra
dio
sh
ut d
ow
n in
late
200
5; T
V 2
/Da
nm
ark
wa
s a
wa
rde
d th
e c
on
ce
ssio
n in
200
6. T
V 2
Ra
dio
sta
rte
d in
ea
rly 2
007,
bu
t sh
ut d
ow
n in
mid
200
8,
wh
en
SBS
Ra
dio
too
k o
ver a
nd
lau
nc
he
d N
OVA
FM
.9
FM
6: T
he
co
nc
ess
ion
wa
s is
sue
d in
200
3, w
ith R
ad
io 1
00 F
M (
Talp
a R
ad
io In
tern
atio
na
l) a
s th
e fi
rst
co
nc
ess
ion
ho
lde
r. Ra
dio
100
FM
he
ld t
he
co
nc
ess
ion
un
til it
s b
an
kru
ptc
y in
Oc
tob
er
2009
. Th
e n
ew c
on
ce
ssio
n h
old
er
is P
OP
FM
(Be
rlin
gsk
e M
ed
ia/S
BS B
roa
dc
ast
ing
). Ta
lpa
’s b
ran
d, R
ad
io 1
00 F
M, n
ow
tra
nsm
its v
ia lo
ca
l fre
qu
en
cie
s.10
Ta
lpa
Ra
dio
’s R
ad
io 1
00 F
M h
eld
the
co
nc
ess
ion
for D
en
ma
rk’s
six
th F
M n
et,
FM6,
un
til it
s b
an
kru
ptc
y in
Oc
tob
er 2
009.
Th
e b
ran
d, R
ad
io 1
00 F
M, w
as
sold
to th
e s
tatio
n’s
ma
na
ge
me
nt,
wh
ich
sin
ce
200
9 h
as
tran
smitt
ed
the
sta
tion
via
lo
ca
l fre
qu
en
cie
s. 11
A s
tate
su
bsi
dy
pro
gra
mm
e o
f 30
mill
lion
DKK
for l
oc
al r
ad
io a
nd
tele
visi
on
is a
dm
inis
tere
d b
y th
e R
ad
io a
nd
Tele
visi
on
Bo
ard
.12
Fu
ll se
rvic
e n
etw
ork
s in
Sw
ed
ish
.13
16
sta
tion
s, 6
of w
hic
h a
re S
BS-o
wn
ed
. Th
e re
st a
re c
oo
pe
ratin
g s
tatio
ns.
14 ”
Na
tion
wid
e” i
n Ic
ela
nd
is d
efin
ed
as
ch
an
ne
ls re
ac
hin
g a
ll re
gio
ns
of t
he
co
un
try
an
d a
t le
ast
90%
of t
he
po
pu
latio
n; ”
Qu
asi
-na
tion
al”
refe
rs to
ch
an
ne
ls re
ac
hin
g tw
o o
r mo
re re
gio
ns
of t
he
co
un
try
an
d o
ver 5
0% o
f th
e p
op
ula
tion
.15
Byl
gja
n: n
atio
nw
ide
ch
an
ne
l sin
ce
199
3; F
M 9
5.7:
na
tion
wid
e c
ha
nn
el s
inc
e 2
001.
16 N
um
be
r of c
on
ce
ssio
ns
in M
ay
2011
.17
P1
als
o c
arr
ies
UR
(Utb
ildn
ing
sra
dio
n)
tran
smis
sio
ns.
P2 c
arr
ies
tran
smis
sio
ns
from
UR,
Sa
me
rad
io a
nd
Sis
ura
dio
. 18
Th
e fi
rst r
eg
ion
al c
ha
nn
el w
as
est
ab
lish
ed
in N
ove
mb
er 1
987,
the
mo
st re
ce
nt i
n O
cto
be
r 198
9.19
Nä
rrad
io, s
om
etim
es
refe
rred
to a
s ’N
eig
hb
ou
rho
od
rad
io’.
146
tran
smitt
ers
(n
orm
ally
on
e p
er c
om
mu
nity
), u
sed
by
a to
tal o
f ap
pro
x. 9
00 o
rga
niz
atio
ns
(870
in A
pril
201
1).
20 O
f th
e o
rga
niz
atio
ns
au
tho
rize
d to
tra
nsm
it o
ver
ne
igh
bo
urh
oo
d ra
dio
fre
qu
en
cie
s in
200
7, 2
9% w
ere
co
nfe
ssio
na
l org
an
iza
tion
s, 16
% ra
dio
ass
oc
iatio
ns,
16%
loc
al u
mb
rella
org
an
iza
tion
s, 7%
po
litic
al p
art
ies,
9% e
thn
ic a
nd
cu
ltura
l o
rga
niz
atio
ns,
18%
’oth
er’
an
d 6
% u
nkn
ow
n.
Sou
rce
s: D
an
ish
Ag
en
cy
for C
ultu
re (
Ce
ntre
for L
ibra
ries
an
d M
ed
ia),
DR,
YLE
, Ass
oc
iatio
n o
f Fin
nis
h B
roa
dc
ast
ers
, Sta
tistic
s Ic
ela
nd
, No
rwe
gia
n M
ed
ia A
uth
orit
y, N
ork
ring
, me
dia
no
rwa
y, SR
, TN
S Si
fo, S
we
dis
h B
roa
dc
ast
ing
Au
tho
rity.

NORDICOM 112 Nordic Public Service Media Map 1/2012
RADIO
3. Digital radio channels in DAB or DVB 2010/2011
Year Channels1 Profile established Owner group
Denmark 2011 (Nov.) DR P1*2 Talk radio DR (state)
DAB start: 2000 DR P2*2 Classical DR (state)
DAB net: Technical reach is almost 100% DR P3* Music, news, satire (age 20-40) DR (state)
DR P5 Culture, music and history (age 60+) 2011 DR (state)
DR P6 Beat Music 2011 DR (state)
DR P7 Mix Music 2011 DR (state)
DR P8 Jazz Jazz 2011 DR (state)
DR Ramasjang Children 2011 DR (state)
DR Mama Youth 2011 DR (state)
NOVA FM* Music 2008 SBS Radio A/S
POP FM* Music 2010 FM6 A/S (Berlingske Media 60% / SBS Radio 40%)
The Voice* Music 2011 SBS Radio A/S
Radio24syv* Talk radio 2011 Berlingske People A/S (Berlingske Media 70%, People Group 30%)
Finland 2010 (end-of-year) Ylen Klassinen Music 1999 YLE (state)
DVB start: 20053 YLE Mondo News 2005 YLE (state)
Iceland 2010 (end-of-year) Rondó Music (classical and jazz) 2004 RÚV (state)
DAB start: 2004, still experimental
DAB net: Technical reach is 60–70%.
Norway 2010 (end-of-year)4 NRK Klassisk Classical music 1995 NRK (state)
DAB start: 1995 NRK Alltid Nyheter News 1997 NRK (state)
DAB net: Technical reach is approx. 80% NRK Sami Radio Transmissions for Samí listeners 1999 NRK (state)
NRK mP3 Music channel for 10-14-year-olds 2000 NRK (state)
NRK Gull From NRK’s archive 2007 NRK (state)
NRK Super Children4 2007 NRK (state)
NRK Sport Sport 2007 NRK (state)
NRK Båtvær5 Weather reports 2007 NRK (state)
NRK Jazz Music 2008 NRK (state)
Sweden 2010 (end-of-year)6 SR P3 Star Music & entertainment for young people 2002 SR (state)
DAB start:1995 SR Sisuradio Finnish-speaking 1998 SR (state)
DAB net: Technical reach is approx. 35%7 SR Atlas World music 2006 SR (state)
SR Radioapans Knattekanal Children’s programmes 2009 SR (state)
SR Klassiskt Classical music 2007 SR (state)
SR Minnen From SR’s archive 2004 SR (state)
1 Denmark: all DAB channels, including both analogue channels simulcast in DAB and digital-only channels (* = analogue channels simulcast in DAB). Other countries: principally DAB (or DVB in Finland) channels, i.e. not including simulcast. Digital channels transmitted online only are not included in this table.
2 DR P1 and DR P2 share FM-frequency since November 2011, but are full channels, i.e. with broadcasts 24/7, on DAB and Internet.3 In Finland the DAB net was shut down in September 2005. YLE broadcasted using DAB from 1998-2005 (September), and then changed to DVB.4 In addition a number of analogue channels are also transmitted via DAB: All analogue NRK channels, the two private radio channels with nationwide concession
(P4 and Radio Norge), plus the local channels/chains P5, NRJ and The Voice.5 Regional DAB channel.6 In addition to the principally digital channels, SR P1 is also transmitted via DAB.7 Transmissions in four areas only: Malmö, Göteborg, Stockholm, Älvsbyn/Luleå.
Sources: Danish Agency for Culture (Centre for Libraries and Media), DR, YLE, Statistics Iceland, RÚV, NRK, medianorway’s database, SR, Teracom.
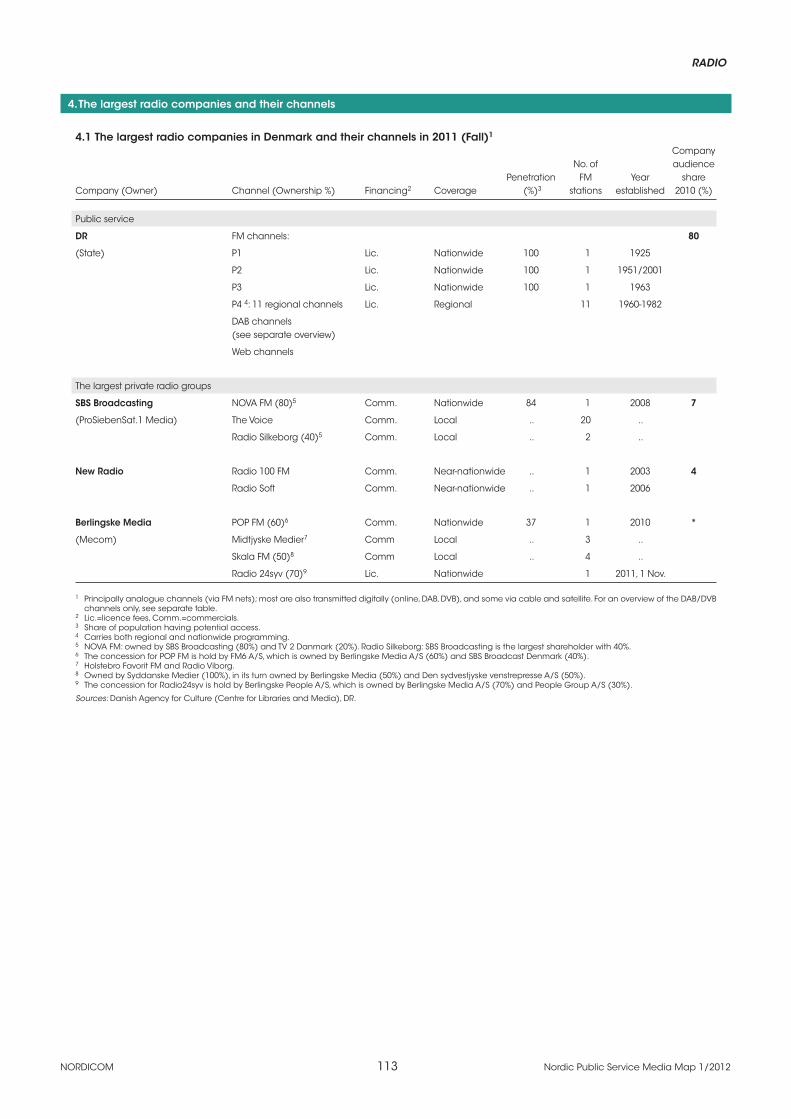
RADIO
NORDICOM 113 Nordic Public Service Media Map 1/2012
4. The largest radio companies and their channels
4.1 The largest radio companies in Denmark and their channels in 2011 (Fall)1
Company No. of audience Penetration FM Year share Company (Owner) Channel (Ownership %) Financing2 Coverage (%)3 stations established 2010 (%)
Public service
DR FM channels: 80
(State) P1 Lic. Nationwide 100 1 1925
P2 Lic. Nationwide 100 1 1951/2001
P3 Lic. Nationwide 100 1 1963
P4 4: 11 regional channels Lic. Regional 11 1960-1982
DAB channels (see separate overview)
Web channels
The largest private radio groups
SBS Broadcasting NOVA FM (80)5 Comm. Nationwide 84 1 2008 7
(ProSiebenSat.1 Media) The Voice Comm. Local .. 20 ..
Radio Silkeborg (40)5 Comm. Local .. 2 ..
New Radio Radio 100 FM Comm. Near-nationwide .. 1 2003 4
Radio Soft Comm. Near-nationwide .. 1 2006
Berlingske Media POP FM (60)6 Comm. Nationwide 37 1 2010 *
(Mecom) Midtjyske Medier7 Comm Local .. 3 ..
Skala FM (50)8 Comm Local .. 4 ..
Radio 24syv (70)9 Lic. Nationwide 1 2011, 1 Nov.
1 Principally analogue channels (via FM nets); most are also transmitted digitally (online, DAB, DVB), and some via cable and satellite. For an overview of the DAB/DVB channels only, see separate table.
2 Lic.=licence fees, Comm.=commercials.3 Share of population having potential access.4 Carries both regional and nationwide programming.5 NOVA FM: owned by SBS Broadcasting (80%) and TV 2 Danmark (20%). Radio Silkeborg: SBS Broadcasting is the largest shareholder with 40%.6 The concession for POP FM is hold by FM6 A/S, which is owned by Berlingske Media A/S (60%) and SBS Broadcast Denmark (40%). 7 Holstebro Favorit FM and Radio Viborg.8 Owned by Syddanske Medier (100%), in its turn owned by Berlingske Media (50%) and Den sydvestjyske venstrepresse A/S (50%).9 The concession for Radio24syv is hold by Berlingske People A/S, which is owned by Berlingske Media A/S (70%) and People Group A/S (30%).
Sources: Danish Agency for Culture (Centre for Libraries and Media), DR.

NORDICOM 114 Nordic Public Service Media Map 1/2012
RADIO
4. Cont. The largest radio companies and their channels
4.2 The largest radio companies in Finland and their channels in 20101
No. of Company Penetration FM Year audience Company (Owner) Channel Financing2 Coverage (%)3 stations established share (%)
Public service
YLE FM stations: 53
(state) YLE Radio1 Lic. Nationwide 100 1 1926/1990
YleX Lic. Nationwide 100 1 1990
YLE Radio Suomi Lic. Nationwide 100 1 1965/1990
with 26 regional windows
– in Finnish Lic. Regional .. 20 1975-
– 5 in Swedish Lic. Regional .. 5 1973-
– 1 in Sami Lic. Regional .. 1 1987
YLE Puhe Lic. Nationwide 90 1 1998/2009
YLE Radio Vega4 Lic. Nationwide 83 1 1961/1997
YLE Radio X3M4 Lic. Regional 48 1 1997
DVB stations:
Ylen Klassinen Lic. Nationwide 100 1 1999
YLE Mondo Lic. Nationwide 100 1 2005
..
The largest private radio groups
SBS Broadcasting The Voice Comm. Nationwide 99 1 2007 11
(ProSiebenSat.1 Media) Iskelmä5 Comm. Local 92 16 2001
Radio 957 Comm. Local .. 1 1985
Radio Jyväskylä Comm. Local .. 1 2001
Radio Mega Comm. Local .. 1 1988
Radio Sata Comm. Local .. 1 1989
Suomen Uutisradio Radio Nova Comm. Nationwide 99 1 1997 11
(MTV3/Bonnier 74%, MTG 22%)
Nelonen Media Radio Aalto Comm. Nationwide 73 1 2007 6
(Sanoma) Radio Rock Comm. Nationwide 85 1 2007
Radio Helsinki Comm. Local .. 1 2000
Metroradio Finland Groove FM Comm. Nationwide 62 1 1999 6
(Communicorp Group) Suomi POP Comm. Nationwide 87 1 2001
NRJ Finland (NRJ) Radio NRJ Comm. Nationwide 87 1 1995 4
1 Analogue (via FM nets) and DVB channels; most are also transmitted digitally online, and some via cable. For an overview of the DAB/DVB channels only, see separate table.
2 Lic.=licence fees, Comm.=commercials.3 Share of population (aged 9 and over) having potential access.4 Full-service stations in Swedish.5 16 stations, 6 of which are SBS-owned. The rest are cooperating stations.
Sources: YLE, Association of Finnish Broadcasters.

RADIO
NORDICOM 115 Nordic Public Service Media Map 1/2012
4. Cont. The largest radio companies and their channels
4.3 The largest radio companies in Iceland and their channels 2010 (end-of-year)1
Penetration Year Company (Owner) Channel Financing2 Coverage3 (%)4 established
Public service
RÚV Ríkisútvarpið ohf. Rás 1 Tax, Comm., Spon. Nationwide 100 1930
(state) Rás 2 Tax, Comm., Spon. Nationwide 100 1983
Rondó (DAB) Tax, Comm., Spon. Quasi-national 65–70 2004
The largest private radio group
365 miðlar ehf. Bylgjan Comm., Spon. Nationwide 99 19865
FM 95.7 Comm., Spon. Nationwide 95 19895
– 4 stations Comm., Spon. Regional/Quasi-national 65–70
1 Principally analogue channels (via FM nets); most are also transmitted digitally (online, DAB, DVB), and some via cable and satellite. For an overview of the DAB/DVB channels only, see separate table.
2 Tax = a special fee imposed on all individuals and legal persons, Comm.=commercials, Spon.=sponsoring, Don.=donations.3 ”Nationwide” is defined here as channels reaching all regions of the country and at least 90% of the population; ”Quasi-national” refers to channels reaching two or
more regions of the country and over 50% of the population.4 Share of population having potential access.5 Bylgjan: nationwide channel since 1993; FM 95.7: nationwide channel since 2001.
Note: Largest radio companies by turnover.
Source: Statistics Iceland.
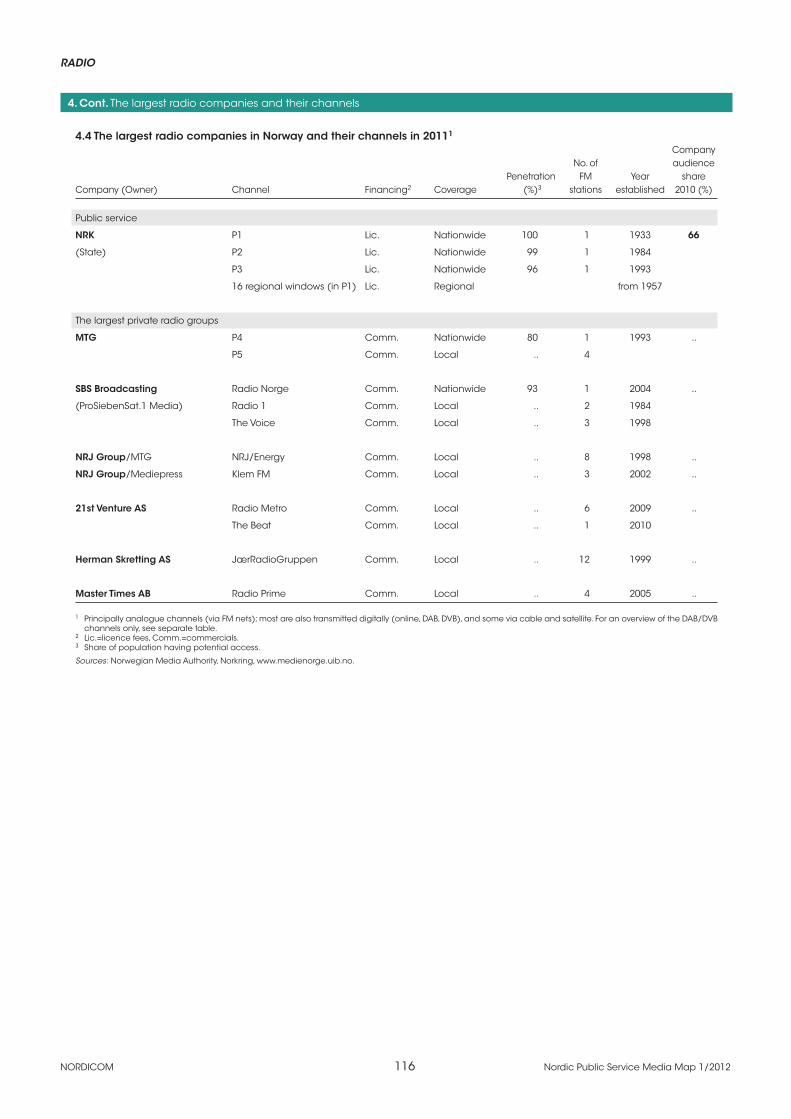
NORDICOM 116 Nordic Public Service Media Map 1/2012
RADIO
4. Cont. The largest radio companies and their channels
4.4 The largest radio companies in Norway and their channels in 20111 Company No. of audience Penetration FM Year share Company (Owner) Channel Financing2 Coverage (%)3 stations established 2010 (%)
Public service
NRK P1 Lic. Nationwide 100 1 1933 66
(State) P2 Lic. Nationwide 99 1 1984
P3 Lic. Nationwide 96 1 1993
16 regional windows (in P1) Lic. Regional from 1957
The largest private radio groups
MTG P4 Comm. Nationwide 80 1 1993 ..
P5 Comm. Local .. 4
SBS Broadcasting Radio Norge Comm. Nationwide 93 1 2004 ..
(ProSiebenSat.1 Media) Radio 1 Comm. Local .. 2 1984
The Voice Comm. Local .. 3 1998
NRJ Group/MTG NRJ/Energy Comm. Local .. 8 1998 ..
NRJ Group/Mediepress Klem FM Comm. Local .. 3 2002 ..
21st Venture AS Radio Metro Comm. Local .. 6 2009 ..
The Beat Comm. Local .. 1 2010
Herman Skretting AS JærRadioGruppen Comm. Local .. 12 1999 ..
Master Times AB Radio Prime Comm. Local .. 4 2005 ..
1 Principally analogue channels (via FM nets); most are also transmitted digitally (online, DAB, DVB), and some via cable and satellite. For an overview of the DAB/DVB channels only, see separate table.
2 Lic.=licence fees, Comm.=commercials.3 Share of population having potential access.
Sources: Norwegian Media Authority, Norkring, www.medienorge.uib.no.

RADIO
NORDICOM 117 Nordic Public Service Media Map 1/2012
4. Cont. The largest radio companies and their channels
4.5 The largest radio companies in Sweden and their channels 2011 (Spring)1
No. of Company Penetration FM Year daily Company (Owner) Channel Financing2 Coverage (%)3 stations established reach (%)4
Public service
SR P1 Lic. Nationwide 100 1 1925 484
(state) P2 Lic. Nationwide 100 1 1955
P3 Lic. Nationwide 100 1 1964
P4 Riks Lic. Nationwide 100 1 1993
P4 Lokal Lic. Regional 100 25 regional 1987-19895 channels
SR Metropol (Stockholm) Lic. Local .. 1 2007
Din gata 100,6 (Malmö) Lic. Local .. 1 2006
The largest private radio groups
MTG Rix FM Comm. .. .. 31 18
Bandit Rock Comm. .. .. 11
Radio 1 (Stockholm) Comm. Local .. 1
Lugna Favoriter (Stockholm) Comm. Local .. 1
MTG / NRJ6 NRJ Comm. .. .. 3
SBS Broadcasting Mix Megapol Comm. .. .. 35 15
(ProSiebenSat.1 Media) Rockklassiker Comm. .. .. 16
Vinyl (Stockholm) Comm. Local 1
Radio 107,5 (Stockholm) Comm. Local .. 1
The Voice (Stockholm) Comm. Local .. 1
1 Principally analogue channels (via FM nets); most are also transmitted digitally (online, DAB, DVB), and some via cable and satellite. For an overview of the DAB/DVB channels only, see separate table.
2 Lic.=licence fees, Comm.=commercials.3 Share of population having potential access.4 Companies ranked by daily reach (Jan-Mar 2011) since audience shares for private radio groups are not available. Audience share for SR was, however, 69%. 5 The first regional was channel established in November 1987, the most recent in October 1989.6 MTG, Modern Times Group, took over operation of NRJ’s 20 radio stations in Sweden in July 2004. Only the NRJ stations in Stockholm, Göteborg and Malmö retain the
NRJ name and format: the others were given standard MTG formats (either RIX FM or Lugna Favoriter). NRJ still holds the concessions for the 20 stations. (In January 2013 NRJ will instead cooperate with SBS Broadcasting, and consequently the stations with MTG formats will broadcast with SBS formats.)
Sources: SR, TNS Sifo, Swedish Broadcasting Authority.

NORDICOM 118 Nordic Public Service Media Map 1/2012
RADIO
5. Public service radio programming by content 2000-2010 (share of transmission time, per cent)
Type of content 2000 2001 2002 2003 2004 2005 2006 2007 2008 2009 2010
Denmark1
DR radio analogue transmissions
News2 8 15 14 15 8 9 .. 9 9 9 9
Current affairs & debate 29 28 29 26 38 38 .. 40 42 43 44
Information & culture 7 9 9 7 9 12 .. 10 8 8 7
Drama/Fiction 2 1 1 1 1 1 .. 1 0 0 0
Music 30 27 25 25 20 23 .. 23 25 27 29
Entertainment 12 16 15 21 18 12 .. 13 13 10 8
Sport 4 2 2 1 1 1 .. 1 2 1 2
Education – – – – – – .. 0 0 0 0
Chorus & Orchestra – – – – – – .. 1 0 0 0
Service (announcers, promotion) 7 3 4 5 4 4 .. 3 2 2 2
Other – – – – – – .. 0 0 0 0
Total 100 100 100 100 100 100 .. 100 100 100 100
Total transmission hours 59 098 56 634 55 912 58 768 54 463 54 245 53 653 54 404 53 969 ..3 ..3
DR radio digital transmissions (DAB and online)
News .. 1 9 12 10 7 .. 6 5 5 5
Current affairs & debate .. 2 9 1 1 2 .. 11 1 1 1
Information & culture .. 0 2 3 5 4 .. 1 0 1 1
Drama/Fiction .. 0 - 5 9 6 .. 1 5 1 0
Music .. 96 74 78 67 66 .. 77 86 90 90
Entertainment .. 0 6 – 2 9 .. 4 3 3 4
Sport .. – 0 – 5 6 .. 0 0 0 0
Education .. – – – – – .. - 0 0 0
Chorus & Orchestra .. – – – – – .. 0 0 0 0
Service (announcers, promotion) .. 0 0 0 0 0 .. 0 0 0 0
Other .. – – – – – .. 0 0 0 0
Total .. 100 100 100 100 100 .. 100 100 100 100
Total transmission hours .. 28 825 57 792 72 744 93 448 161 539 208 199 202 147 212 363 ..3 ..3
Iceland
RÚV radio (FM transmissions)
News and weather 17 18 17 19 18 18 .. 18 16 17 16
Sport 1 1 1 0 1 1 .. 1 1 1 1
Children & youth 1 1 1 1 2 2 .. .. .. .. ..
Music 48 46 45 51 52 53 .. 53 55 55 55
Current affairs 16 18 20 13 12 12 .. 12 10 10 8
Arts, literature, theatre, science 7 8 7 7 6 6 .. 7 10 11 12
Religion 1 1 1 1 1 0 .. 0 1 1 1
Entertainment 6 5 6 6 5 5 .. 6 4 3 3
Advertising 4 3 2 2 3 3 .. 3 3 4 4
Other 1 0 0 0 0 1 .. 0 1 .. ..
Total 100 100 100 100 100 100 .. 100 100 100 100
Total transmission hours 15 612 15 357 15 140 15 208 15 271 15 202 15 180 17 568 17 520 17 520 17 520
Cont.

RADIO
NORDICOM 119 Nordic Public Service Media Map 1/2012
5. Cont. Public service radio programming by content 2000-2010 (share of transmission time, per cent)
Type of content 2000 2001 2002 2003 2004 2005 2006 2007 2008 2009 2010
Norway
NRK radio (P1 and P2)4
News 14 14 14 14 14 13 12 12 12 10 9
Current affairs 8 8 9 10 9 8 9 10 10 10 11
Home/leisure/lifestyle 2 2 1 1 1 1 1 1 1 1 0
Drama 2 2 2 2 2 2 2 2 2 2 2
Entertainment 8 8 10 12 10 13 13 14 12 12 12
Sport 2 2 2 1 1 2 2 2 2 1 2
Children/Youth 2 2 2 2 1 1 1 1 1 1 1
Religion 2 2 1 2 1 2 1 2 2 2 2
Culture 6 6 7 7 5 8 8 8 9 10 10
Nature & Science 1 1 2 3 3 3 3 3 3 3 4
Music 45 45 42 41 39 39 41 39 38 40 39
Education 1 1 – – – – – – – – –
Regional transmissions5 .. .. .. .. 8 8 7 8 8 8 8
Other 7 7 8 5 5 1 0 0 0 0 1
Total 100 100 100 100 100 100 100 100 100 100 100
Total transmission hours5 16 194 16 194 16 226 16 221 17 520 17 520 17 518 17 490 17 563 17 520 17 520
Sweden6
SR analogue transmissions7,8
News 15 15 15 15 15 15 14 14 14 13 14
Current affairs 20 21 20 20 20 19 19 14 16 16 14
Lifestyle * * * * * * * 4 3 4 3
Culture 6 6 6 6 6 6 6 7 7 7 6
Sport 4 4 4 4 4 3 4 3 3 3 3
Entertainment 6 6 6 6 6 6 6 4 5 5 5
Music 45 46 45 47 46 47 48 51 49 50 51
Service (announcers, promotion) 3 3 3 3 3 2 2 3 2 2 3
Total 100 100 100 100 100 100 100 100 100 100 100
Total transmission hours9 120 665 121 231 122 326 121 552 119 565 117 280 125 385 125 580 129 531 131 123 124 562
SR digital transmissions (DAB and online)
News .. .. .. .. .. .. .. 2 2 2 2
Current affairs .. .. .. .. .. .. .. 8 8 8 6
Lifestyle .. .. .. .. .. .. .. 1 1 1 0
Culture .. .. .. .. .. .. .. 10 10 10 8
Sport .. .. .. .. .. .. .. 0 2 2 4
Entertainment .. .. .. .. .. .. .. 4 10 8 7
Music .. .. .. .. .. .. .. 68 66 68 73
Service (announcers, promotion) .. .. .. .. .. .. .. 0 0 0 0
Total .. .. .. .. .. .. .. 100 100 100 100
Total transmission hours9 .. .. .. .. .. .. .. 145 957 156 486 155 800 95 536
Cont.
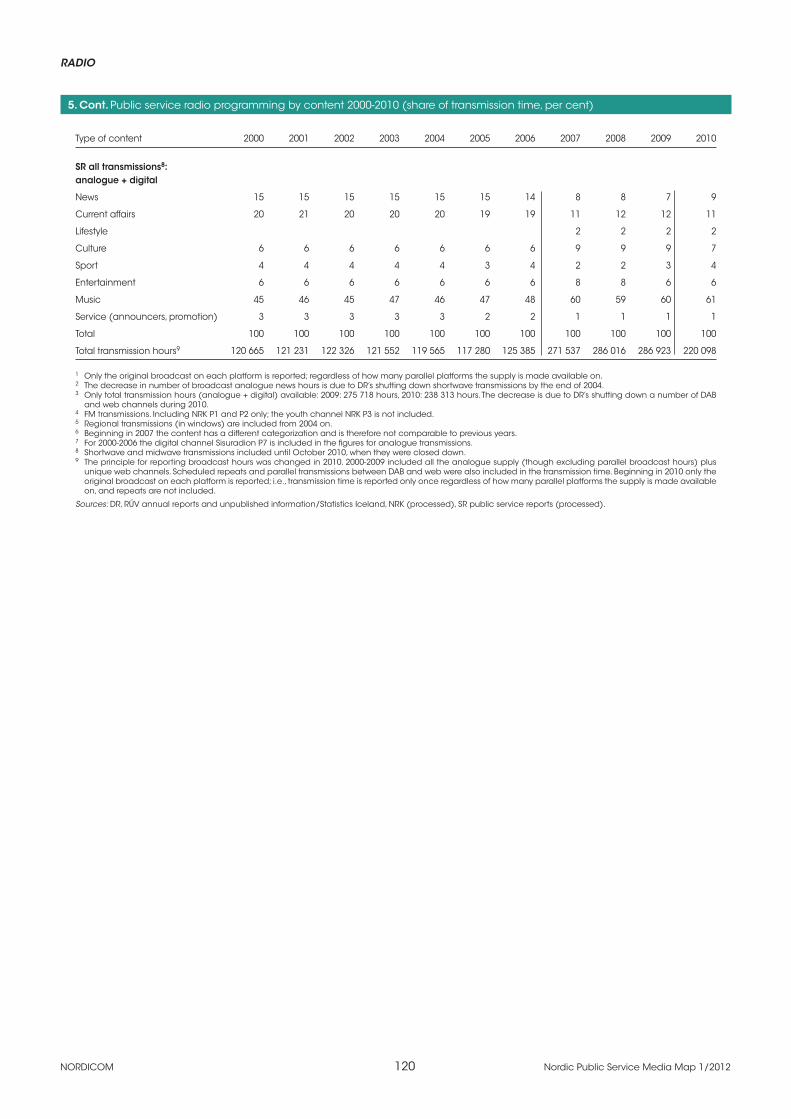
NORDICOM 120 Nordic Public Service Media Map 1/2012
RADIO
5. Cont. Public service radio programming by content 2000-2010 (share of transmission time, per cent)
Type of content 2000 2001 2002 2003 2004 2005 2006 2007 2008 2009 2010
SR all transmissions8: analogue + digital
News 15 15 15 15 15 15 14 8 8 7 9
Current affairs 20 21 20 20 20 19 19 11 12 12 11
Lifestyle 2 2 2 2
Culture 6 6 6 6 6 6 6 9 9 9 7
Sport 4 4 4 4 4 3 4 2 2 3 4
Entertainment 6 6 6 6 6 6 6 8 8 6 6
Music 45 46 45 47 46 47 48 60 59 60 61
Service (announcers, promotion) 3 3 3 3 3 2 2 1 1 1 1
Total 100 100 100 100 100 100 100 100 100 100 100
Total transmission hours9 120 665 121 231 122 326 121 552 119 565 117 280 125 385 271 537 286 016 286 923 220 098
1 Only the original broadcast on each platform is reported; regardless of how many parallel platforms the supply is made available on. 2 The decrease in number of broadcast analogue news hours is due to DR’s shutting down shortwave transmissions by the end of 2004.3 Only total transmission hours (analogue + digital) available: 2009: 275 718 hours, 2010: 238 313 hours. The decrease is due to DR’s shutting down a number of DAB
and web channels during 2010. 4 FM transmissions. Including NRK P1 and P2 only; the youth channel NRK P3 is not included. 5 Regional transmissions (in windows) are included from 2004 on.6 Beginning in 2007 the content has a different categorization and is therefore not comparable to previous years.7 For 2000-2006 the digital channel Sisuradion P7 is included in the figures for analogue transmissions.8 Shortwave and midwave transmissions included until October 2010, when they were closed down. 9 The principle for reporting broadcast hours was changed in 2010. 2000-2009 included all the analogue supply (though excluding parallel broadcast hours) plus
unique web channels. Scheduled repeats and parallel transmissions between DAB and web were also included in the transmission time. Beginning in 2010 only the original broadcast on each platform is reported; i.e., transmission time is reported only once regardless of how many parallel platforms the supply is made available on, and repeats are not included.
Sources: DR, RÚV annual reports and unpublished information/Statistics Iceland, NRK (processed), SR public service reports (processed).
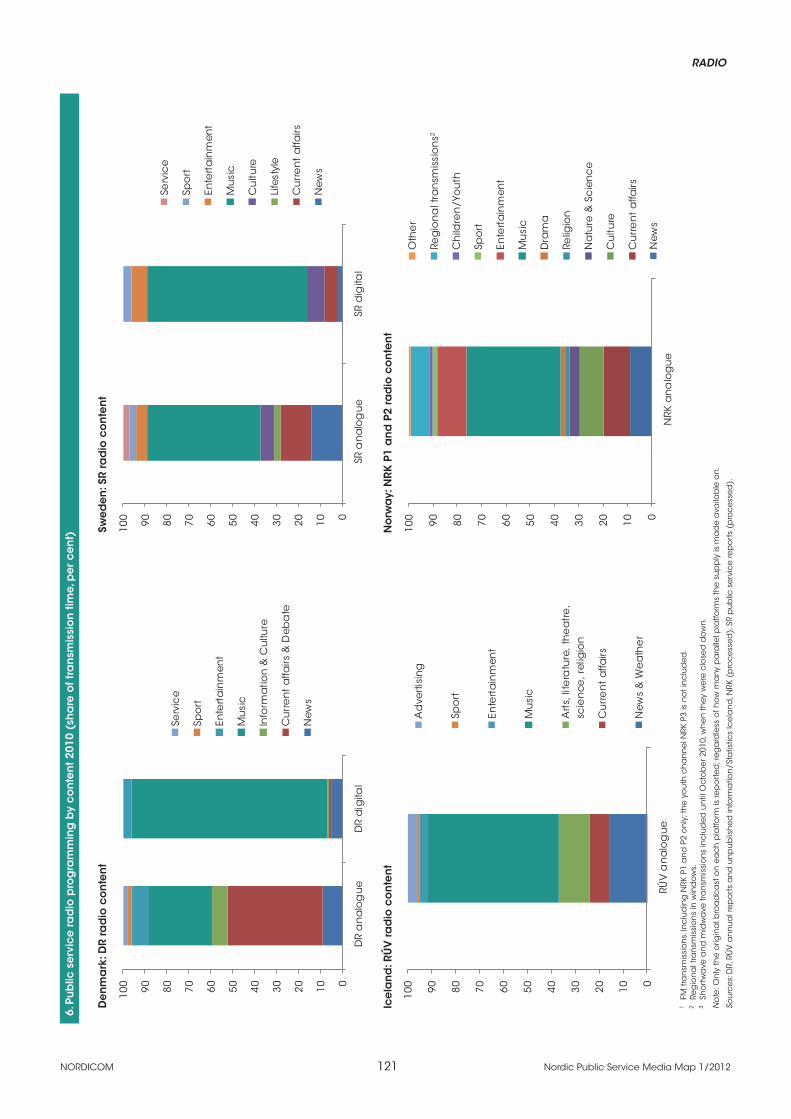
RADIO
NORDICOM 121 Nordic Public Service Media Map 1/2012
6. P
ub
lic s
erv
ice
rad
io p
rog
ram
min
g b
y c
on
ten
t 20
10 (
sha
re o
f tra
nsm
issi
on
tim
e, p
er
ce
nt)
De
nm
ark
: DR
rad
io c
on
ten
t Sw
ed
en
: SR
rad
io c
on
ten
t
Ice
lan
d: R
ÚV
rad
io c
on
ten
t N
orw
ay:
NRK
P1
an
d P
2 ra
dio
co
nte
nt
1 FM
tra
nsm
issi
on
s. In
clu
din
g N
RK P
1 a
nd
P2
on
ly; t
he
yo
uth
ch
an
ne
l NRK
P3
is n
ot i
nc
lud
ed
. 2
Reg
ion
al t
ran
smis
sio
ns
in w
ind
ow
s.3
Sho
rtw
ave
an
d m
idw
ave
tra
nsm
issi
on
s in
clu
de
d u
ntil
Oc
tob
er 2
010,
wh
en
they
we
re c
lose
d d
ow
n.
No
te: O
nly
the
orig
ina
l bro
ad
ca
st o
n e
ac
h p
latfo
rm is
rep
ort
ed
; re
ga
rdle
ss o
f ho
w m
any
pa
ralle
l pla
tform
s th
e s
up
ply
is m
ad
e a
vaila
ble
on
.
Sou
rce
s: D
R, R
ÚV
an
nu
al r
ep
ort
s a
nd
un
pu
blis
he
d in
form
atio
n/S
tatis
tics
Ice
lan
d, N
RK (
pro
ce
sse
d),
SR p
ub
lic s
erv
ice
rep
ort
s (p
roc
ess
ed
).
0102030405060708090100
DR
an
alo
gu
eD
R d
igita
l
Serv
ice
Spo
rt
Ente
rta
inm
ent
Mu
sic
Info
rma
tion
& C
ultu
re
Cu
rre
nt
affa
irs &
Deb
ate
New
s
0102030405060708090100
RÚV
an
alo
gu
e
Ad
vert
isin
g
Spo
rt
Ente
rta
inm
ent
Mu
sic
Art
s, li
tera
ture
, th
ea
tre
,sc
ien
ce, r
elig
ion
Cu
rre
nt
affa
irs
New
s &
We
ath
er
0102030405060708090100
SR a
na
log
ue
SR d
igita
l
Serv
ice
Spo
rt
Ente
rta
inm
ent
Mu
sic
Cu
lture
Life
styl
e
Cu
rre
nt
affa
irs
New
s
0102030405060708090100
NRK
an
alo
gu
e
Oth
er
Reg
ion
al t
ran
smis
sio
ns2
Ch
ildre
n/Y
ou
th
Spo
rt
Ente
rta
inm
ent
Mu
sic
Dra
ma
Relig
ion
Na
ture
& S
cie
nc
e
Cu
lture
Cu
rre
nt
affa
irs
New
s
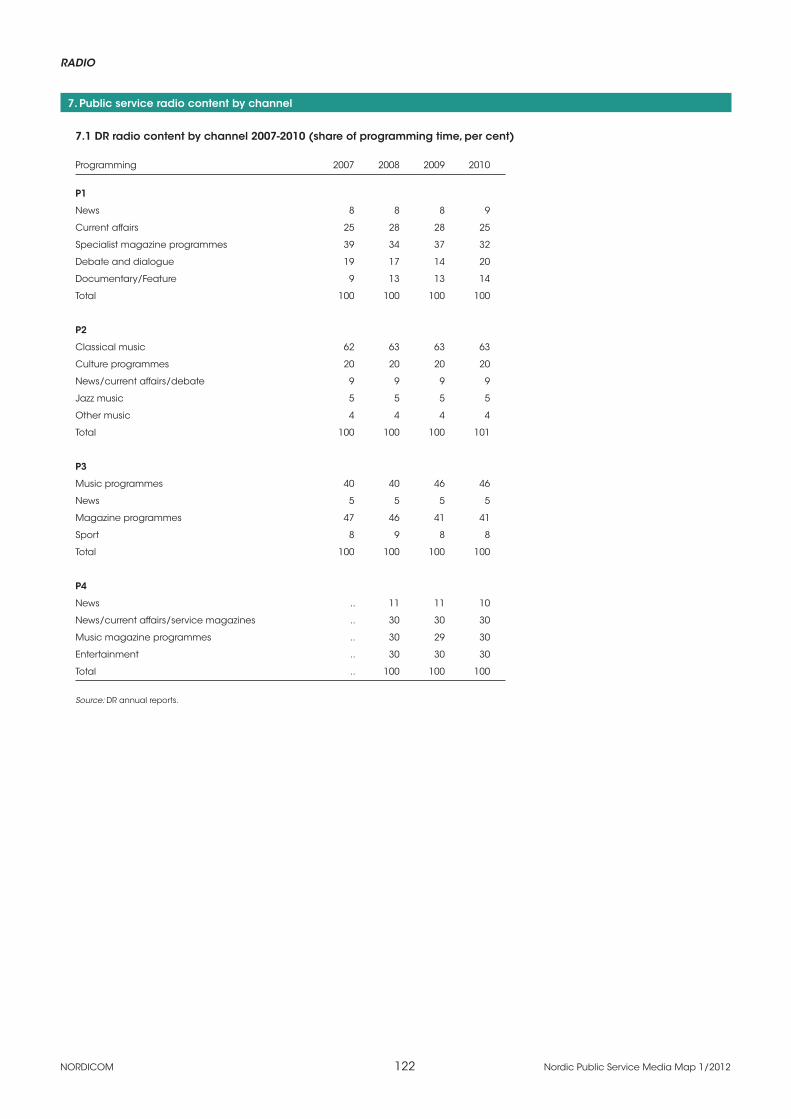
NORDICOM 122 Nordic Public Service Media Map 1/2012
RADIO
7. Public service radio content by channel
7.1 DR radio content by channel 2007-2010 (share of programming time, per cent)
Programming 2007 2008 2009 2010
P1
News 8 8 8 9
Current affairs 25 28 28 25
Specialist magazine programmes 39 34 37 32
Debate and dialogue 19 17 14 20
Documentary/Feature 9 13 13 14
Total 100 100 100 100
P2
Classical music 62 63 63 63
Culture programmes 20 20 20 20
News/current affairs/debate 9 9 9 9
Jazz music 5 5 5 5
Other music 4 4 4 4
Total 100 100 100 101
P3
Music programmes 40 40 46 46
News 5 5 5 5
Magazine programmes 47 46 41 41
Sport 8 9 8 8
Total 100 100 100 100
P4
News .. 11 11 10
News/current affairs/service magazines .. 30 30 30
Music magazine programmes .. 30 29 30
Entertainment .. 30 30 30
Total .. 100 100 100
Source: DR annual reports.

RADIO
NORDICOM 123 Nordic Public Service Media Map 1/2012
7. Cont. Public service radio content by channel
7.2 YLE radio content by channel 2002-2010 (share of programming time, per cent)
Programming 2002 2003 2004 2005 2006 2007 2008 2009 2010
YLE Radio1
Classical music 65 58 56 55 56 54 56 56 58
Culture 6 8 9 10 9 11 11 10 10
Features 8 6 7 7 8 7 7 9 7
Newscasts 6 6 6 6 6 7 7 6 6
Current affairs 2 9 9 7 7 6 5 5 6
Science & education 5 4 4 5 5 3 4 3 2
Religious 3 3 3 3 3 4 3 3 3
Drama 2 2 2 2 2 2 2 3 3
Features & documentaries 2 2 1 1 1 2 2 2 2
Children’s 1 1 1 1 2 1 1 1
Popular culture 1 2 2 2 2
Music entertainment 2 2 3 1
Total 100 100 100 100 100 100 100 100 100
Share of music 60 56 55 53 53 54 54 53 55
YleX
Popular culture 42 31 36 33 33 32 34 33 33
Music entertainment 44 41 33 34 34 33 32 34 34
Other entertainment 6 17 19 21 21 22 23 20 21
Current affairs 5 5 5 5 5 5 4 5 5
Newscasts 2 3 4 4 4 4 4 4 3
Features 4 3 3 3 3 2 3 3
Culture 1 1 1 1
Jazz music 1
Total 100 100 100 100 100 100 100 100 100
Share of music 73 63 64 63 62 60 60 58 56
YLE Radio Suomi1
Music entertainment 38 41 33 31 31 17 17 29 29
Other entertainment 1 12 19 19 20 19 19 19 19
Popular culture 15 8 8 7 7 12 12 13 13
Current affairs 18 15 14 16 15 7 6 14 14
Newscasts 12 11 12 11 11 10 10 13 13
Regional programming 23 22
Sports 10 7 9 8 9 7 9 7 7
Features 4 4 4 6 5 4 4 4 3
Culture 1 1 1 1 1 1 2
Science & education 1 1 1
Drama 1
Children’s 1
Total 100 100 100 100 100 100 100 100 100
Share of music 43 48 48 43 43 45 45 45 43
Cont.

NORDICOM 124 Nordic Public Service Media Map 1/2012
RADIO
7.2 Cont. YLE radio content by channel 2002-2010 (share of programming time, per cent)
Programming 2002 2003 2004 2005 2006 2007 2008 2009 2010
YLE Puhe (2007-2008 YLE Radio Peili)
Current affairs .. .. .. .. .. 26 26 33 34
Features .. .. .. .. .. 26 35 29 25
Culture .. .. .. .. .. 23 19 15 18
Newscasts .. .. .. .. .. 14 11 12 12
Science & education .. .. .. .. .. 8 6 7 7
Drama .. .. .. .. .. 2 2
Popular culture .. .. .. .. .. 1 1 1 1
Sports .. .. .. .. .. 2 2 1 1
Total .. .. .. .. .. 100 100 100 100
Share of music .. .. .. .. .. 0 0 0 0
YLE Radio Vega (in Swedish)
Popular culture 10 6 14 8 8 26 26 21 23
Current affairs 13 12 10 12 12 14 19 11 10
Newscasts 12 14 12 11 13 15 15 11 11
Features 8 9 10 13 12 13 13 11 11
Music entertainment 33 20 11 18 20
Other entertainment 15 14 15 15 14 8 5 5
Classical music 12 12 15 8 7 6 7 32 30
Culture 6 7 7 6 7 6 6 5 5
Religious 3 3 2 3 2 3 2 2 2
Sports 1 1 1 1 1 1 2 1 2
Science & education 1 1 1 2 2 1 1 1 1
Children’s 1 2 1 1 1 1 1
Drama 1 1
Total 100 100 100 100 100 100 100 100 100
Share of music 52 41 40 40 41 41 43 43 43
YLE X3M (in Swedish)
Popular culture 24 23 18 18 14 53 26 41 42
Entertainment 13 36 23 18
Music entertainment 33 38 52 54 58
Other entertainment 6 8 7 3
Current affairs 18 9 8 10 11 17 26 26 38
Features 3 4 2 1 4 8 8 8
Newscasts 3 3 3 2 2 2 2 2 2
Classical music 1 2
Sports 10 4 5 5 8 7 2
Children’s 6 11 3 2
Culture 3 2 1 1
Total 100 100 100 100 100 100 100 100 100
Share of music 68 61 60 61 59 62 61 59 58
1 YLE Radio Suomi: In 2009-2010 regional programming was included in newscasts, current affairs and music entertainment.
Note: Categories differ from year to year.
Source: YLE annual reports.

RADIO
NORDICOM 125 Nordic Public Service Media Map 1/2012
7. Cont. Public service radio content by channel
7.3 RÚV radio content by channel 2010 (share of transmission time, per cent)
Type of content Rás 1 Rás 2
News & weather 13 20
Sports – 1
Children & youth .. –
Advertising 3 6
Music 48 62
Current affairs 11 9
Arts, literature, theatre 21 0
Religion 1 –
Entertainment 3 3
Total 100 100
Total transmission hours 8 760 8 760
Sources: RÚV annual reports and unpublished information/Statistics Iceland.
7.4 NRK radio content by channel 2010 (share of transmission time, per cent)
Type of content P1 P21 P3
News 10 8 3
Current affairs 9 14 5
Home/leisure 1 – –
Nature and Science 1 7 –
Culture 3 16 3
Religion 2 1 –
Children’s programmes 2 – –
Sports 3 0 2
Drama 1 2 –
Entertainment 24 1 23
Music 29 50 60
Regional transmissions2 16 – –
Other 0 1 6
Total 100 100 100
Total transmission hours 8 760 8 760 8 760
1 Includes P2’s all-night classical music programming.2 Transmitted in windows in P1.
Source: NRK (processed).
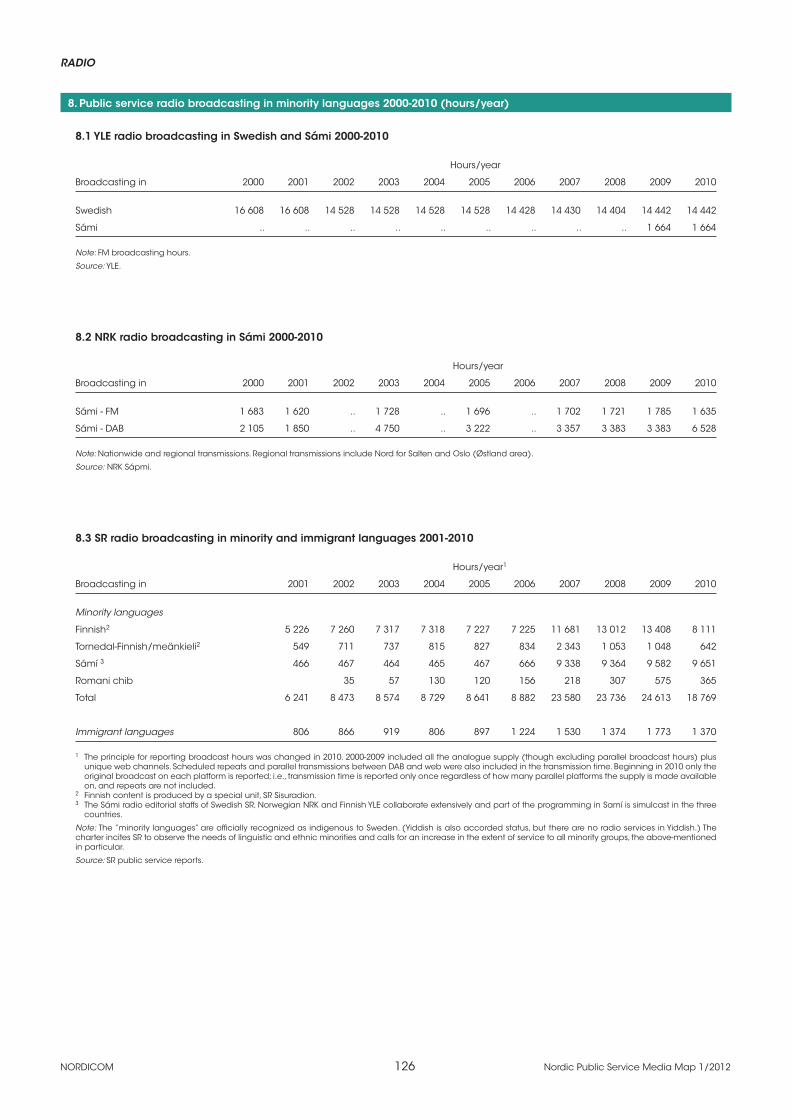
NORDICOM 126 Nordic Public Service Media Map 1/2012
RADIO
8. Public service radio broadcasting in minority languages 2000-2010 (hours/year)
8.1 YLE radio broadcasting in Swedish and Sámi 2000-2010
Hours/year
Broadcasting in 2000 2001 2002 2003 2004 2005 2006 2007 2008 2009 2010
Swedish 16 608 16 608 14 528 14 528 14 528 14 528 14 428 14 430 14 404 14 442 14 442
Sámi .. .. .. .. .. .. .. .. .. 1 664 1 664
Note: FM broadcasting hours.
Source: YLE.
8.2 NRK radio broadcasting in Sámi 2000-2010
Hours/year
Broadcasting in 2000 2001 2002 2003 2004 2005 2006 2007 2008 2009 2010
Sámi - FM 1 683 1 620 .. 1 728 .. 1 696 .. 1 702 1 721 1 785 1 635
Sámi - DAB 2 105 1 850 .. 4 750 .. 3 222 .. 3 357 3 383 3 383 6 528
Note: Nationwide and regional transmissions. Regional transmissions include Nord for Salten and Oslo (Østland area).
Source: NRK Sápmi.
8.3 SR radio broadcasting in minority and immigrant languages 2001-2010
Hours/year1
Broadcasting in 2001 2002 2003 2004 2005 2006 2007 2008 2009 2010
Minority languages
Finnish2 5 226 7 260 7 317 7 318 7 227 7 225 11 681 13 012 13 408 8 111
Tornedal-Finnish/meänkieli2 549 711 737 815 827 834 2 343 1 053 1 048 642
Sámí 3 466 467 464 465 467 666 9 338 9 364 9 582 9 651
Romani chib 35 57 130 120 156 218 307 575 365
Total 6 241 8 473 8 574 8 729 8 641 8 882 23 580 23 736 24 613 18 769
Immigrant languages 806 866 919 806 897 1 224 1 530 1 374 1 773 1 370
1 The principle for reporting broadcast hours was changed in 2010. 2000-2009 included all the analogue supply (though excluding parallel broadcast hours) plus unique web channels. Scheduled repeats and parallel transmissions between DAB and web were also included in the transmission time. Beginning in 2010 only the original broadcast on each platform is reported; i.e., transmission time is reported only once regardless of how many parallel platforms the supply is made available on, and repeats are not included.
2 Finnish content is produced by a special unit, SR Sisuradion.3 The Sámi radio editorial staffs of Swedish SR, Norwegian NRK and Finnish YLE collaborate extensively and part of the programming in Samí is simulcast in the three
countries.
Note: The ”minority languages” are officially recognized as indigenous to Sweden. (Yiddish is also accorded status, but there are no radio services in Yiddish.) The charter incites SR to observe the needs of linguistic and ethnic minorities and calls for an increase in the extent of service to all minority groups, the above-mentioned in particular.
Source: SR public service reports.

RADIO
NORDICOM 127 Nordic Public Service Media Map 1/2012
9. P
riva
te ra
dio
co
nte
nt
in F
inla
nd
, Ic
ela
nd
an
d N
orw
ay
2009
/201
0
9.1
Priv
ate
rad
io in
Fin
lan
d: C
on
ten
t 20
09 (
sha
re o
f tra
nsm
issi
on
tim
e, p
er
ce
nt)
SB
S Is
kelm
ä/
Ra
dio
No
va
Gro
ove
FM
Su
om
i Po
p
Rad
io N
RJ
Rad
io A
alto
Ra
dio
Ro
ck
He
lsin
ki
The
Vo
ice
Ba
sso
rad
io
Cla
ssic
Ra
dio
Ra
dio
De
i Ra
dio
Sp
utn
ik
Typ
e o
f co
nte
nt
(Bo
nn
ier)
(M
etro
me
dia
) (M
etro
me
dia
) (N
RJ)
(Sa
no
ma
) (S
an
om
a)
(SBS
) (S
BS)
Mu
sic
45
74
60
54
71
66
56
56
74
81
56
42
Talk
17
17
30
8
12
16
19
0 0
11
28
5
Talk
& m
usi
c
15
1 2
14
4 6
1 28
17
0
6 35
Ch
an
ne
l ID
s &
pro
mo
s 8
3 2
3 4
3 4
3 1
1 4
9
Ad
vert
isin
g
15
4 5
21
9 9
20
14
7 5
6 9
Oth
er
0 0
0 0
0 0
0 0
1 2
0 0
Tota
l 10
0 10
0 10
0 10
0 10
0 10
0 10
0 10
0 10
0 10
0 10
0 10
0
Sou
rce
: Min
istr
y o
f Tra
nsp
ort
an
d C
om
mu
nic
atio
ns.
9.2
Bylg
jan
in Ic
ela
nd
: Co
nte
nt
2009
-201
0 (s
ha
re o
f pro
gra
mm
ing
tim
e, p
er
ce
nt)
Typ
e o
f co
nte
nt
2009
20
10
New
s a
nd
we
ath
er
5 5
Cu
rren
t affa
irs
5 5
Ente
rta
inm
en
t 5
5
Mu
sic
75
75
Spo
rts
1 1
Cu
lture
2
2
Ch
ildre
n/y
ou
th
0 0
Relig
ion
–
0
Ad
vert
isin
g
7 7
Tota
l 10
0 10
0
Sou
rce
s: S
tatis
tics
Ice
lan
d, i
nfo
rma
tion
fro
m b
roa
dc
ast
er.
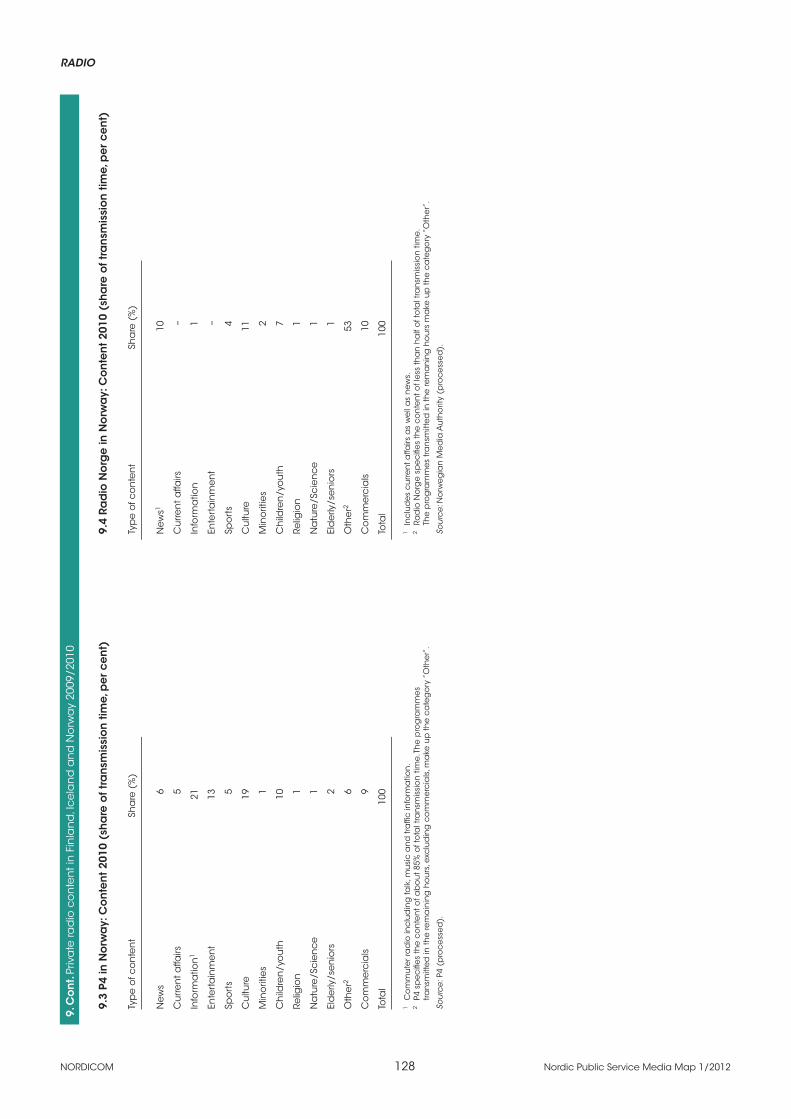
NORDICOM 128 Nordic Public Service Media Map 1/2012
RADIO9.
Co
nt.
Priv
ate
rad
io c
on
ten
t in
Fin
lan
d, I
ce
lan
d a
nd
No
rwa
y 20
09/2
010
9.3
P4 in
No
rwa
y: C
on
ten
t 20
10 (
sha
re o
f tra
nsm
issi
on
tim
e, p
er
ce
nt)
9.
4 Ra
dio
No
rge
in N
orw
ay:
Co
nte
nt
2010
(sh
are
of t
ran
smis
sio
n t
ime,
pe
r c
en
t)
Typ
e o
f co
nte
nt
Sha
re (
%)
Typ
e o
f co
nte
nt
Sha
re (
%)
New
s 6
New
s1 10
Cu
rren
t affa
irs
5 C
urre
nt a
ffairs
–
Info
rma
tion
1 21
In
form
atio
n
1
Ente
rta
inm
en
t 13
En
tert
ain
me
nt
–
Spo
rts
5 Sp
ort
s 4
Cu
lture
19
C
ultu
re
11
Min
orit
ies
1 M
ino
ritie
s 2
Ch
ildre
n/y
ou
th
10
Ch
ildre
n/y
ou
th
7
Relig
ion
1
Relig
ion
1
Na
ture
/Sc
ien
ce
1
Na
ture
/Sc
ien
ce
1
Eld
erly
/se
nio
rs
2 El
de
rly/s
en
iors
1
Oth
er2
6 O
the
r2 53
Co
mm
erc
ials
9
Co
mm
erc
ials
10
Tota
l 10
0 To
tal
100
1 C
om
mu
ter r
ad
io in
clu
din
g ta
lk, m
usi
c a
nd
tra
ffic
info
rma
tion
. 1
In
clu
de
s c
urre
nt a
ffairs
as
we
ll a
s n
ews.
2 P
4 sp
ec
ifie
s th
e c
on
ten
t of a
bo
ut 8
5% o
f to
tal t
ran
smis
sio
n ti
me
. Th
e p
rog
ram
me
s
2 R
ad
io N
org
e s
pe
cifi
es
the
co
nte
nt o
f le
ss th
an
ha
lf o
f to
tal t
ran
smis
sio
n ti
me
.
tran
smitt
ed
in th
e re
ma
inin
g h
ou
rs, e
xclu
din
g c
om
me
rcia
ls, m
ake
up
the
ca
teg
ory
”O
the
r”.
Th
e p
rog
ram
me
s tra
nsm
itte
d in
the
rem
an
ing
ho
urs
ma
ke u
p th
e c
ate
go
ry ”
Oth
er”
.
Sou
rce
: P4
(pro
ce
sse
d).
Sou
rce
: No
rwe
gia
n M
ed
ia A
uth
orit
y (p
roc
ess
ed
).

RADIO
NORDICOM 129 Nordic Public Service Media Map 1/2012
10. Radio listening: Daily reach 2000-2010 (per cent)1,2
Share of population (%)
Denmark3 Finland4 Iceland Norway3,5 Sweden
Year (Age: 12+) (Age: 9+) (Age 12-80) (Age: 9+/12+) (Age: 9-79)
2000 86 81 .. 66 79
2001 85 82 79 65 79
2002 84 83 79 68 77
2003 83 82 88 69 77
2004 83 80 90 70 78
2005 81 79 89 70 80
2006 80 79 83 69 79
2007 81 79 88 67 74
2008 80 78 .. 78 75
2009 78 78 .. 75 75
2010 77 78 .. 75 73
1 Daily reach in Denmark and Sweden: share of population who have listened at least 5 consecutive minutes; Finland and Iceland: a minimum of 8 and 5 minutes, respectively, during at least one 15-minute interval; Norway: 2000-2007 based on at least 2 minutes’ listening, 2008-2010 minimum 1 minute’s listening.
2 Based on Monday-Sunday, except for Iceland: 6-7 days/week except for 2000, Monday-Friday. Survey periods: Denmark, 4th quarter 2000-2007, full year 2008-2010; Finland and Norway, measures throughout the year; Iceland, measures in March/April (2000-2002, 2004, 2007) or Oct/Nov (2003, 2005-2006); and Sweden, Autumn figures.
3 New method from 2008 forward: electronic measurement (ppm). Data are not comparable to previous years.4 From 2009 onwards the base population is the Finnish- and Swedish-speaking population (excluding the Åland islands). Until 2008 Finnish-speaking population only. 5 2000-2007: age 9+, 2008-2010: age 12+.
Note: Different methods have been used, which impairs comparability between countries and years. Data should be taken as indicators of the trend and level of listen-ing. Data include listening to radio, irrespective of platform.
Sources: TNS Gallup Denmark, Finnpanel, Social Science Institute at the University of Iceland, RÚV, Capacent, NRK/TNS Gallup Norway, TNS Sifo (previously RUAB/Sifo Media).
11. Public service radio daily reach 2000-2010 (per cent)1,2
Share of population (%)
Denmark Finland Norway Sweden
Year (Age 12+) (Age: 9+) (Age: 9+/12+) (Age: 9-79)
DR YLE NRK SR
2000 68 54 50 55
2001 67 51 48 54
2002 66 48 50 52
2003 66 47 47 51
2004 63 47 48 50
2005 64 45 48 51
2006 64 46 48 50
2007 63 46 47 46
2008 66 44 56 48
2009 64 43 50 49
2010 64 44 52 48
1 Daily reach in Denmark and Sweden: share of population who have listened at least 5 consecutive minutes; Finland: a minimum of 8 minutes during at least one 15-minute interval; Norway: 2000-2007 based on at least 2 minutes’ listening, 2008-2010 minimum 1 minute’s listening.
2 No data on total public service reach available for RÚV, Iceland. See separate table on channel reach with data for RÚV Rás 1 and Rás 2 separately.
Note: Different methods have been used, which impairs comparability between countries and years. Data should be taken as indicators of the trend and level of listen-ing. Data include listening to radio, irrespective of platform.
Sources: TNS Gallup Denmark, Finnpanel, NRK/TNS Gallup Norway, TNS Sifo (previously RUAB/Sifo Media).

NORDICOM 130 Nordic Public Service Media Map 1/2012
RADIO
12. Public service radio daily reach 2000-2010 (per cent)1,2
1 Daily reach in Denmark and Sweden: share of population who have listened at least 5 consecutive minutes; Finland: a minimum of 8 minutes during at least one 15-minute interval; Norway: 2000-2007 based on at least 2 minutes’ listening, 2008-2010 minimum 1 minute’s listening.
2 No data on total public service reach available for RÚV, Iceland. See separate table on channel reach with data for RÚV Rás 1 and Rás 2 separately.
Note: Different methods have been used, which impairs comparability between countries and years. Data should be taken as indicators of the trend and level of listening. Data include listening to radio, irrespective of platform.
Sources: TNS Gallup Denmark, Finnpanel, NRK/TNS Gallup Norway, TNS Sifo (previously RUAB/Sifo Media).
0
10
20
30
40
50
60
70
80
2000 2001 2002 2003 2004 2005 2006 2007 2008 2009 2010
Sha
re o
f po
pu
latio
n (
%)
DR YLE NRK SR
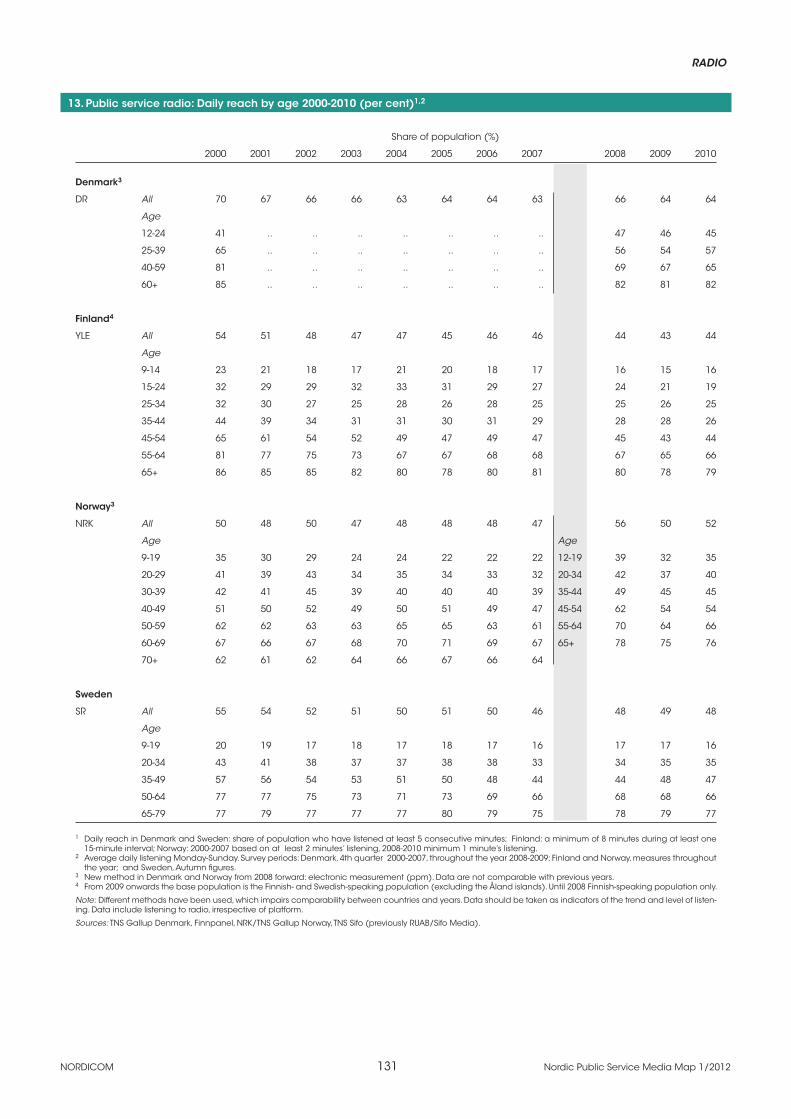
RADIO
NORDICOM 131 Nordic Public Service Media Map 1/2012
13. Public service radio: Daily reach by age 2000-2010 (per cent)1,2
Share of population (%)
2000 2001 2002 2003 2004 2005 2006 2007 2008 2009 2010
Denmark3
DR All 70 67 66 66 63 64 64 63 66 64 64
Age
12-24 41 .. .. .. .. .. .. .. 47 46 45
25-39 65 .. .. .. .. .. .. .. 56 54 57
40-59 81 .. .. .. .. .. .. .. 69 67 65
60+ 85 .. .. .. .. .. .. .. 82 81 82
Finland4
YLE All 54 51 48 47 47 45 46 46 44 43 44
Age
9-14 23 21 18 17 21 20 18 17 16 15 16
15-24 32 29 29 32 33 31 29 27 24 21 19
25-34 32 30 27 25 28 26 28 25 25 26 25
35-44 44 39 34 31 31 30 31 29 28 28 26
45-54 65 61 54 52 49 47 49 47 45 43 44
55-64 81 77 75 73 67 67 68 68 67 65 66
65+ 86 85 85 82 80 78 80 81 80 78 79
Norway3
NRK All 50 48 50 47 48 48 48 47 56 50 52
Age Age
9-19 35 30 29 24 24 22 22 22 12-19 39 32 35
20-29 41 39 43 34 35 34 33 32 20-34 42 37 40
30-39 42 41 45 39 40 40 40 39 35-44 49 45 45
40-49 51 50 52 49 50 51 49 47 45-54 62 54 54
50-59 62 62 63 63 65 65 63 61 55-64 70 64 66
60-69 67 66 67 68 70 71 69 67 65+ 78 75 76
70+ 62 61 62 64 66 67 66 64
Sweden
SR All 55 54 52 51 50 51 50 46 48 49 48
Age
9-19 20 19 17 18 17 18 17 16 17 17 16
20-34 43 41 38 37 37 38 38 33 34 35 35
35-49 57 56 54 53 51 50 48 44 44 48 47
50-64 77 77 75 73 71 73 69 66 68 68 66
65-79 77 79 77 77 77 80 79 75 78 79 77
1 Daily reach in Denmark and Sweden: share of population who have listened at least 5 consecutive minutes; Finland: a minimum of 8 minutes during at least one 15-minute interval; Norway: 2000-2007 based on at least 2 minutes’ listening, 2008-2010 minimum 1 minute’s listening.
2 Average daily listening Monday-Sunday. Survey periods: Denmark, 4th quarter 2000-2007, throughout the year 2008-2009; Finland and Norway, measures throughout the year; and Sweden, Autumn figures.
3 New method in Denmark and Norway from 2008 forward: electronic measurement (ppm). Data are not comparable with previous years.4 From 2009 onwards the base population is the Finnish- and Swedish-speaking population (excluding the Åland islands). Until 2008 Finnish-speaking population only.
Note: Different methods have been used, which impairs comparability between countries and years. Data should be taken as indicators of the trend and level of listen-ing. Data include listening to radio, irrespective of platform.
Sources: TNS Gallup Denmark, Finnpanel, NRK/TNS Gallup Norway, TNS Sifo (previously RUAB/Sifo Media).

NORDICOM 132 Nordic Public Service Media Map 1/2012
RADIO14
. Ra
dio
list
en
ing
: Da
ily c
ha
nn
el r
ea
ch
200
0-20
10 (
pe
r c
en
t)1,
2
S
ha
re o
f po
pu
latio
n (
%)
St
atu
s C
ha
nn
el
2000
20
01
2002
20
03
2004
20
05
2006
20
07
2008
20
09
2010
De
nm
ark
3 Pu
blic
D
R/P1
12
11
11
10
10
11
10
10
8
8 8
(Ag
e: 1
2+)
D
R/P2
..
5 5
5 5
5 5
4 5
4 5
DR/
P3
32
29
27
26
24
25
25
23
26
23
23
DR/
P4
38
39
40
40
37
38
37
35
41
40
39
DR
tota
l 68
67
66
66
63
64
64
63
66
64
64
Pr
iva
te
TV2
Rad
io /
NO
VA F
M5
* *
* *
* *
* 6
3 10
10
POPF
M6
* *
* *
* *
* *
* *
1
Rad
io 1
00 F
M
* *
* ..
8 10
11
8
10
11
6
Rad
io S
oft
* *
* *
* *
* *
4 3
2
The
Vo
ice
, to
tal
* *
* *
* *
* *
5 5
5
All
priv
ate
rad
io7
36
34
34
32
36
32
29
30
37
35
30
All
rad
io
86
85
84
83
83
81
80
81
80
78
77
Fin
lan
d4
Pub
lic
YLE
Rad
io 1
12
12
11
12
11
11
12
11
10
9
9
(Ag
e: 9
+)
Yl
eX
10
9
9 9
10
9 9
8 7
6 6
YLE
Rad
io S
uo
mi
38
37
34
32
31
31
31
32
31
29
29
Yle
Pu
he
*
* *
* *
* *
* *
2 2
YLE
Rad
io V
eg
a &
Ra
dio
X3M
2
1 1
1 1
1 1
1 1
3 3
YLE
tota
l 54
51
48
47
47
45
46
46
44
43
44
Pr
iva
te
All
priv
ate
rad
io
45
49
53
53
52
52
50
50
50
50
50
All
rad
io
81
82
83
82
80
79
79
79
78
78
78
Ice
lan
d
Pub
lic
RÚV
/Rá
s 1
31
30
29
29
29
30
31
29
.. ..
..
(Ag
e: 1
2-80
)
RÚV
/Rá
s 2
42
36
29
40
38
37
37
40
.. ..
..
Pr
iva
te
Bylg
jan
24
25
24
35
37
35
35
36
..
.. ..
All
rad
io
.. 79
79
88
90
89
83
88
..
.. ..
C
on
t.

RADIO
NORDICOM 133 Nordic Public Service Media Map 1/2012
14. C
on
t. Ra
dio
list
en
ing
: Da
ily c
ha
nn
el r
ea
ch
200
0-20
10 (
pe
r ce
nt)
1,2
S
ha
re o
f po
pu
latio
n (
%)
St
atu
s C
ha
nn
el
2000
20
01
2002
20
03
2004
20
05
2006
20
07
2008
20
09
2010
No
rwa
y3 Pu
blic
N
RK/P
1 35
34
36
37
38
38
38
37
48
43
44
(Ag
e: 9
+, fr
om
NRK
/P2
6 6
7 7
7 7
8 7
8 8
8
2008
on
: 12+
)
NRK
/P3
9 8
9 9
9 9
9 8
11
10
11
NRK
tota
l 50
48
50
47
48
48
48
47
56
50
52
Pr
iva
te
P4
23
23
25
25
22
22
22
21
28
29
27
Rad
io N
org
e8
* *
* *
7 8
8 7
14
16
17
Loc
al r
ad
io
12
12
14
15
15
14
13
13
.. ..
8
Oth
er r
ad
io
1 1
1 1
1 1
1 1
.. ..
..
All
rad
io
66
65
68
69
70
70
69
67
78
75
75
Swe
de
n
Pub
lic
SR/P
1 11
12
11
11
12
12
12
11
12
13
12
(Ag
e: 9
-79)
SR/P
2 2
2 2
2 2
2 2
1 2
2 2
SR/P
3 14
13
31
1 11
11
11
12
10
10
11
11
SR/P
49 37
37
35
36
34
35
32
30
31
32
31
SR to
tal
55
54
52
51
50
51
50
46
48
49
48
Pr
iva
te
Priv
ate
loc
al r
ad
io
32
32
31
31
33
35
35
34
33
31
30
Co
mm
un
ity ra
dio
2
3 3
1 2
3 3
2 3
3 2
All
rad
io
79
79
77
77
78
80
79
74
75
75
73
1 D
aily
rea
ch
in D
en
ma
rk a
nd
Sw
ed
en
: sh
are
of p
op
ula
tion
wh
o h
ave
list
en
ed
at l
ea
st 5
co
nse
cu
tive
min
ute
s; F
inla
nd
an
d Ic
ela
nd
: a m
inim
um
of 8
an
d 5
min
ute
s, re
spe
ctiv
ely
, du
ring
at l
ea
st o
ne
15-
min
ute
inte
rva
l; N
orw
ay:
200
0-20
07
ba
sed
on
at
lea
st 2
min
ute
s’ li
ste
nin
g, 2
008-
2010
min
imu
m 1
min
ute
’s li
ste
nin
g.
2 D
en
ma
rk, F
inla
nd
, No
rwa
y a
nd
Sw
ed
en
: Ave
rag
e d
aily
list
en
ing
Mo
nd
ay-
Sun
da
y, Ic
ela
nd
: 6-7
da
ys/w
ee
k ex
ce
pt f
or 2
000,
Mo
nd
ay-
Frid
ay.
Surv
ey p
erio
ds:
De
nm
ark
, 4th
qu
art
er
2000
-200
7, th
rou
gh
ou
t th
e y
ea
r 200
8-20
10; F
inla
nd
an
d
No
rwa
y, m
ea
sure
s th
rou
gh
ou
t th
e y
ea
r; Ic
ela
nd
, me
asu
res
in M
arc
h/A
pril
(20
00-2
002,
200
4, 2
007)
or O
ct/
No
v (2
003,
200
5-20
06);
an
d S
we
de
n, A
utu
mn
fig
ure
s. 3
New
me
tho
d in
De
nm
ark
an
d N
orw
ay
from
200
8 fo
rwa
rd: e
lec
tron
ic m
ea
sure
me
nt (
pp
m).
Da
ta a
re n
ot c
om
pa
rab
le w
ith p
revi
ou
s ye
ars
.4
Fro
m 2
009
on
wa
rds
the
ba
se p
op
ula
tion
is th
e F
inn
ish
- an
d S
we
dis
h-s
pe
aki
ng
po
pu
latio
n (
exc
lud
ing
the
Åla
nd
isla
nd
s). U
ntil
200
8 Fi
nn
ish
-sp
ea
kin
g p
op
ula
tion
on
ly.
5 T
he
fifth
FM
ne
t (FM
5): T
V2
Rad
io s
hu
t do
wn
in m
id 2
008
to b
e re
pla
ce
d b
y N
OVA
FM
. Re
ac
h 2
008
sho
ws
an
ave
rag
e o
f th
e tw
o.
6 T
he
six
th F
M n
et (
FM6)
: PO
P FM
sta
rte
d s
erv
ice
s in
Se
pte
mb
er 2
010,
an
d re
pla
ce
d R
ad
io 1
00 F
M a
s c
on
ce
ssio
n h
old
er.
7 I
nc
lud
ing
the
two
na
tion
wid
e ra
dio
co
nc
ess
ion
s FM
5 a
nd
FM
6, is
sue
d in
200
3. C
on
ce
ssio
n h
old
ers
FM
5: S
ky R
ad
io (
2003
-200
5),
TV2
Rad
io (
2007
-mid
-200
8) a
nd
NO
VA F
M (
from
mid
-200
8); F
M6:
Ra
dio
100
FM
fro
m 2
003,
rep
lac
ed
by
POP
FM in
201
0.
8 P
rior t
o th
e c
ha
nn
el’s
sa
le to
SBS
Ra
dio
AS
in S
prin
g 2
008,
Ra
dio
No
rge
wa
s c
alle
d K
an
al 2
4.9
Da
ta in
clu
de
bo
th th
e n
atio
na
l (P4
Rik
s) a
nd
reg
ion
al (
P4 L
oka
l) tr
an
smis
sio
ns.
No
te: D
iffe
ren
t me
tho
ds
ha
ve b
ee
n u
sed
, wh
ich
imp
airs
co
mp
ara
bili
ty b
etw
ee
n c
ou
ntr
ies
an
d y
ea
rs. D
ata
sh
ou
ld b
e ta
ken
as
ind
ica
tors
of t
he
tre
nd
an
d le
vel o
f lis
ten
ing
. Da
ta in
clu
de
list
en
ing
to ra
dio
, irre
spe
ctiv
e o
f pla
tform
.
Sou
rce
s: T
NS
Ga
llup
De
nm
ark
, Fin
np
an
el,
RÚV,
Ca
pa
ce
nt,
NRK
/TN
S G
allu
p N
orw
ay,
TNS
Sifo
(p
revi
ou
sly
RUA
B/Si
fo M
ed
ia).

NORDICOM 134 Nordic Public Service Media Map 1/2012
RADIO
15. Radio listening: Daily channel reach by sex and age in 2010 (per cent)1,2
Share of population (%)
Denmark DR/P1 DR/P2 DR/P3 DR/P4 total DR total All private radio All radio
All 8 4 23 40 64 34 77
Sex
Men 8 4 27 40 66 33 64
Women 8 5 20 41 62 34 77
Age
12-24 3 0 22 25 46 42 64
25-39 4 1 39 18 54 43 75
40-59 10 2 25 45 67 37 78
60+ 13 13 7 65 81 15 85
YLE Radio YLE Radio All privateFinland YLE Radio 1 YleX Suomi YLE Puhe Vega & Extrem YLE total radio All radio
All 9 6 29 2 3 44 50 78
Sex
Men 8 7 30 2 3 44 50 78
Women 11 5 28 2 3 43 49 79
Age
9-14 3 4 6 1 2 16 50 59
15-24 2 11 5 1 2 19 57 67
25-34 2 14 8 1 2 25 60 72
35-44 4 6 16 2 2 26 65 77
45-54 8 4 34 2 2 44 59 83
55-64 13 2 52 3 4 66 41 87
65+ 25 2 58 5 5 79 24 88
Norway NRK/P1 NRK/P2 NRK/P3 NRK total P4 Radio Norge Local radio All radio
All 44 8 11 52 27 17 8 75
Sex
Men 44 8 12 .. 28 19 8 77
Women 44 8 9 .. 26 15 8 74
Age
12-19 30 2 8 35 25 15 10 62
20-34 22 5 22 40 31 23 11 71
35-44 36 6 13 45 34 18 8 74
45-54 50 7 7 54 33 21 8 80
55-64 62 12 5 66 23 12 5 81
65+ 70 16 3 76 13 8 4 83
Cont.
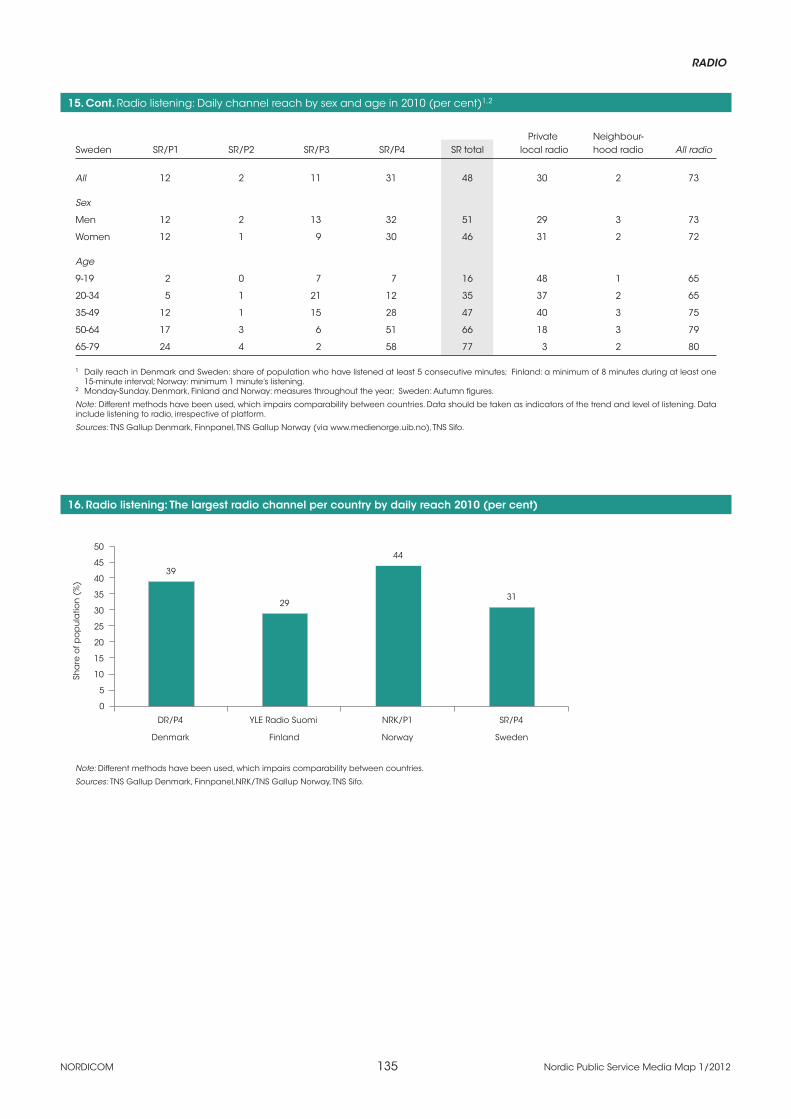
RADIO
NORDICOM 135 Nordic Public Service Media Map 1/2012
15. Cont. Radio listening: Daily channel reach by sex and age in 2010 (per cent)1,2
Private Neighbour-Sweden SR/P1 SR/P2 SR/P3 SR/P4 SR total local radio hood radio All radio
All 12 2 11 31 48 30 2 73
Sex
Men 12 2 13 32 51 29 3 73
Women 12 1 9 30 46 31 2 72
Age
9-19 2 0 7 7 16 48 1 65
20-34 5 1 21 12 35 37 2 65
35-49 12 1 15 28 47 40 3 75
50-64 17 3 6 51 66 18 3 79
65-79 24 4 2 58 77 3 2 80
1 Daily reach in Denmark and Sweden: share of population who have listened at least 5 consecutive minutes; Finland: a minimum of 8 minutes during at least one 15-minute interval; Norway: minimum 1 minute’s listening.
2 Monday-Sunday. Denmark, Finland and Norway: measures throughout the year; Sweden: Autumn figures.
Note: Different methods have been used, which impairs comparability between countries. Data should be taken as indicators of the trend and level of listening. Data include listening to radio, irrespective of platform.
Sources: TNS Gallup Denmark, Finnpanel, TNS Gallup Norway (via www.medienorge.uib.no), TNS Sifo.
16. Radio listening: The largest radio channel per country by daily reach 2010 (per cent)
Note: Different methods have been used, which impairs comparability between countries.
Sources: TNS Gallup Denmark, Finnpanel,NRK/TNS Gallup Norway, TNS Sifo.
39
29
44
31
0
5
10
15
20
25
30
35
40
45
50
DR/P4 YLE Radio Suomi NRK/P1 SR/P4
Denmark Finland Norway Sweden
Sha
re o
f po
pu
latio
n (
%)

NORDICOM 136 Nordic Public Service Media Map 1/2012
RADIO
17. Total daily radio listening time 2000-2011 (minutes)1,2
Denmark3 Finland4 Iceland Norway3,5 Sweden
Year (Age: 12+) (Age: 9+) (Age 12-80) (Age: 9+/12+) (Age: 9-79)
2000 197 201 204 135 174
2001 194 208 203 128 174
2002 187 217 188 137 163
2003 189 206 236 145 163
2004 190 202 242 152 163
2005 182 197 240 146 168
2006 179 194 237 137 174
2007 179 196 230 132 154
2008 131 195 112 97 153
2009 127 191 5 117 98 151
2010 123 190 111 100 140
2011 121 188 115 99 136
1 Average daily listening Monday-Sunday (Iceland 6-7 days/week).2 Survey periods: Denmark, 4th quarter each year 2000-2007, full year 2008-2010; Finland and Norway, measures throughout the year; Iceland, measures in March/April
(2000-2002, 2004, 2007) or Oct/Nov (2003, 2005-2006, 2008-2010); and Sweden, Autumn figures. 3 Denmark, Iceland and Norway: new method from 2008 forward (electronic measurement, ppm). Data are not comparable to previous years.4 From 2009 onwards the base population is the Finnish- and Swedish-speaking population (excluding the Åland islands). Until 2008 Finnish-speaking population only. 5 2000-2007: age 9+, 2008-2010: age 12+.
Note: Different methods have been used, which impairs comparability between countries and years. Data should be taken as indicators of the trend and level of listen-ing. Data include listening to radio, irrespective of platform.
Sources: TNS Gallup Denmark, Finnpanel, Social Science Institute at University of Iceland, Capacent, NRK/ TNS Gallup Norway (www.medienorge.uib.no), TNS Sifo (previously RUAB/Sifo Media).
18. Public service radio audience shares 2000-2011 (per cent)
Share of daily listening time (%)
2000 2001 2002 2003 2004 2005 2006 2007 2008 2009 2010 2011
DR1 66 67 68 70 68 71 72 70 75 76 80 78
YLE2 60 56 51 50 50 51 52 53 52 52 53 54
RÚV1 56 52 55 52 52 53 51 54 54 55 47 55
NRK1 59 60 59 59 60 61 62 62 68 63 66 63
SR 66 66 64 66 63 63 63 63 64 66 69 69
1 Denmark, Iceland and Norway: new method from 2008 forward (electronic measurement, ppm). Data are not comparable to previous years.2 From 2009 onwards the base population is the Finnish- and Swedish-speaking population (excluding the Åland islands). Until 2008 Finnish-speaking population only.
Note: Different methods have been used, which impairs comparability between countries and years. Data should be taken as indicators of the trend and level of listening. Data include listening to radio, irrespective of platform.
Sources: DR, TNS Gallup Denmark, Finnpanel, Capacent, NRK/TNS Gallup Norway, TNS Sifo (previously RUAB/Sifo Media).

RADIO
NORDICOM 137 Nordic Public Service Media Map 1/2012
19. Public service radio audience shares 2000-2011 (per cent)
1 Denmark, Iceland and Norway: new method from 2008 forward (electronic measurement, ppm). Data are not com-parable to previous years.
2 From 2009 onwards the base population is the Finnish- and Swedish-speaking population (excluding the Åland islands). Until 2008 Finnish-speaking population only.
Note: Different methods have been used, which impairs comparability between countries and years. Data should be taken as indicators of the trend and level of listening. Data include listening to radio, irrespective of platform.
Sources: DR, TNS Gallup Denmark, Finnpanel, Capacent, NRK/ TNS Gallup Norway, TNS Sifo (previously RUAB/Sifo Media).
0
10
20
30
40
50
60
70
80
90
2000 2001 2002 2003 2004 2005 2006 2007 2008 2009 2010 2011
Sha
re o
f lis
ten
ing
tim
e (
%)
DR1 YLE2 RÚV1 NRK1 SR

NORDICOM 138 Nordic Public Service Media Map 1/2012
RADIO
20. Public service radio audience shares by age 2000-2010 (per cent)1
Share of daily listening time (%)
2000 2001 2002 2003 2004 2005 2006 2007 2008 2009 2010
Denmark2
DR All 65 67 68 70 66 71 72 70 75 76 80
Age Age
12-24 32 .. .. .. 35 .. .. .. 12-24 55 57 61
25-39 52 .. .. .. 49 .. .. .. 25-39 59 58 65
40-59 71 .. .. .. 70 .. .. .. 40-59 74 75 79
60+ 86 .. .. .. 90 .. .. .. 60+ 91 94 95
Finland3
YLE All 60 56 51 50 50 51 53 53 52 52 53
Age
9-14 23 20 16 17 21 19 19 17 19 18 19
15-24 29 26 26 31 33 32 35 30 26 23 22
25-34 31 28 24 25 28 27 28 26 26 27 26
35-44 41 36 29 28 29 28 29 29 27 26 27
45-54 63 58 49 47 46 45 47 46 43 43 44
55-64 81 74 73 71 66 67 68 68 69 67 68
65+ 89 88 86 83 81 81 83 84 84 84 85
Norway2
NRK All 59 60 59 59 60 61 62 62 68 63 66
Age Age
9-19 38 32 29 33 29 29 27 28 12-19 47 40 44
20-29 35 35 33 34 36 38 37 29 20-34 50 44 47
30-39 39 40 37 38 40 41 41 34 35-44 47 44 49
40-49 55 55 52 53 53 53 52 34 45-54 64 57 57
50-59 73 74 72 70 72 73 73 20 55-64 77 74 76
60-69 87 86 87 86 86 86 87 9 65+ 91 90 89
70+ 94 93 93 92 92 91 92 2
Sweden
SR All 55 54 52 51 50 51 50 46 48 49 48
Age
9-19 20 19 17 18 17 18 17 16 17 17 16
20-34 43 41 38 37 37 38 38 33 34 35 35
35-49 57 56 54 53 51 50 48 44 44 48 47
50-64 77 77 75 73 71 73 69 66 68 68 66
65-79 77 79 77 77 77 80 79 75 78 79 77
1 Average daily listening Monday-Sunday. Survey periods: Denmark, 4th quarter 2000-2007, throughout the year 2008-2010 ; Finland and Norway, measures throughout the year; and Sweden, Autumn figures.
2 New method in Denmark and Norway from 2008 forward: electronic measurement (ppm). Data are not comparable with previous years.3 From 2009 onwards the base population is the Finnish- and Swedish-speaking population (excluding the Åland islands). Until 2008 Finnish-speaking population only.
Note: Different methods have been used, which impairs comparability between countries and years. Data should be taken as indicators of the trend and level of listening.
Sources: TNS Gallup Denmark, Finnpanel, NRK/TNS Gallup Norway, TNS Sifo (previously RUAB/Sifo Media).

RADIO
NORDICOM 139 Nordic Public Service Media Map 1/2012
21. R
ad
io c
ha
nn
el a
ud
ien
ce
sh
are
s 20
00-2
010
(pe
r c
en
t)1,
2
Sh
are
of d
aily
list
en
ing
tim
e (
%)
St
atu
s C
ha
nn
el
2000
20
01
2002
20
03
2004
20
05
2006
20
07
2008
20
09
2010
De
nm
ark
3 Pu
blic
D
R/P1
7
6 6
6 6
7 6
6 5
6 7
(Ag
e: 1
2+)
D
R/P2
4
3 3
4 4
4 4
4 4
4 4
DR/
P3
21
21
20
20
19
20
22
21
20
20
20
DR/
P4
34
37
39
40
38
39
39
37
42
43
44
DR
oth
er4
.. ..
.. ..
1 1
1 2
4 3
5
DR
tota
l 66
67
68
70
68
71
72
70
75
76
80
Pr
iva
te
TV2
Rad
io /
NO
VA F
M5
* *
* *
* *
* 4
1 5
5
POP
FM6
* *
* *
* *
* *
* *
1
Rad
io 1
00 F
M
* *
* ..
6 7
8 6
7 7
5
Rad
io S
oft
* *
* *
* *
* *
2 1
1
The
Vo
ice
, to
tal
* *
* *
* *
* *
2 2
2
All
co
mm
erc
ial r
ad
io
31
29
28
27
31
27
26
28
26
23
20
Oth
er r
ad
io7
4 4
4 3
3 3
3 3
.. ..
..
Tota
l 10
0 10
0 10
0 10
0 10
0 10
0 10
0 10
0 10
0 10
0 10
0
Tota
l lis
ten
ing
tim
e (m
inu
tes)
19
7 19
4 18
7 18
9 19
0 18
2 17
9 17
9 13
1 12
7 12
3
Fin
lan
d8
Pub
lic
YLE
Rad
io 1
8
8 7
8 8
8 9
8 8
7 7
(Ag
e: 9
+)
Yl
eX
6
6 6
6 7
6 6
6 5
5 4
YLE
Rad
io S
uo
mi
44
41
37
35
34
36
36
38
38
36
37
YLE
Puh
e
* *
* *
* *
* *
* 1
2
YLE
Rad
io V
eg
a &
Ra
dio
X3M
1
1 1
1 0
1 0
0 0
3 3
YLE
tota
l 60
56
51
50
50
51
52
53
52
52
53
Pr
iva
te
All
priv
ate
rad
io
41
44
49
50
50
49
48
47
48
48
46
Tota
l 10
0 10
0 10
0 10
0 10
0 10
0 10
0 10
0 10
0 10
0 10
0
Tota
l lis
ten
ing
tim
e (m
inu
tes)
20
1 20
8 21
7 20
6 20
2 19
7 19
4 19
6 19
5 19
1 19
0
Ice
lan
d3
Pub
lic
RÚV
/Rá
s 1
26
24
27
23
21
26
26
24
18
20
16
(Ag
e: 1
2-80
)
RÚV
/Rá
s 2
30
28
28
29
31
27
25
29
35
36
32
RÚV
tota
l 56
52
55
52
52
53
51
54
54
55
47
Pr
iva
te
Bylg
jan
14
17
18
22
24
22
24
24
33
30
35
Oth
er
30
31
27
26
24
25
25
23
13
15
18
Tota
l 10
0 10
0 10
0 10
0 10
0 10
0 10
0 10
0 10
0 10
0 10
0
Tota
l lis
ten
ing
tim
e (m
inu
tes)
20
4 20
3 18
8 23
6 24
2 24
0 23
7 23
0 11
2 11
7 11
1
C
on
t.

NORDICOM 140 Nordic Public Service Media Map 1/2012
RADIO21
. Co
nt.
Rad
io c
ha
nn
el a
ud
ien
ce
sh
are
s 20
00-2
010
(pe
r ce
nt)
1,2
Sh
are
of d
aily
list
en
ing
tim
e (
%)
St
atu
s C
ha
nn
el
2000
20
01
2002
20
03
2004
20
05
2006
20
07
2008
20
09
2010
No
rwa
y3 Pu
blic
N
RK/P
1 47
48
48
48
48
49
51
51
58
53
54
(Ag
e: 9
+, fr
om
NRK
/P2
4 4
4 5
5 5
5 5
4 5
6
2008
on
: 12+
)
NRK
/P3
8 7
7 6
7 7
6 6
6 5
6
NRK
tota
l 59
60
59
59
60
61
62
62
68
63
66
Pr
iva
te
P4
28
28
28
27
22
22
22
22
21
22
21
Rad
io N
org
e9
* *
* *
5 5
4 5
8 9
10
Loc
al r
ad
io
12
12
13
13
12
11
10
10
2 4
4
Oth
er r
ad
io
1 1
1 1
1 1
1 2
1 1
–
Tota
l 10
0 10
0 10
0 10
0 10
0 10
0 10
0 10
0 10
0 10
0 10
0
Tota
l lis
ten
ing
tim
e (m
inu
tes)
13
5 12
8 13
7 14
5 15
2 14
6 13
7 13
2 97
98
10
0
Swe
de
n
Pub
lic
SR/P
1 8
8 8
9 ..
8 10
10
9
10
11
(Ag
e: 9
-79)
SR/P
2 1
1 1
1 ..
1 1
1 1
1 1
SR/P
3 11
11
9
10
.. 10
10
10
10
9
10
SR/P
410
45
45
46
46
.. 43
42
42
42
45
46
SR to
tal
66
66
64
66
63
63
63
63
64
66
68
Pr
iva
te
Priv
ate
loc
al r
ad
io
29
29
29
28
30
30
30
30
29
27
26
Oth
er r
ad
io
5 6
7 6
7 7
7 7
7 7
6
Tota
l 10
0 10
0 10
0 10
0 10
0 10
0 10
0 10
0 10
0 10
0 10
0
Tota
l lis
ten
ing
tim
e (m
inu
tes)
17
4 17
4 16
3 16
3 16
3 16
8 17
4 15
4 15
3 15
1 14
0
1 A
vera
ge
da
ily li
ste
nin
g M
on
da
y-Su
nd
ay.
2 S
urv
ey p
erio
ds:
De
nm
ark
, 4th
qu
art
er 2
000-
2007
an
d th
rou
gh
ou
t th
e y
ea
r 200
8-20
10; F
inla
nd
an
d N
orw
ay,
me
asu
res
thro
ug
ho
ut t
he
ye
ar;
Ice
lan
d, m
ea
sure
s in
Ma
rch
/Ap
ril (
2000
-200
2, 2
004,
200
7) o
r Oc
t/N
ov
(200
3, 2
005-
2006
, 200
8-20
10);
an
d S
we
de
n, A
utu
mn
fig
ure
s. 3
De
nm
ark
, Ic
ela
nd
an
d N
orw
ay:
new
me
tho
d fr
om
200
8 fo
rwa
rd (
ele
ctro
nic
me
asu
rem
en
t, p
pm
). D
ata
are
no
t co
mp
ara
ble
to p
revi
ou
s ye
ars
.4
A s
ele
ctio
n o
f dig
ital D
R c
ha
nn
els
.5
Th
e fi
fth F
M n
et (
FM5)
: TV
2 Ra
dio
sh
ut d
ow
n in
mid
-200
8 to
be
rep
lac
ed
by
NO
VA F
M.
6 T
he
six
th F
M n
et (
FM6)
: PO
P FM
sta
rte
d s
erv
ice
s in
Se
pte
mb
er 2
010,
an
d re
pla
ce
d R
ad
io 1
00 F
M a
s c
on
ce
ssio
n h
old
er.
7 O
the
r ra
dio
: Fo
reig
n a
nd
un
ide
ntifi
ed
rad
io s
tatio
ns.
No
t in
clu
de
d a
fter 2
007.
8 F
rom
200
9 o
nw
ard
s th
e b
ase
po
pu
latio
n is
the
Fin
nis
h- a
nd
Sw
ed
ish
-sp
ea
kin
g p
op
ula
tion
(ex
clu
din
g th
e Å
lan
d is
lan
ds)
. Un
til 2
008
Fin
nis
h-s
pe
aki
ng
po
pu
latio
n o
nly
. 9
Prio
r to
the
ch
an
ne
l’s s
ale
to S
BS R
ad
io A
S in
Sp
ring
200
8, R
ad
io N
org
e w
as
ca
lled
Ka
na
l 24.
10 D
ata
inc
lud
e b
oth
na
tion
al (
P4 R
iks)
an
d re
gio
na
l (P4
Lo
kal)
tra
nsm
issi
on
s.
No
te: D
iffe
ren
t me
tho
ds
ha
ve b
ee
n u
sed
, wh
ich
imp
airs
co
mp
ara
bili
ty b
etw
ee
n c
ou
ntr
ies
an
d y
ea
rs. D
ata
sh
ou
ld b
e ta
ken
as
ind
ica
tors
of t
he
tre
nd
an
d le
vel o
f lis
ten
ing
. Da
ta in
clu
de
list
en
ing
to ra
dio
, irre
spe
ctiv
e o
f pla
tform
.
Sou
rce
s: T
NS
Ga
llup
De
nm
ark
, Fin
np
an
el,
Ca
pa
ce
nt,
NRK
/ TN
S G
allu
p N
orw
ay,
SR a
nd
TN
S Si
fo (
pre
vio
usl
y RU
AB/
Sifo
Me
dia
).

RADIO
NORDICOM 141 Nordic Public Service Media Map 1/2012
22. Radio channel audience shares 2010 (per cent)
Denmark Norway
Finland Sweden
Iceland
Note: Average daily listening Monday-Sunday. Data include listening to radio, irrespective of platform. Public service radio marked with colour.
Sources: TNS Gallup Denmark, Finnpanel, Capacent, NRK/TNS Gallup Norway, SR and TNS Sifo.
DR/P1 7%
DR/P2 4%
DR/P3 20%
DR/P4 44%
DR other 5%
All commercial radio 20%
RÚV/Rás 1 16%
RÚV/Rás 2 32%
Bylgjan 35%
Other 18%
NRK/P1 54%
NRK/P2 6%
NRK/P3 6%
P4 21%
Radio Norge 10%
Local radio 4%
SR/P1 11%
SR/P2 1%
SR/P3 10%
SR/P4 46%
Private local radio 26%
Other radio 6%YLE Radio1 7%
YleX 4%
YLE Radio
Suomi 37%
YLE Puhe 2%YLE Radio Vega
& Radio X3M 3%
All private radio
46%
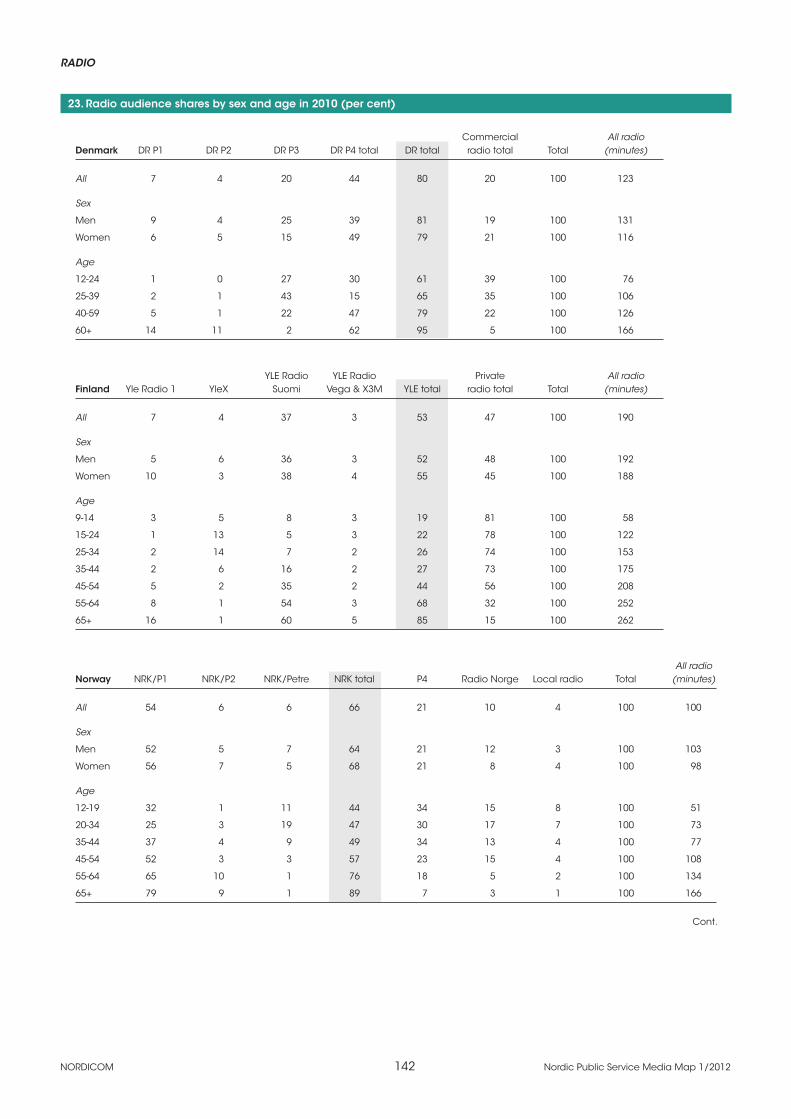
NORDICOM 142 Nordic Public Service Media Map 1/2012
RADIO
23. Radio audience shares by sex and age in 2010 (per cent)
Commercial All radio Denmark DR P1 DR P2 DR P3 DR P4 total DR total radio total Total (minutes)
All 7 4 20 44 80 20 100 123
Sex
Men 9 4 25 39 81 19 100 131
Women 6 5 15 49 79 21 100 116
Age
12-24 1 0 27 30 61 39 100 76
25-39 2 1 43 15 65 35 100 106
40-59 5 1 22 47 79 22 100 126
60+ 14 11 2 62 95 5 100 166
YLE Radio YLE Radio Private All radio Finland Yle Radio 1 YleX Suomi Vega & X3M YLE total radio total Total (minutes)
All 7 4 37 3 53 47 100 190
Sex
Men 5 6 36 3 52 48 100 192
Women 10 3 38 4 55 45 100 188
Age
9-14 3 5 8 3 19 81 100 58
15-24 1 13 5 3 22 78 100 122
25-34 2 14 7 2 26 74 100 153
35-44 2 6 16 2 27 73 100 175
45-54 5 2 35 2 44 56 100 208
55-64 8 1 54 3 68 32 100 252
65+ 16 1 60 5 85 15 100 262
All radio Norway NRK/P1 NRK/P2 NRK/Petre NRK total P4 Radio Norge Local radio Total (minutes)
All 54 6 6 66 21 10 4 100 100
Sex
Men 52 5 7 64 21 12 3 100 103
Women 56 7 5 68 21 8 4 100 98
Age
12-19 32 1 11 44 34 15 8 100 51
20-34 25 3 19 47 30 17 7 100 73
35-44 37 4 9 49 34 13 4 100 77
45-54 52 3 3 57 23 15 4 100 108
55-64 65 10 1 76 18 5 2 100 134
65+ 79 9 1 89 7 3 1 100 166
Cont.

RADIO
NORDICOM 143 Nordic Public Service Media Map 1/2012
23. Cont. Radio audience shares by sex and age in 2010 (per cent)
Private Other All radio Sweden SR/P1 SR/P2 SR/P3 SR/P4 SR total local radio radio Total (minutes)
All 11 1 10 46 68 26 6 100 140
Sex
Men 10 1 13 44 67 27 6 100 147
Women 12 1 7 49 70 27 4 100 132
Age
9-19 2 0 8 8 19 69 12 100 52
20-34 4 1 25 15 46 46 8 100 114
35-49 8 0 13 32 54 38 8 100 144
50-64 11 2 4 63 80 15 6 100 179
65-79 20 2 1 72 96 1 3 100 209
Note: Average daily listening Monday-Sunday. Survey periods: Denmark, Finland, Norway: measures throughout whole years; Sweden: Autumn figures.
Sources: TNS Gallup Denmark, Finnpanel and YLE Audience Research, NRK/TNS Gallup Norway, SR, TNS Sifo.


145
Internet content, access and use
Table 1 Public service companies on the web: Services and content 2011 (Spring) 146
Table 2 Top ten web sites, ranked by number of unique visitors per week 2011, week 11 (March) 147
Table 3 Top ten media web sites, ranked by number of unique visitors per week 2011, week 11 (March) 149
Table 4 Top ten mobile web sites, ranked by number of unique visitors per week 2011, week 42 (mid October) 151
Table 5 Access to Internet at home 2000-2010 (per cent) 152
Table 6 Internet use: Individuals using Internet daily/almost daily 2003-2011 (per cent) 152
Figure 7 Internet use: Individuals using Internet daily/almost daily 2003-2011 (per cent) 153
Table 8 Internet use: Individuals using Internet daily/almost daily by sex and age 2003-2010 (per cent) 154
Internet
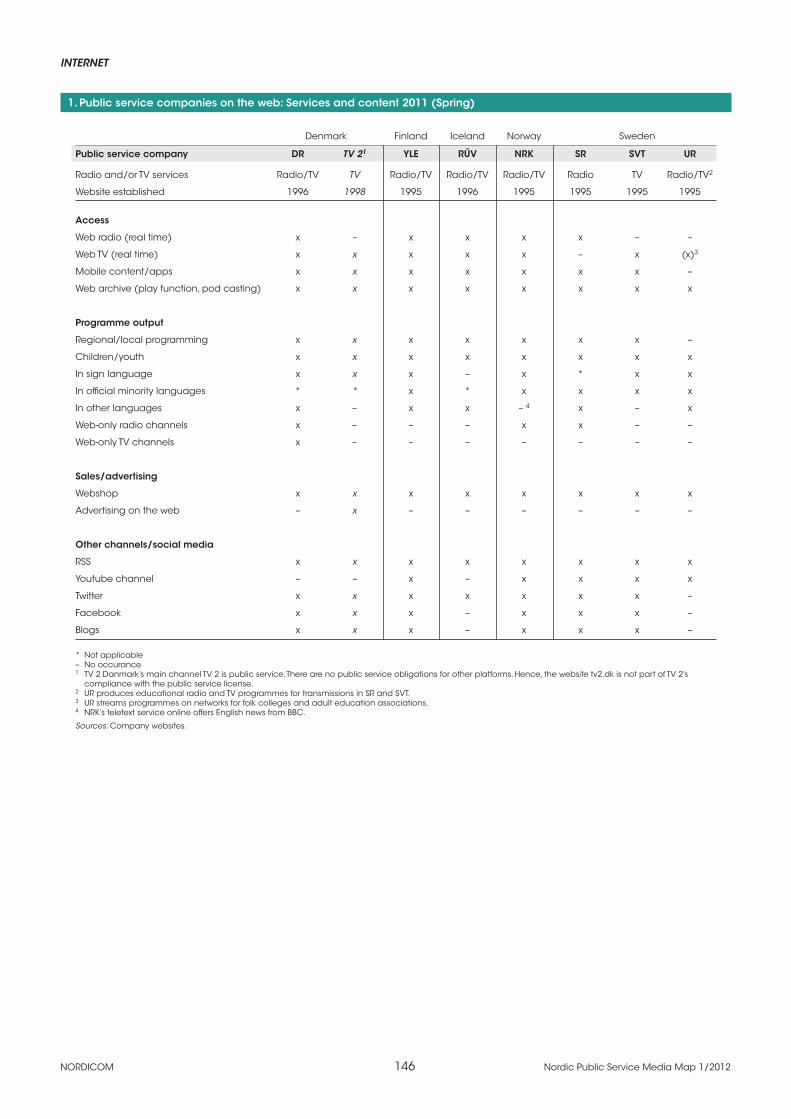
NORDICOM 146 Nordic Public Service Media Map 1/2012
INTERNET
1. Public service companies on the web: Services and content 2011 (Spring)
Denmark Finland Iceland Norway Sweden
Public service company DR TV 21 YLE RÚV NRK SR SVT UR
Radio and/or TV services Radio/TV TV Radio/TV Radio/TV Radio/TV Radio TV Radio/TV2
Website established 1996 1998 1995 1996 1995 1995 1995 1995
Access
Web radio (real time) x – x x x x – –
Web TV (real time) x x x x x – x (x)3
Mobile content/apps x x x x x x x –
Web archive (play function, pod casting) x x x x x x x x
Programme output
Regional/local programming x x x x x x x –
Children/youth x x x x x x x x
In sign language x x x – x * x x
In official minority languages * * x * x x x x
In other languages x – x x – 4 x – x
Web-only radio channels x – – – x x – –
Web-only TV channels x – – – – – – –
Sales/advertising
Webshop x x x x x x x x
Advertising on the web – x – – – – – –
Other channels/social media
RSS x x x x x x x x
Youtube channel – – x – x x x x
Twitter x x x x x x x –
Facebook x x x – x x x –
Blogs x x x – x x x –
* Not applicable– No occurance1 TV 2 Danmark’s main channel TV 2 is public service. There are no public service obligations for other platforms. Hence, the website tv2.dk is not part of TV 2’s compliance with the public service license.2 UR produces educational radio and TV programmes for transmissions in SR and SVT.3 UR streams programmes on networks for folk colleges and adult education associations.4 NRK’s teletext service online offers English news from BBC.
Sources: Company websites.
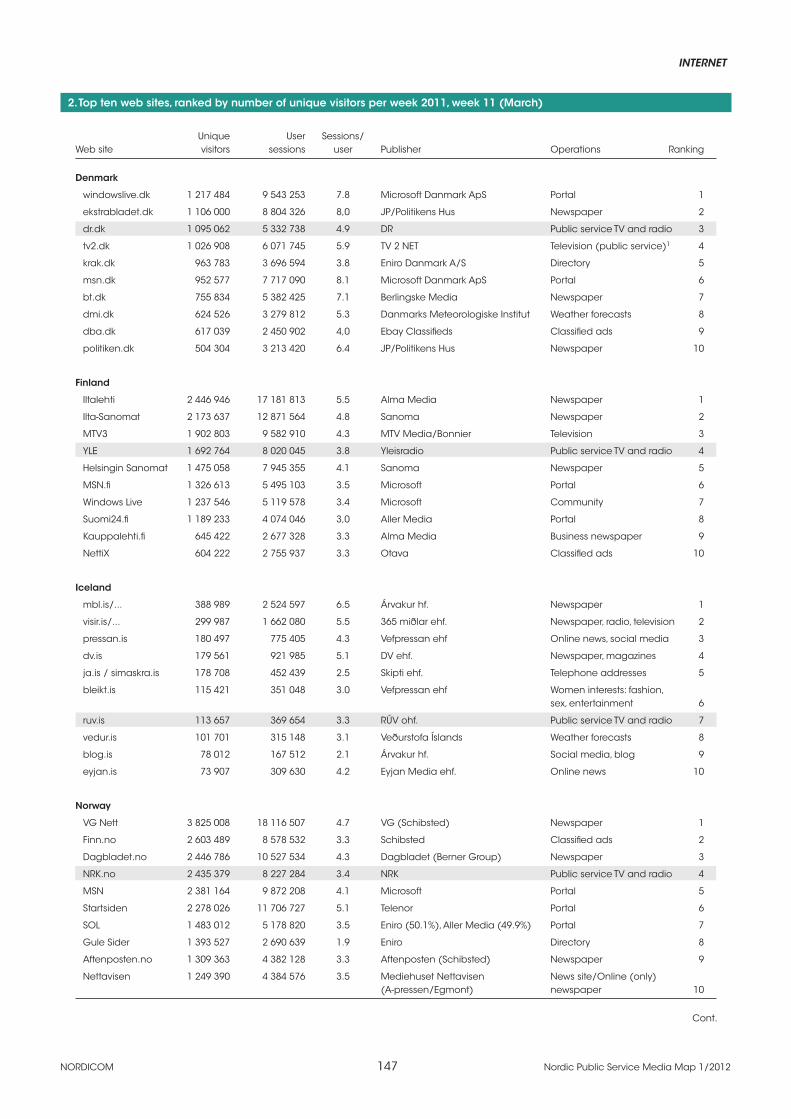
INTERNET
NORDICOM 147 Nordic Public Service Media Map 1/2012
2. Top ten web sites, ranked by number of unique visitors per week 2011, week 11 (March)
Unique User Sessions/Web site visitors sessions user Publisher Operations Ranking
Denmark
windowslive.dk 1 217 484 9 543 253 7.8 Microsoft Danmark ApS Portal 1
ekstrabladet.dk 1 106 000 8 804 326 8,0 JP/Politikens Hus Newspaper 2
dr.dk 1 095 062 5 332 738 4.9 DR Public service TV and radio 3
tv2.dk 1 026 908 6 071 745 5.9 TV 2 NET Television (public service)1 4
krak.dk 963 783 3 696 594 3.8 Eniro Danmark A/S Directory 5
msn.dk 952 577 7 717 090 8.1 Microsoft Danmark ApS Portal 6
bt.dk 755 834 5 382 425 7.1 Berlingske Media Newspaper 7
dmi.dk 624 526 3 279 812 5.3 Danmarks Meteorologiske Institut Weather forecasts 8
dba.dk 617 039 2 450 902 4,0 Ebay Classifieds Classified ads 9
politiken.dk 504 304 3 213 420 6.4 JP/Politikens Hus Newspaper 10
Finland
Iltalehti 2 446 946 17 181 813 5.5 Alma Media Newspaper 1
Ilta-Sanomat 2 173 637 12 871 564 4.8 Sanoma Newspaper 2
MTV3 1 902 803 9 582 910 4.3 MTV Media/Bonnier Television 3
YLE 1 692 764 8 020 045 3.8 Yleisradio Public service TV and radio 4
Helsingin Sanomat 1 475 058 7 945 355 4.1 Sanoma Newspaper 5
MSN.fi 1 326 613 5 495 103 3.5 Microsoft Portal 6
Windows Live 1 237 546 5 119 578 3.4 Microsoft Community 7
Suomi24.fi 1 189 233 4 074 046 3,0 Aller Media Portal 8
Kauppalehti.fi 645 422 2 677 328 3.3 Alma Media Business newspaper 9
NettiX 604 222 2 755 937 3.3 Otava Classified ads 10
Iceland
mbl.is/... 388 989 2 524 597 6.5 Árvakur hf. Newspaper 1
visir.is/... 299 987 1 662 080 5.5 365 miðlar ehf. Newspaper, radio, television 2
pressan.is 180 497 775 405 4.3 Vefpressan ehf Online news, social media 3
dv.is 179 561 921 985 5.1 DV ehf. Newspaper, magazines 4
ja.is / simaskra.is 178 708 452 439 2.5 Skipti ehf. Telephone addresses 5
bleikt.is 115 421 351 048 3.0 Vefpressan ehf Women interests: fashion, sex, entertainment 6
ruv.is 113 657 369 654 3.3 RÚV ohf. Public service TV and radio 7
vedur.is 101 701 315 148 3.1 Veðurstofa Íslands Weather forecasts 8
blog.is 78 012 167 512 2.1 Árvakur hf. Social media, blog 9
eyjan.is 73 907 309 630 4.2 Eyjan Media ehf. Online news 10
Norway
VG Nett 3 825 008 18 116 507 4.7 VG (Schibsted) Newspaper 1
Finn.no 2 603 489 8 578 532 3.3 Schibsted Classified ads 2
Dagbladet.no 2 446 786 10 527 534 4.3 Dagbladet (Berner Group) Newspaper 3
NRK.no 2 435 379 8 227 284 3.4 NRK Public service TV and radio 4
MSN 2 381 164 9 872 208 4.1 Microsoft Portal 5
Startsiden 2 278 026 11 706 727 5.1 Telenor Portal 6
SOL 1 483 012 5 178 820 3.5 Eniro (50.1%), Aller Media (49.9%) Portal 7
Gule Sider 1 393 527 2 690 639 1.9 Eniro Directory 8
Aftenposten.no 1 309 363 4 382 128 3.3 Aftenposten (Schibsted) Newspaper 9
Nettavisen 1 249 390 4 384 576 3.5 Mediehuset Nettavisen News site/Online (only) (A-pressen/Egmont) newspaper 10
Cont.

NORDICOM 148 Nordic Public Service Media Map 1/2012
INTERNET
2. Cont. Top ten web sites, ranked by number of unique visitors per week 2011, week 11 (March)
Unique User Sessions/Web site visitors sessions user Publisher Operations Ranking
Sweden2
Aftonbladet 6 123 658 30 451 349 5.0 Aftonbladet (Schibsted / LO) Newspaper 1
MSN.se 5 642 968 19 986 228 3.5 Microsoft Portal 2
Hotmail 5 208 461 19 527 042 3.7 Microsoft E-mail 3
blocket.se 4 660 418 12 353 197 2.7 Schibsted Classified ads 4
hitta.se 3 764 604 6 781 859 1.8 Schibsted Directory 5
Eniro.se 2 729 882 4 698 910 1.7 Eniro Directory 6
Expressen 2 716 919 10 061 404 3.7 Expressen (Bonnier) Newspaper 7
Messenger 2 467 762 12 216 797 5.0 Microsoft Chat 8
Aftonbladet WebbTV 1 861 077 3 466 773 1.9 Aftonbladet (Schibsted / LO) Web TV 9
Dagens Nyheter 1 855 239 5 471 457 2.9 Dagens Nyheter (Bonnier) Newspaper 10
1 TV 2 Danmark’s main channel TV 2 is public service. There are no public service obligations for other platforms. Hence, the website tv2.dk is not part of TV 2’s compliance with the public service license.2 Networks not included.
Note: Different methods have been used, which impairs comparability between countries. Public service shown in grey.
Sources: FDIM Foreningen av Danske Interaktive Medier, TNS Gallup Finland, Modernus Web Measure (Iceland), TNS Gallup Norway, KIA Index (Sweden).

INTERNET
NORDICOM 149 Nordic Public Service Media Map 1/2012
3. Top ten media web sites, ranked by number of unique visitors per week 2011, week 11 (March)
Unique User Sessions/ RankingWeb site visitors sessions user Publisher Operations in top list
Denmark
ekstrabladet.dk 1 106 000 8 804 326 8.0 JP/Politikens Hus Newspaper 2
dr.dk 1 095 062 5 332 738 4.9 DR Public service TV and radio 3
tv2.dk 1 026 908 6 071 745 5.9 TV2 NET Television (public service)1 4
bt.dk 755 834 5 382 425 7.1 Berlingske Media Newspaper 7
politiken.dk 504 304 3 213 420 6.4 JP/Politikens Hus Newspaper 10
jp.dk 473 803 3 144 134 6.6 JP/Politikens Hus Newspaper 12
berlingske.dk 296 595 1 453 801 4.9 Berlingske Media Newspaper 16
epn.dk 288 295 1 097 437 3.8 JP/Politikens Hus Online business news 17
borsen.dk 201 653 1 413 715 7.0 Dagbladet Børsen A/S Business newspaper 26
business.dk 179 553 458 741 2.6 Berlingske Media Business news 30
Finland
Iltalehti 2 446 946 17 181 813 5.5 Alma Media Newspaper 1
Ilta-Sanomat 2 173 637 12 871 564 4.8 Sanoma Newspaper 2
MTV3 1 902 803 9 582 910 4.3 MTV Media/Bonnier Television 3
YLE 1 692 764 8 020 045 3.8 Yleisradio Public service TV and radio 4
Helsingin Sanomat 1 475 058 7 945 355 4.1 Sanoma Newspaper 5
Taloussanomat 648 213 1 923 245 2.4 Sanoma Online-only business newspaper 10
Kauppalehti.fi 645 422 2 677 328 3.3 Alma Media Business newspaper 11
Nelonen 397 105 912 370 2.1 Sanoma Television 21
Uusi Suomi 339 525 1 041 425 2.5 Kustannusosakeyhtiö Uusi Suomi Online-only newspaper 22
Stara.fi .. 784 627 2.2 Stara Media Online-only magazine 23
Iceland
mbl.is/... 388 989 2 524 597 6.5 Árvakur hf. Newspaper 1
visir.is/... 299 987 1 662 080 5.5 365 miðlar ehf. Newspaper, radio, television 2
pressan.is 180 497 775 405 4.3 Vefpressan ehf Online news, social media 3
dv.is 179 561 921 985 5.1 DV ehf. Newspaper, magazines 4
ruv.is 113 657 369 654 3.3 RÚV ohf. Public service TV and radio 7
eyjan.is 73 907 309 630 4.2 Eyjan Media ehf. Online news 10
vb.is 18 893 48 461 2.6 Myllusetur ehf. Business newspaper 22
vf.is/... 17 685 58 141 3.3 Víkurfréttir ehf. Regional newspaper 23
bb.is 14 881 59 371 4.0 Guttó ehf. Regional newspaper 27
Norway
VG Nett 3 825 008 18 116 507 4.7 VG (Schibsted) Newspaper 1
dagbladet.no 2 446 786 10 527 534 4.3 Dagbladet (Berner Group) Newspaper 3
nrk.no 2 435 379 8 227 284 3.4 NRK Public service TV and radio 4
aftenposten.no 1 309 363 4 382 128 3.3 Aftenposten (Schibsted) Newspaper 9
tv2.no 1 207 609 3 492 382 2.9 TV 2 (A-pressen/Egmont) Television 11
kjendis.no 846 369 1 716 617 2.0 Dagbladet (Berner Group) Newspaper 15
klikk.no 737 234 1 407 634 1.9 Egmont Hjemmet Mortensen Magazines 16
bt.no 472 607 1 593 649 3.4 Bergens Tidende (Schibsted) Regional newspaper 21
seher.no 455 162 1 341 923 2.9 Se og Hør (Aller Media) Celebrity Gossip magazine 22
adressa.no 424 798 1 511 094 3.6 Adresseavisen (Polaris Media) Regional newspaper 23
Cont.

NORDICOM 150 Nordic Public Service Media Map 1/2012
INTERNET
3. Cont. Top ten media web sites, ranked by number of unique visitors per week 2011, week 11 (March)
Unique User Sessions/ RankingWeb site visitors sessions user Publisher Operations in top list
Sweden2
Aftonbladet 6 123 658 30 451 349 5.0 Aftonbladet (Schibsted / LO) Newspaper 1
Expressen 2 716 919 10 061 404 3.7 Expressen (Bonnier) Newspaper 7
Aftonbladet WebbTV 1 861 077 3 466 773 1.9 Aftonbladet (Schibsted / LO) Web TV 9
Dagens Nyheter 1 855 239 5 471 457 2.9 Dagens Nyheter (Bonnier) Newspaper 10
svt.se 1 680 724 4 372 799 2.6 SVT Public service TV 11
svd.se 1 310 972 2 843 282 2.2 Svenska Dagbladet (Schibsted) Newspaper 13
svtplay.se 1 304 956 3 278 766 2.5 SVT Public service TV (Web TV) 14
di.se 1 047 516 3 931 291 3.8 Dagens industri (Bonnier) Business newspaper 16
SR.se 978 486 2 097 347 2.1 SR Public service radio 19
Tv4.se 805 343 1 488 539 1.8 TV4 (Bonnier) Television 21
1 TV 2 Danmark’s main channel TV 2 is public service. There are no public service obligations for other platforms. Hence, the website tv2.dk is not part of TV 2’s compliance with the public service license.2 Networks not included.
Note: Web sites of traditional media only. Different methods have been used, which impairs comparability between countries. Public service shown in grey.
Sources: FDIM Foreningen av Danske Interaktive Medier, TNS Gallup Finland, Modernus Web Measure (Iceland), TNS Gallup Norway, KIA Index (Sweden).
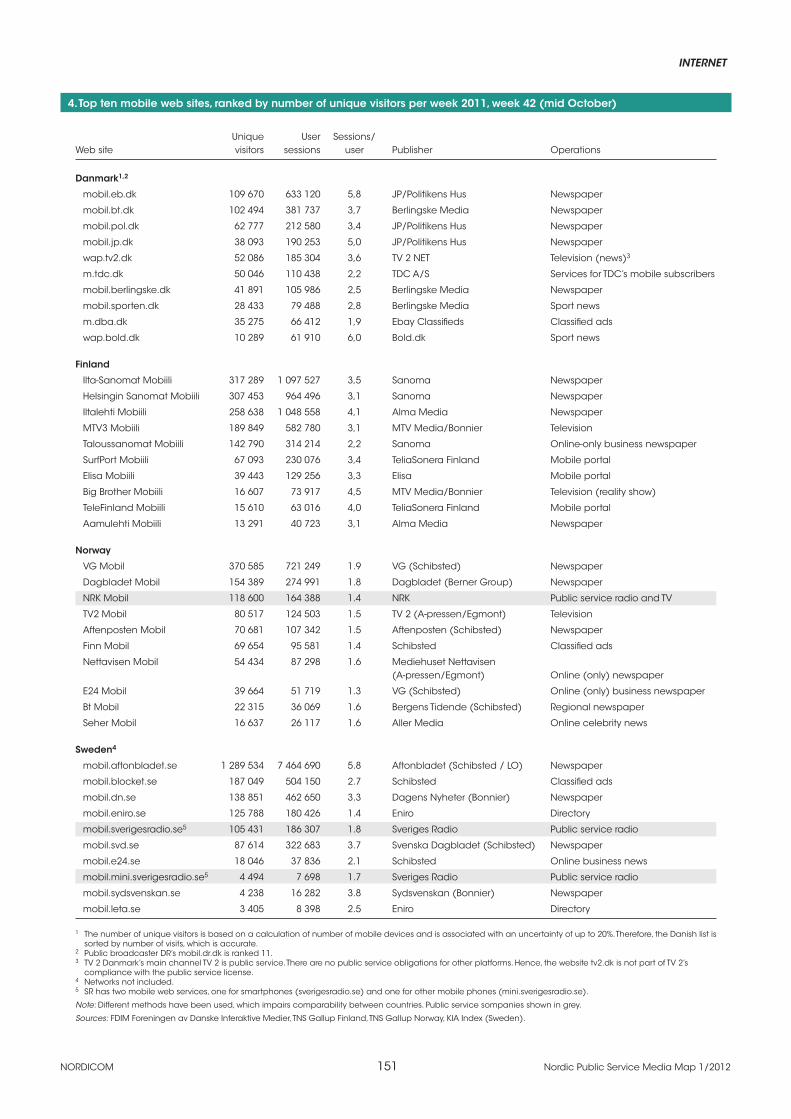
INTERNET
NORDICOM 151 Nordic Public Service Media Map 1/2012
4. Top ten mobile web sites, ranked by number of unique visitors per week 2011, week 42 (mid October)
Unique User Sessions/Web site visitors sessions user Publisher Operations
Danmark1,2
mobil.eb.dk 109 670 633 120 5,8 JP/Politikens Hus Newspaper
mobil.bt.dk 102 494 381 737 3,7 Berlingske Media Newspaper
mobil.pol.dk 62 777 212 580 3,4 JP/Politikens Hus Newspaper
mobil.jp.dk 38 093 190 253 5,0 JP/Politikens Hus Newspaper
wap.tv2.dk 52 086 185 304 3,6 TV 2 NET Television (news)3
m.tdc.dk 50 046 110 438 2,2 TDC A/S Services for TDC’s mobile subscribers
mobil.berlingske.dk 41 891 105 986 2,5 Berlingske Media Newspaper
mobil.sporten.dk 28 433 79 488 2,8 Berlingske Media Sport news
m.dba.dk 35 275 66 412 1,9 Ebay Classifieds Classified ads
wap.bold.dk 10 289 61 910 6,0 Bold.dk Sport news
Finland
Ilta-Sanomat Mobiili 317 289 1 097 527 3,5 Sanoma Newspaper
Helsingin Sanomat Mobiili 307 453 964 496 3,1 Sanoma Newspaper
Iltalehti Mobiili 258 638 1 048 558 4,1 Alma Media Newspaper
MTV3 Mobiili 189 849 582 780 3,1 MTV Media/Bonnier Television
Taloussanomat Mobiili 142 790 314 214 2,2 Sanoma Online-only business newspaper
SurfPort Mobiili 67 093 230 076 3,4 TeliaSonera Finland Mobile portal
Elisa Mobiili 39 443 129 256 3,3 Elisa Mobile portal
Big Brother Mobiili 16 607 73 917 4,5 MTV Media/Bonnier Television (reality show)
TeleFinland Mobiili 15 610 63 016 4,0 TeliaSonera Finland Mobile portal
Aamulehti Mobiili 13 291 40 723 3,1 Alma Media Newspaper
Norway
VG Mobil 370 585 721 249 1.9 VG (Schibsted) Newspaper
Dagbladet Mobil 154 389 274 991 1.8 Dagbladet (Berner Group) Newspaper
NRK Mobil 118 600 164 388 1.4 NRK Public service radio and TV
TV2 Mobil 80 517 124 503 1.5 TV 2 (A-pressen/Egmont) Television
Aftenposten Mobil 70 681 107 342 1.5 Aftenposten (Schibsted) Newspaper
Finn Mobil 69 654 95 581 1.4 Schibsted Classified ads
Nettavisen Mobil 54 434 87 298 1.6 Mediehuset Nettavisen (A-pressen/Egmont) Online (only) newspaper
E24 Mobil 39 664 51 719 1.3 VG (Schibsted) Online (only) business newspaper
Bt Mobil 22 315 36 069 1.6 Bergens Tidende (Schibsted) Regional newspaper
Seher Mobil 16 637 26 117 1.6 Aller Media Online celebrity news
Sweden4
mobil.aftonbladet.se 1 289 534 7 464 690 5.8 Aftonbladet (Schibsted / LO) Newspaper
mobil.blocket.se 187 049 504 150 2.7 Schibsted Classified ads
mobil.dn.se 138 851 462 650 3.3 Dagens Nyheter (Bonnier) Newspaper
mobil.eniro.se 125 788 180 426 1.4 Eniro Directory
mobil.sverigesradio.se5 105 431 186 307 1.8 Sveriges Radio Public service radio
mobil.svd.se 87 614 322 683 3.7 Svenska Dagbladet (Schibsted) Newspaper
mobil.e24.se 18 046 37 836 2.1 Schibsted Online business news
mobil.mini.sverigesradio.se5 4 494 7 698 1.7 Sveriges Radio Public service radio
mobil.sydsvenskan.se 4 238 16 282 3.8 Sydsvenskan (Bonnier) Newspaper
mobil.leta.se 3 405 8 398 2.5 Eniro Directory
1 The number of unique visitors is based on a calculation of number of mobile devices and is associated with an uncertainty of up to 20%. Therefore, the Danish list is sorted by number of visits, which is accurate.
2 Public broadcaster DR’s mobil.dr.dk is ranked 11.3 TV 2 Danmark’s main channel TV 2 is public service. There are no public service obligations for other platforms. Hence, the website tv2.dk is not part of TV 2’s compliance with the public service license.4 Networks not included.5 SR has two mobile web services, one for smartphones (sverigesradio.se) and one for other mobile phones (mini.sverigesradio.se).
Note: Different methods have been used, which impairs comparability between countries. Public service sompanies shown in grey.
Sources: FDIM Foreningen av Danske Interaktive Medier, TNS Gallup Finland, TNS Gallup Norway, KIA Index (Sweden).
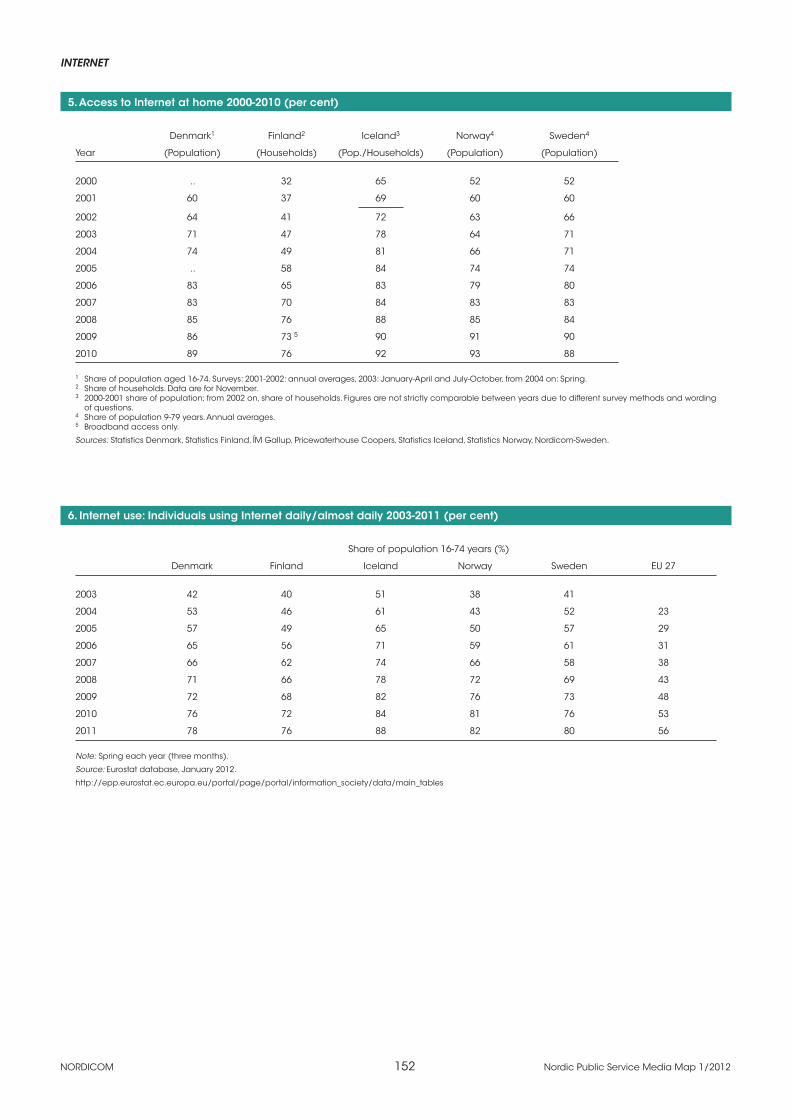
NORDICOM 152 Nordic Public Service Media Map 1/2012
INTERNET
5. Access to Internet at home 2000-2010 (per cent)
Denmark1 Finland2 Iceland3 Norway4 Sweden4
Year (Population) (Households) (Pop./Households) (Population) (Population)
2000 .. 32 65 52 52
2001 60 37 69 60 60
2002 64 41 72 63 66
2003 71 47 78 64 71
2004 74 49 81 66 71
2005 .. 58 84 74 74
2006 83 65 83 79 80
2007 83 70 84 83 83
2008 85 76 88 85 84
2009 86 73 5 90 91 90
2010 89 76 92 93 88
1 Share of population aged 16-74. Surveys: 2001-2002: annual averages, 2003: January-April and July-October, from 2004 on: Spring.2 Share of households. Data are for November.3 2000-2001 share of population; from 2002 on, share of households. Figures are not strictly comparable between years due to different survey methods and wording
of questions.4 Share of population 9-79 years. Annual averages.5 Broadband access only.
Sources: Statistics Denmark, Statistics Finland, ÍM Gallup, Pricewaterhouse Coopers, Statistics Iceland, Statistics Norway, Nordicom-Sweden.
6. Internet use: Individuals using Internet daily/almost daily 2003-2011 (per cent)
Share of population 16-74 years (%)
Denmark Finland Iceland Norway Sweden EU 27
2003 42 40 51 38 41
2004 53 46 61 43 52 23
2005 57 49 65 50 57 29
2006 65 56 71 59 61 31
2007 66 62 74 66 58 38
2008 71 66 78 72 69 43
2009 72 68 82 76 73 48
2010 76 72 84 81 76 53
2011 78 76 88 82 80 56
Note: Spring each year (three months).
Source: Eurostat database, January 2012.
http://epp.eurostat.ec.europa.eu/portal/page/portal/information_society/data/main_tables

INTERNET
NORDICOM 153 Nordic Public Service Media Map 1/2012
7. Internet use: Individuals using Internet daily/almost daily 2003-2011 (per cent)
Note: Spring each year (three months). Population 16-74 years.
Source: Eurostat database, January 2012.
42
78
40
76
51
88
38
82
41
80
23
56
0
10
20
30
40
50
60
70
80
90
100
2003 2004 2005 2006 2007 2008 2009 2010 2011
(%)Denmark Finland Iceland Norway Sweden EU 27
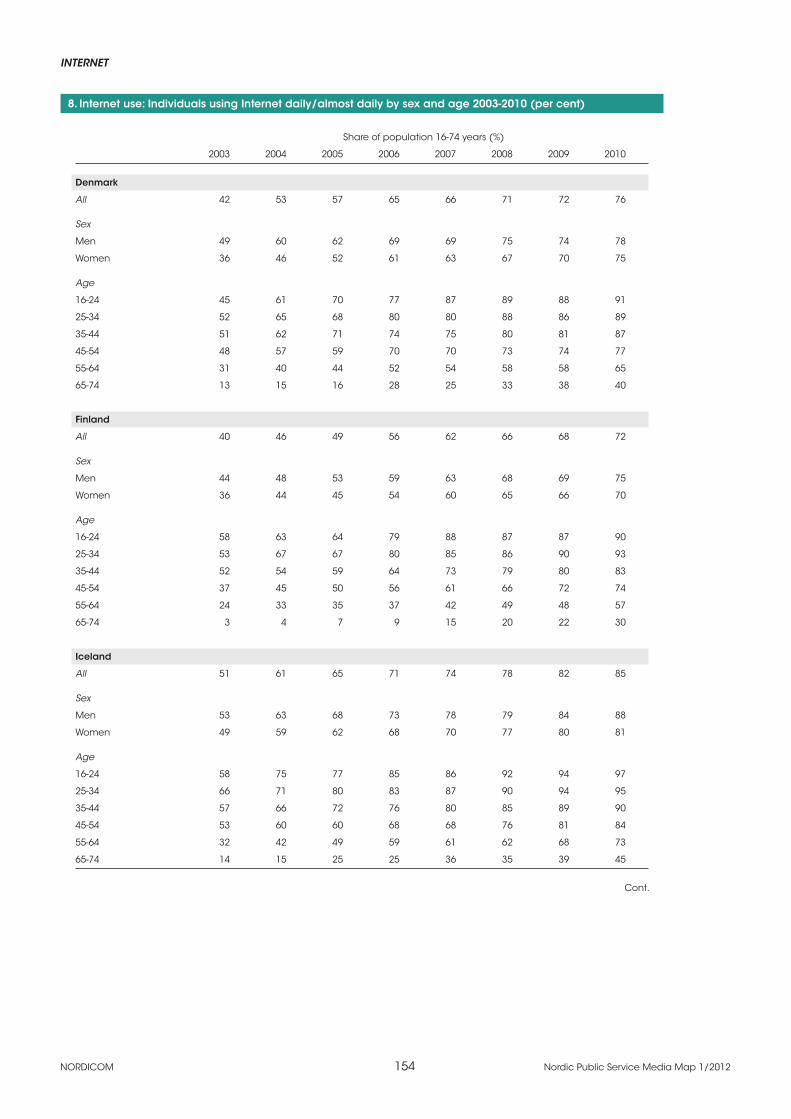
NORDICOM 154 Nordic Public Service Media Map 1/2012
INTERNET
8. Internet use: Individuals using Internet daily/almost daily by sex and age 2003-2010 (per cent)
Share of population 16-74 years (%)
2003 2004 2005 2006 2007 2008 2009 2010
Denmark
All 42 53 57 65 66 71 72 76
Sex
Men 49 60 62 69 69 75 74 78
Women 36 46 52 61 63 67 70 75
Age
16-24 45 61 70 77 87 89 88 91
25-34 52 65 68 80 80 88 86 89
35-44 51 62 71 74 75 80 81 87
45-54 48 57 59 70 70 73 74 77
55-64 31 40 44 52 54 58 58 65
65-74 13 15 16 28 25 33 38 40
Finland
All 40 46 49 56 62 66 68 72
Sex
Men 44 48 53 59 63 68 69 75
Women 36 44 45 54 60 65 66 70
Age
16-24 58 63 64 79 88 87 87 90
25-34 53 67 67 80 85 86 90 93
35-44 52 54 59 64 73 79 80 83
45-54 37 45 50 56 61 66 72 74
55-64 24 33 35 37 42 49 48 57
65-74 3 4 7 9 15 20 22 30
Iceland
All 51 61 65 71 74 78 82 85
Sex
Men 53 63 68 73 78 79 84 88
Women 49 59 62 68 70 77 80 81
Age
16-24 58 75 77 85 86 92 94 97
25-34 66 71 80 83 87 90 94 95
35-44 57 66 72 76 80 85 89 90
45-54 53 60 60 68 68 76 81 84
55-64 32 42 49 59 61 62 68 73
65-74 14 15 25 25 36 35 39 45
Cont.

INTERNET
NORDICOM 155 Nordic Public Service Media Map 1/2012
8. Cont. Internet use: Individuals using Internet daily/almost daily by sex and age 2003-2010 (per cent)
Share of population 16-74 years (%)
2003 2004 2005 2006 2007 2008 2009 2010
Norway
All 38 43 50 59 66 72 76 81
Sex
Men 48 50 58 66 71 77 83 85
Women 28 37 43 51 60 67 70 77
Age
16-24 43 47 60 75 75 91 89 94
25-34 48 55 60 72 80 91 93 97
35-44 46 50 64 65 76 79 85 87
45-54 43 52 51 57 65 68 73 83
55-64 24 29 37 48 47 59 61 67
65-74 10 7 10 19 37 25 39 44
Sweden
All 41 52 57 61 58 69 73 76
Sex
Men 47 57 63 67 64 72 75 78
Women 36 46 50 55 53 65 71 75
Age
16-24 58 64 73 77 75 86 87 88
25-34 55 64 69 74 72 82 91 91
35-44 45 57 66 68 67 77 85 85
45-54 39 52 57 64 59 69 74 81
55-64 33 42 47 45 47 60 60 65
65-74 9 22 13 28 19 27 31 40
EU 27
All .. 23 29 32 38 43 48 53
Sex
Men .. 27 34 36 42 47 52 57
Women .. 18 24 27 34 39 44 49
Age
16-24 .. 34 43 48 59 66 73 78
25-34 .. 33 40 44 51 57 64 70
35-44 .. 26 34 37 42 49 53 60
45-54 .. 20 27 30 35 39 44 50
55-64 .. 12 17 18 23 28 31 36
65-74 .. 4 5 6 8 11 14 17
Note: Spring each year (three months).
Source: Eurostat database, May 2011.
http://epp.eurostat.ec.europa.eu/portal/page/portal/information_society/data/database


157
Demographic & Economic data
1 Population 2000-2011 (inhabitants in thousands) 158
2 Average exchange rates 2000-2011 (1 Euro in national currency) 158
3 Value Added Tax rates 2000-2012 159
Methods & Definitions
4 National media categories included in the advertising tables 161
5 Television audience data 2000-2011. Definitions 162
6 Radio audience data 2000-2011. Definitions 163
Appendix
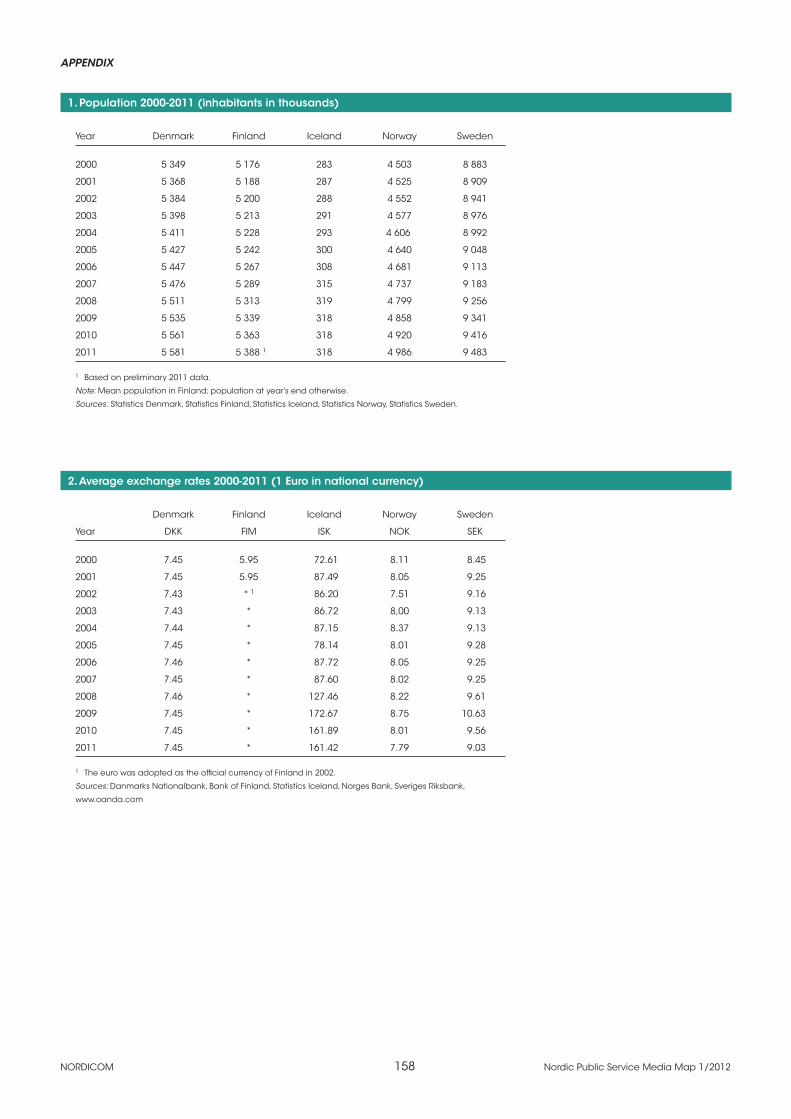
NORDICOM 158 Nordic Public Service Media Map 1/2012
APPENDIX
1. Population 2000-2011 (inhabitants in thousands)
Year Denmark Finland Iceland Norway Sweden
2000 5 349 5 176 283 4 503 8 883
2001 5 368 5 188 287 4 525 8 909
2002 5 384 5 200 288 4 552 8 941
2003 5 398 5 213 291 4 577 8 976
2004 5 411 5 228 293 4 606 8 992
2005 5 427 5 242 300 4 640 9 048
2006 5 447 5 267 308 4 681 9 113
2007 5 476 5 289 315 4 737 9 183
2008 5 511 5 313 319 4 799 9 256
2009 5 535 5 339 318 4 858 9 341
2010 5 561 5 363 318 4 920 9 416
2011 5 581 5 388 1 318 4 986 9 483
1 Based on preliminary 2011 data.
Note: Mean population in Finland; population at year’s end otherwise.
Sources: Statistics Denmark, Statistics Finland, Statistics Iceland, Statistics Norway, Statistics Sweden.
2. Average exchange rates 2000-2011 (1 Euro in national currency)
Denmark Finland Iceland Norway Sweden
Year DKK FIM ISK NOK SEK
2000 7.45 5.95 72.61 8.11 8.45
2001 7.45 5.95 87.49 8.05 9.25
2002 7.43 * 1 86.20 7.51 9.16
2003 7.43 * 86.72 8,00 9.13
2004 7.44 * 87.15 8.37 9.13
2005 7.45 * 78.14 8.01 9.28
2006 7.46 * 87.72 8.05 9.25
2007 7.45 * 87.60 8.02 9.25
2008 7.46 * 127.46 8.22 9.61
2009 7.45 * 172.67 8.75 10.63
2010 7.45 * 161.89 8.01 9.56
2011 7.45 * 161.42 7.79 9.03
1 The euro was adopted as the official currency of Finland in 2002.
Sources: Danmarks Nationalbank, Bank of Finland, Statistics Iceland, Norges Bank, Sveriges Riksbank,
www.oanda.com
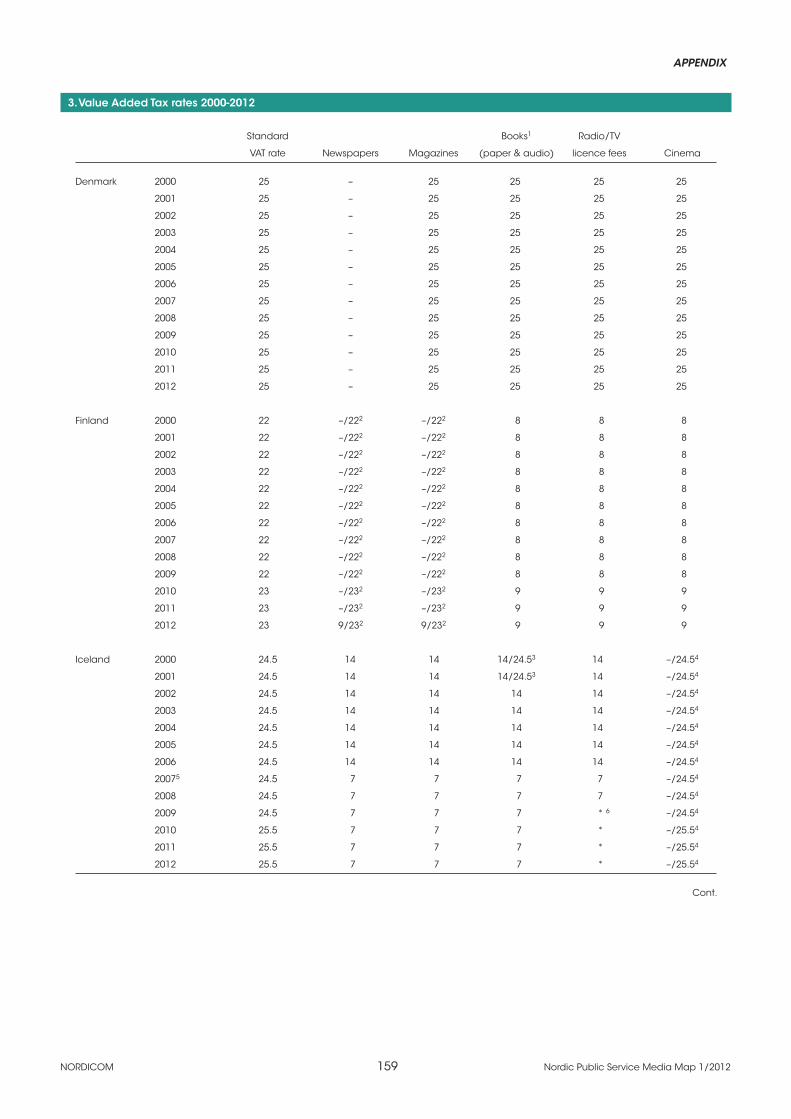
APPENDIX
NORDICOM 159 Nordic Public Service Media Map 1/2012
3. Value Added Tax rates 2000-2012
Standard Books1 Radio/TV
VAT rate Newspapers Magazines (paper & audio) licence fees Cinema
Denmark 2000 25 – 25 25 25 25
2001 25 – 25 25 25 25
2002 25 – 25 25 25 25
2003 25 – 25 25 25 25
2004 25 – 25 25 25 25
2005 25 – 25 25 25 25
2006 25 – 25 25 25 25
2007 25 – 25 25 25 25
2008 25 – 25 25 25 25
2009 25 – 25 25 25 25
2010 25 – 25 25 25 25
2011 25 – 25 25 25 25
2012 25 – 25 25 25 25
Finland 2000 22 –/222 –/222 8 8 8
2001 22 –/222 –/222 8 8 8
2002 22 –/222 –/222 8 8 8
2003 22 –/222 –/222 8 8 8
2004 22 –/222 –/222 8 8 8
2005 22 –/222 –/222 8 8 8
2006 22 –/222 –/222 8 8 8
2007 22 –/222 –/222 8 8 8
2008 22 –/222 –/222 8 8 8
2009 22 –/222 –/222 8 8 8
2010 23 –/232 –/232 9 9 9
2011 23 –/232 –/232 9 9 9
2012 23 9/232 9/232 9 9 9
Iceland 2000 24.5 14 14 14/24.53 14 –/24.54
2001 24.5 14 14 14/24.53 14 –/24.54
2002 24.5 14 14 14 14 –/24.54
2003 24.5 14 14 14 14 –/24.54
2004 24.5 14 14 14 14 –/24.54
2005 24.5 14 14 14 14 –/24.54
2006 24.5 14 14 14 14 –/24.54
20075 24.5 7 7 7 7 –/24.54
2008 24.5 7 7 7 7 –/24.54
2009 24.5 7 7 7 * 6 –/24.54
2010 25.5 7 7 7 * –/25.54
2011 25.5 7 7 7 * –/25.54
2012 25.5 7 7 7 * –/25.54
Cont.

NORDICOM 160 Nordic Public Service Media Map 1/2012
APPENDIX
3. Cont. Value Added Tax rates 2000-2012
Standard Books1 Radio/TV
VAT rate Newspapers Magazines (paper & audio) licence fees Cinema
Norway 2000 23 – 23 – – –
2001 24 – 24 – – –
2002 24 – 24 – – –
2003 24 – 24 – 12 –
2004 24 – 24 – 6 –
2005 25 – 25 – 7 7
2006 25 – 25 – 8 8
2007 25 – 25 – 8 8
2008 25 – 25 – 8 8
2009 25 – 25 – 8 8
2010 25 – 25 – 8 8
2011 25 – 25 – 8 8
2012 25 – 25 – 8 8
Sweden 2000 25 6 25 25 – 6
2001 25 6 25 25 – 6
2002 25 6 6 6 – 6
2003 25 6 6 6 – 6
2004 25 6 6 6 – 6
2005 25 6 6 6 – 6
2006 25 6 6 6 – 6
2007 25 6 6 6 – 6
2008 25 6 6 6 – 6
2009 25 6 6 6 – 6
2010 25 6 6 6 – 6
2011 25 6 6 6 – 6
2012 25 6 6 6 – 6
– VAT exempt.1 E-books are subject to standard VAT rate (also valid for digital versions of magazines and papers).2 Subscriptions of newspapers and magazines were exempt from sales tax until January 2012, when 9% VAT was introduced. VAT on single copy sales is standard VAT
rate.3 14% VAT on domestic books, 24.5% on imported books. VAT on imported books was lowered to 14% in Spring 2002. 4 Screenings of domestic films are exempt from VAT.5 7% from 1. March 2007.6 The licence fee system for TV and radio was abolished in Iceland in beginning of 2009 and replaced by a tax.
Note: Categories of media not listed here are subject to standard VAT in all countries.
Sources: Danish Agency for Culture / Centre for Libraries and Media, Statistics Iceland, Statistics Finland, medianorway, Nordicom.

APPENDIX
NORDICOM 161 Nordic Public Service Media Map 1/2012
4. National media categories included in the advertising tables
Denmark Finland Norway Sweden
TV TV TV TV1 TV
Teletext Teletext Teletext
Radio Radio Radio Radio Radio
Internet Internet Banner, classified, directories, Internet Internet
SEM, e-mail, mobile Mobile
Newspapers Newspapers Daily newspaper Newspapers Newspapers
Local weeklies Non-daily newspaper Free papers Free papers
Urban and pick-up papers Newspaper supplements Newspaper supplements2
Magazines & Paid magazines General interest, women, Consumer magazines Consumer magazines
Periodicals Other magazines professional, business and Trade, technical and Trade, technical and
Trade journals and customer magazines business press business press
periodicals Free magazines
Magazine supplements2
Cinema Cinema Cinema Cinema Cinema
Outdoor Outdoor Outdoor Outdoor Outdoor
In-store advertising
Printed
directories Yearbooks Printed directories Printed directories Printed directories
Direct mail3 Direct mail Addressed direct mail Addressed direct mail Addressed direct mail Door-to-door Unaddressed direct mail Unaddressed direct mail Unaddressed direct mail
1 Teletext included in the TV category. 2 Newspaper supplements and Magazine supplements are separate categories since 2002 only. Previously they were one category.3 Distribution only. Production excluded.
Note: Although the reported media categories in the Nordic countries are generally the same, the statistics vary to a degree as regards definitions and divisions. The categories used in the advertising tables are based on IRM’s Nordic advertising report, where IRM has grouped the media into main media categories, to enable comparison between countries to the highest degree possible. The overview above shows which national categories belong to the respective main media.
Source: Den nordiska reklammarknaden. Juni 2011 [The Nordic Advertising Market. June 2011] by IRM Institute for Advertising and Media Statistics.

NORDICOM 162 Nordic Public Service Media Map 1/2012
APPENDIX
5. Television audience data 2000-2011. Definitions
TV audience data in this publication emanate from national measurements, mainly electronic peoplemeter systems.
Electronic measurement was introduced in Finland in 1987, Denmark and Norway in 1992, Sweden in 1993 and Iceland in 2008.
Below follow some country specifics about the survey methods used in the statistics in this publication.
Denmark
Method Electronic measurement, peoplemeter (started in 1992)
Survey periods Measures throughout the year
Weekdays Average daily viewing Monday-Sunday
Population TV population, age 3 years+
Daily reach Share of TV population who have watched at least 5 consecutive minutes
Timeshift Not included. Timeshift is measured for days 2-7 from 2008 on, but official TV viewing data in Denmark are Live + VOS-DAL (Viewed on same day as live), which is valid for data presented in this publication.
Survey institute TNS Gallup Denmark
Finland
Method Electronic measurement, peoplemeter (started in 1987)
Survey periods Measures throughout the year
Weekdays Average daily viewing Monday-Sunday
Population TV population, age 10 years+
Daily reach Share of TV population who have watched at least 1 minute
Timeshift Timeshift within 7 days is included from 2008 on
Survey institute Finnpanel
Iceland
Method 2000-2007 Diary surveys
Method from 2008 on Electronic measurement, PPM (portable peoplemeter)
Survey periods Data presented in this publication are for 2000-2006 Oct/Nov, 2007 June, and 2008-2010 week 42 (October)
Weekdays Average daily viewing Monday-Sunday
Population Age 12-80 years. (TV population only from 2008 on)
Daily reach 2000-2007: share of respondents who tuned in to the stations per day on average. From 2008 on no public reach data available.
Time shift With the introduction of TV-meter measuring, catch-up-channel viewing was included.
Survey institute Capacent (previously ÍM Gallup)
Norway
Method Electronic measurement, peoplemeter (started in 1992)
Survey periods Measures throughout the year
Weekdays Average daily viewing Monday-Sunday.
Population TV population, age 12 years+
Daily reach Share of TV population who have watched at least 1 minute
Timeshift Timeshift within 7 days is included from 2008 on
Survey institute TNS Gallup Norway
Sweden
Method Electronic measurement, peoplemeter (started in 1993)
Survey periods Measures throughout the year
Weekdays Average daily viewing Monday-Sunday
Population TV population, age 3 years+
Daily reach Share of TV population who have watched at least 5 consecutive minutes
Timeshift Timeshift within 7 days included in 2010
Survey institute MMS - Mediamätning i Skandinavien

APPENDIX
NORDICOM 163 Nordic Public Service Media Map 1/2012
6. Radio audience data 2000-2011. Definitions
Radio audience data in this publication emanate from national surveys, where different methods have been used.
Electronic measures PPM (portable peoplemeter) were introduced in Denmark, Iceland and Norway in 2008.
Data include listening to radio, irrespective of platform.
Below follow some country specifics about the survey methods used in the statistics in this publication.
Denmark
Method 2000-2007 Diary surveys
Method from 2008 on Electronic measurement, PPM
Survey periods 2000-2007: 4th quarter each year, 2008-2010: measures throughout the year
Weekdays Average daily listening Monday-Sunday
Population Age 12 years+
Daily reach Share of population who have listened at least 5 consecutive minutes
Survey institute TNS Gallup Denmark
Finland
Method Diary surveys
Survey periods Measures throughout the year
Weekdays Average daily listening Monday-Sunday
Population Age 9 years+. From 2009 onwards the base population is the Finnish- and Swedish-speaking population (excluding the Åland islands). Until 2008 Finnish-speaking population only.
Daily reach Share of listeners who have listened a minimum of 8 minutes, during at least one 15-minute interval
Survey institute Finnpanel
Iceland
Method 2000-2007 Diary surveys
Method from 2008 on Electronic measurement, PPM (portable peoplemeter)
Survey period Data are from measures in March/April (2000-2002, 2004, 2007) or Oct/Nov (2003, 2005-2006, 2008-2010)
Weekdays Average daily listening 6-7 days/week except for 2000, Monday-Friday
Population Age 12-80 years
Daily reach 2000-2007: share of respondents who have listened a minimum of 5 minutes, during at least one 15-minute interval. From 2008 on no public reach data available.
Survey institute Capacent (previously ÍM Gallup)
Norway
Method 2000-2007 Telephone surveys, CATI (computer assisted telephone interviewing)
Method from 2008 on Electronic measurement, PPM
Survey periods Measures throughout the year
Weekdays Average daily listening Monday-Sunday
Population 2000-2007: age 9 years+, 2008-2010: age 12 years+
Daily reach 2000-2007: based on at least 2 minutes’ listening during one 5-minute interval, 2008-2010: minimum 1 minute listening
Survey institute TNS Gallup Norway
Sweden
Method Telephone surveys, CATI (computer assisted telephone interviewing)
Survey periods Each quarter. Data presented here are Autumn figures.
Weekdays Average daily listening Monday-Sunday
Population Age 9-79 years
Daily reach Share of population who have listened at least 5 consecutive minutes
Survey institute TNS Sifo (previously RUAB/Sifo Media)


165
Nordic Media Facts and FiguresCountry Contributors
Nordic CoordinationNordicomUniversity of GothenburgP O Box 713SE 405 30 Göteborgwww.nordicom.gu.se
Eva Harrie, Nordic coordinatorphone +46 31 786 46 58e-mail [email protected]
DenmarkDanish Agency for Culture /Centre for Libraries, Media and DigitalizationKulturstyrelsen / Center For Bibliotek, Medier og DigitaliseringH. C. Andersens Boulevard 2DK 1553 København Vwww.kulturstyrelsen.dk
Christian Edelvold Berg phone +45 3373 3330e-mail [email protected]
Lykke Nordblomphone +45 3373 3347e-mail [email protected]
FinlandStatistics FinlandMedia statisticsP O Box 5 BFIN-00022 Statistics FinlandHelsinkihttp://tilastokeskus.fi/til/jvie/index.html
Tuomo Sauriphone +358 9 1734 3449e-mail [email protected]
The information in this publication is collected and collated in collaboration with the organizations and individuals below.
IcelandStatistics IcelandHagstofa ÍslandsBorgartún 21AIS-150 Reykjavíkphone +354 528 1000 e-mail [email protected]/
Ragnar Karlssonphone +354 528 1051e-mail [email protected]
NorwaymedianorwaymedienorgeDepartment of Information Science and Media StudiesUniversity of BergenP O Box 7800N-5020 Bergenwww.medienorge.uib.no
Nina Bjørnstadphone +47 55 58 91 26Knut A. Tornesphone +47 55 58 91 21e-mail [email protected]
SwedenNordicom-SwedenUniversity of GothenburgP O Box 713SE 405 30 Göteborgwww.nordicom.gu.se
Ulrika Fachtphone +46 31 786 13 06e-mail [email protected]


167
More Publications from Nordicom Listed below are a number of current publications from Nordicom covering public service media issues in the Nordic countries, Europe and the global arena.
Exporting the Public Value Test. The Regulation of Public Broadcasters’ New Media Services Across EuropeKaren Donders & Hallvard Moe (eds) Nordicom, 2011, 188 p.ISBN 978-91-86523-26-8.
Public service broadcasters across Europe are venturing into the digital world, launching niche TV channels, building extensive websites, de-veloping commercial services, entering into partnerships with external actors, and exploring new ways to reach users, whether its through smart phone apps or screens in public spaces. Such endeavours inten-sify fundamental discussions about what we need public service media institutions for. These are complex discussions, building on history, encompassing new technology, and involving a range of strong stake-holders. Recently, the so-called public value test has emerged as the focal point for these discussions. As a detailed regulatory scheme to measure the public worth and possible market impact of planned pub-licly funded media services, the public value test is causing controversy across Europe. This collection of short essays from academics, regula-tors, public broadcasters and private media representatives, provides thought-provoking perspectives on the state of play of public value tests in a range of European states. In so doing, the book is a topical inter-vention in the ongoing debate about the future of our media systems.
Small Among Giants. Television Broadcasting in Smaller CountriesGregory Ferrell Lowe & Christian S. Nissen (eds) Nordicom, 2011, 231 p., ISBN 978-91-86523-16-9.
Big countries and major markets are often proposed as models for TV broadcasting everywhere. This is evident in the development of Euro-pean media policies and strategic renewal. It is taken for granted that such offer suitable and desirable models for smaller countries. This book questions that assumption on the basis of empirical research. Does a media market in a country with a few million people and far less GDP have the same opportunities as countries with many times the population or wealth? Does the same logic apply in all cases? The need for clarification is urgent given contemporary trends in ex ante regulation, and aggressive media lobbying that rests on an untested belief that one-size-fits-all. The research and analyses presented in this book confronts the pre-sumption, concluding that in crucial respects one-size policies do not fit all countries anymore than one-size strategies fit all companies. There are important differences in size-related factors that establish limits in how TV broadcasting can be organised and operated. The book will reward close attention by policymakers and strategic managers alike, and makes a timely contribution to scholarship on the topic.
International Media and Communication Statistics
2010
N O R D I C O M
Compiled by
Sara Leckner & Ulrika Facht
A Sampler of
N O R D I C M E D I A T R E N D S 1 2
Small Among Giants
Television Broadcastingin Smaller Countries
Gregory Ferrell Lowe & Christian S. Nissen (eds.)
NORDICOM
NORDICOM E
xp
or
tin
g
th
E p
ub
lic
Va
luE
tE
st
t
he r
egu
lation of p
ub
lic broad
casters’ n
ew M
edia s
ervices across E
urop
e
Ed
ited b
y Karen
Don
ders an
d h
allvard M
oe
NORD
ICOM
No
rdic Inform
ation Centre for M
edia and Com
munication Research
University of G
othenburgBox 713, SE 405 30 G
öteborg, Sweden
Telephone +46 31 786 00 00 (op.) | Fax +
46 31 786 46 55
ww
w.nordicom
.gu.se | E-mail: info@
nordicom.gu.se
»This collection of knowledgeable and w
ell composed essays by ex-
perts on media law
and regulation drawn w
idely from across Europe
makes a m
ost timely contribution on an im
portant and controversial policy about w
hich surprisingly little scholarly work has so far been
published: namely, the European C
omm
ission recomm
ended ex ante tests for public service broadcasters’ new
media engagem
ent. The w
ork’s range of country studies is extensive and it will serve as a w
el-com
e resource for the comparative analysis of a key area of broad-
casting regulation and policy.«
Peter H
umphreys
Professor of P
olitics, University of M
anchester
»As publicly funded broadcasters are expanding fast into digital m
e-dia m
arkets, capitalising further on internet and mobile distribution in
competition w
ith private sector broadcasters and online publishers, ex ante tests to establish fi
rst their public value or potential distorting eff
ects of public funding are essential to maintain open com
petition and m
edia plurality. This extensive review show
s just how im
portant these new
tests can be when m
ore widely im
plemented to reassert
core public service objectives and appropriate limits to ensure fair
competition.«
Angela M
ills Wade
Executive Director, European P
ublishers Council
Ex
po
rt
ing
th
E p
ub
lic
Va
luE
tE
st
Ed
ited b
y Karen
Don
ders an
d h
allvard M
oe N
ORD
ICOM
»Due to diff
erent national implem
entations opinions differ about
whether the public value test w
ill give public service media m
ore le-gitim
acy or if it will circum
scribe public service media. B
ut, one thing is sure. The last w
ord about the test has not been said. The public value test has becom
e a symbol for the fundam
ental debate on the future of public service broadcasting. This book feeds into the discus-sion and gives the reader the possibility to form
their own opinion
about a subject that has been surrounded by heated debate.«
Marit Ingves
Head of O
ffice. The N
ordic public services broadcasters representation in B
russels
Karen D
onders is professor of media studies at the Vrije U
niversiteit B
russel. She is a senior researcher w
ith IBB
T-SM
IT and a postdoctoral fellow
of the Research Foundation Flanders.
Hallvard M
oe is associate professor of media studies at the U
niver-sity of B
ergen.
NORDICOMNordic Information Centre for Media and Communication Research
University of GothenburgBox 713, SE 405 30 Göteborg, SwedenTelephone +46 31 786 00 00 (op.) | Fax +46 31 786 46 55
www.nordicom.gu.se | E-mail: [email protected]
The Digital Public Sphere
Challenges for Media Policy
Edited by
Jostein Gripsrud & Hallvard Moe
NORDICOM
“Our understanding of what we mean by ‘the public’ has been disrupted by the huge changes in media and communications brought about by the digital revolution. This brings major new challenges for media policy and thus a need for a re-opening of fundamental questions. The essays in this timely book, by leading scholars on both sides of the Atlantic, provide much needed insight and authoritative analysis to take our thinking forward.”
– Peter Golding, Loughborough University
Until recently, media policy was thought of as national, media-specific, and as part of the cultural domain. All this is changing in a digital public sphere: first, by the processes of globalization in a broad sense; second, by a blurring of borders between media, which can be summed up as convergence; and, third, by a more far-reaching commercialisation of the media. The transformations triggered by these developments are ongoing and have been so for quite a few years. Thus, it is time to take stock. The different contributions in this book set out to do that.
With a basis in the idea that media policy is fundamentally about regulating the public sphere in accordance with central democratic ideals, the book covers a wide range of issues: Transnational online television distribution; the trouble with building and opening digital audiovisual archives; the impact of recent EU regulations on global conglomerates as well as national public service broadcasters; the debate on net neutrality; the idea of the participating public in policy-making; the regulation of freedom of speech on the internet; as well as the impact of legal globalization on media policy itself.
Contributors are internationally leading European and US scholars in the field – Sandra Braman, Karen Donders, Caroline Pauwels and Slavko Splichal – along with a selection of Nordic experts: Jostein Gripsrud, Karl Knapskog, Hallvard Moe, Ole J. Mjøs, Hannu Nieminen, Helge Rønning, and Tanja Storsul.
NORD
ICOM
Th
e Dig
ital P
ub
lic Sp
her
eEdited by Jostein Gripsrud & Hallvard M
oec
ha
lleng
es for
med
ia p
olicy
International Media and Communication Statistics
2010
N O R D I C O M
Compiled by
Sara Leckner & Ulrika Facht
A Sampler of
N O R D I C M E D I A T R E N D S 1 2
Small Among Giants
Television Broadcastingin Smaller Countries
Gregory Ferrell Lowe & Christian S. Nissen (eds.)
NORDICOM
NORDICOM
Ex
po
rt
ing
t
hE
pu
bl
ic V
alu
E t
Es
t
th
e reg
ulation
of pu
blic b
roadcasters’
new
Med
ia services a
cross Eu
rope
Ed
ited b
y Karen
Do
nd
ers and
hallvard
Moe
NORD
ICOM
No
rdic Inform
ation Centre for M
edia and Com
munication Research
University of G
othenburgBox 713, SE 405 30 G
öteborg, Sweden
Telephone +46 31 786 00 00 (op.) | Fax +
46 31 786 46 55
ww
w.nordicom
.gu.se | E-mail: info@
nordicom.gu.se
»This collection of knowledgeable and w
ell composed essays by ex-
perts on media law
and regulation drawn w
idely from across Europe
makes a m
ost timely contribution on an im
portant and controversial policy about w
hich surprisingly little scholarly work has so far been
published: namely, the European C
omm
ission recomm
ended ex ante tests for public service broadcasters’ new
media engagem
ent. The w
ork’s range of country studies is extensive and it will serve as a w
el-com
e resource for the comparative analysis of a key area of broad-
casting regulation and policy.«
Peter H
umphreys
Professor of P
olitics, University of M
anchester
»As publicly funded broadcasters are expanding fast into digital m
e-dia m
arkets, capitalising further on internet and mobile distribution in
competition w
ith private sector broadcasters and online publishers, ex ante tests to establish fi
rst their public value or potential distorting eff
ects of public funding are essential to maintain open com
petition and m
edia plurality. This extensive review show
s just how im
portant these new
tests can be when m
ore widely im
plemented to reassert
core public service objectives and appropriate limits to ensure fair
competition.«
Angela M
ills Wade
Executive Director, European P
ublishers Council
Ex
po
rt
ing
th
E p
ub
lic
Va
luE
tE
st
Ed
ited b
y Karen
Don
ders an
d h
allvard M
oe N
ORD
ICOM
»Due to diff
erent national implem
entations opinions differ about
whether the public value test w
ill give public service media m
ore le-gitim
acy or if it will circum
scribe public service media. B
ut, one thing is sure. The last w
ord about the test has not been said. The public value test has becom
e a symbol for the fundam
ental debate on the future of public service broadcasting. This book feeds into the discus-sion and gives the reader the possibility to form
their own opinion
about a subject that has been surrounded by heated debate.«
Marit Ingves
Head of O
ffice. The N
ordic public services broadcasters representation in B
russels
Karen D
onders is professor of media studies at the Vrije U
niversiteit B
russel. She is a senior researcher w
ith IBB
T-SM
IT and a postdoctoral fellow
of the Research Foundation Flanders.
Hallvard M
oe is associate professor of media studies at the U
niver-sity of B
ergen.
NORDICOMNordic Information Centre for Media and Communication Research
University of GothenburgBox 713, SE 405 30 Göteborg, SwedenTelephone +46 31 786 00 00 (op.) | Fax +46 31 786 46 55
www.nordicom.gu.se | E-mail: [email protected]
The Digital Public Sphere
Challenges for Media Policy
Edited by
Jostein Gripsrud & Hallvard Moe
NORDICOM
“Our understanding of what we mean by ‘the public’ has been disrupted by the huge changes in media and communications brought about by the digital revolution. This brings major new challenges for media policy and thus a need for a re-opening of fundamental questions. The essays in this timely book, by leading scholars on both sides of the Atlantic, provide much needed insight and authoritative analysis to take our thinking forward.”
– Peter Golding, Loughborough University
Until recently, media policy was thought of as national, media-specific, and as part of the cultural domain. All this is changing in a digital public sphere: first, by the processes of globalization in a broad sense; second, by a blurring of borders between media, which can be summed up as convergence; and, third, by a more far-reaching commercialisation of the media. The transformations triggered by these developments are ongoing and have been so for quite a few years. Thus, it is time to take stock. The different contributions in this book set out to do that.
With a basis in the idea that media policy is fundamentally about regulating the public sphere in accordance with central democratic ideals, the book covers a wide range of issues: Transnational online television distribution; the trouble with building and opening digital audiovisual archives; the impact of recent EU regulations on global conglomerates as well as national public service broadcasters; the debate on net neutrality; the idea of the participating public in policy-making; the regulation of freedom of speech on the internet; as well as the impact of legal globalization on media policy itself.
Contributors are internationally leading European and US scholars in the field – Sandra Braman, Karen Donders, Caroline Pauwels and Slavko Splichal – along with a selection of Nordic experts: Jostein Gripsrud, Karl Knapskog, Hallvard Moe, Ole J. Mjøs, Hannu Nieminen, Helge Rønning, and Tanja Storsul.
NORD
ICOM
Th
e Dig
ital P
ub
lic Sp
her
eEdited by Jostein Gripsrud & Hallvard M
oec
ha
lleng
es for
med
ia p
olicy
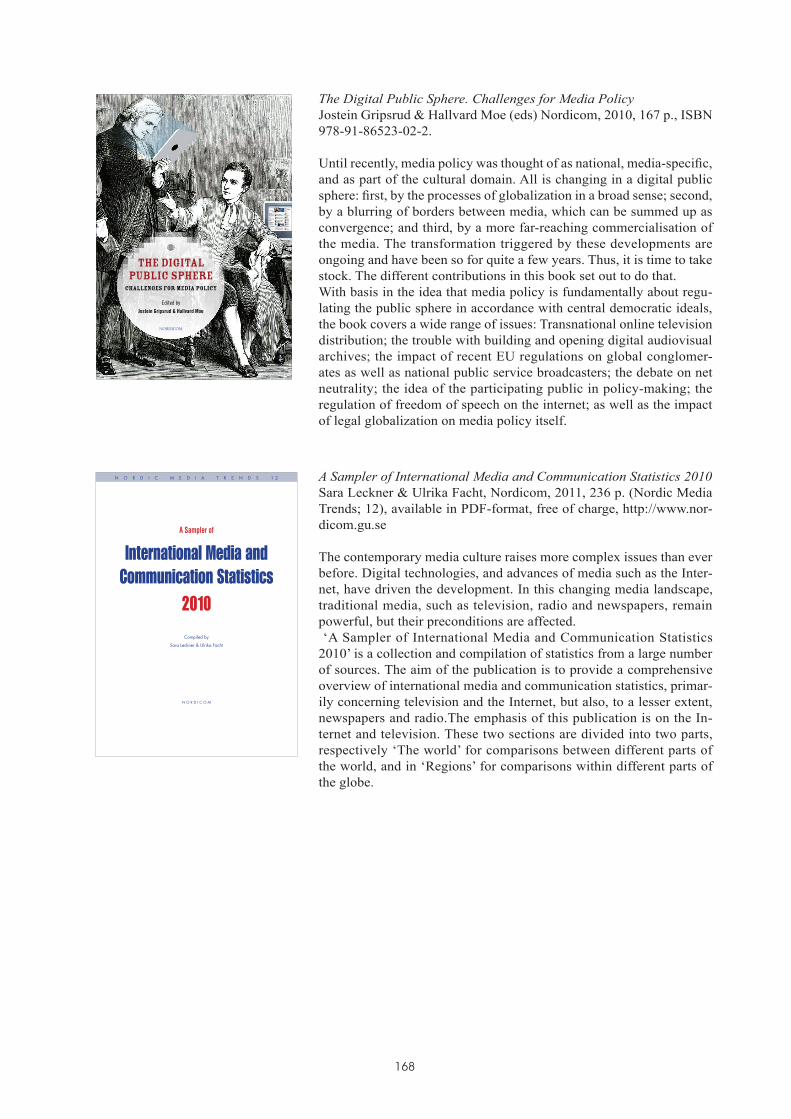
168
The Digital Public Sphere. Challenges for Media PolicyJostein Gripsrud & Hallvard Moe (eds) Nordicom, 2010, 167 p., ISBN 978-91-86523-02-2.
Until recently, media policy was thought of as national, media-specific, and as part of the cultural domain. All is changing in a digital public sphere: first, by the processes of globalization in a broad sense; second, by a blurring of borders between media, which can be summed up as convergence; and third, by a more far-reaching commercialisation of the media. The transformation triggered by these developments are ongoing and have been so for quite a few years. Thus, it is time to take stock. The different contributions in this book set out to do that.With basis in the idea that media policy is fundamentally about regu-lating the public sphere in accordance with central democratic ideals, the book covers a wide range of issues: Transnational online television distribution; the trouble with building and opening digital audiovisual archives; the impact of recent EU regulations on global conglomer-ates as well as national public service broadcasters; the debate on net neutrality; the idea of the participating public in policy-making; the regulation of freedom of speech on the internet; as well as the impact of legal globalization on media policy itself.
A Sampler of International Media and Communication Statistics 2010 Sara Leckner & Ulrika Facht, Nordicom, 2011, 236 p. (Nordic Media Trends; 12), available in PDF-format, free of charge, http://www.nor-dicom.gu.se
The contemporary media culture raises more complex issues than ever before. Digital technologies, and advances of media such as the Inter-net, have driven the development. In this changing media landscape, traditional media, such as television, radio and newspapers, remain powerful, but their preconditions are affected. ‘A Sampler of International Media and Communication Statistics 2010’ is a collection and compilation of statistics from a large number of sources. The aim of the publication is to provide a comprehensive overview of international media and communication statistics, primar-ily concerning television and the Internet, but also, to a lesser extent, newspapers and radio.The emphasis of this publication is on the In-ternet and television. These two sections are divided into two parts, respectively ‘The world’ for comparisons between different parts of the world, and in ‘Regions’ for comparisons within different parts of the globe.
International Media and Communication Statistics
2010
N O R D I C O M
Compiled by
Sara Leckner & Ulrika Facht
A Sampler of
N O R D I C M E D I A T R E N D S 1 2
Small Among Giants
Television Broadcastingin Smaller Countries
Gregory Ferrell Lowe & Christian S. Nissen (eds.)
NORDICOM
NORDICOM
Ex
po
rt
ing
t
hE
pu
bl
ic V
alu
E t
Es
t
th
e reg
ulation
of pu
blic b
roadcasters’
new
Med
ia services a
cross Eu
rope
Ed
ited b
y Karen
Don
ders an
d h
allvard M
oe
NORD
ICOM
No
rdic Inform
ation Centre for M
edia and Com
munication Research
University of G
othenburgBox 713, SE 405 30 G
öteborg, Sweden
Telephone +46 31 786 00 00 (op.) | Fax +
46 31 786 46 55
ww
w.nordicom
.gu.se | E-mail: info@
nordicom.gu.se
»This collection of knowledgeable and w
ell composed essays by ex-
perts on media law
and regulation drawn w
idely from across Europe
makes a m
ost timely contribution on an im
portant and controversial policy about w
hich surprisingly little scholarly work has so far been
published: namely, the European C
omm
ission recomm
ended ex ante tests for public service broadcasters’ new
media engagem
ent. The w
ork’s range of country studies is extensive and it will serve as a w
el-com
e resource for the comparative analysis of a key area of broad-
casting regulation and policy.«
Peter H
umphreys
Professor of P
olitics, University of M
anchester
»As publicly funded broadcasters are expanding fast into digital m
e-dia m
arkets, capitalising further on internet and mobile distribution in
competition w
ith private sector broadcasters and online publishers, ex ante tests to establish fi
rst their public value or potential distorting eff
ects of public funding are essential to maintain open com
petition and m
edia plurality. This extensive review show
s just how im
portant these new
tests can be when m
ore widely im
plemented to reassert
core public service objectives and appropriate limits to ensure fair
competition.«
Angela M
ills Wade
Executive Director, European P
ublishers Council
Ex
po
rt
ing
th
E p
ub
lic
Va
luE
tE
st
Ed
ited b
y Karen
Don
ders an
d h
allvard M
oe N
ORD
ICOM
»Due to diff
erent national implem
entations opinions differ about
whether the public value test w
ill give public service media m
ore le-gitim
acy or if it will circum
scribe public service media. B
ut, one thing is sure. The last w
ord about the test has not been said. The public value test has becom
e a symbol for the fundam
ental debate on the future of public service broadcasting. This book feeds into the discus-sion and gives the reader the possibility to form
their own opinion
about a subject that has been surrounded by heated debate.«
Marit Ingves
Head of O
ffice. The N
ordic public services broadcasters representation in B
russels
Karen D
onders is professor of media studies at the Vrije U
niversiteit B
russel. She is a senior researcher w
ith IBB
T-SM
IT and a postdoctoral fellow
of the Research Foundation Flanders.
Hallvard M
oe is associate professor of media studies at the U
niver-sity of B
ergen.
NORDICOMNordic Information Centre for Media and Communication Research
University of GothenburgBox 713, SE 405 30 Göteborg, SwedenTelephone +46 31 786 00 00 (op.) | Fax +46 31 786 46 55
www.nordicom.gu.se | E-mail: [email protected]
The Digital Public Sphere
Challenges for Media Policy
Edited by
Jostein Gripsrud & Hallvard Moe
NORDICOM
“Our understanding of what we mean by ‘the public’ has been disrupted by the huge changes in media and communications brought about by the digital revolution. This brings major new challenges for media policy and thus a need for a re-opening of fundamental questions. The essays in this timely book, by leading scholars on both sides of the Atlantic, provide much needed insight and authoritative analysis to take our thinking forward.”
– Peter Golding, Loughborough University
Until recently, media policy was thought of as national, media-specific, and as part of the cultural domain. All this is changing in a digital public sphere: first, by the processes of globalization in a broad sense; second, by a blurring of borders between media, which can be summed up as convergence; and, third, by a more far-reaching commercialisation of the media. The transformations triggered by these developments are ongoing and have been so for quite a few years. Thus, it is time to take stock. The different contributions in this book set out to do that.
With a basis in the idea that media policy is fundamentally about regulating the public sphere in accordance with central democratic ideals, the book covers a wide range of issues: Transnational online television distribution; the trouble with building and opening digital audiovisual archives; the impact of recent EU regulations on global conglomerates as well as national public service broadcasters; the debate on net neutrality; the idea of the participating public in policy-making; the regulation of freedom of speech on the internet; as well as the impact of legal globalization on media policy itself.
Contributors are internationally leading European and US scholars in the field – Sandra Braman, Karen Donders, Caroline Pauwels and Slavko Splichal – along with a selection of Nordic experts: Jostein Gripsrud, Karl Knapskog, Hallvard Moe, Ole J. Mjøs, Hannu Nieminen, Helge Rønning, and Tanja Storsul.
NORD
ICOM
Th
e Dig
ital P
ub
lic Sp
her
eEdited by Jostein Gripsrud & Hallvard M
oec
ha
lleng
es for
med
ia p
olicy
International Media and Communication Statistics
2010
N O R D I C O M
Compiled by
Sara Leckner & Ulrika Facht
A Sampler of
N O R D I C M E D I A T R E N D S 1 2
Small Among Giants
Television Broadcastingin Smaller Countries
Gregory Ferrell Lowe & Christian S. Nissen (eds.)
NORDICOM
NORDICOM
Ex
po
rt
ing
t
hE
pu
bl
ic V
alu
E t
Es
t
th
e reg
ulation
of pu
blic b
roadcasters’
new
Med
ia services a
cross Eu
rope
Ed
ited b
y Karen
Don
ders an
d h
allvard M
oe
NORD
ICOM
No
rdic Inform
ation Centre for M
edia and Com
munication Research
University of G
othenburgBox 713, SE 405 30 G
öteborg, Sweden
Telephone +46 31 786 00 00 (op.) | Fax +
46 31 786 46 55
ww
w.nordicom
.gu.se | E-mail: info@
nordicom.gu.se
»This collection of knowledgeable and w
ell composed essays by ex-
perts on media law
and regulation drawn w
idely from across Europe
makes a m
ost timely contribution on an im
portant and controversial policy about w
hich surprisingly little scholarly work has so far been
published: namely, the European C
omm
ission recomm
ended ex ante tests for public service broadcasters’ new
media engagem
ent. The w
ork’s range of country studies is extensive and it will serve as a w
el-com
e resource for the comparative analysis of a key area of broad-
casting regulation and policy.«
Peter H
umphreys
Professor of P
olitics, University of M
anchester
»As publicly funded broadcasters are expanding fast into digital m
e-dia m
arkets, capitalising further on internet and mobile distribution in
competition w
ith private sector broadcasters and online publishers, ex ante tests to establish fi
rst their public value or potential distorting eff
ects of public funding are essential to maintain open com
petition and m
edia plurality. This extensive review show
s just how im
portant these new
tests can be when m
ore widely im
plemented to reassert
core public service objectives and appropriate limits to ensure fair
competition.«
Angela M
ills Wade
Executive Director, European P
ublishers Council
Ex
po
rt
ing
th
E p
ub
lic
Va
luE
tE
st
Ed
ited b
y Karen
Don
ders an
d h
allvard M
oe
NORD
ICOM
»Due to diff
erent national implem
entations opinions differ about
whether the public value test w
ill give public service media m
ore le-gitim
acy or if it will circum
scribe public service media. B
ut, one thing is sure. The last w
ord about the test has not been said. The public value test has becom
e a symbol for the fundam
ental debate on the future of public service broadcasting. This book feeds into the discus-sion and gives the reader the possibility to form
their own opinion
about a subject that has been surrounded by heated debate.«
Marit Ingves
Head of O
ffice. The N
ordic public services broadcasters representation in B
russels
Karen D
onders is professor of media studies at the Vrije U
niversiteit B
russel. She is a senior researcher w
ith IBB
T-SM
IT and a postdoctoral fellow
of the Research Foundation Flanders.
Hallvard M
oe is associate professor of media studies at the U
niver-sity of B
ergen.
NORDICOMNordic Information Centre for Media and Communication Research
University of GothenburgBox 713, SE 405 30 Göteborg, SwedenTelephone +46 31 786 00 00 (op.) | Fax +46 31 786 46 55
www.nordicom.gu.se | E-mail: [email protected]
The Digital Public Sphere
Challenges for Media Policy
Edited by
Jostein Gripsrud & Hallvard Moe
NORDICOM
“Our understanding of what we mean by ‘the public’ has been disrupted by the huge changes in media and communications brought about by the digital revolution. This brings major new challenges for media policy and thus a need for a re-opening of fundamental questions. The essays in this timely book, by leading scholars on both sides of the Atlantic, provide much needed insight and authoritative analysis to take our thinking forward.”
– Peter Golding, Loughborough University
Until recently, media policy was thought of as national, media-specific, and as part of the cultural domain. All this is changing in a digital public sphere: first, by the processes of globalization in a broad sense; second, by a blurring of borders between media, which can be summed up as convergence; and, third, by a more far-reaching commercialisation of the media. The transformations triggered by these developments are ongoing and have been so for quite a few years. Thus, it is time to take stock. The different contributions in this book set out to do that.
With a basis in the idea that media policy is fundamentally about regulating the public sphere in accordance with central democratic ideals, the book covers a wide range of issues: Transnational online television distribution; the trouble with building and opening digital audiovisual archives; the impact of recent EU regulations on global conglomerates as well as national public service broadcasters; the debate on net neutrality; the idea of the participating public in policy-making; the regulation of freedom of speech on the internet; as well as the impact of legal globalization on media policy itself.
Contributors are internationally leading European and US scholars in the field – Sandra Braman, Karen Donders, Caroline Pauwels and Slavko Splichal – along with a selection of Nordic experts: Jostein Gripsrud, Karl Knapskog, Hallvard Moe, Ole J. Mjøs, Hannu Nieminen, Helge Rønning, and Tanja Storsul.
NORD
ICOM
Th
e Dig
ital P
ub
lic Sp
her
eEdited by Jostein Gripsrud & Hallvard M
oec
ha
lleng
es for
med
ia p
olicy