public transport geodata analysis
TRANSCRIPT
Public transport geodata analysisTeam: Maksym Gontar and Oleksandr Kremenetskyi
Supervisor: Tassos Noulas
Lviv 2017
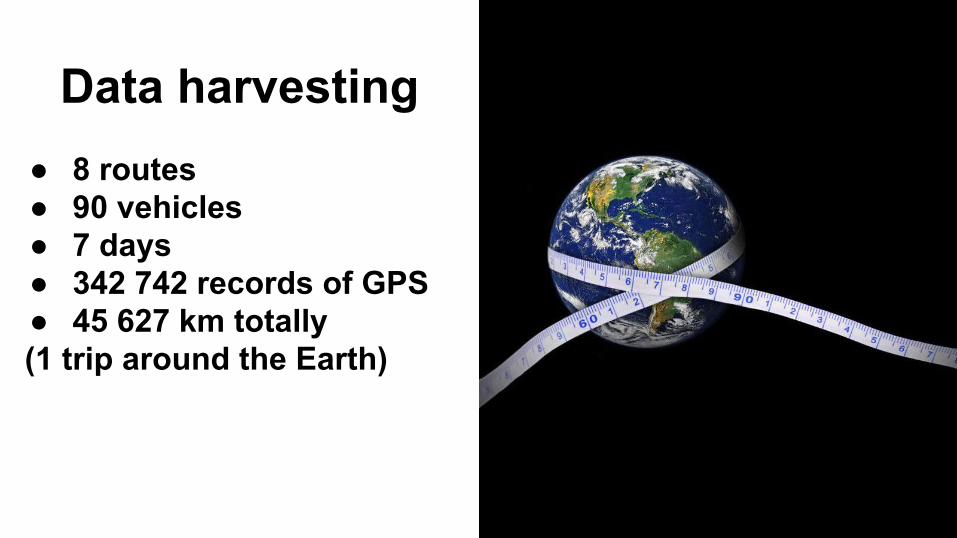
Data harvesting● 8 routes● 90 vehicles● 7 days● 342 742 records of GPS● 45 627 km totally(1 trip around the Earth)
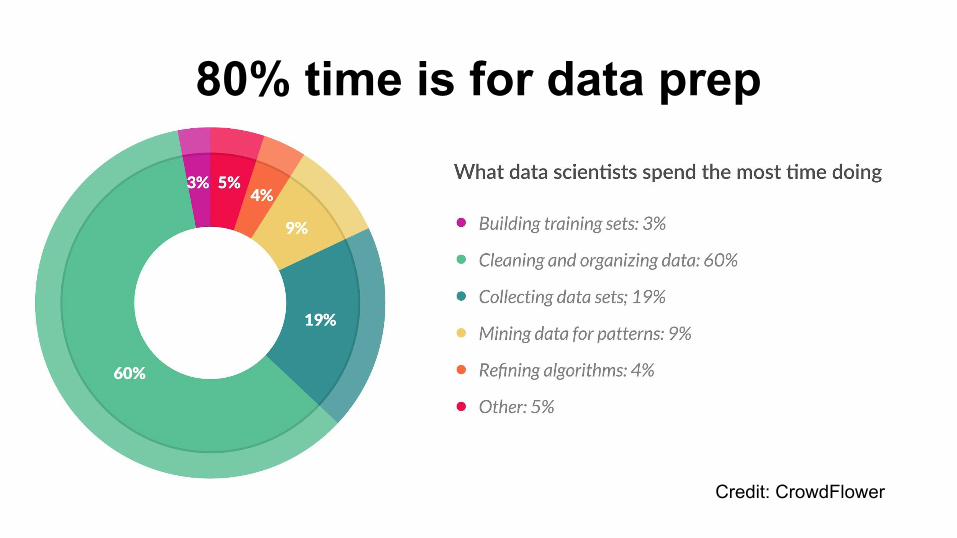
80% time is for data prep
Credit: CrowdFlower
Data prep:
- found route turn stops- route segmentation (50 m)- trip points by vehicle- vehicle trip directions- vehicle speed on segment- and more ….
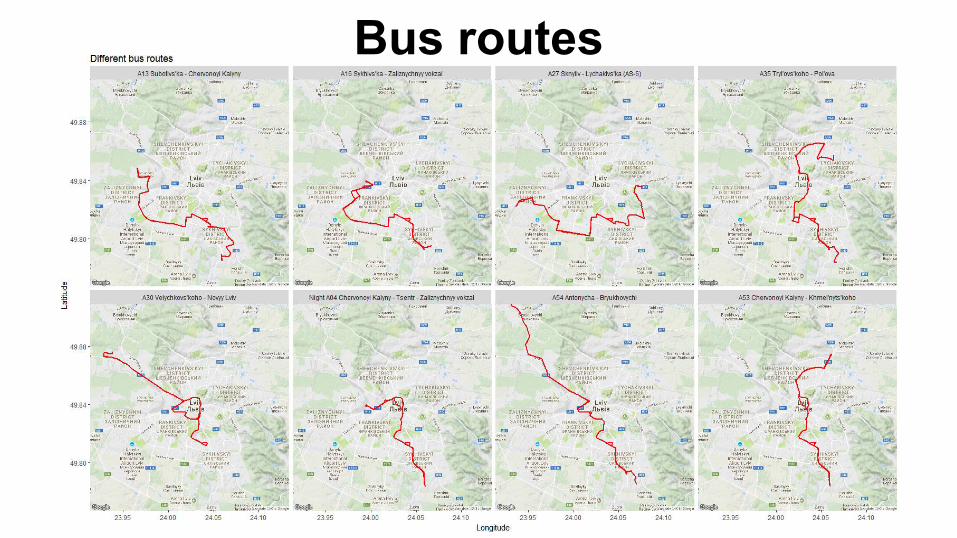
Bus routes
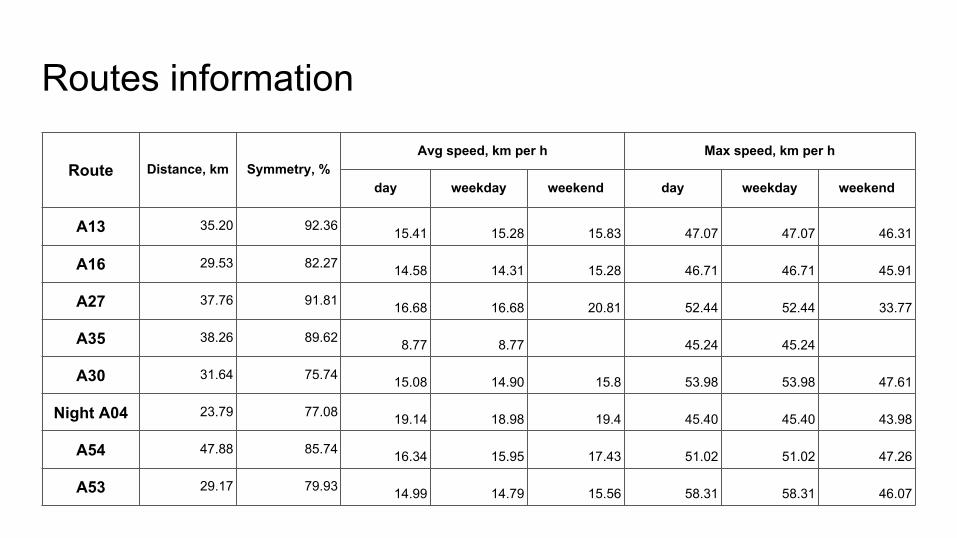
Routes information
Route Distance, km Symmetry, %Avg speed, km per h Max speed, km per h
day weekday weekend day weekday weekend
A13 35.20 92.36 15.41 15.28 15.83 47.07 47.07 46.31
A16 29.53 82.27 14.58 14.31 15.28 46.71 46.71 45.91
A27 37.76 91.81 16.68 16.68 20.81 52.44 52.44 33.77
A35 38.26 89.62 8.77 8.77 45.24 45.24
A30 31.64 75.74 15.08 14.90 15.8 53.98 53.98 47.61
Night A04 23.79 77.08 19.14 18.98 19.4 45.40 45.40 43.98
A54 47.88 85.74 16.34 15.95 17.43 51.02 51.02 47.26
A53 29.17 79.93 14.99 14.79 15.56 58.31 58.31 46.07
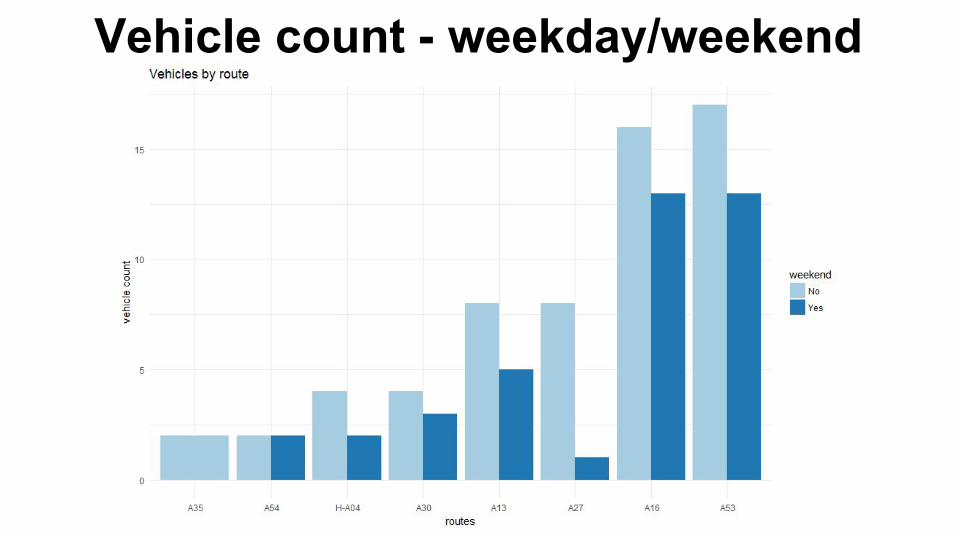
Vehicle count - weekday/weekend
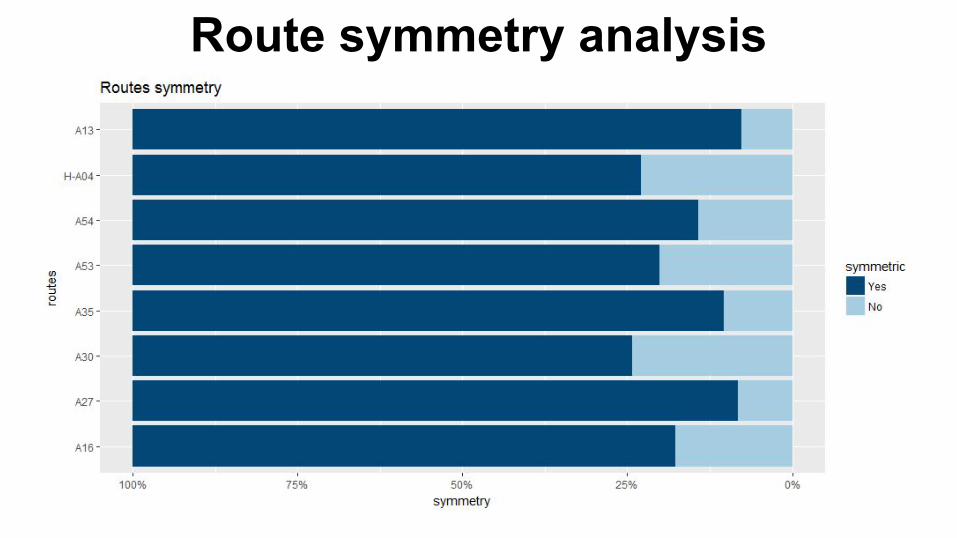
Route symmetry analysis
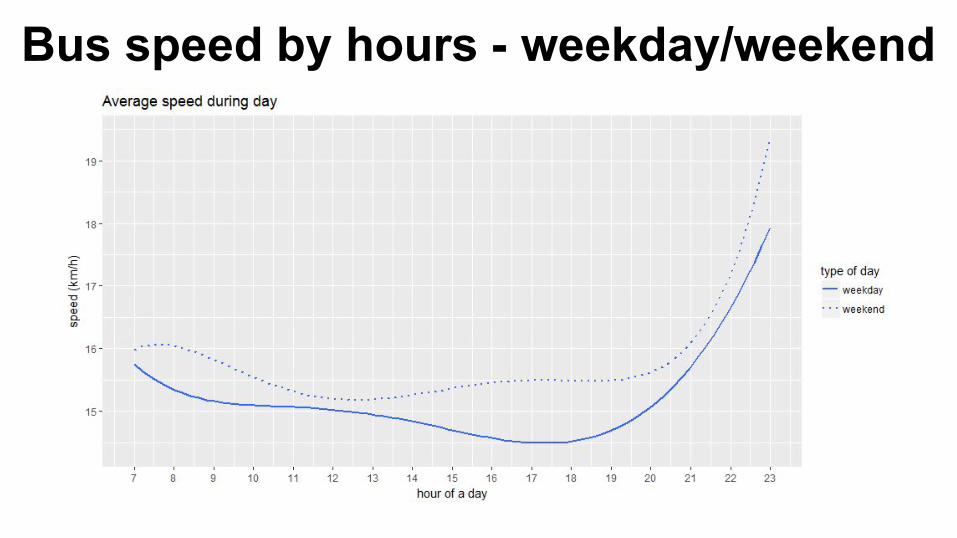
Bus speed by hours - weekday/weekend
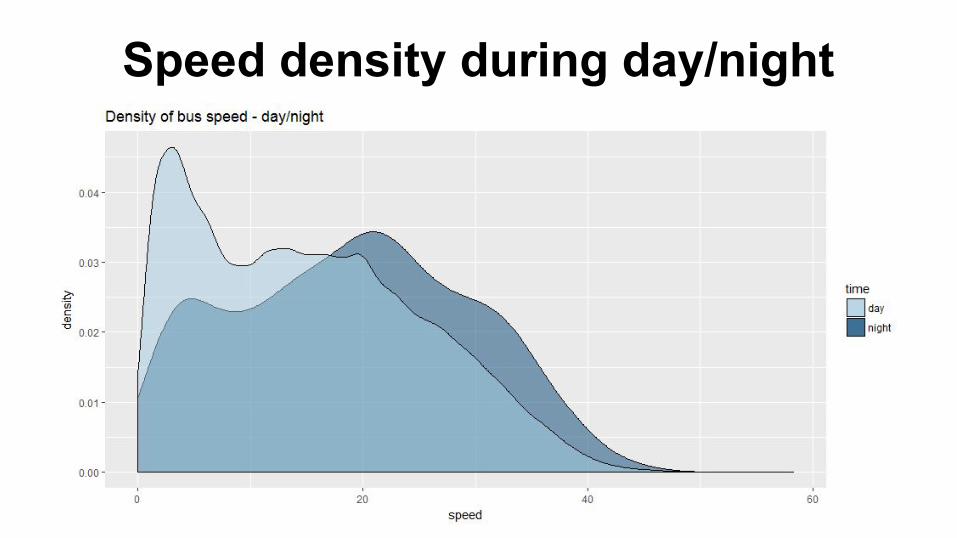
Speed density during day/night
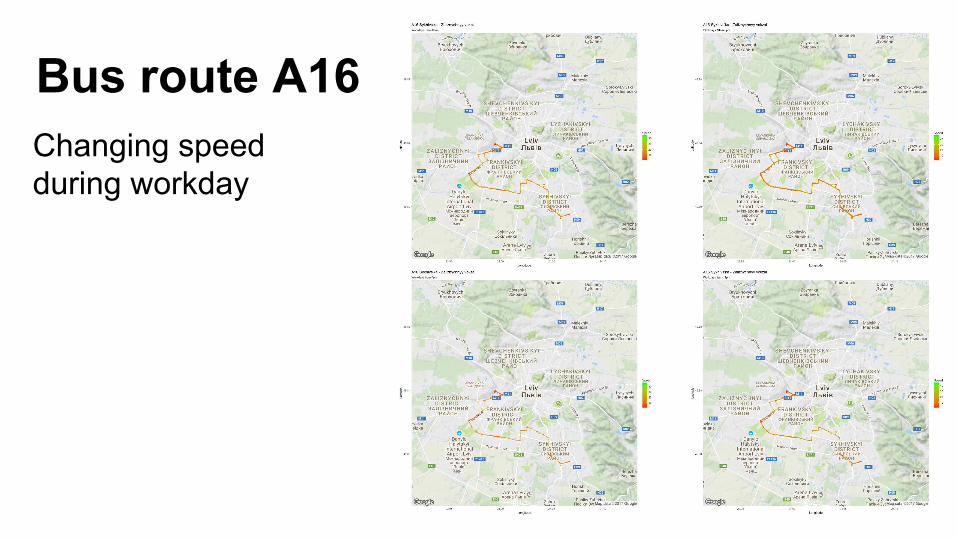
Bus route A16Changing speed during workday
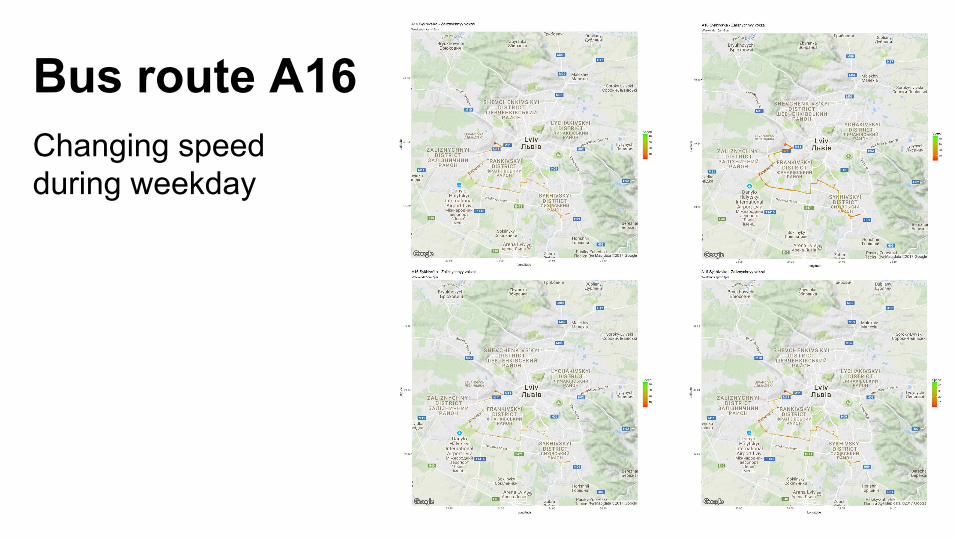
Bus route A16Changing speed during weekday
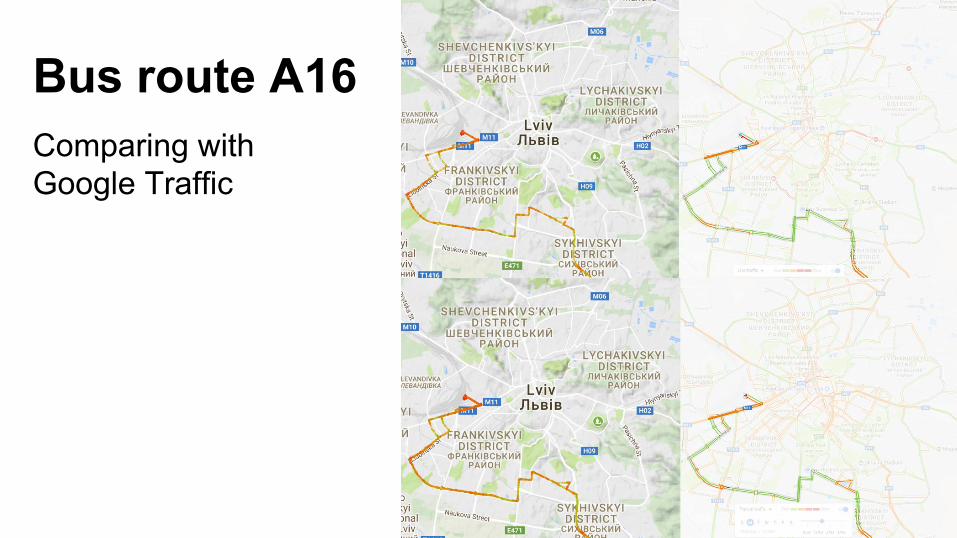
Bus route A16Comparing with Google Traffic
Conclusion
- Schedule 80% of time for data prep
- In unknown domain area be ready to invent your own bicycles
- The data analysis gives ability for further research and ML applications

Thank you! Your questions?
You can find our code & data here: https://github.com/UCUBusProj