public utilities service area
TRANSCRIPT

City of Portland, Oregon – FY 2012-13 Adopted Budget 257
Public Utilities Service Area
Percent of City Budget
Percent of Service Area Budget
Service Area Overview
Requirements Revised
FY 2011-12 Adopted
FY 2012-13 Change from
Prior Year PercentChange
Operating 1,442,208,883 1,322,689,788 (119,519,095) (8.29)
Capital 191,701,047 231,297,000 39,595,953 20.66
Total Requirements 1,633,909,930 1,553,986,788 (79,923,142) (4.89)
Authorized Positions 1,173.83 1,151.83 (22.00) (1.87)
• Bureau of Environmental Services • Portland Water Bureau
Public Utilities Service Area 43.3%
Remaining City Budget 56.7%
Portland Water Bureau 50.3%
Bureau of Environmental Services 49.7%

258 City of Portland, Oregon – FY 2012-13 Adopted Budget
Public Utilities Service Area
Service Area HighlightsDescription
The Public Utilities service area includes utility services provided by the City. These include water service provided by the Portland Water Bureau and sewer and stormwater management services provided by the Bureau of Environmental Services (BES).
Major Themes
Utility Rate Increases The Adopted Budget for FY 2012-13 includes an average monthly effective retail rate increase of 7.6% for water service. The average monthly single family sewer and stormwater bill increase is 5.4%.
Portland Water Bureau
The Water Division's budget of $216.7 million is composed of the operating budget of $80.8 million and the capital budget of $135.9 million.
The operating budget of $80.8 million represents an increase of $3.2 million from the FY 2011-12 Revised Budget of $77.6.
The capital budget of $135.9 million is an increase of $23.4 million from the FY 2011-12 Revised CIP Budget. For additional information, review the Water Bureau CIP section of the budget submission.
The budget funds 616.8 FTE. This includes five new positions associated with the increased monitoring decision package, ten position reductions, one limited term full time and two limited term part time.
Long Term 2 Enhanced Surface Water Treatment Rule
The City has received a variance from building a UV treatment plant for cryptosporidium. If Portland is successful in continuously meeting the stated conditions of the variance that went into effect April 1, 2012, then it will be in effect for ten years. However the City does have to cover its open finished drinking water reservoirs by December 31, 2020.
Bureau of Environmental Services
The FY 2012-13 Adopted Budget for operating and capital expenditures is $220.2 million which is $6.1 million, or 2.7%, lower than the Revised Budget for FY 2011-12
The operating portion of BES's Adopted Budget is 8.9%, or $10.2 million, higher than the FY 2011-12 Revised Budget.
The CIP will decrease $16.3 million over the FY 2011-12 Revised Budget which is primarily due to the completion of the Combined Sewer Overflow (CSO) abatement projects.

City of Portland, Oregon – FY 2012-13 Adopted Budget 259
Public Utilities Service Area
Combined Sewer Overflows
The City is subject to Oregon Department of Environmental Quality (DEQ) administrative orders regarding overflows from the bureau's combined sewer and stormwater collection system. CSO control facilities were fully operational by the agreed upon date of December 1, 2011. The FY 2012-13 Adopted Budget includes $3.4 million of CSO capital costs, reflecting completion of the CSO projects.
Portland Harbor Superfund
BES represents the city's interests on the Portland Harbor Superfund site by working with DEQ to identify and reduce sources of contamination conveyed to the Willamette River via stormwater outfalls, and working with other stakeholders to assess current and past land use practices within the lower Willamette drainage basin. This information will be used in the Superfund process over the next several years to assess the city's potential liability for cleanup activities. The FY 2012-13 Adopted Budget includes $3.9 million of expenditures related to the Portland Harbor Superfund.
The Office of Healthy Working Rivers
Healthy Working Rivers (HWR) will integrate environmental restoration, economic development, and community involvement for the Portland segments of the Willamette and Columbia Rivers. HWR will facilitate river-related projects contributing to City and regional economic prosperity, and implement habitat improvement projects to restore and protect riparian ecological functions. The Adopted Budget includes funding of $622,455 for four positions, as well as funding for technical support. For FY 2012-13, one HWR position will be temporarily assigned to work on the Endangered Species Act Program and one vacant position is being eliminated.

260 City of Portland, Oregon – FY 2012-13 Adopted Budget
Bureau of Environmental Services
Public Utilities Service Area
Dan Saltzman, Commissioner-in-ChargeDean Marriott, Director
Percent of City Budget
Bureau Programs
Bureau Overview
Requirements Revised
FY 2011-12 Adopted
FY 2012-13 Change from
Prior Year PercentChange
Operating 886,144,413 799,514,419 (86,629,994) (9.78)
Capital 112,101,047 95,427,000 (16,674,047) (14.87)
Total Requirements 998,245,460 894,941,419 (103,304,041) (10.35)
Authorized Positions 543.03 532.78 (10.25) (1.89)
Bureau of Environmental Services 24.9%
Remaining City Budget 75.1%
Healthy Working Rivers 0.3%
Administration & Support 16.6%
Portland Harbor 1.8%
Engineering 48.8%
Pollution Prevention 4.2% Wastewater 22.8%
Watershed 5.6%

City of Portland, Oregon – FY 2012-13 Adopted Budget 261
Bureau of Environmental ServicesPublic Utilities Service Area
Sto
rmw
ater
Ret
rofit
Ser
vice
s
Mat
eria
ls L
abor
ator
y
Des
ign
Serv
ices
Proj
ect M
anag
emen
t&
Con
trols
Con
stru
ctio
nS
ervi
ces
Syst
ems
Dev
elop
men
t
Asse
t Sys
tem
sM
anag
emen
tBu
reau
Sup
port
Com
mun
ityIn
volv
emen
t
Adm
inis
trativ
eS
ervi
ces
Env
ironm
enta
lIn
vest
igat
ions
Envi
ronm
enta
lC
ompl
ianc
e
Trea
tmen
t O&M
Col
lect
ion
Syst
em O
&MEc
olog
ical
Res
tora
tion
Bur
eau
of E
nviro
nmen
tal S
ervi
ces
Dire
ctor
Dea
n M
arrio
tt
Hea
lthy
Wor
king
Riv
ers
Was
tew
ater
Ser
vice
sE
ngin
eerin
gSe
rvic
es
Pollu
tion
Prev
entio
nS
ervi
ces
Wat
ersh
edSe
rvic
es
Sus
tain
able
Stor
mw
ater
Enda
nger
edS
peci
es A
ct
Wat
ersh
edM
anag
emen
t
Adm
inis
trativ
eS
ervi
ces
Em
ploy
eeD
evel
opm
ent
Por
tland
Har
bor
Com
preh
ensi
veE
nviro
nmen
tal
Res
pons
e,C
ompe
nsat
ion,
&
Liab
ility
Act
(CE
RC
LA)
Wat
ersh
edR
eveg
etat
ion
Nat
ural
Res
ourc
eD
amag
e As
sess
men
t(N
RD
A)
Wat
er R
esou
rces
Dev
elop
men
t Act
(W
RD
A)
Fina
nce
Info
rmat
ion
Man
agem
ent
Pub
lic In
form
atio
n/E
duca
tion
Env
ironm
enta
lPo
licy
Sour
ce C
ontro
l

262 City of Portland, Oregon – FY 2012-13 Adopted Budget
Bureau of Environmental ServicesPublic Utilities Service Area
Bureau SummaryBureau Mission
The Bureau of Environmental Services, Portland's clean river agency, serves the Portland community by protecting public health, water quality, and the environment.
BES provides sewage and stormwater collection and treatment services to accommodate Portland's current and future needs.
BES protects the quality of surface and ground waters and conducts activities that plan and promote healthy ecosystems in our watersheds.
Bureau OverviewThe bureau has seven major functional program areas and serves over 586,000 customers. The bureau operates and maintains sanitary sewer and stormwater collection systems with retail sewer and stormwater charges, wholesale contract revenues from surrounding jurisdictions, and reimbursements for services provided to other bureaus. The bureau's seven primary functional program areas are: Engineering Services, Pollution Prevention Services, Watershed Services, Wastewater Services, Portland Harbor, Healthy Working Rivers, and Administrative Services.
The FY 2012-13 Adopted Budget for operating and capital expenditures is $220.2 million, which is $6.1 million or 2.7% lower than the Revised Budget for FY 2011-12 and includes 532.78 full-time equivalent positions. The Capital Improvement Plan will decrease $16.3 million from FY 2011-12 which is primarily due to the completion of the Combined Sewer Overflow (CSO) abatement projects. The operating portion of the Adopted Budget is 8.3% or $9.6 million higher than the FY 2011-12 Revised Budget. Increases within the bureau budget are for services from other bureaus (+$1.6 million /+4.8%) and $13.5 million of Utility Franchise Fee payments to the General Fund now reflected within external materials and services (+$11.9 million /+38.1%). The average single-family residential sewer and stormwater bill will increase by 5.4% in FY 2012-13
Strategic Direction
Environmental Issues
Combined Sewer Overflows (CSO)
The City is subject to Oregon Department of Environmental Quality (DEQ) administrative orders regarding overflows from the bureau's combined sewer and stormwater collection system. CSO control facilities were fully operational by the agreed upon date of December 1, 2011. The Adopted Budget includes $3.4 million of CSO capital costs and reflects the completion of the CSO projects.

City of Portland, Oregon – FY 2012-13 Adopted Budget 263
Bureau of Environmental ServicesPublic Utilities Service Area
Portland Harbor Superfund
The bureau represents the City's interests on the Portland Harbor Superfund site by both working with DEQ to identify and reduce sources of contamination conveyed to the Willamette River via stormwater outfalls, and with other stakeholders to assess current and past land use practices within the lower Willamette drainage basin. This information will be used in the Superfund process over future years to assess the City's potential liability for cleanup activities. The FY 2012-13 Adopted Budget includes $3.9 million of expenditures related to the Portland Harbor Superfund.
Healthy Working Rivers
Healthy Working Rivers (HWR) will integrate environmental restoration, economic development, and community involvement for the Portland segments of the Willamette and Columbia Rivers. HWR will facilitate river-related projects contributing to City and regional economic prosperity, and implement habitat improvement projects to restore and protect riparian ecological functions. The Adopted Budget includes funding of $622,455 for four positions, as well as funding for technical support. For FY 2012-13, one HWR position is on loan to the Endangered Species Act Program and one vacant administrative position is being eliminated.
Water Quality Compliance
Compliance with the City's National Pollution Discharge Elimination System (NPDES) stormwater permit and with total maximum daily load (TMDL) regulations issued by DEQ requires modeling and evaluation of citywide pollutant loads, stormwater runoff volumes, and the effectiveness of stormwater management program implementation. The bureau must also comply with underground injection control (UIC) regulations issued by DEQ for the City's 8,548 stormwater sumps. The Adopted Budget contains water quality compliance-related funding across a variety of bureau program areas including Watershed Services, Pollution Prevention Services, and Engineering Services.
Endangered Species Act Requirements
The bureau continues to develop and implement a comprehensive watershed framework for the protection of the Lower Columbia steelhead and the Lower Columbia Chinook salmon per the requirements of the Endangered Species Act (ESA). In addition, the bureau has also begun implementing procedures to comply with requirements related to the designation of the City's streams as critical habitat by the National Marine Fisheries Service. The FY 2012-13 Adopted Budget contains $1.2 million in ESA-related funding in program areas including Watershed Services, Pollution Prevention Services, and Engineering Services.
Restoration and Remediation
The Adopted Budget includes funding for continued flood management and watershed restoration activities in the Johnson Creek watershed. It also funds the identification and characterization of contaminated sediment sites in the Columbia Slough, pursuant to a consent order between the City and DEQ.

264 City of Portland, Oregon – FY 2012-13 Adopted Budget
Bureau of Environmental ServicesPublic Utilities Service Area
Operational Issues
The Adopted Budget includes $31.6 million to support the operation and maintenance of 97 active pumping stations, 2,328 miles of pipeline, 62,706 manholes, 8,548 stormwater sumps, 172,216 laterals, 758,117 lineal feet of ditches, 55,380 stormwater inlets and catch basins, 347 trash racks, 155 parcel-based stormwater facilities (manufactured), 1,375 green stormwater facilities (including parcel-based facilities and green streets), and 242 stormwater detention facilities. The FY 2012-13 Adopted Budget includes costs associated with increased inspection, cleaning and repair of sewer system assets.
Infrastructure
The Adopted Budget includes $36.8 million to support capital repair and replacement of sewer system assets to prevent catastrophic failures. More than 30% of the collection system is over 80 years old and maintenance needs are anticipated to increase significantly in the near future. The bureau has committed to providing funds for repair of structurally deficient portions of the sewer collection system, and the long-term financial forecast anticipates significant increases in the capital maintenance budget beyond completion of the CSO program.
Watershed Opportunities
The Adopted Budget includes $1.5 million for each year of the five-year Capital Improvement Plan to fund innovative watershed enhancements. Priority will be given to projects that leverage other funding sources, demonstrate new technologies, and/or address multiple watershed health goals. Additionally, the bureau is investing $48 million over the next four years to ensure Portland continues to grow in a way that protects and enhances watershed health. The Grey to Green initiative will add 43 acres of ecoroofs, construct 920 Green Street facilities, plant 33,000 yard trees and 50,000 street trees, set up the fight against invasive weeds, replace eight culverts that block fish passage, and purchase 419 acres of high priority natural areas.
Green Street Facilities on Bicycle Boulevards
The Adopted Budget includes $13.4 million in CIP expenditures for Fiscal Years 2012- 13 through 2015-16 to construct green street facilities along high-priority bicycle boulevards. These facilities will serve the dual purpose of removing stormwater inflows from combined sewers, thereby reducing basement backups, and of calming traffic along designated bicycle boulevards. The facilities constructed will include 920 facilities targeted for completion under the Grey to Green initiative.

City of Portland, Oregon – FY 2012-13 Adopted Budget 265
Bureau of Environmental ServicesPublic Utilities Service Area
Service Improvement Plan
Asset Management
Providing wastewater and stormwater utility services requires infrastructure such as pipes, pumps, treatment facilities, as well as the natural environment including surface and ground water, topography, soils, and vegetation. The bureau has researched and applied the leading asset management principles by participating in the Water Services Association of Australia's asset management benchmarking program. This has formulated an asset management framework and implementation plan and the next step is to implement key asset management elements. In 2011, the bureau updated its strategic plan that mandates the use of asset management principles in the bureau's business practices.
Ongoing activities include the increasing use of asset management principles in system planning activities, which includes the Sewer Rehabilitation Program, and the selection criteria for prioritizing project in the Capital Improvement Program.
The following will be completed by June 30, 2013:
Level of Service "strategic outcomes" will be used to help inform the new revised BES Strategic Plan and help to identify define specific bureau activities necessary to meet the strategic levels of service.
Review and refine bureau-wide performance measures in light of the revised strategic plan. New performance measures will be developed where necessary to reinforce the direction set by the strategic plan.
Complete Phase I of the Green Asset Inventory and Assessment Project, designed to help define the necessary follow-on phases to perform field work and information management tasks.
Integrate asset management principles for risk-based planning into three infrastructure planning projects: sewer rehabilitation, plants and pump station operations and maintenance, and the Stephens Creek stormwater system plan. Specific deliverables would include submittals to DEQ to satisfy regulatory requirements such as a Pump Station Reliability Plan, and a Grease Management and Control Program.
Fats, Oils, and Greases (FOG) Program
The City of Portland's FOG Program goals are to minimize the accumulation of fats, oils, and grease in the collection system, reduce associated cleaning costs, eliminate the potential for sewage overflows and basement backups, and promote the proper handling and disposal of fats, oils, and grease. The City has implemented this program through outreach to residential homes and commercial facilities, inspecting grease removal devices at food service establishments, increased sewer line cleaning in areas at increased risk of blockages and overflows, and conducting enforcement actions when sewage overflows are a result of grease blockages. While this has been partially successful, it appears that technical assistance is becoming less effective, which has resulted in increased line cleaning frequency and a

266 City of Portland, Oregon – FY 2012-13 Adopted Budget
Bureau of Environmental ServicesPublic Utilities Service Area
growing number of areas at risk for line blockages and sewer overflows. To address this issue, the City has begun to reorganize the program and take a more proactive approach in minimizing fats, oils, and grease from entering the City's sewer system. Consistent with last year's goals, City Code and Administrative Rules have been updated to reflect the following FOG program goals:
By June of 2013, the bureau plans to meet with all food service establishments to encourage proper implementation of best management practices;
Inspect all grease removal devices at all food service establishments to ensure they are in good working condition and being pumped out regularly to minimize the discharge of FOG into City sewers; and
Phase in tiered extra strength charges for food service establishments and other high-strength dischargers to more equitably distribute the costs of treating FOG and other high-strength discharges across customer groups and to provide enhanced incentives to businesses to minimize discharges of FOG into City sewers.
Audit of BES/PBOT Maintenance Activities
The bureau is responsible for maintaining the City's sanitary sewer and stormwater collection infrastructure, including approximately 2,300 miles of pipes. The bureau has an agreement with the Portland Bureau of Transportation (PBOT) Maintenance Division to provide pipe inspection, cleaning, and repair services. The Auditor's office examined the current agreement against the possibility of locating the maintenance operation within BES, and found potential savings to sewer and stormwater customers from a transfer of responsibility, but pointed out several operational issues that could affect that estimate. The audit recommended that the Commissioners in charge of the respective bureaus develop a coordinated proposal to either maintain or reorganize the relationship, while taking account of the operational issues involved in any transfer.
PBOT and BES worked with OMF staff to develop a scope of work and timeline for a consultant study to assess the potential for savings in relocating the maintenance operation within BES. The City issued an RFP for the work and there were no responses. Follow-up with firms having shown initial interest revealed some uncertainty as to the extent of the work and qualifications required.
By June of 2013, BES and PBOT staff will refine the scope and timeline, reissue the RFP, complete work on the consultant study and have a joint recommendation for Council on the appropriate organization of sewer and stormwater maintenance work.
Summary of Budget Decisions
Reductions The FY 2012-13 Adopted Budget, including the following budget decisions, results in a 5.4% average rate increase.
Reductions for 5.4% Rate Increase
These changes include identified reductions that represent removal of one-time expenditures from the current budget, savings from past projects and completed programs or program expenditures, savings on new contracts, or other reductions that pose acceptable risks to service delivery. All decision package reductions total $4,044,172.

City of Portland, Oregon – FY 2012-13 Adopted Budget 267
Bureau of Environmental ServicesPublic Utilities Service Area
The budget in Healthy Working Rivers was reduced by $35,000 for outside consultant assistance and eliminate a vacant Office Support Specialist III position and correlating budget of $75,564.
Eliminate a Principal Financial Analyst ($139,932) due to retirement within the Environmental Policy program.
Eliminate agreement with the Tribal Institute at Portland State University ($35,000) within the Portland Harbor Program.
Within the Finance Program, eliminate one-year consultant funding ($21,000) for rate approval process, remove $35,615 contribution for the COPPEA Professional Development Fund for one year, eliminate consultant support ($23,315) for auditing bureau contracts, and hold vacant an Accountant I position ($59,430) for one year.
Within the Asset Management Program, eliminate funding for legal expenses ($35,000) that were associated with the possibility of an EPA consent order.
Within Watershed Revegetation Program reduce support for private property stormwater retrofits ($75,500).
Within the Construction Services Program eliminate a vacant Chief Engineer ($138,342) position and within all Engineering Services programs eliminate 25% of training and travel ($37,500) for 180 employees within Engineering Services. Additionally, the program is eliminating a Senior Administrative Specialist ($51,540) at mid-year, a position that is on loan for community outreach purposes related to the FOG program.
Within Pollution Prevention Services, reduce maintenance of grounds at Water Pollution Control Lab and changes in scheduled services from Parks ($27,398), reduce office support, travel and outside laboratory services ($100,150), reduce maintenance inspection program for privately owned stormwater facilities ($10,000), eliminate agreement with DEQ for Underground Injection Control permits as this is being done in-house ($19,000) and hold vacant an Environmental Program Manager within the Environmental Compliance Program for one year ($115,356).
Watershed Services reduces outside support to continue the implementation of the Portland Watershed Management Plan ($65,000), and eliminates two interagency agreements with Parks; these include the IGA with Multnomah County for dog rule enforcement ($69,000) and Arbortec fungicide to protect elm tree canopy ($62,500). Additionally, the Grey to Green program is deferring funding for the ecoroof grant program to reflect lower-than-forecast expenditures due to current economic conditions ($637,512).
Wastewater Services reduces overtime ($50,000) within the Treatment program by budgeting for historical trends; reduces operating budget funding for emergency repairs ($250,000) as they are more appropriately recorded within the CIP; eliminates funding for a forklift ($20,938); holds vacant an Electrician/Instrument Technician ($93,972) for one year; and reduces security services ($62,500) as the new Support Facility, operational January 2013, will have security card access, thus eliminating the need for on-site security guards. There are no reductions within the Collections System Program.

268 City of Portland, Oregon – FY 2012-13 Adopted Budget
Bureau of Environmental ServicesPublic Utilities Service Area
Vacancy Savings
The bureau eliminated an additional 7.5 FTEs and associated budget of $467,436. The positions eliminated are the Portland Harbor Superfund Administrator, a CAD Technician II, a Capital Projects Manager I, a Senior Engineering Associate (Civil), 1.5 Engineering Technicians IIs, a Environmental Technician I, a part-time Senior Management Analyst and a part-time Senior Administrative Specialist. Of the total vacancy cuts, 5.25 FTEs resulted in savings within the operating budget.
COLA and Merit Savings
The Adopted Budget includes delaying cost of living adjustments until the first pay period in June 2012 and freezing merit increases for non-represented employees with a salary over $45,000 per year to achieve a total savings of $884,909.
OMF Interagency Adjustments
As a result of mandatory and efficiency reduction packages submitted by the Office of Management and Finance internal service operations, the Bureau's interagencies have decreased by a total of ($415,763), including COLA savings passed through to customer bureaus. The reductions include:
Debt Management reduction of $11,009 reflecting savings in consulting contracts.
Enterprise Business Solution Fund reduction of $110,704 reflecting savings in consulting contracts and reductions to corporate applications, emergency management system and professional development.
City Fleet reduction of $1,626 reflecting the bureau's share of COLA savings. Risk Management reduction of $25,400 reflecting savings from reducing excess
liability second layer and eliminating an office support position. Technology Services reduction of $257,014 reflecting savings from a mobile data
contract, discounts for 800 MHz radio equipment replacement and GIS major maintenance. Other areas of savings were cuts in materials and services for IRNE operations, Business Solution support, Support Center, Telecommunications, Windows Server support and Radio System support. Positions cuts of 10.0 FTE also contributed to the savings.
Facilities Services reduction of $30,714 reflecting savings through the elimination of Portland Building desk-side trash service, replacement of paper towels in the Portland Building restrooms with electronic hand dryers, the elimination of regularly scheduled air quality testing, the reduction of renewable energy funding account and reduction of software upgrades and support staffing. Additional cuts to the Portland Building operations will reduce winter temperature to 68 degrees, increase summer temperature to 74 degrees, reduce window cleaning, and reduce custodial services by 4%.
Printing and Distribution reduction of $11,925 reflecting savings through cuts to equipment maintenance, copier/printer replacement cycles, inter-office efficiencies and the elimination of one position.
City of Portland, Oregon – FY 2012-13 Adopted Budget 269
Bureau of Environmental ServicesPublic Utilities Service Area
The above savings are offset by additional cost-sharing of $100,956 for these centralized city services:
Facilities Services funding of $27,932 for American with Disabilities Act Phase II and III Compliance Assessment.
Procurement funding of $17,711 for a Minority Evaluator to support the City's minority evaluator services in reviewing Professional, Technical, and Expert (PTE) contracts and bids. Additional duties include bureau support management for the Mayor's Summer Youth Connect Program through SummerWorks. This cost will be added to the General Fund overhead recovery model in FY 2013-14.
Procurement funding of $55,313 for Reinvestment Act (ARRA) position support. This one-time extension of funding will allow Procurement Services compliance staff to continue compliance monitoring activities.
Adds Portland Loos
The Portland Water Bureau will transfer all Portland Loos' assets and maintenance responsibilities to BES effective July 1, 2012. The maintenance responsibilities on seven facilities is estimated at $105,000 to maintain and $14,000 for annual repairs. Bureau budget reductions to absorb this additional cost were derived from funding decreases for interns and security and project management services from central facilities.
Capital BudgetBureau Summary
CIP Highlights and Major Issues
BES successfully met its December 2011 deadline for Combined Sewer Overflow (CSO) commitments mandated by the requirements of the Amended Stipulation and Final Order (ASFO). A few small projects remain to be completed (1% of the total CIP). The majority, 63%, of the 5-Year CIP is in Maintenance and Reliability. The balance is divided among Sewage Treatment Systems (18%), Surface Water Management (15%), and Systems Development (3%). BES operates and maintains an extensive array of capital facilities that include both sanitary and storm water collections systems, pumping and treatment facilities, and watershed enhancements.
In order to manage the Bureau's extensive infrastructure investment, BES is developing an asset management approach to prioritize future investment. Much of the collection system pipe in the City's older neighborhoods is more than 100-years old. BES has a regular inspection program to determine pipe condition and utilizes capital projects and operational activities to rehabilitate or replace failing pipe. The recently completed system plan element for the sanitary and combined collection systems, identified an estimated $123 million in priority pipe maintenance needs. The Sewage Treatment Systems program is to maintain and upgrade the two wastewater treatment plants (Columbia Boulevard and Tryon Creek) and nearly 100 pump stations located throughout the collection system. A number of major upgrades are underway at the Columbia Boulevard plant. These upgrades are required in order to continue to meet permit requirements and to handle the increased flow from the CSO projects.

270 City of Portland, Oregon – FY 2012-13 Adopted Budget
Bureau of Environmental ServicesPublic Utilities Service Area
Changes from Prior Year
In comparing this proposed five-year CIP to last year's 2012-2016 CIP, the four common years (2013-2016) have increased by $13 million or 3%. The increase can be attributed to a combination of minor shifts in project schedules and project priorities and a 1.016% escalation factor for future projects. All projects in the five-year CIP are in FY 2012-13 dollars. The five-year financial forecast, however, makes assumptions for escalation to account for the future cost of construction.
Strategic Direction
Criteria In 2011, the Bureau updated its Strategic Plan, incorporating an increased emphasis on asset management principles. The CIP development strategy is built on the Bureau's strategic plan, input from the 2006 Citizen Task Group, updates to the systems plan, and the regulatory framework. The CIP is shaped by the strategic directives and further shaped by the regulatory environment and stresses the need for comprehensive, multi-objective solutions and reflects the objectives of River Renaissance, the Comprehensive Plan, and the Portland Watershed Management Plan.
Council Goals and Priorities
Over the past few years, citizens and neighborhood committees have been more involved in the planning and development of the Bureau's capital projects. This involvement has included interest in specific construction projects such as the stream restoration work and sewer replacement projects in major arterial streets. Public involvement has also come in the form of policy advisory groups for work elements like the update to the Stormwater Management Manual and the Portland Watershed Management Plan. In addition, there are a number of standing committees including the Stormwater Advisory Committee, the Watershed Science Advisory Committee, the Portland Utility Review Board, and the Columbia Boulevard Wastewater Treatment Plant Citizens Advisory Committee.
As part of the FY 2012-13 budget development process, the Bureau convened a Budget Advisory Committee (BAC). The BAC was briefed on the proposed CIP and its impact on sewer rates. Following extensive discussion, the BAC endorsed the CIP. The CIP development strategy is consistent with the City's goal to improve water quality and the overall well-being of its citizens. It is focused on strategic and comprehensive program delivery and environmental protection and restoration within a prescribed regulatory framework. Priority is given to those projects mandated by federal and state laws and those projects that address City Council goals and objectives.
City Comprehensive Plan
The City's Comprehensive Plan guides future development through a set of goals and policies across a broad range of urban issues. One of those policy areas is public facilities and services which provides guidance on how the City spends money to maintain and construct physical facilities and public services necessary to support the approved land use patterns. The sanitary and stormwater facilities goal and policies state that facilities be provided in an efficient and adequate manner to support the needs of the public while also meeting federal, state, and local clean water requirements. Specific policies address preventative maintenance, control of combined sewer overflows, sewer connection priorities, operation of treatment plants, master planning for stormwater management, and the limit of impervious surfaces. The CIP reflects a commitment to improving the water quality in Portland and to meeting the Comprehensive Plan's sanitary and stormwater facilities policies.

City of Portland, Oregon – FY 2012-13 Adopted Budget 271
Bureau of Environmental ServicesPublic Utilities Service Area
Capital Planning & Budgeting
Capital Planning Process
The CIP is developed utilizing a multi-step process to identify, develop, review, score, and rank projects for funding and scheduling priority. This process insures that the core needs of the sewerage, drainage, and surface water systems and the community served are appropriately funded and scheduled. A bureau-wide stakeholder review team investigates, scores, and ranks all CIP projects in accordance with identified CIP Criteria. CIP weighted criteria, scoring instructions, scheduling guidelines, estimating procedures, and project request forms are used to ensure each project is developed, reviewed, and scored based on detailed and consistent information. A CIP development strategy guides project selection and scheduling. Projects are reviewed by managers in finance, program areas, operations, and engineering to ensure financial resources are expended effectively and appropriately. The CIP management team evaluates all the information from the process, meets with selected Bureau project and program managers to refine cost and schedule data, and submits a recommendation to the Bureau Director. The Bureau Director then reviews the findings and approves the CIP.
Financial Plan Overview
The most recent five-year financial forecast presents the bureau's revenue and expenditure plan for the operation, maintenance, expansion, and reconstruction of the City's sanitary sewer and stormwater systems. The operations, maintenance, and capital construction programs represented in the plan must provide for operation of the system in a safe, sound, and efficient manner as well as compliance with all applicable health, safety, and environmental laws, regulatory body rules, regulatory body orders, and court orders. Revenues from rates and other sources must be sufficient to fund the necessary operation and capital programs. With the Adopted Budget, the Bureau forecasts annual rate increases of 5.4% in FY 2012-13 and 6.5% the following year, 5.2% in the third and fourth years, and 3.75% for the fifth year. These increases are due to growth in annual debt service costs resulting from the CIP, partially offset by transfers from the Rate Stabilization Fund, and increases in non-rate revenues. All CIP expenditures in the financial forecast include an estimate for inflation.
Asset Management and Replacement Plans
In the March 2012 Citywide Assets Report, BES reported an annual funding gap of $23.3 million. This gap includes rehabilitation and capacity needs in four major systems: combined sewers, sanitary only sewers, stormwater conveyance and water quality facilities, and sewage treatment. The estimated gap is based on information from different sources including: The difference between the amount of needed pipe rehabilitation identified in
the Combined and Sanitary Sewer Elements of the System Plan and the amount included in the financial plan.
The capacity projects in the combined system with positive benefit/cost ratios not included in the financial plan as identified in the System Plan.
For stormwater and treatment, the estimated funding gap is based on the difference between the replacement value of assets in very poor condition and the amount of funding in the financial plan for the rehabilitation of those assets.

272 City of Portland, Oregon – FY 2012-13 Adopted Budget
Bureau of Environmental ServicesPublic Utilities Service Area
Capital Programs and Projects
Program Description The Capital Improvement Program is divided into five program areas: Combined Sewer Overflow, Maintenance and Reliability, Sewage Treatment Systems, Surface Water Management, and Systems Development.
Combined Sewer Overflow
Approximately 60% of Portland's population is served by a combined sewer system which carries both domestic sewage and stormwater runoff. With significant rainfall, historically, stormwater runoff has exceeded the carrying capacity of the combined sewers, causing overflows through outfalls to both the Willamette River and the Columbia Slough. With the completion of the 2011 ASFO requirements, overflows to the Columbia Slough are reduced by 99.6% and to the Willamette River by 94%. Only a few minor CSO related projects remain to be completed: the Portsmouth Odor Control Facility, adjustments to automated control systems, and a land use requirement to restore the field office site.
Maintenance and Reliability
Projects in this program area address major maintenance requirements of the sewerage collection system including collector sewers, trunk sewers, and interceptor sewers. The City's sewerage collection and transportation system includes approximately 2,470 miles of sewer line ranging in diameter from four inches to 14 feet. Much of the collection system pipe in the City's older neighborhoods is more than 100 years old. In some areas of the City, recurrent basement flooding is a problem creating health and environmental hazards as well as property damage. This program addresses those problems using a multi-objective approach which includes on-site drainage controls, street inflow controls, and up-sizing undersized public facilities that are causing backup of sewage into basements. Funding in this program area is focused on rehabilitation/reconstruction of the most structurally deficient portions of the collection system.
Sewage Treatment Systems
This program funds projects located at the Columbia Boulevard Wastewater Treatment Plant (CBWTP) and the Tryon Creek Wastewater Treatment Plant (TCWTP) as well as maintenance and repair/rehabilitation of the 97 active pump stations located system-wide. Both treatment plants operate within the framework of the Federal Clean Water Act. Specific requirements for removal of pollutants from wastewater before the treated effluent is discharged into the Columbia or Willamette Rivers are contained in the NPDES permit for each plant. High priority is given to projects that provide operating efficiency, reliability, and longevity of the facilities. Most of these improvements include replacement and reconstruction of aging and unreliable plant or pump station components. Projects that mitigate odor from the CBWTP are also part of this program in accordance with a citizen supported City Council resolution.

City of Portland, Oregon – FY 2012-13 Adopted Budget 273
Bureau of Environmental ServicesPublic Utilities Service Area
Systems Development
In support of the 2040 plan, this programs funds projects that cost effectively and incrementally expand the City's sewer collection system. Work meets multiple watershed objectives in execution of these projects. In addition, the program manages sewer rehabilitation and/or relocation required for major public infrastructure projects managed by others, specifically the extension of streetcar to the eastside and light rail to Milwaukie.
Surface Water Management
The primary objective of this program is to protect the quality of surface and ground waters by addressing watershed health and public safety concerns associated with flooding, stream erosion, and urban pollution. Water quality and flood control projects are located in the Columbia Slough, Fanno Creek, Johnson Creek, Tryon Creek, and along the main stem of the Willamette River. Projects are developed to meet the provisions of the Watershed Management Plan adopted by City Council in 2005. This program is also guided by the ESA Resolution adopted in 1998, the Clean River Plan finalized in 2000, and the River Renaissance Vision adopted in 2001.
The Surface Water Management Program focuses on conditions placed on the City associated with owning and operating 9,000 active Underground Injection Control Systems (UICs). As part of this permit, the City is required to identify any UIC that will not meet conditions of the permit and retrofit or decommission them. Projects proposed under this program include construction of Pollution Reduction Facilities (PRF), sump retrofits, stream restorations, and the installation of surface water filtering systems. By addressing water quality and flooding issues, these projects aim to protect fish, enhance wildlife habitat, and enhance community livability through the "greening" of urban areas.
Funding Sources Planned CIP outlays total $523 million (excluding inflation) over the five-year forecast interval FY 2012-13 through FY 2016-17. A brief description of the resources needed to finance this requirement follows:
Fees, Charges, and Permits. This source of funding includes an estimate of reimbursements for engineering, administration, and construction management services charged to local improvement districts and for permit sewer construction. Also included are anticipated revenues from construction and/or engineering services for projects initiated by other local government agencies such as the PBOT and the Port of Portland.
Line and Branch Charges. Charges in lieu of assessment will be used to support CIP outlays. Line and branch charges are received in the form of cash and in the form of proceeds from special assessment bonds issued for property owners who elect to finance their line. branch and SDC charges. Total revenues from these charges are projected to be approximately $11.2 million over the five-year forecast interval.

274 City of Portland, Oregon – FY 2012-13 Adopted Budget
Bureau of Environmental ServicesPublic Utilities Service Area
Cash Transfers from the Sewer System Operating Fund. Current Sewer System net income from service fees and charges will also be used to fund CIP outlays. The availability of current income to fund CIP expenditures is the result of meeting debt service coverage requirements on outstanding bonds. For planning purposes, the Bureau maintains coverage ratios of 1.50 on first lien debt, 1.30 on combined first and second lien debt, and an ongoing reserve of ten percent of operating expenses for unforeseen financial needs. After making debt service payments, funds in excess of those required for the ten percent operating reserve are available to fund capital improvements. Cash transfers from the Sewer Operating Fund to the Construction Fund are projected to total $104.2 million over the five-year forecast interval.
Bond Proceeds. Based on current planning assumptions, the Bureau's five-year CIP request will require $640 million (nominal dollars) in additional borrowings over the next five fiscal years. Debt service requirements for future bond sales have been calculated assuming level debt service. Interim short-term financing may be used in lieu of or in combination with, long-term financings. The forecast assumes an average annualized coupon rate of 5.5% for the bonds sold in FY 2012-13, 6.25% for the bonds sold in FY 2014-15, and 6.5% for the bonds sold in FY 2016-17, all with the bureau's planning standard debt service coverage ratios of 1.50 and 1.30, as mentioned previously.
Major Projects Major CIP projects include the following highlights:
Fanno Basin Improvements
This group of projects will address deficiencies in the Fanno Basin Pump Station Pressure Line system. Remaining work includes the expansion of the existing pump station and improvements to major trunk lines.
Phase 2 Pipe Rehabilitation
This project includes structural rehabilitation of critical combined and sanitary sewers that are at the end of their economic life and have the highest consequence of failure. The pipes have been prioritized based on their business risk exposure so that the pipes with the highest benefit-to-cost ratios are completed first. This dynamic priority list will be updated once a year and the highest priority pipes will proceed to design and construction. The initial list identified 458 small diameter sewers (36 inch or less) and 59 large diameter sewers requiring whole pipe rehabilitation.
Ankeny Pump Station Upgrade
This project will modernize the aging Ankeny Pump Station: replace 4 sewerage pumps and associated systems; add upgraded instrumentation, control, and communication to operate with the Willamette River CSO Control System during storm events; and make exterior improvements to be more compatible with the Waterfront Park.
CBWTP Secondary Process Improvements
Construct upgrades to aeration basins and instrumentation and controls to improve the settling of solids produced in the secondary treatment process to allow the existing secondary clarifiers to better remove solids. Improvements are needed to continue to meet the requirements of the NPDES permit.

City of Portland, Oregon – FY 2012-13 Adopted Budget 275
Bureau of Environmental ServicesPublic Utilities Service Area
Operating and Maintenance Costs
Each project includes estimated Operating and Maintenance (O & M) costs (or savings) to be included in the operating budget once the facility comes on line. The O & M estimates for costs or savings were prepared by the Wastewater Group. The basis for the estimates depended upon the type of expected impact. The four major components for treatment plant O & M are labor, energy, chemicals, and materials. Costs for energy and chemicals are more easily predicted. The equipment projected for installation has design parameters that more clearly dictate the resource demands. If there is a direct labor application which will have changed as a result of a project, that estimate would be accurate. However, labor and material costs are more commonly based on experienced estimates with similar projects and facilities from either the City of Portland or others.

276 City of Portland, Oregon – FY 2012-13 Adopted Budget
Bureau of Environmental ServicesPublic Utilities Service Area
Administration & Support Administration & SupportDescription The Administrative Services program area manages the Bureau of Environmental
Services, coordinates the activities of the bureau's five service provider groups, and ensures timely and appropriate response to the public, ratepayers, and regulatory agencies. Coordination includes overseeing the development of the bureau's budget and managing review of programs, projects, and services offered by the bureau.
Administrative Services works closely with other City bureaus, regulatory agencies, the Natural Resource Trustees, and tribal governments on local, state, and national environmental issues. The Administrative Services program area provides supervision of the following specific service areas:
Public Information and Community Outreach and Involvement provides public information, communication planning, public involvement, environmental education, and internal communication services required to meet the mandates of several state and federal requirements.
Environmental Policy is responsible for developing environmental policies, rules and codes, and coordinating that work within the bureau, with other city bureaus, interest groups, and federal, state, and local agencies involved in environmental planning and implementation affecting the City.
Bureau Support provides operating and administrative services for all bureau programs.
Employee Development includes identifying training needs and solutions for managers and employees, coordinating internal and external education and training, and maintaining the bureau's database of employee training and development activities.
Finance includes budget development, accounting, financial planning and forecasting, debt management, rate development, grants management, project tracking and year-end financial reporting, wholesale service contract development and administration, management of the Clean River Rewards stormwater discount program and administration of the Party Sewer Conversion program.
Information Management activities include administering the bureau's data management software and software needs.
Goals Public Information and Community Outreach and Involvement support the City goal to protect and enhance the natural and built environment by communicating the importance of these goals to City residents and ratepayers through public information, education, and involvement in bureau programs and projects.
Environmental Policy provides indirect support to the city goal of protecting the natural and built environment by working with legislation and regulations that protect the environment.
Bureau Support, Employee Development, and Finance provide indirect support to the City goal of protecting the natural and built environment by performing necessary business processes, helping to enhance employee skills, and securing necessary financing for bureau operating programs and capital construction.

City of Portland, Oregon – FY 2012-13 Adopted Budget 277
Bureau of Environmental ServicesPublic Utilities Service Area
Information Management supports the City goal of protecting the natural and built environment by developing and maintaining the data to support the bureau's asset management efforts.
Performance Communication performance measures focus on an increased community awareness of BES programs and services, engaging citizens in the decision making processes for bureau projects and programs that impact the community, and providing clean river education opportunities for grades K-12.
The bureau's debt service coverage ratio for all revenue bonds was 1.32 for FY 2010-11 and is 1.30 for FY 2011-12. The goal is to maintain the financial planning standard of 1.30 over the coming five years. The bureau's current bond rating is Aa3/ AA, a strong rating for sewer revenue credit. The goal is to maintain this rating.
The bureau's accident/injury incident rate (recordable incidents per 100 workers) is 3.2 for FY 2010-11, down from 3.36 for the previous year. The goal for FY 2011-12 is to keep reportable incidents per 100 employees at or below 4.0.
Changes to Services and Activities
The Environmental Policy group will eliminate a Principal Financial Analyst ($139,932) due to retirement.
The Finance group will eliminate one-year consultant funding ($21,000) for rate approval process, remove ($35,615) contribution for the COPPEA Professional Development Fund for one year, eliminate consultant support ($23,315) for auditing bureau contracts, hold vacant an Accountant I position ($59,430) for one year and eliminate a Senior Administrative Specialist ($51,540) at mid-year, a position that is on loan for community outreach purposes related to the Fats, Oils and Greases program. There are no service delivery impacts resulting with these reductions.
The Bureau Support group will reduce maintenance of grounds at the Water Pollution Control Lab (WPCL) and will implement changes in scheduled services from Parks ($27,398) and reduce WPCL facility operations and maintenance from centralized Facilities Services ($16,800). Funding is eliminated for a treatment plant forklift ($20,938) and for plant security services ($62,500). In additional to the specific reductions above, pass-through savings from centralized services from the Office of Management totaling $387,803 were offset by $73,024 of additional pass-through charges for procurement activities. There are no service delivery impacts resulting with these reductions.
In additional to the specific program cuts above, there was a one-time elimination of merit increases for non-represented personnel that saved $33,906.
The assets and maintenance responsibilities for the Portland Loos, which will cost $119,000, has transferred from the Water Bureau effective July 1, 2012, and has been included in this budget program, but managed by the Wastewater Treatment Group. Additional internal bureau reductions were made to absorb the extra cost.

278 City of Portland, Oregon – FY 2012-13 Adopted Budget
Bureau of Environmental ServicesPublic Utilities Service Area
FTE & Financials Actual
FY 2009-10 Actual
FY 2010-11 Revised
FY 2011-12 ProposedFY 2012-13
AdoptedFY 2012-13
FTE 76.95 76.80 68.50 67.50 67.00
Expenditures
Administration 1,005,169 1,054,487 1,296,801 1,222,537 1,222,537
Administration & Support 22,351 53,237 0 0 0
Bureau Support 7,599,579 6,700,955 8,172,305 8,143,211 8,233,727
Communications 919,814 906,446 927,383 908,020 908,020
Employee Development 516,171 441,183 86,867 77,720 77,720
Facilities 90 0 0 0 0
Finance 4,621,052 4,930,933 7,004,880 20,364,280 20,837,740
Information Management 5,525,162 6,956,057 5,033,578 5,204,780 5,204,780
Planning 0 155 0 0 0
Total Expenditures 20,209,388 21,043,453 22,521,814 35,920,548 36,484,524
Performance Actual
FY 2009-10 Actual
FY 2010-11 Yr End Est.FY 2011-12
BaseFY 2012-13
TargetFY 2012-13
Effectiveness
Maintain the bureau's first lien debt service coverage ratio at 1.5 or greater
1.71 1.97 1.95 1.95 1.95
Maintain bureau's combined 1st & 2nd lien debt service coverage ratio at 1.3 or greater
1.30 1.31 1.30 1.31 1.31
Efficiency
Time loss hours (due to injuries) 3.36 3.20 4.00 4.00 4.00
Workload
No. of students provided with bureau education programs 15,759 16,121 11,500 12,500 12,500

City of Portland, Oregon – FY 2012-13 Adopted Budget 279
Bureau of Environmental ServicesPublic Utilities Service Area
Engineering EngineeringDescription Engineering Services serves the community by managing the planning, design, and
construction of public improvements necessary to protect public health and watersheds. Engineering Services provides analyses, design, construction management, technical standards, documentation of best management practices, protection and enhancement of the system, development review and permitting, CIP program and budget management, and implementation of programs to protect infrastructure.
Program Management & Controls develops the bureau's annual capital budget and five-year capital improvement plan, monitors the budget and program, and provides support functions for program delivery.
Asset Systems Management provides short and long-term engineering analyses and planning for combined, sanitary, and stormwater facilities and watersheds using an asset management framework. It is responsible for developing and leading improvement to the bureau's asset management program and manages the CSO program to ensure the requirements of the Amended Stipulation and Final Order are met in a timely, cost effective, and functional manner.
Design Services provides project management and engineering design services, and is responsible for ensuring each assigned project accomplishes its intended purpose on schedule, within budget, at best value, and in a manner consistent with City and bureau missions and values.
Watershed Revegetation reforests city natural areas and adjacent lands, plants and maintains City greenstreets and stormwater management facilities, and plants street trees to improve the urban forest canopy and enhance the functional ability of urban watersheds.
Construction Services provides construction management and inspection services for bureau projects, development projects and projects managed by other City bureaus for assets that become part of the BES infrastructure. This program also provides materials testing, inspection, and geotechnical services for both bureau projects and projects managed by other City bureaus.
Systems Development assists developers and other customers and supports City development goals by reviewing and approving plans, issuing permits and inspecting private stormwater facilities. This division also has primary responsibility to develop and revise the City's Stormwater Manual and to implement policies that protect water resources and stream integrity.
Administrative/Stormwater Retrofit Services manages group operations, operating budget, personnel, and contract services, and provides support to all group programs. This program also partners with private property owners to increase on-site stormwater management at targeted locations in support of distinct bureau priorities.
Goals Engineering Services supports the City goal of protecting and enhancing the natural and built environment by preserving, protecting, and enhancing infrastructure. Engineering Services manages wastewater and stormwater assets to preserve and enhance the value of the community's investment; aggressively controls sewer overflows and basement flooding; explores and evaluates innovative technologies and solutions; and integrates natural system concepts into design, construction, and maintenance of systems that retain or improve the current service level.
280 City of Portland, Oregon – FY 2012-13 Adopted Budget
Bureau of Environmental ServicesPublic Utilities Service Area
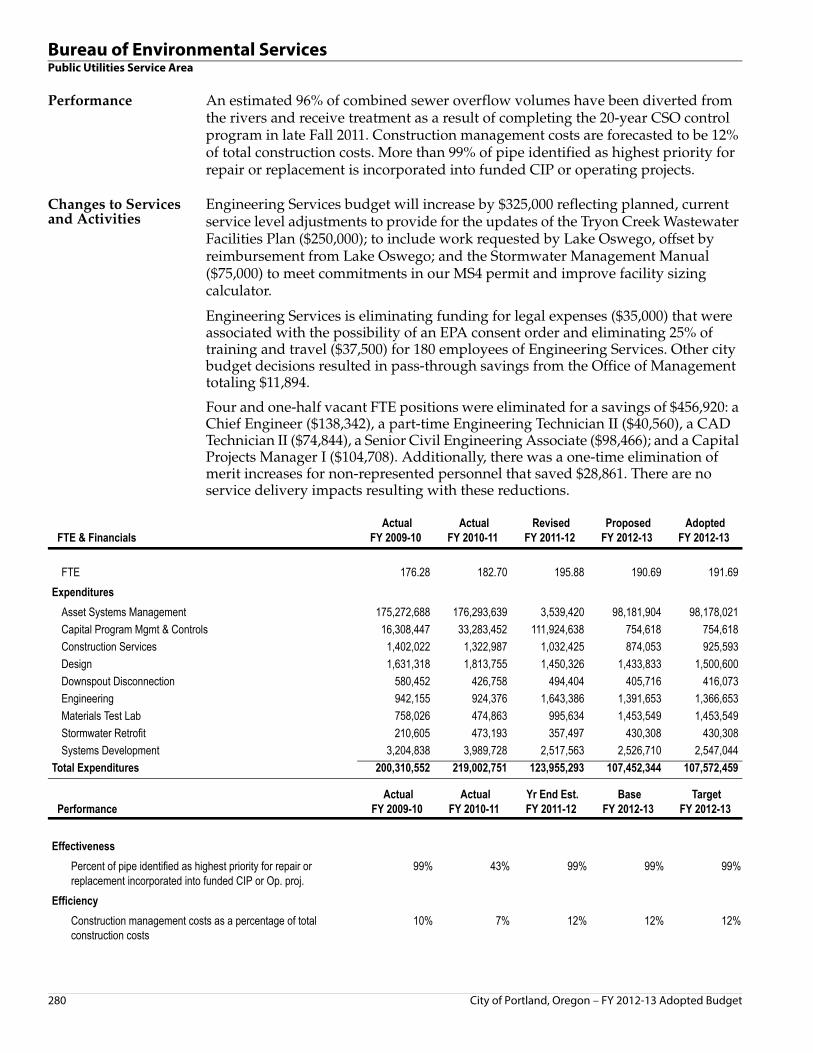
Performance An estimated 96% of combined sewer overflow volumes have been diverted from the rivers and receive treatment as a result of completing the 20-year CSO control program in late Fall 2011. Construction management costs are forecasted to be 12% of total construction costs. More than 99% of pipe identified as highest priority for repair or replacement is incorporated into funded CIP or operating projects.
Changes to Services and Activities
Engineering Services budget will increase by $325,000 reflecting planned, current service level adjustments to provide for the updates of the Tryon Creek Wastewater Facilities Plan ($250,000); to include work requested by Lake Oswego, offset by reimbursement from Lake Oswego; and the Stormwater Management Manual ($75,000) to meet commitments in our MS4 permit and improve facility sizing calculator.
Engineering Services is eliminating funding for legal expenses ($35,000) that were associated with the possibility of an EPA consent order and eliminating 25% of training and travel ($37,500) for 180 employees of Engineering Services. Other city budget decisions resulted in pass-through savings from the Office of Management totaling $11,894.
Four and one-half vacant FTE positions were eliminated for a savings of $456,920: a Chief Engineer ($138,342), a part-time Engineering Technician II ($40,560), a CAD Technician II ($74,844), a Senior Civil Engineering Associate ($98,466); and a Capital Projects Manager I ($104,708). Additionally, there was a one-time elimination of merit increases for non-represented personnel that saved $28,861. There are no service delivery impacts resulting with these reductions.
FTE & Financials Actual
FY 2009-10 Actual
FY 2010-11 Revised
FY 2011-12 ProposedFY 2012-13
AdoptedFY 2012-13
FTE 176.28 182.70 195.88 190.69 191.69
Expenditures
Asset Systems Management 175,272,688 176,293,639 3,539,420 98,181,904 98,178,021
Capital Program Mgmt & Controls 16,308,447 33,283,452 111,924,638 754,618 754,618
Construction Services 1,402,022 1,322,987 1,032,425 874,053 925,593
Design 1,631,318 1,813,755 1,450,326 1,433,833 1,500,600
Downspout Disconnection 580,452 426,758 494,404 405,716 416,073
Engineering 942,155 924,376 1,643,386 1,391,653 1,366,653
Materials Test Lab 758,026 474,863 995,634 1,453,549 1,453,549
Stormwater Retrofit 210,605 473,193 357,497 430,308 430,308
Systems Development 3,204,838 3,989,728 2,517,563 2,526,710 2,547,044
Total Expenditures 200,310,552 219,002,751 123,955,293 107,452,344 107,572,459
Performance Actual
FY 2009-10 Actual
FY 2010-11 Yr End Est.FY 2011-12
BaseFY 2012-13
TargetFY 2012-13
Effectiveness
Percent of pipe identified as highest priority for repair or replacement incorporated into funded CIP or Op. proj.
99% 43% 99% 99% 99%
Efficiency
Construction management costs as a percentage of total construction costs
10% 7% 12% 12% 12%

City of Portland, Oregon – FY 2012-13 Adopted Budget 281
Bureau of Environmental ServicesPublic Utilities Service Area
Healthy Working Rivers Healthy Working RiversDescription Healthy Working Rivers (HWR) promotes the integration of environmental
restoration, economic development, and community involvement for the Portland segments of the Willamette and Columbia Rivers. HWR facilitates river-related projects contributing to City and regional economic prosperity and implements habitat improvement projects to restore and protect riparian ecological functions. HWR coordinates implementation of river-related projects restoring and protecting ecological functions, identifies and selects pilot restoration projects, and facilitates river projects contributing to City and regional economic prosperity.
Goals HWR's activities support efforts to enhance watershed health with a focus on the City's two main stem rivers. The office supports the City's goals to promote economic development by redeveloping Brownfield sites and connecting the community to the river to build support for improvements to watershed health.
Performance HWR continues to provide support for restoration projects in the industrial harbor to enhance ecological values and promote economic redevelopment. The group supports implementation of a compensatory mitigation bank to support watershed restoration efforts; reviews river-related plans and programs to ensure that watershed health, economic development, and community involvement goals are being met. HWR engages other bureaus and stakeholders in discussions related to on-river recreational needs, public access and environmental protection goals and builds partnerships to support the City's watershed health efforts.
Changes to Services and Activities
Healthy Working Rivers will reduce outside consultant assistance ($35,000) and eliminate a vacant Office Support Specialist III position ($75,564). There are no service delivery impacts resulting with these reductions. Additionally, there was a one-time elimination of merit increases for non-represented personnel that saved $3,930.
FTE & Financials Actual
FY 2009-10 Actual
FY 2010-11 Revised
FY 2011-12 ProposedFY 2012-13
AdoptedFY 2012-13
FTE 4.00 5.00 5.00 5.00 4.00
Expenditures
Healthy Working Rivers 393,512 746,971 800,726 698,019 622,455
Total Expenditures 393,512 746,971 800,726 698,019 622,455

282 City of Portland, Oregon – FY 2012-13 Adopted Budget
Bureau of Environmental ServicesPublic Utilities Service Area
Pollution Prevention Pollution PreventionDescription Pollution Prevention Services includes three programs: Source Control,
Environmental Investigations, and Environmental Compliance. This service area also includes the Brownfield Program.
Source Control provides environmental oversight and technical services to industrial and commercial customers to control or eliminate harmful or toxic pollutants to the City's sewer systems. This environmental oversight supports compliance with various permits held by the bureau, including the NPDES permits for both the wastewater and stormwater systems.
Environmental Investigations provides wastewater, stormwater, surface water, groundwater, industrial wastewater, gases, soils and sediment sampling and monitoring services; a full-service environmental laboratory; and environmental project management including consultation, data analysis, and reporting for the bureau, other City bureaus, and outside agencies.
Environmental Compliance manages the bureau's regulatory enforcement process which includes industrial pre-treatment, stormwater, and other environmental regulations under the bureau's authority. This service area also ensures bureau compliance with its state and federal regulatory obligations including permits governing wastewater collection and treatment, influences environmental policy and regulations developed by other entities; and manages the City's stormwater and groundwater permits under the Clean Water Act and the Safe Drinking Water Act.
Brownfield Program involves clean-up and redevelopment activities through use of federal Brownfield grants, matching funds from the City and other public agencies, and investment by private sector partners. The focus of the program is to return previously contaminated property to productive economic and community use through partnership with neighborhoods and businesses.
Goals Pollution Prevention Services supports the City goal of protecting and enhancing the natural and built environment by increasing innovative pollution prevention strategies. Pollution Prevention Services provides technical assistance to City staff and to citizens to help others prevent pollution through effective permit management, best management practices and education, and partners with customers to prevent or control pollution at the source.
Performance In FY 2011-12 it is expected that 99% of industrial enforcement tests be in full compliance, which is the same level of performance as FY 2010-11. The goal for FY 2012-13 is to work with customers to maintain this level of performance.
Site investigations and remediation will require an average expenditure of $13,000 per site in FY 2012-13. This is more than double the figure for FY 2010-11. The methodology used to calculate the project costs was modified to analyze projects that represent the types of projects the section manages, for example green street projects, property acquisitions, restorations, dredge projects, and pipe projects. These projects were analyzed to obtain personnel and other costs charged to the project from SAP, work orders, and invoices. The average is much larger than in past years, but the size of the project has increased. Total costs per project ranges from around $3,000 to $100,000, with the rounded average of $13,000.

City of Portland, Oregon – FY 2012-13 Adopted Budget 283
Bureau of Environmental ServicesPublic Utilities Service Area
The Water Pollution Control Laboratory estimates it will perform 46,000 lab analyses in FY 2012-13. This figure is approximately the same as the actual number of testing performed during FY 2010-11. In FY 2010-11 46,048 tests were performed which was a significant increase from the previous years. The bureau is projecting approximately the same results because of a decrease in the types of tests required for the UIC Program with an increase in the number of tests coming from outside agencies.
Changes to Services and Activities
Pollution Prevention Services budget will increase by $181,000 reflecting planned current service level adjustments to provide for replacements of required lab equipment. Reductions will occur within Pollution Prevention Services and include reducing office support, travel, and outside laboratory services ($100,150); reducing maintenance inspection program for privately owned stormwater facilities ($10,000); eliminating agreement with DEQ for Underground Injection Control permits as this is being done in-house ($19,000); holding vacant an Environmental Program Manager for one year ($115,356); and eliminating a vacant Engineering Technician II ($74,844). There was a one-time elimination of merit increases for non-represented personnel that saved $8,731. Other city budget decisions resulted in pass-through savings from centralized services from the Office of Management totaling $11,382.
Effective July 1, 2013, the bureau will assume the responsibility of the Portland Loos at an additional cost of $119,000. The cost will be absorbed by $27,400 of internal cuts ($20,000 from minor equipment and $7,400 from the budget for intern support).
There are no service delivery impacts resulting with these reductions.
FTE & Financials Actual
FY 2009-10 Actual
FY 2010-11 Revised
FY 2011-12 ProposedFY 2012-13
AdoptedFY 2012-13
FTE 81.60 80.00 85.17 84.50 84.50
Expenditures
Env. Monitoring & Investigation 1,619,184 1,817,397 2,350,267 1,930,106 1,910,106
Environmental Compliance 1,695,327 2,378,343 4,332,355 3,515,962 3,534,962
Pollution Prevention 198,552 224,287 354,475 389,295 338,479
Source Control 2,827,185 2,839,050 3,607,239 3,425,463 3,402,355
Total Expenditures 6,340,249 7,259,077 10,644,336 9,260,826 9,185,902
Performance Actual
FY 2009-10 Actual
FY 2010-11 Yr End Est.FY 2011-12
BaseFY 2012-13
TargetFY 2012-13
Effectiveness
Percent of industrial enforcement tests in full compliance 99.0% 99.0% 99.0% 99.0% 99.0%
Efficiency
Average resources spent in site investigations and cleanup, per site investigated or remediated
$3,652 $6,132 $4,435 $13,000 $13,000
Workload
No. of lab analyses performed each year 39,800 46,048 41,000 46,000 46,000

284 City of Portland, Oregon – FY 2012-13 Adopted Budget
Bureau of Environmental ServicesPublic Utilities Service Area
Portland Harbor Portland HarborDescription The Portland Harbor Superfund program is managed through the Office of the
Director and is funded within the Environmental Remediation Fund. The existence of the bureau's Superfund program is recognition by City Council that a strong City presence in the Superfund cleanup is critical. The Administrator of the Portland Harbor Superfund Program reports to the bureau director. The Administrator represents the City at a management level in the Lower Willamette Group (LWG), and with the tribal governments, and federal and state agencies.
The City is a member of the LWG, composed of private and public entities who have signed a formal Consent Order agreement with the Environmental Protection Agency (EPA) to fund a contaminated sediment investigation. The City has a dual role as a party potentially responsible for cleaning up contaminated sediments and as a government with strong stewardship obligations and commitments. The City is also assessing the potential of the City's stormwater conveyance system to carry contamination from upland sources to the river sediments.
Program staff work with Natural Resource Trustee agencies and tribal governments on natural resource restoration efforts, and have developed government-to-government relationships with several tribal governments involved in the project. Program staff are working with other City staff, spearheading a Lower Willamette Ecosystem Restoration Project with the Army Corps of Engineers under the authority of the federal Water Resources Development Act (WRDA). This work is closely coordinated with the Office of Healthy Working Rivers, Bureau of Planning and Sustainability, and the BES watershed management staff.
The City is continuing to pursue and maintain a strong, direct government-to-government role with EPA, DEQ, and the six tribal governments on all of these issues in addition to its work as a member of the LWG.
Goals The Superfund program supports the City goal of protecting and enhancing the natural and built environment by actively participating in the Superfund cleanup. This involvement will also ultimately promote economic vitality and opportunities as Superfund cleanup issues are resolved. The City is helping to fund and coordinate the investigation and potential cleanup activities to ensure that the Lower Willamette River is fully evaluated in a timely and cost effective manner, the Lower Willamette is restored to protect human health and the environment, and liability is fairly allocated among all responsible parties.
Changes to Services and Activities
Reductions within Portland Harbor include eliminating a vacant Portland Harbor Superfund Administrator position ($119,046), a reduction in contractor assistance for outfall investigation ($125,000), CERCLA technical assistance ($200,000), elimination of an agreement with the Tribal Institute at Portland State University ($35,000) and reduction of payments to the LWG ($900,000), reflecting a planned decrease in contributions for studies in anticipation of a Record of Decision. There is also a reduction of ($190,528) in internal services for field operations and

City of Portland, Oregon – FY 2012-13 Adopted Budget 285
Bureau of Environmental ServicesPublic Utilities Service Area
laboratory services, offset by additional services from the City Attorney’s Office of $137,660. There was a one-time elimination of merit increases for non-represented personnel that saved $1,028. Other City budget decisions resulted in pass-through savings from centralized services from the Office of Management totaling $704. There are no service delivery impacts resulting with these reductions.
FTE & Financials Actual
FY 2009-10 Actual
FY 2010-11 Revised
FY 2011-12 ProposedFY 2012-13
AdoptedFY 2012-13
FTE 6.00 6.00 5.00 3.00 4.00
Expenditures
CERCLA (Superfund) 3,141 16,195 1,550,000 650,000 650,000
Portland Harbor 5,580,862 5,421,005 3,690,526 3,154,781 3,230,345
Total Expenditures 5,584,004 5,437,200 5,240,526 3,804,781 3,880,345

286 City of Portland, Oregon – FY 2012-13 Adopted Budget
Bureau of Environmental ServicesPublic Utilities Service Area
Waste Water WastewaterDescription Wastewater Services protects public health, water quality, and the environment by
cost-effectively operating and maintaining wastewater and stormwater collection, pumping and treatment facilities and managing related programs in a manner that assures compliance with all applicable permits, regulations, and contracts. In addition to two wastewater treatment plants, the system includes 97 active pumping stations, 2,328 miles of pipeline, 62,706 manholes, 8,548 stormwater sumps (UICs), 172,216 laterals, 758,117 lineal feet of ditches, 55,380 stormwater inlets and catch basins, 347 trash racks, 155 manufactured stormwater facilities, 1,375 "green" stormwater facilities, and 242 stormwater detention facilities. Additional services provided by Wastewater include residuals management, odor control, biosolids reuse, methane reuse, vector control, and emergency repairs.
Inspection, cleaning, maintenance, and repair for most sewer and stormwater facilities are provided through an interagency agreement with the Portland Bureau of Transportation Maintenance Division (PBOT). PBOT also provides collection system customer response and utility locating services.
This program also manages services that support the operation and maintenance of wastewater infrastructure. This includes administrative services, work and asset management system administration, facilities management, and inventory management and acquisition.
Goals Wastewater Services support the City goal of protecting and enhancing the natural and built environment by meeting regulatory requirements.
Performance The treatment process at both treatment plants continues to achieve removal of greater than 96% of total suspended solids and biochemical oxygen demand from the wastewater, compared with the 85% regulatory performance required in the NPDES permits. Wastewater Services plans to sustain this level of performance in FY 2012-13.
Collection and treatment facilities delivered and processed 30.4 billion gallons of wastewater during FY 2010-11. Factors affecting total volume include the degree of water conservation by customers, how much stormwater and groundwater are kept out of the system, the volume of captured CSO now in place, and rainfall in the service area. High rainfall during FY 2010-11 drove the total flow higher than originally anticipated. It is expected that wastewater conveyed and treated will total approximately 28.4 billion gallons in FY 2011-12, and, with a full year of East Side CSO flow captured and treated during FY 2012-13, total flow during FY 2012-13 is expected to increase to 30.4 billion gallons.
The operating and maintenance cost of wastewater treatment was approximately $509 per million gallons treated for FY 2010-11, driven down by the high rainfall. This is projected to increase in FY 2011-12 to about $555 per million gallons treated and then increase slightly again for FY 2012-13.
In an effort to continue to preserve system capacity and prevent sanitary sewer overflows in the collection system, 1.35 million feet of sewers were inspected and approximately the same feet cleaned, totaling 2.7 million feet inspected and cleaned in FY 2010-11. This is projected to remain approximately the same in FY 2011-12.

City of Portland, Oregon – FY 2012-13 Adopted Budget 287
Bureau of Environmental ServicesPublic Utilities Service Area
Changes to Services and Activities
Wastewater Services budget increased by $585,000 reflecting planned, current service level adjustments for increases in utilities and materials costs, as FY 2012-13 will be the first full year operating and maintaining all the new facilities associated with the CSO system. This includes $250,000 for collections system utilities; $80,000 for treatment plant utilities, $120,000 for chemically enhanced primary treatment, $50,000 for chemicals at Swan Island CSO Pump Station and $50,000 for hypochlorite prices increases that will take effect October 2012.
Additionally, CBWTP was issued a new NPDES permit, effective July 1, 2011. The permit includes several new requirements for monitoring, inspections, procedures and studies. These new regulatory requirements increase the bureau's work and supporting budget in several areas including $120,000 for outfall inspections, $8,200 for new permit procedures, and $129,000 for required studies.
Costs to sustain current service levels include $78,316 for biosolids transportation, $29,575 for polymer, $43,438 for services to maintain co-generation engines, $91,000 for replacement of existing inspection equipment, $220,000 for replacement of existing vehicles, $67,000 for replacement of an existing engine lath, the refunding of $25,000 for odor control chemicals, and $50,000 for utilities at Fanno Basin Pump Station with this facility back on-line.
Costs for additional services include $100,000 for adequate operation and maintenance of stormwater facilities, $190,000 for biosolids land application to return service levels to previous years' and mitigate accumulating solids in the lagoon, and $32,000 for services to inspect medium voltage variable frequency drives.
The increases are offset by reductions of $863,000 for fleet replacements assigned to PBOT for the collection system interagency and ($75,000) for security improvements that will be implemented by the end of FY 2012-13.
Wastewater Services' FY 2012-13 budget reflects additional reductions in overtime ($50,000) by budgeting for historical trends, reduced operating budget funding for emergency repairs ($250,000) as they are more appropriately recorded within the CIP, hold vacant an Electrician/Instrument Technician ($93,972) for one year, and eliminate a vacant Engineering Technician II ($74,844). There was a one-time elimination of merit increases for non-represented personnel that saved $6,935. Other city budget decisions resulted in pass-through savings from centralized services from the Office of Management totaling $68,228. There are no service delivery impacts resulting with these reductions.
Effective July 1, 2013, the bureau will assume the responsibility of the Portland Loos, at an additional cost of $119,000 of which this budget program contributed $7,400 of internal cuts (intern support) to absorb the added expense. Improved operational activities with regard to sale of methane gas to Malarkey Roofing resulted in an additional $60,000 of revenue. The Portland Loos has been included in the Administration and Support budget program, although managed by the Wastewater Treatment Group.

288 City of Portland, Oregon – FY 2012-13 Adopted Budget
Bureau of Environmental ServicesPublic Utilities Service Area
FTE & Financials Actual
FY 2009-10 Actual
FY 2010-11 Revised
FY 2011-12 ProposedFY 2012-13
AdoptedFY 2012-13
FTE 135.67 137.00 128.95 128.02 128.02
Expenditures
Collection System 27,183,599 25,298,363 34,821,609 31,603,509 31,596,109
Maintenance 1,641 2,061 0 0 0
Operations 0 1,657 0 (4,235) 0
Treatment 15,762,695 15,446,180 16,628,876 17,727,578 17,723,343
Wastewater 788,599 774,603 943,151 849,223 849,223
Total Expenditures 43,736,535 41,522,864 52,393,636 50,176,075 50,168,675
Performance Actual
FY 2009-10 Actual
FY 2010-11 Yr End Est.FY 2011-12
BaseFY 2012-13
TargetFY 2012-13
Effectiveness
Percent of biochemical oxygen demand (BOD) removed 96.5% 96.5% 85.0% 85.0% 85.0%
Efficiency
Cost to operate and maintain the treatment plants reflected in costs per million gallons per day (mgd)
$573 $509 $555 $565 $565
Workload
Wastewater processed in million gallons per day 27,566 30,449 28,450 30,400 30,400

City of Portland, Oregon – FY 2012-13 Adopted Budget 289
Bureau of Environmental ServicesPublic Utilities Service Area
Water Shed WatershedDescription The Watershed Services is comprised of three Programs: Watershed Management,
Sustainable Stormwater, and Endangered Species Act (Science Fish and Wildlife). The Group works with other City bureaus, local, regional, state and federal agencies and the Portland community to protect and restore our rivers and watersheds. Watershed Services plans, implements, and monitors watershed-based projects to meet regulatory mandates and maintain public health and safety. The group also tests, promotes, and implements sustainable site development practices and projects, and interprets and implements state and federal fish and wildlife laws, regulations, and policies.
The Watershed Management Program leads development and implementation of the Portland Watershed Management Plan (PWMP), which establishes comprehensive approaches and priority projects to protect and restore Portland's urban waterways. The FY 2012-13 is the seventh year of integrated watershed management under the PWMP. The PWMP is designed to integrate the City's response to regulatory requirements of the Clean Water Act, the Safe Drinking Water Act, the ESA, and other laws and programs in an approach based in ecological principles and watershed conditions, rather than relying strictly on regulatory requirements to define city actions. FY 2012-13 will be the fourth year implementing the Grey to Green Initiative, an acceleration of project activities under the PWMP.
The Sustainable Stormwater Management Program provides policy and technical assistance, education and outreach, and project design and implementation to demonstrate and create incentives for sustainable stormwater projects. Sustainable stormwater facilities cost-effectively reduce the volume of stormwater entering the combined system, mitigate impacts to sensitive habitats, and reduce stormwater pollutants. These projects also help the City meet resource protection and environmental compliance goals and regulations.
The Endangered Species Act (Science, Fish, and Wildlife) Program provides the scientific foundation needed to respond to, and implement, the City's environmental mandates - especially the ESA - and to integrate those mandates fully into the watershed context. The Program provides vital services and ecological expertise for implementation of a variety of city projects and programs in multiple bureaus. ESA also is responsible for managing a streamlined process for in-water construction permits for all City bureaus and for coordination with a variety of regional-scale watershed management programs.
Goals Watershed Services supports the City goal of protecting and enhancing the natural and built environment by improving and protecting watershed health within the urban community. Watershed Services demonstrates and promotes the advantages of watershed health protection when developing and implementing City programs and projects. Watershed Services responds to regulatory and environmental compliance using a natural systems approach (green infrastructure) to meet the

290 City of Portland, Oregon – FY 2012-13 Adopted Budget
Bureau of Environmental ServicesPublic Utilities Service Area
bureau's objectives, minimize costs, and provide maximum benefits. Watershed Services is working closely with the Bureau of Planning and Sustainability in the planning and implementation of the Climate Action Plan and the Portland Plan. Watershed Services also is investing significant support of asset management work within BES and integration of green infrastructure into system development work.
Performance Watershed Services and the Watershed Revegetation Program restored 26,225 feet of stream bank during FY 2010-11, bringing the bureau's cumulative total restored to over 376,000 feet. The bureau goal for FY 2011-12 and FY 2012-13 is to restore an additional 25,000 feet each year. The annual amount of stream bank restoration reported each year varies based on timing of project completion and the varying size and nature of projects.
Also in FY 2010-11, 9,965 people contributed thousands of volunteer hours in projects organized or coordinated by the Community Watershed Stewardship Program and other watershed stewardship programs. For FY 2011-12 and FY 2012-13, the number of participants is expected to remain fairly constant, with some variances in participation levels due to the type of volunteer projects that are selected for funding.
Watershed Services and the Watershed Revegetation Program planted 48,797 trees in FY 2010-11. The bulk of those were seedlings planted as part of natural area revegetation projects, while 7,348 were new (larger) street and yard trees planted through the Grey to Green initiative. The FY 2011-12 goal for natural area trees was 35,000, and the goal for new Grey to Green street and yard trees was 7,700. The target for FY 2012-13 is an additional 41,400 trees planted between the two programs.
The Grey to Green initiative accomplishments from 2008 to June 30, 2011 also include: over 281,000 square feet of ecoroofs constructed (6.47 acres), over 2,700 new acres treated for invasive plant control in parks and through the Early Detection Rapid Response program, 546 green street facilities constructed, and 261 acres of natural area purchased to protect water quality and restore watershed function. Of eight culverts targeted for replacement in Crystal Springs Creek, one is complete and five others are designed and slated for construction in FY 2012-13 and FY 2013-14, with the majority of the funding coming from the Army Corps of Engineers and other partners.
Changes to Services and Activities
Watershed Services budget increased by $300,012 reflecting a planned, current service level adjustment to ecoroof activities and $55,000 for the continuation of private property retrofits to address sewer backups.
Watershed Services reflects the reduced support for private property stormwater retrofits ($75,000), the elimination of part time positions: a Senior Administrative Specialist ($34,776) and a Senior Management Analyst ($45,180), and the elimination of Parks pass-through funding to Multnomah County ($69,000). Additionally, the Grey to Green program is deferring funding for the ecoroof grant program to reflect slower than forecast expenditures due to current economic conditions ($637,512). There was a one-time elimination of merit increases for non-represented personnel that saved $15,229. Other city budget decisions resulted in pass-through savings from centralized services from the Office of Management totaling $8,776. There are no service delivery impacts resulting with these reductions.

City of Portland, Oregon – FY 2012-13 Adopted Budget 291
Bureau of Environmental ServicesPublic Utilities Service Area
Effective July 1, 2013, the bureau will assume the responsibility of the Portland Loos, at an additional cost of $119,000, of which this budget program contributed $7,400 of internal cuts (intern support) to absorb the added expense.
FTE & Financials Actual
FY 2009-10 Actual
FY 2010-11 Revised
FY 2011-12 ProposedFY 2012-13
AdoptedFY 2012-13
FTE 60.25 61.60 54.53 52.57 53.57
Expenditures
Environmental Policy 1,953,628 509,969 0 0 0
Science, Fish & Wildlife 891,211 1,311,130 1,279,466 1,189,510 1,189,510
Sustainable Stormwater 2,007,713 1,811,710 2,712,295 2,295,679 2,295,679
Watershed 294,775 355,509 384,009 504,721 534,157
Watershed Management 4,308,031 4,764,442 6,683,949 6,499,887 6,984,494
Watershed Revegetation 3,043,325 3,815,874 906,175 1,659,097 1,322,169
Total Expenditures 12,498,683 12,568,634 11,965,894 12,148,894 12,326,009
Performance Actual
FY 2009-10 Actual
FY 2010-11 Yr End Est.FY 2011-12
BaseFY 2012-13
TargetFY 2012-13
Workload
Number of individual participants in projects catalyzed or hosted by the Stewardship Program
12,346 9,965 10,000 9,500 9,500
Number of trees planted 58,370 48,797 56,950 41,400 41,400

292 City of Portland, Oregon – FY 2012-13 Adopted Budget
Bureau of Environmental ServicesPublic Utilities Service Area
Performance Measures
Enforcement Tests
Percent of industrial enforcement tests in full compliance.
Per
cent
Wastewater Processing Cost
Cost to operate and maintain the wastewater treatment plants reflected in costs per million gallons. FY 2008-09 reflects the lowest combined flow rate in the last decade. When flow is low, cost per unit increases.
doll
ars
per
mil
lion
gal
lons
per
day
98.95
99
99.05
99.1
99.15
99.2
99.25
2008 2009 2010 2011 2012 2013
500520540560580600620640
2008 2009 2010 2011 2012 2013
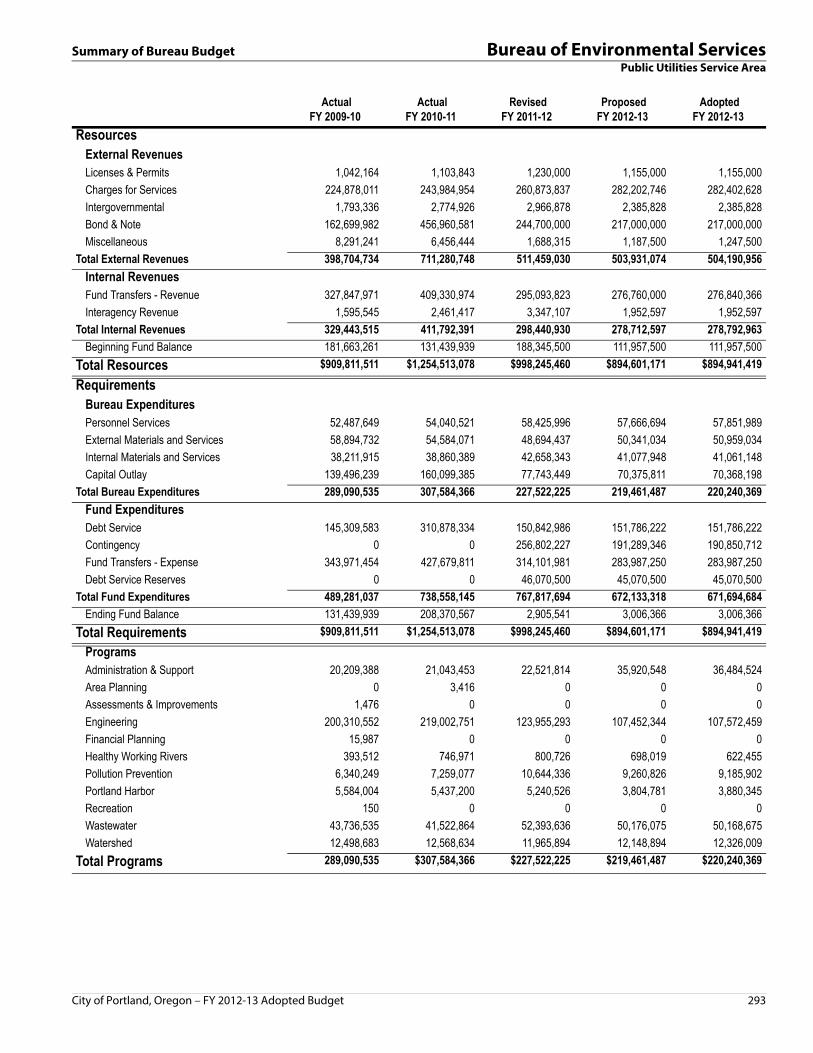
City of Portland, Oregon – FY 2012-13 Adopted Budget 293
Summary of Bureau Budget Bureau of Environmental ServicesPublic Utilities Service Area
Actual
FY 2009-10 Actual
FY 2010-11 Revised
FY 2011-12 ProposedFY 2012-13
AdoptedFY 2012-13
ResourcesExternal RevenuesLicenses & Permits 1,042,164 1,103,843 1,230,000 1,155,000 1,155,000
Charges for Services 224,878,011 243,984,954 260,873,837 282,202,746 282,402,628
Intergovernmental 1,793,336 2,774,926 2,966,878 2,385,828 2,385,828
Bond & Note 162,699,982 456,960,581 244,700,000 217,000,000 217,000,000
Miscellaneous 8,291,241 6,456,444 1,688,315 1,187,500 1,247,500
Total External Revenues 398,704,734 711,280,748 511,459,030 503,931,074 504,190,956
Internal RevenuesFund Transfers - Revenue 327,847,971 409,330,974 295,093,823 276,760,000 276,840,366
Interagency Revenue 1,595,545 2,461,417 3,347,107 1,952,597 1,952,597
Total Internal Revenues 329,443,515 411,792,391 298,440,930 278,712,597 278,792,963
Beginning Fund Balance 181,663,261 131,439,939 188,345,500 111,957,500 111,957,500
Total Resources $909,811,511 $1,254,513,078 $998,245,460 $894,601,171 $894,941,419
RequirementsBureau ExpendituresPersonnel Services 52,487,649 54,040,521 58,425,996 57,666,694 57,851,989
External Materials and Services 58,894,732 54,584,071 48,694,437 50,341,034 50,959,034
Internal Materials and Services 38,211,915 38,860,389 42,658,343 41,077,948 41,061,148
Capital Outlay 139,496,239 160,099,385 77,743,449 70,375,811 70,368,198
Total Bureau Expenditures 289,090,535 307,584,366 227,522,225 219,461,487 220,240,369
Fund ExpendituresDebt Service 145,309,583 310,878,334 150,842,986 151,786,222 151,786,222
Contingency 0 0 256,802,227 191,289,346 190,850,712
Fund Transfers - Expense 343,971,454 427,679,811 314,101,981 283,987,250 283,987,250
Debt Service Reserves 0 0 46,070,500 45,070,500 45,070,500
Total Fund Expenditures 489,281,037 738,558,145 767,817,694 672,133,318 671,694,684
Ending Fund Balance 131,439,939 208,370,567 2,905,541 3,006,366 3,006,366
Total Requirements $909,811,511 $1,254,513,078 $998,245,460 $894,601,171 $894,941,419
ProgramsAdministration & Support 20,209,388 21,043,453 22,521,814 35,920,548 36,484,524
Area Planning 0 3,416 0 0 0
Assessments & Improvements 1,476 0 0 0 0
Engineering 200,310,552 219,002,751 123,955,293 107,452,344 107,572,459
Financial Planning 15,987 0 0 0 0
Healthy Working Rivers 393,512 746,971 800,726 698,019 622,455
Pollution Prevention 6,340,249 7,259,077 10,644,336 9,260,826 9,185,902
Portland Harbor 5,584,004 5,437,200 5,240,526 3,804,781 3,880,345
Recreation 150 0 0 0 0
Wastewater 43,736,535 41,522,864 52,393,636 50,176,075 50,168,675
Watershed 12,498,683 12,568,634 11,965,894 12,148,894 12,326,009
Total Programs 289,090,535 $307,584,366 $227,522,225 $219,461,487 $220,240,369

294 City of Portland, Oregon – FY 2012-13 Adopted Budget
Bureau of Environmental Services CIP SummaryPublic Utilities Service Area
This table summarizes project expenses by capital programs.
Bureau Capital Program Revised Adopted Capital Plan
Project Prior Years FY 2011-12 FY 2012-13 FY 2013-14 FY 2014-15 FY 2015-16 FY 2016-17 5-Year Total
Combined Sewer Overflow Eastside Combined Sewer Overflow
System Startup0 3,002,000 1,093,000 495,000 0 0 0 1,588,000
Portland Opera Permanent Parking Lot
0 0 277,000 0 0 0 0 277,000
Portsmouth Force Main Odor Control
0 2,800,000 2,034,000 0 0 0 0 2,034,000
Total Combined Sewer Over-flow
0 5,802,000 3,404,000 495,000 0 0 0 3,899,000
Maintenance and Reliability Alder: Ladd's Addition South
Reconstruction/GreenStreets0 0 0 0 0 0 725,000 725,000
Alder: Sunnyside East South Recon Green Streets
0 0 0 0 0 462,000 2,330,000 2,792,000
Alder: Sunnyside North Recon/Green Street
0 0 0 0 0 1,746,000 4,807,000 6,553,000
Alder: Sunnyside South Recon/ Green Street
0 0 0 0 0 0 1,021,000 1,021,000
Ash Creek Sewer Rehabilitation 0 0 0 700,000 0 0 0 700,000
Beech Essex CP-K 0 0 0 0 0 51,000 279,000 330,000
Beech-Essex CP-J 0 0 0 0 51,000 814,000 5,486,000 6,351,000
Bike Boulevard Green Streets 0 1,300,000 4,260,000 3,606,000 3,573,000 2,000,000 0 13,439,000
Fanno Basin System Improvement 791,615 5,835,000 2,712,000 9,496,000 7,766,000 0 0 19,974,000
Fanno Creek Infiltration and Inflow 0 200,000 1,316,000 616,000 1,310,000 2,520,000 2,025,000 7,787,000
Fanno/Tryon Rehab 0 0 0 0 0 166,000 1,537,000 1,703,000
Hollywood Stormwater & Sewer Solutions
0 0 860,000 1,619,000 1,619,000 2,034,000 2,034,000 8,166,000
Maintenance Capital - Construction 8,689,526 230,000 230,000 230,000 230,000 230,000 240,000 1,160,000
Maintenance Capital - Contract 30,911,265 2,500,000 2,533,000 2,700,000 2,700,000 2,500,000 3,000,000 13,433,000
NE 13th: Piedmont-King Reconstruction
0 0 0 0 930,000 3,336,000 3,099,000 7,365,000
NE 13th: Woodlawn-Piedmont Reconstruction
0 0 0 0 520,000 2,052,000 1,869,000 4,441,000
NWN: BCC Support Project 0 0 500,000 1,000,000 0 0 0 1,500,000
NWN: Far North Nicolai Pipe Replacement
0 0 444,000 1,921,000 1,610,000 0 0 3,975,000
NWN: North Tanner Pipe Construction
0 0 0 0 0 1,488,000 747,000 2,235,000
NWN: Southeast Tanner 0 0 0 0 0 576,000 1,792,000 2,368,000
NWN: Southwest Tanner 0 0 0 0 0 0 472,000 472,000
Oak A Basin Phase 2 0 0 0 0 0 0 500,000 500,000
OAK:SE Oak St Sewer Repair 0 0 800,000 0 0 0 0 800,000
Owner Controlled Insurance Program Phase IV
0 804,000 802,000 802,000 802,000 0 0 2,406,000
Phase 2 Pipe Rehabilitation 0 3,113,000 8,627,000 25,884,000 38,431,000 32,171,000 33,754,000 138,867,000
SE Interceptor Rehabilitation 0 0 699,000 688,000 3,494,000 3,563,000 0 8,444,000

City of Portland, Oregon – FY 2012-13 Adopted Budget 295
CIP Summary Bureau of Environmental ServicesPublic Utilities Service Area
Sewer Structural Rehabilitation 249,452 8,041,000 5,659,000 1,413,000 0 0 0 7,072,000
Stark HSS-17 0 0 0 0 0 893,000 1,160,000 2,053,000
Structural Rehab Taggart Outfall 30 0 0 102,000 1,016,000 844,000 8,684,000 4,395,000 15,041,000
Taggart TGA-06 0 0 10,000 141,000 763,000 0 0 914,000
TGD: SE 41st & SE Madison 0 0 524,000 24,000 23,000 0 0 571,000
TGD: SE 41th Reconstruct & Greenstreet
0 0 0 40,000 449,000 472,000 25,000 986,000
TGD: SE 9th Greenstreet 0 0 110,000 348,000 33,000 20,000 0 511,000
TGD: SE Division Stormwater & Pipe Reconstruction
0 0 3,828,000 532,000 119,000 0 0 4,479,000
TGD: SE Hawthorne Green Street and Pipe Replacement
0 0 102,000 1,089,000 1,110,000 22,000 6,000 2,329,000
TGD: SE Powell Green Street and Pipe Reconstruction
0 0 554,000 655,000 3,059,000 3,059,000 79,000 7,406,000
TGD: SE Salmon Green Street and Pipe Reconstruction
0 0 31,000 135,000 537,000 938,000 27,000 1,668,000
TGD: Taggart D Phase 2 0 0 0 0 1,053,000 1,054,000 3,163,000 5,270,000
TGD:SE Clinton-Caruthers System Improvements
0 0 1,650,000 0 0 0 0 1,650,000
Tryon Creek Infiltration and Inflow 0 375,000 300,000 2,825,000 2,270,000 2,120,000 1,015,000 8,530,000
Tryon SS Protection 1A TCWTP to Hwy 43
0 0 136,000 460,000 921,000 0 0 1,517,000
Wheeler WHE-04 0 0 0 725,000 944,000 4,174,000 4,173,000 10,016,000
Willamette Interceptor Upgrade 0 0 0 0 0 168,000 654,000 822,000
Total Maintenance and Reli-ability
40,641,858 22,398,000 36,789,000 58,665,000 75,161,000 77,313,000 80,414,000 328,342,000
Sewage Treatment Systems Ankeny Pump Station Upgrade 218,002 2,162,000 6,000,000 1,000,000 0 0 0 7,000,000
CBWTP Cogeneration 0 320,000 350,000 350,000 3,154,000 1,290,000 0 5,144,000
CBWTP Digester Mixing 0 3,100,000 4,300,000 3,700,000 0 0 0 8,000,000
CBWTP Lagoon Phase 2, Cells 3 0 0 2,373,000 981,000 1,361,000 0 0 4,715,000
CBWTP Lagoon Phase 3 & 4, Cell 0 0 0 1,275,000 3,354,000 1,822,000 521,000 6,972,000
CBWTP Outfall Diffuser 0 0 0 0 0 642,000 1,392,000 2,034,000
CBWTP Secondary Treatment Expansion
0 0 0 0 0 1,821,000 3,019,000 4,840,000
CBWTP Seismic Improvements 0 0 0 0 0 1,669,000 1,538,000 3,207,000
CBWTP Selector Performance Enhancement
0 1,610,000 11,320,000 4,680,000 0 0 0 16,000,000
CBWTP Support Facility 0 0 4,000,000 0 0 0 0 4,000,000
CBWTP Thickened Waste Activated Sludge Piping
0 0 50,000 150,000 400,000 400,000 0 1,000,000
Guilds Lake Pump Station Upgrade 0 2,356,000 2,116,000 0 0 0 0 2,116,000
Pump Station Improvements 25,443,646 2,000,000 2,500,000 3,600,000 3,800,000 4,000,000 4,000,000 17,900,000
Repair, Rehabilitation, and Modification
19,778,780 2,000,000 2,000,000 2,000,000 2,000,000 2,000,000 2,000,000 10,000,000
This table summarizes project expenses by capital programs.
Bureau Capital Program Revised Adopted Capital Plan
Project Prior Years FY 2011-12 FY 2012-13 FY 2013-14 FY 2014-15 FY 2015-16 FY 2016-17 5-Year Total

296 City of Portland, Oregon – FY 2012-13 Adopted Budget
Bureau of Environmental Services CIP SummaryPublic Utilities Service Area
Tryon Creek Wastewater Treatment Plant Improvements
0 263,000 0 216,000 749,000 378,000 860,000 2,203,000
Total Sewage Treatment Sys-tems
45,440,428 13,811,000 35,009,000 17,952,000 14,818,000 14,022,000 13,330,000 95,131,000
Surface Water Management CS: Columbia Slough Outfalls
Predesign0 155,000 315,000 154,000 0 0 0 469,000
CS: Mason Flats 0 0 1,020,000 15,000 15,000 0 0 1,050,000
CS: NE 148th Basin Water Quality Facility
121,619 0 130,000 1,708,000 0 0 0 1,838,000
CS: NE 33rd Drive Culvert Phase 2 0 0 1,499,000 145,000 0 0 0 1,644,000
Culvert Replacement Phase 2 0 0 50,000 1,200,000 1,650,000 900,000 0 3,800,000
FT: Barbur Blvd Drainage Retrofit 0 0 0 39,000 39,000 246,000 246,000 570,000
FT: Boones Ferry Culvert 0 0 254,000 231,000 1,184,000 0 0 1,669,000
FT: Fanno BvrtnHills Hwy 0 0 83,000 373,000 584,000 0 0 1,040,000
FT: Fanno Tryon Drainage Shoulder Improvements
0 0 0 0 206,000 1,158,000 1,155,000 2,519,000
FT: Fanno/Tryon Creek Watersheds Land Acquisition
0 0 0 154,000 154,000 154,000 0 462,000
FT: Fanno/Tryon Outfall 0 0 427,000 1,000,000 0 0 0 1,427,000
FT: Fanno/Tryon Stormwater Facilities
0 0 320,000 0 0 0 0 320,000
FT: Fanno/Tryon WQF 2 0 0 34,000 263,000 262,000 69,000 0 628,000
FT: FannoTryon StrmRetro 0 0 76,000 128,000 468,000 468,000 392,000 1,532,000
FT: I5/SW 26 WQF 0 0 0 0 146,000 133,000 1,000,000 1,279,000
FT: Jackson Middle School Creek Daylight
0 0 0 0 162,000 898,000 285,000 1,345,000
FT: Spring Garden Stream 0 0 223,000 0 0 0 0 223,000
FT: SW 45th Ave Culvert 0 0 0 63,000 60,000 467,000 0 590,000
Green Streets/Bikeways 0 1,900,000 1,513,000 0 0 0 0 1,513,000
Grey to Green - Green Street Projects
0 0 75,000 719,000 0 0 0 794,000
Grey to Green Culverts 0 0 527,000 302,000 125,000 0 0 954,000
Grey to Green: Land Acquisition 0 9,136,475 3,000,000 4,000,000 1,500,000 2,000,000 1,000,000 11,500,000
JC: Brunkow 0 0 0 248,000 497,000 23,000 0 768,000
JC: Community Restoration Partnership
0 0 25,000 75,000 300,000 398,000 398,000 1,196,000
JC: Freeway Land Floodplain Restoration
0 0 50,000 800,000 700,000 1,000,000 3,000,000 5,550,000
JC: Hammersmith 0 0 0 0 444,000 875,000 38,000 1,357,000
JC: Johnson Creek Willing Seller Phase 2
0 0 500,000 500,000 500,000 500,000 500,000 2,500,000
JC: Oxbox 0 0 0 234,000 176,000 940,000 0 1,350,000
JC: Springwater Wetland 0 0 340,000 0 0 0 0 340,000
JC: West Lents Flood Mitigation 428,108 0 0 0 293,000 527,000 2,665,000 3,485,000
JC:Luther Road Habitat Restoration 97,021 0 200,000 3,500,000 200,000 0 0 3,900,000
This table summarizes project expenses by capital programs.
Bureau Capital Program Revised Adopted Capital Plan
Project Prior Years FY 2011-12 FY 2012-13 FY 2013-14 FY 2014-15 FY 2015-16 FY 2016-17 5-Year Total

City of Portland, Oregon – FY 2012-13 Adopted Budget 297
CIP Summary Bureau of Environmental ServicesPublic Utilities Service Area
JC:S Foster - E Lents Phase 2 Flood Mitigation
0 0 2,000,000 0 0 0 0 2,000,000
Oaks Bottom Culvert Replacement 0 0 10,000 2,054,000 0 0 0 2,064,000
Swan Island Beach Mitigation Bank 0 0 1,100,000 500,000 1,332,000 1,336,000 1,332,000 5,600,000
Underground Injection Control Improvements
156,050 1,605,000 1,056,000 3,223,000 1,448,000 0 0 5,727,000
Watershed Investment 0 1,500,572 1,500,000 1,500,000 1,500,000 1,500,000 1,500,000 7,500,000
Total Surface Water Manage-ment
802,798 14,297,047 16,327,000 23,128,000 13,945,000 13,592,000 13,511,000 80,503,000
Systems Development Drainage Improvement 2,232,967 29,000 250,000 250,000 250,000 250,000 250,000 1,250,000
Milw Light Rail Ext 0 571,000 226,000 226,000 226,000 42,000 0 720,000
Party Sewers 0 750,000 750,000 2,450,000 2,400,000 1,000,000 1,000,000 7,600,000
PBOT Interagency Reimbursement 7,578,004 350,000 350,000 350,000 350,000 350,000 350,000 1,750,000
Permit Reimbursement 950,027 45,000 45,000 45,000 45,000 45,000 45,000 225,000
Pleasant Valley Strm 0 0 0 0 0 0 567,000 567,000
Public Works Permit Projects 11,194,271 725,000 350,000 400,000 400,000 400,000 400,000 1,950,000
SE Foster & 122nd Sewer Construction
0 0 0 368,000 0 0 0 368,000
Sewer Easements on Existing Sewers
0 0 62,000 50,000 50,000 50,000 50,000 262,000
South Airport Pump Station 0 1,085,000 1,865,000 660,000 0 0 0 2,525,000
Total Systems Development 21,955,269 3,555,000 3,898,000 4,799,000 3,721,000 2,137,000 2,662,000 17,217,000
Total Requirements 108,840,353 59,863,047 95,427,000 105,039,000 107,645,000 107,064,000 109,917,000 525,092,000
This table summarizes project expenses by capital programs.
Bureau Capital Program Revised Adopted Capital Plan
Project Prior Years FY 2011-12 FY 2012-13 FY 2013-14 FY 2014-15 FY 2015-16 FY 2016-17 5-Year Total

298 City of Portland, Oregon – FY 2012-13 Adopted Budget
Bureau of Environmental Services FTE SummaryPublic Utilities Service Area
Salary Range Revised
FY 2011-12 ProposedFY 2012-13
AdoptedFY 2012-13
Class Title Minimum Maximum No. Amount No. Amount No. Amount30000062 Accountant I 38,064 53,123 1.00 38,064 1.00 38,064 1.00 38,064
30000063 Accountant II 49,754 60,798 4.00 232,032 4.00 234,900 4.00 234,900
30000064 Accountant III 54,787 66,893 1.00 66,888 1.00 66,888 1.00 66,888
30000434 Administrative Assistant 45,074 69,451 5.00 317,816 5.00 323,222 5.00 323,222
30000433 Administrative Specialist, Sr 41,974 64,626 5.00 319,618 3.50 246,388 4.50 288,364
30000436 Administrative Supervisor I 54,725 72,925 2.00 145,848 2.00 145,848 2.00 145,848
30000104 Automotive Equip Oper II: Tractor-Trailr 43,347 52,208 1.00 52,212 1.00 52,212 1.00 52,212
30000671 Biosolids/Reuse Program Manager 69,826 93,829 1.00 89,789 1.00 93,201 1.00 93,201
30000315 Botanic Spec I-Generalist 51,334 65,520 1.00 59,424 1.00 61,656 1.00 61,656
30000320 Botanic Spec II-Generalist 54,038 68,931 3.00 173,736 3.00 178,454 3.00 178,454
30000321 Botanic Spec II-Ntrl Resource Ecologist 54,038 68,931 6.00 404,420 6.00 409,760 6.00 409,760
30000441 Business Operations Manager 75,109 100,048 3.00 297,701 3.00 300,132 3.00 300,132
30000442 Business Operations Manager, Sr 93,288 130,291 1.00 130,296 1.00 130,296 1.00 130,296
30000448 Business Systems Analyst 57,450 76,586 1.00 74,576 1.00 76,584 1.00 76,584
30000449 Business Systems Analyst, Sr 63,378 84,635 3.00 250,908 3.00 252,658 3.00 252,658
30000329 CAD Technician II 50,690 64,667 15.00 919,200 14.00 879,520 14.00 879,520
30000330 CAD Technician III 61,568 78,645 5.00 389,532 5.00 392,313 5.00 392,313
30000689 Capital Program Mgmt & Controls Manager 86,840 117,686 1.00 103,728 1.00 107,979 1.00 107,979
30000399 Capital Project Manager I 61,568 78,645 3.00 224,868 2.00 167,899 2.00 155,755
30000686 Capital Project Manager II 66,602 89,107 2.00 178,224 2.00 178,224 2.00 178,224
30000700 Communications Engineer 66,602 89,107 1.00 89,112 1.00 89,112 1.00 89,112
30000491 Community Outreach & Informtn Assistant 45,074 69,451 2.00 91,222 2.00 94,960 2.00 94,960
30000492 Community Outreach & Informtn Rep 54,725 72,925 2.00 145,848 2.00 145,848 2.00 145,848
30000493 Community Outreach & Informtn Rep, Sr 60,341 80,475 2.00 136,840 2.00 141,291 2.00 141,291
30000470 Contractor Dev Program Coordinator 63,378 84,635 1.00 73,068 1.00 75,558 1.00 75,558
30000455 Contracts Dev & Review Administrator 66,602 89,107 1.00 89,112 1.00 89,112 1.00 89,112
30000672 Data Acquisition & Mgmt Supervisor 69,826 93,829 1.00 93,828 1.00 93,828 1.00 93,828
30000733 Development Services Manager 80,787 107,557 1.00 107,556 1.00 107,556 1.00 107,556
30000333 Development Services Technician II 50,690 64,667 1.00 64,668 1.00 64,668 1.00 64,668
30000732 Development Supervisor I 63,378 84,635 1.00 84,636 1.00 84,636 1.00 84,636
30000576 Economist, Sr 66,602 89,107 1.00 85,632 1.00 88,822 1.00 88,822
30000635 Electrical/Instrumentation Supervisor 69,826 93,829 1.00 93,828 1.00 93,828 1.00 93,828
30000116 Electrician 64,376 69,493 6.00 416,952 6.00 416,952 6.00 416,952
30000121 Electrician/Instrument Technician 66,331 71,594 7.00 495,888 7.00 495,888 7.00 495,888
30000401 Electronic Systems Technician 52,666 67,184 3.00 201,564 3.00 201,564 3.00 201,564
30000683 Engineer, Chief 102,648 146,952 2.00 249,600 1.00 146,952 1.00 146,952
30000682 Engineer, Principal 93,787 125,070 3.00 372,156 3.00 374,204 3.00 374,204
30000680 Engineer, Sr 81,182 108,243 11.00 1,176,463 11.00 1,187,035 11.00 1,187,035
30000681 Engineer, Supervising 87,277 116,355 11.00 1,268,416 11.00 1,277,449 11.00 1,277,449
30000365 Engineer-Civil 80,954 98,384 29.00 2,789,784 29.00 2,817,903 29.00 2,817,903
30000366 Engineer-Electrical 80,954 98,384 2.00 196,776 2.00 196,776 2.00 196,776
30000368 Engineer-Mechanical 80,954 98,384 1.00 94,076 1.00 98,388 1.00 98,388
30000358 Engineering Associate, Sr-Civil 69,992 89,232 11.00 916,226 10.00 856,588 10.00 856,588
30000360 Engineering Associate, Sr-Geotechnical 69,992 89,232 1.00 89,232 1.00 89,232 1.00 89,232
30000353 Engineering Associate-Civil 57,533 77,106 8.00 536,755 8.00 558,154 8.00 558,154
30000324 Engineering Technician I 37,835 50,690 1.00 38,148 1.00 40,044 1.00 40,044
30000325 Engineering Technician II 50,690 64,667 26.00 1,592,901 25.00 1,563,109 26.00 1,618,993
30000326 Engineering Technician III 61,568 78,645 7.00 532,476 7.00 536,827 7.00 536,827
30001659 Env Svcs OCIP, Risk & Safety Officer 75,109 100,048 1.00 98,532 1.00 99,666 1.00 99,666
30001736 Environmental Compliance Mgr 80,787 107,557 1.00 100,044 1.00 103,464 1.00 103,464

City of Portland, Oregon – FY 2012-13 Adopted Budget 299
FTE Summary Bureau of Environmental ServicesPublic Utilities Service Area
30000859 Environmental Intergovernmental Rel Mgr 80,787 107,557 1.00 107,556 1.00 107,556 1.00 107,556
30001735 Environmental Investigations Mgr 80,787 107,557 1.00 125,076 1.00 125,076 1.00 125,076
30000669 Environmental Monitoring Svcs Group Mgr 93,288 130,291 1.00 130,296 1.00 130,296 1.00 130,296
30000459 Environmental Policy Analyst 63,378 84,635 1.00 84,636 1.00 84,636 1.00 84,636
30000662 Environmental Program Coordinator 60,341 80,475 9.00 672,107 9.00 686,345 9.00 686,345
30000663 Environmental Program Manager 66,602 89,107 11.00 951,010 10.00 871,504 10.00 871,504
30000664 Environmental Program Manager, Sr 75,109 100,048 3.60 349,832 3.60 353,506 3.60 353,506
30000661 Environmental Program Specialist 54,725 72,925 3.00 210,972 3.00 213,640 3.00 213,640
30000419 Environmental Services Director 129,834 186,056 1.00 179,373 1.00 185,142 1.00 185,142
30000339 Environmental Specialist 61,568 78,645 27.00 2,016,371 27.00 2,050,380 27.00 2,050,380
30001359 Environmental Svcs Public Affairs Mgr 75,109 100,048 1.00 95,808 1.00 99,732 1.00 99,732
30000337 Environmental Technician I 37,835 50,690 4.00 153,216 2.00 79,224 3.00 117,060
30000338 Environmental Technician II 50,690 64,667 34.00 2,112,920 35.00 2,190,021 34.00 2,139,333
30000712 Facilities Services Specialist 54,725 72,925 1.00 61,590 1.00 64,118 1.00 64,118
30000569 Financial Analyst, Principal 75,109 100,048 4.00 404,004 3.00 305,136 3.00 305,136
30000341 GIS Technician I 37,835 50,690 1.00 50,688 1.00 50,688 1.00 50,688
30000342 GIS Technician II 50,690 64,667 2.00 115,248 2.00 119,410 2.00 119,410
30000343 GIS Technician III 61,568 78,645 3.00 225,252 3.00 227,468 3.00 227,468
30000373 Graphics Designer III 61,568 78,645 1.00 78,648 1.00 78,648 1.00 78,648
30001080 Healthy Working Rivers Manager 86,840 117,686 1.00 92,700 1.00 95,870 1.00 95,870
30000340 Hydrogeologist 69,826 89,066 1.00 89,064 1.00 89,064 1.00 89,064
30000126 Industrial Machinist 51,979 56,472 1.00 56,472 1.00 56,472 1.00 56,472
30000157 Industrial Maintenance Millwright 51,979 56,472 28.00 1,572,240 28.00 1,575,232 28.00 1,575,232
30000114 Industrial Painter 51,438 55,890 1.00 51,444 1.00 51,444 1.00 51,444
30001510 Inf Syst Analyst IV-GIS,Vertical 66,602 89,107 1.00 89,112 1.00 89,112 1.00 89,112
30000218 Inf Syst Analyst, Principal-Gen 75,109 100,048 2.00 191,320 2.00 195,056 2.00 195,056
30000880 Inf Syst Analyst, Principal-GIS,Vertical 75,109 100,048 1.00 100,044 1.00 100,044 1.00 100,044
30000606 Inf Syst Mgr-Enterprise Database Mgr 80,787 107,557 1.00 97,134 1.00 101,109 1.00 101,109
30000239 Instrument Technician 64,376 69,493 9.00 625,428 9.00 625,428 9.00 625,428
30001283 Laboratory Analyst II 45,760 60,382 6.00 359,448 6.00 362,304 6.00 362,304
30001284 Laboratory Analytical Specialist 52,166 69,264 6.00 415,584 6.00 415,584 6.00 415,584
30001285 Laboratory Coordinator 54,142 76,398 2.00 152,808 2.00 152,808 2.00 152,808
30000670 Laboratory Manager 75,109 100,048 1.00 100,044 1.00 100,044 1.00 100,044
30000644 Maintenance Planner/Scheduler 54,725 72,925 5.00 363,916 5.00 364,620 5.00 364,620
30000451 Management Analyst 57,450 76,586 1.00 76,584 1.00 76,584 1.00 76,584
30000453 Management Analyst, Principal 75,109 100,048 1.00 100,044 1.00 100,044 1.00 100,044
30000452 Management Analyst, Sr 63,378 84,635 3.00 235,471 2.00 177,391 3.00 240,775
30000450 Management Assistant 45,074 69,451 2.00 138,912 2.00 138,912 2.00 138,912
30000692 Maps & Records Supervisor 60,341 80,475 1.00 77,712 1.00 77,712 1.00 77,712
30000345 Materials Testing Technician II 50,690 64,667 4.00 242,112 4.00 244,692 4.00 244,692
30000346 Materials Testing Technician III 61,568 78,645 1.00 78,648 1.00 78,648 1.00 78,648
30000012 Office Support Specialist II 31,512 43,950 5.00 194,892 5.00 197,705 5.00 197,705
30000013 Office Support Specialist III 40,310 51,896 6.00 310,776 5.00 259,500 5.00 259,500
30000678 Portland Harbor Superfund Administrator 86,840 117,686 1.00 86,844 0.00 0 0.00 0
30000677 Portland Harbor Superfund Technical Mgr 75,109 100,048 1.00 100,044 1.00 100,044 1.00 100,044
30000464 Program Coordinator 60,341 80,475 3.50 253,352 5.00 351,837 5.00 351,837
30000465 Program Manager 63,378 84,635 6.00 489,144 6.00 494,538 6.00 494,538
30000466 Program Manager, Sr 75,109 100,048 1.00 98,832 1.00 99,943 1.00 99,943
30000463 Program Specialist 54,725 72,925 2.00 136,800 2.00 138,980 2.00 138,980
30000462 Program Specialist, Assistant 45,074 69,451 2.50 158,684 2.00 131,340 2.00 131,340
Salary Range Revised
FY 2011-12 ProposedFY 2012-13
AdoptedFY 2012-13
Class Title Minimum Maximum No. Amount No. Amount No. Amount

300 City of Portland, Oregon – FY 2012-13 Adopted Budget
Bureau of Environmental Services FTE SummaryPublic Utilities Service Area
30000698 Property Acquisition & Services Manager 63,378 84,635 1.00 84,636 1.00 84,636 1.00 84,636
30000495 Public Information Officer 63,378 84,635 1.00 84,636 1.00 84,636 1.00 84,636
30000691 Public Works Inspection Manager 66,602 89,107 1.00 89,112 1.00 89,112 1.00 89,112
30000690 Public Works Inspection Supervisor 63,378 84,635 1.00 84,636 1.00 84,636 1.00 84,636
30000228 Public Works Inspector 56,888 65,000 16.00 1,012,392 16.00 1,014,894 16.00 1,014,894
30000229 Public Works Inspector, Sr 61,693 72,696 12.00 872,352 12.00 872,352 12.00 872,352
30000828 Records Specialist 31,512 43,950 1.00 43,956 1.00 43,956 1.00 43,956
30000481 Risk Specialist 54,725 72,925 1.00 56,976 1.00 58,722 1.00 58,722
30000482 Risk Specialist, Sr 60,341 80,475 1.00 80,472 1.00 80,472 1.00 80,472
30000485 Safety & Risk Officer I 63,378 84,635 1.00 84,636 1.00 84,636 1.00 84,636
30000179 Site Development Inspector II 62,546 72,363 1.00 62,544 0.00 0 0.00 0
30000668 Source Reduction & Control Manager 80,787 107,557 1.00 80,784 1.00 80,784 1.00 80,784
30000054 Storekeeper/Acquisition Specialist II 43,139 52,728 3.00 158,184 3.00 158,184 3.00 158,184
30000056 Storekeeper/Acquisition Specialist III 48,714 60,570 1.00 60,576 1.00 60,576 1.00 60,576
30000468 Stores System Supervisor II 57,450 76,586 1.00 75,528 1.00 76,144 1.00 76,144
30001078 Sustainable Stormwater Division Mgr 80,787 107,557 1.00 107,556 1.00 107,556 1.00 107,556
30000675 Wastewater Collections System Manager 86,840 117,686 1.00 117,684 1.00 117,684 1.00 117,684
30000676 Wastewater Operations Group Manager 93,288 130,291 1.00 130,296 1.00 130,296 1.00 130,296
30000163 Wastewater Operations Specialist 53,622 60,694 5.00 303,480 5.00 303,480 5.00 303,480
30000161 Wastewater Operator II 46,696 56,472 41.00 2,254,594 41.00 2,273,427 41.00 2,273,427
30000674 Wastewater Treatment Manager 86,840 117,686 2.00 177,240 2.00 180,639 2.00 180,639
30000673 Wastewater Treatment O&M Supervisor 66,602 89,107 4.00 324,932 4.00 330,952 4.00 330,952
30000656 Water Resources Program Manager 66,602 89,107 5.00 423,048 5.00 423,048 5.00 423,048
30000659 Watershed Division Manager 80,787 107,557 1.00 107,556 1.00 107,556 1.00 107,556
30000667 Watershed Revegetation Program Manager 66,602 89,107 1.00 69,996 1.00 72,386 1.00 72,386
30000666 Watershed Revegetation Program Supvr 60,341 80,475 1.00 80,472 1.00 80,472 1.00 80,472
30000660 Watershed Services Group Manager 93,288 130,291 1.00 99,132 1.00 103,200 1.00 103,200
TOTAL FULL-TIME POSITIONS 533.60 39,177,837 521.10 38,734,635 524.10 38,870,883
30000433 Administrative Specialist, Sr 41,974 64,626 0.50 27,016 0.50 28,124 0.00 14,060
30000321 Botanic Spec II-Ntrl Resource Ecologist 54,038 68,931 0.88 60,660 0.88 60,660 0.88 60,660
30000447 Business Systems Analyst, Assistant 45,074 69,451 0.80 55,560 0.80 55,560 0.80 55,560
30000367 Engineer-Geotechnical 80,954 98,384 0.50 45,120 0.50 45,120 0.50 45,120
30000358 Engineering Associate, Sr-Civil 69,992 89,232 0.50 42,096 0.50 42,096 0.50 42,096
30000325 Engineering Technician II 50,690 64,667 0.50 27,936 0.50 27,936 0.00 20,952
30000339 Environmental Specialist 61,568 78,645 0.50 39,324 0.50 39,324 0.50 39,324
30000452 Management Analyst, Sr 63,378 84,635 0.50 31,692 0.50 31,692 0.00 15,840
30000464 Program Coordinator 60,341 80,475 0.50 40,236 0.50 40,236 0.50 40,236
TOTAL PART-TIME POSITIONS 5.18 369,640 5.18 370,748 3.68 333,848
30000686 Capital Project Manager II 66,602 89,107 0.58 38,850 1.00 66,600 1.00 66,600
30000338 Environmental Technician II 50,690 64,667 3.67 188,122 4.00 211,358 4.00 211,358
TOTAL LIMITED TERM POSITIONS 4.25 226,972 5.00 277,958 5.00 277,958
GRAND TOTAL 543.03 39,774,449 531.28 39,383,341 532.78 39,482,689
Salary Range Revised
FY 2011-12 ProposedFY 2012-13
AdoptedFY 2012-13
Class Title Minimum Maximum No. Amount No. Amount No. Amount

City of Portland, Oregon – FY 2012-13 Adopted Budget 301
Budget Decisions Bureau of Environmental ServicesPublic Utilities Service Area
This chart shows decisions and adjustments made during the budget process. The chart begins with an estimate of the bureau's Current Appropriations Level (CAL) requirements.
Amount
Action Ongoing One-Time Total Package FTE Decision
FY 2012-13 223,321,848 0 223,321,848 543.78 FY 2012-13 Current Appropriation Level
CAL Adjustments
0 0 0 0.00 None
Mayor's Proposed Budget Decisions
(1,373,241) (962,823) (2,336,064) (3.50) Programmatic reductions
(667,318) 0 (667,318) (9.00) Vacancy savings
(415,763) 0 (415,763) 0.00 OMF interagency adjustments
0 (98,620) (98,620) 0.00 Non-represented merit freeze
0 (214,000) (214,000) 0.00 COLA inflation reduction
(128,596) 0 (128,596) 0.00 Technical adjustments
Approved Budget Additions and Reductions
199,882 0 199,882 1.50 Correction to vacancy savings package
Adopted Budget Additions and Reductions
0 60,000 60,000 0.00 Transfer of Portland Loos
(2,385,036) (696,443) (3,081,479) (11.00) Total FY 2012-13 Decision Packages
220,240,369 532.78 Total Adopted Budget

302 City of Portland, Oregon – FY 2012-13 Adopted Budget
Portland Water Bureau
Public Utilities Service Area
Randy Leonard, Commissioner-in-ChargeDavid Shaff, Administrator
Percent of City Budget
Bureau Programs
Bureau Overview
Requirements Revised
FY 2011-12 Adopted
FY 2012-13 Change from
Prior Year PercentChange
Operating 556,064,470 523,175,369 (32,889,101) (5.91)
Capital 79,600,000 135,870,000 56,270,000 70.69
Total Requirements 635,664,470 659,045,369 23,380,899 3.68
Authorized Positions 630.80 619.05 (11.75) (1.86)
Portland Water Bureau 18.4%
Remaining City Budget 81.6%
Hydroelectric Power 0.3%
Administration & Support 13.9%
Treatment 1.2%Customer Service 11.9%Supply 2.8%
Distribution 29.8%
Regulatory Compliance 13.2%Transmission & Terminal Storage 26.9%

City of Portland, Oregon – FY 2012-13 Adopted Budget 303
Portland Water BureauPublic Utilities Service Area
Adm
inis
trato
rD
avid
Sha
ff
Hyd
roel
ectri
cP
ower
Div
isio
nW
ater
Div
isio
n
Adm
inis
tratio
n
Fina
nce
and
Sup
port
Ser
vice
s
Port
land
Wat
er B
urea
u
Mai
nten
ance
and
Con
stru
ctio
n S
ervi
ces
Eng
inee
ring
Res
ourc
e P
rote
ctio
n an
d P
lann
ing
Ope
ratio
ns
Cus
tom
er S
ervi
ces

304 City of Portland, Oregon – FY 2012-13 Adopted Budget
Portland Water BureauPublic Utilities Service Area
Bureau SummaryBureau Mission
The mission of the Portland Water Bureau is:
To provide reliable water service to customers in the quantities they desire and at a quality level that meets or exceeds both customer and regulatory standards
To provide the highest value to customers through excellent business, management, and operational practices and appropriate application of innovation and technology
To be responsible stewards of the public's water infrastructure, fiscal, and natural resources
To provide the citizens and the City Council with a water system that supports their community objectives and overall vision for the City of Portland
Bureau Overview
The Portland Water Bureau has two divisions, the Water and Hydroelectric Power Divisions.
Water Division The Water Division is responsible for construction, maintenance, and operation of Portland's municipal water system. The Water Division ensures that the water system can provide a sufficient quantity of high-quality water to satisfy the existing and future needs of the community.
Approximately 900,000 people (about one-quarter of the state's population) are served by the Water Division on either a retail or wholesale basis. Retail customers use about 60% of the water sold, while the other 40% is provided on a wholesale contract basis to 19 water purveyors, which include cities, water districts, private water companies, and a people's utility district. Approximately 80% to 85% of water sales revenue comes from retail customers, and 15% to 20% is derived from wholesale contracts.
The Water Division has seven budget programs and 22 subprograms that encompass all of the bureau's work including:
Supply
The focus of the Supply program is work associated with providing water to the Portland service area, including retail and wholesale customers. This program includes activities related to the City's primary Bull Run water supply as well as groundwater projects associated with the secondary wellfield system located in the Columbia South Shore area.
Transmission and Terminal Storage
The Transmission and Terminal Storage program includes conveying water from the supply facilities in the Bull Run Watershed to the retail distribution system and service delivery points for wholesale customers. The activities included in this program are related to terminal reservoirs as well as conduits and transmission.

City of Portland, Oregon – FY 2012-13 Adopted Budget 305
Portland Water BureauPublic Utilities Service Area
Treatment
The Treatment program provides for meeting or exceeding the federal and state requirements for a public water system utilizing an unfiltered surface water source as well as a groundwater source. This program currently provides for the application of chlorine, ammonia, and sodium hydroxide, and associated regulatory and process control monitoring.
Distribution
The Distribution program is responsible for providing water to customers through distribution mains and related facilities. The activities in the Distribution program include pump stations and tanks; distribution mains; services; meters; hydrants; valves, gates, and regulators; fountains; and field support.
Regulatory Compliance
The Regulatory Compliance program is responsible for meeting regulatory standards, including compliance with the Endangered Species Act, proper disposal of dechlorinated water, and various monitoring requirements.
Customer Service
The Customer Service program focuses on customer contact, billing and collection, conservation, security, maintenance of decorative fountains, and grounds facilities.
Support
The Support program includes the bureau-wide work supporting other programs, including planning, financial support, data management, and human resource functions.
Hydroelectric Power Division
The Water Bureau's Hydroelectric Power Division is responsible for all aspects of the Portland Hydroelectric Project (PHP) operations. It is responsible for regulatory issues and power sales of two small hydroelectric projects and for dam safety of the Water Division's other two dams and open water reservoirs. These hydroelectric projects provide the region with clean, renewable energy while providing both the General Fund and the Water Fund with additional revenue.
The PHP is located 25 miles east of Portland in the Bull Run Watershed and has a combined power generation capacity of 36 megawatts. The PHP project facilities include powerhouses adjoining the bureau's primary water supply dams and approximately ten miles of power transmission and communication lines that connect the PHP powerhouses with Portland General Electric's (PGE) electrical distribution system. The Hydroelectric Power Division, on behalf of the City, maintains a long-term power sales agreement with PGE that addresses PHP operations and maintenance and the sales of power generated. Most of the revenues supporting this division come from the sale of power generated at the PHP, and most of the expenses relate directly to administration and monitoring of that project.

306 City of Portland, Oregon – FY 2012-13 Adopted Budget
Portland Water BureauPublic Utilities Service Area
The primary responsibilities of the Hydroelectric Power Division staff include:
coordination with PGE on financial, operations, and repair issues relating to the PHP;
ensuring compliance with all PHP regulatory requirements including surveillance, oversight, and reporting; and
coordination of all PHP project financial matters including the administration of PHP's revenue bonds and related trust indenture requirements.
Strategic Direction
The strategic direction of the Portland Water Bureau in FY 2012-13 covers the following areas:
Forecast Retail Water Demand
The typical single family residential customer water usage per month has been steadily declining since FY 2003-04. Current usage by a typical single family residential customer has dropped to 5 hundred cubic feet (ccf )as residential water usage continues to decline. This is because residential customers are routinely practicing water conservation and are installing new plumbing fixtures and appliances that are increasingly more water efficient with technological advances.
The weather also contributed to the downward trend in retail water demand during the past couple of years. In 2010, Portland recorded three consecutive summer months of below-average temperatures for the first time in 35 years and was the coldest summer in 17 years.
The summers of 2010 and 2011 were unusually cooler and wetter than normal as was the Spring of 2012. The 5-year demand forecast assumes a normalized summer weather pattern. Demand projections are a primary factor in setting water rates. As customers purchase less water, there is a corresponding rate increase due to proportionally fewer units sold to fund the fixed costs of the utility (similar to most water utilities, more than 95 percent of Portland Water Bureau system costs are considered fixed in the short term).
Long-Term 2 Enhanced Surface Water Treatment Rule
The Long Term 2 Enhanced Surface Water Treatment Rule (LT2) was issued by the Environmental Protection Agency (EPA) in January 2006. The purpose of the rule is to reduce illness linked with Cryptosporidium and other pathogenic microorganisms in drinking water.
Compliance with LT2 will impact two separate parts of Portland's water system. First, the rule requires the City to provide additional treatment to its Bull Run supply to either remove or inactivate Cryptosporidium. In May 2009, City Council directed the Bureau to pursue ultraviolet (UV) treatment to inactivate Cryptosporidium oocysts from raw Bull Run water if alternate compliance options prove unsuccessful. Second, the rule requires changes regarding how uncovered open finished drinking water reservoirs are managed and operated. The rule mandates that water systems with uncovered finished water reservoirs, like those

City of Portland, Oregon – FY 2012-13 Adopted Budget 307
Portland Water BureauPublic Utilities Service Area
at Mt. Tabor and Washington Parks, either cover the reservoirs or provide treatment at the outlets of the reservoirs to inactivate Cryptosporidium, Giardia, and other pathogens. Cryptosporidium can enter surface water via human and animal fecal material. Surface water sources that are exposed to intensive human activities, pollution, and animal wastes are at risk to contain the parasite.
The Portland City Council committed in January 2005 to pursue alternative forms of compliance for the LT2 Rule. Soon after, the City met with EPA officials to request that the agency alter the final rule so that it would include alternate approaches that would allow Portland to avoid building additional treatment. When that effort failed, the City filed a legal challenge to the rule in the Washington DC District Court of Appeals in early 2006. In November 2007 the Court issued a decision rejecting the City's challenge and upholding the rule.
In response to the court ruling, the City pursued parallel compliance strategies. Commissioner Randy Leonard directed the Bureau to plan and budget to achieve compliance with the source water sections of the LT2 Rule as written but also pursue the variance provisions of the rule with the EPA.
Treatment
In 2009, City Council approved the development of an engineering design for a UV treatment plant while the Water Bureau continued its efforts to obtain a variance. The Water Bureau completed the UV design in December 2011. In May 2011, the bureau submitted a comprehensive request for a treatment variance to the Oregon Health Authority (OHA). The request contained the results of a year-long intensive water sampling program, additional field data, and research that supported Portland's assertion that treatment for Cryptosporidium was unnecessary due to the nature of the Bull Run source. In March 2012, OHA approved Portland's request for a treatment variance subject to a list of conditions which include ongoing sampling of Bull Run water for Cryptosporidium, maintenance of all existing watershed protections, seasonal field inspections, regular reporting, and monitoring of potential Cryptosporidium sources in and around the watershed. If Portland is successful in continuously meeting the stated conditions, the variance, which went into effect April 1, 2012, will be in effect for 10 years. The variance means that Portland will not need to build the UV treatment plant to comply with the LT2 rule.
The FY 2012-13 budget includes funding for a treatment variance monitoring program designed to enable Portland to meet all of the variance conditions imposed by OHA. The FY 2012-13 Budget Advisory Committee (BAC) supported the Water Bureau's treatment variance monitoring budget.
Uncovered Finished Drinking Water Reservoirs
The Bureau submitted, and EPA approved, a compliance plan to comply with the uncovered reservoir storage requirements of the LT2 Rule. The plan includes constructing an enclosed 50 million gallon storage reservoir at Powell Butte, increasing the storage capacity at Kelly Butte to 25 million gallons, replacing Washington Park Reservoir 3 with a 15 million gallon buried storage tank, and constructing transmission pipes and other system improvements. The deadlines in the plan to disconnect Mt. Tabor and Washington Park open reservoirs from the drinking water system are December 31, 2015 and December 31, 2020, respectively.

308 City of Portland, Oregon – FY 2012-13 Adopted Budget
Portland Water BureauPublic Utilities Service Area
In August 2011, in response to United States Senator Charles Schumer on behalf of the City of New York, the EPA agreed to review the LT2 regulation as part of its standard regulatory review and also in response to a presidential executive order. In February 2012, the City asked for an opportunity to suspend the Water Bureau's compliance schedule to disconnect the City's uncovered reservoirs pending the EPA's review of the LT2 Rule. The compliance schedule extension would have resulted in the Mt. Tabor and Washington Park reservoirs being disconnected from the drinking water system as of June 30, 2023 and June 30, 2025, respectively. On May 17, 2012, OHA denied the City's request for an extension. The existing regulatory schedule to replace all uncovered storage by December 31, 2020 is therefore in effect and the Bureau is moving forward to complete the necessary projects to comply with this schedule. The five-year capital improvement plan has been revised to reflect OHA's decision.
Monthly Bills
The FY 2011-12 Adopted Budget included a budget note directing the bureau to adjust its billing system and business processes so that the majority of water and waste water customers are billed monthly. The bureau submitted a decision package to implement monthly statements to be implemented on July 1, 2012 but was denied. The Budget Advisory Committee (BAC) supported implementing monthly statements but felt customers should be given the option of paying the whole quarterly bill if desired. The BAC recommended including the quarterly billed amount on the monthly statements to provide customers the option to pay the entire bill. City Council has revised their initial direction to the bureau providing monthly statements to those who sign up for electronic billing. The bureau will implement a voluntary electronic monthly statement program. Customers may request an electronic monthly statement, but the meter reading frequencies would not change.
Base Charge
Prior to 2000, the base charge was a fixed monthly or quarterly charge that recovered relevant base charge costs and varied by meter size. The relevant costs recovered by the base charge included billing, collection, customer service, meter purchases, cost of meter maintenance and allocable indirect costs. As part of the 2000 rate reform, City Council lowered the base charge to only include billing, collection, call center, and customer services costs. This shifted more costs to the volumetric portion of the rate structure to promote conservation and to lower the bills for low water use customers. In FY 2009-10, the Bureau raised the base charge rate by the same percentage increase as the volumetric rate. This approach was to make it easier for the public to understand the rate increases. In the FY 2010-11 budget, the Bureau proposed to return the base charge to a more typical and generally accepted cost of service methodology. Neither the BAC, Portland Utility Review Board or the City Council indicated interest in the bureau's proposal; therefore, the base charge has continued to increase at the same percentage rate increase as the volume rate for the last two years.

City of Portland, Oregon – FY 2012-13 Adopted Budget 309
Portland Water BureauPublic Utilities Service Area
This year the bureau revisited the base charge proposal with the BAC once again. There was considerable support from the BAC members to have the base charge calculated using a cost of service methodology, but the members were also concerned, given the current economic conditions, about having significant increases in the base charge for residential customers. Therefore, the BAC recommended the bureau pursue a phase-in approach and have gradual increases to avoid large base charge increases all at once, even if the base charge increases would lower the volume rate increases. The bureau plans to propose to City Council that the bureau develop a phase-in approach to returning the base charge to the more typical and generally accepted cost of service methodology. If approved, this change would be implemented at a future date that has not been identified at this time.
For FY 2012-13, the bureau plans to increase the base charge rate by the same percentage increase as the volumetric rate. With the implementation of monthly statements, the base charge will be based on meter reading frequencies.
Pending Lawsuit
On December 6, 2011, Citizens for Water Accountability, Trust and Reform filed a lawsuit against the City alleging that the City improperly spent millions of dollars of utility ratepayer monies on projects that are unrelated to the utilities' core functions. The lawsuit asked for an order that would require the City to reimburse the Water Fund and Sewage Disposal Fund for those expenditures. The City's preliminary estimate is a combined maximum of about $50 million for both utility funds if all expenditures in question were determined to be inappropriate. This Five-Year Preliminary Financial Plan assumes no reimbursements from the City to the Water Fund.
Service Improvement Plan
Project Decision Making
The Bureau is committed to using benefit/cost analysis and business case principles in its capital and maintenance decision making. The Engineering Planning staff uses business case evaluation in Planning Concept Reports and Basis of Design Reports. Asset Management Plans are being developed, or have been developed, for various groups of assets and replacement and maintenance strategies based on the application of these concepts are being developed.
A list of projects where cost savings have been realized by applying these concepts include the hydrant asset management plan; Council Crest service area improvements; Taylor's Ferry pump station upgrade; Soapstone slide area improvements; Greenleaf pump station/Penridge service area improvements; and Portland Heights pump station improvements.
Manage Risk of Asset Failure
The "risk" service level directs the bureau to assess risks of asset failure. High and extreme risks that are identified receive follow-up actions on an accelerated scale. Since risk is both the consequence of the failure and the likelihood of the failure, it is often necessary and appropriate to focus on the assessment of the condition of the high consequence asset to determine just how high the risk is. The bureau has

310 City of Portland, Oregon – FY 2012-13 Adopted Budget
Portland Water BureauPublic Utilities Service Area
conducted condition assessments of high pressure pump mains, pipes on bridges, pipes under freeway and railroad crossings, and in key operational areas. Over 20 miles of high consequence pipes were evaluated for leaks using innovative technology. The bureau has a flexible services contract available for specialized condition assessment of high risk pipelines.
Among the high risk pipes where inspections or assessments were completed, those indicating a lower likelihood of failure were: SE Supply Line near Macadam Ave, Conduits 2 & 4 near Lusted Hill where a landslide occurred in 2011, Mt. Tabor above Reservoir 6, the Carolina pump main, Kings Heights pump main, Arlington Heights pump main, 36-inch transmission main under I-405, Fulton pump main under I-5, and the Sam Jackson supply main. Two pipes that required immediate remedial action were Barbur Gibbs pump main and the Grand Avenue viaduct crossing.
Reliability Centered Maintenance
Reliability Centered Maintenance (RCM) is a term used to refer to a number of steps, including systematic use of predictive and preventive maintenance processes, to ensure that key assets will continue to perform. The bureau is taking a number of actions to utilize RCM on its rotating equipment and tanks. In December of 2011, the bureau invited consultants from Brown and Caldwell to perform training on the utilization and implementation of RCM. Attendees included staff representatives from engineering, management, electrical, instrumentation, and operations.
Two specific ways that the bureau continues to improve its ability to maintain public assets and incorporate RCM include taking advantage of new technologies and improving work flow processes. Resources and work flows are now managed through use of a computerized maintenance management system (CMMS) which allows tracking and prioritization of corrective maintenance tasks. Additionally, the bureau continuously refines its standard operating procedures and improves techniques for data collection for better accuracy and precision. These technologies include utilizing such techniques as electrical thermography, networked electrical monitoring, PGE electronic metering, vibration analysis, and oil and fuel analysis.
The asset management group uses the data from these sources to determine asset risk versus probability of failure and make recommendations for replacement.
Currently, the bureau is engaged in a contract for $150,650 to develop a new mobile application to allow for wireless field entry and access to the CMMS, which will allow for better data management and resource allocation.
Cathodic protection for all 33 steel tanks is being planned by Engineering Services Design Engineers at an average cost of $35,000 per tank. This work began in FY 2008-09 and is scheduled for three tanks per year for 11 years. The groundwater pump station tank is currently undergoing improvements for cathodic protection.

City of Portland, Oregon – FY 2012-13 Adopted Budget 311
Portland Water BureauPublic Utilities Service Area
Meters
The bureau is developing criticality reports to be used in the meter program for monitoring, maintenance and replacement of large meters. The current approach was developed in the first asset management plan for meters completed in 2007 and the approach will be revised in a new asset management plan to be completed this calendar year.
Portland Hydroelectric Project Operations
Due to the age of the Portland Hydroelectric Project, there are currently a number of identified needs for repair or replacement of various elements of the PHP's equipment and facilities to keep operations safe and reliable. The required funding for this work is included in the Hydroelectric Power Division's FY 2012-13 budget.
Summary of Budget Decisions
Water Division Budget
The Water Division's budget of $217 million is composed of the operating budget of $81 million and the capital budget of $136 million.
Operating Budget
The operating budget of $80.8 million represents an increase of $3.2 million from the FY 2011-12 Revised Budget of $77.6 million.
Capital Budget
The capital budget of $135.9 million is an increase of $23.4 million from the FY 2011-12 Revised CIP Budget of $112.4 million. For additional information refer to the FY 2012-17 Requested Five-Year Capital Improvement Plan.
Staffing
The FY 2012-13 Adopted Budget funds 616.8 FTE. This includes five new positions associated with the increased monitoring decision package, ten position reduction, one limited term full time and two limited term part time.
Rate Increase
The bureau's average effective in-city retail rate increase is 7.60% for FY 2012-13. This increase includes the decision package for increased monitoring for the treatment variance.
Hydroelectric Power Division Budget
The Hydroelectric Power Division's FY 2012-13 operating budget is $703,328. This budget supports the Portland Hydroelectric Project's administrative and operational costs with power sales revenue that is specifically dedicated for that purpose.
Staffing
The Hydroelectric Power Division's budget maintains 2.25 FTE positions in FY 2012-13.

312 City of Portland, Oregon – FY 2012-13 Adopted Budget
Portland Water BureauPublic Utilities Service Area
Capital BudgetBureau Summary
CIP Highlights The bureau's Five-Year CIP includes about $535 million in water system infrastructure needs for the five year period beginning in FY 2012-13 and stated in FY 2012-13 dollars.
The budget program framework structure consists of seven primary budget programs that are the top level organizing elements in the City budget documents, and 22 water programs that further delineate the bureau's work and assets. For framework details and program descriptions, refer to the section titled "Capital Plans and Projects."
Most of the CIP is for improvements to the transmission and terminal storage system to comply with LT2. While Portland no longer has to construct a treatment plant, it still is required by the OHA to cover or replace the open reservoirs.
Treatment and the revised LT2 storage and conduit projects in transmission and terminal storage, is now about 45% of the CIP, the distribution program is about 42%, with Interstate facility improvement and Willamette River crossing pipe included in the distribution total. Projects to meet bureau obligations of the Bull Run Habitat Conservation Plan (HCP) are about 7%, while Supply, Customer Service and Support comprise the remaining 6%.
The bureau's commitment to replace and rehabilitate its aging core infrastructure continues near the same funding level as prior years, but the relative percentage by program shifts dramatically with the commitments to comply with LT2.
Notable projects include modifications to the Bull Run Dam 2 outlet tower, rehabilitation of the Interstate maintenance facility, Willamette River crossing pipe, Fulton pump station improvement, and completion of the city emergency coordination center (ECC) which is a joint project with OMF Internal Business Services and Facilities.
Continuing construction of a second 50 million gallon water storage tank at Powell Butte, beginning construction of the Kelly Butte replacement tank, completing planning of the Washington Park area storage, and piping adjustments needed to disconnect the Mt Tabor open reservoirs are the LT2 related capital projects.
Major Issues The FY 2012-17 CIP continues to balance longer term infrastructure replacement and maintenance, while addressing short-term water system infrastructure needs to ensure compliance with drinking water regulations. The CIP priorities for the bureau's budget and capital programs include:
Develop a budget and CIP that reflect community priorities and values and are funded at a level responsive to affordability concerns, yet maintain service levels.
Fund system infrastructure replacement and maintenance needs to keep pace with ongoing deterioration.
Support other governmental agency capital improvement projects (e.g., light rail, Sellwood Bridge, Columbia River crossing) as directed by City Council.

City of Portland, Oregon – FY 2012-13 Adopted Budget 313
Portland Water BureauPublic Utilities Service Area
Continue to expand the utilization of an asset management system plan and maintenance management system to support planning and implementation of system maintenance activities.
Implement the Bull Run HCP, a comprehensive multi-decade Clean Water and Endangered Species Act compliance agreement for the Bull Run Watershed.
Implement improvements necessary to assure compliance with current safe drinking water regulations, including LT2.
Changes from Prior Year
The bureau developed the FY 2012-17 CIP using the budget process it has used for the past five years in response to the priorities identified by the City Council and key stakeholders. The CIP is more than $130 million for FY 2012-13 and totals about $535 million (FY 2012-13 dollars) over the entire five years.
In March 2012, the bureau received a variance to the LT2 treatment requirements from the OHA. This decision saves Portland ratepayers roughly $70 million in capital expenses by allowing Portland to avoid constructing a treatment facility to address the microorganism Cryptosporidium for the City's Bull Run source. The variance went into effect on April 1, 2012 and will be in effect for 10 years if Portland is able to continue to meet a list of conditions set forth by the agency.
Then on May 17, 2012 OHA denied the bureau's request for an adjustment to its regulatory schedule to replace the uncovered drinking water reservoirs at Mt.Tabor and Washington parks. This decision means that Portland's existing regulatory schedule to end the use of the uncovered reservoirs by December 31, 2020 remains in effect. Portland had requested an extension of that schedule to the year 2026.
Strategic Direction
Council Goals and Priorities
The CIP addresses multiple City goals; primarily the delivery of efficient, effective and accountable municipal services; as well as protection and enhancement of the natural and built environment. Some projects support other goals, such as utility relocation for major transportation initiatives and energy efficiency.
City Comprehensive Plan
The PWB is committed to the following Comprehensive Plan Goals and Policies for the City:
Goal 2, Urban Development: The CIP supports safe, adequate, and affordable water supplies to support the land uses listed in this Goal's strategies.
Goal 3, Neighborhoods: The CIP supports policy 3.1 on physical conditions preventing deterioration of existing public facilities through projects that maintain and/or replace infrastructure assets. These include mains replacements, pump station upgrades, meter replacements, hydrant renewals, tank maintenance and/or new tank development, and in-city transmission main replacements and/or new installation.
Goal 4, Housing: The water system is designed to meet the housing needs allocated to various areas within the city through the Comprehensive Plan.
Goal 5, Economic Development: A key aim of the CIP is to ensure that water quantity and quality meet the existing and potential needs of businesses in support of policy 5.2 Business Development, 5.5 Infrastructure Development, and 5.10 Columbia South Shore.

314 City of Portland, Oregon – FY 2012-13 Adopted Budget
Portland Water BureauPublic Utilities Service Area
Goal 6, Transportation: The CIP supports water system adjustments and relocations required to accommodate the construction and operation of light rail and other transportation projects.
Goal 7, Energy: The CIP supports energy efficiency policies through the industrial water conservation program, and through the planning and construction of capital facilities with sustainability as an important criterion.
Goal 8, Environment: The PWB's CIP supports the implementation of the Bull Run HCP, a comprehensive multi-decade Clean Water and Endangered Species Act compliance agreement for the Bull Run Watershed. In addition, all water projects planned for construction that may impact environmentally sensitive locations inside the urban area include studies of the environmental review, recommendations for mitigation, and any necessary City and federal permit processes that apply, including environmental zone reviews and ESA consultations.
Goal 9, Public Involvement: The PWB engaged the public in developing its budget and the CIP. All Portland CIP projects that affect neighborhoods or that require city, state, and/or federal permit review processes include public involvement elements.
Goal 11, Public Facilities: The CIP is designed to meet the primary Public Facilities Goal, particularly Policy 11.1 on service responsibility for subsection (6) - Water Supply. Policy 11.7 requires that the CIP be an annual planning process for major improvements.
Criteria CIP criteria focus on large distribution, storage and environmental regulatory compliance projects to address vulnerability, LT2, and the HCP. Other criteria include maintaining, improving or replacing aging infrastructure that is essential to the long term health of the water system.
The PWB's capital prioritization is also guided by values including, but not limited to: public health and safety, reliability, reducing vulnerability, minimizing environmental impact, and affordable water rates.
A distribution system master plan and updated computer model completed in June 2007 remains the planning resource for many projects not related to regulatory compliance. The focus of the plan was the distribution backbone system: 40 pump stations, 68 tanks, and the large-diameter pipelines (approximately 300 miles) that distribute water from Powell Butte Reservoir to terminal storage at Mount Tabor and Washington Park and to the distribution system service areas. The plan described service goals, project priorities, hydraulic model upgrades, condition assessments, and asset management recommendations.
Capital Planning and Budgeting
Capital Planning Process
The CIP is the implementation plan for water system improvements. It is updated annually and is the budget and policy tool for the PWB and City Council to direct capital work. The CIP identifies, in detail, specific projects, their budgets, phasing or components, and the relationship among capital projects.

City of Portland, Oregon – FY 2012-13 Adopted Budget 315
Portland Water BureauPublic Utilities Service Area
The CIP process is a bureau-wide collaborative effort of engineers, operations and maintenance managers, financial analysts, and policy staff. Together they bring to bear planning analysis; engineering standards; operational, technical, regulatory and fiscal expertise, and an understanding of external factors affecting PWB operations.
The CIP and capital budget priorities are reviewed by the BAC as part of the bureau's budget proposal and by the Portland Utility Review Team (PURB).
Financial Forecast Overview
The CIP is an integral element in the development of the bureau's financial plan, because the size of the CIP has a significant effect on water rates. The mix of projects in the CIP is also important. Projects related to supply and transmission enhancements serve both wholesale and retail customers alike, but costs for projects related to the distribution system can only be allocated to retail customers. Finally, the method chosen to finance projects affects rates as well. Specifically, debt service coverage targets (which affect the balance between debt and cash financing) and bond terms and structures can have a significant effect on water rates.
The projected water rates for the five-year financial forecast are based on the CIP and operations and maintenance (O&M) budgets and other factors affecting rates. Those factors include projected demand estimates, inflation factors, and other economic factors such as interest rates.
Retail Rate Impact
The revenue forecast refers to the costs that are expected to be recovered from water sales, regardless from whom they will be collected. The revenue requirements must be allocated between wholesale and retail customers to determine the specific customer class rate revenue impact. Contractual provisions specify the method of allocating costs to wholesale customers. Retail rates are set on a residual cash basis to recover whatever portion of the total cash basis revenue requirements that is not allocable to wholesale customers. After deducting all other revenue sources, including wholesale revenues, the PWB's proposed average effective retail rate increase for FY 2012-13 is 7.6%.
Water Construction Fund
Capital investments in the water system are funded through the Water Construction Fund (WCF). The WCF is financed from three major sources: transfers from the Water operating fund (primarily water sales revenues), net proceeds from revenue bond sales, and construction fund revenues (direct reimbursements, system development charges, and interest earnings). These monies fund indirect capital costs (overhead and interest) as well as direct project costs. For this CIP, approximately 29% of capital requirements are funded with current resources, and the balance will come from bond proceeds.

316 City of Portland, Oregon – FY 2012-13 Adopted Budget
Portland Water BureauPublic Utilities Service Area
Cash/Water Sales Financing: The bureau has two debt service coverage planning standards for rate setting. The PWB's target minimum debt service coverage ratio is 1.90 on first lien bonds (1.25 per bond covenant) and the debt service coverage ratio on combined first and second lien bonds is 1.75 stabilized net revenue (1.10 per bond covenant). In managing the second lien-stabilized test, the PWB employs a rate stabilization account that also serves the dual purpose of a "rainy day" fund. Managing these two ratios together reflects the bureau's desire to optimize its capital financing strategies and maximize existing resources.
Debt Financing: Pursuant to the City Charter, state statutory authority, and City Council approval, the bureau may issue debt in the form of revenue or general obligation bonds. By City Charter, the WCF is the recipient of net proceeds from bond sales to fund capital improvements. Bond reserves are deposited in the Water Sinking Fund. Between $80.0 to $85.0 million in revenue bonds, including a bond reserve, are scheduled to be sold in calendar year 2012. The bureau also plans to issue revenue bonds annually for the first two years and year four of the five year forecast to provide necessary debt financing for the five-year period. Bonds were previously issued every two years to facilitate compliance with IRS regulations regarding the period during which the proceeds must be spent. Bond sales will be required every year for the next two years to provide funding to construct the capital facilities required. Beyond this CIP, bond sales will likely be sold again biennially to fund the future improvement requests.
WCF Revenues: The bureau's level of WCF revenues is determined mainly by the actions of external parties, with the majority of these revenues (in current dollars) coming from service and main installations ($2.4 million in FY 2012-13) and interagency capital revenues ($1.7 million in FY 2012-13).
Operations & Maintenance and Capital Studies
The CIP also includes a small portion of project expenditures that cannot be funded through the WCF. These expenditures generally fall into the grouping of capital studies, preliminary engineering, and other work that does not meet the capital criteria of a betterment, improvement, or addition to the water system as set forth by city policy or industry practice. The CIP includes about $3.2 million of O&M and studies in FY 2012-13. The total O&M and studies over the five years is $17.3 million. As an operating cost, these are 100 percent cash-financed, usually through water sales.
Asset Management and Replacement Plans
The PWB's general asset management goal is to extend the useful life of the City's water facilities through appropriate maintenance and repair until such time as infrastructure replacement is more cost effective. The type of facility, its age, and the effectiveness of past maintenance and repair activities drive the repair and replacement cycles.
The operational life of a majority of the PWB's key infrastructure facilities, such as the Bull Run dams, pipeline networks, buildings, and concrete reservoirs, ranges from 50 years to more than 100 years. Other assets such as mechanical and electrical systems and certain distribution system appurtenances (meters, regulators, etc.) usually have shorter life cycles of 20 to 50 years. These life cycle ranges are a key driver of the bureau's ongoing capital maintenance programs.

City of Portland, Oregon – FY 2012-13 Adopted Budget 317
Portland Water BureauPublic Utilities Service Area
Excluding LT2 compliance projects, most of the CIP is focused on maintenance and replacement of key system components. In addition to the CIP, there is a preventive maintenance and repair program in the operating budget that provides for more immediate and routine maintenance.
With an estimated replacement value for the City's water system of more than $6.7 billion, asset management and replacement programs will continue to be one of the largest CIP activities, protecting the public's investment in its drinking water system. A large portion of the CIP is for the distribution mains program that annually replaces about four miles of distribution mains. The services water program installs up to 1,000 new service lines and replaces up to 500 annually.
An assessment of the water system, based on a comparison of the age of assets to their useful life, on actual condition assessment data, or on identified vulnerabilities, suggests that the transmission and distribution system's capital costs will need to increase in the future, as many of these assets will reach the end of their economic life.
The PWB is undertaking projects to better understand the condition of its high risk pipes and valves. Those assets confirmed as high risk will be repaired or replaced.
Capital Programs and Projects
Capital Program Descriptions
The 22 water program areas are summarized within the CIP in the following 7 program areas:
Customer Service Program
Capital projects in the Customer Service program address the need to improve security of critical PWB facilities and improvements to the bureau's grounds and parks. A major project in this program is the City Emergency Coordination Center.
Distribution Program
The Distribution program addresses the reliability and expansion of the piping, pumping and storage network that primarily distributes water from terminal storage reservoirs to retail customers. It addresses the ongoing installation and replacement need for 2,100 miles of distribution mains, including control valves, fire hydrants, and customer service connections, as well as pump stations, storage tanks, large diameter distribution system transmission mains, and pressure regulating stations. The program also provides for relocation and other adjustments to water pipes and facilities to accommodate transportation and other public infrastructure projects. Rehabilitation and improvement of decorative and drinking fountains and the replacement of the Interstate maintenance facility are also included in the program. Over $220 million of the CIP is budgeted in this program. Major projects in this CIP include the construction of the Portland to Milwaukie Light Rail, central SCADA server replacement and Interstate facility rehabilitation, several pump station replacement, upgrade or extensions, as well as pre-design towards replacement of the Willamette River Pipe Crossing.

318 City of Portland, Oregon – FY 2012-13 Adopted Budget
Portland Water BureauPublic Utilities Service Area
Regulatory Compliance and Water Quality Program
The Regulatory Compliance and Water Quality program includes improvements to both Bull Run and groundwater sources. The program ensures that water throughout the water system meets federal and State of Oregon drinking water quality standards. FY 2012-13 is the second year of the 50-year federally approved Habitat Conservation Plan (HCP) and this CIP includes funding for multiple easements and improvements per that plan as well as the construction of the Bull Run Dam 2 tower intake structure to better control the release of water to enhance downstream conditions for anadromous fish species.
Supply Program
The Supply program includes both the watershed areas and groundwater basins. Projects in the Bull Run Watershed address reliability of the principal water supply source. The program's objectives include maintaining the reliability of the water supply through effective management of watershed assets.
The Columbia South Shore (CSS) wellfield is Portland's second water source, augmenting Bull Run and serving as the region's backup water supply. The CSS wells enable the bureau to continue to serve customers when there is an interruption of the Bull Run surface supply. The Bull Run supply can be interrupted by major storm events that result in unacceptable levels of turbidity, drought conditions that restrict supply, conduit operation interruption, or other natural or man made issues. The groundwater supply allows the bureau to continue to operate without constructing and operating a costly surface water filtration plant. The groundwater portion of the program focuses on maintaining the installed capacity and reducing vulnerability of the CSS wellfield. The work includes maintenance and improvements to wells, pumps, collection mains, and the disinfection treatment of groundwater. This CIP does not include major expansion of the CSS wellfield beyond the current capacity but it does include projects to reduce the vulnerabilities in the Groundwater Pump Station as well as other projects to repair and upgrade our groundwater infrastructure.
Support Program
The Support program addresses non-asset specific work such as master planning and other similar support functions. Master planning focuses on identifying the need and timing of infrastructure acquisition or improvements and the most effective asset management strategies to maximize infrastructure investments. The bureau has several studies planned in this CIP related to its tanks, pump stations and mains. These studies guide the selection and design of major capital projects for external construction as well as the many smaller mains constructed by bureau crews to reduce leaks.
Transmission and Terminal Storage Program
The Transmission and Terminal Storage program provides for the rehabilitation, replacement, and expansion of the primary transmission pipelines and terminal storage reservoirs that make up the supply backbone of the water system.

City of Portland, Oregon – FY 2012-13 Adopted Budget 319
Portland Water BureauPublic Utilities Service Area
In FY 2009-10, work began on storage projects to achieve compliance with the LT2 rule as written. The rule requires that water systems with uncovered finished water reservoirs, like those at Mt. Tabor and Washington Park, either cover the reservoirs or provide treatment at the outlets of the reservoirs to inactivate Cryptosporidium, Giardia, and other viruses. A plan explaining the schedule and manner for bringing Portland into compliance with the covered storage requirements of the rule was approved by the EPA in April 2009.
That plan describes how the bureau intends to build additional and replacement enclosed drinking water storage and establishes deadlines for when the Mt. Tabor and Washington Park open reservoirs will be disconnected from the drinking water system, which is December 31, 2015 and December 31, 2020 respectively.
The bureau requested a schedule extension to delay the disconnection dates to 2021 and 2026 but the request was denied. The decision by OHA means that Portland's existing regulatory schedule to end the use of the uncovered reservoirs by December 31, 2020 remains in effect.
Major projects in this program continues construction of the second 50 million gallon water storage tank at Powell Butte, and for other enclosed storage for LT2 compliance at Kelly Butte and Washington Park.
Treatment Program
In March 2012, OHA granted a ten-year variance from water treatment. Based on this variance, PWB has halted its efforts to build a UV treatment plant to comply with the rule. This CIP funds only the design and construction of flow meters at Headworks which will improve Portland's compliance with other drinking water rules related to chemical additions.
Funding Sources See the Financial Forecast Overview above for an explanation of funding sources for the CIP.
Major Projects Customer Service
Some security related projects and projects for the bureau's grounds and parks are budgeted in this program. The Water Bureau is participating in the city Emergency Coordination Center project. Security staff will operate from this center with PBEM and in the event of an emergency, all bureaus and the Council will work from this site.
Distribution
Over $220 million of the total CIP is dedicated to this program, with $46 million requested to continue rehabilitation of the Interstate Maintenance facility. Other areas include pump stations and tanks, distribution pipelines, services, meters, hydrants, and valves. Of the total, about $72 million is to be used for direct water line replacement projects. Much of the effort is a result of work initiated by other bureaus and agencies including TriMet, but work also includes replacement of the oldest or most deteriorated portions of the distribution system. Construction will begin on the $12 million Fulton pump station replacement and Portland Heights pump main. Construction will also start on the 1.3 million gallon Forest Low tank which is expected to cost about $8 million. PWB will continue the pre-design of the Willamette River Pipe crossing.

320 City of Portland, Oregon – FY 2012-13 Adopted Budget
Portland Water BureauPublic Utilities Service Area
Regulatory Compliance
The Dam 2 Tower multilevel intake improvement is the major project in this program. The anticipated total project cost is over $40 million to account for the amount of underwater diving work that will be needed to accomplish the project. Other significantly less expensive HCP projects include fish habitat enhancements and the acquisition of land easements and improvements to those properties with the cooperation of landowners and other organizations involved with maintaining the Bull Run Watershed.
Supply
This program implements the improvements to existing facilities in the Bull Run watershed areas and groundwater basins. Currently, the City is making capital improvements to the groundwater system in the following areas: (1) rehabilitating well pumps and motors; (2) maintaining and repairing wells that produce excessive sand and changing the pump settings in selected wells to optimize well performance; and (3) installing and equipping additional wellhead protection monitoring wells to protect investment in wellfield infrastructure and ensure the quality of the groundwater produced by the system.
Support
There are no major projects proposed in this program. The program funds general engineering planning studies and includes bureau participation in the citywide systems plan being developed by the Planning Bureau. All major capital studies have planning studies to determine cost effective solutions which can take up to a year. The remaining studies are smaller ones to prioritize Distribution projects to reduce leaks.
Transmission and Terminal Storage
In this program, efforts will continue with the construction of Powell Butte Reservoir and the design and construction of Kelly Butte, complete planning for the Washington Park Reservoir, and design of piping adjustment at Mt. Tabor. The bureau will also complete construction on the Sandy Wholesale Connection which is a new meter connection for the City of Sandy.
Treatment
The UV treatment project has been halted in the design phase, and the only project in this program is the Headworks Flow Meters to regulate chemical additions to the system in compliance with drinking water regulations. The total CIP amount for this sole project in this program is $2.6 million
Net Operating and Maintenance Costs or Savings
O&M costs, when applicable, are estimated as part of the project feasibility study and preliminary evaluations. The costs generally include labor, electricity or fuel, and chemicals. Changes in the cost of energy and chemicals are normally much easier to identify and estimate than labor or efficiency savings.

City of Portland, Oregon – FY 2012-13 Adopted Budget 321
Portland Water BureauPublic Utilities Service Area
Much of the CIP is dedicated to the ongoing renewal and replacement of the backbone water system, the pipes, valves, hydrants and other system appurtenances. These long life passive assets, typically buried and not visible, do not require much in the way of regular O&M. Following initial installation, only occasional specific maintenance is completed, such as pipeline flushing, verifying water control valve operation, and fire hydrant flow testing. Due to the large inventory of these assets, completed renewal projects may result in only a nominal net change in O&M costs because the maintenance cost is so minimal.
For example, the replacement of pipelines with a high frequency of leaks will result in reduced reactive O&M due to fewer leak repairs. However, the relatively small percentage of pipe length replaced in any given year will not appreciably alter the O&M budget. Other infrastructure, such as pump station improvements, may increase O&M costs as a result of energy consumption when new facilities are constructed. Most improvements are to reconstruct existing facilities, and though annual costs can be hundreds of thousands of dollars, the net change in O&M expense is only significant when new facilities are constructed.
An example of a new facility is the ECC where the Wat6er Bureau's portion of the annual building expense is estimated to be $300,000 when occupied starting in FY 2013-14.

322 City of Portland, Oregon – FY 2012-13 Adopted Budget
Portland Water BureauPublic Utilities Service Area
Administration & Support Administration & SupportDescription The Administration and Support program works to support the other programs in
the bureau. Examples of this support include personnel training, data management, financial planning and accounting, and facilities services. This program is also responsible for meeting many Citywide responsible requirements, such as those related to budgeting, accounting, and human resources.
Goals This program supports the City goal of protecting and enhancing the natural and built environment, particularly with respect to providing safe drinking water. It also supports the City goal of promoting economic vitality and opportunity, especially providing high quality, affordable public utility services.
Performance PWB will provide a level of support that allows the bureau to maximize the efficiency and effectiveness of its direct services.
Changes to Services and Activities
In the FY 2012-13 budget there is funding for studies to guide the selection and design of major capital projects for external construction as well as the many smaller mains constructed by Water Bureau crews to reduce leaks.
FTE & Financials Actual
FY 2009-10 Actual
FY 2010-11 Revised
FY 2011-12 ProposedFY 2012-13
AdoptedFY 2012-13
FTE 196.03 197.70 201.10 199.10 197.10
Expenditures
Bureau Support 12,208,962 13,885,844 14,305,514 18,917,243 18,796,420
Data Management 2,643,652 3,009,911 3,023,412 3,006,033 3,006,033
Employee Investment 2,076,250 2,089,378 4,013,920 4,098,657 4,205,085
Facilities 4,356,125 103,806 0 0 0
Planning (14,528,137) (13,678,634) 4,469,802 4,933,649 4,925,472
Total Expenditures 6,756,850 5,410,305 25,812,648 30,955,582 30,933,010
Performance Actual
FY 2009-10 Actual
FY 2010-11 Yr End Est.FY 2011-12
BaseFY 2012-13
TargetFY 2012-13
Effectiveness
Pct of time bureau maintains Aaa rating for revenue bonds 100% 100% 100% 100% 100%
Debt Service coverage at 1.90 on First Lien Bonds 2.69 2.42 1.90 1.90 1.90
Debt Service coverage at 1.75 on both First and Second Lien Bonds
1.81 1.90 1.75 1.75 1.75
Percent of budgeted CIP expended 105% 94% 100% 100% 100%
Efficiency
Percent of projects forecast to be completed within three months of planned date
94% 97% 80% 80% 80%

City of Portland, Oregon – FY 2012-13 Adopted Budget 323
Portland Water BureauPublic Utilities Service Area
Customer Service Customer ServiceDescription The Customer Service program provides services for customers other than the
direct supply of water. It includes customer billing, collection, and call center costs, which are the largest portion of the costs of this program. It also includes work on conservation, security, and grounds maintenance for bureau properties.
Goals This program supports the City goal of protecting and enhancing the natural and built environment, particularly with respect to providing safe drinking water. It also supports the City goal of promoting economic vitality and opportunity with respect to providing high quality, affordable public utility services.
Performance The Bureau's measures of program performance include:
PWB will answer 80% of calls within 60 seconds. PWB will respond to 95% of customer inquires or requests within 5 days. PWB will maintain a target of 75% of customers giving high or very high
ratings on Auditor's Survey. Forty percent of customer accounts will be paid electronically. Reduce the bureau's carbon emissions from 2007 levels. Increase the percent of energy use from new renewable sources from 2007
levels.
Changes to Services and Activities
The major project in this program is the bureau's participation in the City ECC.
FTE & Financials Actual
FY 2009-10 Actual
FY 2010-11 Revised
FY 2011-12 ProposedFY 2012-13
AdoptedFY 2012-13
FTE 151.05 149.30 145.70 142.70 139.70
Expenditures
Conservation/Sustainability 1,050,268 802,193 929,758 1,022,638 1,022,638
Customer Services 13,834,334 13,324,079 15,053,658 14,955,587 14,672,131
Fountains 780,010 2,910 0 0 0
Grounds/Parks 4,891,098 1,895,915 1,279,277 1,341,194 1,276,286
Security/Emergency Management 2,931,454 2,647,924 3,073,098 9,501,614 9,501,614
Total Expenditures 23,487,164 18,673,021 20,335,791 26,821,033 26,472,669
Performance Actual
FY 2009-10 Actual
FY 2010-11 Yr End Est.FY 2011-12
BaseFY 2012-13
TargetFY 2012-13
Effectiveness
Percent of customers giving high or very high ratings on Auditor's Survey
85% 77% 75% 75% 75%
Capacity of new renewable energy sources, kilowatts 279 279 400 400 400
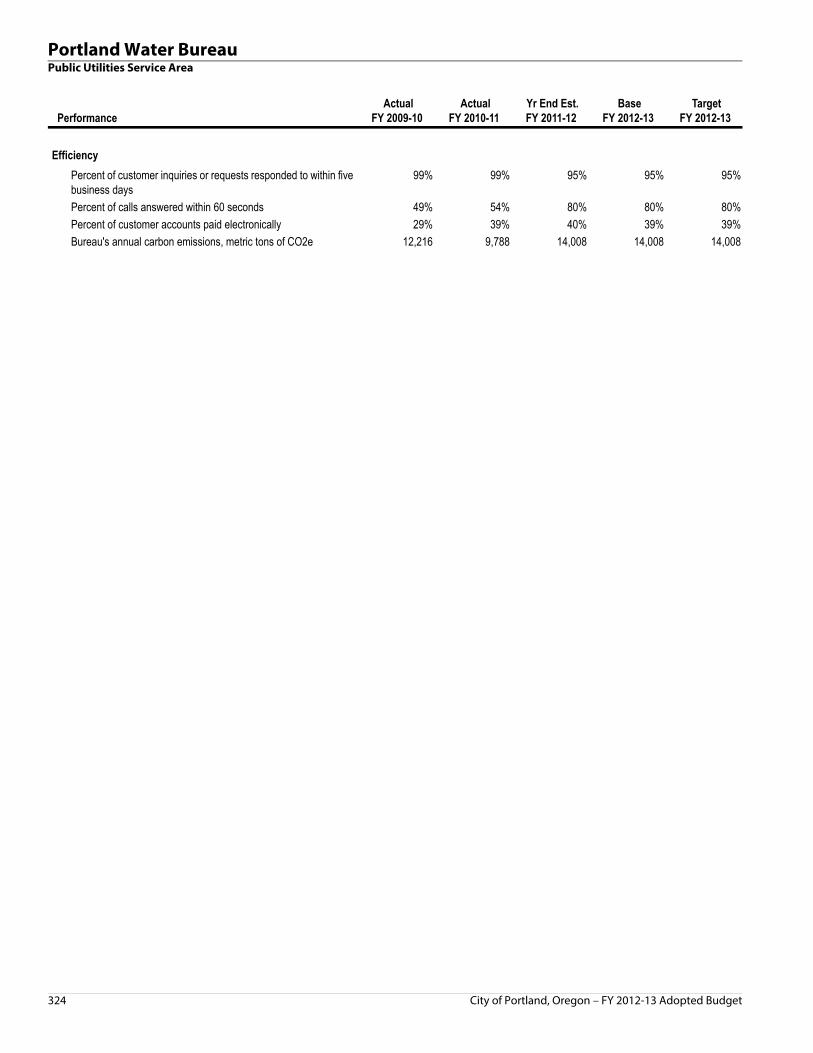
324 City of Portland, Oregon – FY 2012-13 Adopted Budget
Portland Water BureauPublic Utilities Service Area
Efficiency
Percent of customer inquiries or requests responded to within five business days
99% 99% 95% 95% 95%
Percent of calls answered within 60 seconds 49% 54% 80% 80% 80%
Percent of customer accounts paid electronically 29% 39% 40% 39% 39%
Bureau's annual carbon emissions, metric tons of CO2e 12,216 9,788 14,008 14,008 14,008
Performance Actual
FY 2009-10 Actual
FY 2010-11 Yr End Est.FY 2011-12
BaseFY 2012-13
TargetFY 2012-13

City of Portland, Oregon – FY 2012-13 Adopted Budget 325
Portland Water BureauPublic Utilities Service Area
Distribution DistributionDescription The Distribution program is primarily responsible for the conveyance of water
from the terminal storage reservoirs through the customer meters. This program includes distribution mains, tanks, meters, services, hydrants, valves, gates, decorative fountains, and drinking fountains. This program is responsible for a wide variety of elements, such as tanks to store water and maintain system pressures, meters to accurately record usage for billing purposes, hydrants for fire protection and for line flushing purposes, and valves to alter or stop water flows under various circumstances such as line breaks or fire needs. A considerable portion of spending in this program is for system maintenance.
Goals This program supports the City goal of protecting and enhancing the natural and built environment, particularly with respect to providing safe drinking water. It also supports the City goal of promoting economic vitality and opportunity with respect to providing high quality public utility services.
Performance The program performance metrics include the following:
No more than 5% of customers will be out of water for more than 8 hours a year. No customer will be out of water more than 3 times per year. PWB maintains a minimum service pressure of 20 pounds per square inch (psi)
during normal demands 99% of the time. PWB will meet at least 80% of standards established for inspection, testing,
repair and replacement of assets that are identified as medium, high or extreme risk.
PWB will have more than 90% of flow control valves operate when needed.
Changes to Services and Activities
The major projects in the CIP include the construction of the LRT Transit SE, Water control center SCADA replacement, and Interstate facility rehabilitation.
FTE & Financials Actual
FY 2009-10 Actual
FY 2010-11 Revised
FY 2011-12 ProposedFY 2012-13
AdoptedFY 2012-13
FTE 227.17 226.00 214.00 212.00 209.00
Expenditures
Distribution Mains 23,065,625 22,196,230 21,101,447 19,072,941 13,369,727
Field Support 5,572,215 5,826,910 10,958,042 25,562,346 25,296,276
Fountains 267,771 874,943 817,002 818,277 818,277
Hydrants 2,131,123 2,228,521 1,503,343 1,639,758 1,639,758
Meters 3,425,619 3,181,116 3,379,278 3,328,647 3,328,647
Pump Stations/Tanks 9,130,231 11,422,649 10,184,016 14,943,110 15,093,110
Services 6,735,845 6,953,979 5,106,149 5,746,188 5,692,974
Valves/Gates/Regulators 1,056,970 1,339,835 1,144,000 1,287,860 1,287,860
Total Expenditures 51,385,398 54,024,183 54,193,277 72,399,127 66,526,629

326 City of Portland, Oregon – FY 2012-13 Adopted Budget
Portland Water BureauPublic Utilities Service Area
Performance Actual
FY 2009-10 Actual
FY 2010-11 Yr End Est.FY 2011-12
BaseFY 2012-13
TargetFY 2012-13
Effectiveness
Customers out of water more than three times per year 1 6 0 0 0
Percent of flow control valves operational when needed 93% 95% 90% 90% 90%
Percent of standards met for high risk assets 81% 83% 80% 80% 80%

City of Portland, Oregon – FY 2012-13 Adopted Budget 327
Portland Water BureauPublic Utilities Service Area
Hydroelectric Power Hydroelectric PowerDescription The Hydroelectric Power program provides for the administrative, operational,
and regulatory oversight activities as required for the Portland Hydroelectric Project (PHP). Program staff members provide the day-to-day oversight and coordination for the operation of the PHP which includes the control of the levels in the City's Bull Run reservoirs, the withdrawal of water from those reservoirs, and the release of water downstream for compliance with in-stream regulatory flow targets. Additionally, the program coordinates all issues associated with the sales of generated power to PGE, the administration of the PHP's revenue bonds and related trust indenture requirements, and all state and federal regulatory requirements associated with both the PHP and the Mt. Tabor Hydroelectric Project.
Goals This program supports the City goal of delivering efficient, effective, and accountable municipal services. It also supports the City goal of protecting and enhancing the natural and built environment, particularly with respect to its oversight and coordination of dam safety issues and the ongoing operation of the PHP on the Bull Run River.
Performance In FY 2010-11, the amount of power generated by the PHP was 121% of its long-term annual average. For FY 2011-12, that generation is projected at 108% of average. During FY 2011-12, this program's staff will have provided all required oversight and support for the two hydroelectric power projects and the seven dams that it now oversees and monitors.
Changes to Services and Activities
In FY 2011-12, Hydroelectric Power transferred $300,000 in Hydroelectric Power Operating Fund profits to the City's General Fund and in FY 2012-13 that amount is being increased to $500,000.
FTE & Financials Actual
FY 2009-10 Actual
FY 2010-11 Revised
FY 2011-12 ProposedFY 2012-13
AdoptedFY 2012-13
FTE 3.00 2.15 3.00 2.25 2.25
Expenditures
Hydroelectric Power 532,564 556,523 692,954 703,328 703,328
Total Expenditures 532,564 556,523 692,954 703,328 703,328
Performance Actual
FY 2009-10 Actual
FY 2010-11 Yr End Est.FY 2011-12
BaseFY 2012-13
TargetFY 2012-13
Effectiveness
Power Sold to PGE (mwh) 88,854 103,301 91,900 50,400 50,400
Efficiency
Transfer of Hydropower Profits to General Fund $290,000 $250,000 $300,000 $500,000 $500,000

328 City of Portland, Oregon – FY 2012-13 Adopted Budget
Portland Water BureauPublic Utilities Service Area
Regulatory Compliance Regulatory ComplianceDescription The Regulatory Compliance program has the responsibility for meeting or
exceeding all federal and state water quality requirements. It is also responsible for meeting other regulatory standards, including compliance with the Endangered Species Act, proper disposal of dechlorinated water, and various monitoring requirements.
Goals This program supports the City goal of protecting and enhancing the natural and built environment, particularly with respect to providing safe drinking water. It also supports the City goal of promoting economic vitality and opportunity with respect to providing high quality public utility services.
Performance The bureau will have no violations of state and federal drinking water quality regulations nor any violations of environmental regulations (including NPDES permit requirements, Clean Water Act requirements, and Endangered Species Act requirements).
Changes to Services and Activities
FY 2012-13 is the second year of the 50-year federally approved HCP, and includes funding for construction of the Bull Run Dam 2 tower intake structure. The budget includes $1.5 million for increased treatment monitoring approved by OHA.
FTE & Financials Actual
FY 2009-10 Actual
FY 2010-11 Revised
FY 2011-12 ProposedFY 2012-13
AdoptedFY 2012-13
FTE 43.00 42.00 42.00 46.00 46.00
Expenditures
Regulatory Compliance 7,133,173 11,814,873 18,119,270 29,527,491 29,527,491
Total Expenditures 7,133,173 11,814,873 18,119,270 29,527,491 29,527,491
Performance Actual
FY 2009-10 Actual
FY 2010-11 Yr End Est.FY 2011-12
BaseFY 2012-13
TargetFY 2012-13
Effectiveness
Number of violations of state or federal drinking water quality standards
1 0 0 0 0
Violations of environmental regulations 0 0 0 0 0

City of Portland, Oregon – FY 2012-13 Adopted Budget 329
Portland Water BureauPublic Utilities Service Area
Supply SupplyDescription The provision of water in the quantities desired by customers is a key portion of the
mission of the bureau. The Supply program is responsible for providing the water that all customers use in the Portland service area, including both retail and wholesale customers. The program includes both water from the Bull Run watershed and water from the Columbia South Shore wellfield. In total, these systems supply water to a population of nearly 900,000 people and to businesses in the Portland area.
Goals This program supports the City goal of protecting and enhancing the natural and built environment, particularly with respect to providing safe drinking water. It also supports the City goal of promoting economic vitality and opportunity with respect to providing high quality public utility services.
Performance The Bull Run watershed provides 95% or more of the City's annual water supply under normal operating conditions.
Changes to Services and Activities
Included in the FY 2012-13 are projects to reduce the vulnerabilities in the Groundwater Pump Station as well as other projects to repair and upgrade groundwater infrastructure.
FTE & Financials Actual
FY 2009-10 Actual
FY 2010-11 Revised
FY 2011-12 ProposedFY 2012-13
AdoptedFY 2012-13
FTE 22.00 24.00 25.00 25.00 25.00
Expenditures
Bull Run Watershed 5,203,216 5,076,534 4,428,460 3,204,527 3,204,527
Groundwater 2,074,237 3,004,980 2,698,024 2,941,575 2,941,575
Total Expenditures 7,277,453 8,081,514 7,126,484 6,146,102 6,146,102
Performance Actual
FY 2009-10 Actual
FY 2010-11 Yr End Est.FY 2011-12
BaseFY 2012-13
TargetFY 2012-13
Effectiveness
Percent of city's water supply provided by Bull Run Watershed under normal operating conditions
95% 96% 95% 95% 95%

330 City of Portland, Oregon – FY 2012-13 Adopted Budget
Portland Water BureauPublic Utilities Service Area
Transmission & Terminal Storage Transmission & Terminal StorageDescription The Transmission & Terminal Storage program is for the conveyance of water from
the supply sources to the City, including the terminal storage reservoirs at Powell Butte, Mt. Tabor, and Washington Park.
Goals This program supports the City goal of protecting and enhancing the natural and built environment, particularly with respect to providing safe drinking water. It also supports the City goal of promoting economic vitality and opportunity with respect to providing high quality public utility services.
Performance There will be no simultaneous conduit and/or transmission main outages that cause disruption of service to customers except in the case of natural vulnerability events that occur less often than once every hundred years or planned maintenance shutdowns.
Changes to Services and Activities
The FY 2012-13 Adopted Budget includes funding only for the construction of the Powell Butte Reservoir 2 Reservoir.
FTE & Financials Actual
FY 2009-10 Actual
FY 2010-11 Revised
FY 2011-12 ProposedFY 2012-13
AdoptedFY 2012-13
Expenditures
Conduits/Transmission 14,914,183 3,795,480 1,073,012 959,306 959,306
Terminal Reservoirs 13,836,595 11,373,387 22,620,085 53,431,370 58,931,370
Total Expenditures 28,750,779 15,168,867 23,693,097 54,390,676 59,890,676

City of Portland, Oregon – FY 2012-13 Adopted Budget 331
Portland Water BureauPublic Utilities Service Area
Treatment TreatmentDescription The Treatment program provides for meeting or exceeding the federal and state
requirements for a public water system utilizing an unfiltered surface water source as well as a groundwater source. This program currently provides for the application of chlorine, ammonia, and sodium hydroxide, and associated regulatory and process control monitoring.
Goals This program supports the City goal of protecting and enhancing the natural and built environment, particularly with respect to providing safe drinking water. It also supports the City goal of promoting economic vitality and opportunity, especially providing high quality, affordable public utility services.
Performance The bureau's target is to have no violations of state and federal drinking water regulations.
Changes to Services and Activities
The FY 2012-13 budget funds only the design and construction of flow meters at Headworks which will improve the bureau's compliance with other drinking water rules related to chemical additions.
FTE & Financials Actual
FY 2009-10 Actual
FY 2010-11 Revised
FY 2011-12 ProposedFY 2012-13
AdoptedFY 2012-13
Expenditures
Water Program Treatment 2,012,211 11,973,337 7,932,567 2,683,294 2,683,294
Total Expenditures 2,012,211 11,973,337 7,932,567 2,683,294 2,683,294

332 City of Portland, Oregon – FY 2012-13 Adopted Budget
Portland Water BureauPublic Utilities Service Area
Performance Measures
Percent of Calls Answered Within 60 Seconds
The goal of the Call Center is to answer 80% of all calls within 60 seconds.
Per
cent
Number of Customer Accounts Paid Electronically
The bureau's goal is to receive 40% of all payments electronically.
Per
cent
Number of Violations of State or Federal Drinking Water Quality Standards
The bureau's goal is to have zero violations per year.
Cou
nt
455055606570758085
2008 2009 2010 2011 2012 2013
2830323436384042
2008 2009 2010 2011 2012 2013
0
0.2
0.4
0.6
0.8
1
2008 2009 2010 2011 2012 2013

City of Portland, Oregon – FY 2012-13 Adopted Budget 333
Summary of Bureau Budget Portland Water BureauPublic Utilities Service Area
Actual
FY 2009-10 Actual
FY 2010-11 Revised
FY 2011-12 ProposedFY 2012-13
AdoptedFY 2012-13
ResourcesExternal RevenuesCharges for Services 108,920,288 114,682,949 128,336,472 137,825,183 137,347,583
Intergovernmental 943,687 1,493,140 1,719,000 476,000 476,000
Bond & Note 75,794,252 86,534,273 161,251,000 189,350,000 214,085,000
Miscellaneous 5,243,892 5,014,862 5,700,015 5,306,269 5,326,532
Total External Revenues 190,902,119 207,725,224 297,006,487 332,957,452 357,235,115
Internal RevenuesFund Transfers - Revenue 108,075,658 125,289,058 188,007,868 209,600,120 209,811,953
Interagency Revenue 3,773,504 3,152,783 3,282,648 3,376,583 3,376,583
Total Internal Revenues 111,849,162 128,441,841 191,290,516 212,976,703 213,188,536
Beginning Fund Balance 90,648,096 114,021,135 147,367,467 88,621,718 88,621,718
Total Resources $393,399,377 $450,188,200 $635,664,470 $634,555,873 $659,045,369
RequirementsBureau ExpendituresPersonnel Services 56,808,483 56,469,860 61,346,688 65,137,509 64,698,075
External Materials and Services 27,546,803 18,169,478 21,603,430 26,665,683 26,361,683
Internal Materials and Services 18,727,460 18,528,964 21,475,750 20,130,835 20,130,835
Capital Outlay 24,252,846 32,534,321 53,480,220 111,692,606 111,692,606
Total Bureau Expenditures 127,335,592 125,702,623 157,906,088 223,626,633 222,883,199
Fund ExpendituresDebt Service 35,663,275 33,517,065 37,288,033 42,653,870 42,777,545
Contingency 0 0 125,943,382 83,841,322 84,277,115
Fund Transfers - Expense 116,379,375 133,633,583 197,836,543 214,811,812 214,915,487
Debt Service Reserves 0 0 31,318,751 32,662,390 34,597,390
Total Fund Expenditures 152,042,650 167,150,648 392,386,709 373,969,394 376,567,537
Ending Fund Balance 114,021,135 157,334,929 85,371,673 36,959,846 59,594,633
Total Requirements $393,399,377 $450,188,200 $635,664,470 $634,555,873 $659,045,369
ProgramsAdministration & Support 6,756,850 5,410,305 25,812,648 30,955,582 30,933,010
Customer Service 23,487,164 18,673,021 20,335,791 26,821,033 26,472,669
Distribution 51,385,398 54,024,183 54,193,277 72,399,127 66,526,629
Hydroelectric Power 532,564 556,523 692,954 703,328 703,328
Regulatory Compliance 7,133,173 11,814,873 18,119,270 29,527,491 29,527,491
Supply 7,277,453 8,081,514 7,126,484 6,146,102 6,146,102
Transmission & Terminal Storage 28,750,779 15,168,867 23,693,097 54,390,676 59,890,676
Treatment 2,012,211 11,973,337 7,932,567 2,683,294 2,683,294
Total Programs 127,335,592 $125,702,623 $157,906,088 $223,626,633 $222,883,199

334 City of Portland, Oregon – FY 2012-13 Adopted Budget
Portland Water Bureau CIP SummaryPublic Utilities Service Area
This table summarizes project expenses by capital programs.
Bureau Capital Program Revised Adopted Capital Plan
Project Prior Years FY 2011-12 FY 2012-13 FY 2013-14 FY 2014-15 FY 2015-16 FY 2016-17 5-Year Total
Customer Service Emergency Coordination Center 1,762,975 0 6,100,000 0 0 0 0 6,100,000
Security and Emergency Management
1,313,000 100,000 0 0 0 250,000 500,000 750,000
Total Customer Service 3,075,975 100,000 6,100,000 0 0 250,000 500,000 6,850,000
Distribution Carolina Pump Main Extension 117,407 0 0 0 0 200,000 4,800,000 5,000,000
Control Center SCADA Server Replacement
1,160,866 0 300,000 0 0 0 0 300,000
Distribution Mains 34,408,680 16,945,000 6,360,000 16,075,000 16,375,000 15,875,000 16,775,000 71,460,000
Field Support 10,002,134 6,622,000 4,050,000 3,810,000 3,547,000 3,410,000 3,500,000 18,317,000
Forest Park Low Tank 486,468 0 5,570,000 740,000 0 0 0 6,310,000
Fountains 403,065 150,000 180,000 150,000 150,000 150,000 150,000 780,000
Fulton Pump Station Improvements 931,579 0 1,270,000 6,200,000 2,350,000 0 0 9,820,000
Hydrants 2,196,555 980,000 1,100,000 900,000 900,000 900,000 900,000 4,700,000
Interstate Facility Rehabilitation 983,262 0 16,250,000 10,000,000 19,400,000 0 0 45,650,000
Meters 4,735,143 2,190,000 1,700,000 1,590,000 1,590,000 1,590,000 1,590,000 8,060,000
Portland Heights Pump Main 91,008 0 1,550,000 0 0 0 0 1,550,000
Portland Heights Pump Station Electrical Improvements
231,687 0 1,400,000 0 0 0 0 1,400,000
Portland to Milwaukie Light Rail 354,080 50,000 1,340,000 400,000 0 0 0 1,740,000
Pump Stations and Tanks 6,301,947 4,350,000 420,000 500,000 510,000 480,000 430,000 2,340,000
Services 11,687,018 3,500,000 3,900,000 3,500,000 3,500,000 3,500,000 3,500,000 17,900,000
Willamette River Pipe Crossing 111,062 0 200,000 0 2,600,000 5,000,000 20,000,000 27,800,000
Total Distribution 74,201,961 34,787,000 45,590,000 43,865,000 50,922,000 31,105,000 51,645,000 223,127,000
Regulatory Compliance Bull Run Dam 2 Tower 3,945,423 0 20,680,000 3,425,000 200,000 0 0 24,305,000
HCP Alder Creek Fish Passage 35,530 0 250,000 200,000 100,000 50,000 0 600,000
Water Quality and Regulatory Compliance
2,329,254 13,000,000 1,870,000 875,000 1,300,000 8,950,000 2,000,000 14,995,000
Total Regulatory Compliance 6,310,207 13,000,000 22,800,000 4,500,000 1,600,000 9,000,000 2,000,000 39,900,000
Supply Bull Run Watershed 22,493,744 1,500,000 250,000 0 2,250,000 2,500,000 2,750,000 7,750,000
Groundwater 1,865,991 820,000 740,000 300,000 300,000 820,000 820,000 2,980,000
Groundwater Electrical Supply Improvements
28,858 0 40,000 130,000 1,960,000 0 0 2,130,000
Total Supply 24,388,593 2,320,000 1,030,000 430,000 4,510,000 3,320,000 3,570,000 12,860,000
Support Planning 2,054,924 1,100,000 1,500,000 1,500,000 1,500,000 2,000,000 2,500,000 9,000,000
Total Support 2,054,924 1,100,000 1,500,000 1,500,000 1,500,000 2,000,000 2,500,000 9,000,000
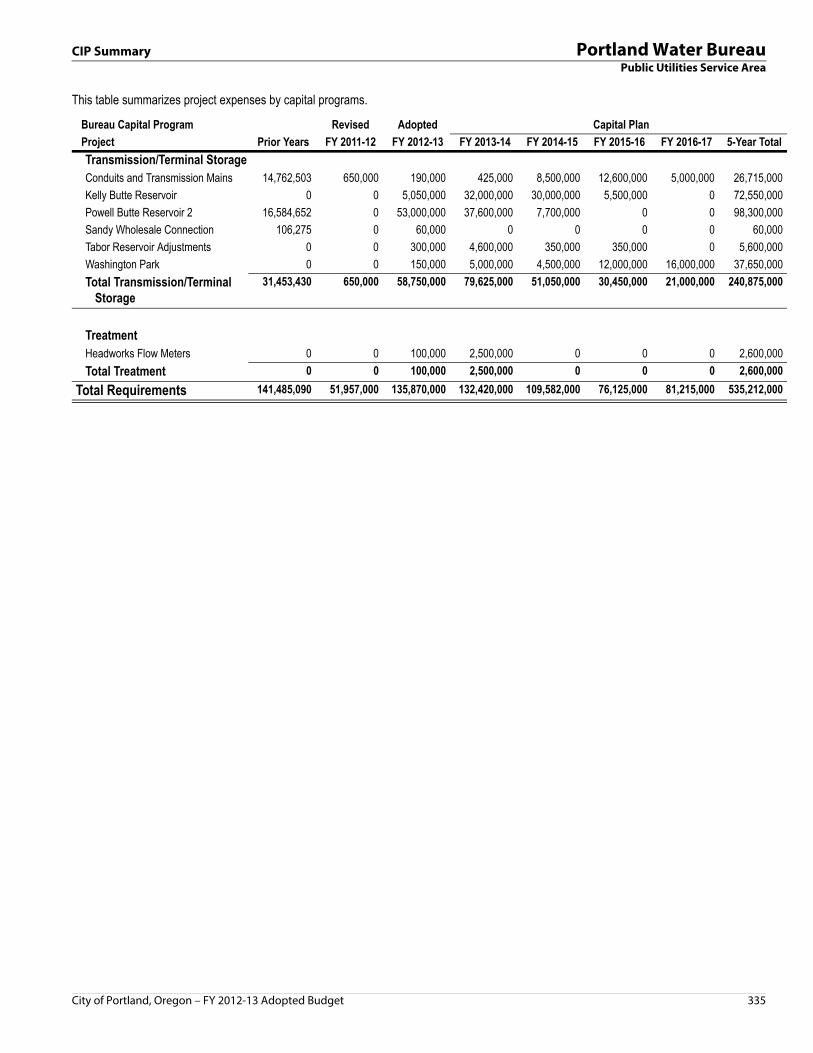
City of Portland, Oregon – FY 2012-13 Adopted Budget 335
CIP Summary Portland Water BureauPublic Utilities Service Area
Transmission/Terminal Storage Conduits and Transmission Mains 14,762,503 650,000 190,000 425,000 8,500,000 12,600,000 5,000,000 26,715,000
Kelly Butte Reservoir 0 0 5,050,000 32,000,000 30,000,000 5,500,000 0 72,550,000
Powell Butte Reservoir 2 16,584,652 0 53,000,000 37,600,000 7,700,000 0 0 98,300,000
Sandy Wholesale Connection 106,275 0 60,000 0 0 0 0 60,000
Tabor Reservoir Adjustments 0 0 300,000 4,600,000 350,000 350,000 0 5,600,000
Washington Park 0 0 150,000 5,000,000 4,500,000 12,000,000 16,000,000 37,650,000
Total Transmission/Terminal Storage
31,453,430 650,000 58,750,000 79,625,000 51,050,000 30,450,000 21,000,000 240,875,000
Treatment Headworks Flow Meters 0 0 100,000 2,500,000 0 0 0 2,600,000
Total Treatment 0 0 100,000 2,500,000 0 0 0 2,600,000
Total Requirements 141,485,090 51,957,000 135,870,000 132,420,000 109,582,000 76,125,000 81,215,000 535,212,000
This table summarizes project expenses by capital programs.
Bureau Capital Program Revised Adopted Capital Plan
Project Prior Years FY 2011-12 FY 2012-13 FY 2013-14 FY 2014-15 FY 2015-16 FY 2016-17 5-Year Total

336 City of Portland, Oregon – FY 2012-13 Adopted Budget
Portland Water Bureau FTE SummaryPublic Utilities Service Area
Salary Range Revised
FY 2011-12 ProposedFY 2012-13
AdoptedFY 2012-13
Class Title Minimum Maximum No. Amount No. Amount No. Amount30000062 Accountant I 38,064 53,123 1.00 53,124 1.00 53,124 1.00 53,124
30000063 Accountant II 49,754 60,798 3.00 171,360 3.00 176,272 3.00 176,272
30000064 Accountant III 54,787 66,893 1.00 66,888 1.00 66,888 1.00 66,888
30000434 Administrative Assistant 45,074 69,451 7.00 467,181 7.00 473,692 7.00 473,692
30000433 Administrative Specialist, Sr 41,974 64,626 4.00 196,378 4.00 201,506 4.00 201,506
30000436 Administrative Supervisor I 54,725 72,925 3.00 210,548 3.00 213,200 3.00 213,200
30000437 Administrative Supervisor II 57,450 76,586 1.00 76,584 1.00 76,584 1.00 76,584
30000203 Applications Analyst II-Generalist 57,450 76,586 1.00 69,152 1.00 71,993 1.00 71,993
30000204 Applications Analyst III-Generalist 63,378 84,635 2.00 169,272 2.00 169,272 2.00 169,272
30000207 Applications Analyst IV-Generalist 66,602 89,107 3.00 225,096 2.25 180,844 2.25 180,844
30000102 Automotive Equip Oper II: Sewer Vacuum 43,347 52,208 1.00 52,212 1.00 52,212 1.00 52,212
30000104 Automotive Equip Oper II: Tractor-Trailr 43,347 52,208 1.00 52,212 1.00 52,212 1.00 52,212
30000101 Automotive Equipment Oper I 40,830 49,483 10.00 494,880 10.00 494,880 10.00 494,880
30001583 Bus Driver 43,347 52,208 1.00 43,344 1.00 43,344 1.00 43,344
30000441 Business Operations Manager 75,109 100,048 1.00 96,711 1.00 100,044 1.00 100,044
30000442 Business Operations Manager, Sr 93,288 130,291 1.00 130,296 1.00 130,296 1.00 130,296
30000440 Business Operations Supervisor 66,602 89,107 1.00 89,112 1.00 89,112 1.00 89,112
30000449 Business Systems Analyst, Sr 63,378 84,635 3.00 245,544 3.00 247,893 3.00 247,893
30000331 CAD Analyst 61,568 78,645 1.00 78,648 1.00 78,648 1.00 78,648
30000328 CAD Technician I 37,835 50,690 1.00 50,688 1.00 50,688 1.00 50,688
30000329 CAD Technician II 50,690 64,667 5.00 323,340 5.00 323,340 5.00 323,340
30000330 CAD Technician III 61,568 78,645 1.00 67,956 1.00 70,172 1.00 70,172
30000454 Capital Improvmnt Program Planning Supvr 75,109 100,048 1.00 100,044 1.00 100,044 1.00 100,044
30000399 Capital Project Manager I 61,568 78,645 2.00 157,296 2.00 157,296 2.00 157,296
30000686 Capital Project Manager II 66,602 89,107 2.00 155,712 2.00 155,712 2.00 155,712
30000687 Capital Project Manager III 69,826 93,829 2.00 187,656 2.00 187,656 2.00 187,656
30000110 Carpenter 51,438 55,890 2.00 111,792 2.00 111,792 2.00 111,792
30000493 Community Outreach & Informtn Rep, Sr 60,341 80,475 2.00 156,780 2.00 158,600 2.00 158,600
30000107 Concrete Finisher 51,438 55,890 3.00 167,688 3.00 167,688 3.00 167,688
30000507 Conservation Program Coordinator, Sr 63,378 84,635 1.00 68,664 1.00 71,014 1.00 71,014
30000105 Construction Equipment Operator 43,472 55,515 17.00 943,704 17.00 943,704 17.00 943,704
30000455 Contracts Dev & Review Administrator 66,602 89,107 1.00 88,993 1.00 89,112 1.00 89,112
30000017 Customer Accounts Specialist I 33,800 47,320 46.00 2,068,440 46.00 2,068,440 44.00 2,000,832
30000018 Customer Accounts Specialist II 40,310 51,896 10.00 502,576 10.00 505,232 10.00 505,232
30000445 Customer Service Supervisor 63,378 84,635 7.00 551,100 7.00 559,159 7.00 559,159
30000732 Development Supervisor I 63,378 84,635 1.00 84,636 1.00 84,636 1.00 84,636
30000577 Economist, Principal 75,109 100,048 1.00 100,044 1.00 100,044 1.00 100,044
30000635 Electrical/Instrumentation Supervisor 69,826 93,829 1.00 93,828 1.00 93,828 1.00 93,828
30000116 Electrician 64,376 69,493 6.00 406,728 6.00 411,840 6.00 411,840
30000120 Electrician/Instrument Tech, Apprentice 42,952 69,493 1.00 69,492 1.00 69,492 1.00 69,492
30000685 Engineer, Chief - Water Bureau 102,648 146,952 1.00 146,952 1.00 146,952 1.00 146,952
30000682 Engineer, Principal 93,787 125,070 7.00 858,036 7.00 862,448 7.00 862,448
30000680 Engineer, Sr 81,182 108,243 16.00 1,675,781 16.00 1,701,292 16.00 1,701,292
30000681 Engineer, Supervising 87,277 116,355 5.00 561,962 5.00 572,556 5.00 572,556
30000364 Engineer-Chemical/Environmental 80,954 98,384 1.00 91,087 1.00 95,644 1.00 95,644
30000365 Engineer-Civil 80,954 98,384 15.00 1,441,304 15.00 1,453,288 15.00 1,453,288
30000366 Engineer-Electrical 80,954 98,384 1.00 98,388 1.00 98,388 1.00 98,388
30000358 Engineering Associate, Sr-Civil 69,992 89,232 16.00 1,363,878 16.00 1,386,336 16.00 1,386,336
30000353 Engineering Associate-Civil 57,533 77,106 6.00 379,228 6.00 390,176 6.00 390,176
30000355 Engineering Associate-Mechanical 57,533 77,106 1.00 74,042 1.00 77,112 1.00 77,112

City of Portland, Oregon – FY 2012-13 Adopted Budget 337
FTE Summary Portland Water BureauPublic Utilities Service Area
30000696 Engineering Survey Manager 69,826 93,829 1.00 47,560 1.00 49,508 1.00 49,508
30000325 Engineering Technician II 50,690 64,667 10.00 617,532 10.00 625,038 10.00 625,038
30000326 Engineering Technician III 61,568 78,645 2.00 157,296 2.00 157,296 2.00 157,296
30000662 Environmental Program Coordinator 60,341 80,475 1.00 78,449 1.00 80,472 1.00 80,472
30000663 Environmental Program Manager 66,602 89,107 0.00 0 1.00 89,112 1.00 89,112
30000664 Environmental Program Manager, Sr 75,109 100,048 1.00 100,044 1.00 100,044 1.00 100,044
30000661 Environmental Program Specialist 54,725 72,925 2.00 118,968 3.00 193,425 3.00 193,425
30000339 Environmental Specialist 61,568 78,645 6.00 443,720 7.00 532,067 7.00 532,067
30000338 Environmental Technician II 50,690 64,667 0.00 0 2.00 129,336 2.00 129,336
30000712 Facilities Services Specialist 54,725 72,925 1.00 54,720 1.00 54,720 1.00 54,720
30000567 Financial Analyst 57,450 76,586 2.00 126,264 2.00 130,520 2.00 130,520
30000566 Financial Analyst, Assistant 45,074 69,451 1.00 69,456 1.00 69,456 1.00 69,456
30000569 Financial Analyst, Principal 75,109 100,048 4.00 400,176 4.00 400,176 4.00 400,176
30000568 Financial Analyst, Sr 63,378 84,635 1.00 74,764 1.00 77,832 1.00 77,832
30000127 General Mechanic 46,696 56,472 2.00 112,944 2.00 112,944 2.00 112,944
30000341 GIS Technician I 37,835 50,690 1.00 50,688 1.00 50,688 1.00 50,688
30000342 GIS Technician II 50,690 64,667 6.00 366,739 6.00 375,114 6.00 375,114
30000343 GIS Technician III 61,568 78,645 2.00 146,604 2.00 148,820 2.00 148,820
30000373 Graphics Designer III 61,568 78,645 1.00 78,648 1.00 78,648 1.00 78,648
30000252 Horticulturist 43,950 53,102 1.00 53,100 1.00 53,100 1.00 53,100
30000657 Hydroelectric Power Project Manager 75,109 100,048 1.00 100,044 1.00 100,044 1.00 100,044
30000658 Hydroelectric Power Project Mgr, Asst 66,602 89,107 1.00 81,408 1.00 83,910 1.00 83,910
30000114 Industrial Painter 51,438 55,890 3.00 163,236 3.00 163,236 3.00 163,236
30000115 Industrial Painter, Lead 53,976 58,677 1.00 58,680 1.00 58,680 1.00 58,680
30000603 Inf Syst Analyst IV(Supvr)-Gen 66,602 89,107 1.00 89,112 1.00 89,112 1.00 89,112
30000218 Inf Syst Analyst, Principal-Gen 75,109 100,048 1.00 90,048 1.00 93,425 1.00 93,425
30000607 Inf Syst Mgr-Generalist 80,787 107,557 1.00 80,784 1.00 80,784 1.00 80,784
30000239 Instrument Technician 64,376 69,493 7.00 476,220 7.00 484,314 7.00 484,314
30001408 Instrumentation & Security Systems Supvr 63,378 84,635 1.00 84,636 1.00 84,636 1.00 84,636
30001283 Laboratory Analyst II 45,760 60,382 4.00 235,920 4.00 238,450 4.00 238,450
30001284 Laboratory Analytical Specialist 52,166 69,264 2.00 121,428 2.00 127,066 2.00 127,066
30001285 Laboratory Coordinator 54,142 76,398 1.00 54,144 1.00 54,144 1.00 54,144
30000670 Laboratory Manager 75,109 100,048 1.00 100,044 1.00 100,044 1.00 100,044
30000644 Maintenance Planner/Scheduler 54,725 72,925 4.00 275,220 4.00 280,516 4.00 280,516
30000073 Maintenance Worker 23,691 28,080 2.00 56,160 2.00 56,160 2.00 56,160
30000451 Management Analyst 57,450 76,586 2.00 136,597 2.00 139,064 2.00 139,064
30000453 Management Analyst, Principal 75,109 100,048 3.00 300,132 3.00 300,132 3.00 300,132
30000452 Management Analyst, Sr 63,378 84,635 2.00 162,252 2.00 164,107 2.00 164,107
30000450 Management Assistant 45,074 69,451 6.00 322,232 6.00 332,478 6.00 332,478
30000693 Mapping & GIS Supervisor 69,826 93,829 1.00 87,642 1.00 91,236 1.00 91,236
30000978 Mapping Data Technician II 61,568 78,645 1.00 74,940 1.00 78,030 1.00 78,030
30000653 Mechanical Systems Supervisor-Water,Sr 69,826 93,829 1.00 93,828 1.00 93,828 1.00 93,828
30000012 Office Support Specialist II 31,512 43,950 6.00 251,280 6.00 251,280 6.00 251,280
30000013 Office Support Specialist III 40,310 51,896 3.00 144,987 3.00 149,469 3.00 149,469
30000152 Operating Engineer I 46,779 48,984 4.00 189,312 4.00 193,360 4.00 193,360
30000154 Operating Engineer III 49,566 64,064 13.00 832,884 13.00 832,884 13.00 832,884
30000759 Parks Maintenance Supervisor 57,450 76,586 1.00 65,232 1.00 67,912 1.00 67,912
30000081 Parks Technician 42,557 48,381 6.00 284,472 6.00 284,472 5.00 241,920
30000398 Planner, Sr City-Water Resources 61,568 78,645 1.00 78,648 1.00 78,648 1.00 78,648
30000464 Program Coordinator 60,341 80,475 4.00 282,816 4.00 290,167 4.00 290,167
Salary Range Revised
FY 2011-12 ProposedFY 2012-13
AdoptedFY 2012-13
Class Title Minimum Maximum No. Amount No. Amount No. Amount

338 City of Portland, Oregon – FY 2012-13 Adopted Budget
Portland Water Bureau FTE SummaryPublic Utilities Service Area
30000465 Program Manager 63,378 84,635 2.00 160,812 2.00 163,412 2.00 163,412
30000466 Program Manager, Sr 75,109 100,048 4.00 398,664 4.00 400,050 4.00 400,050
30000463 Program Specialist 54,725 72,925 1.00 72,924 1.00 72,924 1.00 72,924
30000462 Program Specialist, Assistant 45,074 69,451 3.00 166,290 3.00 171,099 3.00 171,099
30000698 Property Acquisition & Services Manager 63,378 84,635 1.00 84,636 1.00 84,636 1.00 84,636
30000495 Public Information Officer 63,378 84,635 1.00 66,690 1.00 69,426 1.00 69,426
30000691 Public Works Inspection Manager 66,602 89,107 1.00 89,112 1.00 89,112 1.00 89,112
30000228 Public Works Inspector 56,888 65,000 6.00 390,024 6.00 390,024 6.00 390,024
30000229 Public Works Inspector, Sr 61,693 72,696 3.00 218,088 3.00 218,088 3.00 218,088
30000630 Public Works Supervisor II 57,450 76,586 9.00 653,354 9.00 667,001 9.00 667,001
30000403 Remittance Technician 33,800 47,320 2.00 94,632 1.00 45,516 1.00 45,516
30000350 Right of Way Agent III 61,568 78,645 1.00 75,867 1.00 78,648 1.00 78,648
30000481 Risk Specialist 54,725 72,925 1.00 69,168 1.00 71,056 1.00 71,056
30000486 Safety & Risk Officer II 69,826 93,829 1.00 90,392 1.00 93,065 1.00 93,065
30000488 Security Program Manager 66,602 89,107 1.00 89,112 1.00 89,112 1.00 89,112
30000645 Security Supervisor 57,450 76,586 2.00 141,314 2.00 146,890 2.00 146,890
30000029 Service Dispatcher 33,800 47,320 2.00 94,632 2.00 94,632 2.00 94,632
30000054 Storekeeper/Acquisition Specialist II 43,139 52,728 3.00 155,064 3.00 158,184 3.00 158,184
30000056 Storekeeper/Acquisition Specialist III 48,714 60,570 1.00 60,576 1.00 60,576 1.00 60,576
30000468 Stores System Supervisor II 57,450 76,586 1.00 76,584 1.00 76,584 1.00 76,584
30000224 Surveying Aide II 41,974 46,530 2.00 88,512 2.00 91,470 2.00 91,470
30000695 Surveying Supvr/Water Rights Examiner 66,602 89,107 1.00 88,464 1.00 89,112 1.00 89,112
30000225 Surveyor I 47,944 59,592 2.00 119,184 2.00 119,184 2.00 119,184
30000226 Surveyor II 55,682 63,794 1.00 63,792 1.00 63,792 1.00 63,792
30001558 Timekeeping Specialist 33,862 47,258 3.00 114,984 3.00 119,718 3.00 119,718
30000531 Training & Development Analyst 57,450 76,586 2.00 137,037 1.00 60,967 1.00 60,967
30000532 Training & Development Officer 63,378 84,635 1.00 63,372 1.00 65,542 1.00 65,542
30001037 Utility Locator 47,112 50,690 6.00 302,768 6.00 304,128 6.00 304,128
30000076 Utility Worker I 40,290 43,826 6.00 262,944 6.00 262,944 6.00 262,944
30000077 Utility Worker II 43,826 47,112 37.00 1,743,144 37.00 1,743,144 37.00 1,743,144
30000075 Utility Worker II, Apprentice 32,989 43,576 17.00 560,796 17.00 560,796 12.00 395,856
30000438 Water Administrative Manager 69,826 93,829 1.00 93,828 1.00 93,828 1.00 93,828
30001534 Water Bureau Emergency Management Mgr 66,602 89,107 1.00 80,660 1.00 83,970 1.00 83,970
30000512 Water Conservation Program Coordinator 60,341 80,475 2.00 148,254 2.00 151,032 2.00 151,032
30000514 Water Conservation Program Manager 66,602 89,107 1.00 89,112 1.00 89,112 1.00 89,112
30000646 Water Consortium Conservation Pg Mgr 63,378 84,635 1.00 84,636 1.00 84,636 1.00 84,636
30000655 Water Group Manager 93,288 130,291 4.00 520,008 4.00 521,184 4.00 521,184
30000652 Water Maintenance Supervisor, Sr 69,826 93,829 3.00 278,484 3.00 281,234 3.00 281,234
30000133 Water Meter Reader I 36,171 44,595 12.00 508,620 12.00 522,648 12.00 522,648
30000134 Water Meter Reader II 44,325 50,482 1.00 44,328 1.00 44,328 1.00 44,328
30000142 Water Meter Technician I 42,328 51,210 4.00 204,864 4.00 204,864 4.00 204,864
30000143 Water Meter Technician II 53,976 58,677 6.00 352,080 6.00 352,080 6.00 352,080
30000654 Water Operations & Support Manager 86,840 117,686 1.00 112,764 1.00 116,614 1.00 116,614
30000145 Water Operations Mechanic 52,042 58,448 27.00 1,571,228 27.00 1,571,796 27.00 1,571,796
30000144 Water Operations Mechanic, Apprentice 40,310 54,725 10.00 499,909 10.00 518,859 10.00 518,859
30000651 Water Quality Inspection Supervisor 60,341 80,475 1.00 80,472 1.00 80,472 1.00 80,472
30000140 Water Quality Inspector II 49,566 64,064 6.00 384,408 6.00 384,408 6.00 384,408
30000141 Water Quality Inspector III 52,042 67,226 1.00 67,224 1.00 67,224 1.00 67,224
30001034 Water Quality Manager 86,840 117,686 1.00 107,016 1.00 110,310 1.00 110,310
30000647 Water Resource & Urban Affairs Coord 63,378 84,635 1.00 84,636 1.00 84,636 1.00 84,636
Salary Range Revised
FY 2011-12 ProposedFY 2012-13
AdoptedFY 2012-13
Class Title Minimum Maximum No. Amount No. Amount No. Amount

City of Portland, Oregon – FY 2012-13 Adopted Budget 339
FTE Summary Portland Water BureauPublic Utilities Service Area
30000648 Water Resources Planning Manager 86,840 117,686 1.00 122,160 1.00 122,160 1.00 122,160
30000656 Water Resources Program Manager 66,602 89,107 2.00 182,676 2.00 182,676 2.00 182,676
30000138 Water Security Specialist 43,826 47,112 19.00 883,757 19.00 892,114 19.00 892,114
30000135 Water Service Inspector I 44,325 50,482 8.00 391,560 8.00 393,480 8.00 393,480
30000136 Water Service Inspector II 47,902 54,517 1.00 47,904 1.00 47,904 1.00 47,904
30000650 Water Treatment Operations Supervisor 69,826 93,829 1.00 93,828 1.00 93,828 1.00 93,828
30000147 Water Treatment Operator II 49,566 64,064 10.00 617,528 10.00 628,909 10.00 628,909
30000424 Water Utility Director 129,834 186,056 1.00 186,060 1.00 186,060 1.00 186,060
30000078 Water Utility Worker, Sr 44,512 49,483 1.00 49,488 1.00 49,488 1.00 49,488
30001081 Watershed & Conduit Supvr 69,826 93,829 1.00 91,020 1.00 93,828 1.00 93,828
30000149 Watershed Specialist I 38,438 47,112 4.00 179,772 4.00 179,772 4.00 179,772
30000151 Watershed Specialist II 44,512 49,483 2.00 98,976 2.00 98,976 2.00 98,976
30001308 Watershed Specialist III 53,082 59,509 2.00 119,016 2.00 119,016 2.00 119,016
TOTAL FULL-TIME POSITIONS 619.00 39,777,575 621.25 40,357,879 613.25 40,082,779
30000433 Administrative Specialist, Sr 41,974 64,626 0.85 39,060 0.85 40,664 0.85 40,664
30000017 Customer Accounts Specialist I 33,800 47,320 1.50 73,668 1.50 73,668 1.50 73,668
30000365 Engineer-Civil 80,954 98,384 0.50 51,060 0.50 51,060 0.50 51,060
30000451 Management Analyst 57,450 76,586 0.75 45,246 0.75 47,100 0.75 47,100
TOTAL PART-TIME POSITIONS 3.60 209,034 3.60 212,492 3.60 212,492
30000110 Carpenter 51,438 55,890 1.00 55,896 0.00 0 0.00 0
30000017 Customer Accounts Specialist I 33,800 47,320 1.20 56,784 1.20 56,784 1.20 56,784
30000324 Engineering Technician I 37,835 50,690 1.00 50,688 0.00 0 0.00 0
30000661 Environmental Program Specialist 54,725 72,925 1.00 54,732 0.00 0 0.00 0
30000453 Management Analyst, Principal 75,109 100,048 1.00 100,044 1.00 100,044 1.00 100,044
30001159 Plumber 56,888 61,838 1.00 61,836 0.00 0 0.00 0
30000463 Program Specialist 54,725 72,925 1.00 54,720 0.00 0 0.00 0
30000462 Program Specialist, Assistant 45,074 69,451 1.00 64,841 0.00 0 0.00 0
TOTAL LIMITED TERM POSITIONS 8.20 499,541 2.20 156,828 2.20 156,828
GRAND TOTAL 630.80 40,486,150 627.05 40,727,199 619.05 40,452,099
Salary Range Revised
FY 2011-12 ProposedFY 2012-13
AdoptedFY 2012-13
Class Title Minimum Maximum No. Amount No. Amount No. Amount

340 City of Portland, Oregon – FY 2012-13 Adopted Budget
Portland Water Bureau Budget DecisionsPublic Utilities Service Area
This chart shows decisions and adjustments made during the budget process. The chart begins with an estimate of the bureau's Current Appropriations Level (CAL) requirements.
Amount
Action Ongoing One-Time Total Package FTE Decision
FY 2012-13 222,063,506 0 222,063,506 624.05 FY 2012-13 Current Appropriation Level (includes Hydroelectric Power)
CAL Adjustments
0 0 0 0.00 None
Mayor's Proposed Budget Decisions
1,900,000 0 1,900,000 5.00 Water - LT2 variance monitoring
175,000 0 175,000 0.00 Water - ebill monthly statement marketing
210,965 0 210,965 0.00 Water - HR/Class and Comp Adjustments
83,989 0 83,989 0.00 Water - Technical Adjustments
(489,982) 0 (489,982) 0.00 Water - OMF interagency adjustments
(3,376) 0 (3,376) 0.00 Hydro - OMF interagency adjustments
(134,805) 0 (134,805) 0.00 Water - Non-represented merit freeze
(178,664) 0 (178,664) (2.00) Water - Two FTE reduction in Customer Services
Approved Budget Additions and Reductions
0 0 0 0.00 None
Adopted Budget Additions and Reductions
(439,434) 0 (439,434) (8.00) Eliminate 8 vacancies
(105,000) 0 (105,000) 0.00 Move Loos to BES
(175,000) 0 (175,000) 0.00 Eliminate ebill monthly statement marketing
(24,000) 0 (24,000) 0.00 Reduction in Utility License Fee
819,693 0 819,693 (5.00) Total FY 2012-13 Decision Packages
222,883,199 619.05 Total Adopted Budget