publication--diabetes in culturally and linguistically
TRANSCRIPT
Diabetes in culturally and
linguistically diverse
Australians
Identification of communities at high risk
Anne Marie Thow and
Anne-Marie Waters
October 2005
Australian Institute of Health and Welfare Canberra
AIHW cat. no. CVD 30
© Australian Institute of Health and Welfare 2005 This work is copyright. Apart from any use as permitted under the Copyright Act 1968, no part may be reproduced without prior written permission from the Australian Institute of Health and Welfare. Requests and enquiries concerning reproduction and rights should be directed to the Head, Business Promotion and Media Unit, Australian Institute of Health and Welfare, GPO Box 570, Canberra ACT 2601. A complete list of the Institute’s publications is available from the Business Promotion and Media Unit, Australian Institute of Health and Welfare, GPO Box 570, Canberra ACT 2601, or via the Institute’s website <http://www.aihw.gov.au>. ISBN 1 74024 504 0
Suggested citation
AIHW: Thow, AM & Waters A-M 2005. Diabetes in culturally and linguistically diverse Australians: identification of communities at high risk. AIHW cat. no. CVD 30. Canberra: Australian Institute of Health and Welfare.
Australian Institute of Health and Welfare
Board Chair Hon. Peter Collins, QC, AM Director Dr Richard Madden Any enquiries about or comments on this publication should be directed to: Cardiovascular Disease and Diabetes Unit Australian Institute of Health and Welfare GPO Box 570 Canberra ACT 2601 Phone: (02) 6244 1000 Published by Australian Institute of Health and Welfare Printed by Pirion Pty Limited
iii
Contents Contents ........................................................................................................................................ iii
List of tables................................................................................................................................... v
List of figures............................................................................................................................... vii
Acknowledgments.....................................................................................................................viii
Abbreviations ............................................................................................................................... ix
Summary.........................................................................................................................................x
1 Introduction.................................................................................................................................1 Project description .................................................................................................................1 Scope ........................................................................................................................................2
2 Diabetes in culturally and linguistically diverse Australians ..............................................3 Overview.................................................................................................................................3
Diabetes in specific groups...........................................................................................................8
Risk factors for diabetes..............................................................................................................14 Complications of diabetes...................................................................................................18 The impact of religious and cultural factors on diabetes risk and care........................20
3 Demographic characteristics of culturally and linguistically diverse groups at high risk for diabetes ....................................................................................................................21 Scope ......................................................................................................................................21 Languages other than English spoken at home...............................................................21 Proficiency in spoken English ............................................................................................21 Where do high-risk CALD groups live in Australia? .....................................................23
4 Gaps and recommendations....................................................................................................28 Gaps in data/literature .......................................................................................................28 Recommendations................................................................................................................29
Appendix A: Data sources..........................................................................................................31 Australian Bureau of Statistics 1995 and 2001 National Health Surveys.....................31 Australian Bureau of Statistics 2001 Census of Population and Housing ...................31 Australian Diabetes, Obesity and Lifestyle Study (AusDiab Study)............................31 National Diabetes Register .................................................................................................31 National Mortality Database ..............................................................................................32 National Hospital Morbidity Database.............................................................................32
Appendix B: Methods .................................................................................................................33
iv
Age-standardised rates .......................................................................................................33 Direct age standardisation ..................................................................................................33 Indirect age standardisation ...............................................................................................33 Geographical regions...........................................................................................................34
Appendix C: Statistical tables ....................................................................................................35 Summary of demographic data with epidemiological information presented in
this report.........................................................................................................................41 Location of other language groups....................................................................................46
Glossary.........................................................................................................................................54
References .....................................................................................................................................56
v
List of tables Table S1: Regions of birth with the highest rate ratios for specific measures relevant to
diabetes...............................................................................................................................x Table 1: Diabetes prevalence, incidence, hospitalisation and deaths, age-standardised
rate ratios by region of birth, people aged 20 years and over ...................................4 Table 2: Standardised prevalence ratios for self-reported diabetes by country of birth,
people aged 20 years and over, 2001..............................................................................5 Table 3: Standardised prevalence ratios for self-reported diabetes by main language
spoken at home, people aged 20 years and over, 2001................................................6 Table 4: NDSS registrants by country of birth(a), Australia and top 20 overseas countries
of birth ................................................................................................................................7 Table 5: Prevalence of overweight and physical inactivity by region of birth, people
aged 18 years and over, 2001.........................................................................................15 Table 6: Standardised separation ratios(a) for diabetes-related lower limb amputations
by region of birth, people aged 25 years and over, 1995–2004 .................................19 Table 7: Language groups with more than 10% of people speaking English ‘not well’ or
‘not at all’..........................................................................................................................22 Table 8: Languages spoken at home and place of residence: Southern and South Eastern
European languages .......................................................................................................23 Table 9: Languages spoken at home and place of residence: Middle Eastern and North
African languages ...........................................................................................................24 Table 10: Languages spoken at home and place of residence: Southern Asian languages...25 Table 11: Languages spoken at home and place of residence: South-East Asian
languages .........................................................................................................................26 Table 12: Languages spoken at home and place of residence: South Pacific languages .......27 Table A1: Standardised prevalence ratios for self-reported diabetes by region of birth and
sex, people aged 20 years and over, 2001 ....................................................................35 Table A2: Standardised prevalence ratios for self-reported diabetes by region of birth and
sex, people aged 20 years and over, 1995 ....................................................................35 Table A3: Standardised prevalence ratios for measured diabetes, persons by birthplace,
1999–2000 .........................................................................................................................36 Table A4: National Diabetes Register, registrants aged 15 years and over at diagnosis by
region of birth and sex, 1999–2001................................................................................36 Table A5: Age-standardised rate of diabetes-related hospital separations (1999–00) and
diabetes-related mortality (1997–2000) by region of birth, people aged 20 years and over............................................................................................................................37
Table A6: Overseas-born population: top 12 birthplace groups 1976 to 2001..........................38 Table A7: Median age of Australian residents by countries of birth at selected censuses.....39 Table A8: Southern and South-Eastern Europe—summary of demographic information....41
vi
Table A9: Northern and Western European—summary of demographic information .........41 Table A10: Eastern Europe and Central Asia—summary of demographic information..........42 Table A11: Middle East and North Africa—summary of demographic information...............42 Table A12: Southern Asia—summary of demographic information ..........................................43 Table A13: North Asia—summary of demographic information................................................43 Table A14: South-East Asia—summary of demographic information .......................................44 Table A15: South Pacific—summary of epidemiological and demographic information .......44 Table A16: South America—summary of demographic information .........................................45 Table A17: Other Africa—summary of epidemiological and demographic information ........45 Table A18: Languages spoken at home and place of residence: North and West European
languages .........................................................................................................................46 Table A19: Languages spoken at home and place of residence: Southern European
languages .........................................................................................................................47 Table A20: Languages spoken at home and place of residence: Eastern European and
Central Asian languages ................................................................................................49 Table A21: Languages spoken at home and place of residence: North-East Asian
languages .........................................................................................................................50 Table A22: Languages spoken at home and place of residence: South-East Asian
languages .........................................................................................................................52 Table A23: Languages spoken at home and place of residence: Middle Eastern and North
African languages ...........................................................................................................53 Table A24: Languages spoken at home and place of residence: South American
languages .........................................................................................................................53
vii
List of figures Figure 1: Prevalence of diabetes in people aged 20–79 years by selected region of
residence, 2003...................................................................................................................8 Figure 2: Age distribution of overseas-born Australians from non-English-speaking
countries, 2001 .................................................................................................................17
viii
Acknowledgments This report was prepared by Anne Marie Thow and Anne-Marie Waters of the National Centre for Monitoring Diabetes at the Australian Institute of Health and Welfare (AIHW). Valuable comments and assistance were received from the Project Steering Committee—Janine Bevan, Gladys Hitchen, Bridget Hsu-Hage, Sandra Kipp and Joseph de Riva O’Phelan—as well as from Lynelle Moon, Kathleen O’Brien and Peter White. Thanks also to Ian Titulaer for his assistance with analysis of the National Hospital Morbidity Database. The AIHW gratefully acknowledge the funding provided by the Australian Government under the National Diabetes Services Scheme (NDSS). The NDSS is an initiative of the Australian Government administered by Diabetes Australia Ltd.
ix
Abbreviations ABS Australian Bureau of Statistics ACT Australian Capital Territory AIHW Australian Institute of Health and Welfare ASR age-standardised rate AusDiab Australian Diabetes, Obesity and Lifestyle Study CALD culturally and linguistically diverse CI confidence interval FECCA Federation of Ethnic Communities’ Councils of Australia GDM gestational diabetes mellitus ICD–9–CM International Classification of Diseases, 9th Revision,
Clinical Modification ICD–10–AM International Statistical Classification of Diseases and Related
Health Problems, 10th Revision, Australian Modification NDSS National Diabetes Services Scheme NHS National Health Survey NSW New South Wales NT Northern Territory Qld Queensland SA South Australia SERCIS Social Environmental Risk Context Information System SPR standardised prevalence ratio Tas Tasmania UK United Kingdom Vic Victoria WA Western Australia WHO World Health Organization
x
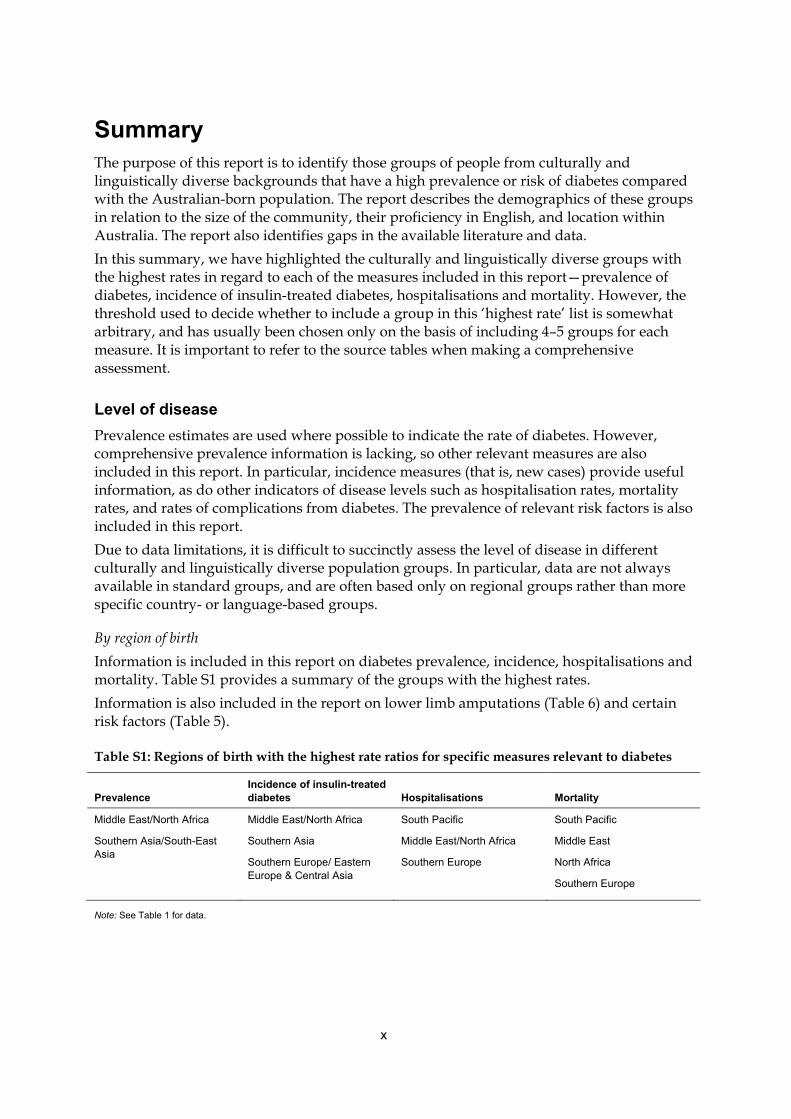
Summary The purpose of this report is to identify those groups of people from culturally and linguistically diverse backgrounds that have a high prevalence or risk of diabetes compared with the Australian-born population. The report describes the demographics of these groups in relation to the size of the community, their proficiency in English, and location within Australia. The report also identifies gaps in the available literature and data. In this summary, we have highlighted the culturally and linguistically diverse groups with the highest rates in regard to each of the measures included in this report—prevalence of diabetes, incidence of insulin-treated diabetes, hospitalisations and mortality. However, the threshold used to decide whether to include a group in this ‘highest rate’ list is somewhat arbitrary, and has usually been chosen only on the basis of including 4–5 groups for each measure. It is important to refer to the source tables when making a comprehensive assessment.
Level of disease Prevalence estimates are used where possible to indicate the rate of diabetes. However, comprehensive prevalence information is lacking, so other relevant measures are also included in this report. In particular, incidence measures (that is, new cases) provide useful information, as do other indicators of disease levels such as hospitalisation rates, mortality rates, and rates of complications from diabetes. The prevalence of relevant risk factors is also included in this report. Due to data limitations, it is difficult to succinctly assess the level of disease in different culturally and linguistically diverse population groups. In particular, data are not always available in standard groups, and are often based only on regional groups rather than more specific country- or language-based groups.
By region of birth Information is included in this report on diabetes prevalence, incidence, hospitalisations and mortality. Table S1 provides a summary of the groups with the highest rates. Information is also included in the report on lower limb amputations (Table 6) and certain risk factors (Table 5).
Table S1: Regions of birth with the highest rate ratios for specific measures relevant to diabetes
Prevalence Incidence of insulin-treated diabetes Hospitalisations Mortality
Middle East/North Africa
Southern Asia/South-East Asia
Middle East/North Africa
Southern Asia
Southern Europe/ Eastern Europe & Central Asia
South Pacific
Middle East/North Africa
Southern Europe
South Pacific
Middle East
North Africa
Southern Europe
Note: See Table 1 for data.
xi
By country of birth Prevalence based on country of birth is included, however these data need to be used with caution as the estimates have high relative standard errors associated with them. The non-English-speaking countries with the highest standardised prevalence ratios were Singapore, Egypt, Lebanon, South Africa and Sri Lanka (Table 2). Table 4 presents the number of people registered with the National Diabetes Services Scheme, by country of birth.
By language spoken at home The prevalence of diabetes based on the language spoken at home is included, however, these results have high relative standard errors associated with them and so need to be used with caution. The language groups with the highest standardised prevalence ratios were those in the Middle East/North Africa, Southern Asia, other South-West Asia, and East Asia (Table 3).
Demographics The size of various population groups by country of birth and age structure is presented in Figure 2. The largest overseas-born populations in Australia are people born in the United Kingdom (UK)/Ireland, New Zealand, Italy, Former Yugoslav Republics, Vietnam, China and Greece (Table A6). Information is also provided on English proficiency based on language spoken at home (Table 7). The groups with the highest proportion reporting that they do not speak English well or at all are: Chinese not included in other groups (this group is very small), Vietnamese, Korean, Khmer, followed by a number of other Chinese languages and Japanese. There are also a number of larger sized groups having more than 15% reporting that they do not speak English well or at all, including those speaking Greek, Arabic and Italian. Detailed information on where these groups live in Australia is included in Tables 8–12, and in Appendix C (Tables A18–A24).
Gaps in the data The main data gaps identified in this report fall into four groups. Firstly, there is a dearth of prevalence information for specific groups of people from culturally and linguistically diverse backgrounds. While some information is available for particular regions or countries of birth, or language groups, these do not allow for analysis based on the specific groups of interest. Secondly, there is a lack of relevant information on complications from diabetes for these specific groups. Thirdly, there is little information on prevalence rates based on measured glucose levels for these groups. Finally, detailed information on language skills for the high risk groups is also lacking.

1
1 Introduction The purpose of this report is to identify those groups of people from culturally and linguistically diverse backgrounds in Australia that have a high prevalence or risk of diabetes compared with the Australian-born population. The report describes the demographics of these groups, particularly in relation to the size of the community, their proficiency in English, and location within Australia, with the aim of providing information that could be used to identify those most in need of targeted educational materials. The report also identifies gaps in the available literature and data relating to diabetes risk and prevalence in Australians from culturally and linguistically diverse backgrounds. Australia is a multicultural nation with 28% of its population born overseas (ABS 2002a). Data from the Australian Bureau of Statistics (ABS) 2001 Census of Population and Housing showed that after people born in the United Kingdom (UK) and Ireland (5.8% of the population) and New Zealand (1.9%), the most commonly reported overseas places of birth were Italy (1.2%), Vietnam (0.8%), China (0.8%), Greece (0.6%), Germany (0.6%), the Philippines (0.5%), and India (0.5%). Among the almost 4 million people who spoke a language other than English at home, the most common languages were Italian (353,607 people), Greek (263,718), Cantonese (225,307), Arabic (209,372), Vietnamese (174,239) and Mandarin (139,286) (ABS 2002a). Since 1976, there has been a marked change in the country of origin of immigrants to Australia. In 1976 the largest group of immigrants were from the UK and Ireland (41.1%), with nearly all the other large groupings from European countries (ABS 1997a). By 2001, while the largest group was still from the UK and Ireland, this had dropped to 26.4% and people born in Vietnam, China, the Philippines and Malaysia were contributing almost 12% of the total immigrant intake.
Project description This project was undertaken for Diabetes Australia, in four stages: • Stage 1 involved a review of the literature and available data sources (outlined in
Appendix A) for information on prevalence, incidence, risk, trends and attitudes to self-care among Australians from culturally and linguistically diverse backgrounds. Only data sources which had become available since the adoption of the National Diabetes Strategy (Colagiuri et al. 1998), that is, since 1998, were included in this review.
• Stage 2 augmented this information with data from the ABS 2001 Census of Population and Housing to determine the demographics of high risk groups of Australians from culturally and linguistically diverse backgrounds. Data from the National Diabetes Services Scheme (NDSS) were also used to provide information on the distribution of Australians from culturally and linguistically diverse backgrounds registered with the NDSS.
• Stage 3 identified key gaps in available national information and data collections about diabetes among people from culturally and linguistically diverse backgrounds. Recommendations have been proposed for ways in which these national data collections could be improved to better identify at-risk communities.
• Stage 4 was the production of this report summarising the findings and gaps and providing information that could be used to rank the most ‘at-risk’ culturally and
2
linguistically diverse communities according to those most in need of targeted educational materials.
Scope In this report people from culturally and linguistically diverse (CALD) backgrounds are defined as: • people born overseas in countries where English is not the main language spoken, that is
people whose country of birth is not Australia and its external territories, New Zealand, the UK, Ireland, the United States of America, Canada or South Africa. This selection of countries is based on the main countries from which Australia receives overseas settlers who are likely to speak English; or
• people born in Australia whose main or preferred language spoken is not English. This definition may not always identify the complexities involved in identifying specific CALD communities. Data on country of birth and/or language spoken may not take into account the importance of cultural identity. For example, Assyrian people may define themselves as separate from the Arabic population despite potentially having the same country of birth. In addition, census data only provide information on languages other than English spoken at home, but does not specify whether these languages are the main or preferred languages. It should be noted that Indigenous Australians are not included in the scope of this report despite the fact that they are a culturally and linguistically diverse group who have a significantly higher prevalence of diabetes than non-Indigenous Australians.
3
2 Diabetes in culturally and linguistically diverse Australians
Overview It is well established that certain culturally and linguistically diverse groups in Australia have a high prevalence of diabetes compared with the Australian-born population. It is thought that the differentials in diabetes prevalence and risk by birthplace are due to a combination of genetic, biological, behavioural and environmental risk factors. However, there are limited data available indicating which specific language and cultural groups have the highest rates of diabetes or are most at risk.
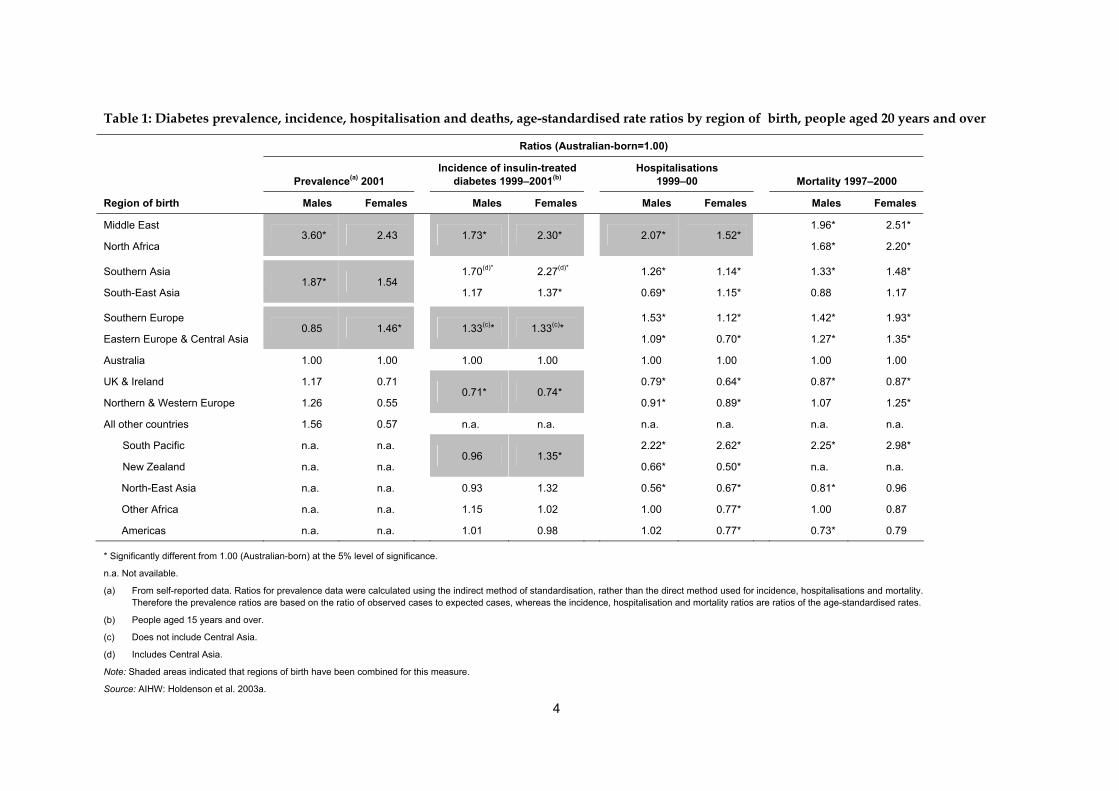
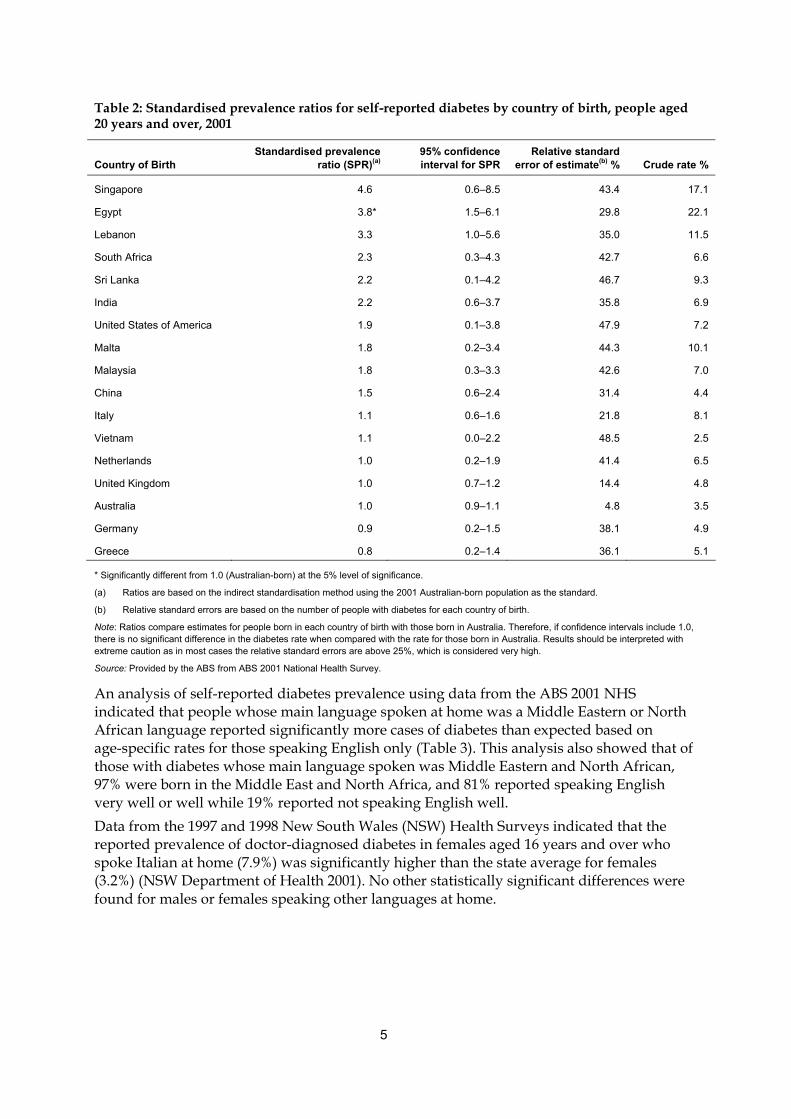
Diabetes other than gestational diabetes In their report A Picture of Diabetes in Overseas-born Australians, Holdenson et al. (AIHW 2003a) found that proportionally more overseas-born people than Australian-born report having diabetes. Approximately 35% of people who reported having diabetes in 2001 were born overseas despite the fact that only 28% of the Australian population in 2001 were born overseas. The regions of birth with the highest diabetes prevalence, incidence of insulin-treated diabetes and diabetes-related hospitalisation and/or mortality rates were the South Pacific Islands, Southern Europe, Eastern Europe and Central Asia, the Middle East, North Africa and Southern Asia (Table 1; also see Appendix Tables A1–A5). It is very difficult to obtain reliable estimates of the prevalence of diabetes for specific countries of birth. The ABS provided standardised prevalence ratios for self-reported diabetes prevalence from the 2001 National Health Survey (NHS) for specific countries of birth (Table 2). However the relative standard errors for these country-specific estimates were very high (i.e. between 25% and 50%), so extreme caution should be taken in interpreting the results. Of the countries included, only people born in Egypt reported significantly more cases of diabetes than expected based on the prevalence for Australian-born people.
4
Table 1: Diabetes prevalence, incidence, hospitalisation and deaths, age-standardised rate ratios by region of birth, people aged 20 years and over
Ratios (Australian-born=1.00)
Prevalence(a) 2001
Incidence of insulin-treated diabetes 1999–2001(b)
Hospitalisations 1999–00
Mortality 1997–2000
Region of birth Males Females Males Females Males Females Males Females
Middle East 1.96* 2.51*
North Africa 3.60* 2.43
1.73* 2.30*
2.07* 1.52*
1.68* 2.20*
Southern Asia 1.70(d)* 2.27(d)* 1.26* 1.14* 1.33* 1.48*
South-East Asia 1.87* 1.54
1.17 1.37* 0.69* 1.15* 0.88 1.17
Southern Europe 1.53* 1.12* 1.42* 1.93*
Eastern Europe & Central Asia 0.85 1.46*
1.33(c)* 1.33(c)*
1.09* 0.70* 1.27* 1.35*
Australia 1.00 1.00 1.00 1.00 1.00 1.00 1.00 1.00
UK & Ireland 1.17 0.71 0.79* 0.64* 0.87* 0.87*
Northern & Western Europe 1.26 0.55 0.71* 0.74*
0.91* 0.89* 1.07 1.25*
All other countries 1.56 0.57 n.a. n.a. n.a. n.a. n.a. n.a.
South Pacific n.a. n.a. 2.22* 2.62* 2.25* 2.98*
New Zealand n.a. n.a. 0.96 1.35*
0.66* 0.50* n.a. n.a.
North-East Asia n.a. n.a. 0.93 1.32 0.56* 0.67* 0.81* 0.96
Other Africa n.a. n.a. 1.15 1.02 1.00 0.77* 1.00 0.87
Americas n.a. n.a. 1.01 0.98 1.02 0.77* 0.73* 0.79
* Significantly different from 1.00 (Australian-born) at the 5% level of significance.
n.a. Not available.
(a) From self-reported data. Ratios for prevalence data were calculated using the indirect method of standardisation, rather than the direct method used for incidence, hospitalisations and mortality. Therefore the prevalence ratios are based on the ratio of observed cases to expected cases, whereas the incidence, hospitalisation and mortality ratios are ratios of the age-standardised rates.
(b) People aged 15 years and over.
(c) Does not include Central Asia.
(d) Includes Central Asia.
Note: Shaded areas indicated that regions of birth have been combined for this measure.
Source: AIHW: Holdenson et al. 2003a.
5
Table 2: Standardised prevalence ratios for self-reported diabetes by country of birth, people aged 20 years and over, 2001
Country of Birth Standardised prevalence
ratio (SPR)(a) 95% confidence interval for SPR
Relative standard error of estimate(b) % Crude rate %
Singapore 4.6 0.6–8.5 43.4 17.1
Egypt 3.8* 1.5–6.1 29.8 22.1
Lebanon 3.3 1.0–5.6 35.0 11.5
South Africa 2.3 0.3–4.3 42.7 6.6
Sri Lanka 2.2 0.1–4.2 46.7 9.3
India 2.2 0.6–3.7 35.8 6.9
United States of America 1.9 0.1–3.8 47.9 7.2
Malta 1.8 0.2–3.4 44.3 10.1
Malaysia 1.8 0.3–3.3 42.6 7.0
China 1.5 0.6–2.4 31.4 4.4
Italy 1.1 0.6–1.6 21.8 8.1
Vietnam 1.1 0.0–2.2 48.5 2.5
Netherlands 1.0 0.2–1.9 41.4 6.5
United Kingdom 1.0 0.7–1.2 14.4 4.8
Australia 1.0 0.9–1.1 4.8 3.5
Germany 0.9 0.2–1.5 38.1 4.9
Greece 0.8 0.2–1.4 36.1 5.1
* Significantly different from 1.0 (Australian-born) at the 5% level of significance.
(a) Ratios are based on the indirect standardisation method using the 2001 Australian-born population as the standard.
(b) Relative standard errors are based on the number of people with diabetes for each country of birth.
Note: Ratios compare estimates for people born in each country of birth with those born in Australia. Therefore, if confidence intervals include 1.0, there is no significant difference in the diabetes rate when compared with the rate for those born in Australia. Results should be interpreted with extreme caution as in most cases the relative standard errors are above 25%, which is considered very high.
Source: Provided by the ABS from ABS 2001 National Health Survey.
An analysis of self-reported diabetes prevalence using data from the ABS 2001 NHS indicated that people whose main language spoken at home was a Middle Eastern or North African language reported significantly more cases of diabetes than expected based on age-specific rates for those speaking English only (Table 3). This analysis also showed that of those with diabetes whose main language spoken was Middle Eastern and North African, 97% were born in the Middle East and North Africa, and 81% reported speaking English very well or well while 19% reported not speaking English well. Data from the 1997 and 1998 New South Wales (NSW) Health Surveys indicated that the reported prevalence of doctor-diagnosed diabetes in females aged 16 years and over who spoke Italian at home (7.9%) was significantly higher than the state average for females (3.2%) (NSW Department of Health 2001). No other statistically significant differences were found for males or females speaking other languages at home.
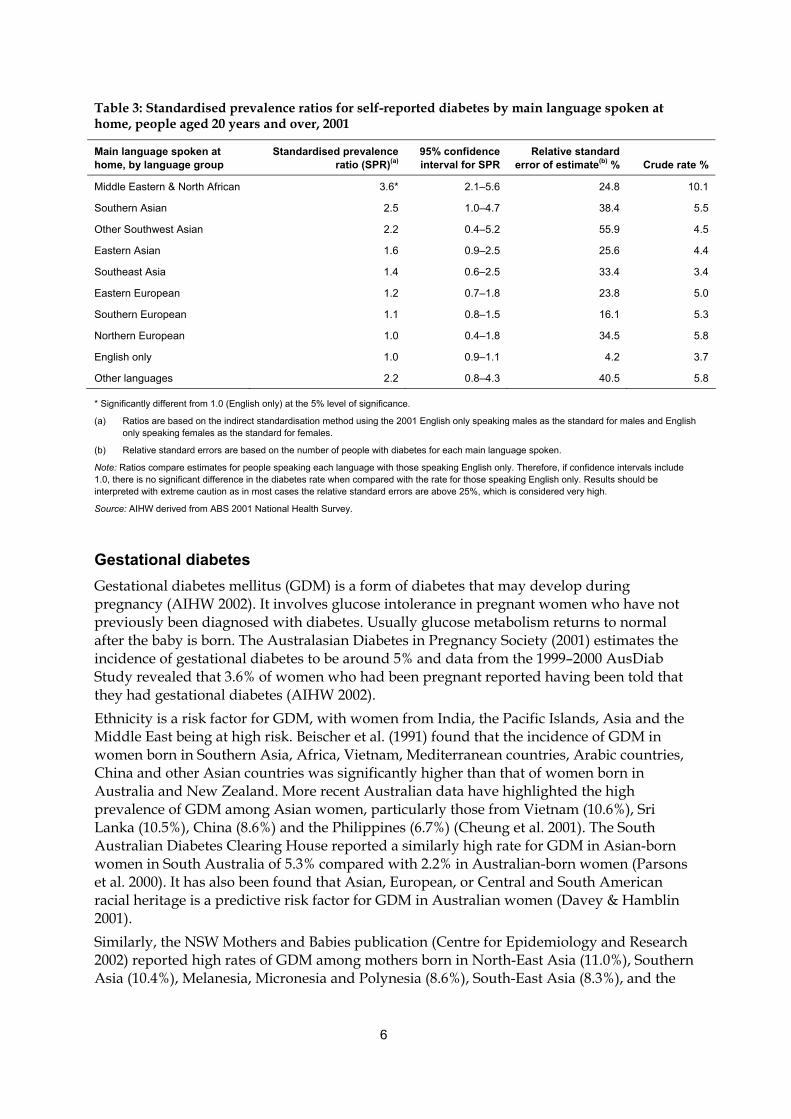
6
Table 3: Standardised prevalence ratios for self-reported diabetes by main language spoken at home, people aged 20 years and over, 2001
Main language spoken at home, by language group
Standardised prevalence ratio (SPR)(a)
95% confidence interval for SPR
Relative standard error of estimate(b) % Crude rate %
Middle Eastern & North African 3.6* 2.1–5.6 24.8 10.1
Southern Asian 2.5 1.0–4.7 38.4 5.5
Other Southwest Asian 2.2 0.4–5.2 55.9 4.5
Eastern Asian 1.6 0.9–2.5 25.6 4.4
Southeast Asia 1.4 0.6–2.5 33.4 3.4
Eastern European 1.2 0.7–1.8 23.8 5.0
Southern European 1.1 0.8–1.5 16.1 5.3
Northern European 1.0 0.4–1.8 34.5 5.8
English only 1.0 0.9–1.1 4.2 3.7
Other languages 2.2 0.8–4.3 40.5 5.8
* Significantly different from 1.0 (English only) at the 5% level of significance.
(a) Ratios are based on the indirect standardisation method using the 2001 English only speaking males as the standard for males and English only speaking females as the standard for females.
(b) Relative standard errors are based on the number of people with diabetes for each main language spoken.
Note: Ratios compare estimates for people speaking each language with those speaking English only. Therefore, if confidence intervals include 1.0, there is no significant difference in the diabetes rate when compared with the rate for those speaking English only. Results should be interpreted with extreme caution as in most cases the relative standard errors are above 25%, which is considered very high.
Source: AIHW derived from ABS 2001 National Health Survey.
Gestational diabetes Gestational diabetes mellitus (GDM) is a form of diabetes that may develop during pregnancy (AIHW 2002). It involves glucose intolerance in pregnant women who have not previously been diagnosed with diabetes. Usually glucose metabolism returns to normal after the baby is born. The Australasian Diabetes in Pregnancy Society (2001) estimates the incidence of gestational diabetes to be around 5% and data from the 1999–2000 AusDiab Study revealed that 3.6% of women who had been pregnant reported having been told that they had gestational diabetes (AIHW 2002). Ethnicity is a risk factor for GDM, with women from India, the Pacific Islands, Asia and the Middle East being at high risk. Beischer et al. (1991) found that the incidence of GDM in women born in Southern Asia, Africa, Vietnam, Mediterranean countries, Arabic countries, China and other Asian countries was significantly higher than that of women born in Australia and New Zealand. More recent Australian data have highlighted the high prevalence of GDM among Asian women, particularly those from Vietnam (10.6%), Sri Lanka (10.5%), China (8.6%) and the Philippines (6.7%) (Cheung et al. 2001). The South Australian Diabetes Clearing House reported a similarly high rate for GDM in Asian-born women in South Australia of 5.3% compared with 2.2% in Australian-born women (Parsons et al. 2000). It has also been found that Asian, European, or Central and South American racial heritage is a predictive risk factor for GDM in Australian women (Davey & Hamblin 2001). Similarly, the NSW Mothers and Babies publication (Centre for Epidemiology and Research 2002) reported high rates of GDM among mothers born in North-East Asia (11.0%), Southern Asia (10.4%), Melanesia, Micronesia and Polynesia (8.6%), South-East Asia (8.3%), and the
7
Middle East and North Africa (6.9%), compared with mothers born in English-speaking countries (2.7%). Evidence from other countries also shows that certain immigrant groups have a higher risk of GDM than the native-born population. Non-Hispanic black mothers who were born outside the United States of America have been seen to have elevated risk for GDM (Kieffer et al. 1999). Weijers et al. (1998) also found that GDM risk was elevated among Turkish and Moroccan women who had migrated to the Netherlands. Other risk factors for GDM are glycosuria, age over 30 years, obesity, family history of diabetes, past history of GDM or glucose intolerance and previous adverse pregnancy outcome (Davey & Hamblin 2001). As certain cultural groups are at higher risk for factors such as obesity (discussed below), individuals in these groups may be more likely to have more than one risk factor.
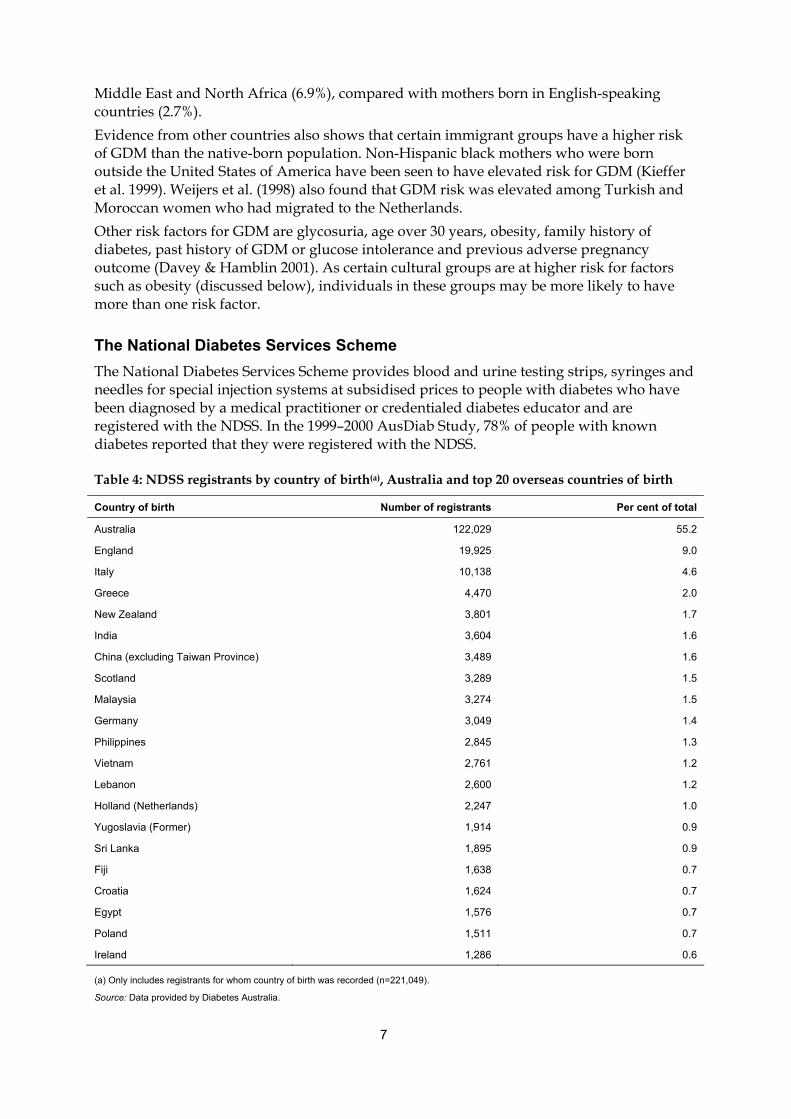
The National Diabetes Services Scheme The National Diabetes Services Scheme provides blood and urine testing strips, syringes and needles for special injection systems at subsidised prices to people with diabetes who have been diagnosed by a medical practitioner or credentialed diabetes educator and are registered with the NDSS. In the 1999–2000 AusDiab Study, 78% of people with known diabetes reported that they were registered with the NDSS.
Table 4: NDSS registrants by country of birth(a), Australia and top 20 overseas countries of birth
Country of birth Number of registrants Per cent of total
Australia 122,029 55.2
England 19,925 9.0
Italy 10,138 4.6
Greece 4,470 2.0
New Zealand 3,801 1.7
India 3,604 1.6
China (excluding Taiwan Province) 3,489 1.6
Scotland 3,289 1.5
Malaysia 3,274 1.5
Germany 3,049 1.4
Philippines 2,845 1.3
Vietnam 2,761 1.2
Lebanon 2,600 1.2
Holland (Netherlands) 2,247 1.0
Yugoslavia (Former) 1,914 0.9
Sri Lanka 1,895 0.9
Fiji 1,638 0.7
Croatia 1,624 0.7
Egypt 1,576 0.7
Poland 1,511 0.7
Ireland 1,286 0.6
(a) Only includes registrants for whom country of birth was recorded (n=221,049).
Source: Data provided by Diabetes Australia.
8
Data provided by Diabetes Australia show that of all people registered on the NDSS as at 31 December 2001, country of birth was recorded for 44% of registrants and, of these, 45% were born overseas (Table 4).
Diabetes in specific groups
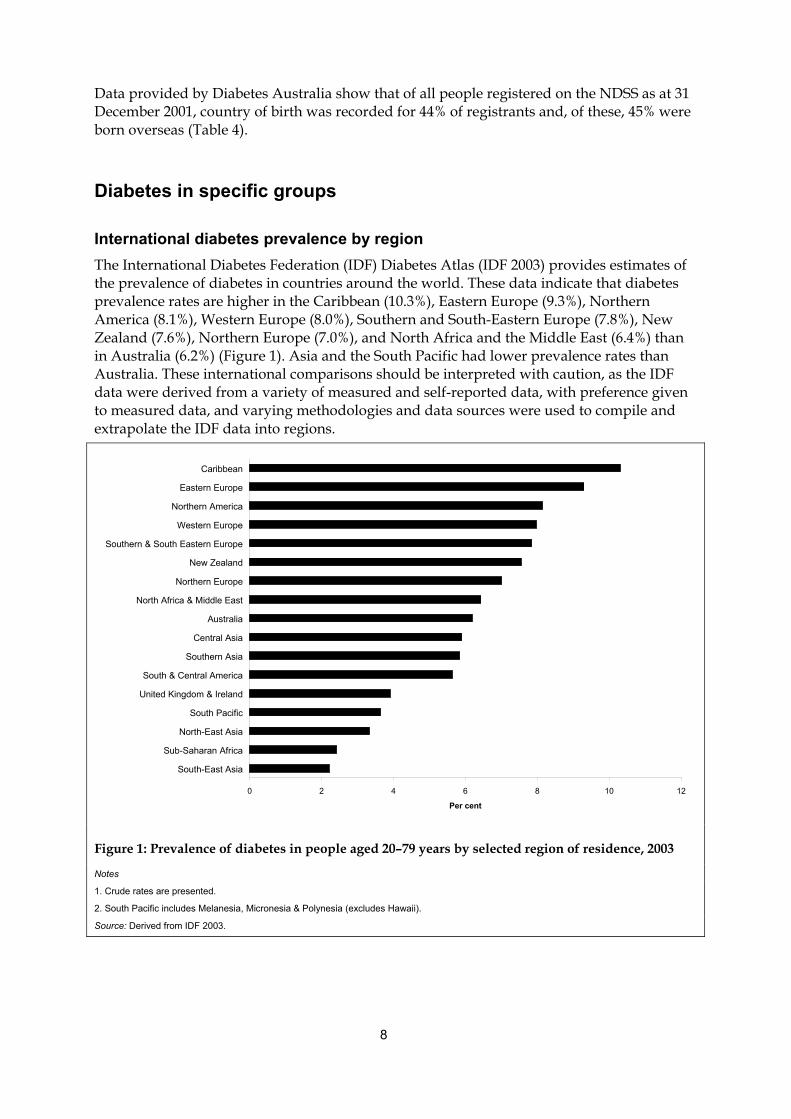
International diabetes prevalence by region The International Diabetes Federation (IDF) Diabetes Atlas (IDF 2003) provides estimates of the prevalence of diabetes in countries around the world. These data indicate that diabetes prevalence rates are higher in the Caribbean (10.3%), Eastern Europe (9.3%), Northern America (8.1%), Western Europe (8.0%), Southern and South-Eastern Europe (7.8%), New Zealand (7.6%), Northern Europe (7.0%), and North Africa and the Middle East (6.4%) than in Australia (6.2%) (Figure 1). Asia and the South Pacific had lower prevalence rates than Australia. These international comparisons should be interpreted with caution, as the IDF data were derived from a variety of measured and self-reported data, with preference given to measured data, and varying methodologies and data sources were used to compile and extrapolate the IDF data into regions.
0 2 4 6 8 10 12
South-East Asia
Sub-Saharan Africa
North-East Asia
South Pacific
United Kingdom & Ireland
South & Central America
Southern Asia
Central Asia
Australia
North Africa & Middle East
Northern Europe
New Zealand
Southern & South Eastern Europe
Western Europe
Northern America
Eastern Europe
Caribbean
Per cent
Figure 1: Prevalence of diabetes in people aged 20–79 years by selected region of residence, 2003
Notes
1. Crude rates are presented.
2. South Pacific includes Melanesia, Micronesia & Polynesia (excludes Hawaii).
Source: Derived from IDF 2003.
9
Northern and Western European Data from the 2001 NHS indicate that the prevalence rates of diabetes among immigrants from both the UK and Ireland, and other Northern and Western Europe, are not statistically significantly different from that of the Australian-born population (Tables 1 and 2). The NSW Chief Health Officer also found that in 1997 and 1998 the prevalence of current diabetes or high blood sugar among people born in Northern and Western Europe as a whole (4.3%; 95% CI 3.4%–5.2%) was similar to that for the Australian-born population (3.8%; 95% CI 3.5%–4.1%) (NSW Department of Health 2002). In contrast, results from the South Australian Social Environmental Risk Context Information System (SERCIS) Migrant Health Survey conducted in 1997 showed that, after adjusting for age and sex, immigrants from Poland had a statistically significantly higher prevalence of medically confirmed diabetes than Australian-born people (Taylor et al. 1997). Further, this South Australian survey showed that, in comparison to other people from non-English-speaking countries as a whole (4.1%), immigrants from Poland (10.3%) and other Northern and Western Europe (excluding Germany and the Netherlands) (7.5%) had significantly higher medically confirmed diabetes prevalence rates. The national incidence of insulin-treated diabetes in 1999–2001 and the rate of hospitalisations in 1999–00 (Table 1) were both statistically significantly lower for males and females from Northern and Western Europe compared with the Australian-born population. Similarly, the NSW Chief Health Officer (NSW Department of Health 2002) found that the rate of hospitalisations for diabetes complications was statistically significantly lower in 1995–96 to 1999–00 among people born in Northern and Western Europe (95.7 per 100,000 population; 95% CI 91.6–99.8) compared with that for people born in Australia (158.0 per 100,000 population; 95% CI 156.4–159.6). Death rates in 1997–2000 for diabetes among immigrants born in the UK and Ireland were also statistically significantly lower than the corresponding Australian-born death rates, but for females born in Northern and Western Europe the diabetes-related death rate was significantly higher than the rate for Australian-born females (Table 1).
Southern European, Eastern European and Central Asian Results from the 2001 NHS showed that females born in Southern Europe, Eastern Europe and Central Asia reported significantly more cases than expected based on Australian-born female rates (Table 1). However, there was no evidence of a statistically significant difference between the prevalence of self-reported diabetes in males born in these regions compared with their Australian-born counterparts. The NSW Chief Health Officer (NSW Department of Health 2002) found that, compared with people born in Australia, the prevalence of diabetes or high blood sugar in 1997 and 1998 was statistically significantly higher for people born in Southern Europe (9.9%; 95% CI 7.4%–12.4%) but similar for people born in Eastern Europe (7.9%; 95% CI 3.8%–12.0%). Results for specific countries of birth from the 1997 and 1998 NSW Health Surveys indicated that the reported prevalence rates of doctor-diagnosed diabetes among Italian-born males (12.5%) and females (9.3%) aged 16 years and over were statistically significantly higher (based on comparison of 95% confidence intervals) than the state averages (3.9% for males and 3.2% for females) (NSW Department of Health 2001). Data from the South Australian SERCIS Migrant Health Survey 1997 indicated that, after adjusting for age and sex, people born in Greece or Cyprus had a statistically significantly higher prevalence of medically confirmed diabetes (5.3%) than people born in non-English-speaking countries as a whole (4.1%) (Taylor et al. 1997).
10
Incidence rates of insulin-treated diabetes in 1999–2001 and diabetes-related death rates in 1997–2000 were statistically significantly higher for both males and females born in Southern Europe, Eastern Europe and Central Asia than for their Australian-born counterparts (Table 1). Further, males born in these regions, as well as females born in Southern Europe alone, had significantly higher hospitalisation rates in 1999–00 than their Australian-born counterparts; while females born in Eastern Europe and Central Asia had a significantly lower hospitalisation rate than Australian-born females. The NSW Chief Health Officer (NSW Department of Health 2002) found that the rates of hospitalisations for diabetes complications in 1995–96 to 1999–00 were statistically significantly higher among people born in Southern Europe (199.1 per 100,000 population; 95% CI 190.7–207.7) and Eastern Europe (191.6 per 100,000 population; 95% CI 180.0–203.6) compared with that for people born in Australia (158.0 per 100,000 population; 95% CI 156.4–159.6). Detailed literature on diabetes prevalence and incidence for specific communities within these immigrant groups were not found. Results from the Melbourne Collaborative Cohort Study (Hodge et al. 2004; personal communication from Allison Hodge 13 January 2004) showed that at baseline Greek- and Italian-born immigrants aged 40–69 years had higher diabetes prevalence rates (9.7% and 9.4% respectively) than their Australian- or New Zealand-born counterparts (2.9%). Further, at 4-year follow-up, after adjusting for age Greek- and Italian-born immigrants who did not have diabetes at baseline were statistically significantly more likely than people born in Australian or New Zealand to have developed Type 2 diabetes (Greek-born odds ratio 3.8, 95% CI 2.9–5.0; Italian-born odds ratio 3.3, 95% CI 2.6–4.3). These findings are supported by McKay et al. (2000), who found in their study of the Victorian Visual Impairment Project that Mediterranean ethnicity was positively associated with self-reported diabetes. They reported that, compared with people of UK or Irish heritage, Italian- and Greek-born people had a statistically significantly higher odds ratio for self-reported diabetes (2.1 and 1.8 respectively). Italian-born people in Western Australia have also been reported to have a high prevalence of diabetes (DiFrancesco et al. 1999).
North African and Middle Eastern In 2001, men born in the Middle East and North Africa reported a prevalence of diabetes 3.6 times higher than expected, based on the age-specific rates for Australian-born men (Table 1). However, there was no evidence from the ABS 2001 NHS that women born in the Middle East and North Africa report more cases than expected. The NSW Chief Health Officer (NSW Department of Health 2002) reported that the prevalence of current diabetes or high blood sugar in 1997 and 1998 was 8.1% for people born in the Middle East; this was statistically significantly higher than the rate of 3.8% for Australian-born people. The high prevalence rates of diabetes among the North African and Middle Eastern communities living in Australia are supported by a study conducted in an Arabic-speaking general practitioner’s office in Sydney which found that 13% of Arabic-speaking males and 5% of Arabic-speaking females surveyed had diabetes (Rissel et al. 1998), and by the high reported prevalence of diabetes for Egyptian-born people recorded in the ABS 2001 NHS (Table 2). Data from the National Diabetes Register show that both male and female immigrants from North Africa and the Middle East had statistically significantly higher incidence rates of insulin-treated diabetes in 1999–2001 compared with the Australian-born population, with rate ratios of 1.73 for males and 2.30 for females (Table 1). Immigrants from the Middle East and North Africa also had statistically significantly higher rates of diabetes-related hospitalisation and mortality than the Australian-born population, with mortality among Middle Eastern-born people higher than those born in North Africa
11
(Table 1 and Appendix Table A5). The NSW Chief Health Officer (NSW Department of Health 2002) found that the rate of hospitalisations for diabetes complications in 1995–96 to 1999–00 was statistically significantly higher for people born in the Middle East (664.3 per 100,000 population; 95% CI 637.4–691.9) compared with the rate for people born in Australia (158.0 per 100,000 population; 95% CI 156.4–159.6). Anecdotal evidence suggests that Arabic-speaking people have a high risk of diabetes after migrating to Australia (Conquest 2002; Yunus 2002). Further, the Ethiopian Community Diabetes Project Report (Rozman 2001) suggested that the prevalence of diabetes among Ethiopian-born Australians is likely to increase due to the age structure of this community. In addition to these data on North African and Middle Eastern immigrants to Australia, two Dutch studies have found that Middle Eastern- and North African-born (Turkish and Moroccan) populations in the Netherlands had a higher prevalence of diabetes than people of Dutch origin (Weijers et al. 1998; Dijkshoorn et al. 2003). In New Zealand it was found that people of Middle Eastern ethnicity had one of the highest prevalence rates of diabetes (8.2%) of all non-European groups (4.3% overall) compared with a prevalence of 1.9% in European New Zealanders (Simmons et al. 1999).
South-East Asian and Southern Asian It has been reported that the prevalence of Type 2 diabetes is increasing at a disproportionately high rate among Asian Australians compared with their non-Asian counterparts (Wahlqvist 2002). In 2001, South-East Asian and Southern Asian immigrants to Australia reported more cases of diabetes than expected (significantly more for males) based on age-specific rates for Australian-born (Table 1). A similar result was found in the 1999–2000 AusDiab study. The NSW Chief Health Officer (NSW Department of Health 2002) reported a 3.8% prevalence rate for diabetes or high blood sugar in 1997 and 1998 among people born in South-East Asia and 5.8% for those born in Southern Asia; however neither rate was statistically significantly higher than the rate for people born in Australia (3.8%). Incidence rates of insulin-treated diabetes in 1999–2001 among male and female immigrants from Southern Asia and Central Asia, and female immigrants from South-East Asia, were statistically significantly higher than the corresponding Australian-born rates (Table 1). Male and female immigrants from Southern Asia, and female immigrants from South-East Asia, had statistically significantly higher diabetes-related hospitalisation rates in 1999–00 than people born in Australia (Table 1). In contrast, males born in South-East Asia had a statistically significantly lower diabetes-related hospitalisation rate in 1999–00 than Australian-born males. The NSW Chief Health Officer (NSW Department of Health 2002) also found that the rate of hospitalisations for diabetes complications from 1995–96 to 1999–00 was significantly higher among people born in Southern Asia (232.6 per 100,000 population; 95% CI 216.1–250.0) compared with that for people born in Australia (158.0 per 100,000 population; 95% CI 156.4–159.6), while for people born in South-East Asia it was significantly lower (141.5 per 100,000 population; 95% CI 130.6–152.9). Diabetes-related mortality rates for 1997–2000 for both males and females born in Southern Asia were significantly higher than the rates for Australian-born males and females (Table 1). In their study of the service needs of people from Italian and Vietnamese communities living in Perth, DiFrancesco et al. (1999) found that while the overall age-standardised diabetes-hospital separation rate for 1995–96 among people born in Vietnam was similar to that for Australian-born people, the rate among Vietnamese people aged 75–79 years was nine times higher than the rate for their Australian-born counterparts. They suggested that this might
12
mean that the burden of diabetes among the Vietnamese community might increase as it ages. A high prevalence of diabetes in Asian-born populations is also seen in other countries, particularly among immigrants from Southern Asia (Chowdhury et al. 2003). In their review of ethnicity and diabetes, Abate and Chandalia (2003) reported that although the prevalence of diabetes was 8–10% in the Philippines and 4% in Japan, the prevalence among Filipinos living in Houston, Texas was 16%, while the prevalence among Japanese people living in Seattle was as high as 21%. They also reported that Asian Indians who had migrated to the UK or other westernised countries had a prevalence of diabetes that was about four times higher than that of those living in India. In other studies, British South Asian children were found to have higher average levels of insulin and insulin resistance than white children even after adjusting for height and ponderal index (Whincup et al. 2002), and Feltbower (2002) reported that South Asian children who had migrated to the UK had a higher prevalence of Type 1 diabetes than those living in Asia.
Immigrants from other countries
South Pacific The NSW Chief Health Officer (NSW Department of Health 2002) reported the prevalence of diabetes or high blood sugar in 1997 and 1998 to be 5.0% for people born in the South Pacific. This was not statistically significantly different from the rate for Australian-born people, as the number of respondents from the South Pacific was small. The NSW Chief Health Officer also found that the rate of hospitalisations for diabetes complications in 1995–96 to 1999–00 among people born in the South Pacific (855.1 per 100,000 population; 95% CI 806.7–905.5) was statistically significantly higher at over five times the rate for Australian-born people (158.0 per 100,000 population; 95% CI 156.4–159.6). The incidence of insulin-treated diabetes in 1999–2001 was statistically significantly higher for females born in the South Pacific and New Zealand than for the Australian-born females but no difference was observed for males (Table 1). Diabetes-related mortality rates in 1997–2000 and hospitalisation rates in 1999–00 for immigrants from the South Pacific were significantly higher than those for the Australian-born population (Table 1). Urbanised Pacific Islander people have consistently been reported to have high rates of diabetes (Foliaki & Pearce 2003); in particular, the diabetes prevalence among adults in Nauru has been reported to be as high as 40% (Colagiuri et al. 2002). Simmons et al. (1999 & 2001) reported a much higher age-adjusted prevalence of known diabetes among immigrant Pacific Islander people in New Zealand—4% (for all ages) compared with 2% in European New Zealanders; and 25% for those aged 40–59 years compared with 7% in Europeans.
Americas The NSW Chief Health Officer (NSW Department of Health 2002) reported that the prevalence of diabetes and high blood sugar in 1997 and 1998 was 4.2% for people born in Latin America and 1.4% for people born in Northern America; however the number of respondents from these regions was small. Anecdotal evidence also suggests that South American-born people are at higher risk of diabetes after migrating to Australia (Cameron 2002). The incidence of insulin-treated diabetes in 1999–2001 for immigrants from the Americas and the rate of hospitalisations in 1999–00 for males born in the Americas were not significantly different from the rates for Australian-born population (Table 1). However, females born in the Americas had a significantly lower diabetes-related hospitalisation rate than Australian-
13
born females, and the diabetes-related mortality rate in 1997–2000 was significantly lower among males born in the Americas compared with Australian-born males. The NSW Chief Health Officer (NSW Department of Health 2002) found that the rates of hospitalisations for diabetes complications in 1995–96 to 1999–00 were significantly lower among people born in Latin America (89.0 per 100,000 population; 95% CI 73.9–106.0) and Northern America (111.8 per 100,000 population; 95% CI 92.0–134.5) than the rate for Australian-born people (158.0 per 100,000 population; 95% CI 156.4–159.6).
Other Africa The NSW Chief Health Officer reported that the prevalence of diabetes or high blood sugar in 1997 and 1998 among people born in Africa (including North Africa) was 6.2%; however this was not statistically significantly higher than the rate for the Australian-born population (NSW Department of Health 2002). In contrast, the rate of hospitalisations for diabetes-related complications in 1995–96 to 1999–00 was statistically significantly higher (208.3 per 100,000 population; 95% CI 194.0–223.4) than the corresponding rate for the Australian-born population (158.0 per 100,000 population; 95% CI 156.4–159.6). The available national data provide little evidence of differences in the incidence of insulin-treated diabetes and diabetes-related hospitalisation and mortality rates between immigrants from ‘Other’ Africa (i.e. regions other than North Africa) and Australian-born males and females (Table 1). A study conducted in a Ghanaian community in Sydney found that 20% of men and 11% of women from this community had Type 2 diabetes (Saleh et al. 2002). Similarly, Mbanya et al. (1999) found high rates of glucose intolerance among African and Caribbean immigrants to the UK compared with those living in rural and urban Cameroon and Jamaica; and Riste et al. (2001) found a known and newly-detected diabetes prevalence of 18–26% among African-Caribbeans in the UK.
North-East Asia The NSW Chief Health Officer reported that the prevalence of diabetes or high blood sugar among people born in North-East Asia (this region was called Eastern Asia in the NSW Chief Health officer’s report) in 1997 and 1998 was 3.1%, which was just slightly lower than the rate for the Australian-born population (3.8%) but not statistically significantly different (NSW Department of Health 2002). The available national data indicate no significant difference in the incidence of insulin-treated diabetes in 1999–2001 between immigrants from North-East Asia and the Australian-born population (Table 1). However, the diabetes-related hospitalisation rates in 1999–00 for males and females born in North-East Asia were significantly lower than the rates for their Australian-born counterparts, as was the diabetes-related mortality rate in 1997–2000 for North-East Asian-born males. The NSW Chief Health Officer found that the rate of hospitalisations for diabetes-related complications in 1995–96 to 1999–00 among the North-East Asian-born population was 148.2 per 100,000 population (95% CI 139.2–157.7), which was not significantly different from the rate for the Australian-born population (158.0 per 100,000 population; 95% CI 156.4–159.6).
14
Risk factors for diabetes Type 1 diabetes is believed to be caused by exposure to environmental factors, possibly toxins or viruses (AIHW 2002). A genetic component is suspected, although a large proportion of cases occur in people with no family history of the disease (Dorman et al. 1995). Race and ethnicity are also important factors. No modifiable risk factors for Type 1 diabetes have been clearly identified. Genetic, environmental and behavioural risk factors all contribute to the aetiology of Type 2 diabetes. While the genetic basis for Type 2 diabetes remains unknown, twin and family studies have shown a strong relationship between family history and risk. Race and ethnic background have also been seen to be associated with higher risk. Environmental factors associated with an increased risk of diabetes include urbanisation and increased modernisation. These factors also influence behavioural choices that are linked to increased risk, particularly physical inactivity and poor nutrition and, indirectly, overweight and obesity. Increasing age is also a risk factor for Type 2 diabetes (AIHW 2002). This section focuses on Type 2 diabetes, primarily because it accounts for 85–90% of diabetes (AIHW 2002), and also because the existence of modifiable risk factors means that it is possible to prevent or delay its onset.
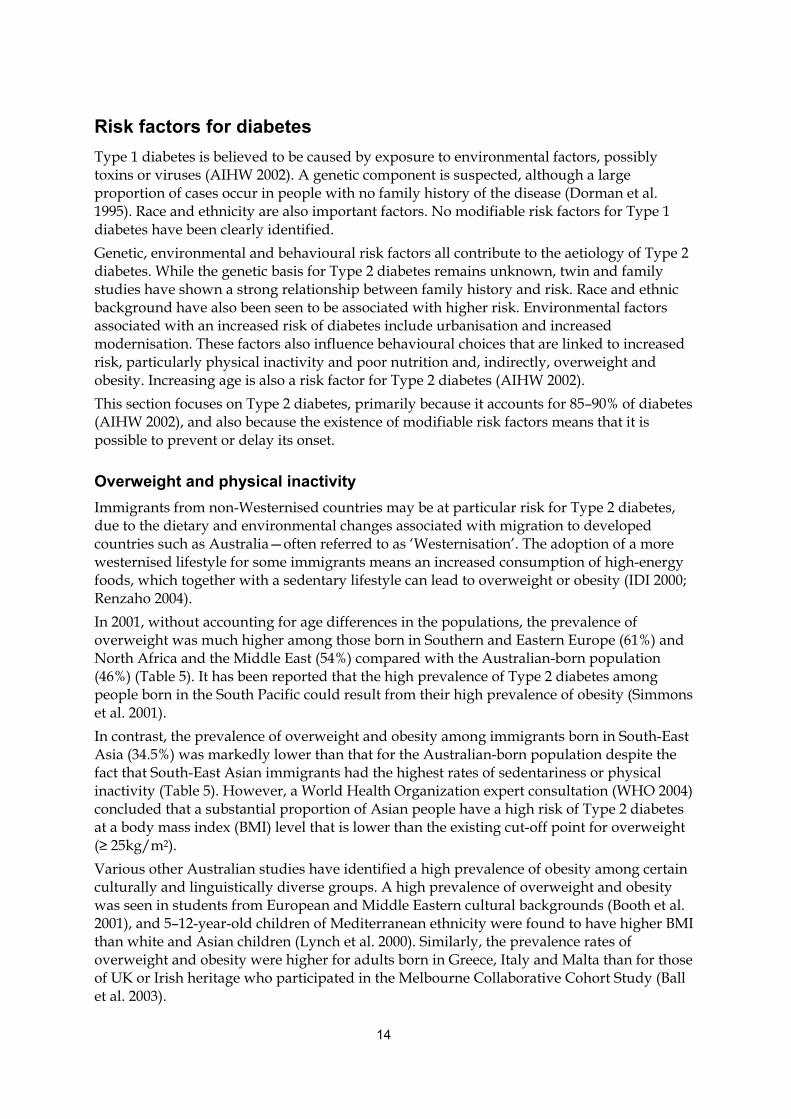
Overweight and physical inactivity Immigrants from non-Westernised countries may be at particular risk for Type 2 diabetes, due to the dietary and environmental changes associated with migration to developed countries such as Australia—often referred to as ‘Westernisation’. The adoption of a more westernised lifestyle for some immigrants means an increased consumption of high-energy foods, which together with a sedentary lifestyle can lead to overweight or obesity (IDI 2000; Renzaho 2004). In 2001, without accounting for age differences in the populations, the prevalence of overweight was much higher among those born in Southern and Eastern Europe (61%) and North Africa and the Middle East (54%) compared with the Australian-born population (46%) (Table 5). It has been reported that the high prevalence of Type 2 diabetes among people born in the South Pacific could result from their high prevalence of obesity (Simmons et al. 2001). In contrast, the prevalence of overweight and obesity among immigrants born in South-East Asia (34.5%) was markedly lower than that for the Australian-born population despite the fact that South-East Asian immigrants had the highest rates of sedentariness or physical inactivity (Table 5). However, a World Health Organization expert consultation (WHO 2004) concluded that a substantial proportion of Asian people have a high risk of Type 2 diabetes at a body mass index (BMI) level that is lower than the existing cut-off point for overweight (≥ 25kg/m2). Various other Australian studies have identified a high prevalence of obesity among certain culturally and linguistically diverse groups. A high prevalence of overweight and obesity was seen in students from European and Middle Eastern cultural backgrounds (Booth et al. 2001), and 5–12-year-old children of Mediterranean ethnicity were found to have higher BMI than white and Asian children (Lynch et al. 2000). Similarly, the prevalence rates of overweight and obesity were higher for adults born in Greece, Italy and Malta than for those of UK or Irish heritage who participated in the Melbourne Collaborative Cohort Study (Ball et al. 2003).
15
Table 5: Prevalence of overweight and physical inactivity by region of birth, people aged 18 years and over, 2001
Overweight(a)(b) Sedentary/low physical activity level
Region of birth Males Females Persons Males Females Persons
Per cent
Southern & Eastern Europe 70.3 51.1 60.6 75.1 79.0 77.1
North Africa & Middle East 65.7 37.1 54.4 65.3 84.8 73.0
UK 56.4 41.6 49.0 61.4 69.2 65.3
Other Oceania 51.9 44.0 47.9 59.0 73.0 66.2
Other Northern & Western Europe 55.8 39.1 47.7 67.6 66.9 67.2
Australia 55.1 38.1 46.4 63.5 73.1 68.5
South-East Asia 32.6 18.4 34.5 79.7 87.1 84.0
All other countries 33.4 29.2 31.3 69.6 74.4 72.0
(a) Overweight indicates a self-reported Body Mass Index of greater than or equal to 25.0 kg/m2.
(b) These data are not age-standardised and therefore the age distribution of the population should be considered when interpreting these estimates.
Source: ABS 2002b.
A high prevalence of overweight and obesity was also seen in Sydney Arabic-speaking and Ghanaian populations. The prevalence of overweight for the Arabic-speaking population (surveyed at an Arabic-speaking doctors’ surgery) was 73% for males and 36% for females (Rissel et al. 1998). Within the surveyed Ghanaian community, 53% of males and 40% of females were overweight (but not obese), and a further 18% of males and 26% of females were obese. Abdominal overweight was present in 53% of males and 74% of females (Saleh et al. 2002). Results from the ABS 2001 NHS indicate that a large proportion (almost 70%) of Australian-born people are sedentary or undertake a low level of physical activity. Immigrants from the UK, other Northern and Western Europe, the North Africa and the Middle East, and ‘other Oceania’ reported similar rates of inactivity. However, people born in Southern and Eastern Europe, and South-East Asia reported much higher rates of physical inactivity (around 80%). In addition, low levels of physical activity were observed in the ‘parents’ generation, compared with children or grandparents, from Greek, Turkish, Indian and Chinese communities that have migrated to Australia in the last three decades (Green et al. 2003). This suggests that ‘middle aged’ immigrants might be at higher risk of developing Type 2 diabetes. This is also observed within the Spanish and Hispano-American population (Email communication from Mrs Gladys Hitchen, Steering Committee, 23 June 2004).
Impaired glucose tolerance There are limited data available to estimate the prevalence of impaired glucose tolerance (IGT) in Australians from CALD backgrounds. However the risk of IGT is likely to be higher in groups that have a greater risk of Type 2 diabetes such as people born in the South Pacific Islands, Southern Asia and South-East Asia (AIHW 2002).
16
Age The risk of developing Type 2 diabetes increases significantly with age, and this risk factor is particularly pertinent in identifying Australians from CALD backgrounds at high risk of Type 2 diabetes. Changes in Australia’s immigration policies, particularly since World War II, have meant that immigrants have come to Australia in ’waves’ from various regions (ABS 1997a). The proportion of people emigrating from non-English-speaking countries has increased from 54% in 1976 to 61% in 2001. Further, since 1976 there has been a decline in the proportion of the population from European countries and an increase in the Asian-born population. Groups who arrived in earlier immigration waves have higher median ages than more recent arrivals (DIMA 2001): the longer an immigrant group has resided in Australia, the higher its median age in comparison to the rest of the population. See Appendix C, Tables A6 and A7, for more detail. The changing age profile of particular overseas-born groups affects the size of these groups at older ages, which is particularly relevant for aged care services. In the 1996 census, for people aged 65 years and over, the five largest groups with a language other than English spoken at home were those speaking particular European languages (Italian, Greek, German, ‘other European languages’, and Polish). However, by 2011 Cantonese is expected to become one of these top five groups (AIHW: Gibson et al. 2001). Data from the ABS 2001 Census of Population and Housing also indicate that different communities have different age structures. For example, Italian, Greek and Polish communities have a large proportion of older people, whereas Chinese, Indian, Malaysian and Vietnamese communities have a large proportion of young people (Figure 2).
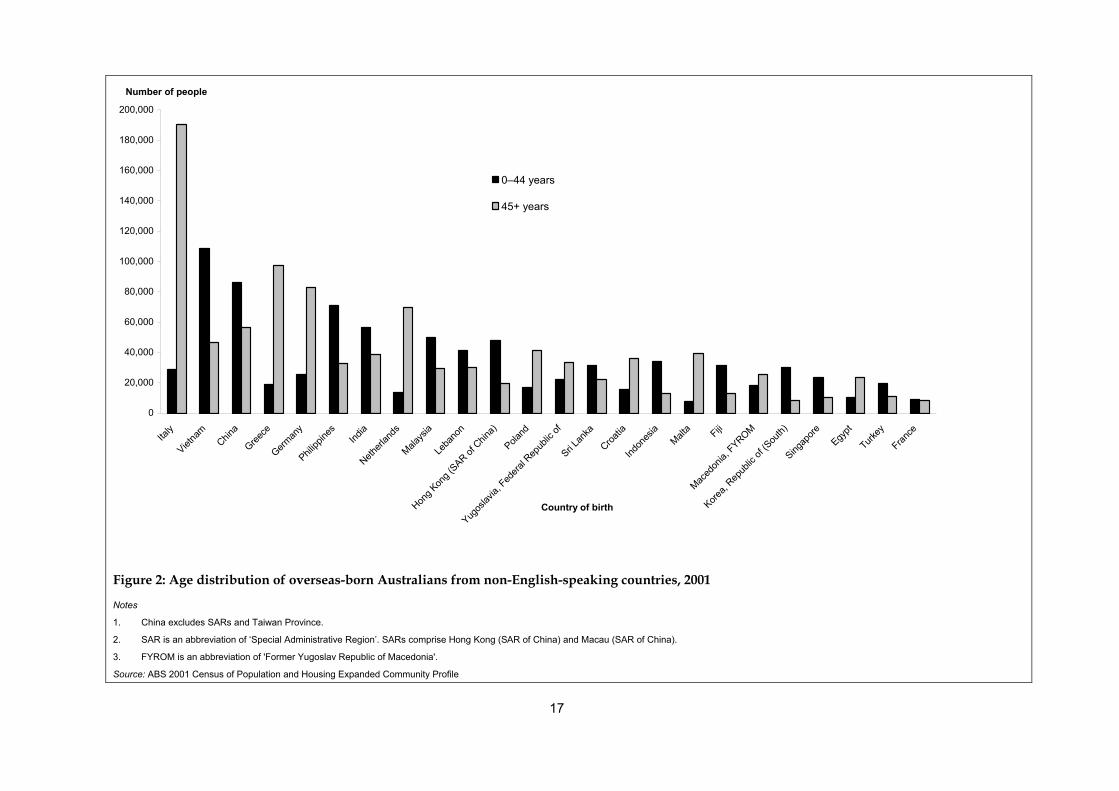
17
0
20,000
40,000
60,000
80,000
100,000
120,000
140,000
160,000
180,000
200,000
Italy
Vietna
m
China
Greece
German
yPhil
ippine
s
India
Netherl
ands
Malays
iaLe
bano
n
Hong K
ong (
SAR of C
hina)
Poland
Yugos
lavia,
Federa
l Rep
ublic
ofSri L
anka
Croatia
Indon
esia
Malta Fiji
Maced
onia,
FYROM
Korea,
Repub
lic of
(Sou
th)Sing
apore
Egypt
Turkey
France
Country of birth
Number of people
0–44 years
45+ years
Figure 2: Age distribution of overseas-born Australians from non-English-speaking countries, 2001
Notes
1. China excludes SARs and Taiwan Province.
2. SAR is an abbreviation of ‘Special Administrative Region’. SARs comprise Hong Kong (SAR of China) and Macau (SAR of China).
3. FYROM is an abbreviation of 'Former Yugoslav Republic of Macedonia'.
Source: ABS 2001 Census of Population and Housing Expanded Community Profile
18
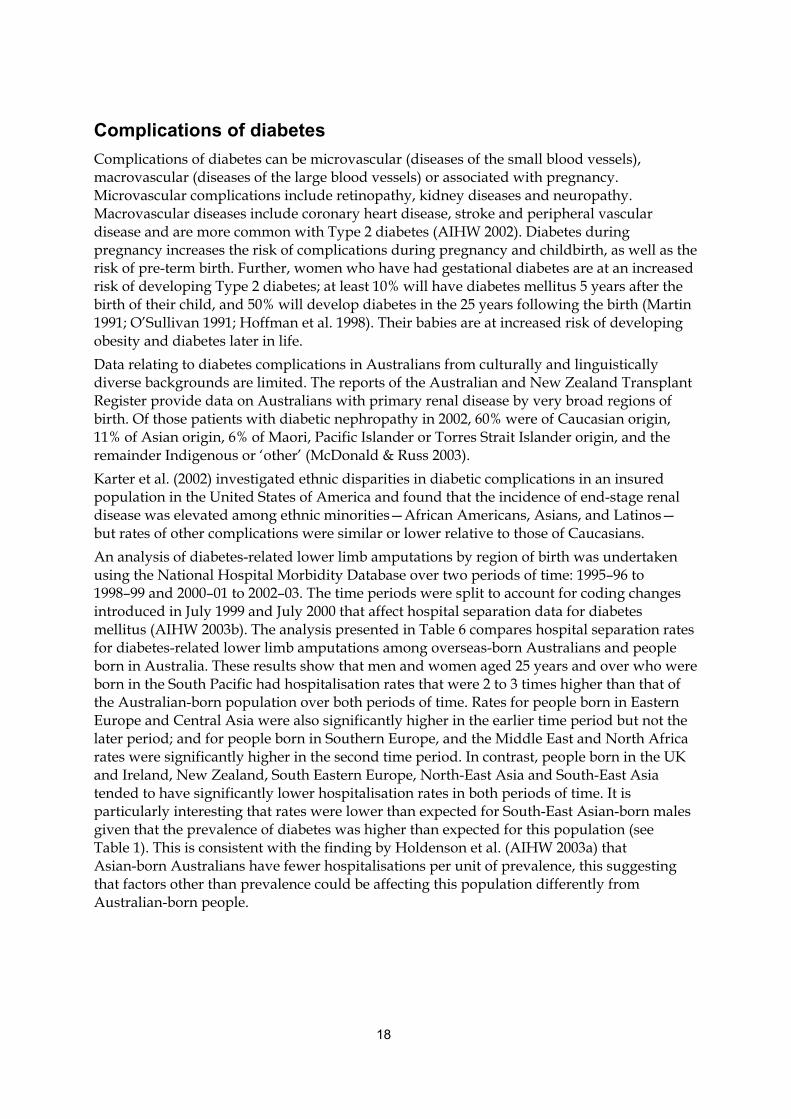
Complications of diabetes Complications of diabetes can be microvascular (diseases of the small blood vessels), macrovascular (diseases of the large blood vessels) or associated with pregnancy. Microvascular complications include retinopathy, kidney diseases and neuropathy. Macrovascular diseases include coronary heart disease, stroke and peripheral vascular disease and are more common with Type 2 diabetes (AIHW 2002). Diabetes during pregnancy increases the risk of complications during pregnancy and childbirth, as well as the risk of pre-term birth. Further, women who have had gestational diabetes are at an increased risk of developing Type 2 diabetes; at least 10% will have diabetes mellitus 5 years after the birth of their child, and 50% will develop diabetes in the 25 years following the birth (Martin 1991; O’Sullivan 1991; Hoffman et al. 1998). Their babies are at increased risk of developing obesity and diabetes later in life. Data relating to diabetes complications in Australians from culturally and linguistically diverse backgrounds are limited. The reports of the Australian and New Zealand Transplant Register provide data on Australians with primary renal disease by very broad regions of birth. Of those patients with diabetic nephropathy in 2002, 60% were of Caucasian origin, 11% of Asian origin, 6% of Maori, Pacific Islander or Torres Strait Islander origin, and the remainder Indigenous or ‘other’ (McDonald & Russ 2003). Karter et al. (2002) investigated ethnic disparities in diabetic complications in an insured population in the United States of America and found that the incidence of end-stage renal disease was elevated among ethnic minorities—African Americans, Asians, and Latinos—but rates of other complications were similar or lower relative to those of Caucasians. An analysis of diabetes-related lower limb amputations by region of birth was undertaken using the National Hospital Morbidity Database over two periods of time: 1995–96 to 1998–99 and 2000–01 to 2002–03. The time periods were split to account for coding changes introduced in July 1999 and July 2000 that affect hospital separation data for diabetes mellitus (AIHW 2003b). The analysis presented in Table 6 compares hospital separation rates for diabetes-related lower limb amputations among overseas-born Australians and people born in Australia. These results show that men and women aged 25 years and over who were born in the South Pacific had hospitalisation rates that were 2 to 3 times higher than that of the Australian-born population over both periods of time. Rates for people born in Eastern Europe and Central Asia were also significantly higher in the earlier time period but not the later period; and for people born in Southern Europe, and the Middle East and North Africa rates were significantly higher in the second time period. In contrast, people born in the UK and Ireland, New Zealand, South Eastern Europe, North-East Asia and South-East Asia tended to have significantly lower hospitalisation rates in both periods of time. It is particularly interesting that rates were lower than expected for South-East Asian-born males given that the prevalence of diabetes was higher than expected for this population (see Table 1). This is consistent with the finding by Holdenson et al. (AIHW 2003a) that Asian-born Australians have fewer hospitalisations per unit of prevalence, this suggesting that factors other than prevalence could be affecting this population differently from Australian-born people.
19
Table 6: Standardised separation ratios(a) for diabetes-related lower limb amputations by region of birth, people aged 25 years and over, 1995–2004
1995–96 to 1998–99 2000–01 to 2003–04
Region of birth Males Females Persons Males Females Persons
South Pacific 2.7* 3.1* 2.9* 2.1* 3.4* 2.5*
Southern Europe 1.1 1.3 1.2 1.1* 1.4* 1.2*
Eastern Europe & Central Asia 1.4* 1.2 1.3*
1.0 1.3* 1.1
Sub-Saharan Africa 0.4 0.6 0.5 1.3 0.9 1.2
Middle East & North Africa 0.9 1.5 1.1 1.0 1.1 1.0
Northern Europe 1.1 0.8 1.0 1.1 1.3 1.1
Australia 1.0 1.0 1.0 1.0 1.0 1.0
Western Europe 0.8 1.0 0.9 0.9* 1.2* 1.0
South Eastern Europe 0.9 1.1 1.0 0.9* 1.1 0.9
UK & Ireland 0.7* 0.6* 0.7* 0.7* 0.7* 0.7*
Southern Asia 0.7 0.7 0.7 0.8* 0.6* 0.7*
South & Central America & Caribbean 0.8 0.3 0.6
0.5* 0.9 0.6*
New Zealand 0.5* 0.6 0.5* 0.8* 0.4* 0.7*
Northern America 0.7 1.0 0.7 0.5* 1.0 0.7*
North-East Asia 0.3* 0.5 0.4* 0.2* 0.3* 0.3*
South-East Asia 0.3* 0.5 0.4* 0.3* 0.4* 0.4*
* Significantly different from 1.0 (Australian-born) at the 5% level of significance.
(a) Indirectly age-standardised to the Australian-born male and female populations in 1995–96 to 1998–99 and 2000–01 to 2003–04. The standardised separation ratio is the ratio of the observed number of hospital separations to the number expected if overseas-born Australians experienced the same age-sex-specific hospital separation rates as the Australian born population.
Source: AIHW National Hospital Morbidity Database.
Although there is some evidence that certain overseas-born women are at high risk of GDM (Hsu-Hage & Yang 1999), there are limited data available regarding the impact of ethnicity on the development of complications of GDM. Factors that contribute to the development of complications in people with diabetes include age and possibly sex and genetic factors (AIHW 2002). Modifiable factors include obesity, physical activity, high blood pressure, high cholesterol, tobacco smoking, hyperglycaemia, poor management of diabetes and a lack of access to appropriate care. Another important factor in the development of complications is the duration of diabetes. In addition to the data on obesity, physical activity and age discussed above, Australians from culturally and linguistically diverse backgrounds appear to be at a high risk for complications of diabetes principally because they may face many barriers in accessing health care services (DiFrancesco et al. 1999; von Hofe et al. 2002). These barriers include language barriers and literacy rates, effects of stigmatisation, lack of access to culturally specific care, religious beliefs and cultural practices. Language is one of the primary barriers to Australians from culturally and linguistically diverse backgrounds benefiting from health care services. This has been found in many language groups, particularly in relation to diabetes care in Italian, Spanish, Vietnamese, Russian, and Chinese communities (Worthington Di Marzio & Cultural Partners Australia 2001; von Hofe et al. 2002; Powell et al. 2003).
20
In addition, people are often reluctant to admit that they are illiterate, and some may be illiterate in their native language as well as in English. For example, Cameron (2002) provides a case study of a general practitioner who provided information to Vietnamese women on GDM, in Vietnamese, but when he later asked the women about the information they were not able to answer his questions. He concluded that because for many of them their country was war-torn at the time they would have been at school, their ability to read—even in their own language—was limited. Limited education may also affect their understanding of how the body works and the effects of diabetes. Illiteracy may also affect peoples’ ability to self-monitor their diabetes as they are unable to read written instructions accompanying monitoring devices (Cameron 2002). This might leave them vulnerable to complications arising from poorly controlled diabetes but this would depend on the way that diabetes education is provided to them by health professionals.
The impact of religious and cultural factors on diabetes risk and care Diabetes care for Australians from culturally and linguistically diverse backgrounds may also have to take into account cultural or religious practices that affect patients’ ability to self-manage diabetes or to comply with advice from health care providers. These communities may be proficient in English, but nevertheless may have trouble communicating their needs to health care providers. A common issue encountered by professionals providing diabetes care is that of Muslims desiring to fast during Ramadan. Much of this literature is UK-based, but as there are over 280,000 Islamic people in Australia (ABS 2002a), this may be a relevant issue. Fasting, if done carefully, can be safe for people with diabetes (Burden 2001; Khodabukus 2003). However, it has been documented that some Islamic people avoid contact with their health professional at this time due to fear of being told not to fast (Burden 2001). Cultural factors can also influence peoples’ ability to self-manage their diabetes. For example, South Pacific Islanders and people from sub-Saharan Africa have often been taught that being overweight is a sign of wealth or happiness (IDI 2000; Renzaho 2004). Also, Ethiopian people have culturally based perceptions of the causes of diabetes, such as psychosocial factors (e.g. worry or stress) or being wealthy (Rozman 2001). Australians from culturally and linguistically diverse backgrounds may also be at risk of poor management of diabetes, resulting in an increased risk of complications, because culture can be a determinant of motivational factors for self-management. For example, a housewife born in Southern Europe may not be motivated to self-manage her diabetes if she is simply told that it will help her to stay well, but if it is pointed out that by staying well—controlling her diabetes—she will be better able to look after her household, then this may provide more relevant motivation (Cameron 2002). Economic constraints may also cause problems for Australians from culturally and linguistically diverse backgrounds in managing their diabetes, particularly for a working man or woman (often the only wage-earner in the family) with poor English. Such people may also fear job loss resulting from taking time off work to seek diagnosis and advice (Conquest 2001). Culturally specific health education, such as information brochures, can assist understanding of diabetes management and attendance at appointments (Burden 2001; Naeem 2003).
21
3 Demographic characteristics of culturally and linguistically diverse groups at high risk for diabetes
Scope Demographic information about Australians from culturally and linguistically diverse backgrounds is presented here on the basis of language spoken at home, because the project is intended for educational and information dissemination purposes. The data reported here have come from CDATA 2001, which is a geographic information system mapping program combined with the 2001 Census data developed jointly by the ABS and MapInfo Australia. It should be noted that CDATA 2001 provides information for only the top 32 language groups. Additional data have been obtained from Dr Sandra Kipp (see Appendix A for details). High risk Australians from culturally and linguistically diverse backgrounds have been identified using the information on prevalence and risk presented above, which has been summarised in the tables contained in Appendix C (Tables A8 to A17). A brief summary of the primary locations of these populations is outlined below, with the location of communities from culturally and linguistically diverse backgrounds given at the state and Statistical Subdivision (SSD) level.
Languages other than English spoken at home In 2001, the 20 most commonly reported languages other than English spoken at home were (in order of frequency) Italian, Greek, Cantonese, Arabic (including Lebanese), Vietnamese, Mandarin, Spanish, Tagalog (Filipino)1, German, Macedonian, Croatian, Polish, Turkish, Serbian, Hindi, Maltese, Dutch, French, Korean and Indonesian. Together these 20 languages accounted for over three-quarters of all languages other than English spoken at home.
Proficiency in spoken English Since 1981, the Census of Population and Housing has included a question about proficiency in spoken English for those people who speak a language other than English at home. In 2001, the majority of people who spoke a language other than English at home also reported speaking English ‘well’ or ‘very well’ (Table 7). However, there were certain groups with quite low proficiency in English, particularly people speaking Asian languages. ABS 2001 Census data by sex indicate that overall, women were much more likely than men to report speaking English ‘not well’ or ‘not at all’. Further, for some language groups, particularly European languages, the proportion of people aged 45 years and over who reported having a low proficiency in spoken English was very high (Table 7). This has implications for education and preventive strategies for this very high-risk group. It should be noted that the assessment of how well a person speaks English is subjective and depends on how the respondent interprets the question or how a person who answers for the respondent assesses the respondent’s proficiency in English (ABS 1999).
1 In the census, the category Tagalog includes the Filipino language and it is not possible to disaggregate the two. Filipino is the planned
national language of the Philippines, based largely but not solely on Tagalog. Tagalog is the most widely used of the 85 Filipino languages and the regional language of the area around Manila. Note that there are also other Filipino languages that have been coded separately.
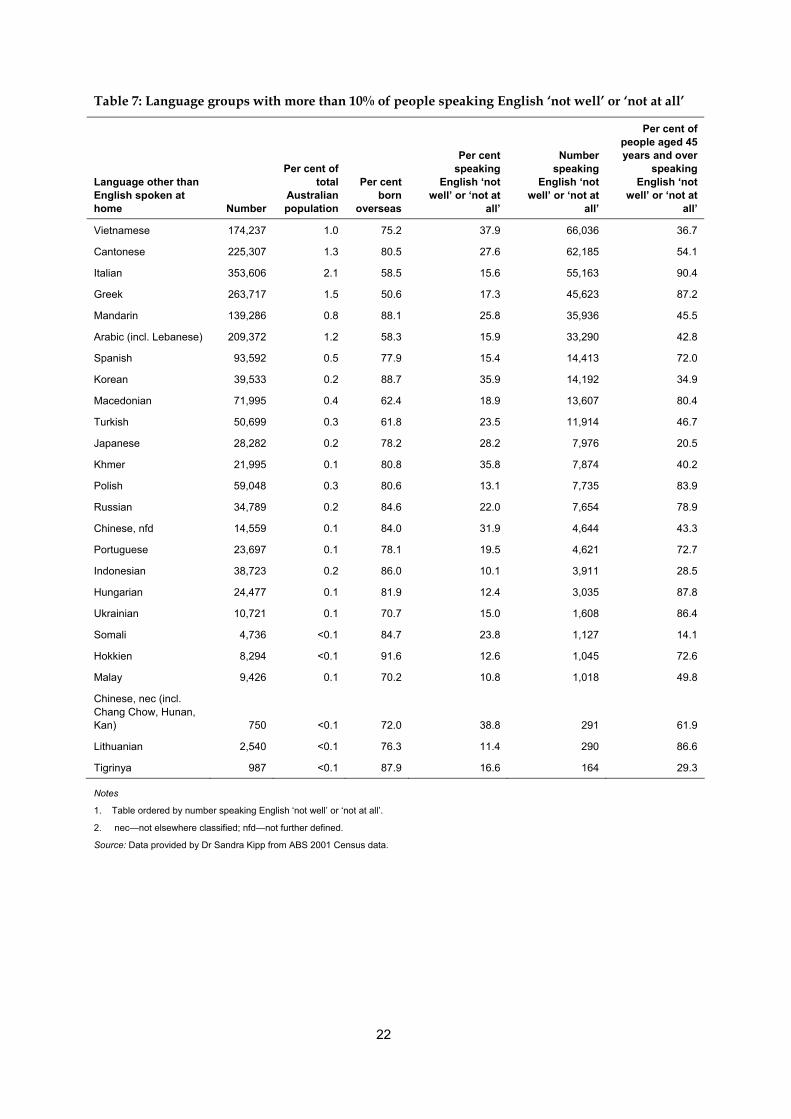
22
Table 7: Language groups with more than 10% of people speaking English ‘not well’ or ‘not at all’
Language other than English spoken at home Number
Per cent of total
Australian population
Per cent born
overseas
Per cent speaking
English ‘not well’ or ‘not at
all’
Number speaking
English ‘not well’ or ‘not at
all’
Per cent of people aged 45 years and over
speaking English ‘not
well’ or ‘not at all’
Vietnamese 174,237 1.0 75.2 37.9 66,036 36.7
Cantonese 225,307 1.3 80.5 27.6 62,185 54.1
Italian 353,606 2.1 58.5 15.6 55,163 90.4
Greek 263,717 1.5 50.6 17.3 45,623 87.2
Mandarin 139,286 0.8 88.1 25.8 35,936 45.5
Arabic (incl. Lebanese) 209,372 1.2 58.3 15.9 33,290 42.8
Spanish 93,592 0.5 77.9 15.4 14,413 72.0
Korean 39,533 0.2 88.7 35.9 14,192 34.9
Macedonian 71,995 0.4 62.4 18.9 13,607 80.4
Turkish 50,699 0.3 61.8 23.5 11,914 46.7
Japanese 28,282 0.2 78.2 28.2 7,976 20.5
Khmer 21,995 0.1 80.8 35.8 7,874 40.2
Polish 59,048 0.3 80.6 13.1 7,735 83.9
Russian 34,789 0.2 84.6 22.0 7,654 78.9
Chinese, nfd 14,559 0.1 84.0 31.9 4,644 43.3
Portuguese 23,697 0.1 78.1 19.5 4,621 72.7
Indonesian 38,723 0.2 86.0 10.1 3,911 28.5
Hungarian 24,477 0.1 81.9 12.4 3,035 87.8
Ukrainian 10,721 0.1 70.7 15.0 1,608 86.4
Somali 4,736 <0.1 84.7 23.8 1,127 14.1
Hokkien 8,294 <0.1 91.6 12.6 1,045 72.6
Malay 9,426 0.1 70.2 10.8 1,018 49.8
Chinese, nec (incl. Chang Chow, Hunan, Kan) 750 <0.1 72.0 38.8 291 61.9
Lithuanian 2,540 <0.1 76.3 11.4 290 86.6
Tigrinya 987 <0.1 87.9 16.6 164 29.3
Notes
1. Table ordered by number speaking English ‘not well’ or ‘not at all’.
2. nec—not elsewhere classified; nfd—not further defined.
Source: Data provided by Dr Sandra Kipp from ABS 2001 Census data.
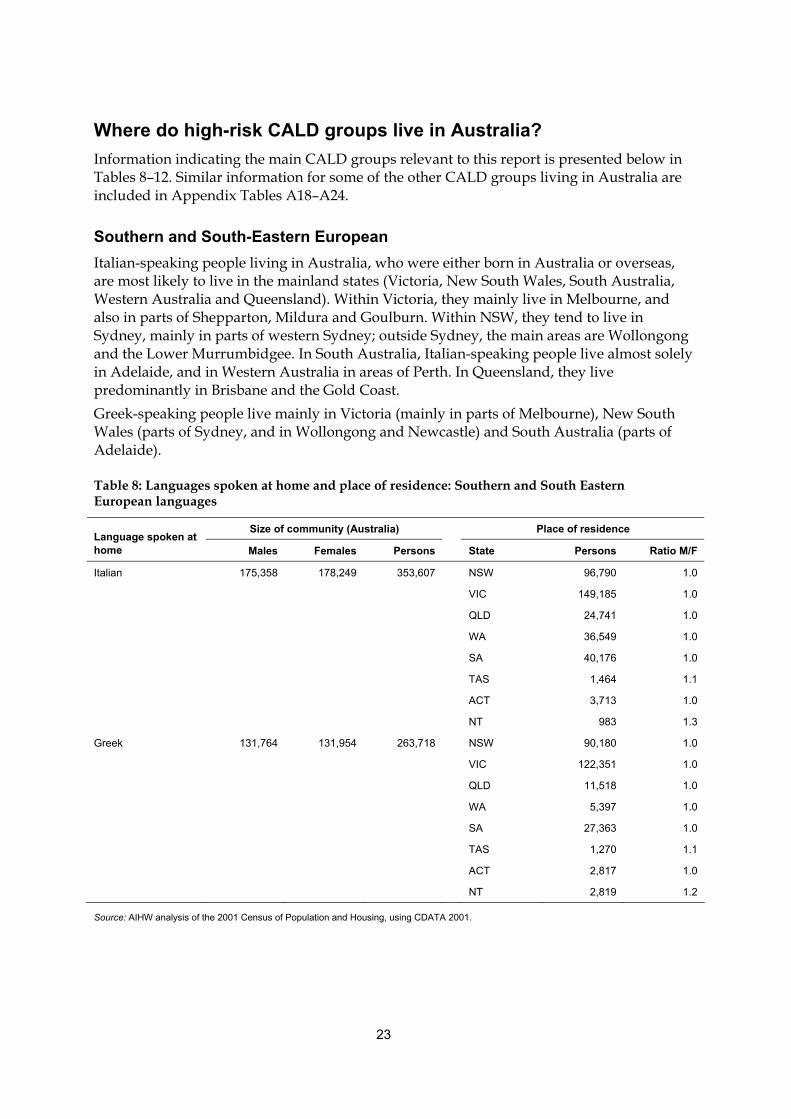
23
Where do high-risk CALD groups live in Australia? Information indicating the main CALD groups relevant to this report is presented below in Tables 8–12. Similar information for some of the other CALD groups living in Australia are included in Appendix Tables A18–A24.
Southern and South-Eastern European Italian-speaking people living in Australia, who were either born in Australia or overseas, are most likely to live in the mainland states (Victoria, New South Wales, South Australia, Western Australia and Queensland). Within Victoria, they mainly live in Melbourne, and also in parts of Shepparton, Mildura and Goulburn. Within NSW, they tend to live in Sydney, mainly in parts of western Sydney; outside Sydney, the main areas are Wollongong and the Lower Murrumbidgee. In South Australia, Italian-speaking people live almost solely in Adelaide, and in Western Australia in areas of Perth. In Queensland, they live predominantly in Brisbane and the Gold Coast. Greek-speaking people live mainly in Victoria (mainly in parts of Melbourne), New South Wales (parts of Sydney, and in Wollongong and Newcastle) and South Australia (parts of Adelaide).
Table 8: Languages spoken at home and place of residence: Southern and South Eastern European languages
Size of community (Australia) Place of residence Language spoken at home Males Females Persons State Persons Ratio M/F
Italian 175,358 178,249 353,607 NSW 96,790 1.0
VIC 149,185 1.0
QLD 24,741 1.0
WA 36,549 1.0
SA 40,176 1.0
TAS 1,464 1.1
ACT 3,713 1.0
NT 983 1.3
Greek 131,764 131,954 263,718 NSW 90,180 1.0
VIC 122,351 1.0
QLD 11,518 1.0
WA 5,397 1.0
SA 27,363 1.0
TAS 1,270 1.1
ACT 2,817 1.0
NT 2,819 1.2
Source: AIHW analysis of the 2001 Census of Population and Housing, using CDATA 2001.
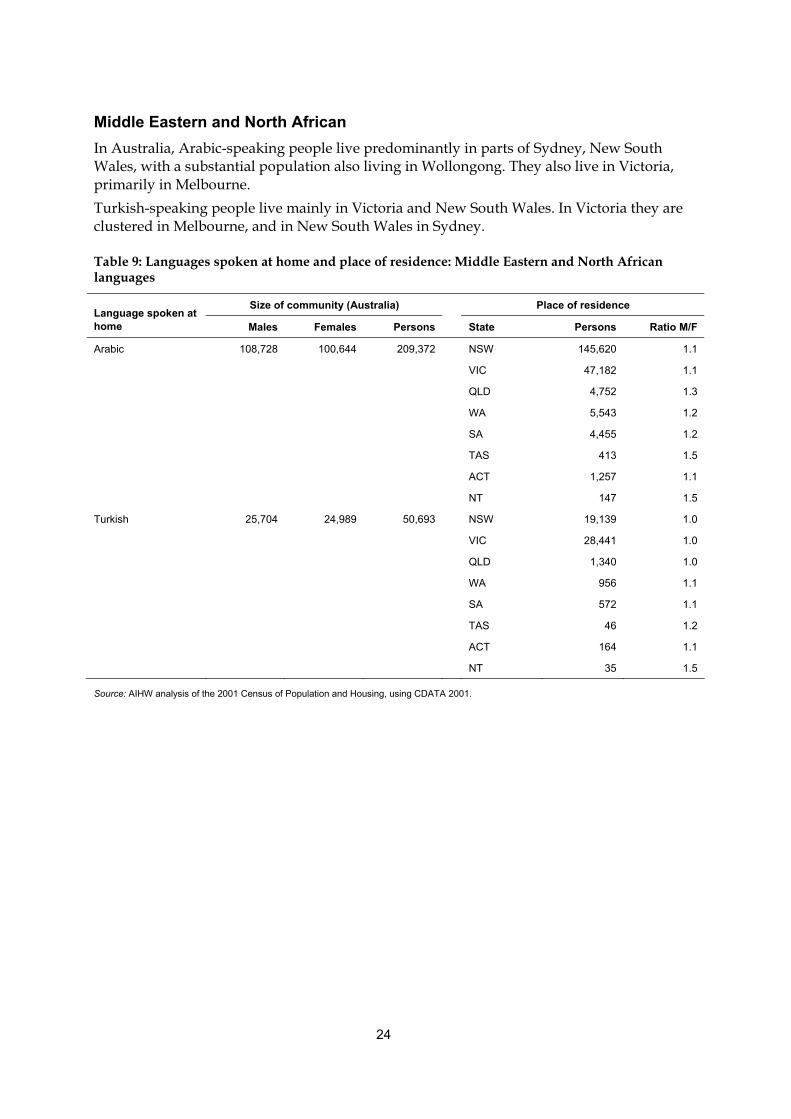
24
Middle Eastern and North African In Australia, Arabic-speaking people live predominantly in parts of Sydney, New South Wales, with a substantial population also living in Wollongong. They also live in Victoria, primarily in Melbourne. Turkish-speaking people live mainly in Victoria and New South Wales. In Victoria they are clustered in Melbourne, and in New South Wales in Sydney.
Table 9: Languages spoken at home and place of residence: Middle Eastern and North African languages
Size of community (Australia) Place of residence Language spoken at home Males Females Persons State Persons Ratio M/F
Arabic 108,728 100,644 209,372 NSW 145,620 1.1
VIC 47,182 1.1
QLD 4,752 1.3
WA 5,543 1.2
SA 4,455 1.2
TAS 413 1.5
ACT 1,257 1.1
NT 147 1.5
Turkish 25,704 24,989 50,693 NSW 19,139 1.0
VIC 28,441 1.0
QLD 1,340 1.0
WA 956 1.1
SA 572 1.1
TAS 46 1.2
ACT 164 1.1
NT 35 1.5
Source: AIHW analysis of the 2001 Census of Population and Housing, using CDATA 2001.
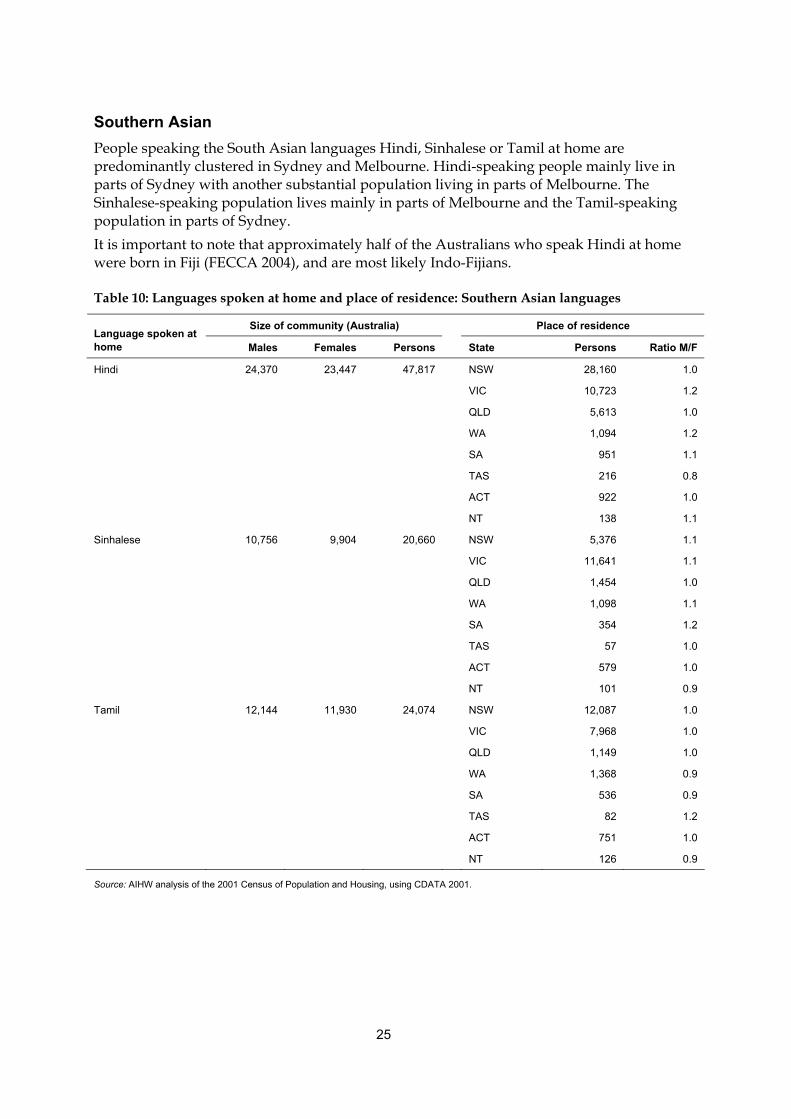
25
Southern Asian People speaking the South Asian languages Hindi, Sinhalese or Tamil at home are predominantly clustered in Sydney and Melbourne. Hindi-speaking people mainly live in parts of Sydney with another substantial population living in parts of Melbourne. The Sinhalese-speaking population lives mainly in parts of Melbourne and the Tamil-speaking population in parts of Sydney. It is important to note that approximately half of the Australians who speak Hindi at home were born in Fiji (FECCA 2004), and are most likely Indo-Fijians.
Table 10: Languages spoken at home and place of residence: Southern Asian languages
Size of community (Australia) Place of residence Language spoken at home Males Females Persons State Persons Ratio M/F
Hindi 24,370 23,447 47,817 NSW 28,160 1.0
VIC 10,723 1.2
QLD 5,613 1.0
WA 1,094 1.2
SA 951 1.1
TAS 216 0.8
ACT 922 1.0
NT 138 1.1
Sinhalese 10,756 9,904 20,660 NSW 5,376 1.1
VIC 11,641 1.1
QLD 1,454 1.0
WA 1,098 1.1
SA 354 1.2
TAS 57 1.0
ACT 579 1.0
NT 101 0.9
Tamil 12,144 11,930 24,074 NSW 12,087 1.0
VIC 7,968 1.0
QLD 1,149 1.0
WA 1,368 0.9
SA 536 0.9
TAS 82 1.2
ACT 751 1.0
NT 126 0.9
Source: AIHW analysis of the 2001 Census of Population and Housing, using CDATA 2001.
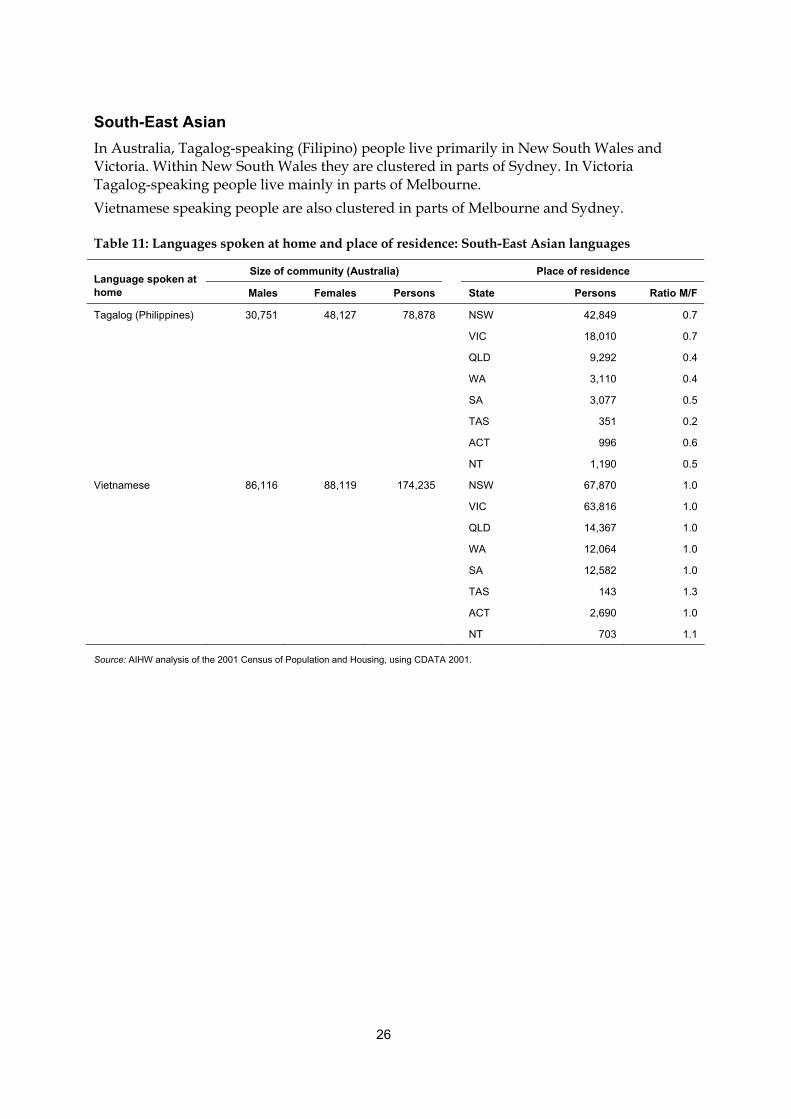
26
South-East Asian In Australia, Tagalog-speaking (Filipino) people live primarily in New South Wales and Victoria. Within New South Wales they are clustered in parts of Sydney. In Victoria Tagalog-speaking people live mainly in parts of Melbourne. Vietnamese speaking people are also clustered in parts of Melbourne and Sydney.
Table 11: Languages spoken at home and place of residence: South-East Asian languages
Size of community (Australia) Place of residence Language spoken at home Males Females Persons State Persons Ratio M/F
Tagalog (Philippines) 30,751 48,127 78,878 NSW 42,849 0.7
VIC 18,010 0.7
QLD 9,292 0.4
WA 3,110 0.4
SA 3,077 0.5
TAS 351 0.2
ACT 996 0.6
NT 1,190 0.5
Vietnamese 86,116 88,119 174,235 NSW 67,870 1.0
VIC 63,816 1.0
QLD 14,367 1.0
WA 12,064 1.0
SA 12,582 1.0
TAS 143 1.3
ACT 2,690 1.0
NT 703 1.1
Source: AIHW analysis of the 2001 Census of Population and Housing, using CDATA 2001.
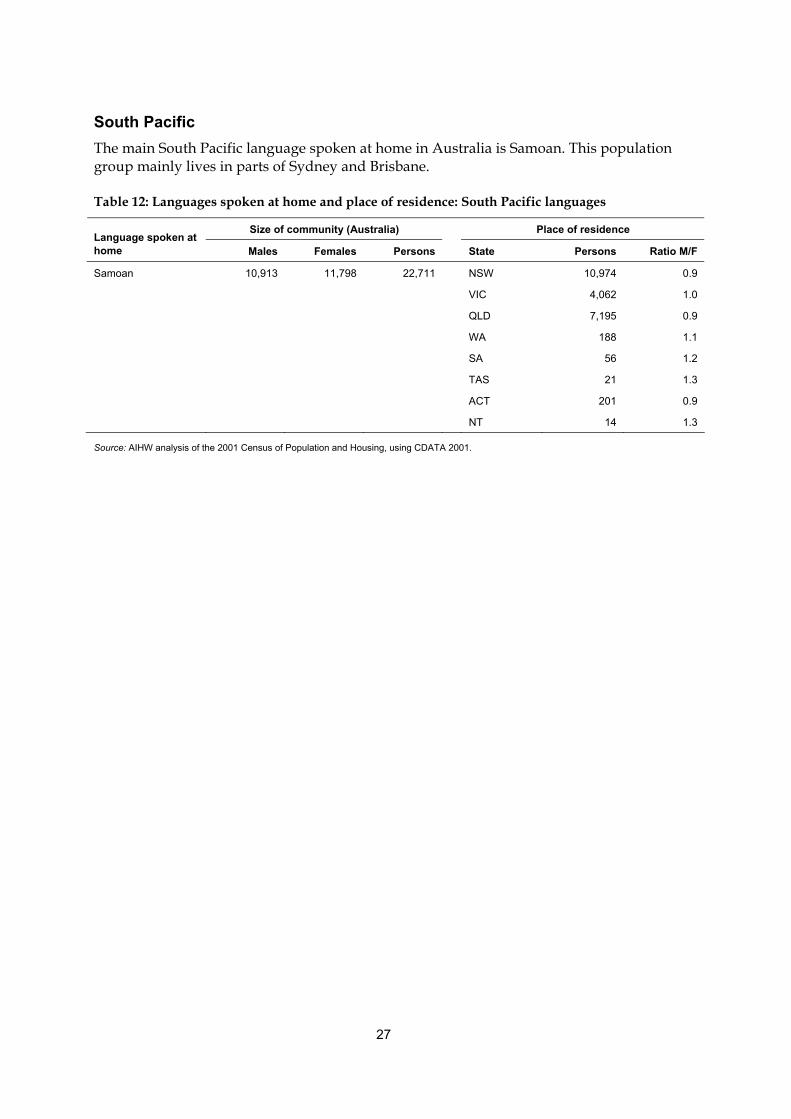
27
South Pacific The main South Pacific language spoken at home in Australia is Samoan. This population group mainly lives in parts of Sydney and Brisbane.
Table 12: Languages spoken at home and place of residence: South Pacific languages
Size of community (Australia) Place of residence Language spoken at home Males Females Persons State Persons Ratio M/F
Samoan 10,913 11,798 22,711 NSW 10,974 0.9
VIC 4,062 1.0
QLD 7,195 0.9
WA 188 1.1
SA 56 1.2
TAS 21 1.3
ACT 201 0.9
NT 14 1.3
Source: AIHW analysis of the 2001 Census of Population and Housing, using CDATA 2001.
28
4 Gaps and recommendations This section identifies the main gaps and limitations in the national data available for this report, and proposes some changes that could address these limitations. Here the focus is on data that are particularly useful for disease monitoring and for service provision. There may also be a need for more detailed information not covered here, but that is outside the scope of this report. It is likely that much of this more detailed information would be best collected in targeted research projects, rather than through national data collections.
Gaps in data/literature The crucial gap in the available data and literature is that of specific diabetes prevalence rates for culturally and linguistically diverse (CALD) communities. While the regional data available from the NHS are helpful, it is apparent that there may be variations in diabetes prevalence within these regions. In addition, there are some regions which were grouped or cannot be separately identified in the 2001 National Health Survey (either because of small sample sizes or possibly because they were not represented at all) and as a result there are no country-specific prevalence rates for these regions. These regions include Southern Europe, Eastern Europe, Central Asia, North Africa, the Middle East, North Asia and the South Pacific. Similarly, there is little data on gestational diabetes mellitus among these populations. In addition, some overseas-born groups have a large representation in the Australian population and appear to be at a high risk of diabetes, but as noted above do not have any specific diabetes prevalence data available; for example, people born in Vietnam, Lebanon, the Philippines and India. Similarly, there is little existing literature or data for population subgroups in communities that appear to be at high risk, such as North African populations. The communities that have the least available data and which may have a high risk of diabetes include North African immigrants, Sub-Saharan African immigrants (particularly refugees), South American immigrants, and small immigrant communities from countries such as Mauritius. Another major gap in the available data regarding CALD Australians is that the prevalence of diabetes based on measured blood glucose in these groups is not known. The 1999–2000 AusDiab study, which collected this information for the Australian population, was not specifically designed to provide information for CALD groups. The sample size for people born overseas is therefore insufficient to be able to analyse these data by country of birth, or even region. It would be helpful to be able to determine whether there is not only a higher prevalence of known diabetes in these groups, but also a higher prevalence of undiagnosed diabetes. Finding out which groups are most at risk from undiagnosed diabetes would assist in targeting those at highest risk. There is also little information on the prevalence of diabetes complications by CALD groups. For example, Payne (2000) investigated the rate of lower limb amputations due to diabetes, but was unable to report data from all states and territories regarding country of birth. To clearly identify particular CALD communities, quite detailed data on language proficiency and particular cultural attributes would be needed. However, such detailed information is unlikely to be available in most national data collections, and is more appropriately examined through detailed research studies. Where possible throughout this
29
report, information has been presented based on main or preferred language spoken. This does provide valuable information relevant to CALD groups. However, some data collections do not contain this information (such as the national hospital data), though many do contain information on country of birth. While census information allows identification of people who speak a language other than English at home, it does not specify whether that language is the main or preferred language.
Recommendations This section outlines suggested changes to resolve some of the gaps identified in the previous section. The relative importance of these suggestions against each other and against other priorities in health information is outside the scope of this report. The main gaps identified above and potential ways these could be improved are outlined below. • Lack of prevalence data:
- Data on prevalence could be obtained either through population-based studies, or studies focusing on specific CALD communities, or a combination of both. For example, it may be appropriate to further identify regions at risk using population-based studies, and then identify more specific high-risk communities as a second stage. Potentially, over-sampling of high-risk groups in regular health surveys could fill this gap.
- Some information indirectly related to prevalence could be obtained through health service data such as hospital admissions, and use of other relevant services such as interpreter services. However, the information would be affected by service use patterns (e.g. some CALD groups may be less likely to seek and obtain specific services) and cannot be directly regarded as prevalence information. In addition, much of this information is not available by main language spoken, but is available by country of birth.
- Another valuable source of information related to prevalence could come from the most recent version of the NDSS registration form. That form contains a field ‘Main language spoken at home’, which if filled out accurately would provide a very valuable addition to the currently available information.
- As the National Diabetes Register (NDR) becomes more established, the number of people on the NDR who are still alive will be able to be used to supplement prevalence data, and eventually provide a measure of prevalence for insulin-treated diabetes.
• Lack of data on complications from diabetes: - This information for particular populations is usually collected as part of a specific
diabetes survey. In order to obtain information on particular CALD groups, oversampling or surveys targeted specifically at these groups would need to be undertaken.
- Some relevant information could be obtained from health service data, such as hospitalisations.
• Lack of data on ‘measured’ diabetes: - Oversampling or surveys targeted specifically at these groups would need to be
undertaken to fill this gap.
30
• Lack of information to clearly specify particular CALD communities: - For national monitoring and service provision information, a potential strategy
would be to collect information on an individual’s preferred language or language spoken at home, in addition to information on country of birth. Consideration of this issue could be taken up by some of the main administrative data collections, such as the national hospital data.
31
Appendix A: Data sources
Australian Bureau of Statistics 1995 and 2001 National Health Surveys The 1995 and 2001 National Health Surveys were conducted by the ABS. They were designed to obtain national information on the health status of Australians, their use of health services and facilities, and health-related aspects of their lifestyle. The 1995 survey collected information from a sample of 57,600 people (ABS 1996) and the 2001 survey collected information from approximately 26,900 respondents (ABS 2002b).
Australian Bureau of Statistics 2001 Census of Population and Housing The 2001 Census of Population and Housing was conducted by the ABS. Its objective was to measure the number and key characteristics of people in Australia on census night (7 August 2001). Census data were obtained from the CDATA 2001 Expanded Community Profile software, held by the Australian Institute of Health and Welfare, and from Dr Sandra Kipp, a member of the Steering Committee, who provided further tables regarding language spoken at home and country of birth.
Australian Diabetes, Obesity and Lifestyle Study (AusDiab Study) The AusDiab Study was conducted in 1999–2000, by the International Diabetes Institute and was partially funded by the then Commonwealth Department of Health and Aged Care. It is the most comprehensive survey to date on the prevalence and impact of diabetes. The survey collected information on self-reported and measured diabetes and cardiovascular risk factors, health knowledge, attitudes, and health service utilisation and practices. The study collected information from 11,247 adults aged 25 years and over throughout Australia (excluding the Australian Capital Territory).
National Diabetes Register The National Diabetes Register, held at the Australian Institute of Health and Welfare, is a database that holds information about people who use insulin as part of their treatment of diabetes. It includes people who began to use insulin from 1 January 1999. Data for the register are obtained from two main sources: the National Diabetes Services Scheme, administered by Diabetes Australia, and the Australasian Paediatric Endocrine Group State-based registers. At December 2001, the register contained information on approximately 23,000 people.
32
National Mortality Database The National Mortality Database, held at the AIHW, contains information on the cause of death supplied by the medical practitioner certifying the death or by a coroner. Registration of deaths is the responsibility of the state and territory Registrars of Births, Deaths and Marriages. Registrars provide the information to the ABS for coding of cause of death using the International Statistical Classification of Diseases and Related Health Problems (ICD) codes (WHO 1992) and compilation into aggregate statistics. On 1 January 1997, the ABS introduced automatic coding software, which is used to code multiple causes of deaths.
National Hospital Morbidity Database The National Hospital Morbidity Database contains demographic, diagnostic, procedural and duration of stay information on episodes of care for patients admitted to hospital. The data items are supplied by state and territory health authorities to the AIHW for storage and custodianship. The database provides information on the number of hospitalisations for a particular condition or procedure and therefore it is not possible to count patients individually. These data are classified using the ICD-9-CM (Australian edition) (1993–94 to 1998–99) and ICD-10-AM (1999–00 to 2003–04) for principal or additional diagnoses of diabetes. Diabetes mellitus is represented in ICD-9-CM by category 250 and in ICD-10-AM by categories E10, E11, E13 and E14. It should be noted that there was a change in coding practice in 1999–00, which makes direct comparison with prior years problematic.
33
Appendix B: Methods
Age-standardised rates Age-standardised rates are used to remove the influence of age when comparing populations with different age structures by applying age-specific rates to a standard population. This report uses the 2001 Australian population as the standard population and 5-year age groups for age-specific rates.
Direct age standardisation Direct age standardisation is the most common method of age standardisation, and is used in this report for incidence, hospital morbidity and mortality data. The calculation of direct age-standardisation comprises three steps: Step 1: Calculate the age-specific rate for each age group. Step 2: Calculate the expected number of cases in each age group by multiplying the
age-specific rate by the corresponding standard population for each age group. Step 3: Sum the expected number of cases in each age group and divide this sum by the
total of the standard population to give the age-standardised rate.
Indirect age standardisation In situations where populations are small or where there is some uncertainty about the stability of age-specific prevalence rates, indirect standardisation has been used. This effectively removes the influence of the age structure, but does not provide a measure of prevalence in terms of a rate. Rather, the summary measure is a comparison of the number of observed cases compared with the number expected if the age-specific prevalence rates of the standard population are applied to the study population. The method used for this calculation is composed of three steps: Step 1: Calculate the age-specific prevalence rates for each age group in the standard
population. Step 2: Apply these age-specific rates to the number in each age group of the study
population and sum to derive the total expected number of cases for the study population.
Step 3: Sum the observed cases in the study population and divide this number by the expected number derived in Step 2 to calculate the standardised prevalence ratio (SPR).
An SPR of 1 indicates the same number of observed cases as were expected (suggesting rates in the study and standard populations are similar). A result greater than 1 indicates more cases than expected. A result less than 1 indicates fewer cases than expected.
34
Geographical regions The Australian Standard Classification of Countries for Social Statistics (ASCCSS) (ABS 1990) and the Standard Australian Classification of Countries (SACC) (ABS 1998), were used to specify which countries would populate the geographic regions of study. More detail is available from the ABS <www.abs.gov.au>. As the National Health Surveys are conducted by the ABS, they use the ASCCSS and SACC (1995 and 2001 respectively). The AusDiab Study country of birth variable was collected in a text format, and manually mapped to the regions in ASCCSS. In 1999–00, the National Hospital Morbidity Database used ASCCSS to code country of birth. The National Mortality Database also used the ASCCSS during the years of analysis. The National Diabetes Register incidence data used a combination of SACC and ASCCSS.
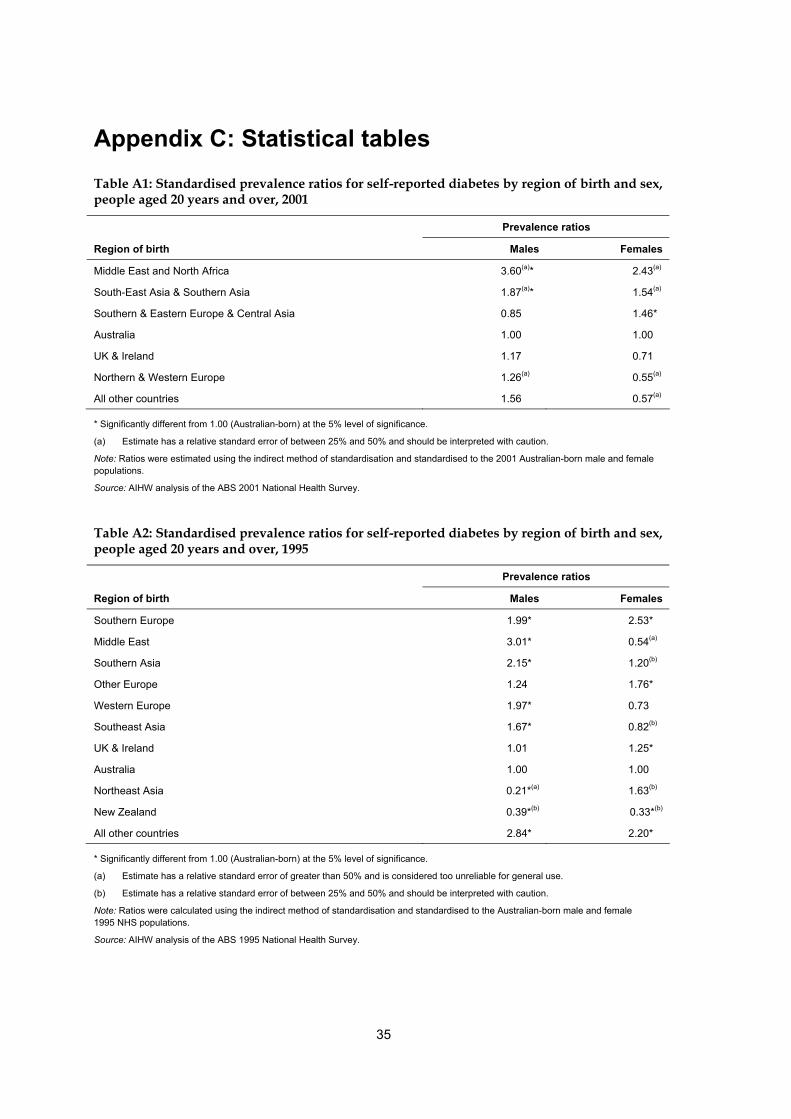
35
Appendix C: Statistical tables Table A1: Standardised prevalence ratios for self-reported diabetes by region of birth and sex, people aged 20 years and over, 2001
Prevalence ratios
Region of birth Males Females
Middle East and North Africa 3.60(a)* 2.43(a)
South-East Asia & Southern Asia 1.87(a)* 1.54(a)
Southern & Eastern Europe & Central Asia 0.85 1.46*
Australia 1.00 1.00
UK & Ireland 1.17 0.71
Northern & Western Europe 1.26(a) 0.55(a)
All other countries 1.56 0.57(a)
* Significantly different from 1.00 (Australian-born) at the 5% level of significance.
(a) Estimate has a relative standard error of between 25% and 50% and should be interpreted with caution.
Note: Ratios were estimated using the indirect method of standardisation and standardised to the 2001 Australian-born male and female populations.
Source: AIHW analysis of the ABS 2001 National Health Survey.
Table A2: Standardised prevalence ratios for self-reported diabetes by region of birth and sex, people aged 20 years and over, 1995
Prevalence ratios
Region of birth Males Females
Southern Europe 1.99* 2.53*
Middle East 3.01* 0.54(a)
Southern Asia 2.15* 1.20(b)
Other Europe 1.24 1.76*
Western Europe 1.97* 0.73
Southeast Asia 1.67* 0.82(b)
UK & Ireland 1.01 1.25*
Australia 1.00 1.00
Northeast Asia 0.21*(a) 1.63(b)
New Zealand 0.39*(b) 0.33*(b)
All other countries 2.84* 2.20*
* Significantly different from 1.00 (Australian-born) at the 5% level of significance.
(a) Estimate has a relative standard error of greater than 50% and is considered too unreliable for general use.
(b) Estimate has a relative standard error of between 25% and 50% and should be interpreted with caution.
Note: Ratios were calculated using the indirect method of standardisation and standardised to the Australian-born male and female 1995 NHS populations.
Source: AIHW analysis of the ABS 1995 National Health Survey.
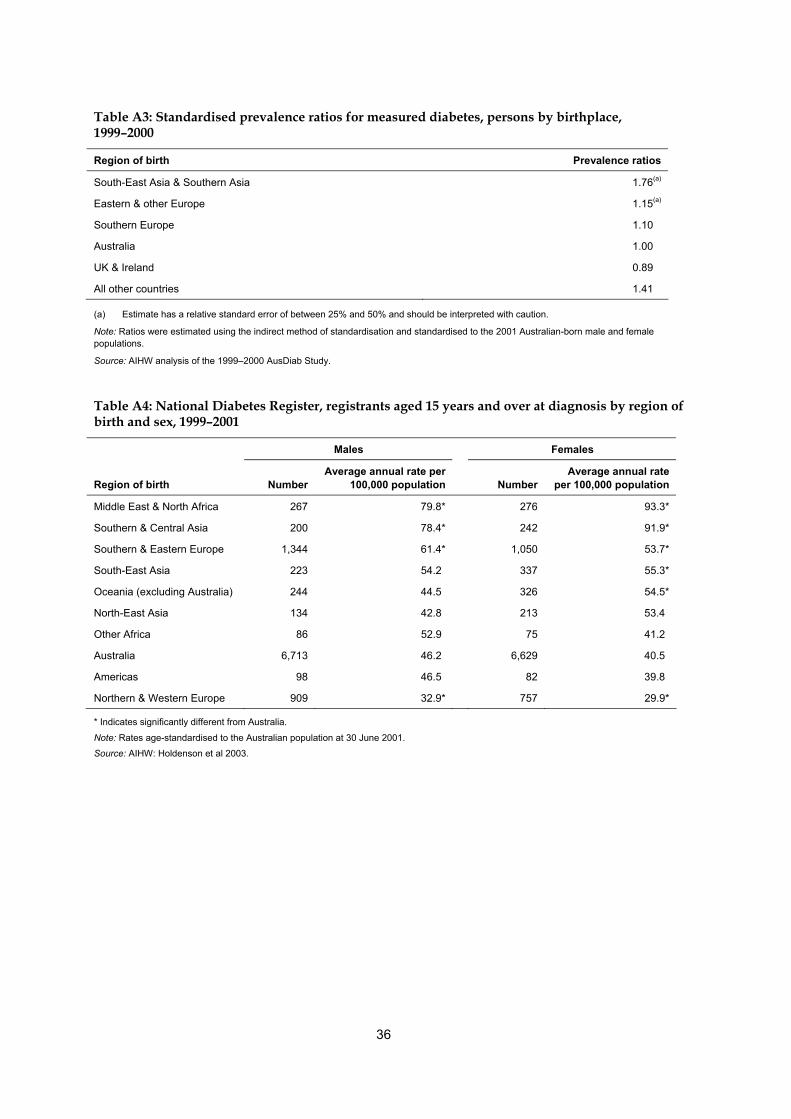
36
Table A3: Standardised prevalence ratios for measured diabetes, persons by birthplace, 1999–2000
Region of birth Prevalence ratios
South-East Asia & Southern Asia 1.76(a)
Eastern & other Europe 1.15(a)
Southern Europe 1.10
Australia 1.00
UK & Ireland 0.89
All other countries 1.41
(a) Estimate has a relative standard error of between 25% and 50% and should be interpreted with caution.
Note: Ratios were estimated using the indirect method of standardisation and standardised to the 2001 Australian-born male and female populations.
Source: AIHW analysis of the 1999–2000 AusDiab Study.
Table A4: National Diabetes Register, registrants aged 15 years and over at diagnosis by region of birth and sex, 1999–2001
Males Females
Region of birth Number Average annual rate per
100,000 population
Number Average annual rate
per 100,000 population
Middle East & North Africa 267 79.8* 276 93.3*
Southern & Central Asia 200 78.4* 242 91.9*
Southern & Eastern Europe 1,344 61.4* 1,050 53.7*
South-East Asia 223 54.2 337 55.3*
Oceania (excluding Australia) 244 44.5 326 54.5*
North-East Asia 134 42.8 213 53.4
Other Africa 86 52.9 75 41.2
Australia 6,713 46.2 6,629 40.5
Americas 98 46.5 82 39.8
Northern & Western Europe 909 32.9* 757 29.9*
* Indicates significantly different from Australia.
Note: Rates age-standardised to the Australian population at 30 June 2001.
Source: AIHW: Holdenson et al 2003.
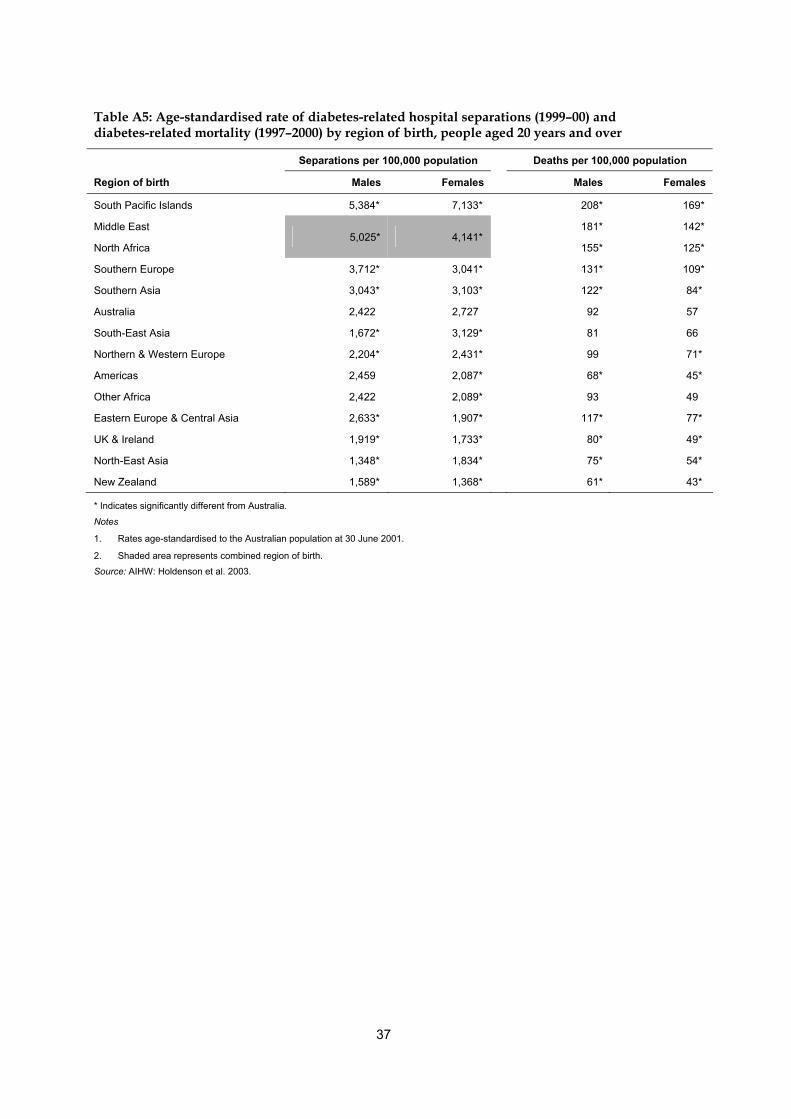
37
Table A5: Age-standardised rate of diabetes-related hospital separations (1999–00) and diabetes-related mortality (1997–2000) by region of birth, people aged 20 years and over
Separations per 100,000 population Deaths per 100,000 population
Region of birth Males Females Males Females
South Pacific Islands 5,384* 7,133* 208* 169*
Middle East 181* 142*
North Africa 5,025* 4,141*
155* 125*
Southern Europe 3,712* 3,041* 131* 109*
Southern Asia 3,043* 3,103* 122* 84*
Australia 2,422 2,727 92 57
South-East Asia 1,672* 3,129* 81 66
Northern & Western Europe 2,204* 2,431* 99 71*
Americas 2,459 2,087* 68* 45*
Other Africa 2,422 2,089* 93 49
Eastern Europe & Central Asia 2,633* 1,907* 117* 77*
UK & Ireland 1,919* 1,733* 80* 49*
North-East Asia 1,348* 1,834* 75* 54*
New Zealand 1,589* 1,368* 61* 43*
* Indicates significantly different from Australia.
Notes
1. Rates age-standardised to the Australian population at 30 June 2001.
2. Shaded area represents combined region of birth.
Source: AIHW: Holdenson et al. 2003.
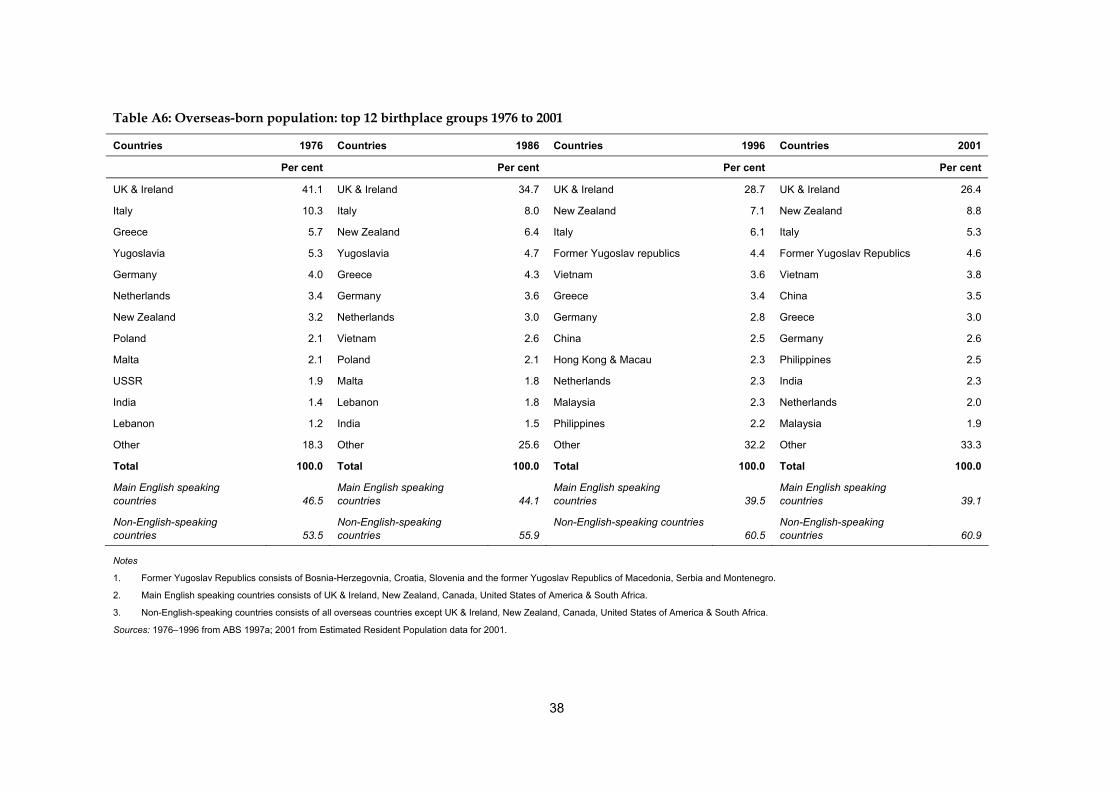
38
Table A6: Overseas-born population: top 12 birthplace groups 1976 to 2001
Countries 1976 Countries 1986 Countries 1996 Countries 2001
Per cent Per cent Per cent Per cent
UK & Ireland 41.1 UK & Ireland 34.7 UK & Ireland 28.7 UK & Ireland 26.4
Italy 10.3 Italy 8.0 New Zealand 7.1 New Zealand 8.8
Greece 5.7 New Zealand 6.4 Italy 6.1 Italy 5.3
Yugoslavia 5.3 Yugoslavia 4.7 Former Yugoslav republics 4.4 Former Yugoslav Republics 4.6
Germany 4.0 Greece 4.3 Vietnam 3.6 Vietnam 3.8
Netherlands 3.4 Germany 3.6 Greece 3.4 China 3.5
New Zealand 3.2 Netherlands 3.0 Germany 2.8 Greece 3.0
Poland 2.1 Vietnam 2.6 China 2.5 Germany 2.6
Malta 2.1 Poland 2.1 Hong Kong & Macau 2.3 Philippines 2.5
USSR 1.9 Malta 1.8 Netherlands 2.3 India 2.3
India 1.4 Lebanon 1.8 Malaysia 2.3 Netherlands 2.0
Lebanon 1.2 India 1.5 Philippines 2.2 Malaysia 1.9
Other 18.3 Other 25.6 Other 32.2 Other 33.3
Total 100.0 Total 100.0 Total 100.0 Total 100.0
Main English speaking countries 46.5
Main English speaking countries 44.1
Main English speaking countries 39.5
Main English speaking countries 39.1
Non-English-speaking countries 53.5
Non-English-speaking countries 55.9
Non-English-speaking countries 60.5
Non-English-speaking countries 60.9
Notes
1. Former Yugoslav Republics consists of Bosnia-Herzegovnia, Croatia, Slovenia and the former Yugoslav Republics of Macedonia, Serbia and Montenegro.
2. Main English speaking countries consists of UK & Ireland, New Zealand, Canada, United States of America & South Africa.
3. Non-English-speaking countries consists of all overseas countries except UK & Ireland, New Zealand, Canada, United States of America & South Africa.
Sources: 1976–1996 from ABS 1997a; 2001 from Estimated Resident Population data for 2001.
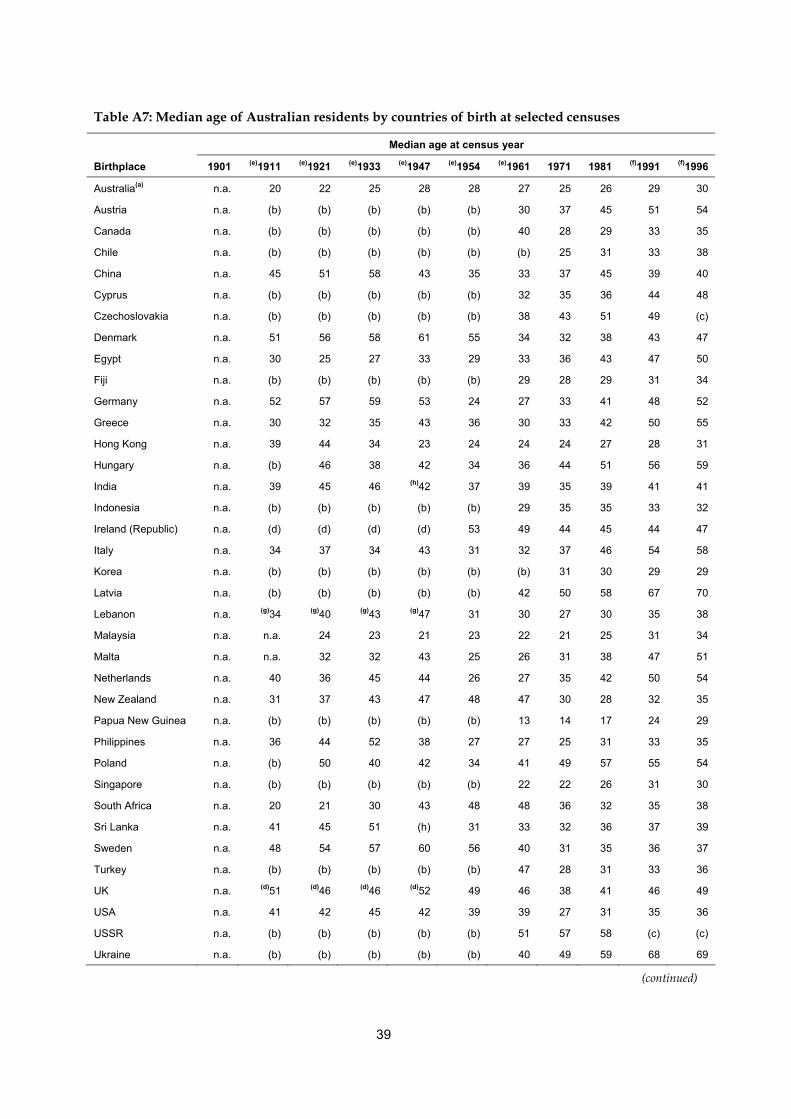
39
Table A7: Median age of Australian residents by countries of birth at selected censuses Median age at census year
Birthplace 1901 (e)1911 (e)1921 (e)1933 (e)1947 (e)1954 (e)1961 1971 1981 (f)1991 (f)1996
Australia(a) n.a. 20 22 25 28 28 27 25 26 29 30
Austria n.a. (b) (b) (b) (b) (b) 30 37 45 51 54
Canada n.a. (b) (b) (b) (b) (b) 40 28 29 33 35
Chile n.a. (b) (b) (b) (b) (b) (b) 25 31 33 38
China n.a. 45 51 58 43 35 33 37 45 39 40
Cyprus n.a. (b) (b) (b) (b) (b) 32 35 36 44 48
Czechoslovakia n.a. (b) (b) (b) (b) (b) 38 43 51 49 (c)
Denmark n.a. 51 56 58 61 55 34 32 38 43 47
Egypt n.a. 30 25 27 33 29 33 36 43 47 50
Fiji n.a. (b) (b) (b) (b) (b) 29 28 29 31 34
Germany n.a. 52 57 59 53 24 27 33 41 48 52
Greece n.a. 30 32 35 43 36 30 33 42 50 55
Hong Kong n.a. 39 44 34 23 24 24 24 27 28 31
Hungary n.a. (b) 46 38 42 34 36 44 51 56 59
India n.a. 39 45 46 (h)42 37 39 35 39 41 41
Indonesia n.a. (b) (b) (b) (b) (b) 29 35 35 33 32
Ireland (Republic) n.a. (d) (d) (d) (d) 53 49 44 45 44 47
Italy n.a. 34 37 34 43 31 32 37 46 54 58
Korea n.a. (b) (b) (b) (b) (b) (b) 31 30 29 29
Latvia n.a. (b) (b) (b) (b) (b) 42 50 58 67 70
Lebanon n.a. (g)34 (g)40 (g)43 (g)47 31 30 27 30 35 38
Malaysia n.a. n.a. 24 23 21 23 22 21 25 31 34
Malta n.a. n.a. 32 32 43 25 26 31 38 47 51
Netherlands n.a. 40 36 45 44 26 27 35 42 50 54
New Zealand n.a. 31 37 43 47 48 47 30 28 32 35
Papua New Guinea n.a. (b) (b) (b) (b) (b) 13 14 17 24 29
Philippines n.a. 36 44 52 38 27 27 25 31 33 35
Poland n.a. (b) 50 40 42 34 41 49 57 55 54
Singapore n.a. (b) (b) (b) (b) (b) 22 22 26 31 30
South Africa n.a. 20 21 30 43 48 48 36 32 35 38
Sri Lanka n.a. 41 45 51 (h) 31 33 32 36 37 39
Sweden n.a. 48 54 57 60 56 40 31 35 36 37
Turkey n.a. (b) (b) (b) (b) (b) 47 28 31 33 36
UK n.a. (d)51 (d)46 (d)46 (d)52 49 46 38 41 46 49
USA n.a. 41 42 45 42 39 39 27 31 35 36
USSR n.a. (b) (b) (b) (b) (b) 51 57 58 (c) (c)
Ukraine n.a. (b) (b) (b) (b) (b) 40 49 59 68 69
(continued)
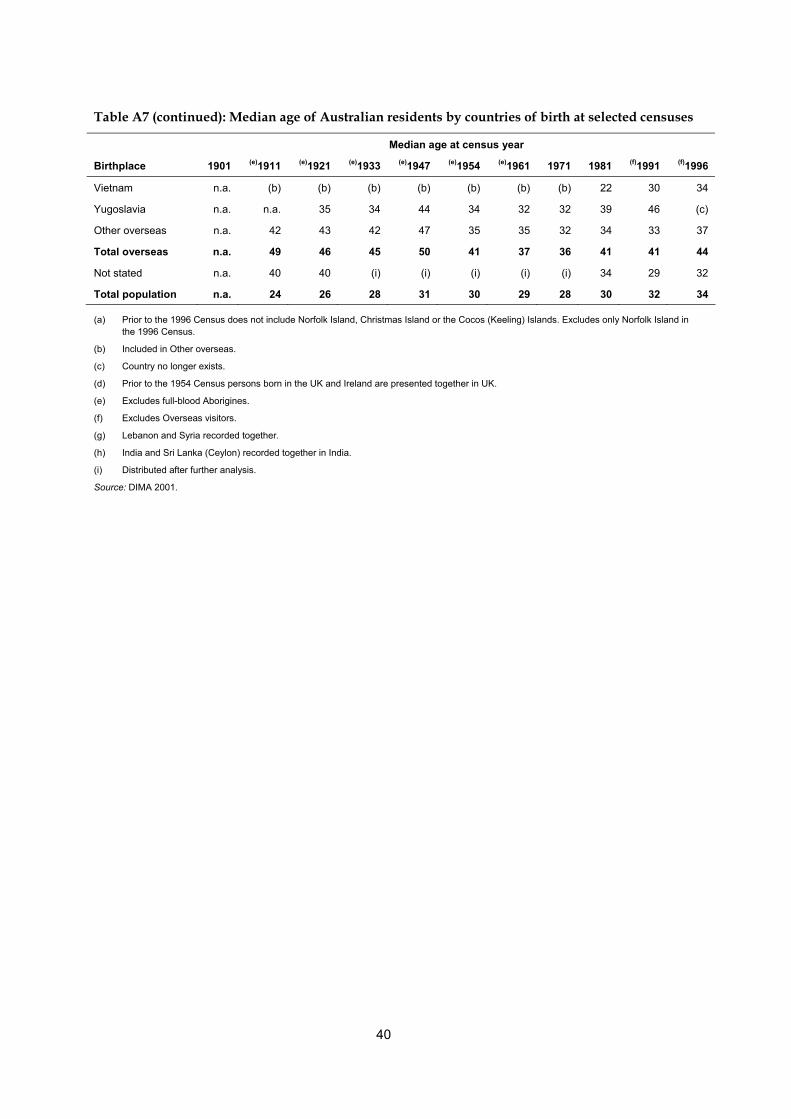
40
Table A7 (continued): Median age of Australian residents by countries of birth at selected censuses Median age at census year
Birthplace 1901 (e)1911 (e)1921 (e)1933 (e)1947 (e)1954 (e)1961 1971 1981 (f)1991 (f)1996
Vietnam n.a. (b) (b) (b) (b) (b) (b) (b) 22 30 34
Yugoslavia n.a. n.a. 35 34 44 34 32 32 39 46 (c)
Other overseas n.a. 42 43 42 47 35 35 32 34 33 37
Total overseas n.a. 49 46 45 50 41 37 36 41 41 44
Not stated n.a. 40 40 (i) (i) (i) (i) (i) 34 29 32
Total population n.a. 24 26 28 31 30 29 28 30 32 34
(a) Prior to the 1996 Census does not include Norfolk Island, Christmas Island or the Cocos (Keeling) Islands. Excludes only Norfolk Island in the 1996 Census.
(b) Included in Other overseas.
(c) Country no longer exists.
(d) Prior to the 1954 Census persons born in the UK and Ireland are presented together in UK.
(e) Excludes full-blood Aborigines.
(f) Excludes Overseas visitors.
(g) Lebanon and Syria recorded together.
(h) India and Sri Lanka (Ceylon) recorded together in India.
(i) Distributed after further analysis.
Source: DIMA 2001.
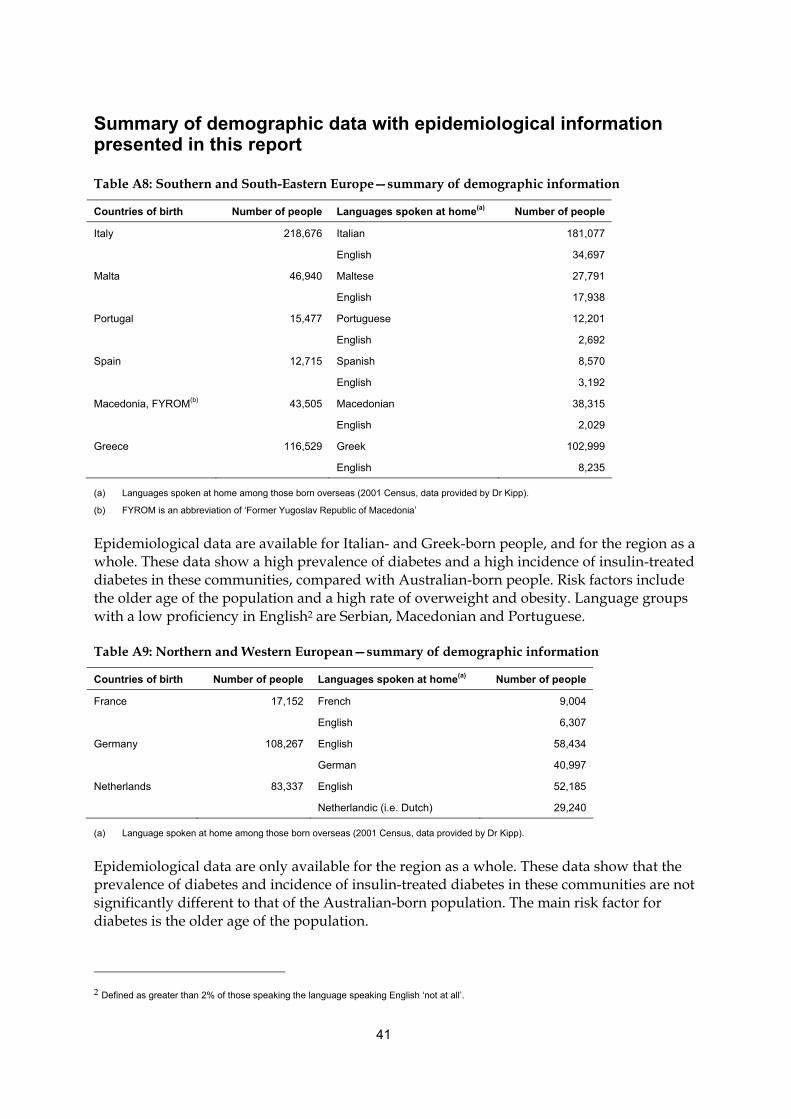
41
Summary of demographic data with epidemiological information presented in this report
Table A8: Southern and South-Eastern Europe—summary of demographic information
Countries of birth Number of people Languages spoken at home(a) Number of people
Italy 218,676 Italian 181,077
English 34,697
Malta 46,940 Maltese 27,791
English 17,938
Portugal 15,477 Portuguese 12,201
English 2,692
Spain 12,715 Spanish 8,570
English 3,192
Macedonia, FYROM(b) 43,505 Macedonian 38,315
English 2,029
Greece 116,529 Greek 102,999
English 8,235
(a) Languages spoken at home among those born overseas (2001 Census, data provided by Dr Kipp).
(b) FYROM is an abbreviation of ‘Former Yugoslav Republic of Macedonia’
Epidemiological data are available for Italian- and Greek-born people, and for the region as a whole. These data show a high prevalence of diabetes and a high incidence of insulin-treated diabetes in these communities, compared with Australian-born people. Risk factors include the older age of the population and a high rate of overweight and obesity. Language groups with a low proficiency in English2 are Serbian, Macedonian and Portuguese.
Table A9: Northern and Western European—summary of demographic information
Countries of birth Number of people Languages spoken at home(a) Number of people
France 17,152 French 9,004
English 6,307
Germany 108,267 English 58,434
German 40,997
Netherlands 83,337 English 52,185
Netherlandic (i.e. Dutch) 29,240
(a) Language spoken at home among those born overseas (2001 Census, data provided by Dr Kipp).
Epidemiological data are only available for the region as a whole. These data show that the prevalence of diabetes and incidence of insulin-treated diabetes in these communities are not significantly different to that of the Australian-born population. The main risk factor for diabetes is the older age of the population.
2 Defined as greater than 2% of those speaking the language speaking English ‘not at all’.
42
Table A10: Eastern Europe and Central Asia—summary of demographic information
Countries of Birth Number of people Languages spoken at home (a) Number of people
Hungary 22,761 Hungarian 13,513
English 7,959
Poland 58,056 Polish 41,222
English 12,922
Russian Federation 15,071 Russian 11,438
English 2,008
Ukraine 14,091 Russian 6,153
Ukrainian 5,078
English 1,906
(a) Language spoken at home among those born overseas (2001 Census, data provided by Dr Kipp).
Epidemiological data are only available for the region as a whole. These data show that the prevalence of diabetes and incidence of insulin-treated diabetes in these communities are not significantly different to that of Australian-born people. Russian language speakers have reported a low proficiency in English3.
Table A11: Middle East and North Africa—summary of demographic information
Countries of Birth Number of people Languages spoken at home (a) Number of People
Turkey 29,841 Turkish 24,341
English 2,122
Iraq 24,856 Arabic 10,824
Assyrian(b) 10,192
English 902
Lebanon 71,329 Arabic 64,698
English 4,398
Egypt 33,413 Arabic 15,669
English 7,256
(a) Language spoken at home among those born overseas (2001 Census, data provided by Dr Kipp).
(b) (FECCA 2004)
Epidemiological data are available for Turkish-born and Arabic-speaking people, and for the region as a whole. These data show a high prevalence of diabetes and incidence of insulin-treated diabetes in these communities, compared with Australian-born people. The main risk factor is the high rate of overweight and obesity. Language groups with a low proficiency in English3 are Arabic, Turkish and Persian.
3 Defined as greater than 2% of those speaking the language speaking English ‘not at all’.
43
Table A12: Southern Asia—summary of demographic information
Countries of Birth Number of people Languages spoken at home (a) Number of people
India 95,484 English 45,486
Hindi(b) 14,856
Tamil 5,242
Other 28,270
Sri Lanka 53,450 English 21,587
Sinhalese 17,364
Tamil 12,893
(a) Language spoken at home among those born overseas (2001 Census, data provided by Dr Kipp).
(b) (FECCA 2004)
Epidemiological data are available for the region as a whole. These data show high mortality from diabetes and high incidence of insulin-treated diabetes in these communities, compared with Australian-born people. The main risk factor is the high rate of overweight and obesity.
Table A13: North Asia—summary of demographic information
Countries of Birth Number of people Languages spoken at home (a) Number of people
Taiwan 22,320 Mandarin 19,547
Japan 25,462 Japanese 20,320
English 4,315
38,987 Korean 33,673 Korea, Republic of (South)
English 4,310
67,054 Cantonese 57,642 Hong Kong (SAR of China)(b)
English 6,886
142,819 Mandarin 68,485
Cantonese 52,500
Chinese nfd 8,380
China (excludes SARs and Taiwan Province)(b)
English 6,115
nfd no further detail.
(a) Language spoken at home among those born overseas (2001 Census, data provided by Dr Kipp).
(b) SAR is an abbreviation of ‘Special Administrative Region’. SARs comprise Hong Kong and Macau (SARs of China).
Epidemiological data are available for the region as a whole. These data show a low prevalence of diabetes and a low incidence of insulin-treated diabetes in these communities, compared with Australian-born people. Language groups with a low proficiency in English4 are Cantonese, Mandarin, other Chinese, Korean and Japanese.
4 Defined as greater than 2% of those speaking the language speaking English ‘not at all’.
44
Table A14: South-East Asia—summary of demographic information
Countries of Birth Number of people Languages spoken at home (a) Number of People
Vietnam 154,858 Vietnamese 119,609
Cantonese 25,955
English 3,730
Cambodia 22,956 Khmer 14,627
Cantonese 2,748
Mandarin 1,023
Indonesia 47,084 Indonesian 31,629
English 7,736
Mandarin 2,670
Philippines 103,963 Tagalog 69,295
English 28,479
Malaysia 78,892 English 28,316
Cantonese 22,480
Mandarin 12,892
Hokkien 4,922
Singapore 33,541 English 16,397
Mandarin 7,737
Cantonese 4,172
(a) Language spoken at home among those born overseas (2001 Census, data provided by Dr Kipp).
Epidemiological data are available for Vietnamese- and Philippine-born people, and for the region as a whole. These data show a high prevalence of diabetes and a low incidence of insulin-treated diabetes in these communities, compared with Australian-born people. Language groups with a low proficiency in English5 are Vietnamese and Khmer.
Table A15: South Pacific—summary of epidemiological and demographic information
Countries of Birth Number of people Languages spoken at home (a) Number of people
Samoa n.a. Samoan 10,894
Fiji 44,261 Hindi 24,070
n.a. not available
(a) Language spoken at home among those born overseas (2001 Census, data provided by Dr Kipp).
Epidemiological data are available for the region as a whole. These data show a high prevalence of diabetes, along with high mortality and a high rate of hospitalisations, in these communities compared with Australian-born people. The main risk factor is the high rate of overweight and obesity.
5 Defined as greater than 2% of those speaking the language speaking English ‘not at all’.
45
Table A16: South America—summary of demographic information
Countries of Birth Number of people Languages spoken at home (a) Number of people
Brazil 4,657 Portuguese 2,973
English 1,121
Chile 23,429 Spanish 20,137
English 2,854
Argentina 10,752 Spanish 8,063
English 1,825
24,218 Spanish 18,627 Other South America
English 4,460
(a) Language spoken at home among those born overseas (2001 Census, data provided by Dr Kipp).
Epidemiological data are available for the region as a whole. These data show a high prevalence of diabetes in these communities, compared with Australian-born people. Spanish speakers have reported a low proficiency in English6.
Table A17: Other Africa—summary of epidemiological and demographic information
Countries of birth Number of people Languages spoken at home(a) Number of people
Mauritius 16,994 French 9,782
English 4,643
(a) Language spoken at home among those born overseas (2001 Census, data provided by Dr Kipp).
There is very little epidemiological data available for this region. As a result, little is known about the burden of diabetes and risk factors for this community.
6 Defined as greater than 2% of those speaking the language speaking English ‘not at all’.
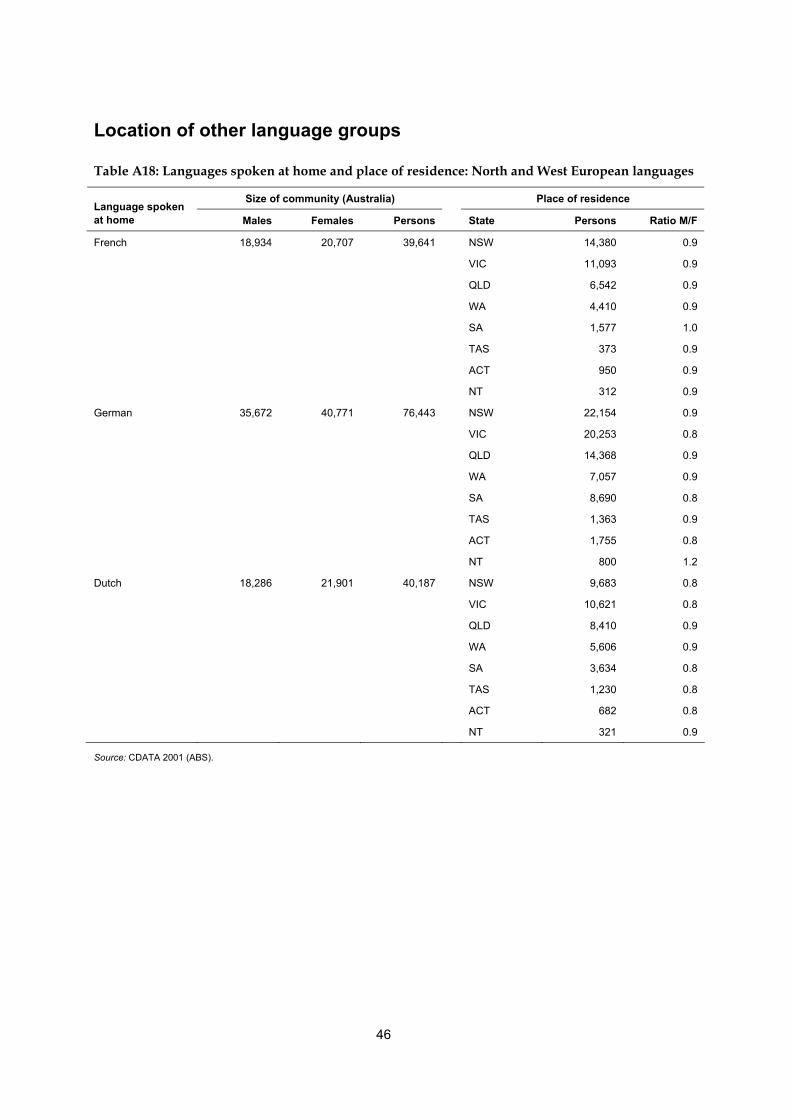
46
Location of other language groups
Table A18: Languages spoken at home and place of residence: North and West European languages
Size of community (Australia) Place of residence Language spoken at home Males Females Persons State Persons Ratio M/F
French 18,934 20,707 39,641 NSW 14,380 0.9
VIC 11,093 0.9
QLD 6,542 0.9
WA 4,410 0.9
SA 1,577 1.0
TAS 373 0.9
ACT 950 0.9
NT 312 0.9
German 35,672 40,771 76,443 NSW 22,154 0.9
VIC 20,253 0.8
QLD 14,368 0.9
WA 7,057 0.9
SA 8,690 0.8
TAS 1,363 0.9
ACT 1,755 0.8
NT 800 1.2
Dutch 18,286 21,901 40,187 NSW 9,683 0.8
VIC 10,621 0.8
QLD 8,410 0.9
WA 5,606 0.9
SA 3,634 0.8
TAS 1,230 0.8
ACT 682 0.8
NT 321 0.9
Source: CDATA 2001 (ABS).
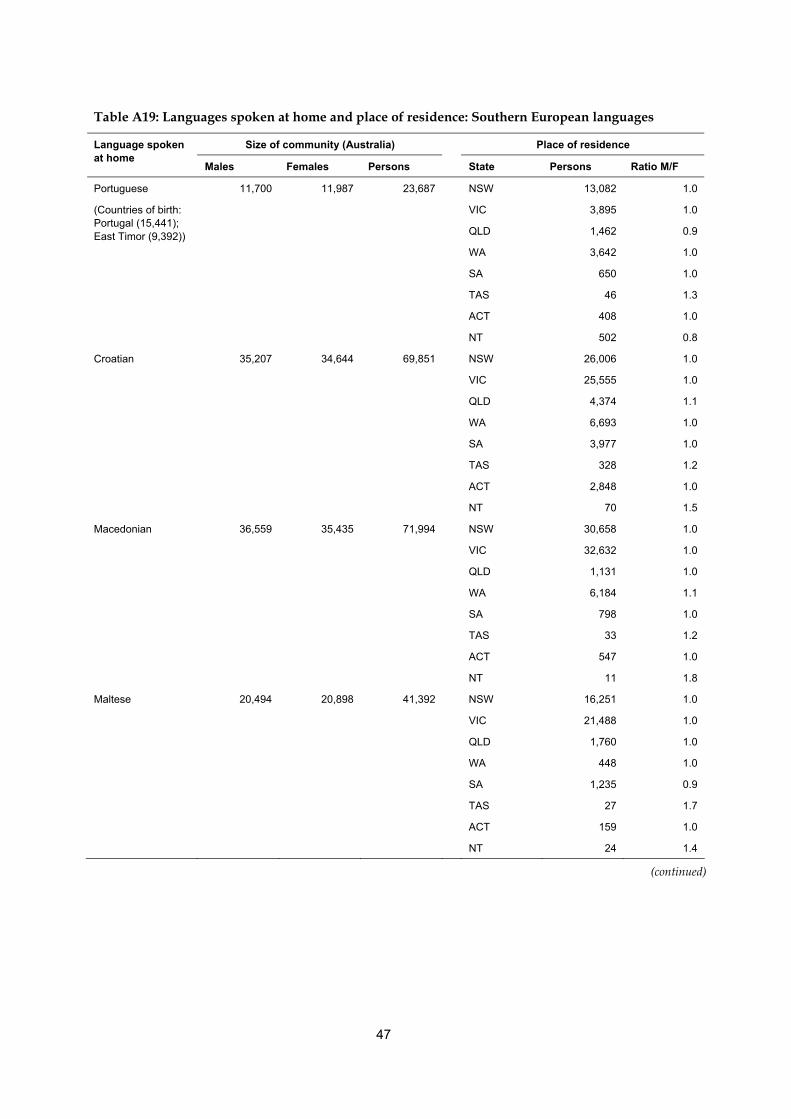
47
Table A19: Languages spoken at home and place of residence: Southern European languages
Size of community (Australia) Place of residence Language spoken at home
Males Females Persons State Persons Ratio M/F
11,700 11,987 23,687 NSW 13,082 1.0
VIC 3,895 1.0
QLD 1,462 0.9
WA 3,642 1.0
SA 650 1.0
TAS 46 1.3
ACT 408 1.0
Portuguese
(Countries of birth: Portugal (15,441); East Timor (9,392))
NT 502 0.8
Croatian 35,207 34,644 69,851 NSW 26,006 1.0
VIC 25,555 1.0
QLD 4,374 1.1
WA 6,693 1.0
SA 3,977 1.0
TAS 328 1.2
ACT 2,848 1.0
NT 70 1.5
Macedonian 36,559 35,435 71,994 NSW 30,658 1.0
VIC 32,632 1.0
QLD 1,131 1.0
WA 6,184 1.1
SA 798 1.0
TAS 33 1.2
ACT 547 1.0
NT 11 1.8
Maltese 20,494 20,898 41,392 NSW 16,251 1.0
VIC 21,488 1.0
QLD 1,760 1.0
WA 448 1.0
SA 1,235 0.9
TAS 27 1.7
ACT 159 1.0
NT 24 1.4
(continued)
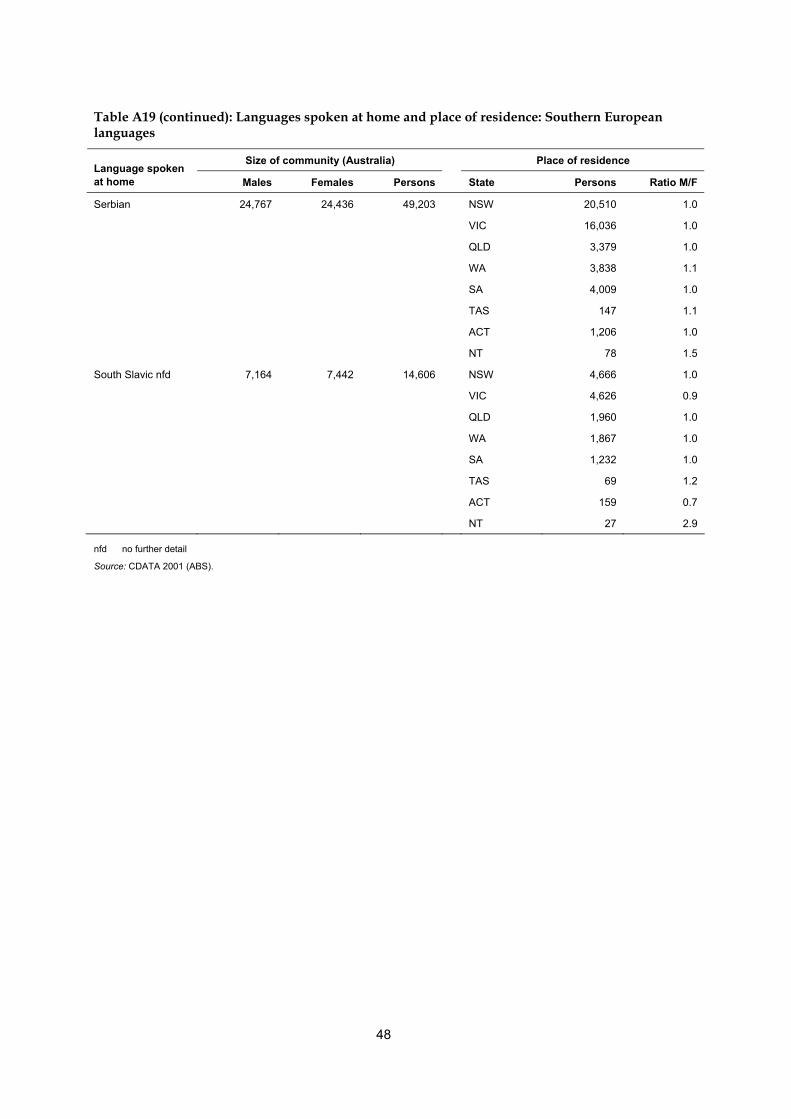
48
Table A19 (continued): Languages spoken at home and place of residence: Southern European languages
Size of community (Australia) Place of residence Language spoken at home Males Females Persons State Persons Ratio M/F
Serbian 24,767 24,436 49,203 NSW 20,510 1.0
VIC 16,036 1.0
QLD 3,379 1.0
WA 3,838 1.1
SA 4,009 1.0
TAS 147 1.1
ACT 1,206 1.0
NT 78 1.5
South Slavic nfd 7,164 7,442 14,606 NSW 4,666 1.0
VIC 4,626 0.9
QLD 1,960 1.0
WA 1,867 1.0
SA 1,232 1.0
TAS 69 1.2
ACT 159 0.7
NT 27 2.9
nfd no further detail
Source: CDATA 2001 (ABS).
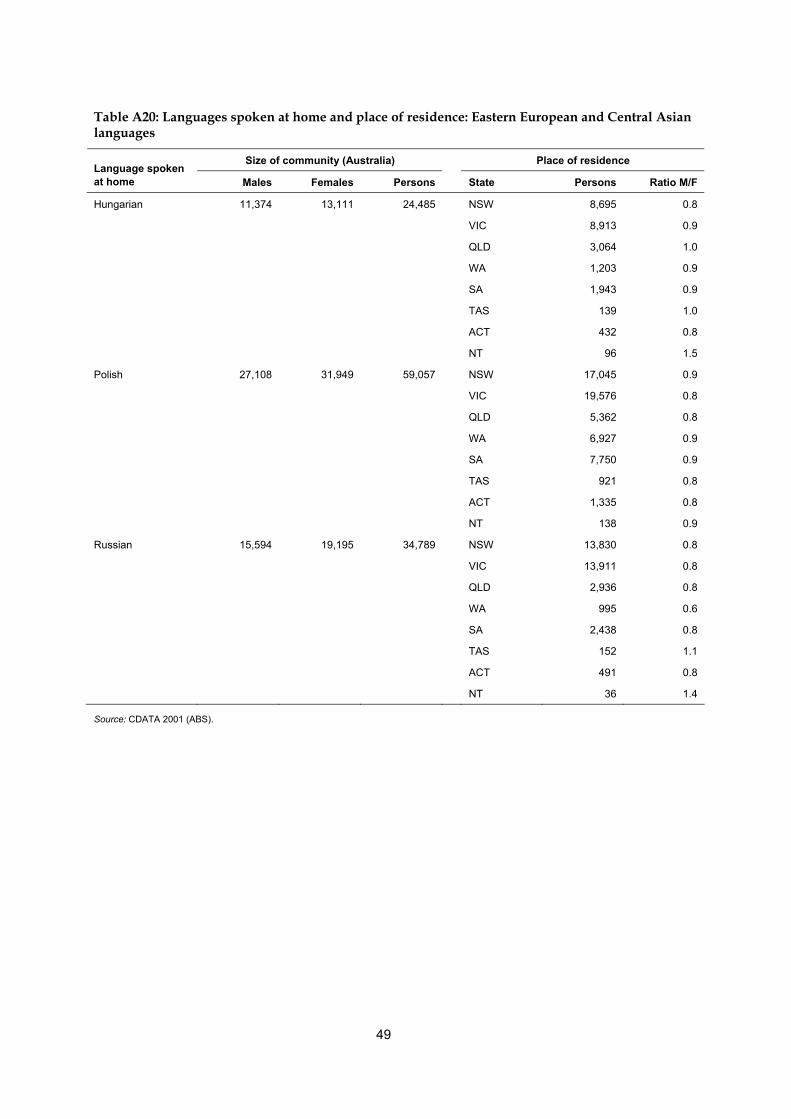
49
Table A20: Languages spoken at home and place of residence: Eastern European and Central Asian languages
Size of community (Australia) Place of residence Language spoken at home Males Females Persons State Persons Ratio M/F
Hungarian 11,374 13,111 24,485 NSW 8,695 0.8
VIC 8,913 0.9
QLD 3,064 1.0
WA 1,203 0.9
SA 1,943 0.9
TAS 139 1.0
ACT 432 0.8
NT 96 1.5
Polish 27,108 31,949 59,057 NSW 17,045 0.9
VIC 19,576 0.8
QLD 5,362 0.8
WA 6,927 0.9
SA 7,750 0.9
TAS 921 0.8
ACT 1,335 0.8
NT 138 0.9
Russian 15,594 19,195 34,789 NSW 13,830 0.8
VIC 13,911 0.8
QLD 2,936 0.8
WA 995 0.6
SA 2,438 0.8
TAS 152 1.1
ACT 491 0.8
NT 36 1.4
Source: CDATA 2001 (ABS).
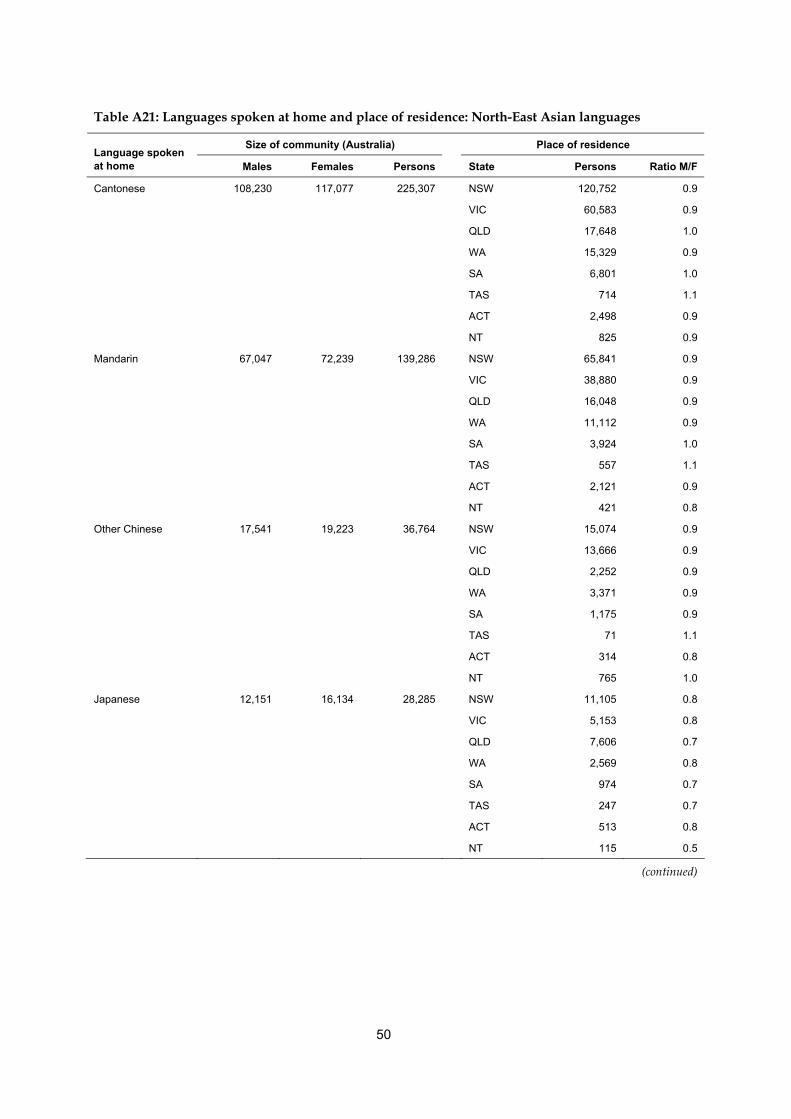
50
Table A21: Languages spoken at home and place of residence: North-East Asian languages
Size of community (Australia) Place of residence Language spoken at home Males Females Persons State Persons Ratio M/F
Cantonese 108,230 117,077 225,307 NSW 120,752 0.9
VIC 60,583 0.9
QLD 17,648 1.0
WA 15,329 0.9
SA 6,801 1.0
TAS 714 1.1
ACT 2,498 0.9
NT 825 0.9
Mandarin 67,047 72,239 139,286 NSW 65,841 0.9
VIC 38,880 0.9
QLD 16,048 0.9
WA 11,112 0.9
SA 3,924 1.0
TAS 557 1.1
ACT 2,121 0.9
NT 421 0.8
Other Chinese 17,541 19,223 36,764 NSW 15,074 0.9
VIC 13,666 0.9
QLD 2,252 0.9
WA 3,371 0.9
SA 1,175 0.9
TAS 71 1.1
ACT 314 0.8
NT 765 1.0
Japanese 12,151 16,134 28,285 NSW 11,105 0.8
VIC 5,153 0.8
QLD 7,606 0.7
WA 2,569 0.8
SA 974 0.7
TAS 247 0.7
ACT 513 0.8
NT 115 0.5
(continued)
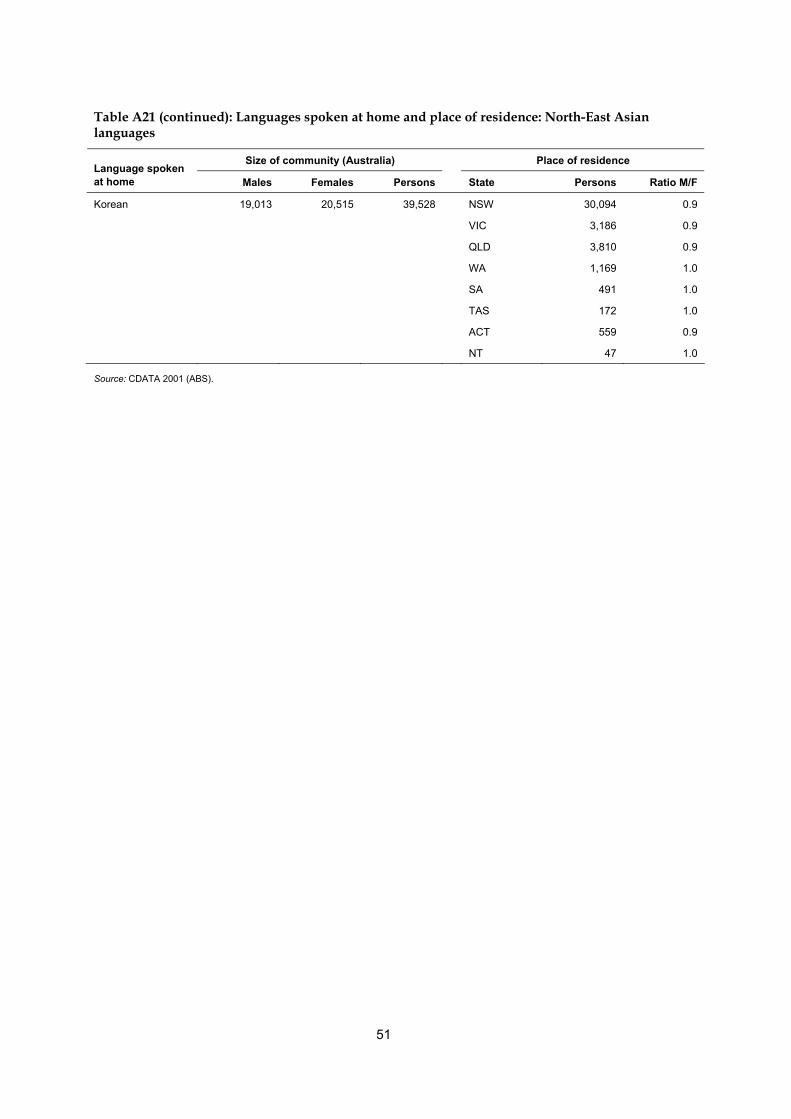
51
Table A21 (continued): Languages spoken at home and place of residence: North-East Asian languages
Size of community (Australia) Place of residence Language spoken at home Males Females Persons State Persons Ratio M/F
Korean 19,013 20,515 39,528 NSW 30,094 0.9
VIC 3,186 0.9
QLD 3,810 0.9
WA 1,169 1.0
SA 491 1.0
TAS 172 1.0
ACT 559 0.9
NT 47 1.0
Source: CDATA 2001 (ABS).
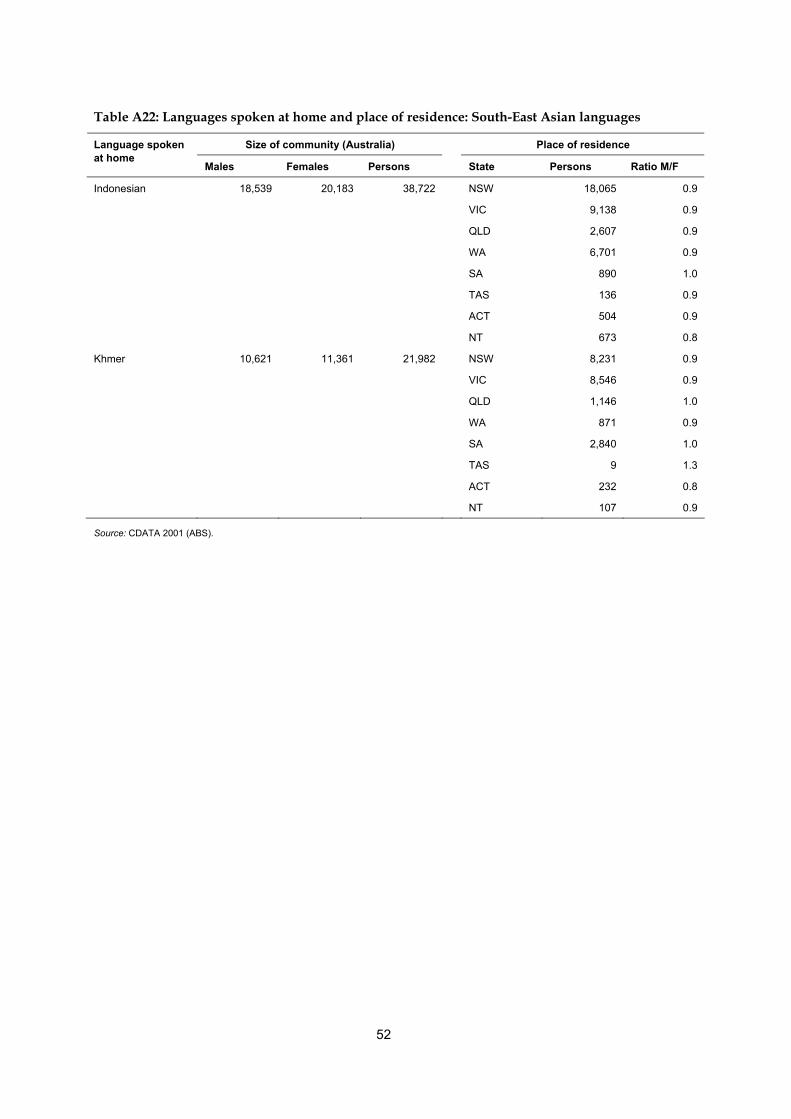
52
Table A22: Languages spoken at home and place of residence: South-East Asian languages
Size of community (Australia) Place of residence Language spoken at home
Males Females Persons State Persons Ratio M/F
Indonesian 18,539 20,183 38,722 NSW 18,065 0.9
VIC 9,138 0.9
QLD 2,607 0.9
WA 6,701 0.9
SA 890 1.0
TAS 136 0.9
ACT 504 0.9
NT 673 0.8
Khmer 10,621 11,361 21,982 NSW 8,231 0.9
VIC 8,546 0.9
QLD 1,146 1.0
WA 871 0.9
SA 2,840 1.0
TAS 9 1.3
ACT 232 0.8
NT 107 0.9
Source: CDATA 2001 (ABS).
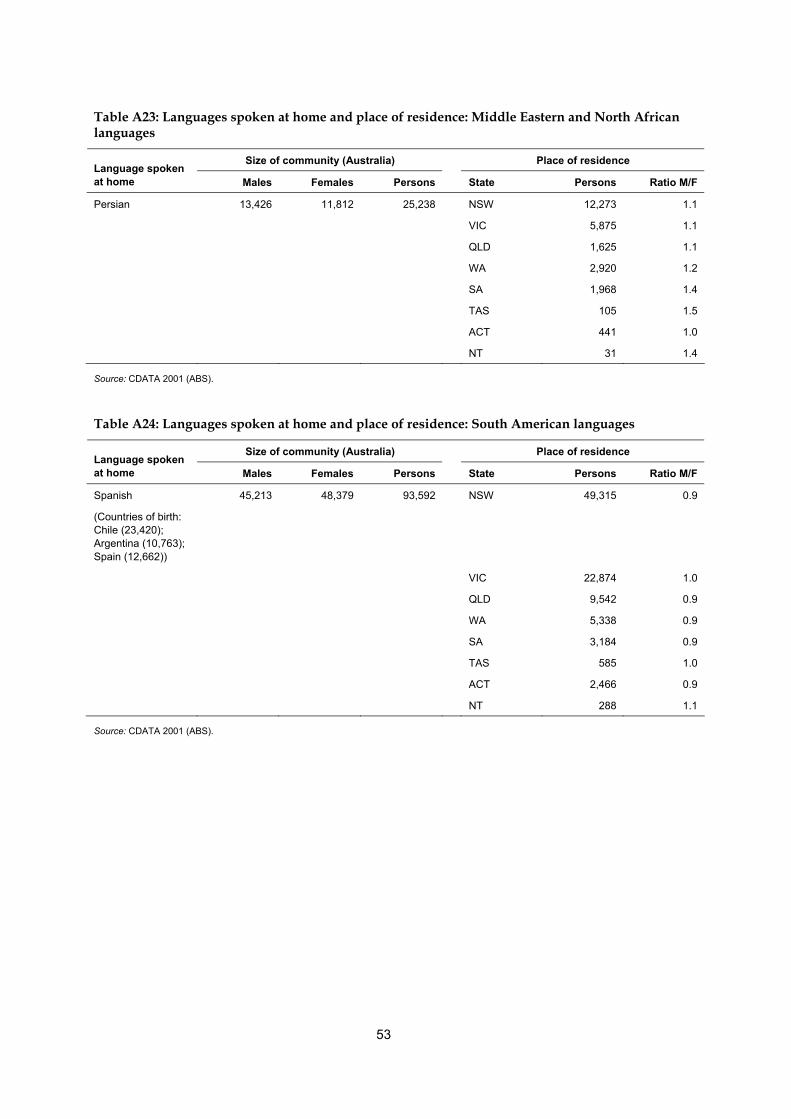
53
Table A23: Languages spoken at home and place of residence: Middle Eastern and North African languages
Size of community (Australia) Place of residence Language spoken at home Males Females Persons State Persons Ratio M/F
Persian 13,426 11,812 25,238 NSW 12,273 1.1
VIC 5,875 1.1
QLD 1,625 1.1
WA 2,920 1.2
SA 1,968 1.4
TAS 105 1.5
ACT 441 1.0
NT 31 1.4
Source: CDATA 2001 (ABS).
Table A24: Languages spoken at home and place of residence: South American languages
Size of community (Australia) Place of residence Language spoken at home Males Females Persons State Persons Ratio M/F
Spanish
(Countries of birth: Chile (23,420); Argentina (10,763); Spain (12,662))
45,213 48,379 93,592 NSW 49,315 0.9
VIC 22,874 1.0
QLD 9,542 0.9
WA 5,338 0.9
SA 3,184 0.9
TAS 585 1.0
ACT 2,466 0.9
NT 288 1.1
Source: CDATA 2001 (ABS).
54
Glossary Age standardisation: A method of removing the influence of age when comparing populations with different age structures. This is usually necessary because the rates of many diseases vary strongly (usually increasing) with age. The age structures of the different populations are converted to the same ‘standard’ structure, then the disease rates that would have occurred with that structure are calculated and compared. Age-specific rate: A rate for a specific age group. The numerator and denominator relate to the same age group. Body mass index (BMI): The most commonly used method of assessing whether a person is healthy weight, underweight, overweight or obese. It is calculated by dividing the person’s weight (in kilograms) by their height (in metres) squared, that is, kg ÷ m2. For both men and women, underweight is a BMI below 18.5, healthy weight is from 18.5 to less than 25, overweight is 25 and above (includes obese), and obese is 30 and over. Cause of death: From information reported on the medical certificate of cause of death, each death is classified by the underlying cause of death according to rules and conventions of the 10th revision of the International Classification of Diseases. The underlying cause is defined as the disease that initiated the train of events leading directly to death. Deaths from injury or poisoning are classified according to the circumstances of the accident or violence which produced the fatal injury, rather than to the nature of the injury. Cohort: A group of individuals being studied who have experienced the same event at a specified period in time; for example ‘birth cohort’ refers to people born in the same year. Complication: A secondary problem that arises from or occurs with a disease or its treatment (such as surgery), worsening the patient’s condition and making treatment more complicated. Confidence intervals: Confidence intervals are an indication of the amount of variation associated with an estimate. For example, a 95% confidence interval indicates that if the process that led to the estimated value were repeated many times, in 95% of cases the true population value would fall within that confidence interval. Diabetes (diabetes mellitus): A chronic condition in which the body makes too little of the hormone insulin or cannot use it properly. This raises the blood level of the body’s major energy source, the sugar glucose, and causes other widespread disturbance of the body’s energy processes. Epidemiology: The study of the patterns and causes of health and disease in populations, and the application of this study to improve health. Gestational diabetes mellitus: Diabetes which is first diagnosed during pregnancy (gestation). Glycosuria: Sugar in the urine. Health status: An individual’s or population’s overall level of health, taking account of various aspects such as life expectancy, amount of disability, levels of disease risk factors and so forth. Impaired glucose tolerance: Condition in which blood glucose levels are higher than normal but less than required for a diagnosis of diabetes, and which signals an increased risk of developing Type 2 diabetes.
55
Impairment: Any loss or abnormality of psychological, physiological or anatomical structure or function. Incidence: The number of new cases of a disease arising in the population in a given time period. Insulin: Hormone that is produced by the pancreas and regulates the body’s energy sources, most notably the sugar glucose. International Classification of Diseases: The World Health Organization’s internationally accepted classification of diseases and health related problems. The 10th Revision (ICD-10) is currently in use. Median: The midpoint of a list of observations ranked from the smallest to the largest. Medicare: A national, government-funded scheme that subsidises the cost of personal medical services for all Australians and aims to help them afford medical care. Morbidity: Refers to ill health in an individual and to levels of ill health in a population or group. Mortality: Death. Obesity: Marked degree of overweight, defined as body mass index of 30 and over. Overweight: Defined as a body mass index of 25 and over. Ponderal index: an index of body mass calculated by dividing the person’s weight (in kilograms) by their height (in metres) cubed (i.e. kg ÷ m3). Prevalence: The number of cases of a disease in the population at a specified point in time. Risk factor: Any factor which represents a greater risk of a health disorder or other unwanted condition or event. Some risk factors are regarded as causes of disease, others are not necessarily so. Statistical significance: An indication from a statistical test that an observed difference or association may be significant or ‘real’ because it is unlikely to be due just to chance. A statistical result is usually said to be ‘significant’ if it would occur by chance only once in twenty times or less often. Type 1 diabetes: A form of diabetes usually arising in childhood or youth (‘juvenile onset’), marked by a complete lack of insulin and needing insulin replacement for survival. Type 2 diabetes: The most common form of diabetes, occurring mostly in people aged 40 years and over and marked by reduced or less effective insulin. Underlying cause of death: The condition, disease or injury initiating the sequence of events leading to death, that is, the primary, chief, main or principal cause.
56
References Abate N & Chandalia M 2003. The impact of ethnicity on Type 2 diabetes. Journal of Diabetes and its Complications 17: 39–58. ABS (Australian Bureau of Statistics) 1990. Australian standard classification of countries for social statistics (ASCCSS). ABS Cat. No. 1269.0. Canberra: ABS. ABS 1996. National Health Survey: user’s guide, Australia 1995. ABS Cat. No. 4363.0. Canberra: ABS. ABS 1997a. Australian social trends 1997. ABS Cat. No. 4102.0. Canberra: ABS. ABS 1997b. Australian Standard Classification of Languages (ASCL). ABS Cat. No. 1267.0. Canberra: ABS. ABS 1998. Standard Australian Classification of Countries (SACC). ABS Cat. No. 1269.0. Canberra: ABS. ABS 1999. Standards for statistics on cultural and language diversity. ABS Cat. No. 1289.0. Canberra: ABS. ABS 2002a. Census of Population and Housing: selected social and housing characteristics, Australia. ABS Cat. No. 2015.0. Canberra: ABS. ABS 2002b. 2001 National Health Survey: summary of results, Australia. ABS Cat. No. 4364.0. Canberra: ABS. AIHW (Australian Institute of Health and Welfare): Gibson D, Braun P, Benham C & Mason F. 2001. Projections of older immigrants: people from culturally and linguistically diverse backgrounds, 1996–2025, Australia. AIHW Cat. No. AGE 18. Canberra: AIHW (Aged Care Series no. 6). AIHW 2002. Diabetes: Australian facts 2002. AIHW Cat. No. PHE 8. Canberra: AIHW. AIHW: Holdenson Z, Catanzariti L, Phillips G & Waters A-M 2003a. A picture of diabetes in overseas-born Australians. Bulletin No. 9. AIHW Cat. No. AUS 38. Canberra: AIHW. AIHW: Phillips G 2003b. The impact of ICD coding changes for diabetes hospital morbidity data. AIHW Cat. No. CVD 26. Canberra: AIHW. Australasian Diabetes in Pregnancy Society 2001. Consumer centre: gestational diabetes. Viewed 16 August 2005, < http://www.adips.org/consumer.htm> Ball K, Crawford D, Ireland P & Hodge A 2003. Patterns and demographic predictors of 5-year weight change in a multi-ethnic cohort of men and women in Australia. Public Health Nutrition 6(3): 269–80. Beischer N, Oats J, Henry O, Sheedy M & Walstab 1991. Incidence and severity of gestational diabetes mellitus according to country of birth in women living in Australia. Diabetes 40(2): 35–8. Booth M, Wake M, Armstrong T, Chey T, Hesketh K & Mathur S 2001. The epidemiology of overweight and obesity among Australian children and adolescents, 1995–97. Australian and New Zealand Journal of Public Health 25(2): 162–9. Burden M 2001. Culturally sensitive care: managing diabetes during Ramadan. British Journal of Community Nursing 6(11): 581–5. Cameron T 2002. Break down the barriers. Diabetes Australia Conquest Magazine Spring: 4–5.
57
Centre for Epidemiology and Research, NSW Department of Health 2002. New South Wales Mothers and Babies 2001. NSW Public Health Bulletin 13(S-4). Sydney: NSW Department of Health. Cheung N, Wasmer G & Al-Ali J 2001. Risk factors for gestational diabetes among Asian women. Diabetes Care 24(5): 955–6. Chowdhury T, Grace C & Kopelman P 2003. Preventing diabetes in south Asians: too little action and too late. British Medical Journal 327: 1,059–60. Colagiuri S, Colagiuri R & Ward J 1998. National Diabetes Strategy and Implementation Plan. Canberra: Diabetes Australia. Colagiuri S, Colagiuri R, Na’ati S, Muimuiheata S, Hussain Z & Palu T 2002. The prevalence of diabetes in the Kingdom of Tonga. Diabetes Care 25(8): 1,378–83. Conquest (2001). Interpreter services on the front line for support. Diabetes Australia Conquest Magazine Autumn: 10–11. Conquest (2002). Lifestyle changes hit Arabic families. Diabetes Australia Conquest Magazine Spring: 10. Davey R & Hamblin P 2001. Selective versus universal screening for gestational diabetes mellitus: an evaluation of predictive risk factors. Medical Journal of Australia 174: 118–21. DiFrancesco A, Gillam C & Unsworth M 1999. Diabetes in Italian and Vietnamese communities: an assessment of service needs in the inner city area of Perth. A joint initiative of Eastern Perth Public and Community Health Unit and Inner City Diabetes Services. Perth: Eastern Perth Public and Community Health Unit. Dijkshoorn H, Uitenbroek D & Middelkoop B 2003. Prevalence of diabetes mellitus and cardiovascular disease among immigrants from Turkey and Morocco and the indigenous Dutch population. Ned Tijdschr Geneeskd 147(28): 1,362–6. Abstract only cited as article in Dutch. DIMA (Department of Immigration and Multicultural Affairs) Statistics Section 2001. Immigration: Federation to Century’s end 1901–2000. Canberra: DIMA. Dorman J, McCarthy B. O’Leary L & Koehler A 1995. Risk factors for insulin-dependent diabetes. In: National Institute of Diabetes and Digestive and Kidney Diseases, National Institutes of Health. Diabetes in America. 2nd edition. Bethesda, MD: National Institute of Diabetes and Digestive and Kidney Diseases, National Institutes of Health. FECCA (Federation of Ethnic Communities’ Councils of Australia) 2004. Multicultural Australia—the people by numbers. Viewed 6 May 2004, <http:// www.fecca.org.au/ census/fCensusIndex.html> Feltbower R, Bodansky H, McKinney P, Houghton J, Stephenson C & Haigh D 2002. Trends in the incidence of childhood diabetes in south Asians and other children in Bradford, UK. Diabetic Medicine 19: 162–6. Foliaki S & Pearce N 2003. Prevention and control of diabetes in Pacific people. British Medical Journal 327: 437–9. Green J, Waters E, Haikerwal A, O’Neill C, Raman S, Booth M et al. 2003. Social, cultural and environmental influences on child activity and eating in Australian migrant communities. Child: Care, Health and Development 29(6): 441–8. Hodge A 2004. Diabetes in the Melbourne Collaborative Cohort Study, personal communication, 13 January 2004.
58
Hodge AM, English DR, O’Dea K & Giles GG 2004. Increased diabetes incidence in Greek and Italian migrants to Australia. Diabetes Care 27(10): 2,330–4. Hoffman L, Nolan C, Wilson J, Oats J & Simmons D 1998. Gestational diabetes mellitus—management guidelines. The Australiasian Diabetes in Pregnancy Society. Medical Journal of Australia 169: 93–97. Hsu-Hage B & Yang X 1999. Gestational diabetes mellitus and its complications. Asia Pacific Journal of Clinical Nutrition 8(1): 82–9. IDF (International Diabetes Federation) 2003. Diabetes atlas, second edition. Brussels: IDF. IDI (International Diabetes Institute) 2000. The Asia-Pacific perspective: redefining obesity and its treatment, Health Communications Australia. Viewed 6 May 2004, <http://www.idi.org.au/research/report_obesity.htm>. Karter A, Ferrara A, Liu J, Moffet H, Ackerson L & Selby J 2002. Ethnic disparities in diabetic complications in an insured population. Journal of the American Medical Association 287(19): 2,519–27. Khodabukus R 2003. Advising patients with diabetes about fasting during Ramadhan. Nursing Times 99(28): 26–7. Kieffer E, Martin J & Herman W 1999. Impact of maternal nativity on the prevalence of diabetes during pregnancy among US ethnic groups. Diabetes Care 22(5): 729–35. Lynch J, Wang X & Wilcken D 2000. Body mass index in Australian children: recent changes and relevance of ethnicity. Archives of Disease in Childhood 82: 16–20. Martin FIR 1991. The diagnosis of gestational diabetes. Medical Journal of Australia 155: 112. Mbanya J-C, Cruickshank J, Forrester T, Balkau B, Ngogang J, Riste L et al. 1999. Standardised comparison of glucose intolerance in West African-origin populations of rural and urban Cameroon, Jamaica, and Caribbean migrants to Britain. Diabetes Care 22(3): 434–40. McDonald S & Russ G (eds.) 2003. ANZDATA Registry report. The twenty-sixth report, 2002. Adelaide: Australia and New Zealand Dialysis and Transplant Registry. McKay R, McCarty C & Taylor H 2000. Diabetes in Victoria, Australia: the Visual Impairment Project. Australian and New Zealand Journal of Public Health 24(6): 565–9. Naeem A 2003. The role of culture and religion in the management of diabetes: a study of Kashmiri men in Leeds. The Journal of The Royal Society for the Promotion of Health 123(2): 110–6. NSW Department of Health 2001. Report on the 1997 and 1998 NSW Health Surveys. Sydney: NSW Department of Health, Public Health Division. Viewed 26 May 2004, < http://www.health.nsw.gov.au/public-health/nswhs>. NSW Department of Health 2002. The health of the people of New South Wales—Report of the Chief Health Officer, 2002. Sydney: NSW Department of Health, Public Health Division. O’Sullivan JB 1991. Diabetes after GDM. Diabetes 29(2): 131–5. Parsons J, Wilson D & Scardigno A 2000. The impact of diabetes in South Australia 2000: the evidence. Adelaide: South Australian Department of Human Services. Payne C 2000. Diabetes-related lower-limb amputations in Australia. Medical Journal of Australia 173: 352–4. Powell S, Vulikh E, Jones M & Schroen L 2003. Diabetes education for people from non-English speaking backgrounds: a needs assessment of a Russian speaking community.
59
Abstract of poster presented at the Australian Diabetes Society and Australian Diabetes Educators Association Annual Scientific Meeting, 17–19 September 2003. Renzaho A 2004. Fat, rich and beautiful: changing socio-cultural paradigms associated with obesity risk, nutritional status and refugee children from sub-Saharan Africa. Health and Place 10: 105–113. Rissel C, Lesjak M & Ward J 1998. Cardiovascular risk factors among Arabic-speaking patients attending Arabic-speaking general practitioners in Sydney, Australia: opportunities for intervention. Ethnicity and Health 3(3): 213–22. Riste L, Khan F & Cruickshank K 2001. High prevalence of type 2 diabetes in all ethnic groups, including Europeans, in a British inner city: relative poverty, history, inactivity, or 21st century Europe? Diabetes Care 24(8): 1,377–83. Rozman M 2001. Ethiopian Community Diabetes Project report. Footscray: Western Region Health Centre. Saleh A, Amanatidis S & Samman S 2002. Cross-sectional study of diet and risk factors for metabolic diseases in a Ghanaian population in Sydney, Australia. Asia Pacific Journal of Clinical Nutrition 11(3): 210–6. Simmons D, Harry T & Gatland B 1999. Prevalence of known diabetes in different ethnic groups in inner urban South Auckland. New Zealand Medical Journal 112(1,094): 316–9. Simmons D, Thompson CF & Volklander D 2001. Polynesians: prone to obesity and Type 2 diabetes mellitus but not hyperinsulinaemia. Diabetic Medicine 18: 193–8. Taylor A, Dal Grande E, Parsons J, Kunst P & Zhang Y 1997. Migrant Health Survey October 1996 – February 1997. Prepared for the Migrant health Service, South Australian Health Commission. Adelaide: SERCIS Behavioural Epidemiology Unit, South Australian Health Commission. von Hofe B, Thomas M & Colagiuri R 2002. A systematic review of issues impacting on health care for culturally diverse groups using diabetes as a model. Sydney: Australian Centre for Diabetes Strategies & Multicultural Health Unit. Wahlqvist M 2002. Asian migration to Australia: food and health consequences. Asia Pacific Journal of Clinical Nutrition 11(suppl): S562–8. Weijers R, Bekedam D & Oosting H 1998. The prevalence of type 2 diabetes and gestational diabetes mellitus in an inner city multi-ethnic population. European Journal of Epidemiology 14: 693–9. Whincup P, Gilg J, Papacosta O, Seymour C, Miller G, Alberti K et al. 2002. Early evidence of ethnic differences in cardiovascular risk: cross sectional comparison of British South Asian and white children. British Medical Journal 324: 1–6. WHO (World Health Organization) 1992. International statistical classification of diseases and related health problems, 10th revision. Geneva: WHO. WHO Expert Consultation 2004. Appropriate body-mass index for Asian populations and its implications for policy and intervention strategies. Lancet 363: 157–63. Worthington Di Marzio & Cultural Partners Australia 2001. Access to information about government services among culturally and linguistically diverse audiences. Melbourne: Victorian Department of Premier and Cabinet. Viewed 7 May 2004, <http://www.voma.vic.gov.au/domino/web_notes/voma/vomasite.nsf/Frameset/VOMA?OpenDocument>.

60
Yunus A 2002. Muslim men advised: switch to healthier diet. Diabetes Australia Conquest Magazine Spring: 10.