publisher placement algorithms in content-based publish ...msrg.org › ... › 2010 ›...
TRANSCRIPT
Publisher Placement Algorithms inContent-based Publish/Subscribe
Alex King Yeung Cheung and Hans-Arno JacobsenUniversity of Toronto, Middleware Systems Research Group (MSRG.org)
Email: {cheung,jacobsen}@eecg.utoronto.ca
Abstract—Many publish/subscribe systems implement a policyfor clients to join to their physically closest broker to minimizetransmission delays incurred on the clients’ messages. However,the amount of delay reduced by this policy is only the tip ofthe iceberg as messages incur queuing, matching, transmission,and scheduling delays from traveling across potentially longdistances in the broker network. Additionally, the clients’ impacton system load is totally neglected by such a policy. This paperproposes two new algorithms that intelligently relocate publisherson the broker overlay to minimize both the overall end-to-enddelivery delay and system load. Both algorithms exploit livepublication distribution patterns but with different optimizationmetrics and computation methodologies to determine the bestrelocation point. Evaluations on PlanetLab and a cluster testbedshow that our algorithms can reduce the average input load ofthe system by up to 68%, average broker message rate by up to85%, and average delivery delay by up to 68%.
Keywords: Content-based publish/subscribe, publisher migra-tion, publisher repositioning, delivery delay minimization, loadminimization
I. I NTRODUCTION
Many filter-based publish/subscribe systems assume thatpublishers and subscribers join the broker federation by con-necting to the closest broker [1], [2], [3] or to any brokerwith no restrictions [4], [5], [6], [7], [8]. The former as-sumption may minimize the transmission delay between theclient and broker, and the latter may provide more freedomof choice for the client. Regardless, both policies introduce anunpredictable number of overlay network hops between thepublisher and subscriber that may hinder system performanceand result in high delivery delays. This problem is particularlyimportant in commercial publish/subscribe systems that can-not tolerate server overloads and unexpected response timessuch as GooPS [9], Google’s publish/subscribe system thatintegrates its web applications; SuperMontage [10], Tibco’spublish/subscribe distribution network for Nasdaq’s quote andorder-processing system; and GDSN (Global Data Synchro-nization Network) [11], a global publish/subscribe networkthat allows suppliers and retailers to exchange timely and ac-curate supply chain data. Reducing in-network processing andtransmission delays on publication messages has previouslybeen addressed by reconfiguring the broker topology [12],
Published in the 30th IEEE International Conference on Distributed Com-puting Systems (ICDCS), Genoa, Italy, 2010.
clustering subscribers into multicast-groups to limit publica-tion propagation only among interested peers [13], [14], [15],[16], [17], [18], [19], or incorporating multicast-groups withfilter-based approaches [20].
In this paper, we show that strategic placement of publishersin a content-based publish/subscribe network can improvesystem scalability, robustness, and performance. We presenttwo different placement algorithms, POP (Publisher OptimisticPlacement) and GRAPE (Greedy Relocation Algorithm forPublishers of Events), to intelligently relocate publishers whilekeeping the broker overlay intact to minimize both the av-erage end-to-end delivery delay and system load. Both POPand GRAPE follow a 3-Phase operational design: (1) gatherpublication delivery statistics on the publishers’ publications,(2) identify the target broker to relocate the publisher to,and(3) transparently migrate the publisher to the target broker.Each phase of POP and GRAPE contribute to the algorithms’dynamic, scalable, robust, and transparent properties. Bothalgorithms aredynamic by periodically making relocationdecisions based onlive publication delivery patterns. Both arescalable thanks to the use of distributed design that scaleswith the number of brokers and clients in the network. Bothare robust because an instance of POP or GRAPE runs onevery broker to rule out the possibility of any single pointof failure. Lastly, both aretransparent to application-levelpublish/subscribe clients as publication statistics gathering andpublisher migration all happen behind the scenes; neither re-quire the application’s involvement nor introduce any messageloss.
However, POP and GRAPE are different from each otherdue to design decisions that trade off simplicity for flexibility.(1) POP uses one optimization metric, the average numberof publication deliveries downstream, whereas GRAPE usestwo optimization metrics, the end-to-end delivery delay andtotal broker message rate, to compute the relocation target.(2) GRAPE allows the prioritization of minimizing averagedelivery delay, system load, or any combination of both met-rics simultaneously whereas POP does not give the user thisflexibility. (3) In Phase 1, POP retrieves optimization metricsonce per each traced publication message whereas GRAPEretrieves optimization metrics once per broker selection cycle,thus giving POP and GRAPE different tradeoffs betweenalgorithm response time and message overhead. (4) In Phase 2,POP performs its broker selection in a distributed manner hop-by-hop towards the target broker, whereas GRAPE performs
its broker selection in a centralized manner all locally at thepublisher’s first broker. (5) GRAPE is easier to debug and testrelative to POP because its core computations are centralized.
POP and GRAPE are primarily targeted at enterprise-grademessaging systems consisting of hundreds to thousands ofdedicated servers [9], [21], [22]. These systems include thecommercial publish/subscribe systems mentioned previouslyas well as other systems enabled by publish/subscribe suchas workflow management systems [5], decentralized businessprocess execution [23], automated service composition [24],RSS dissemination [25], [26], network and systems monitoring[27], resource discovery [28] and more.
A motivating application scenario can be found in theGDSN [11] commercial publish/subscribe system where re-tailers subscribe to product information/updates published bysuppliers. To illustrate our point, we derive a real businessscenario from [29] that focuses on the dynamic pricing ofsoft drinks. Retailers on GDSN such as Walmart, Target,SUPERVALU, Metro, Associated Grocers, and many othersare likely subscribed to events published by suppliers thatreport moderate to large changes in the cost of soft drinkscurrently sold (due to peak season, supplier competition,currency fluctuations, etc.) so that shelve prices can be up-dated as soon as possible to maximize profit and minimizeloss. However, retailers are not interested in minute pricechanges because price adjustment on the cent-level for allon-the-shelf products is not economically feasible. Suppliersof soft drink products on GDSN, Coca-Cola Enterprises andPepsiCo, are likely subscribing to all price updates publishedby themselves for record keeping and by their competitorfor close monitoring. If the GDSN is equipped with GRAPEset to minimize solely on average delivery delay, GRAPEwill reconnect the suppliers’ publishing agents close to thehundreds of retailers’ subscriber agents that sink a subsetof thepublishers’ events. The result is quicker price update deliveriesto the subscriber agents for more timely price adjustments.Onthe other hand, with GRAPE set to minimize solely on systemload, GRAPE will reconnect the publishing agents close totheir own and the direct competitor’s subscriber agent thatsink all of the publishers’ events. The result is brokers becomeless loaded, which adds stability and further capacity to theGDSN backbone. If the GDSN is instead equipped with POP,the outcome can be anywhere between the two extremes ofGRAPE: minimizing price update transmission delays and/orchances of system down-times, both of which are cost savingmeasures critical to businesses. These illustrated behaviorsof GRAPE and POP are in fact what we observed in ourexperiments.
The main contributions of this paper are: (1) POP’s Phase1 algorithm which probabilistically traces publication mes-sages and retrieves trace information through replies withdata aggregation, (2) POP’s Phase 2 algorithm which selectsthe target broker in a fully decentralized manner using onlypartial trace data, (3) GRAPE’s Phase 1 algorithm whichtraces publication messages and stores trace results into space-efficient bit vectors for later retrieval through replies with data
aggregation, (4) GRAPE’s Phase 2 algorithm which selects thetarget broker in a centralized manner based on the specifiedprioritization metric and weight, (5) POP and GRAPE’s Phase3 algorithm which transparently migrates the publisher fromthe original to the target broker while introducing minimalmessage overhead, and (6) extensive experiments using real-world data on PlanetLab and a cluster testbed that quantita-tively validate and compare our two approaches. Our resultsshow that POP and GRAPE are able to reduce the averagebroker input utilization by up to 64% and 68%, average brokermessage rate by up to 85% and 85%, and average deliverydelay by up to 63% and 68% on PlanetLab, respectively.
The rest of this paper is organized as follows. SectionIIputs our work in the context of related approaches. SectionsIII and IV describe in detail the architecture and operationof POP and GRAPE, respectively. SectionV evaluates theperformance of both POP and GRAPE implementations in thePADRES publish/subscribe system [1], [23], [28], [30], [31],[32], [33] running on PlanetLab and on a cluster testbed.
II. RELATED WORK
A. Publish/Subscribe Systems
Two main classes of distributed content-based pub-lish/subscribe systems exists today: filter-based [1], [2], [3],[4], [5], [6], [7], [32], [34] and multicast-based [14], [15],[16], [17], [18], [19]. In the filter-based approach, advertise-ments and subscriptions are propagated into the network toestablish paths that guide publications to subscribers. Eachpublication is matched at every broker along the overlay toget forwarded towards neighbors with matching subscriptions.Consequently, the farther the publication travels, the higher isthe delivery delay. In the multicast-based approach, subscriberswith similar interests are clustered into the same multicastgroup. Each publication is matched once to determine thematching multicast group(s) to which the message should bemulticasted, broadcasted, or unicasted. As a result, matchingand transmission of a publication message happens at mostonce, thus incurring minimal delivery delay. However, com-pared to the filter-based approach, subscribers in a multicastgroup may receive unwanted publications because subscriberswith even slightly different interests may still be assigned tothe same group. One possible solution to this problem is theintroduction of filter-based functionality within each multicastgroup [20].
By reconnecting publishers to areas of most populatedand/or highest-rated matching subscribers in filter-basedap-proaches, POP and GRAPE reduce the in-network processingand transmission overhead to the level of multicast-based ap-proaches. At the same time, our algorithms guarantee no false-positive publication delivery and do not have to manage andpartition subscribers into multicast groups. A key distinguish-ing feature of our work is that both POP and GRAPE focus onbringing publishers closer to their subscribers on the overlaynetwork rather than virtually grouping subscribers together.POP and GRAPE are applicable to filter-based approaches
that use tree overlays with or without subscription cover-ing [35], subscription merging [36], [37], and subscriptionsummary [38], [39] optimizations. POP and GRAPE can alsobe adapted to systems where clients take on both publisherand subscriber roles by separating the network connectionsbetween the two entities.
A number of approaches are found in the literature thatalso try to reduce the overlay distance between publishersand subscribers. Baldoniet al. [12] dynamically reconfigureinter-broker overlay links to allow publications to skip overbrokers with no matching subscribers. On the other hand, POPand GRAPE relocate publishers to the location of highest-rated or populated matching subscribers while preserving thebroker overlay. Hence, our work is suited to policy-drivenbroker networks where inter-broker links are statically andtightly controlled by administrators. TERA [40] utilizes ran-dom walks and access point lookup tables to have publicationsdelivered directly from the publisher to clusters of peerswith matching subscriptions. In contrast to our work, TERAoperates on a peer-to-peer architecture, clusters subscribersof similar interests, and supports a topic-based rather than acontent-based language. Through epidemic-based clustering,SUB-2-SUB [13] clusters subscribers of similar interests andpropagates publications only among interested peers. Similarto our work, SUB-2-SUB supports a content-based language.However, SUB-2-SUB’s peer-to-peer architecture is funda-mentally different from the broker-based architecture that POPand GRAPE are designed for: each peer in SUB-2-SUB isassociated with exactlyone subscription, while each brokerin our system is associated withany number of subscriptions,depending on the number of subscriber clients attached to thebroker. This distinction allows SUB-2-SUB to route multipleevents from the same publisher only to interested peers evenif the events are delivered to different sets of peers.
B. Publisher Migration Protocols
Muthusamy et al. [31], [41] proposed several publishermigration protocols with different optimization techniques tostudy the effects of publisher and subscriber migration onsystem performance. The publisher migration protocol thatwepropose in this paper is different in three ways. First, insteadof rebuilding the advertisement tree rooted at the new broker,we simply revise the last hop of the existing advertisementonly on brokers along themigration pathas in [31]. In termsof overhead message count, our approach generatesO(logN) messages, whereas the approach in [41] generatesO(N)messages, whereN is the total number of brokers in a tree-overlay network with typical fan-out greater than one. Second,the advertisement/subscription tree rebuilding period isknownin our approach. This allows our publishers to know preciselythe earliest time to resume publishing at the new brokerwith assurance that those messages will be delivered to allmatching subscribers in the network. Third, the objective in[41] is to analyze the impact of supporting mobile publisherson system performance, whereas here, our objective is tominimize average end-to-end delivery delay and system load
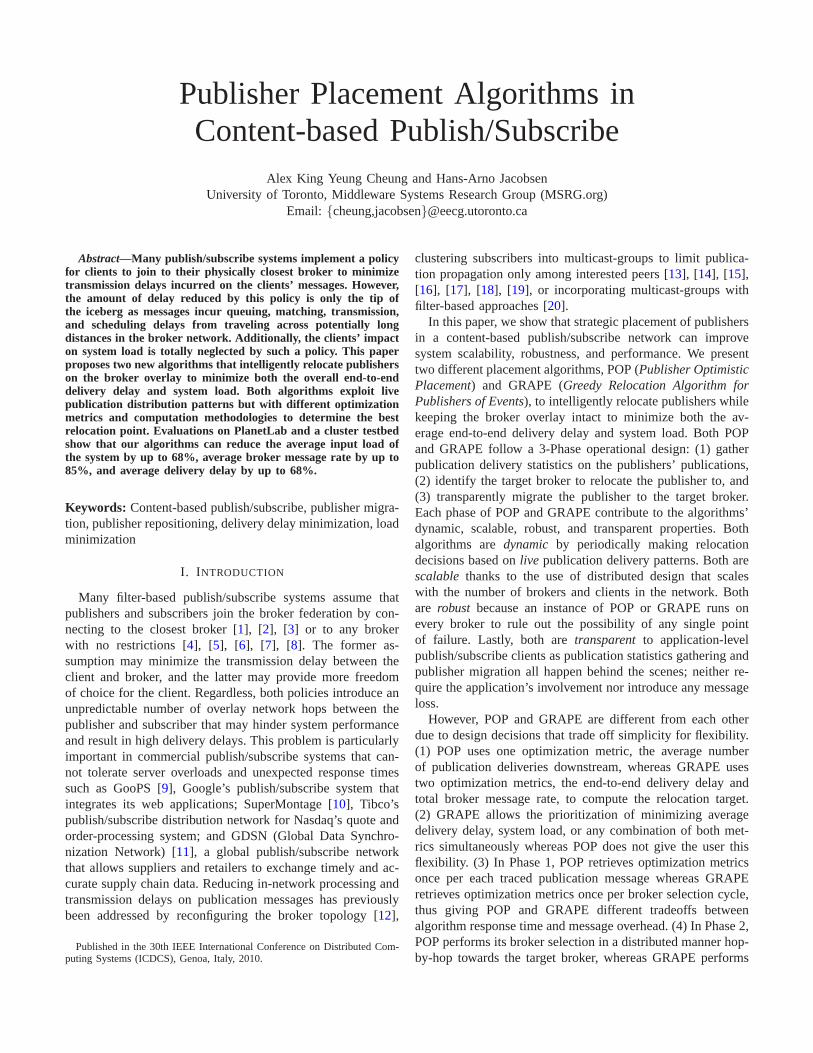
Fig. 1. Example ofPublisher Profile Table
by relocating publishers.
III. T HE POP PLACEMENT ALGORITHM
The rest of this paper makes use of the termsdownstreamandupstreamto identify other brokers relative to an arbitrarilyreferenced broker and a publisher. Downstream brokers arethose that receive publication messages from the referencedbroker, directly or indirectly over multiple neighbors. Inotherwords, downstream brokers are those farther away from thepublisher compared to the referenced broker. The oppositedefinition holds for upstream brokers. Using Figure1 as anexample, if the referenced broker isB6 and the publisher isat B1, thenB7 andB8 are downstream brokers whileB5 andB1 are upstream brokers.
The following sections show POP’s 3-Phase operation indetail. SectionIII-A presents Phase 1, where POP probabilis-tically traces each publisher’slive publications to discoverthe location and number of matching subscribers in the net-work. SectionIII-B describes Phase 2, where POP uses traceinformation obtained from Phase 1 to pinpoint the brokerclosest to the highest number of matching subscribers thatthe publisher should connect to. SectionIII-C presents Phase3, which involves transparently migrating the publisher tothe broker identified in Phase 2 with minimal routing tableupdates. Message sequence diagrams detailing each phaseunder Figure1’s scenario are included in our online Appendix[42] for further clarification. Our evaluation shows that POP’sdata structures use no more than 34% (or 19 MB) of additionalmemory, and message overhead varies between 6% and 57%at two most extreme POP configurations.
A. Phase 1: Distributed Trace Algorithm
The goal of Phase 1 is to gather the average number ofsubscribers downstream of each brokers’ neighbor links foreach publisher client. To realize this goal, we developed (1)an algorithm to tag publication messages to trace where theygot delivered, (2) a reply protocol to notify upstream brokersof the number of subscribers to which the publication wasdelivered at downstream brokers, and (3) a data structure tostore and aggregate results from the traces.
1) Probabilistic Publication Tagging:POP utilizes a spe-cial publication tagging technique to reduce both message andcomputation overhead from publication tracing. Whenever the
publisher’s first brokerhandles a publication message from theclient, it can choose to trace the message by tagging/settingthetrace header field totrue, or disable tracing by leavingtrace at its default value offalse. Tagging is based onPtrace, which is defined by the function:Ptrace = 1 − T
N.
Here,T is the number of messages already tagged for tracingin the current time windowW , and N is a configurableparameter that limits the maximum number of publicationmessages traced in time windowW . By default, N is setto 50 andW to 60 s. Each publisher is associated with itsown value ofT . The advantages of using thePtrace functionover a constant function are: (1) the number of publicationstraced withinW is bounded byN , (2) for extremely low-ratedpublishers, at least one publication message is tagged with100% probability in each time window, and (3) for high-ratedpublishers, this equation offers a higher chance of taggingpublication messages sent near the end of each time window.
2) Trace Result Notification:On handling a publicationmessage with atrue value in thetrace header field, thebroker has to send back to the upstream broker aTrace ResultMessage (TRM). A TRM contains two fields: (1)publisher’sadvertisement IDobtained from the publication’s header and(2) cumulative subscriber count, which is the total numberof subscribers at and downstream of the reporting broker. Abroker can only send aTRM to the upstream broker if any ofthe following two conditions are satisfied: (1) the publicationmessage isonly delivered to subscribers or (2) a correspondingTRM is received from each neighbor to which the publicationmessage is sent.
3) Publisher Profile Table:POP stores trace results foreach publisher into aPublisher Profile Table (PPTable)whichhas two columns: (1)downstream brokerand (2) theaveragenumber of subscribers. A running average is used to maintainthe average number of subscribers because it has the benefitof efficiently aggregating multiple values to conserve space.By default, the running average gives a weight of 0.25 tothe newest value and 0.75 to the last average value. Figure1shows an example of thePPTableat each broker after tracingone publication message that got delivered to all illustratedsubscribers.
B. Phase 2: Decentralized Broker Selection Algorithm
The goal of Phase 2 is to use thePPTablesgathered inPhase 1 to incrementally pinpoint the broker closest to thehighest number of matching subscribers, which we refer toas theclosestbroker from here on. POP’s Phase 2 algorithmis initiated after two conditions are met: (1) the numberof publications traced meets the thresholdPtℎresℎold and(2) the publisher does not have any outstanding publicationtrace results (so as to prevent trace data inconsistency amongbrokers). By defaultPtℎresℎold is set to 100. On Phase 2 initi-ation, POP in the publisher’s first broker creates aRelocationRequest Message (RRM). TheRRM contains three values: (1)publisher’s advertisement ID, (2) total number of subscribersdown the link from which this request is sent, and (3)list ofbrokers traversed by thisRRM in decreasing order ofclosest
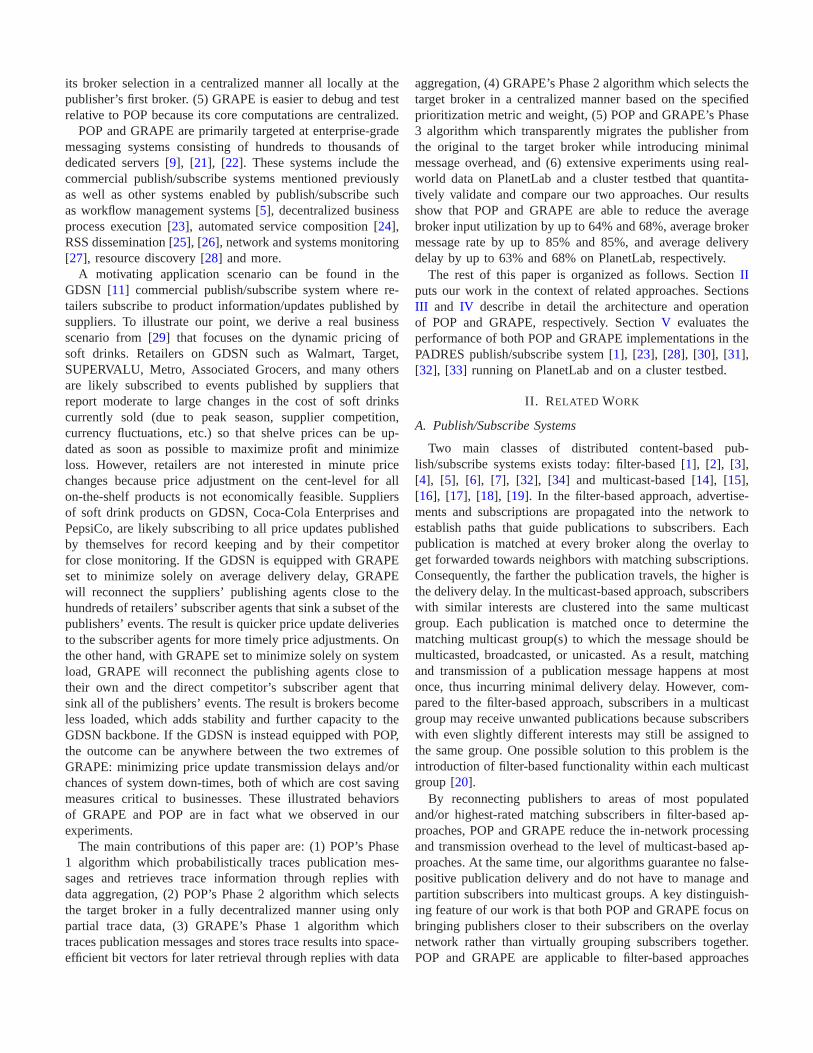
(a) Neighbor B1 satis-fies the closest condi-tion
(b) No neighbors sat-isfy closest condition.Closestbroker isB2
(c) The original brokeris theclosestbroker
Fig. 2. All possible outcomes of POP’s broker selection algorithm
location. The latter field identifies brokers on themigrationpath that need routing table updates in Phase 3.
When a broker creates or receives aRRM, it has to de-termine the nextclosestneighboring broker to forward themessage to. The nextclosestneighboring broker is:
the one whose number of downstream subscribersis greater than the sum of all other neighbors’downstream subscribers plus the local broker’s sub-scribers.
If no neighbor broker satisfies theclosestcondition, thenthe closestbroker is itself. Note that each broker handlingthe RRM has its own definition of downstream as will beshown through an example in the next paragraph. The closestcondition can be extended to include a threshold parameterto dampen any potential ping-pong effect when the differenceis just one. However, we will leave this extension for futurework and just focus on POP with minimal optimizations inthis paper. Figure2 summarizes all three possible outcomesof the broker selection algorithm. If theclosestbroker isnotthe originator of theRRM, then aRelocation Answer Message(RAM) is sent back to the originator with thepublisher’sadvertisement IDand thelist of brokerstraversed by theRRMincluding theclosestbroker itself. Otherwise, the publisher isalready at theclosestbroker, in which case Phase 3 is abortedand Phase 1 will be initiated again after gettingPtℎresℎold newtrace results.
Using brokerB1 in Figure 1 as an example, sinceB5’ssum of 15 from thePPTable is greater than the sum ofB2, B4, and B1, 6 + 3 + 1 = 10, B5 is the nextclosestbroker. As a result,B1 updates and forwards theRRM to B5.Specifically,B1 adds itself to the head of thebroker list andincrements thetotal number of subscribersfield by 10, whichis the number of subscribers at the local brokerB1 plus thenumber of subscribers at and downstream of allnon-closestneighbors, namelyB2 andB4. Upon receiving theRRM fromB1, B5 finds that the number of subscribers downstream toB6 (according to thePPTable) is greater than the numberof subscribers downstream toB1 (according to theRRM).Therefore,B5 updates theRRM’s broker list to [B5, B1] andforwards the message toB6. Upon receiving theRRM fromB5, B6 discovers that there are 10 subscribers downstream toB5. Since no neighbor is able to satisfy theclosestcondition,B6 determines itself to be theclosestbroker and sends aRAMback toB1 to initiate Phase 3.
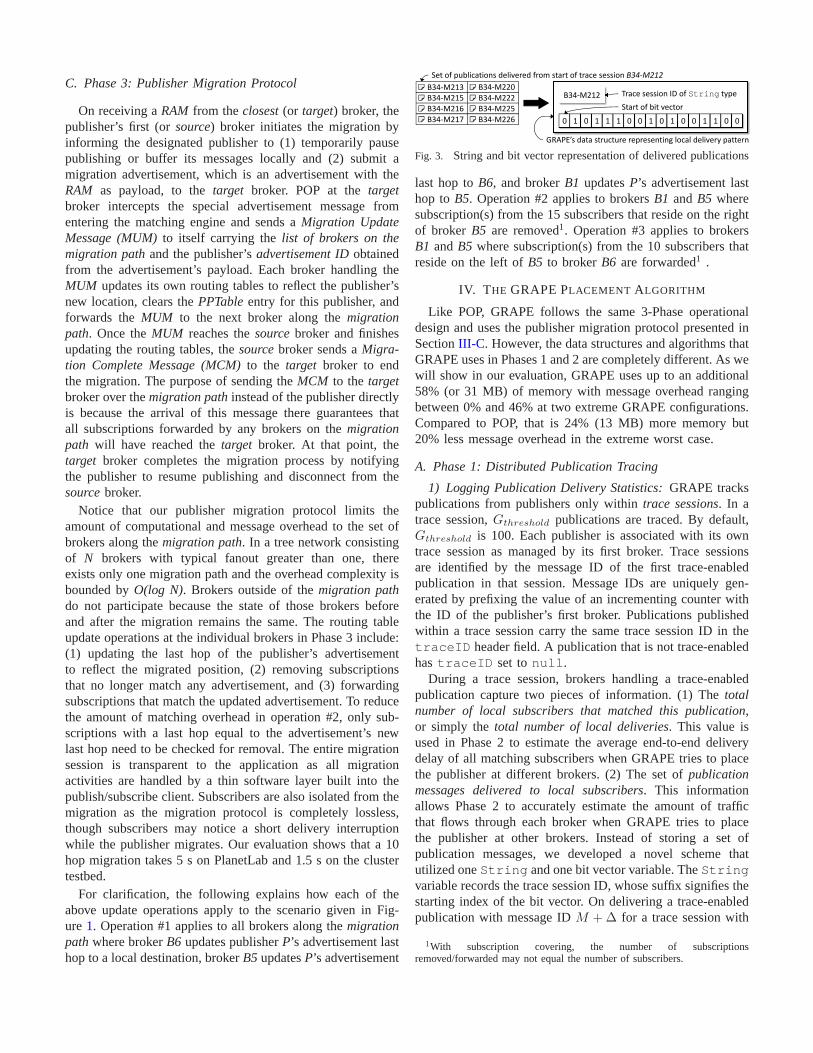
C. Phase 3: Publisher Migration Protocol
On receiving aRAM from theclosest(or target) broker, thepublisher’s first (orsource) broker initiates the migration byinforming the designated publisher to (1) temporarily pausepublishing or buffer its messages locally and (2) submit amigration advertisement, which is an advertisement with theRAM as payload, to thetarget broker. POP at thetargetbroker intercepts the special advertisement message fromentering the matching engine and sends aMigration UpdateMessage (MUM)to itself carrying thelist of brokers on themigration pathand the publisher’sadvertisement IDobtainedfrom the advertisement’s payload. Each broker handling theMUM updates its own routing tables to reflect the publisher’snew location, clears thePPTableentry for this publisher, andforwards theMUM to the next broker along themigrationpath. Once theMUM reaches thesourcebroker and finishesupdating the routing tables, thesourcebroker sends aMigra-tion Complete Message (MCM)to the target broker to endthe migration. The purpose of sending theMCM to the targetbroker over themigration pathinstead of the publisher directlyis because the arrival of this message there guarantees thatall subscriptions forwarded by any brokers on themigrationpath will have reached thetarget broker. At that point, thetarget broker completes the migration process by notifyingthe publisher to resume publishing and disconnect from thesourcebroker.
Notice that our publisher migration protocol limits theamount of computational and message overhead to the set ofbrokers along themigration path. In a tree network consistingof N brokers with typical fanout greater than one, thereexists only one migration path and the overhead complexity isbounded byO(log N). Brokers outside of themigration pathdo not participate because the state of those brokers beforeand after the migration remains the same. The routing tableupdate operations at the individual brokers in Phase 3 include:(1) updating the last hop of the publisher’s advertisementto reflect the migrated position, (2) removing subscriptionsthat no longer match any advertisement, and (3) forwardingsubscriptions that match the updated advertisement. To reducethe amount of matching overhead in operation #2, only sub-scriptions with a last hop equal to the advertisement’s newlast hop need to be checked for removal. The entire migrationsession is transparent to the application as all migrationactivities are handled by a thin software layer built into thepublish/subscribe client. Subscribers are also isolated from themigration as the migration protocol is completely lossless,though subscribers may notice a short delivery interruptionwhile the publisher migrates. Our evaluation shows that a 10hop migration takes 5 s on PlanetLab and 1.5 s on the clustertestbed.
For clarification, the following explains how each of theabove update operations apply to the scenario given in Fig-ure 1. Operation #1 applies to all brokers along themigrationpathwhere brokerB6 updates publisherP’s advertisement lasthop to a local destination, brokerB5 updatesP’s advertisement
B34-M213
B34-M215
B34-M216
B34-M217
B34-M220
B34-M222
B34-M225
B34-M226 0 1 0 1 1 1 1111 0000000
Trace session ID of String type
Start of bit vector
Set of publications delivered from start of trace session B34-M212
GRAPE’s data structure representing local delivery pattern
B34-M212
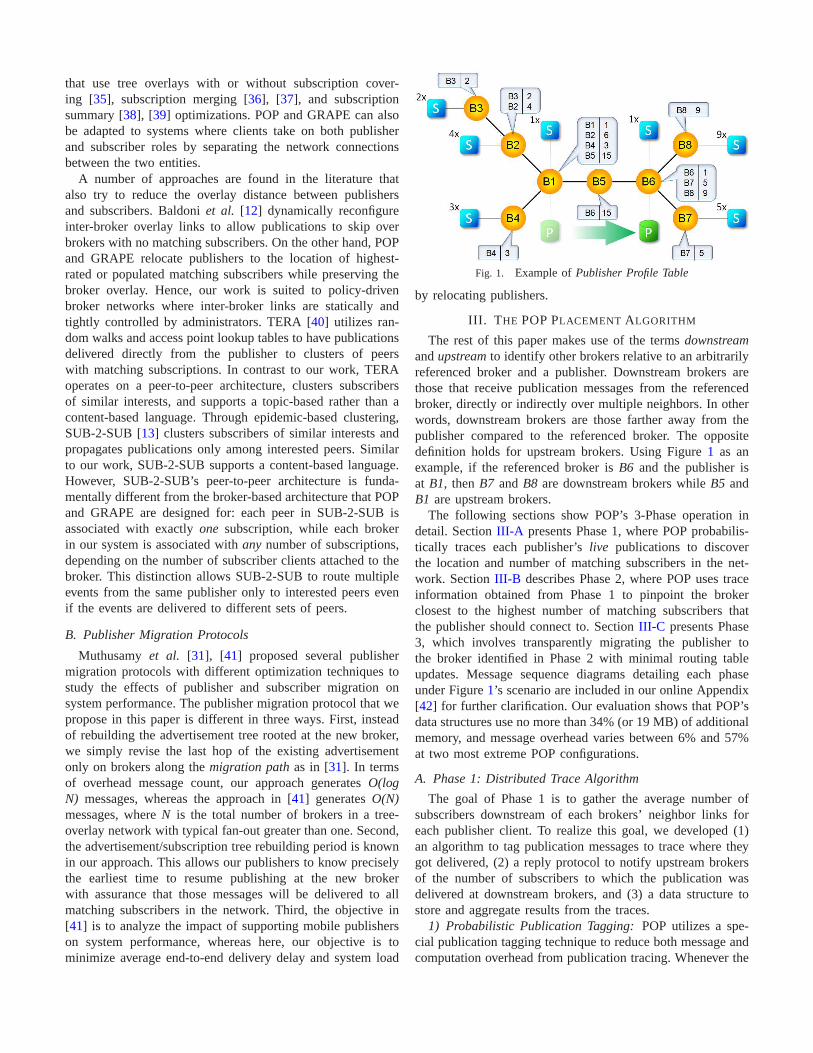
Fig. 3. String and bit vector representation of delivered publications
last hop toB6, and brokerB1 updatesP’s advertisement lasthop toB5. Operation #2 applies to brokersB1 andB5 wheresubscription(s) from the 15 subscribers that reside on the rightof broker B5 are removed1. Operation #3 applies to brokersB1 andB5 where subscription(s) from the 10 subscribers thatreside on the left ofB5 to brokerB6 are forwarded1 .
IV. T HE GRAPE PLACEMENT ALGORITHM
Like POP, GRAPE follows the same 3-Phase operationaldesign and uses the publisher migration protocol presentedinSectionIII-C. However, the data structures and algorithms thatGRAPE uses in Phases 1 and 2 are completely different. As wewill show in our evaluation, GRAPE uses up to an additional58% (or 31 MB) of memory with message overhead rangingbetween 0% and 46% at two extreme GRAPE configurations.Compared to POP, that is 24% (13 MB) more memory but20% less message overhead in the extreme worst case.
A. Phase 1: Distributed Publication Tracing
1) Logging Publication Delivery Statistics:GRAPE trackspublications from publishers only withintrace sessions. In atrace session,Gtℎresℎold publications are traced. By default,Gtℎresℎold is 100. Each publisher is associated with its owntrace session as managed by its first broker. Trace sessionsare identified by the message ID of the first trace-enabledpublication in that session. Message IDs are uniquely gen-erated by prefixing the value of an incrementing counter withthe ID of the publisher’s first broker. Publications publishedwithin a trace session carry the same trace session ID in thetraceID header field. A publication that is not trace-enabledhastraceID set tonull.
During a trace session, brokers handling a trace-enabledpublication capture two pieces of information. (1) Thetotalnumber of local subscribers that matched this publication,or simply thetotal number of local deliveries. This value isused in Phase 2 to estimate the average end-to-end deliverydelay of all matching subscribers when GRAPE tries to placethe publisher at different brokers. (2) The set ofpublicationmessages delivered to local subscribers. This informationallows Phase 2 to accurately estimate the amount of trafficthat flows through each broker when GRAPE tries to placethe publisher at other brokers. Instead of storing a set ofpublication messages, we developed a novel scheme thatutilized oneString and one bit vector variable. TheStringvariable records the trace session ID, whose suffix signifiesthestarting index of the bit vector. On delivering a trace-enabledpublication with message IDM +Δ for a trace session with
1With subscription covering, the number of subscriptionsremoved/forwarded may not equal the number of subscribers.
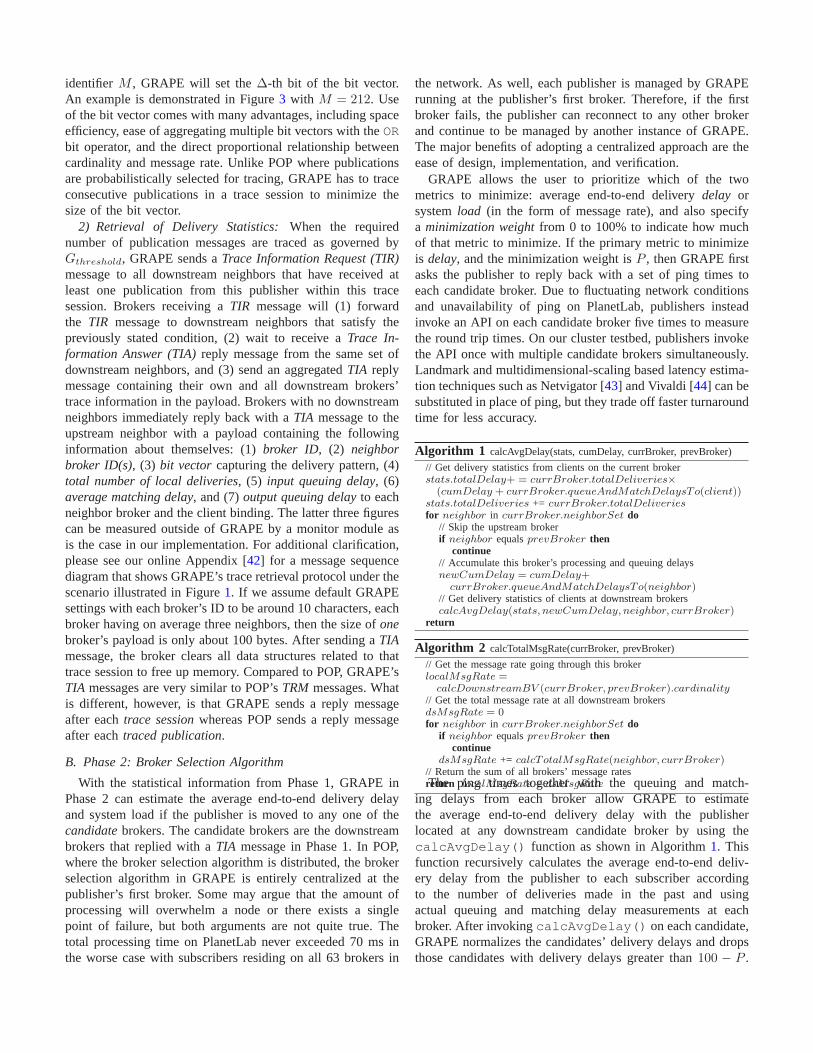
identifier M , GRAPE will set theΔ-th bit of the bit vector.An example is demonstrated in Figure3 with M = 212. Useof the bit vector comes with many advantages, including spaceefficiency, ease of aggregating multiple bit vectors with theORbit operator, and the direct proportional relationship betweencardinality and message rate. Unlike POP where publicationsare probabilistically selected for tracing, GRAPE has to traceconsecutive publications in a trace session to minimize thesize of the bit vector.
2) Retrieval of Delivery Statistics:When the requirednumber of publication messages are traced as governed byGtℎresℎold, GRAPE sends aTrace Information Request (TIR)message to all downstream neighbors that have received atleast one publication from this publisher within this tracesession. Brokers receiving aTIR message will (1) forwardthe TIR message to downstream neighbors that satisfy thepreviously stated condition, (2) wait to receive aTrace In-formation Answer (TIA)reply message from the same set ofdownstream neighbors, and (3) send an aggregatedTIA replymessage containing their own and all downstream brokers’trace information in the payload. Brokers with no downstreamneighbors immediately reply back with aTIA message to theupstream neighbor with a payload containing the followinginformation about themselves: (1)broker ID, (2) neighborbroker ID(s), (3) bit vector capturing the delivery pattern, (4)total number of local deliveries, (5) input queuing delay, (6)average matching delay, and (7)output queuing delayto eachneighbor broker and the client binding. The latter three figurescan be measured outside of GRAPE by a monitor module asis the case in our implementation. For additional clarification,please see our online Appendix [42] for a message sequencediagram that shows GRAPE’s trace retrieval protocol under thescenario illustrated in Figure1. If we assume default GRAPEsettings with each broker’s ID to be around 10 characters, eachbroker having on average three neighbors, then the size ofonebroker’s payload is only about 100 bytes. After sending aTIAmessage, the broker clears all data structures related to thattrace session to free up memory. Compared to POP, GRAPE’sTIA messages are very similar to POP’sTRM messages. Whatis different, however, is that GRAPE sends a reply messageafter eachtrace sessionwhereas POP sends a reply messageafter eachtraced publication.
B. Phase 2: Broker Selection Algorithm
With the statistical information from Phase 1, GRAPE inPhase 2 can estimate the average end-to-end delivery delayand system load if the publisher is moved to any one of thecandidatebrokers. The candidate brokers are the downstreambrokers that replied with aTIA message in Phase 1. In POP,where the broker selection algorithm is distributed, the brokerselection algorithm in GRAPE is entirely centralized at thepublisher’s first broker. Some may argue that the amount ofprocessing will overwhelm a node or there exists a singlepoint of failure, but both arguments are not quite true. Thetotal processing time on PlanetLab never exceeded 70 ms inthe worse case with subscribers residing on all 63 brokers in
the network. As well, each publisher is managed by GRAPErunning at the publisher’s first broker. Therefore, if the firstbroker fails, the publisher can reconnect to any other brokerand continue to be managed by another instance of GRAPE.The major benefits of adopting a centralized approach are theease of design, implementation, and verification.
GRAPE allows the user to prioritize which of the twometrics to minimize: average end-to-end deliverydelay orsystemload (in the form of message rate), and also specifya minimization weightfrom 0 to 100% to indicate how muchof that metric to minimize. If the primary metric to minimizeis delay, and the minimization weight isP , then GRAPE firstasks the publisher to reply back with a set of ping times toeach candidate broker. Due to fluctuating network conditionsand unavailability of ping on PlanetLab, publishers insteadinvoke an API on each candidate broker five times to measurethe round trip times. On our cluster testbed, publishers invokethe API once with multiple candidate brokers simultaneously.Landmark and multidimensional-scaling based latency estima-tion techniques such as Netvigator [43] and Vivaldi [44] can besubstituted in place of ping, but they trade off faster turnaroundtime for less accuracy.
Algorithm 1 calcAvgDelay(stats, cumDelay, currBroker, prevBroker)
// Get delivery statistics from clients on the current brokerstats.totalDelay+ = currBroker.totalDeliveries×
(cumDelay + currBroker.queueAndMatcℎDelaysTo(client))stats.totalDeliveries += currBroker.totalDeliveriesfor neigℎbor in currBroker.neigℎborSet do
// Skip the upstream brokerif neigℎbor equalsprevBroker then
continue// Accumulate this broker’s processing and queuing delaysnewCumDelay = cumDelay+
currBroker.queueAndMatcℎDelaysTo(neigℎbor)// Get delivery statistics of clients at downstream brokerscalcAvgDelay(stats, newCumDelay, neigℎbor, currBroker)
return
Algorithm 2 calcTotalMsgRate(currBroker, prevBroker)
// Get the message rate going through this brokerlocalMsgRate =
calcDownstreamBV (currBroker, prevBroker).cardinality// Get the total message rate at all downstream brokersdsMsgRate = 0for neigℎbor in currBroker.neigℎborSet do
if neigℎbor equalsprevBroker thencontinue
dsMsgRate += calcTotalMsgRate(neigℎbor, currBroker)// Return the sum of all brokers’ message ratesreturn localMsgRate+ dsMsgRateThe ping times together with the queuing and match-
ing delays from each broker allow GRAPE to estimatethe average end-to-end delivery delay with the publisherlocated at any downstream candidate broker by using thecalcAvgDelay() function as shown in Algorithm1. Thisfunction recursively calculates the average end-to-end deliv-ery delay from the publisher to each subscriber accordingto the number of deliveries made in the past and usingactual queuing and matching delay measurements at eachbroker. After invokingcalcAvgDelay() on each candidate,GRAPE normalizes the candidates’ delivery delays and dropsthose candidates with delivery delays greater than100 − P .
Messages
Input Bindings
(WS, RMI, GRID,
JMS, TCP/IP, etc)
Input Queue
Matching Engine
Broker Core
(Queue Manager)
Neighbor
Bindings
(RMI, WS, etc)
Output Queue
Client Bindings
Monitor
POP
GRAPE
Output Queue
Output Queue
Output Queue
Client Bindings
(RMI, WS, GRID,
JMS, TCP/IP, etc)
Output Queue
Load
Balancer
Output Queue
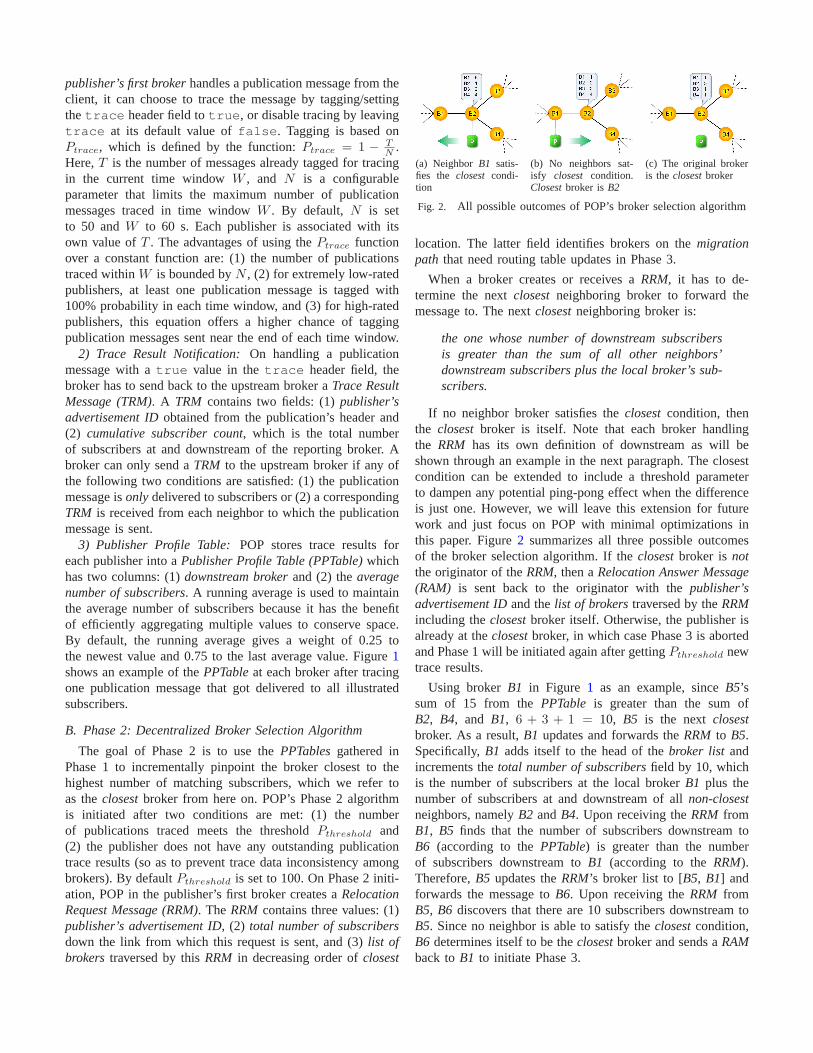
(a) POP and GRAPE in the PADRES broker
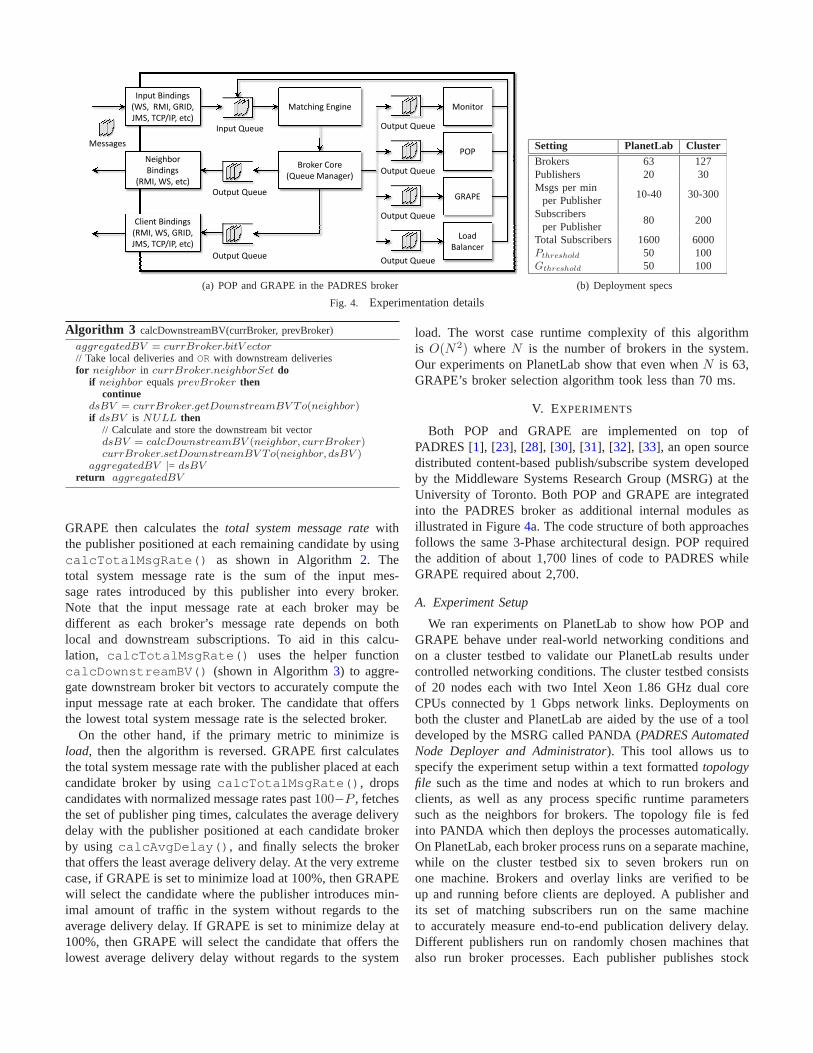
Setting PlanetLab ClusterBrokers 63 127Publishers 20 30Msgs per min
10-40 30-300per Publisher
Subscribers80 200
per PublisherTotal Subscribers 1600 6000Ptℎresℎold 50 100Gtℎresℎold 50 100
(b) Deployment specs
Fig. 4. Experimentation details
Algorithm 3 calcDownstreamBV(currBroker, prevBroker)
aggregatedBV = currBroker.bitV ector// Take local deliveries andOR with downstream deliveriesfor neigℎbor in currBroker.neigℎborSet do
if neigℎbor equalsprevBroker thencontinue
dsBV = currBroker.getDownstreamBV To(neigℎbor)if dsBV is NULL then
// Calculate and store the downstream bit vectordsBV = calcDownstreamBV (neigℎbor, currBroker)currBroker.setDownstreamBV To(neigℎbor, dsBV )
aggregatedBV ∣= dsBVreturn aggregatedBV
GRAPE then calculates thetotal system message ratewiththe publisher positioned at each remaining candidate by usingcalcTotalMsgRate() as shown in Algorithm2. Thetotal system message rate is the sum of the input mes-sage rates introduced by this publisher into every broker.Note that the input message rate at each broker may bedifferent as each broker’s message rate depends on bothlocal and downstream subscriptions. To aid in this calcu-lation, calcTotalMsgRate() uses the helper functioncalcDownstreamBV() (shown in Algorithm3) to aggre-gate downstream broker bit vectors to accurately compute theinput message rate at each broker. The candidate that offersthe lowest total system message rate is the selected broker.
On the other hand, if the primary metric to minimize isload, then the algorithm is reversed. GRAPE first calculatesthe total system message rate with the publisher placed at eachcandidate broker by usingcalcTotalMsgRate(), dropscandidates with normalized message rates past100−P , fetchesthe set of publisher ping times, calculates the average deliverydelay with the publisher positioned at each candidate brokerby usingcalcAvgDelay(), and finally selects the brokerthat offers the least average delivery delay. At the very extremecase, if GRAPE is set to minimize load at 100%, then GRAPEwill select the candidate where the publisher introduces min-imal amount of traffic in the system without regards to theaverage delivery delay. If GRAPE is set to minimize delay at100%, then GRAPE will select the candidate that offers thelowest average delivery delay without regards to the system
load. The worst case runtime complexity of this algorithmis O(N2) whereN is the number of brokers in the system.Our experiments on PlanetLab show that even whenN is 63,GRAPE’s broker selection algorithm took less than 70 ms.
V. EXPERIMENTS
Both POP and GRAPE are implemented on top ofPADRES [1], [23], [28], [30], [31], [32], [33], an open sourcedistributed content-based publish/subscribe system developedby the Middleware Systems Research Group (MSRG) at theUniversity of Toronto. Both POP and GRAPE are integratedinto the PADRES broker as additional internal modules asillustrated in Figure4a. The code structure of both approachesfollows the same 3-Phase architectural design. POP requiredthe addition of about 1,700 lines of code to PADRES whileGRAPE required about 2,700.
A. Experiment Setup
We ran experiments on PlanetLab to show how POP andGRAPE behave under real-world networking conditions andon a cluster testbed to validate our PlanetLab results undercontrolled networking conditions. The cluster testbed consistsof 20 nodes each with two Intel Xeon 1.86 GHz dual coreCPUs connected by 1 Gbps network links. Deployments onboth the cluster and PlanetLab are aided by the use of a tooldeveloped by the MSRG called PANDA (PADRES AutomatedNode Deployer and Administrator). This tool allows us tospecify the experiment setup within a text formattedtopologyfile such as the time and nodes at which to run brokers andclients, as well as any process specific runtime parameterssuch as the neighbors for brokers. The topology file is fedinto PANDA which then deploys the processes automatically.On PlanetLab, each broker process runs on a separate machine,while on the cluster testbed six to seven brokers run onone machine. Brokers and overlay links are verified to beup and running before clients are deployed. A publisher andits set of matching subscribers run on the same machineto accurately measure end-to-end publication delivery delay.Different publishers run on randomly chosen machines thatalso run broker processes. Each publisher publishes stock
quote publications of a particular stock that are real-worldvalues obtained from Yahoo! Finance containing a stock’sdaily closing prices.2 A typical publication looks like this:[class,‘STOCK’],[symbol,‘YHOO’],[open,18.37],
[high,18.6],[low,18.37],[close,18.37],[volume,6200],[date,‘5-Sep-96’],[openClose%Diff,0.0],[highLow%Diff,0.014],[closeEqualsLow,‘true’],[closeEqualsHigh,‘false’]
We ran experiments on both PlanetLab and the clustertestbed using two different subscriber traffic distributions.One is randomwhere 70% of the subscribers are low-rated,meaning they sink about 10% of their publishers’ traffic;25% are medium-rated, meaning they sink about 50% of theirpublishers’ traffic; and 5% are high-rated, meaning they sinkall of their publishers’ traffic. Subscribers of each categoryare randomly assigned toX number of brokers, where X isvaried in our experiments. The other distribution is referredto asenterprise, where 95% of the subscribers are low-ratedand 5% are high-rated. All high-rated subscribers connect toone broker, while low-rated subscribers are randomly assignedto the otherX − 1 brokers. The random workload representsa generic scenario, while the enterprise workload mimics anenterprise deployment consisting of a database sinking alltraffic at the main office and many end-users subscribingto selected traffic at different branch office locations. Anexample of low, medium, and high-rated subscriptions toYHOO stockquotes are shown below:low - [class,=,‘STOCK’],[symbol,=,‘YHOO’],
[highLow%Diff,>,0.15]medium - [class,=,‘STOCK’],[symbol,=,‘YHOO’],
[volume,>,1000000],[openClose%Diff,>,0.025]high - [class,=,‘STOCK’],[symbol,=,‘YHOO’]
The overlay topology we used for all evaluations is abalanced tree with a fan-out of 2 or 4. The number ofpublishers, subscribers, brokers and all other settings weusedon PlanetLab and the cluster testbed are shown in Figure4b.Unless otherwise stated, default POP and GRAPE settings areused.
B. Experiment Results
We evaluated POP and GRAPE with real-world data sets onPlanetLab and a cluster testbed while varying the subscriberdistributions, GRAPE’s minimization metric (which is eitherthe end-to-end delivery delay or system load), GRAPE’sminimization weight, and number of samples for triggeringbroker selection. For graphs without time as the x-axis, theplotted values are obtained at the end of the experiment, whichis 18 minutes after all clients are deployed. All graphs useaverage values across all brokers or clients in the system.Due to limited space, we can only include a small subsetof the graphs here with the full set in an online Appendix[42]. Nevertheless, we summarize all of our results here in thispaper. From this point on, we will use the notationload 75%(delay 25%) to denote GRAPE’s configuration to prioritizeon minimizing average system load (delivery delay) with 75%(25%) weight.
2Available at http://research.msrg.utoronto.ca/Padres/DataSets
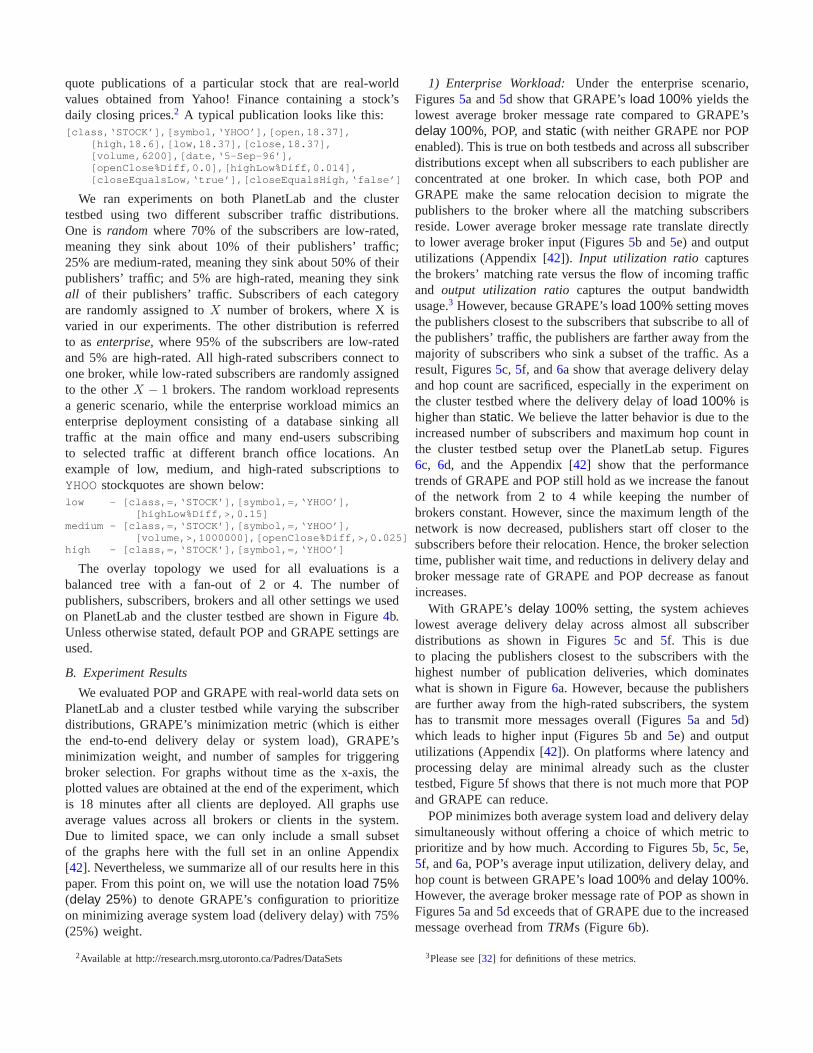
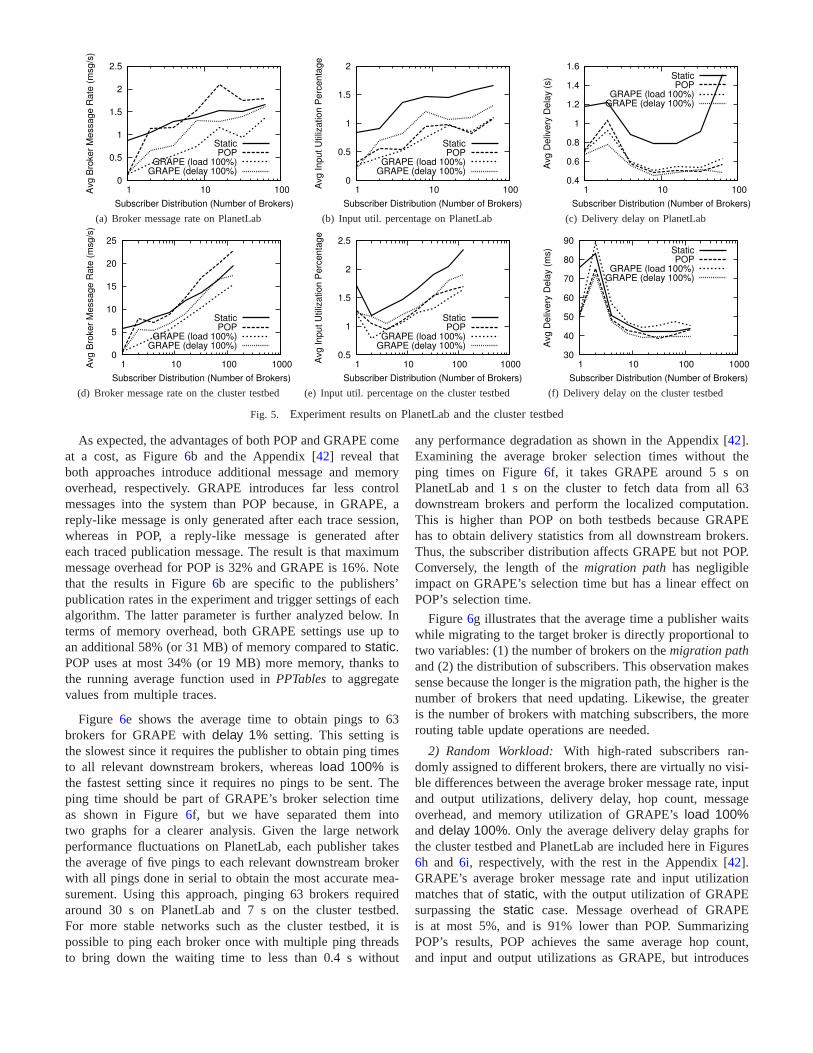
1) Enterprise Workload: Under the enterprise scenario,Figures5a and5d show that GRAPE’sload 100% yields thelowest average broker message rate compared to GRAPE’sdelay 100%, POP, andstatic (with neither GRAPE nor POPenabled). This is true on both testbeds and across all subscriberdistributions except when all subscribers to each publisher areconcentrated at one broker. In which case, both POP andGRAPE make the same relocation decision to migrate thepublishers to the broker where all the matching subscribersreside. Lower average broker message rate translate directlyto lower average broker input (Figures5b and5e) and outpututilizations (Appendix [42]). Input utilization ratio capturesthe brokers’ matching rate versus the flow of incoming trafficand output utilization ratio captures the output bandwidthusage.3 However, because GRAPE’sload 100% setting movesthe publishers closest to the subscribers that subscribe toall ofthe publishers’ traffic, the publishers are farther away from themajority of subscribers who sink a subset of the traffic. As aresult, Figures5c, 5f, and6a show that average delivery delayand hop count are sacrificed, especially in the experiment onthe cluster testbed where the delivery delay ofload 100% ishigher thanstatic. We believe the latter behavior is due to theincreased number of subscribers and maximum hop count inthe cluster testbed setup over the PlanetLab setup. Figures6c, 6d, and the Appendix [42] show that the performancetrends of GRAPE and POP still hold as we increase the fanoutof the network from 2 to 4 while keeping the number ofbrokers constant. However, since the maximum length of thenetwork is now decreased, publishers start off closer to thesubscribers before their relocation. Hence, the broker selectiontime, publisher wait time, and reductions in delivery delayandbroker message rate of GRAPE and POP decrease as fanoutincreases.
With GRAPE’s delay 100% setting, the system achieveslowest average delivery delay across almost all subscriberdistributions as shown in Figures5c and 5f. This is dueto placing the publishers closest to the subscribers with thehighest number of publication deliveries, which dominateswhat is shown in Figure6a. However, because the publishersare further away from the high-rated subscribers, the systemhas to transmit more messages overall (Figures5a and5d)which leads to higher input (Figures5b and 5e) and outpututilizations (Appendix [42]). On platforms where latency andprocessing delay are minimal already such as the clustertestbed, Figure5f shows that there is not much more that POPand GRAPE can reduce.
POP minimizes both average system load and delivery delaysimultaneously without offering a choice of which metric toprioritize and by how much. According to Figures5b, 5c, 5e,5f, and6a, POP’s average input utilization, delivery delay, andhop count is between GRAPE’sload 100% anddelay 100%.However, the average broker message rate of POP as shown inFigures5a and5d exceeds that of GRAPE due to the increasedmessage overhead fromTRMs (Figure6b).
3Please see [32] for definitions of these metrics.
0
0.5
1
1.5
2
2.5
1 10 100Avg B
roker
Message R
ate
(m
sg/s
)
Subscriber Distribution (Number of Brokers)
StaticPOP
GRAPE (load 100%)GRAPE (delay 100%)
(a) Broker message rate on PlanetLab
0
0.5
1
1.5
2
1 10 100Avg Input U
tiliz
ation P
erc
enta
ge
Subscriber Distribution (Number of Brokers)
StaticPOP
GRAPE (load 100%)GRAPE (delay 100%)
(b) Input util. percentage on PlanetLab
0.4
0.6
0.8
1
1.2
1.4
1.6
1 10 100
Avg D
eliv
ery
Dela
y (
s)
Subscriber Distribution (Number of Brokers)
StaticPOP
GRAPE (load 100%)GRAPE (delay 100%)
(c) Delivery delay on PlanetLab
0
5
10
15
20
25
1 10 100 1000Avg B
roker
Message R
ate
(m
sg/s
)
Subscriber Distribution (Number of Brokers)
StaticPOP
GRAPE (load 100%)GRAPE (delay 100%)
(d) Broker message rate on the cluster testbed
0.5
1
1.5
2
2.5
1 10 100 1000Avg Input U
tiliz
ation P
erc
enta
ge
Subscriber Distribution (Number of Brokers)
StaticPOP
GRAPE (load 100%)GRAPE (delay 100%)
(e) Input util. percentage on the cluster testbed
30
40
50
60
70
80
90
1 10 100 1000
Avg D
eliv
ery
Dela
y (
ms)
Subscriber Distribution (Number of Brokers)
StaticPOP
GRAPE (load 100%)GRAPE (delay 100%)
(f) Delivery delay on the cluster testbed
Fig. 5. Experiment results on PlanetLab and the cluster testbed
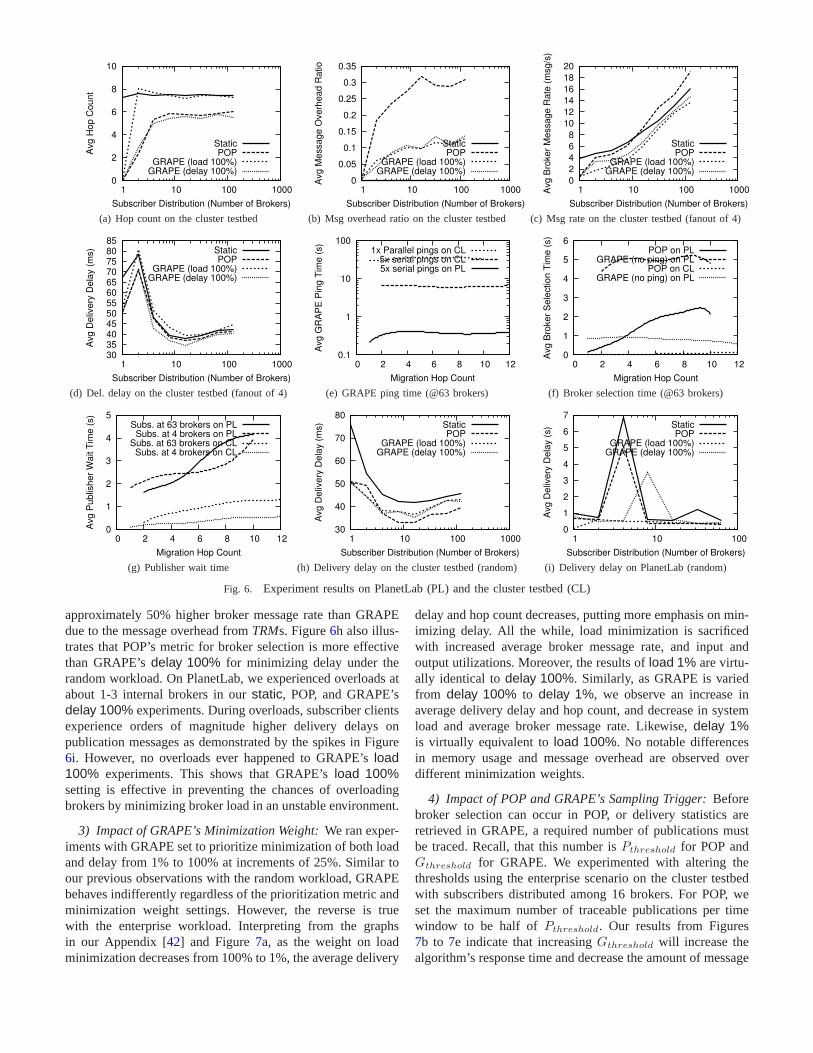
As expected, the advantages of both POP and GRAPE comeat a cost, as Figure6b and the Appendix [42] reveal thatboth approaches introduce additional message and memoryoverhead, respectively. GRAPE introduces far less controlmessages into the system than POP because, in GRAPE, areply-like message is only generated after each trace session,whereas in POP, a reply-like message is generated aftereach traced publication message. The result is that maximummessage overhead for POP is 32% and GRAPE is 16%. Notethat the results in Figure6b are specific to the publishers’publication rates in the experiment and trigger settings ofeachalgorithm. The latter parameter is further analyzed below.Interms of memory overhead, both GRAPE settings use up toan additional 58% (or 31 MB) of memory compared tostatic.POP uses at most 34% (or 19 MB) more memory, thanks tothe running average function used inPPTablesto aggregatevalues from multiple traces.
Figure 6e shows the average time to obtain pings to 63brokers for GRAPE withdelay 1% setting. This setting isthe slowest since it requires the publisher to obtain ping timesto all relevant downstream brokers, whereasload 100% isthe fastest setting since it requires no pings to be sent. Theping time should be part of GRAPE’s broker selection timeas shown in Figure6f, but we have separated them intotwo graphs for a clearer analysis. Given the large networkperformance fluctuations on PlanetLab, each publisher takesthe average of five pings to each relevant downstream brokerwith all pings done in serial to obtain the most accurate mea-surement. Using this approach, pinging 63 brokers requiredaround 30 s on PlanetLab and 7 s on the cluster testbed.For more stable networks such as the cluster testbed, it ispossible to ping each broker once with multiple ping threadsto bring down the waiting time to less than 0.4 s without
any performance degradation as shown in the Appendix [42].Examining the average broker selection times without theping times on Figure6f, it takes GRAPE around 5 s onPlanetLab and 1 s on the cluster to fetch data from all 63downstream brokers and perform the localized computation.This is higher than POP on both testbeds because GRAPEhas to obtain delivery statistics from all downstream brokers.Thus, the subscriber distribution affects GRAPE but not POP.Conversely, the length of themigration pathhas negligibleimpact on GRAPE’s selection time but has a linear effect onPOP’s selection time.
Figure6g illustrates that the average time a publisher waitswhile migrating to the target broker is directly proportional totwo variables: (1) the number of brokers on themigration pathand (2) the distribution of subscribers. This observation makessense because the longer is the migration path, the higher isthenumber of brokers that need updating. Likewise, the greateris the number of brokers with matching subscribers, the morerouting table update operations are needed.
2) Random Workload:With high-rated subscribers ran-domly assigned to different brokers, there are virtually novisi-ble differences between the average broker message rate, inputand output utilizations, delivery delay, hop count, messageoverhead, and memory utilization of GRAPE’sload 100%anddelay 100%. Only the average delivery delay graphs forthe cluster testbed and PlanetLab are included here in Figures6h and 6i, respectively, with the rest in the Appendix [42].GRAPE’s average broker message rate and input utilizationmatches that ofstatic, with the output utilization of GRAPEsurpassing thestatic case. Message overhead of GRAPEis at most 5%, and is 91% lower than POP. SummarizingPOP’s results, POP achieves the same average hop count,and input and output utilizations as GRAPE, but introduces
0
2
4
6
8
10
1 10 100 1000
Avg H
op C
ount
Subscriber Distribution (Number of Brokers)
StaticPOP
GRAPE (load 100%)GRAPE (delay 100%)
(a) Hop count on the cluster testbed
0
0.05
0.1
0.15
0.2
0.25
0.3
0.35
1 10 100 1000
Avg M
essage O
verh
ead R
atio
Subscriber Distribution (Number of Brokers)
StaticPOP
GRAPE (load 100%)GRAPE (delay 100%)
(b) Msg overhead ratio on the cluster testbed
0
2
4
6
8
10
12
14
16
18
20
1 10 100 1000Avg B
roker
Message R
ate
(m
sg/s
)
Subscriber Distribution (Number of Brokers)
StaticPOP
GRAPE (load 100%)GRAPE (delay 100%)
(c) Msg rate on the cluster testbed (fanout of 4)
30 35 40 45 50 55 60 65 70 75 80 85
1 10 100 1000
Avg D
eliv
ery
Dela
y (
ms)
Subscriber Distribution (Number of Brokers)
StaticPOP
GRAPE (load 100%)GRAPE (delay 100%)
(d) Del. delay on the cluster testbed (fanout of 4)
0.1
1
10
100
0 2 4 6 8 10 12
Avg G
RA
PE
Pin
g T
ime (
s)
Migration Hop Count
1x Parallel pings on CL5x serial pings on CL5x serial pings on PL
(e) GRAPE ping time (@63 brokers)
0
1
2
3
4
5
6
0 2 4 6 8 10 12
Avg B
roker
Sele
ction T
ime (
s)
Migration Hop Count
POP on PLGRAPE (no ping) on PL
POP on CLGRAPE (no ping) on PL
(f) Broker selection time (@63 brokers)
0
1
2
3
4
5
0 2 4 6 8 10 12
Avg P
ublis
her
Wait T
ime (
s)
Migration Hop Count
Subs. at 63 brokers on PLSubs. at 4 brokers on PL
Subs. at 63 brokers on CLSubs. at 4 brokers on CL
(g) Publisher wait time
30
40
50
60
70
80
1 10 100 1000
Avg D
eliv
ery
Dela
y (
ms)
Subscriber Distribution (Number of Brokers)
StaticPOP
GRAPE (load 100%)GRAPE (delay 100%)
(h) Delivery delay on the cluster testbed (random)
0
1
2
3
4
5
6
7
1 10 100A
vg D
eliv
ery
Dela
y (
s)
Subscriber Distribution (Number of Brokers)
StaticPOP
GRAPE (load 100%)GRAPE (delay 100%)
(i) Delivery delay on PlanetLab (random)
Fig. 6. Experiment results on PlanetLab (PL) and the cluster testbed (CL)
approximately 50% higher broker message rate than GRAPEdue to the message overhead fromTRMs. Figure6h also illus-trates that POP’s metric for broker selection is more effectivethan GRAPE’sdelay 100% for minimizing delay under therandom workload. On PlanetLab, we experienced overloads atabout 1-3 internal brokers in ourstatic, POP, and GRAPE’sdelay 100% experiments. During overloads, subscriber clientsexperience orders of magnitude higher delivery delays onpublication messages as demonstrated by the spikes in Figure6i. However, no overloads ever happened to GRAPE’sload100% experiments. This shows that GRAPE’sload 100%setting is effective in preventing the chances of overloadingbrokers by minimizing broker load in an unstable environment.
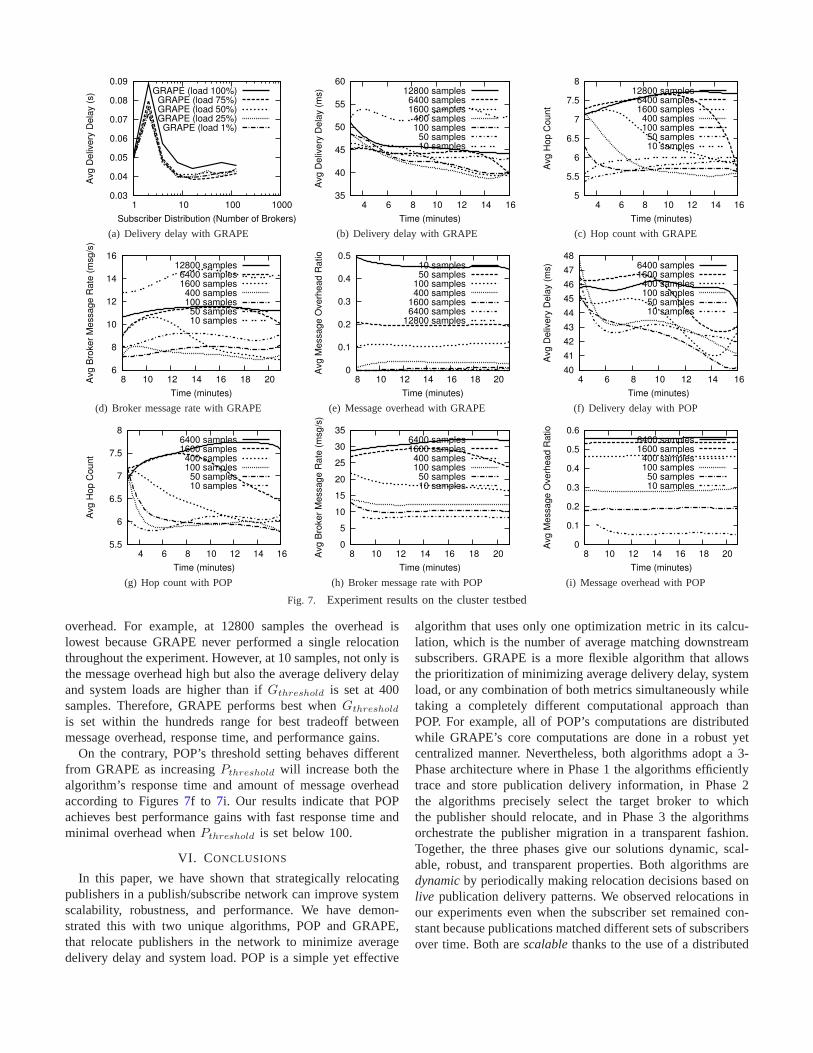
3) Impact of GRAPE’s Minimization Weight:We ran exper-iments with GRAPE set to prioritize minimization of both loadand delay from 1% to 100% at increments of 25%. Similar toour previous observations with the random workload, GRAPEbehaves indifferently regardless of the prioritization metric andminimization weight settings. However, the reverse is truewith the enterprise workload. Interpreting from the graphsin our Appendix [42] and Figure7a, as the weight on loadminimization decreases from 100% to 1%, the average delivery
delay and hop count decreases, putting more emphasis on min-imizing delay. All the while, load minimization is sacrificedwith increased average broker message rate, and input andoutput utilizations. Moreover, the results ofload 1% are virtu-ally identical todelay 100%. Similarly, as GRAPE is variedfrom delay 100% to delay 1%, we observe an increase inaverage delivery delay and hop count, and decrease in systemload and average broker message rate. Likewise,delay 1%is virtually equivalent toload 100%. No notable differencesin memory usage and message overhead are observed overdifferent minimization weights.
4) Impact of POP and GRAPE’s Sampling Trigger:Beforebroker selection can occur in POP, or delivery statistics areretrieved in GRAPE, a required number of publications mustbe traced. Recall, that this number isPtℎresℎold for POP andGtℎresℎold for GRAPE. We experimented with altering thethresholds using the enterprise scenario on the cluster testbedwith subscribers distributed among 16 brokers. For POP, weset the maximum number of traceable publications per timewindow to be half ofPtℎresℎold. Our results from Figures7b to 7e indicate that increasingGtℎresℎold will increase thealgorithm’s response time and decrease the amount of message
0.03
0.04
0.05
0.06
0.07
0.08
0.09
1 10 100 1000
Avg D
eliv
ery
Dela
y (
s)
Subscriber Distribution (Number of Brokers)
GRAPE (load 100%)GRAPE (load 75%)GRAPE (load 50%)GRAPE (load 25%)GRAPE (load 1%)
(a) Delivery delay with GRAPE
35
40
45
50
55
60
4 6 8 10 12 14 16
Avg D
eliv
ery
Dela
y (
ms)
Time (minutes)
12800 samples6400 samples1600 samples400 samples100 samples50 samples10 samples
(b) Delivery delay with GRAPE
5
5.5
6
6.5
7
7.5
8
4 6 8 10 12 14 16
Avg H
op C
ount
Time (minutes)
12800 samples6400 samples1600 samples400 samples100 samples50 samples10 samples
(c) Hop count with GRAPE
6
8
10
12
14
16
8 10 12 14 16 18 20Avg B
roker
Message R
ate
(m
sg/s
)
Time (minutes)
12800 samples6400 samples1600 samples400 samples100 samples50 samples10 samples
(d) Broker message rate with GRAPE
0
0.1
0.2
0.3
0.4
0.5
8 10 12 14 16 18 20
Avg M
essage O
verh
ead R
atio
Time (minutes)
10 samples50 samples
100 samples400 samples
1600 samples6400 samples
12800 samples
(e) Message overhead with GRAPE
40
41
42
43
44
45
46
47
48
4 6 8 10 12 14 16
Avg D
eliv
ery
Dela
y (
ms)
Time (minutes)
6400 samples1600 samples400 samples100 samples50 samples10 samples
(f) Delivery delay with POP
5.5
6
6.5
7
7.5
8
4 6 8 10 12 14 16
Avg H
op C
ount
Time (minutes)
6400 samples1600 samples400 samples100 samples50 samples10 samples
(g) Hop count with POP
0
5
10
15
20
25
30
35
8 10 12 14 16 18 20Avg B
roker
Message R
ate
(m
sg/s
)
Time (minutes)
6400 samples1600 samples400 samples100 samples50 samples10 samples
(h) Broker message rate with POP
0
0.1
0.2
0.3
0.4
0.5
0.6
8 10 12 14 16 18 20A
vg M
essage O
verh
ead R
atio
Time (minutes)
6400 samples1600 samples400 samples100 samples50 samples10 samples
(i) Message overhead with POP
Fig. 7. Experiment results on the cluster testbed
overhead. For example, at 12800 samples the overhead islowest because GRAPE never performed a single relocationthroughout the experiment. However, at 10 samples, not onlyisthe message overhead high but also the average delivery delayand system loads are higher than ifGtℎresℎold is set at 400samples. Therefore, GRAPE performs best whenGtℎresℎold
is set within the hundreds range for best tradeoff betweenmessage overhead, response time, and performance gains.
On the contrary, POP’s threshold setting behaves differentfrom GRAPE as increasingPtℎresℎold will increase both thealgorithm’s response time and amount of message overheadaccording to Figures7f to 7i. Our results indicate that POPachieves best performance gains with fast response time andminimal overhead whenPtℎresℎold is set below 100.
VI. CONCLUSIONS
In this paper, we have shown that strategically relocatingpublishers in a publish/subscribe network can improve systemscalability, robustness, and performance. We have demon-strated this with two unique algorithms, POP and GRAPE,that relocate publishers in the network to minimize averagedelivery delay and system load. POP is a simple yet effective
algorithm that uses only one optimization metric in its calcu-lation, which is the number of average matching downstreamsubscribers. GRAPE is a more flexible algorithm that allowsthe prioritization of minimizing average delivery delay, systemload, or any combination of both metrics simultaneously whiletaking a completely different computational approach thanPOP. For example, all of POP’s computations are distributedwhile GRAPE’s core computations are done in a robust yetcentralized manner. Nevertheless, both algorithms adopt a3-Phase architecture where in Phase 1 the algorithms efficientlytrace and store publication delivery information, in Phase2the algorithms precisely select the target broker to whichthe publisher should relocate, and in Phase 3 the algorithmsorchestrate the publisher migration in a transparent fashion.Together, the three phases give our solutions dynamic, scal-able, robust, and transparent properties. Both algorithmsaredynamicby periodically making relocation decisions based onlive publication delivery patterns. We observed relocations inour experiments even when the subscriber set remained con-stant because publications matched different sets of subscribersover time. Both arescalablethanks to the use of a distributed
design that scales with the number of brokers and clients inthe network. We tested both POP and GRAPE using hundredsof brokers and thousands of clients and still witnessed fastalgorithm response times with low overheads. Both arerobustbecause every broker runs an instance of POP or GRAPE torule out the possibility of any single point of failure. OurPlanetLab experiments revealed that GRAPE’sload 100%setting was effective in preventing broker overloads that couldhave lead to broker crashes. Lastly, both aretransparenttoapplication-level publish/subscribe clients as publication statis-tics gathering and publisher migration all happen behind thescene. Our experiments showed no interruptions to messagedelivery while POP or GRAPE actively relocated publishers.
Extensive experimental results confirm that our algorithmsare effective under enterprise and random workloads on bothPlanetLab and a cluster testbed. GRAPE’sload 100% settingreduced the average input load of the system by up to 68% andaverage broker message rate by up to 84%, while GRAPE’sdelay 100% setting reduced the average delivery delay byup to 68%. GRAPE was able to minimize both averagedelivery delay and system load simultaneously according tothespecified priority and weight. POP consistently reduced bothaverage delivery delay and system load on PlanetLab, but thereductions fell in between the two extreme settings of GRAPE,load 100% anddelay 100%, except for the random workloadwhere POP produced the lowest average delivery delay. POP’sbroker selection time is lower and is dependent on the lengthofthe migration path. GRAPE’s broker selection time is higherand is dependent on the number of brokers with matchingsubscribers. In terms of overhead, both approaches introducedno more than 58% (or 31 MB) more memory overhead. Theamount of message overhead from both approaches dependedupon the number of publications traced per trace session,which in turn controlled the response time of both approaches.
Taking all results and the unique features of POPand GRAPE into account, we recommend POP for pub-lish/subscribe systems that strive for simplicity (such asGooPS[9]) and expect unpredictable subscription and traffic patterns.On the other hand, we recommend GRAPE for systems thatstrive to achieve minimal delivery delay (such as Tibco’sSupermontage [10]), load usage (such as sensor networks),or require the flexibility to minimize delivery delay whenthere are available resources (i.e., during off-peak Internethours) and minimize network traffic when servers are aboutto overload (i.e., during on-peak Internet hours).
ACKNOWLEDGEMENTS
Thanks to the PADRES team members, specifically Chun-yang Ye, Young Yoon, and Vinod Muthusamy for their com-ments. We are also very grateful to Serge Mankovskii (CA),CA, Sun Microsystems, NSERC, OCE, CFI, and ORF for theirsupport in this research.
REFERENCES
[1] G. Li et al., “Adaptive content-based routing in general overlay topolo-gies,” in Middleware’08.
[2] S. Pallickara and G. Fox, “NaradaBrokering: a middlewareframeworkand architecture for enabling durable peer-to-peer grids,” in Middle-ware’03.
[3] Y. Chen and K. Schwan, “Opportunistic overlays: efficient contentdelivery in mobile ad hoc networks,” inMiddleware’05.
[4] A. Carzaniga et al., “Design and evaluation of a wide-area eventnotification service,”ACM ToCS, 2001.
[5] G. Cugolaet al., “The JEDI event-based infrastructure and its applicationto the development of the OPSS WFMS,”IEEE TSE, 2001.
[6] G. Banavaret al., “An efficient multicast protocol for content-basedpublish-subscribe systems,” inICDCS’99.
[7] P. R. Pietzuch and J. M. Bacon, “Hermes: a distributed event-basedmiddleware architecture,” inDEBS’02.
[8] R. S. Kazemzadeh and H.-A. Jacobsen, “Reliable and highlyavailabledistributed publish/subscribe service,” inSRDS’09.
[9] J. Reumann, “Pub/sub at google,” CANOE and EuroSys SummerSchool, 2009.
[10] Tibco, “Tibco software chosen as infrastructure for nasdaq’ssupermontage,” 2001. [Online]. Available:www.tibco.com
[11] GS1. [Online]. Available:www.gs1.org/docs/gdsn/gdsnbrochure.pdf[12] R. Baldoniet al., “Efficient publish/subscribe through a self-organizing
broker overlay and its application to SIENA,”TCJ, 2007.[13] S. Voulgariset al., “Sub-2-sub: self-organizing content-based publish
subscribe for dynamic large scale collaborative networks,”in IPTPS’06.[14] M. Adler et al., “Channelization problem in large scale data dissemina-
tion,” in ICNP’01.[15] L. Opyrchal et al., “Exploiting IP multicast in content-based publish-
subscribe systems,” inMiddleware’00.[16] A. Riabov et al., “Clustering algorithms for content-based publication-
subscription systems,” inICDCS’02.[17] ——, “New algorithms for content-based publication-subscription sys-
tems,” in ICDCS’03.[18] E. Casalicchio and F. Morabito, “Distributed subscriptions clustering
with limited knowledge sharing for content-based publish/subscribesystems,” inNCA’07.
[19] T. Wong et al., “An evaluation of preference clustering in large-scalemulticast applications,” inINFOCOM’00.
[20] F. Cao and J. P. Singh, “Efficient event routing in content-based publish-subscribe service networks,” inINFOCOM’04.
[21] P. Strong, “eBay - very large distributed systems (a.k.a. grids) @ work,”BEinGRID Industry Days, 2008.
[22] S. Ghemawatet al., “The Google file system,”SOSP’03.[23] G. Li et al., “A distributed service-oriented architecture for business
process execution,”ACM Trans. Web, 2010.[24] S. Hu et al., “Distributed automatic service composition in large-scale
systems,” inDEBS’08.[25] M. Petrovicet al., “G-ToPSS: Fast filtering of graph-based metadata,”
in WWW’05.[26] I. Roseet al., “Cobra: content-based filtering and aggregation of blogs
and RSS feeds,” inNSDI’07.[27] B. Mukherjeeet al., “Network intrusion detection,”IEEE Network, 1994.[28] “Efficient event-based resource discovery,” inDEBS’09.[29] K. Graham, “Hedging your bets: currency fluctuations & the supply
chain,” 2008. [Online]. Available:www.supplyexcellence.com[30] PADRES. [Online]. Available:www.msrg.org/projects/padres/[31] S. Hu et al., “Transactional mobility in distributed content-based pub-
lish/subscribe systems,” inICDCS’09.[32] A. K. Y. Cheung and H.-A. Jacobsen, “Dynamic load balancing in
distributed content-based publish/subscribe,” inMiddleware’06.[33] G. Li and H.-A. Jacobsen, “Composite subscriptions in content-based
publish/subscribe systems,” inMiddleware’05.[34] B. Segall and D. Arnold, “Elvin has left the building: a publish/subscribe
notification service with quenching,” inAUUG’97.[35] A. M. Ouksel et al., “Efficient probabilistic subsumption checking for
content-based publish/subscribe systems,” inMiddleware’06.[36] G. Li et al., “Routing of xml and xpath queries in data dissemination
networks,” in ICDCS’08.[37] Y.-M. Wang et al., “Summary-based routing for content-based event
distribution networks,”SIGCOMM CCR, 2004.[38] P. Triantafillou and A. A. Economides, “Subscription summaries for
scalability and efficiency in publish/subscribe systems,” in ICDCS’02.[39] Z. Jerzak and C. Fetzer, “Bloom filter based routing for content-based
publish/subscribe,” inDEBS’08.
[40] R. Baldoni et al., “TERA: topic-based event routing for peer-to-peerarchitectures,” inDEBS’07.
[41] V. Muthusamyet al., “Effects of routing computations in content-basedrouting networks with mobile data sources,” inMobiCom’05.
[42] A. K. Y. Cheung and H.-A. Jacob-sen, “Appendix,” 2009. [Online]. Available:research.msrg.utoronto.ca/twiki/pub/Padres/WebHome/appendix.pdf
[43] P. Sharmaet al., “Estimating network proximity and latency,”SIG-COMM CCR, 2006.
[44] F. Dabeket al., “Vivaldi: a decentralized network coordinate system,”in SIGCOMM’04.