puerto rico economic analysis report 2014 2015 - … · puerto rico economic analysis report...
TRANSCRIPT

Puerto Rico Economic Analysis Report 2014-2015
Puerto Rico Economic
Analysis Report
2014-2015
Commonwealth of Puerto Rico
Department of Labor and Human Resources
Bureau of Labor Statistics

Puerto Rico Economic Analysis Report 2014-2015 2
Table of Content
I. Population…………………………………………………………………………………………………………………………...3
II. Labor Force, Employment and Unemployment……………………………………………………………..……..9
III. Employment by Industry…………………………………………………………………………………………………….19
IV. Business Employment Dynamics (BED)……………………………………………………………………..………..24
VI. Occupational Employment Survey (OES)…………………………………………………………………………….27
VII. Occupational Skills & Research…………………………………………………………………………………………..30
VIII.Long Term Industry & Occupational Projections 2012-2022 by Workforce Development
Areas………………………………………………………………………………………………………………………………….33
IX. Other Publications……………………………………………………………………………………………………………..65

Puerto Rico Economic Analysis Report 2014-2015 3
I. Population
A. Demographics
According to the statistics presented by the U.S. Census Bureau, Population Division, the population
of Puerto Rico continues its downward trend since the 2010-2014 period. The decreased in the
estimated population from 2010 to 2014 shows a reduction of 173,130 persons or –4.7%.
B. Population by Age and Sex
When compared both the male & female population, in 2014, there are 149,415 more females than
males. The male population decreases by 83,294 when we compare the year 2014 (1,699,491) with
the year 2010 (1,782,785). The female population also decreases by 89,836 when we compare the
year 2014 (1,848,906) with the year 2010 (1,938,742).
Figure 1 Total Population and Population by Sex
(Population Estimates Year July 1, 2010 - 2014)
Source: U.S. Census Bureau, Population Division.
1,7
82
,785
1,7
64
,780
1,7
43
,902
1,7
21
,924
1,6
99
,491
1,9
38
,742
1,9
21
,991
1,8
98
,379
1,8
73
,915
1,8
48
,906
3,721,527
3,686,771
3,642,281
3,595,839
3,548,397
3,450,000
3,500,000
3,550,000
3,600,000
3,650,000
3,700,000
3,750,000
1,600,000
1,650,000
1,700,000
1,750,000
1,800,000
1,850,000
1,900,000
1,950,000
2,000,000
2010 2011 2012 2013 2014
Year
Po
pu
lati
on
Es
tim
ate
s
Male Female Both Sexes

Puerto Rico Economic Analysis Report 2014-2015 4
Figure 2 Population Estimates by Age Group and Sex
Year 2014
Source: U.S. Census Bureau, Population Division.
The age group of under 5 years of age until 20 to 24 years old, shows more males than females in
2014. While the age group 25 to 29 to 85 years and over show more females that males. The age
group with the highest number of females over males in 2014 was the 60 to 64 years old a difference
of 19,505. They were followed by the age group of 85 years and over (difference of 19,364), 65 to 69
year olds shows a difference of 18,296 and 55 to 59 years olds, a difference of 18,286 of females over
males.
96,227
107,432
118,403
128,795
130,927
111,135
106,660
107,716
108,762
109,133
108,663
103,047
94,927
90,649
68,940
49,728
31,027
27,320
91,144
101,464
110,163
121,457
128,351
114,092
115,779
117,397
117,884
120,827
125,240
121,333
114,432
108,945
85,253
63,942
44,519
46,684
0 50,000 100,000 150,000 200,000 250,000 300,000
Under 5 years
5 to 9 years
10 to 14 years
15 to 19 years
20 to 24 years
25 to 29 years
30 to 34 years
35 to 39 years
40 to 44 years
45 to 49 years
50 to 54 years
55 to 59 years
60 to 64 years
65 to 69 years
70 to 74 years
75 to 79 years
80 to 84 years
85 years and over
Population Estimates
Age
Gro
up
Male Female

Puerto Rico Economic Analysis Report 2014-2015 5
Figure 3 Compared Population by Age Group
Population Estimates July 1, 2010 and 2014
Source: U.S. Census Bureau, Population Division.
The age group with the highest number of persons in 2010 year was the 15 to 19 year olds (282,896) and in 2014 was the 20 to 24 year olds (259,278). These two age groups shows the highest population in 2014. The age group with the highest population loss was the 10 to 14 year olds with 38,910.
222,314
238,069
267,476
282,896
262,232
242,563
247,841
240,292
241,655
247,852
239,827
223,965
217,782
177,309
136,993
101,514
67,576
63,371
187,371
208,896
228,566
250,252
259,278
225,227
222,439
225,113
226,646
229,960
233,903
224,380
209,359
199,594
154,193
113,670
75,546
74,004
800 50,800 100,800 150,800 200,800 250,800 300,800
Under 5 years
5 to 9 years
10 to 14 years
15 to 19 years
20 to 24 years
25 to 29 years
30 to 34 years
35 to 39 years
40 to 44 years
45 to 49 years
50 to 54 years
55 to 59 years
60 to 64 years
65 to 69 years
70 to 74 years
75 to 79 years
80 to 84 years
85 years and over
Population Estimates
Age
Gro
up
July 1, 2010 July 1, 2014

Puerto Rico Economic Analysis Report 2014-2015 6
Figure 4 Difference in Population by Age Group
Population Estimates July 1, 2010 and 2014
Source: U.S. Census Bureau, Population Division.
The older population from 65 year olds and over is the age group with the highest increase in 2014 when compared to 2010. The age group 65 to 69 year olds show the highest increase, followed by the age group 70 to 74. All group from 65 to 69 year up to the 85 year olds and over, show an increase for 2014. Also increasing is the age group of 55 to 59 year for the comparison period. The others age groups reflecting decreases in population. The age group with more losses was the under 5 year bracket up to 15 to 19 years.
-34,943
-29,173
-38,910
-32,644
-2,954
-17,336
-25,402
-15,179
-15,009
-17,892
-5,924
415
-8,423
22,285
17,200
12,156
7,970
10,633
-55,000 -45,000 -35,000 -25,000 -15,000 -5,000 5,000 15,000 25,000 35,000
Under 5 years
5 to 9 years
10 to 14 years
15 to 19 years
20 to 24 years
25 to 29 years
30 to 34 years
35 to 39 years
40 to 44 years
45 to 49 years
50 to 54 years
55 to 59 years
60 to 64 years
65 to 69 years
70 to 74 years
75 to 79 years
80 to 84 years
85 years and over
Difference
Age
Gro
up

Puerto Rico Economic Analysis Report 2014-2015 7
Table 1 Population by Municipalities
Population Estimates July 1, 2010 and 2014
Source: U.S. Census Bureau, Population Division.
C. Population by Municipalities
When comparing 2010 to 2014 the only five municipalities showing increase in population are: Gurabo
(1,590), Toa Alta (559), Barceloneta (131), Naguabo (114) y Dorado (27).
July 1, 2010 July 1, 2014 Numeric Percent July 1, 2010 July 1, 2014 Numeric Percent
Adjuntas 19,473 18,900 -573 -2.9 Juncos 40,344 40,102 -242 -0.60
Aguada 41,917 40,329 -1588 -3.8 Lajas 25,707 24,465 -1242 -4.83
Aguadilla 60,788 57,290 -3,498 -5.8 Lares 30,629 28,208 -2,421 -7.90
Aguas Buenas 28,654 27,473 -1181 -4.1 Las Marías 9,870 9,158 -712 -7.21
Aibonito 25,878 24,561 -1317 -5.1 Las Piedras 38,719 38,671 -48 -0.12
Añasco 29,271 28,403 -868 -3.0 Loíza 30,016 28,065 -1,951 -6.50
Arecibo 96,263 91,540 -4,723 -4.9 Luquillo 20,056 19,338 -718 -3.58
Arroyo 19,572 18,853 -719 -3.7 Manatí 44,039 41,675 -2,364 -5.37
Barceloneta 24,827 24,958 131 0.5 Maricao 6,278 6,022 -256 -4.08
Barranquitas 30,324 29,697 -627 -2.1 Maunabo 12,215 11,565 -650 -5.32
Bayamón 207,644 194,210 -13,434 -6.5 Mayagüez 88,786 81,915 -6,871 -7.74
Cabo Rojo 50,963 50,349 -614 -1.2 Moca 40,104 38,461 -1643 -4.10
Caguas 142,854 137,032 -5,822 -4.1 Morovis 32,649 32,194 -455 -1.39
Camuy 35,122 33,664 -1458 -4.2 Naguabo 26,772 26,886 114 0.43
Canóvanas 47,694 47,457 -237 -0.5 Naranjito 30,384 29,602 -782 -2.57
Carolina 176,420 165,820 -10,600 -6.0 Orocovis 23,426 22,392 -1034 -4.41
Cataño 28,077 26,274 -1,803 -6.4 Patillas 19,258 18,261 -997 -5.18
Cayey 48,115 46,293 -1,822 -3.8 Peñuelas 24,219 22,365 -1,854 -7.66
Ceiba 13,611 12,607 -1004 -7.4 Ponce 165,714 153,540 -12,174 -7.35
Ciales 18,753 17,728 -1025 -5.5 Quebradillas 25,899 25,042 -857 -3.31
Cidra 43,477 42,118 -1359 -3.1 Rincón 15,199 14,782 -417 -2.74
Coamo 40,568 40,331 -237 -0.6 Río Grande 54,298 52,668 -1630 -3.00
Comerío 20,796 20,253 -543 -2.6 Sabana Grande 25,250 24,121 -1129 -4.47
Corozal 37,134 35,693 -1441 -3.9 Salinas 31,046 29,881 -1165 -3.75
Culebra 1,820 1,818 -2 -0.1 San Germán 35,629 33,725 -1,904 -5.34
Dorado 38,237 38,264 27 0.1 San Juan 394,234 365,575 -28,659 -7.27
Fajardo 36,880 34,049 -2,831 -7.7 San Lorenzo 41,020 39,524 -1496 -3.65
Florida 12,688 12,411 -277 -2.2 San Sebastián 42,337 39,969 -2,368 -5.59
Guánica 19,376 17,852 -1,524 -7.9 Santa Isabel 23,289 22,860 -429 -1.84
Guayama 45,277 43,467 -1,810 -4.0 Toa Alta 74,278 74,837 559 0.75
Guayanilla 21,525 20,148 -1377 -6.4 Toa Baja 89,465 84,165 -5,300 -5.92
Guaynabo 97,788 92,799 -4,989 -5.1 Trujillo Alto 74,757 71,019 -3,738 -5.00
Gurabo 45,555 47,145 1,590 3.5 Utuado 33,056 31,050 -2,006 -6.07
Hatillo 41,969 41,618 -351 -0.8 Vega Alta 39,951 39,236 -715 -1.79
Hormigueros 17,247 16,746 -501 -2.9 Vega Baja 59,554 56,166 -3,388 -5.69
Humacao 58,370 55,884 -2,486 -4.3 Vieques 9,306 9,113 -193 -2.07
Isabela 45,657 44,149 -1508 -3.3 Villalba 26,007 24,389 -1,618 -6.22
Jayuya 16,638 15,693 -945 -5.7 Yabucoa 37,880 35,879 -2,001 -5.28
Juana Díaz 50,739 48,853 -1,886 -3.7 Yauco 41,926 38,782 -3,144 -7.50
Population EstimatesMunicipalities
Population EstimatesChange (2010 to 2014)Municipalities
Change (2010 to 2014)

Puerto Rico Economic Analysis Report 2014-2015 8
The ten municipalities with highest decrease in population, when compared 2010 and 2014 were:
San Juan (28,659), Bayamón (13,434), Ponce (12,174), Carolina (10,600), Mayagüez (6,871), Caguas
(5,822), Toa Baja (5,300), Guaynabo (4,989), Arecibo (4,723), and Trujillo Alto (3,738).

Puerto Rico Economic Analysis Report 2014-2015 9
II. Labor Force, Employment and Unemployment
A. Labor Force
The labor force is the sum of employed and unemployed persons. Employed persons consist of:
persons who did any work for pay or profit during the survey reference week; persons who did at
least 15 hours of unpaid work in a family-operated enterprise; and persons who were temporarily
absent from their regular jobs because of illness, vacation, bad weather, industrial dispute, or various
personal reasons. Unemployed persons are classified as unemployed if they do not have a job, have
actively looked for work in the prior 4 weeks, and are currently available for work. Persons who were
not working and were waiting to be recalled to a job from which they had been temporarily laid off
are also included as unemployed. Receiving benefits from the Unemployment Insurance (UI) program
has no bearing on whether a person is classified as unemployed.
In FY 2015, the labor force was estimated in 1,138,000 persons, representing a decrease of 24,000
persons or 2.1% when compared to FY 2014 (1,162,000).
Figure 5 Labor Force (thousands of person 16 years of age and over) Not Seasonally Adjusted
Fiscal Years 2005 - 2015
Source: PR Department of Labor and Human Resources - Labor Force Survey.
B. Employment
In FY 2015, (not seasonally adjusted) the number of employed persons (which includes self-employed
individuals and agricultural employment) reached a total of 990,000. This represents a decrease of
6,000 employees in the local economy, when compared to FY 2014 (996,000). The self-employment
in FY 2015 was 163,000 or 16.5% of the total of employed persons. In this sector was reflected a
increase of 13,000 persons when compared with FY 2014 (150,000).
1,357 1,410 1,413 1,355 1,325 1,285 1,246 1,211 1,182 1,162 1,1381,000
1,050
1,100
1,150
1,200
1,250
1,300
1,350
1,400
1,450
2005 2006 2007 2008 2009 2010 2011 2012 2013 2014 2015
tho
usa
nd
s
Fiscal Years

Puerto Rico Economic Analysis Report 2014-2015 10
Figure 6 Total Employment (thousands of person 16 years of age and over) Not Seasonally Adjusted
Fiscal Years 2005 - 2015
Source: PR Department of Labor and Human Resources - Labor Force Survey.
C. Unemployment
In FY 2015, unemployment (not seasonally adjusted) registered 148,000 or 19,000 unemployed
persons less than in PY 2014 (167,000). The unemployment rate (not seasonally adjusted) for FY 2015
was 13.0%, 1.3 percentage points fewer than in FY 2014 with 14.3%. In FY 2015 the unemployment
rate (not seasonally adjusted) for male was 14.6% and 10.7% for female. This represents respective
decreases of 1.2% and 3.7% when compared to FY 2014.
Figure 7 Unemployment (thousands of person 16 years of age and over) Not Seasonally Adjusted
Fiscal Years 2005 - 2015
Source: PR Department of Labor and Human Resources - Labor Force Survey.
1,213 1,254 1,263 1,203 1,144 1,075 1,044 1,027 1,016 996 990800
850
900
950
1,000
1,050
1,100
1,150
1,200
1,250
1,300
2005 2006 2007 2008 2009 2010 2011 2012 2013 2014 2015
tho
usa
nd
s
Fiscal Years
144 156 150 152 181 210 202 184 165 167 148100
120
140
160
180
200
220
2005 2006 2007 2008 2009 2010 2011 2012 2013 2014 2015
tho
usa
nd
s
Fiscal Years

Puerto Rico Economic Analysis Report 2014-2015 11
Figure 8 Unemployment Rate (thousands of person 16 years of age and over) Not Seasonally Adjusted
Fiscal Years 2005 - 2015
Source: PR Department of Labor and Human Resources - Labor Force Survey.
10.6 11.0 10.6 11.2 13.7 16.3 16.2 15.2 14.0 14.3 13.00.0
2.0
4.0
6.0
8.0
10.0
12.0
14.0
16.0
18.0
2005 2006 2007 2008 2009 2010 2011 2012 2013 2014 2015
Un
em
plo
yme
nt
Rat
e
Fiscal Years

Puerto Rico Economic Analysis Report 2014-2015 12
Figu
re 9
U
ne
mp
loym
en
t R
ate
By
Mu
nic
ipal
itie
s (
No
t Se
aso
nal
ly A
dju
ste
d)
Fisc
al Y
ear
20
15
Sou
rce
: D
ep
artm
en
t o
f La
bo
r an
d H
um
an R
eso
urc
es
- L
oca
l Are
a U
ne
mp
loym
en
t St
atisti
cs (
LAU
S).
-
-
-
-

Puerto Rico Economic Analysis Report 2014-2015 13
D. Labor Force by Local Areas of Labor Development Program (PDL)
In this section we present a profile of each one of the designated Labor Development Program (PDL) under the WIOA program. The program divides the Island into 15 local areas, embracing among them the 78 municipalities of Puerto Rico. In this document we will discuss the labor force profile of each area comparing its changes between FY2014 and FY 2015. The 15 local areas are:
1. Bayamón-Comerio This area comprises only these two municipalities. The labor force in the subject area presents a decrease of 1,042 persons between FY 2014 and FY 2015. The Bayamón municipality presents the biggest reduction with (-825) and Comerio with (-217). In terms of the area’s employment it shows reductions of 512 employees between the two fiscal years, from those 479 are from Bayamón and 34 from Comerio. The unemployment in the area also shows a reduction of 530 persons of which 346 are from Bayamón and 183 from Comerio. The unemployment rate between the two fiscal years shows a reduction of (-0.6) from PY 2014 to PY 2015.
2. Caguas-Guayama This area comprises eight municipalities of the Island which are Aguas Buenas, Aibonito, Arroyo, Caguas, Cayey, Guayama, Gurabo and Trujillo Alto. For FY 2014 the Labor Force was estimated in 144,145 and for FY 140,991, a reduction of 3,154 persons from 2014 to 2015. So is the case for the employment for the area showing a decrease 1,352 person form FY 2014 to FY 2015. The unemployment for the area decreased from 18,617 in 2014 to 16,815 in FY 2015 a reduction of 1,803 unemployed persons. This represents a 1 percent change in the unemployment rate from PY 2014 to PY 2015.
3. Carolina Carolina is one of the few municipalities operating by itself as a PDL under the WIOA program. All of its labor market components depicted in this documents present negative increases from FY 2014 to FY 2015. The labor force decreased from 64,550 to 63,890 or a reduction of 660 persons between the two years. So is the case with employment reducing from 125,000 to 124,176 or 1,352 fewer people employed from 2014 to 2015.
4. Guaynabo Toa-Baja The area is composed by four municipalities Cataño, Guaynabo, Toa Alta and Toa Baja. The labor force reflects a reduction from PY 2014 to PY 2015, from 103,656 to 102,250 a decrease of 1,405. The employment segment also shows a reduction for the period, from 94,389 to 93,676 a difference of 713 less employees. The number of unemployed persons for the discussed period was 692 less from 2014 to 2015. The unemployment rate changed from 8.9 to 8.4 or -0.6 for the studied period.
5. Mayaguez-Las Marías This area is composed by only these two municipalities. Its labor force for FY 2014 was 28,022 and 27,078 for FY 2015 a reduction of 276 persons. The employment sector however, shows an

Puerto Rico Economic Analysis Report 2014-2015 14
increase of 299 persons from PY 2014 to PY 2015, from 22,548 to 22,847 respectively. The unemployed persons decreased from 5,454 to 4,231, a reduction of 1,224 from PY 2014 to 2015. 6. La Montaña This area composed of the municipalities of Barranquitas, Cidra, Corozal, Orocovis and Villalba is geographically the less populated and isolated sector of the Island. It is characterized mainly for its diminishing agricultural activity and is located in the central mountainous sector of the Island. Its labor force for FY 1014 was 47,223 and 46,167 for 2015 a difference of 1,055 less persons in the labor force. Employment for FY 2014 was and 39,383 for FY 2015, a reduction of 310 persons. The number of unemployed persons also was reduced from 7,530 to 6785, a reduction of 745 unemployed persons. The unemployment rate shows a contraction of 1.2% from 15.9 in 2010 to 14.7 in 2015.
7. Noreste This area is composed by nine municipalities: Canóvanas, Ceiba, Culebra, Fajardo, Loiza, Luquillo, Naguabo, Rio Grande, and Vieques. It reduced in its labor force from 78,828 in 2014 to 77,156 in 2015 which means 1,672 less persons in the labor force. Also, a reduction of 484 persons is found in its employment component from 67,221 in 2014 and 66,737 in FY 2015. The unemployed persons also diminished for the period when in FY 2014 there were 11,608 unemployed and 10,419 for 2015, a reduction of 1.2 in the unemployment rate for the period.
8. Noroeste This area is composed by seven municipalities: Aguada, Aguadilla, Añasco, Isabela, Moca, Rincón and San Sebastian. The labor force population for the area was estimated in 76,127 for FY 2014 while for FY 2015 was 75,217, which represents a reduction of 910 persons less in the labor force from the previous year. The employment of the area for 2014 was 61,727 in PY 2014 and 63,039 for PY 2015; this represents an increase of 1,312 employees. The unemployment shows a reduction from 14,399 in 2014 to 12,178 in 2015 a total of 2,221 less unemployed in the area. The numbers presented before shows a reduction in the unemployment rate of the area from 18.9 in 2014 to 16.2 in 2015, a difference of 2.7%.
9. Norte Central - Arecibo Eight municipalities compose this area, these are: Adjuntas, Arecibo, Camuy, Hatillo, Jayuya, Lares Quebradillas and Utuado. Its labor force shows a reduction of 2,054 persons from PY 2014 (79,143) to PY 2015 (77,088). The number of employed persons also shows a reduction from 65,070 in 2014 to 64,422 in 2015, a difference of 647persons. The number of unemployed persons also decreased for the PY 2014-2015 period, from 14,073 to 12,666 respectively for a total reduction of 1,407 persons. The unemployment rate for the area decreased from 17.8 to 16.4 or 1.35% for the years in discussion.
10. Norte Central – Manati This area is composed by eight municipalities: Barceloneta, Ciales, Dorado, Florida, Manatí, Morovis, Vega Alta and Vega Baja. The area presents a reduction in the labor force from 2014 to 2015. For 2014 it was estimated in 72,855 and in 2015; 70,317, a decrease of 2,539 persons in the labor force. The employment of this labor force shows figures of 61,106 for PY 2014 and 60,635

Puerto Rico Economic Analysis Report 2014-2015 15
for 2015 a reduction of 471 employees. Unemployment for the area reflects 11,749 for 2014 and 9,682 for 2015 a decrease of 2,067. In terms of the unemployment rate, these figures translate to 16.1 in FY 2014 and 13.8 in 2015, a reduction of 2.36 in the unemployment rate.
11. Ponce Ponce is another standalone PDL with a labor force of 50,454 in FY 2014 and 49,328 in FY 2015, decreasing in 1,125 persons from one year to the next. Employment for the municipality was 42,460 for 2,014 and 42,161 for 2015, a reduction of 299 employed persons. Unemployment for Ponce was register in 7,994 persons in 2014 and 7,167 in 2015 representing 827 less persons unemployed for the last year.
12. San Juan Like Carolina and Ponce, San Juan is the other standalone PDL of the 15 areas in Puerto Rico. In FY 2014 its labor force was estimated in 140,037 while in FY 2015 this number was 138,628 representing a reduction of 1,409 from one year to the other. The unemployment was 128,376 in 2014 and 124,549 in 2015, a reduction of 827 employees. Total unemployment in the capital city in 2014 was 11,661 in 2014 and had a reduction of 582 persons for a total of 11,079 in 2015. Unemployment rate also shows a reduction from 2014 to 2015 of .34%, from 8.3 in 2014 to 8.0 for 2015.
13. Sur Central-Salinas This area is composed by five municipalities: Coamo, Juana Diaz, Naranjito, Salinas and Santa Isabel. The labor force population for the area was estimated in 53,456 for FY 2014 while for FY 2015 was 52,268, which represents a reduction of 1188 persons less in the labor force than the previous year. The employment of the area for 2014 was 43,126 in PY 2014 and 42,319 for PY 2015; this represents a decrease of 806 employees. The unemployment shows a reduction from 10,330 in 2014 to 9,949 in 2015 a total of 582 less unemployed persons in the area. The numbers presented before shows a reduction in the unemployment rate of the area from 19.3 in 2014 to 19.0 in 2015, a difference of .29%. 14. Sureste Seven municipalities compose this area, these are: Humacao, Juncos, Las Piedras, Maunabo, Patillas, San Lorenzo and Yabucoa. Its labor force shows a reduction of 2,366 persons from PY 2014 (73,714) to PY 2015 (71,347). The number of employed persons also shows a reduction from 60,075 in 2014 to 59,563 in 2015, a difference of 512 persons. The number of unemployed persons also decreased for the PY 2014-2015 period, from 13,638 to 11,784 respectively for a total reduction of 1,855 persons. The unemployment rate for the area decreased from 18.5 to 16.5 or 1.99% for the years in discussion.
15. Suroeste This is the PDL encompassing the largest number of municipalities with 10. These are: Cabo Rojo, Guánica, Guayanilla, Hormigueros, Lajas, Maricao, Peñuelas, Sabana Grande, San Germán and Yauco. The labor force for FY 2014 was estimated in 74,908 and in 71,949 in PY 2015 for a reduction of 2,958 persons in the latest year. Employment for the area is distributed in 59,090 for FY 2014 and 59,454 for FY 2015. This presents an increase of 364 persons from one year to the

Puerto Rico Economic Analysis Report 2014-2015 16
next. The figures for unemployment show 15,818 persons unemployed in 2014 and 12,495 or 3,323 less for FY 2015. The unemployment rate for the area was 21.1 percent in 2014 and 17.4 for 2015, a reduction of 3.75 in the unemployment rate for FY 2015.

Puerto Rico Economic Analysis Report 2014-2015 17
Table 2 Labor Force, Employment, Unemployment and Unemployment Rate by Labor Development Program (PDL)
Fiscal Years 2014 and 2015
Source: Department of Labor and Human Resources, Local Area Unemployment Statistics (LAUS).
FY 2014 FY 2015 Difference FY 2014 FY 2015 Difference FY 2014 FY 2015 Difference FY 2014 FY 2015 Difference
Bayamón - Comerio 75,040 73,998 -1,042 66,830 66,317 -512 8,210 7,680 -530 10.9 10.4 -0.6
Bayamón 69,578 68,752 -825 62,450 61,972 -479 7,127 6,781 -346 10.2 9.9 -0.4
Comerio 5,462 5,245 -217 4,380 4,346 -34 1,083 899 -183 19.8 17.1 -2.7
Caguas-Guayama 144,145 140,991 -3,154 125,528 124,176 -1,352 18,617 16,815 -1,803 12.9 11.9 -1.0
Aguas Buenas 7,070 6,938 -132 5,901 5,848 -53 1,169 1,090 -79 16.5 15.7 -0.8
Aibonito 6,988 6,812 -176 5,768 5,709 -59 1,220 1,102 -118 17.5 16.2 -1.3
Arroyo 5,529 5,236 -293 4,159 4,123 -36 1,369 1,113 -257 24.8 21.2 -3.5
Caguas 50,040 48,941 -1,098 44,124 43,476 -648 5,916 5,465 -450 11.8 11.2 -0.7
Cayey 16,776 16,377 -399 14,573 14,458 -115 2,203 1,919 -283 13.1 11.7 -1.4
Guayama 12,697 12,267 -429 9,996 9,898 -98 2,701 2,370 -331 21.3 19.3 -2.0
Gurabo 17,173 16,880 -293 15,351 15,213 -138 1,822 1,667 -155 10.6 9.9 -0.7
Truji l lo Al to 27,872 27,539 -333 25,655 25,450 -204 2,218 2,089 -129 8.0 7.6 -0.4
Carolina 64,550 63,890 -660 58,302 57,834 -469 6,248 6,057 -191 9.7 9.5 -0.2
Guaynabo-Toa Baja 103,656 102,250 -1,405 94,389 93,676 -713 9,266 8,574 -692 8.9 8.4 -0.6
Cataño 8,421 8,224 -197 7,347 7,295 -52 1,074 928 -145 12.7 11.3 -1.5
Guaynabo 37,852 37,586 -265 35,429 35,191 -238 2,423 2,395 -28 6.4 6.4 0.0
Toa Alta 26,257 25,893 -364 23,771 23,582 -189 2,486 2,311 -175 9.5 8.9 -0.5
Toa Baja 31,126 30,547 -579 27,843 27,608 -235 3,284 2,940 -344 10.5 9.6 -0.9
Mayaguez -Las Marías 28,002 27,078 -925 22,548 22,847 299 5,454 4,231 -1,224 19.5 15.6 -3.9
Las Marias 3,035 2,759 -276 2,232 2,163 -69 803 596 -206 26.4 21.6 -4.8
Mayaguez 24,967 24,318 -649 20,316 20,684 369 4,652 3,634 -1,018 18.6 14.9 -3.7
La Montaña 47,223 46,167 -1,055 39,693 39,383 -310 7,530 6,785 -745 15.9 14.7 -1.2
Barranquitas 7,702 7,455 -247 6,476 6,382 -94 1,226 1,073 -153 15.9 14.4 -1.5
Cidra 16,160 15,778 -382 14,166 14,044 -122 1,995 1,734 -260 12.3 11.0 -1.3
Corozal 9,703 9,616 -87 8,230 8,228 -3 1,473 1,389 -84 15.2 14.4 -0.7
Orocovis 5,505 5,369 -136 4,466 4,419 -47 1,039 949 -90 18.9 17.7 -1.2
Vi l la lba 8,152 7,950 -202 6,355 6,310 -45 1,797 1,640 -158 22.0 20.6 -1.4
Noreste 78,828 77,156 -1,672 67,221 66,737 -484 11,608 10,419 -1,188 14.7 13.5 -1.2
Canóvanas 16,414 16,132 -282 14,235 14,117 -118 2,180 2,015 -165 13.3 12.5 -0.8
Ceiba 4,172 4,013 -159 3,426 3,402 -25 746 611 -135 17.9 15.2 -2.7
Culebra 818 786 -32 749 745 -4 69 41 -28 8.5 5.2 -3.3
Fajardo 12,304 11,986 -317 10,127 10,050 -77 2,176 1,936 -240 17.7 16.2 -1.5
Loiza 9,130 9,024 -106 7,960 7,882 -79 1,170 1,143 -28 12.8 12.7 -0.2
Luqui l lo 6,831 6,587 -244 5,492 5,438 -54 1,339 1,149 -190 19.6 17.4 -2.2
Naguabo 8,450 8,171 -278 7,098 6,999 -99 1,351 1,172 -179 16.0 14.3 -1.6
Rio Grande 17,545 17,275 -271 15,465 15,326 -138 2,081 1,949 -132 11.9 11.3 -0.6
Vieques 3,164 3,182 18 2,669 2,779 109 495 404 -91 15.6 12.7 -3.0
Noroeste 76,127 75,217 -910 61,727 63,039 1,312 14,399 12,178 -2,221 18.9 16.2 -2.7
Aguada 12,255 12,066 -189 10,034 10,187 153 2,221 1,880 -342 18.1 15.6 -2.5
Aguadi l la 15,277 15,102 -176 12,650 12,840 190 2,628 2,262 -366 17.2 15.0 -2.2
Añasco 9,170 8,963 -207 7,531 7,653 121 1,638 1,310 -328 17.9 14.6 -3.2
Isabela 12,267 12,539 272 10,236 10,818 582 2,031 1,721 -310 16.6 13.7 -2.8
Moca 11,062 10,810 -253 8,896 9,009 113 2,166 1,801 -365 19.6 16.7 -2.9
Rincón 4,771 4,693 -78 3,781 3,837 56 990 856 -134 20.8 18.2 -2.5
San Sebastián 11,324 11,045 -279 8,599 8,696 96 2,725 2,349 -376 24.1 21.3 -2.8
Local Area NameUnemployment RateUnemployment EmploymentLabor Force

Puerto Rico Economic Analysis Report 2014-2015 18
Table 2 (Cont.) Labor Force, Employment, Unemployment and Unemployment Rate by Labor Development Program (PDL)
Fiscal Years 2014 and 2015
Source: Department of Labor and Human Resources, Local Area Unemployment Statistics (LAUS).
FY 2014 FY 2015 Difference FY 2014 FY 2015 Difference FY 2014 FY 2015 Difference FY 2014 FY 2015 Difference
Norte Central-Arecibo 79,143 77,088 -2,054 65,070 64,422 -647 14,073 12,666 -1,407 17.8 16.4 -1.35
Adjuntas 4,689 4,400 -289 3,598 3,518 -81 1,091 883 -208 23.3 20.1 -3.20
Arecibo 25,237 24,649 -589 21,316 20,998 -318 3,921 3,651 -271 15.5 14.8 -0.73
Camuy 9,971 9,707 -264 8,463 8,346 -117 1,507 1,361 -147 15.1 14.0 -1.10
Hati l lo 13,367 13,136 -231 11,219 11,050 -169 2,148 2,086 -62 16.1 15.9 -0.19
Jayuya 4,330 4,173 -157 3,521 3,489 -32 809 684 -125 18.7 16.4 -2.28
Lares 7,945 7,708 -237 5,965 6,031 66 1,980 1,677 -302 24.9 21.8 -3.16
Quebradi l las 6,345 6,203 -141 5,155 5,090 -65 1,190 1,114 -76 18.7 18.0 -0.79
Utuado 7,259 7,112 -147 5,832 5,901 70 1,428 1,211 -217 19.7 17.0 -2.64
Norte Central-Manatí 72,855 70,317 -2,539 61,106 60,635 -471 11,749 9,682 -2,067 16.1 13.8 -2.36
Barceloneta 6,346 5,968 -378 4,954 4,914 -40 1,392 1,054 -338 21.9 17.7 -4.28
Cia les 4,448 4,064 -384 3,308 3,261 -47 1,140 803 -338 25.6 19.7 -5.89
Dorado 12,843 12,665 -179 11,670 11,577 -93 1,174 1,088 -86 9.1 8.6 -0.55
Florida 3,661 3,466 -195 2,915 2,884 -31 747 582 -165 20.4 16.8 -3.60
Manati 12,057 11,889 -168 10,368 10,364 -4 1,689 1,525 -164 14.0 12.8 -1.18
Morovis 8,685 8,237 -448 6,993 6,915 -78 1,692 1,322 -371 19.5 16.0 -3.44
Vega Alta 10,185 9,889 -296 8,726 8,644 -82 1,459 1,245 -215 14.3 12.6 -1.74
Vega Baja 14,629 14,139 -490 12,173 12,075 -98 2,456 2,065 -392 16.8 14.6 -2.19
Ponce 50,454 49,328 -1,125 42,460 42,161 -299 7,994 7,167 -827 15.8 14.5 -1.31
San Juan 140,037 138,628 -1,409 128,376 127,549 -827 11,661 11,079 -582 8.3 8.0 -0.34
Sur Central - Salinas 53,456 52,268 -1,188 43,126 42,319 -806 10,330 9,949 -382 19.3 19.0 -0.29
Coamo 11,281 11,008 -273 8,946 8,774 -172 2,335 2,234 -101 20.7 20.3 -0.40
Juana Diaz 16,072 15,804 -268 13,472 13,296 -176 2,601 2,508 -92 16.2 15.9 -0.31
Naranji to 7,656 7,426 -230 6,365 6,286 -80 1,291 1,140 -151 16.9 15.4 -1.50
Sal inas 8,443 8,355 -88 6,238 6,198 -40 2,205 2,156 -49 26.1 25.8 -0.31
Santa Isabel 10,003 9,676 -328 8,104 7,765 -339 1,899 1,910 11 19.0 19.7 0.76
Sureste 73,714 71,347 -2,366 60,075 59,563 -512 13,638 11,784 -1,855 18.5 16.5 -1.99
Humacao 18,449 17,927 -522 15,124 15,043 -81 3,325 2,884 -441 18.0 16.1 -1.94
Juncos 12,683 12,409 -273 10,693 10,576 -118 1,989 1,834 -156 15.7 14.8 -0.91
Las Piedras 11,680 11,320 -361 9,686 9,596 -90 1,995 1,723 -271 17.1 15.2 -1.85
Maunabo 3,224 3,116 -107 2,514 2,494 -20 709 622 -88 22.0 20.0 -2.05
Pati l las 5,041 4,901 -140 3,819 3,784 -35 1,223 1,118 -105 24.3 22.8 -1.45
San Lorenzo 12,574 12,186 -388 10,524 10,425 -99 2,050 1,761 -289 16.3 14.4 -1.85
Yabucoa 10,063 9,488 -575 7,716 7,646 -70 2,348 1,843 -505 23.3 19.4 -3.91
Suroeste 74,908 71,949 -2,958 59,090 59,454 364 15,818 12,495 -3,323 21.1 17.4 -3.75
Cabo Rojo 14,838 14,218 -620 11,964 12,170 206 2,875 2,049 -826 19.4 14.4 -4.96
Guanica 4,706 4,408 -298 3,471 3,431 -41 1,234 977 -257 26.2 22.2 -4.06
Guayani l la 5,693 5,460 -233 4,426 4,359 -67 1,268 1,101 -166 22.3 20.2 -2.09
Hormigueros 5,778 5,637 -141 4,843 4,921 77 935 716 -218 16.2 12.7 -3.47
Lajas 6,191 5,791 -400 4,549 4,624 75 1,642 1,167 -475 26.5 20.1 -6.37
Maricao 2,074 1,925 -150 1,609 1,567 -42 465 358 -107 22.4 18.6 -3.83
Penuelas 6,707 6,464 -243 5,273 5,232 -41 1,434 1,232 -202 21.4 19.1 -2.32
Sabana Grande 6,706 6,488 -218 5,326 5,432 105 1,380 1,056 -324 20.6 16.3 -4.30
San Germán 10,860 10,521 -339 8,747 8,876 129 2,113 1,644 -469 19.5 15.6 -3.83
Yauco 11,355 11,039 -316 8,881 8,844 -37 2,474 2,195 -279 21.8 19.9 -1.90
Unemployment Local Area Name
Unemployment RateLabor Force Employment

Puerto Rico Economic Analysis Report 2014-2015 19
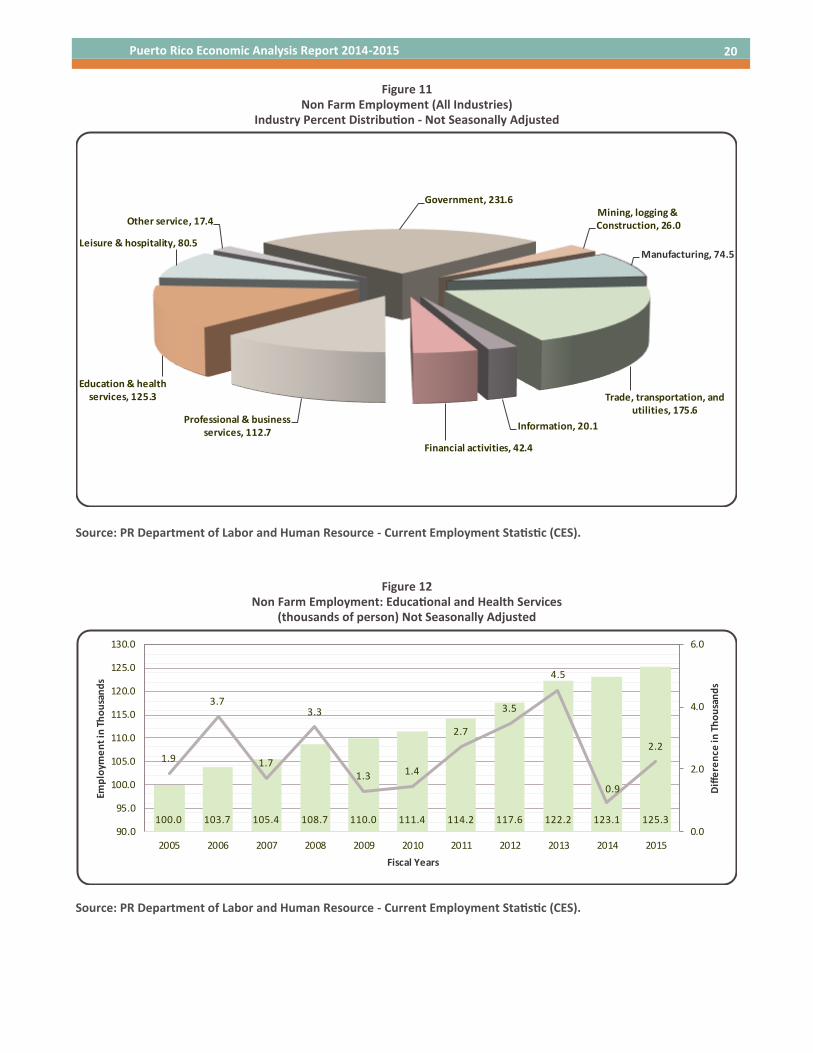
III. Employment by Industry
A. Current Employment Statistics Survey
Nonfarm employment declined by 10,600 in fiscal year2015, mainly due the significant loss in the
Government sector. The industry sector added jobs in fiscal year 2015 when compare to fiscal year
2014, in Education & Health services (2,200); Leisure & Hospitality (1,000) and Information (400).
In FY 2015 two major industry groups show the highest representations in historical series from FY
2005 to 2015. These were: Educational and Health Services; and Leisure and Hospitality.
The industry sector with major jobs losses in FY 2015 is Government (-6,500). Mining, Logging &
Construction (2,200); Professional and Business Services (-1,900); Trade, Transportation, and Utilities
(-1,100); Financial activities (-1,100); Manufacturing (-1,000); and Other Service (-400) had jobs losses
for FY 2014 to 2015 period.
Figure 10 Non Farm Employment (All Industries)
(thousands of person) Not Seasonally Adjusted
Source: PR Department of Labor and Human Resource - Current Employment Statistic (CES).
The distribution of employment for fiscal year 2015 by major industry sector is shown in the next
chart. The three industries with the higher employment are: Government (231,600), Trade,
Transportation, and Utilities (175,600), and Education & Health Services (125,300).
1,0
53
.3
1,0
51
.2
1,0
36
.1
1,0
24
.2
99
6.0
94
3.3
92
3.6
93
1.3
93
7.2
91
6.8
90
6.2
17.0
-2.1
-15.1 -11.9
-28.2
-52.8
-19.7
7.7 5.9
-20.4
-10.6
-80.0
-60.0
-40.0
-20.0
0.0
20.0
40.0
800
850
900
950
1,000
1,050
1,100
2005 2006 2007 2008 2009 2010 2011 2012 2013 2014 2015D
iffe
ren
ce i
n t
hu
san
ds
Emp
loym
en
t in
th
ou
san
ds
Fiscal Years
Puerto Rico Economic Analysis Report 2014-2015 20
Figure 11 Non Farm Employment (All Industries)
Industry Percent Distribution - Not Seasonally Adjusted
Source: PR Department of Labor and Human Resource - Current Employment Statistic (CES).
Figure 12 Non Farm Employment: Educational and Health Services
(thousands of person) Not Seasonally Adjusted
Source: PR Department of Labor and Human Resource - Current Employment Statistic (CES).
Mining, logging & Construction, 26.0
Manufacturing, 74.5
Trade, transportation, and utilities, 175.6
Information, 20.1
Financial activities, 42.4
Professional & business services, 112.7
Education & health services, 125.3
Leisure & hospitality, 80.5
Other service, 17.4
Government, 231.6
100.0 103.7 105.4 108.7 110.0 111.4 114.2 117.6 122.2 123.1 125.3
1.9
3.7
1.7
3.3
1.3 1.4
2.7
3.5
4.5
0.9
2.2
0.0
2.0
4.0
6.0
90.0
95.0
100.0
105.0
110.0
115.0
120.0
125.0
130.0
2005 2006 2007 2008 2009 2010 2011 2012 2013 2014 2015
Dif
fere
nce
in T
ho
usa
nd
s
Emp
loym
en
t in
Th
ou
san
ds
Fiscal Years

Puerto Rico Economic Analysis Report 2014-2015 21
Figure 13 Non Farm Employment: Leisure & Hospitality
(thousands of person) Not Seasonally Adjusted
Source: PR Department of Labor and Human Resource - Current Employment Statistic (CES).
Figure 14 Non Farm Employment: Information
(thousands of person) Not Seasonally Adjusted
Source: PR Department of Labor and Human Resource - Current Employment Statistic (CES).
Figure 15
Non Farm Employment: Government (thousands of person) Not Seasonally Adjusted
Source: PR Department of Labor and Human Resource - Current Employment Statistic (CES).
22.6 22.7 22.6 21.4 20.2 18.8 18.7 18.7 19.2 19.7 20.1
0.7
0.1 0.0
-1.2 -1.2 -1.4
-0.1 -0.10.5 0.5 0.4
-4.0
-2.0
0.0
2.0
16.0
18.0
20.0
22.0
24.0
2005 2006 2007 2008 2009 2010 2011 2012 2013 2014 2015
Dif
fere
nce
in t
ho
usan
ds
Emp
loym
en
t in
th
ou
san
ds
Fiscal Years
72.6 74.8 73.6 73.4 70.9 71.1 71.2 72.8 77.0 79.5 80.5
2.3 2.2
-1.1-0.2
-2.5
0.1 0.1
1.6
4.2
2.5
1.0
-6.0
-4.0
-2.0
0.0
2.0
4.0
6.0
60.0
65.0
70.0
75.0
80.0
85.0
2005 2006 2007 2008 2009 2010 2011 2012 2013 2014 2015
Dif
fere
nce
in T
ho
usa
nd
s
Emp
loym
en
t in
Th
ou
san
ds
Fiscal Years
307.8 302.5 298.1 297.7 300.7 276.5 260.0 258.4 254.6 238.0 231.6
4.4
-5.3 -4.4-0.4
3.0
-24.2
-16.5
-1.6-3.8
-16.6
-6.5
-35.0
-25.0
-15.0
-5.0
5.0
15.0
200.0
220.0
240.0
260.0
280.0
300.0
320.0
2005 2006 2007 2008 2009 2010 2011 2012 2013 2014 2015
Dif
fere
nce
in T
ho
usa
nd
s
Emp
loym
en
t in
Th
ou
san
ds
Fiscal Years

Puerto Rico Economic Analysis Report 2014-2015 22
Figure 16 Non Farm Employment: Mining, Logging & Construction
(thousands of person) Not Seasonally Adjusted
Source: PR Department of Labor and Human Resource - Current Employment Statistic (CES).
Figure 17
Non Farm Employment: Professional and Business Services (thousands of person) Not Seasonally Adjusted
Source: PR Department of Labor and Human Resource - Current Employment Statistic (CES).
Figure 18 Non Farm Employment: Trade, Transportation & Utilities
(thousands of person) Not Seasonally Adjusted
Source: PR Department of Labor and Human Resource - Current Employment Statistic (CES).
103.8 106.5 108.8 108.2 103.3 102.7 105.7 108.9 112.7 114.6 112.7
1.9 2.8 2.3
-0.7
-4.8
-0.6
2.9 3.2 3.81.9
-1.9
-12.0
-7.0
-2.0
3.0
90.0
95.0
100.0
105.0
110.0
115.0
120.0
2005 2006 2007 2008 2009 2010 2011 2012 2013 2014 2015
Dif
fere
nce
in
Th
ou
san
ds
Emp
loym
en
t in
Th
ou
san
ds
Fiscal Years
68.2 65.9 64.7 59.7 49.1 36.3 32.1 35.1 33.7 28.2 26.0
-1.1 -2.3 -1.2
-5.0
-10.6-12.8
-4.2
3.1
-1.4
-5.5
-2.2
-25.0
-20.0
-15.0
-10.0
-5.0
0.0
5.0
0.0
10.0
20.0
30.0
40.0
50.0
60.0
70.0
80.0
2005 2006 2007 2008 2009 2010 2011 2012 2013 2014 2015
Dif
fere
nce
in T
ho
usa
nd
s
Emp
loym
en
t in
Th
ou
san
ds
Fiscal Years
187.5 188.8 184.0 181.3 176.5 173.5 174.4 174.3 176.8 176.8 175.6
5.2
1.3
-4.8-2.7
-4.9-3.0
0.9-0.1
2.5
-0.1-1.1
-14.0
-9.0
-4.0
1.0
6.0
160.0
165.0
170.0
175.0
180.0
185.0
190.0
2005 2006 2007 2008 2009 2010 2011 2012 2013 2014 2015
Dif
fere
nce
in T
ho
usa
nd
s
Emp
loym
en
t in
Tth
ou
san
ds
Fiscal Years

Puerto Rico Economic Analysis Report 2014-2015 23
Figure 19 Non Farm Employment: Financial Activities
(thousands of person) Not Seasonally Adjusted
Source: PR Department of Labor and Human Resource - Current Employment Statistic (CES).
Figure 20
Non Farm Employment: Manufacturing (thousands of person) Not Seasonally Adjusted
Source: PR Department of Labor and Human Resource - Current Employment Statistic (CES).
Figure 21
Non Farm Employment: Other Services (thousands of person) Not Seasonally Adjusted
Source: PR Department of Labor and Human Resource - Current Employment Statistic (CES).
48.6 49.8 49.1 48.5 48.5 45.8 43.7 44.4 44.4 43.5 42.4
1.81.1
-0.7 -0.60.0
-2.7-2.1
0.7
0.0-0.9 -1.1
-8.0
-6.0
-4.0
-2.0
0.0
2.0
4.0
40.0
42.0
44.0
46.0
48.0
50.0
2005 2006 2007 2008 2009 2010 2011 2012 2013 2014 2015
Dif
fere
nce
in T
ho
usa
nd
s
Emp
loym
en
t in
Th
ou
san
ds
Fiscal Years
24.8 24.0 21.9 21.2 20.1 18.8 17.9 17.6 17.9 17.9 17.4
1.1
-0.8
-2.1
-0.7-1.1 -1.4
-0.8-0.3
0.3 0.0-0.4
-6.0
-5.0
-4.0
-3.0
-2.0
-1.0
0.0
1.0
2.0
15.0
18.0
21.0
24.0
27.0
2005 2006 2007 2008 2009 2010 2011 2012 2013 2014 2015
Dif
fere
nce
in T
ho
usa
nd
s
Emp
loym
en
t in
Th
ou
san
ds
Fiscal Years
117.3 112.6 107.9 104.1 96.7 88.3 85.7 83.5 78.7 75.5 74.5
-1.1
-4.7 -4.7-3.8
-7.3-8.4
-2.7 -2.2
-4.8
-3.2
-1.0
-12.0
-10.0
-8.0
-6.0
-4.0
-2.0
0.0
60.0
70.0
80.0
90.0
100.0
110.0
120.0
2005 2006 2007 2008 2009 2010 2011 2012 2013 2014 2015
Dif
fere
nce
in T
ho
usa
nd
s
Emp
loym
en
t in
Th
ou
san
ds
Fiscal Years

Puerto Rico Economic Analysis Report 2014-2015 24
IV. Business Employment Dynamics (BED)
A. Trends in Gross Job Gains and Job Losses
Opening and expanding private sector business establishments in Puerto Rico gained 43,922 jobs in
the fourth quarter of 2014. This represents an increase of 5,784 from the previous quarter. Over
the quarter, expanding establishments added 37,334 jobs, while opening establishments added
6,588.
Gross job losses totaled 33,988 in the fourth quarter of 2014, a decrease of 6,523 from the third
quarter of 2014. This was the third decrease in gross job losses since December of 2013. In the
fourth quarter of 2014, contracting establishments lost 26,744 jobs, while closing establishments
accounted for a loss of 7,244 jobs.
Table 3 Three-Month Private Sector Gross Job Gains and Losses, seasonally adjusted
Fourth Quarter 2014
1/ The net employment change is the difference between total gross job gains and total gross job losses. Source: PR Department of Labor and Human Resource—Business Employment Dynamics (BED).
From October to December 2014 in Puerto Rico, gross job gains represented 6.5 percent of private
sector employment, and gross job losses represented 5.0 percent of the private sector employment,
according to preliminary data released by the Bureau of Labor Statistics of the U.S. Department of
Labor. This is less than the national rate of gross job gains (6.6 percent) and less for job losses (5.6
percent). The number of job gains from opening and expanding establishments was 43,922 and the
number of job losses from closing and contracting establishments was 33,988. Expanding and
contracting establishments accounted for most of the jobs gained and lost.
B. Rates of Gross Job Gains and Gross Job Losses
From October to December 2014, gross job gains represented 6.5 percent of private sector
employment. Over the quarter, gross job gains at expanding establishments represented 5.5 percent
of private sector employment, and gross job gains at opening establishments represented 1.0
percent. Nationally, these quarter gross job gains at expanding establishments represented 5.4
Dec. March June Sept. Dec.
2013 2014 2014 2014 2014
Gross job gains 45,339 35,354 38,012 38,138 43,922
At expanding establ ishments 38,035 29,511 30,807 31,124 37,334
At opening establ ishments 7,304 5,843 7,205 7,014 6,588
Gross job losses 36,188 44,386 42,472 40,511 33,988
At contracting establ ishments 29,780 37,958 35,872 34,235 26,744
At clos ing establ ishments 6,408 6,428 6,600 6,276 7,244
Net employment change1/ 9,151 -9,032 -4,460 -2,373 9,934
Category
(3 months ended)

Puerto Rico Economic Analysis Report 2014-2015 25
percent of private sector employment, and at opening establishments represented 1.2 percent.
For the same period, gross job losses represented 5.0 percent of private sector employment. Gross
job losses at contracting establishments represented 3.9 percent of private sector employment, which
was lower than the national rate at contracting establishments (4.5 percent). The rate of gross job
losses at closing establishments was 1.1 for Puerto Rico, and 1.1 percent for the United States.
Table 4 Three-Month Private Sector Gross Job Gains and Losses as percent of employment,
seasonally adjusted - Fourth Quarter 2014
1/ The net employment change is the difference between total gross job gains and total gross job losses. Source: PR Department of Labor and Human Resource—Business Employment Dynamics (BED).
C. Number of Establishments Gaining and Losing Employment
Another way to observe the dynamics of employment change is to count the number of
establishments that opened, closed, expanded, or contracted during the quarter. Out of 44,395
active private sector establishments, a total of 9,365 gained jobs from October to December 2014
(See table C). Of these, 8,031 were expanding establishments and 1,334 were opening
establishments. During the fourth quarter of 2014, 8,374 establishments showed some job losses. Of
these, 6,979 were contracting establishments and 1,395 were closing establishments.
D. Establishment Births and Deaths
From October to December 2014, a total of 883 new private sector, non-farm businesses created
Dec. March June Sept. Dec.
2013 2014 2014 2014 2014
Total Private for Commonwealth of Puerto Rico
Gross job gains 6.6 5.1 5.6 5.6 6.5
At expanding establ ishments 5.5 4.3 4.5 4.6 5.5
At opening establ ishments 1.1 0.8 1.1 1.0 1.0
Gross job losses 5.2 6.4 6.3 5.9 5.0
At contracting establ ishments 4.3 5.5 5.3 5.0 3.9
At clos ing establ ishments 0.9 0.9 1.0 0.9 1.1
Net employment change1/
1.4 -1.3 -0.7 -0.3 1.5
Total Private for United States as a whole
Gross job gains 6.4 6.0 6.5 6.2 6.6
At expanding establ ishments 5.2 4.9 5.3 5.1 5.4
At opening establ ishments 1.2 1.1 1.2 1.1 1.2
Gross job losses 5.8 5.7 5.6 5.8 5.6
At contracting establ ishments 4.7 4.7 4.6 4.8 4.5
At clos ing establ ishments 1.1 1.0 1.0 1.0 1.1
Net employment change1/ 0.6 0.3 0.9 0.4 1.0
Category
(3 months ended)
Rates (percent)
Rates (percent)

Puerto Rico Economic Analysis Report 2014-2015 26
4,268 jobs. This represented a decrease of 28 establishment births from the prior quarter and a
decrease of 656 jobs. The job gains from these new establishments represented 0.6 percent of total
births employment. The historical time series of birth data shows that the number of establishment
births has remained around 900 every quarter.
Table 5 Three-Month Private Sector Gross Job Gains and Losses as percent of employment,
seasonally adjusted - Fourth Quarter 2014
1/ The net employment change is the difference between the number of opening establishments and the number of closing establishment. Source: PR Department of Labor and Human Resource—Business Employment Dynamics (BED).
Dec. March June Sept. Dec.
2013 2014 2014 2014 2014
Establishments gaining jobs 9,626 8,198 8,645 8,636 9,365
Expanding establ ishments 8,237 6,932 7,259 7,252 8,031
Opening establ ishments 1,389 1,266 1,386 1,384 1,334
Establishments losing jobs 8,830 10,225 9,448 9,348 8,374
Contracting establ ishments 7,346 8,609 7,920 7,954 6,979
Clos ing establ ishments 1,484 1,616 1,528 1,394 1,395
Net employment change1/ -95 -350 -142 -10 -61
Category
(3 months ended)

Puerto Rico Economic Analysis Report 2014-2015 27
V. Occupational Employment Survey
A. Occupational Employment and Wage Estimates 2014
According to the 2014 Occupational Employment Survey, estimated employment for the year was
902,930. The hourly mean wage was $13.23 and the hourly median wage was $9.42. In terms of
employment and wages by major occupational group, the Office and Administrative Support
Occupations had the highest employment with 166,720. The hourly mean and median wage for this
group was $11.33 and $9.40, respectively. Other occupational groups that stand out in terms of
employment were, Sales and Related Occupations, 110,610 workers; Food Preparations and Serving
Related Occupations, 72,640 workers; Education, Training, and Library Occupations, 67,050;
Production Occupations, 63,340 workers; and Protective Service Occupations, 58,250 workers.
Table 6 Employment and Wages by Major Occupational Group, 2014
Source: PR Department of Labor and Human Resources. Occupational Employment Survey (OES)
The top 25 highest employment and paying occupations are shown in the next charts.
SOC Employment
Code Total Mean Median Mean Median
11-0000 Management Occupations 37,010 $33.90 $28.05 $70,500 $58,340
13-0000 Business and Financial Operations Occupations 39,510 $18.32 $15.52 $38,110 $32,270
15-0000 Computer and Mathematical Occupations 9,170 $20.61 $18.18 $42,880 $37,820
17-0000 Architecture and Engineering Occupations 13,580 $25.87 $23.44 $53,820 $48,750
19-0000 Life, Physical, and Social Science Occupations 7,380 $21.42 $18.14 $44,550 $37,730
21-0000 Community and Social Service Occupations 15,730 $13.49 $12.59 $28,050 $26,200
23-0000 Legal Occupations 4,530 $30.40 $26.82 $63,240 $55,780
25-0000 Education, Training, and Library Occupations 67,050 $16.90 $15.18 $35,160 $31,570
27-0000 Arts, Design, Entertainment, Sports, and Media Occupations 6,820 $16.92 $13.16 $35,190 $27,380
29-0000 Healthcare Practitioners and Technical Occupations 49,930 $17.06 $13.68 $35,490 $28,450
31-0000 Healthcare Support Occupations 11,060 $9.44 $8.83 $19,630 $18,360
33-0000 Protective Service Occupations 58,250 $9.67 $8.73 $20,120 $18,160
35-0000 Food Preparation and Serving Related Occupations 72,640 $8.67 $8.57 $18,020 $17,820
37-0000 Building and Grounds Cleaning and Maintenance Occupations 43,580 $8.93 $8.59 $18,580 $17,870
39-0000 Personal Care and Service Occupations 15,980 $8.97 $8.55 $18,660 $17,790
41-0000 Sales and Related Occupations 110,610 $10.60 $8.86 $22,060 $18,430
43-0000 Office and Administrative Support Occupations 166,720 $11.33 $9.40 $23,570 $19,560
45-0000 Farming, Fishing, and Forestry Occupations 1,640 $10.76 $8.87 $22,390 $18,440
47-0000 Construction and Extraction Occupations 31,130 $10.21 $8.91 $21,240 $18,540
49-0000 Installation, Maintenance, and Repair Occupations 29,070 $13.35 $11.16 $27,780 $23,220
51-0000 Production Occupations 63,340 $10.93 $9.16 $22,740 $19,060
53-0000 Transportation and Material Moving Occupations 48,200 $10.43 $8.87 $21,690 $18,460
Occupational Group (SOC Title)Hourly Wage Annual Wage

Puerto Rico Economic Analysis Report 2014-2015 28
Figure 22 Top 25 Highest Paying Occupations, 2014
Source: PR Department of Labor and Human Resources. Occupational Employment Survey (OES)
$87.03
$55.00
$47.91
$46.86
$46.29
$43.01
$42.98
$42.78
$41.01
$40.19
$39.91
$39.23
$38.88
$38.87
$38.14
$37.37
$37.05
$36.81
$36.63
$36.33
$35.96
$35.94
$35.86
$35.14
$35.11
$0.0 $10.0 $20.0 $30.0 $40.0 $50.0 $60.0 $70.0 $80.0 $90.0 $100.0
Psychiatrists
Chief Executives
Air Traffic Controllers
Industrial Production Managers
Architectural and Engineering Managers
Internists, General
Judges, Magistrate Judges and Magistrates
Natural Sciences Managers
Compensation and Benefits Managers
Administrative Law Judges, Adjudicators and Hearing Officers
Obstetricians and Gynecologists
Atmospheric and Space Scientists
Sales Managers
Pharmacists
Marketing Managers
Sales Engineers
Postmasters and Mail Superintendents
Computer and Information Systems Managers
Anesthesiologists
General and Operations Managers
Financial Managers
Securities, Commodities and Financial Services Sales Agents
Medical and Health Services Managers
Electronics Engineers, Except Computer
Geoscientists, Except Hydrologists and Geographers
Hourly Mean
Occ
up
atio
ns

Puerto Rico Economic Analysis Report 2014-2015 29
Figure 23 Top 25 Highest Employment Occupations, 2014
Source: PR Department of Labor and Human Resources. Occupational Employment Survey (OES)
42,840
30,810
29,630
27,050
24,540
22,800
17,740
16,630
16,320
15,150
14,650
13,890
12,470
12,120
11,890
10,710
9,930
9,830
9,810
9,440
8,100
7,860
7,750
7,530
7,440
5,000 20,000 35,000 50,000
Retail Salespersons
Cashiers
Janitors and Cleaners, Except Maids and Housekeeping Cleaners
Security Guards
Secretaries and Administrative Assistants, Except Legal, Medical andExecutive
Office Clerks, General
Registered Nurses
Stock Clerks and Order Fillers
Police and Sheriff's Patrol Officers
Elementary School Teachers, Except Special Education
First-Line Supervisors of Office and Administrative Support Workers
Customer Service Representatives
Laborers and Freight, Stock and Material Movers, Hand
First-Line Supervisors of Retail Sales Workers
Food Preparation Workers
Combined Food Preparation and Serving Workers, Including FastFood
Waiters and Waitresses
Secondary School Teachers, Except Special and Career/TechnicalEducation
Executive Secretaries and Executive Administrative Assistants
Accountants and Auditors
Heavy and Tractor-Trailer Truck Drivers
Landscaping and Groundskeeping Workers
First-Line Supervisors of Food Preparation and Serving Workers
Sales Representatives, Wholesale and Manufacturing, ExceptTechnical and Scientific Products
Construction Laborers
Employment

Puerto Rico Economic Analysis Report 2014-2015 30
VI. Occupational Skills & Research
This section presents the results of the Occupational Skills and Research Survey of the Puerto Rico
Bureau Labor Statistics. It presents skills on demand by employers in Puerto Rico. Of the entire
universe of employers, 35.4% informed that they had recruited at least one new employee between
April of 2012 and March of 2013. Of the recruited employees, 27.1% were not required to present
any evidence of a specific level of education. However, 31.0% of those recruited at the end of the
time period had a high school diploma or its equivalent, while 22.8% had a Bachelor degree.
A. Rate of Overqualification
The rate of overqualification, equivalent to the rate of those most recently hired with a higher
academic level to that required by the job vacancy, reached 45.6%. This rate reflected an increase of
2.8 percentage points when compared with that of the previous year (42.8%).
The industry with the highest rate of overqualification was Business Administration, where 100% of
the recruited employees had more education that the one required by the job vacancy, followed by
Information with 81.0%.
Figure 24
Top 5 Industries with Highest Rate of Overqualification - 2013
Source: Puerto Rico Department of Labor: Occupational Skills & Research Division.
B. Rate of Contracted Hires
The rate of contracted hires for the month of March 2013 was 1.9% and the rate of separation was
1.5%, while for March of 2012, the rate was 1.5% and 1.0% respectively. Of the total amount of
those hired in March 2013, 17.9% were part-time workers (less than 28 hours per week), and for
March 2012 was 15.6%. Health plans were offered by 26.2% of employers. On the other hand,
59.2% of the workers hired in April 2012 and March 2013 were required some knowledge of
computers and their dominion of certain, specific software programs.
100.0
81.0
71.9
68.7
64.7
0.0 10.0 20.0 30.0 40.0 50.0 60.0 70.0 80.0 90.0 100.0
Business Administration
Information
Accommodations and Food Services
Transportation and Warehousing
Art, Entertainment, and Recreation
Percent
Ind
ust
rie
s

Puerto Rico Economic Analysis Report 2014-2015 31
C. Job skills with most demand
Timeliness and responsibility, followed by the Capability to follow instructions were the job skills with
most demand and most important to employers. The same were selected for the year 2013 by 80.9%
and 78.8%, while in 2012 by 82.0% and 76.3%, respectively.
Figure 25
Top 5 Higher Demand Skill, 2012-2013
Source: Puerto Rico Department of Labor: Occupational Skills & Research Division.
The five (5) tasks or activities mostly required of a new recruit, and the percent of employers requiring
them for 2013 were as follows:
Figure 26
Top 5 Tasks or Activities Mostly Required of a New Recruit - 2013
Source: Puerto Rico Department of Labor: Occupational Skills & Research Division.
82.0
76.3
59.2
69.2
59.1
80.9
78.8
67.5
59.7
56.1
0.0 20.0 40.0 60.0 80.0 100.0 120.0 140.0 160.0 180.0
Timeliness and responsibility
Capability to follow instructions
Oral and written communications
Team work capability
Skills customer services
Percent
Skill
s
2012 2013
83.4
73.4
63.1
62.2
54.4
0.0 20.0 40.0 60.0 80.0 100.0
Time management
customer relations
Team work
Priority management
Work under pressure
Percent
Task
s o
r A
ctiv
itie
s

Puerto Rico Economic Analysis Report 2014-2015 32
D. Vacancy rate
The vacancy rate, defined as the number of jobs vacant at the moment of answering the
questionnaire, as a percent of the total universe, was 2.0%. This rate reflected an decrease of 2.4
percentage points when compared to that of the previous year (4.4%). Of the total of employers that
answered the questionnaire, 6.6% informed that they had vacant jobs; and of these, 47.2% found
difficulty in trying to fill them.
The highest vacancy rate corresponded to the Public Administration industry with 5.2%, followed by
Art, Entertainment and Recreation with 4.9%. Among the establishments that reported having vacant
jobs, the industries of Art, Entertainment and Recreation (79.5%) and Administrative and Support
Services (57.2%) registered the highest percentage rate of new vacant jobs. During the previous year,
the industries with the highest percentage rate of new jobs were Arts, Entertainment and Recreation
(68.7%) and Professional Services, Scientists and Technicians (40.9%).
The Information and Real Estate and Rental and Leasing industries was the one that reflected the
highest percentage rate of establishment with vacancies hardest to fill with 100% and 73.9%,
respectively. In 2012, the Arts, Entertainment and Recreation industry was the one that reported the
highest percentage rate of establishment with vacancies hardest to fill, with 100.0%. Within the
occupations of Pharmacists (5.1%) and Butchers and Meat Cutters (4.9%), they reflected the highest
percentage rate as the vacancies hardest to fill, while in 2012 were the Retail Salespersons (5.5%) and
Secretaries and Administrative Assistant, except for Legal, Medical and Executives (3.8%).
Figure 27 Top 5 Occupations with the Rate of Vacancies Hardest to Fill - 2013
Source: Puerto Rico Department of Labor: Occupational Skills & Research Division.
5.1
4.9
3.5
3.4
3.0
0.0 2.0 4.0 6.0
Pharmacists
Butchers and Meat Cutters
Pharmacy Technicians
Retail Salespersons
Accountants and Auditors
Percent
Occ
up
atio
ns

Puerto Rico Economic Analysis Report 2014-2015 33
VII. Long Term Industry Projections 2012-2022 by Labor Development Program (PDL)
This section presents the labor market profile, occupational and industrial projections from 2012 to
2022 for the Labor Development Program (PDL) under the WIOA of Puerto Rico. It is important to
notice that the local areas in Puerto Rico do
not follow a parallel patter with the
Metropolitan Statistical Areas delineated by
the U.S. Census and the Office of
Management and Budget. Although the local
areas hold geographical continuity some
municipalities of a particular area belong to different MSA’s. The map below for example, depicts the
San Juan MSA which embraces 41 municipalities of the Island and two thirds of its population.
It is important to notice how the municipalities around the MSA’s in Puerto Rico gravitate towards
the economic and business activity centers of the area and generates great labor mobility within.
The most important as stated before is San Juan followed by Ponce in the south coast and Mayaguez
in the west. The remaining of the municipalities of the Island are located in the mountain (cordillera
Central) area that typically show a reduced population and economic activity. This next section
presents a map of local areas and profile of each one of the 15 local areas including:

Puerto Rico Economic Analysis Report 2014-2015 34
-
-
-
-
-
-
-
Figu
re 2
8
Lab
or
De
velo
pm
en
t P
rogr
am (
PD
L)

Puerto Rico Economic Analysis Report 2014-2015 35
A. Bayamón - Comerio Local Area
Industry projections for 2012-2022 (calendar year) period for this area shows an increase of 3,128
new jobs. The total employment estimated in 2012 was 58,520 and the projected employment to
2022 was 61,648. This increase is mainly expected in the Service Providing Sector with 6.49 percent
of job growth. The industry sector with the highest gain was Trade, Transportation and Utilities;
followed by Health Care and Social Assistance. The Government and Educational Services sector
were the only service sector showing a decrease. The goods producing industries are also projecting
a loss in employment of 395 jobs, due to a loss in the manufacturing sector.
The major occupational group with the highest increase in employment are Sales and Related
Occupations and Healthcare Practitioners and Technical Occupations. The occupations gaining the
most new jobs (projected numeric growth in employment 2012-2022) are Retails Salespersons,
Registered Nurses, Janitors and Cleaners, First-Line Supervisors of Retail Sales Workers and Cashier.
The occupation with fastest-growing (projected percent growth 2012-2022) are Pharmacists;
Registered Nurses; Light Truck or Delivery Services Drivers; Medical and Clinical Laboratory
Technologists; and Billing and Posting Clerks. The declining occupations by net growth 2012-2022 are
Police and Sheriff’s Patrol Officers; Office Clerks, General; Word Processors and Typists; Executive
Secretaries and Executive Administrative Assistants; and Data Entry Keyers.
Figure 29 Bayamón-Comerio Local Area - Long Term Projections 2012-2022
Jobs by Major Industry Group
Source: Puerto Rico Department of Labor - Research & Statistic Division.
1,969
1,789
726
447
172
100
47
5
-442
-504
-1,181
-2,000 -1,000 0 1,000 2,000
Trade, Transportation and Utilities
Health Care and Social Assistance
Professional and Business Services
Leisure and Hospitality
Information
Financial Activities
Natural Resources and Mining / Construction
Other Services (Except Government)
Manufacturing
Educational Services
Government
Employment
Maj
or
Ind
ust
ry S
ect
or

Puerto Rico Economic Analysis Report 2014-2015 36
Figure 30 Bayamón-Comerio Local Area - Long Term Projections 2012-2022
Employment Outlook by Major Occupational Group
Source: Puerto Rico Department of Labor - Research & Statistic Division.
1,177
958
473
260
205
155
151
129
110
83
9
6
4
0
-1
-6
-32
-119
-179
-264
-600 -200 200 600 1,000 1,400 1,800
Sales and Related Occupations
Healthcare Practitioners and Technical Occupations
Food Preparation and Serving Related Occupations
Transportation and Material Moving Occupations
Building and Grounds Cleaning and Maintenance Occupations
Healthcare Support Occupations
Office and Administrative Support Occupations
Personal Care and Service Occupations
Installation, Maintenance, and Repair Occupations
Construction and Extraction Occupations
Arts, Design, Entertainment, Sports, and Media Occupations
Architecture and Engineering Occupations
Community and Social Service Occupations
Management Occupations
Computer and Mathematical Occupations
Life, Physical, and Social Science Occupations
Business and Financial Operations Occupations
Protective Service Occupations
Production Occupations
Education, Training, and Library Occupations
Employment
Maj
or
Occ
up
atio
nal
Gro
up

Puerto Rico Economic Analysis Report 2014-2015 37
B. Caguas-Guayama Local Area
Industry projections for 2012-2022 (calendar year) period for this area shows an increase of 25,187
new jobs. The total employment estimated in 2012 was 98,296 and the projected employment to
2022 was 123,483. This increase is mainly expected in the Service Providing Sector with 30.25
percent of job growth. The industry sector with the highest gain was Health Care and Social
Assistance, followed by Trade, Transportation and Utilities. The goods producing industries are also
projecting a increase in employment of 163 jobs, although in the manufacturing sector is projected a
loss of 578 jobs.
The major occupational group with the highest increase in employment are Sales and Related
Occupations and Office and Administrative Support Occupations. The occupations gaining the most
new jobs (projected numeric growth in employment 2012-2022) are Personal Care Aides; Retail
Salespersons, Registered Nurses; Security Guards; and Janitors and Cleaners. The occupation with
fastest-growing (projected percent growth 2012-2022) are Personal Care Aides; Home Health Aides;
Registered Nurses; Medical Secretaries; and Meeting, Convention, and Event Planners. The declining
occupations by net growth 2012-2022 are Team Assemblers; Word Processors and Typists; Sewing
Machine Operators; Data Entry Keyers; and Mixing and Blending Machine Setters, Operators, and
Tenders.
Figure 31 Caguas-Guayama Local Area - Long Term Projections 2012-2022
Jobs by Major Industry Group
Source: Puerto Rico Department of Labor - Research & Statistic Division.
7,142
6,880
4,099
2,230
1,419
1,250
1,079
741
672
253
-578
-2,000 0 2,000 4,000 6,000 8,000 10,000
Health Care and Social Assistance
Trade, Transportation and Utilities
Professional and Business Services
Leisure and Hospitality
Educational Services
Government
Financial Activities
Natural Resources and Mining / Construction
Information
Other Services (Except Government)
Manufacturing
Employment
Maj
or
Ind
ust
ry S
ect
or

Puerto Rico Economic Analysis Report 2014-2015 38
Figure 32 Caguas - Guayama Local Area - Long Term Projections 2012-2022
Employment Outlook by Major Occupational Group
Source: Puerto Rico Department of Labor - Research & Statistic Division.
3,369
3,172
2,436
2,405
2,350
1,906
1,210
1,173
1,108
1,039
935
899
711
687
655
403
231
168
144
103
62
21
0 400 800 1,200 1,600 2,000 2,400 2,800 3,200 3,600 4,000
Sales and Related Occupations
Office and Administrative Support Occupations
Personal Care and Service Occupations
Healthcare Practitioners and Technical Occupations
Food Preparation and Serving Related Occupations
Transportation and Material Moving Occupations
Protective Service Occupations
Building and Grounds Cleaning and Maintenance Occupations
Installation, Maintenance, and Repair Occupations
Education, Training, and Library Occupations
Construction and Extraction Occupations
Healthcare Support Occupations
Business and Financial Operations Occupations
Management Occupations
Production Occupations
Community and Social Service Occupations
Computer and Mathematical Occupations
Arts, Design, Entertainment, Sports, and Media Occupations
Life, Physical, and Social Science Occupations
Architecture and Engineering Occupations
Farming, Fishing, and Forestry Occupations
Legal Occupations
Employment
Maj
or
Occ
up
atio
nal
Gro
up

Puerto Rico Economic Analysis Report 2014-2015 39
C. Carolina Local Area
Industry projections for 2012-2022 (calendar year) period for this area shows an increase of 5,641
new jobs. The total employment estimated in 2012 was 51,734 and the projected employment to
2022 was 57,375. This increase is mainly expected in the Service Providing Sector with 12.82 percent
of job growth. The industry sector with the highest gain was Trade, Transportation and Utilities;
followed by Professional and Business Services. The Government and Educational Services sector
were the only service sector showing a decrease. The Goods Producing industries are also projecting
a loss in employment of 445 jobs, due to a loss in the Manufacturing and Natural Resources and
Mining / Construction sector.
The major occupational group with the highest increase in employment are Sales and Related
Occupations and Food Preparation and Serving Related Occupations. The occupations gaining the
most new jobs (projected numeric growth in employment 2012-2022) are Retails Salespersons;
Cashier; Janitors and Cleaners; Customer Service Representatives; and Maintenance and Repair
Workers, General. The occupation with fastest-growing (projected percent growth 2012-2022) are
Driver/Sales Workers; Registered Nurses; Cooks, Restaurant; Customer Service Representatives; and
Bartenders. The declining occupations by net growth 2012-2022 are Executive Secretaries and
Executive Administrative Assistants; Painters, Construction and Maintenance; Data Entry Keyers;
Aircraft Mechanics and Service Technicians; and Correctional Officers and Jailers.
Figure 33 Carolina Local Area - Long Term Projections 2012-2022
Jobs by Major Industry Group
Source: Puerto Rico Department of Labor - Research & Statistic Division
1,919
1,873
1,533
611
288
238
25
-9
-72
-329
-436
-2,000 0 2,000 4,000 6,000 8,000 10,000
Trade, Transportation and Utilities
Professional and Business Services
Leisure and Hospitality
Health Care and Social Assistance
Information
Financial Activities
Other Services (Except Government)
Natural Resources and Mining / Construction
Educational Services
Government
Manufacturing
Employment
Maj
or
Ind
ust
ry S
ect
or

Puerto Rico Economic Analysis Report 2014-2015 40
Figure 34 Carolina Local Area - Long Term Projections 2012-2022
Employment Outlook by Major Occupational Group
Source: Puerto Rico Department of Labor - Research & Statistic Division.
1,156
953
434
361
289
279
277
188
182
156
102
78
33
21
9
-19
-29
-46
-97
-400 0 400 800 1,200
Sales and Related Occupations
Food Preparation and Serving Related Occupations
Office and Administrative Support Occupations
Transportation and Material Moving Occupations
Installation, Maintenance, and Repair Occupations
Building and Grounds Cleaning and Maintenance Occupations
Healthcare Practitioners and Technical Occupations
Personal Care and Service Occupations
Healthcare Support Occupations
Management Occupations
Business and Financial Operations Occupations
Computer and Mathematical Occupations
Community and Social Service Occupations
Arts, Design, Entertainment, Sports, and Media Occupations
Education, Training, and Library Occupations
Life, Physical, and Social Science Occupations
Construction and Extraction Occupations
Architecture and Engineering Occupations
Production Occupations
Employment
Maj
or
Occ
up
atio
nal
Gro
up

Puerto Rico Economic Analysis Report 2014-2015 41
D. Guaynabo-Toa Baja Local Area
Industry projections for 2012-2022 (calendar year) period for this area shows an increase of 12,567
new jobs. The total employment estimated in 2012 was 70,075 and the projected employment to
2022 was 82,642. This increase is mainly expected in the Service Providing Sector with 20.70 percent
of job growth. The industry sector with the highest gain was Trade, Transportation and Utilities,
followed by Professional and Business Services. The goods producing industries are projecting a loss
in employment of 25 jobs, due to loss in manufacturing sector with a decrease by 430 jobs.
The major occupational group with the highest increase in employment are Office and Administrative
Support Occupations and Sales and Related Occupations. The occupations gaining the most new jobs
(projected numeric growth in employment 2012-2022) are Janitors and Cleaners; Customer Service
Representatives; Secretaries and Administrative Assistant; Retail Salespersons; and Sales
Representative, Wholesale and Manufacturing. The occupation with fastest-growing (projected
percent growth 2012-2022) are Market Research Analysts and Marketing Specialists; Civil Engineers;
Demonstrators and Product Promoters; Pharmacists; and Computer User Support Specialists. The
declining occupations by net growth 2012-2022 are Word Processors and Typists; Helpers-Production
Workers; Roofers; Couriers and Messengers; and Mixing and Blending Machine Setters, Operators,
and Tenders.
Figure 35
Guaynabo-Toa Baja Local Area - Long Term Projections 2012-2022 Jobs by Major Industry Group
Source: Puerto Rico Department of Labor - Research & Statistic Division.
3,628
3,320
1,644
1,085
1,071
929
484
405
252
179
-430
-1,000 0 1,000 2,000 3,000 4,000 5,000
Trade, Transportation and Utilities
Professional and Business Services
Information
Leisure and Hospitality
Health Care and Social Assistance
Financial Activities
Government
Natural Resources and Mining / Construction
Educational Services
Other Services (Except Government)
Manufacturing
Employment
Maj
or
Ind
ust
ry S
ect
or

Puerto Rico Economic Analysis Report 2014-2015 42
Figure 36 Guaynabo-Toa Baja Local Area - Long Term Projections 2012-2022
Employment Outlook by Major Occupational Group
Source: Puerto Rico Department of Labor - Research & Statistic Division.
2,237
1,878
1,030
1,003
991
858
846
554
486
448
422
383
377
349
240
179
114
87
57
22
10
-4
-400 0 400 800 1,200 1,600 2,000 2,400
Office and Administrative Support Occupations
Sales and Related Occupations
Transportation and Material Moving Occupations
Building and Grounds Cleaning and Maintenance Occupations
Food Preparation and Serving Related Occupations
Business and Financial Operations Occupations
Management Occupations
Healthcare Practitioners and Technical Occupations
Installation, Maintenance, and Repair Occupations
Construction and Extraction Occupations
Architecture and Engineering Occupations
Computer and Mathematical Occupations
Personal Care and Service Occupations
Education, Training, and Library Occupations
Arts, Design, Entertainment, Sports, and Media Occupations
Protective Service Occupations
Community and Social Service Occupations
Healthcare Support Occupations
Life, Physical, and Social Science Occupations
Production Occupations
Legal Occupations
Farming, Fishing, and Forestry Occupations
Employment
Maj
or
Occ
up
atio
nal
Gro
up

Puerto Rico Economic Analysis Report 2014-2015 43
D. Mayagüez-Las Marías Local Area
Industry projections for 2012-2022 (calendar year) period for this area shows an increase of 736 new
jobs. The total employment estimated in 2012 was 34,936 and the projected employment to 2022
was 35,672. This increase is mainly expected in the Service Providing Sector with 6.66 percent of job
growth. The industry sector with the highest gain was Health Care and Social Assistance, followed by
Trade, Transportation and Utilities. The Government, Educational Services, and Other Services sector
were the only Service Providing Sector showing a decrease. The Goods Producing Industries are
projecting a loss in employment of 1,259 jobs, due to loss in Manufacturing and Natural Resources
and Mining / Construction sector.
The major occupational group with the highest increase in employment are Healthcare Practitioners
and Technical Occupations and Sales and Related Occupations. The occupations gaining the most
new jobs (projected numeric growth in employment 2012-2022) are Registered Nurses; Retail
Salespersons; Medical Secretaries; Cashiers; and Security Guards. The occupation with fastest-
growing (projected percent growth 2012-2022) are Medical Secretaries; Registered Nurses; Combined
Food Preparation and Serving Workers, including Fast Food; Licensed Practical and Licensed
Vocational Nurses; and Customer Service Representatives. The declining occupations by net growth
2012-2022 are Sewing Machine Operators; Police and Sheriff’s Patrol Officers; Inspectors, Testers,
Sorters, Samplers, and Weighers; Executive Secretaries and Executive Administrative Assistants; and
Office Clerks, General.
Figure 37 Mayagüez-Las Marías Local Area - Long Term Projections 2012-2022
Jobs by Major Industry Group
Source: Puerto Rico Department of Labor - Research & Statistic Division.
1,126
785
557
331
112
88
-1
-75
-301
-702
-1,184
-1,600 -1,200 -800 -400 0 400 800 1,200
Health Care and Social Assistance
Trade, Transportation and Utilities
Professional and Business Services
Leisure and Hospitality
Financial Activities
Information
Other Services (Except Government)
Natural Resources and Mining / Construction
Educational Services
Government
Manufacturing
Employment
Maj
or
Ind
ust
ry S
ect
or

Puerto Rico Economic Analysis Report 2014-2015 44
Figure 38 Mayagüez-Las Marías Local Area - Long Term Projections 2012-2022
Employment Outlook by Major Occupational Group
Source: Puerto Rico Department of Labor - Research & Statistic Division.
527
439
296
138
119
62
60
59
56
14
10
10
2
-1
-18
-21
-61
-80
-136
-727
-1,000 -800 -600 -400 -200 0 200 400 600 800
Healthcare Practitioners and Technical Occupations
Sales and Related Occupations
Food Preparation and Serving Related Occupations
Office and Administrative Support Occupations
Healthcare Support Occupations
Building and Grounds Cleaning and Maintenance Occupations
Personal Care and Service Occupations
Computer and Mathematical Occupations
Transportation and Material Moving Occupations
Management Occupations
Community and Social Service Occupations
Installation, Maintenance, and Repair Occupations
Arts, Design, Entertainment, Sports, and Media Occupations
Architecture and Engineering Occupations
Life, Physical, and Social Science Occupations
Business and Financial Operations Occupations
Protective Service Occupations
Construction and Extraction Occupations
Education, Training, and Library Occupations
Production Occupations
Employment
Maj
or
Occ
up
atio
nal
Gro
up

Puerto Rico Economic Analysis Report 2014-2015 45
D. La Montaña Local Area
Industry projections for 2012-2022 (calendar year) period for this area shows an increase of 2,135
new jobs. The total employment estimated in 2012 was 19,364 and the projected employment to
2022 was 21,499. This increase is mainly expected in the Service Providing Sector with 19.62 percent
of job growth. The industry sector with the highest gain was Trade, Transportation and Utilities,
followed by Health Care and Social Assistance. The goods producing industries are projecting a loss in
employment of 649 jobs, due to loss in manufacturing sector with a decrease by 752 jobs.
The major occupational group with the highest increase in employment are Sales and Related
Occupations and Office and Administrative Support Occupations. The occupations gaining the most
new jobs (projected numeric growth in employment 2012-2022) are Cashiers; Retail Salespersons;
Secretaries and Administrative Assistant; Registered Nurses; and Dental Assistants. The occupation
with fastest-growing (projected percent growth 2012-2022) are Registered Nurses; Construction
Laborers; Cashiers; Dental Assistants; and Retail Salespersons. The declining occupations by net
growth 2012-2022 are Sewing Machine Operators; Inspector, Testers, Sorters, Samplers, and
Weighers; First-Line Supervisors of Production and Operating Workers; Industrial Truck and Tractor
Operators; and Industrial Engineers.
Figure 39 La Montaña Local Area - Long Term Projections 2012-2022
Jobs by Major Industry Group
Source: Puerto Rico Department of Labor - Research & Statistic Division.
816
742
290
264
264
229
146
103
33
-752
-1,000 -500 0 500 1,000
Trade, Transportation and Utilities
Health Care and Social Assistance
Educational Services
Leisure and Hospitality
Government
Professional and Business Services
Information / Financial Activities
Natural Resources and Mining / Construction
Other Services (Except Government)
Manufacturing
Employment
Maj
or
Ind
ust
ry S
ect
or

Puerto Rico Economic Analysis Report 2014-2015 46
Figure 40 La Montaña Local Area - Long Term Projections 2012-2022
Employment Outlook by Major Occupational Group
Source: Puerto Rico Department of Labor - Research & Statistic Division.
363
339
300
284
235
200
187
118
104
62
45
41
37
28
26
8
-2
-3
-540
-700 -300 100 500
Sales and Related Occupations
Office and Administrative Support Occupations
Food Preparation and Serving Related Occupations
Healthcare Practitioners and Technical Occupations
Transportation and Material Moving Occupations
Construction and Extraction Occupations
Healthcare Support Occupations
Community and Social Service Occupations
Building and Grounds Cleaning and Maintenance Occupations
Personal Care and Service Occupations
Installation, Maintenance, and Repair Occupations
Management Occupations
Business and Financial Operations Occupations
Protective Service Occupations
Arts, Design, Entertainment, Sports, and Media Occupations
Computer and Mathematical Occupations
Life, Physical, and Social Science Occupations
Architecture and Engineering Occupations
Production Occupations
Employment
Maj
or
Occ
up
atio
nal
Gro
up

Puerto Rico Economic Analysis Report 2014-2015 47
G. Noreste Local Area
Industry projections for 2012-2022 (calendar year) period for this area shows an increase of 5,442
new jobs. The total employment estimated in 2012 was 33,301 and the projected employment to
2022 was 38,743. This increase is mainly expected in the Service Providing Sector with 18.91 percent
of job growth. The industry sector with the highest gain was Leisure and Hospitality, followed by
Trade, Transportation and Utilities. The goods producing industries are projecting a loss in
employment of 44 jobs, due to loss in manufacturing sector with a decrease by 129 jobs.
The major occupational group with the highest increase in employment are Sales and Related
Occupations and Food Preparation and Serving Related Occupations. The occupations gaining the
most new jobs (projected numeric growth in employment 2012-2022) are Retail Salespersons;
Waiters and Waitresses; Secretaries and Administrative Assistant; Cashiers; and First-Line Supervisors
of Retail Sales Workers. The occupation with fastest-growing (projected percent growth 2012-2022)
are Medical Secretaries; Registered Nurses; Combined Food Preparation and Serving Workers,
including Fast Food; Cooks, Restaurant; and Bartenders. The declining occupations by net growth
2012-2022 are Executive Secretaries and Executive Administrative Assistant; Packing and Filling
Machine Operators and Tenders; Farmworkers and Laborers, Crop, Nursery, and Greenhouse;
Industrial Production Managers; and Packers and Packagers, Hand.
Figure 41 Noreste Local Area - Long Term Projections 2012-2022
Jobs by Major Industry Group
Source: Puerto Rico Department of Labor - Research & Statistic Division.
1,641
1,585
916
284
267
265
255
223
85
50
-129
-400 -200 0 200 400 600 800 1,000 1,200 1,400 1,600 1,800 2,000
Leisure and Hospitality
Trade, Transportation and Utilities
Health Care and Social Assistance
Professional and Business Services
Information
Government
Educational Services
Financial Activities
Natural Resources and Mining / Construction
Other Services (Except Government)
Manufacturing
Employment
Maj
or
Ind
ust
ry S
ect
or

Puerto Rico Economic Analysis Report 2014-2015 48
Figure 42 Noreste Local Area - Long Term Projections 2012-2022
Employment Outlook by Major Occupational Group
Source: Puerto Rico Department of Labor - Research & Statistic Division.
1,063
914
725
448
380
311
263
246
243
214
122
109
109
107
61
57
39
24
20
-2
-15
-200 0 200 400 600 800 1,000 1,200 1,400
Sales and Related Occupations
Food Preparation and Serving Related Occupations
Office and Administrative Support Occupations
Healthcare Practitioners and Technical Occupations
Transportation and Material Moving Occupations
Building and Grounds Cleaning and Maintenance Occupations
Installation, Maintenance, and Repair Occupations
Healthcare Support Occupations
Education, Training, and Library Occupations
Personal Care and Service Occupations
Management Occupations
Business and Financial Operations Occupations
Construction and Extraction Occupations
Protective Service Occupations
Production Occupations
Arts, Design, Entertainment, Sports, and Media Occupations
Community and Social Service Occupations
Computer and Mathematical Occupations
Architecture and Engineering Occupations
Life, Physical, and Social Science Occupations
Farming, Fishing, and Forestry Occupations
Employment
Maj
or
Occ
up
atio
nal
Gro
up

Puerto Rico Economic Analysis Report 2014-2015 49
D. Noroeste Local Area
Industry projections for 2012-2022 (calendar year) period for this area shows an increase of 6,294 new
jobs. The total employment estimated in 2012 was 44,231 and the projected employment to 2022
was 50,525. This increase is mainly expected in the Service Providing Sector with 18.15 percent of job
growth. The industry sector with the highest gain was Trade, Transportation and Utilities, followed by
Health Care and Social Assistance. The goods producing industries are projecting a loss in
employment of 202 jobs, due to loss in manufacturing sector with a decrease by 790 jobs.
The major occupational group with the highest increase in employment are Office and Administrative
Support Occupations and Sales and Related Occupations. The occupations gaining the most new jobs
(projected numeric growth in employment 2012-2022) are Retail Salespersons; Secretaries and
Administrative Assistant; Registered Nurses; Cashiers and Combined Food Preparation and Serving
Workers, including Fast Foods. The occupation with fastest-growing (projected percent growth 2012-
2022) are Medical Secretaries; Registered Nurses; Carpenters; Combined Food Preparation and
Serving Workers, including Fast Food; and Construction Laborers. The declining occupations by net
growth 2012-2022 are Team assemblers; Sewing Machine Operators; Word Processors and Typists;
Molding Coremaking, and Casting Machine Setters, Operator, and Tenders, Metal and Plastic; and
Data Entry Keyers.
Figure 43 Noroeste Local Area - Long Term Projections 2012-2022
Jobs by Major Industry Group
Source: Puerto Rico Department of Labor - Research & Statistic Division.
1,675
1,499
1,201
960
588
398
298
288
126
51
-790
-1,200 -800 -400 0 400 800 1,200 1,600 2,000
Trade, Transportation and Utilities
Health Care and Social Assistance
Professional and Business Services
Leisure and Hospitality
Natural Resources and Mining / Construction
Educational Services
Financial Activities
Government
Information
Other Services (Except Government)
Manufacturing
Employment
Maj
or
Ind
ust
ry S
ect
or

Puerto Rico Economic Analysis Report 2014-2015 50
Figure 44 Noroeste Local Area - Long Term Projections 2012-2022
Employment Outlook by Major Occupational Group
Source: Puerto Rico Department of Labor - Research & Statistic Division.
1,093
945
723
721
592
438
385
376
314
202
184
178
145
126
108
84
54
38
-3
-397
-600 -400 -200 0 200 400 600 800 1,000 1,200 1,400
Office and Administrative Support Occupations
Sales and Related Occupations
Healthcare Practitioners and Technical Occupations
Food Preparation and Serving Related Occupations
Construction and Extraction Occupations
Education, Training, and Library Occupations
Building and Grounds Cleaning and Maintenance Occupations
Architecture and Engineering Occupations
Transportation and Material Moving Occupations
Business and Financial Operations Occupations
Personal Care and Service Occupations
Healthcare Support Occupations
Installation, Maintenance, and Repair Occupations
Management Occupations
Protective Service Occupations
Community and Social Service Occupations
Computer and Mathematical Occupations
Arts, Design, Entertainment, Sports, and Media Occupations
Life, Physical, and Social Science Occupations
Production Occupations
Employment
Maj
or
Occ
up
atio
nal
Gro
up

Puerto Rico Economic Analysis Report 2014-2015 51
D. Norte Central-Arecibo Local Area
Industry projections for 2012-2022 (calendar year) period for this area shows an increase of 2,300 new
jobs. The total employment estimated in 2012 was 49,809 and the projected employment to 2022
was 52,109. This increase is mainly expected in the Service Providing Sector with 8.83 percent of job
growth. The industry sector with the highest gain was Health Care and Social Assistance, followed by
Trade, Transportation and Utilities. The goods producing industries are projecting a loss in
employment of 1,293 jobs, due to loss in manufacturing and Natural Resources and Mining/
Construction sector.
The major occupational group with the highest increase in employment are Healthcare Practitioners
and Technical Occupations and Sales and Related Occupations. The occupations gaining the most new
jobs (projected numeric growth in employment 2012-2022) are Retail Salespersons; Registered
Nurses; Cashiers; Pharmacy Technicians; and Secretaries and Administrative Assistant. The occupation
with fastest-growing (projected percent growth 2012-2022) are Pharmacy Technicians; Medical
Secretaries; Registered Nurses; Automotive Service Technicians and Mechanics; and Licensed Practical
and Licensed Vocational Nurses. The declining occupations by net growth 2012-2022 are Team
assemblers; Police and Sheriff’s Patrol Officers; Word Processors and Typists; Office Clerks, General;
and Executive Secretaries and Executive Administrative Assistants.
Figure 45 Norte Central-Arecibo Local Area - Long Term Projections 2012-2022
Jobs by Major Industry Group
Source: Puerto Rico Department of Labor - Research & Statistic Division.
1,870
1,352
444
350
149
142
16
-83
-139
-591
-1,210
-2,000 -1,600 -1,200 -800 -400 0 400 800 1,200 1,600 2,000 2,400
Health Care and Social Assistance
Trade, Transportation and Utilities
Leisure and Hospitality
Professional and Business Services
Financial Activities
Information
Other Services (Except Government)
Natural Resources and Mining / Construction
Educational Services
Government
Manufacturing
Employment
Maj
or
Ind
ust
ry S
ect
or

Puerto Rico Economic Analysis Report 2014-2015 52
Figure 46 Norte Central-Arecibo Local Area - Long Term Projections 2012-2022
Employment Outlook by Major Occupational Group
Source: Puerto Rico Department of Labor - Research & Statistic Division.
917
783
436
324
243
209
179
145
106
102
35
15
6
-4
-4
-14
-20
-22
-32
-109
-116
-879
-1,200-1,000-800 -600 -400 -200 0 200 400 600 800 1,0001,200
Healthcare Practitioners and Technical Occupations
Sales and Related Occupations
Food Preparation and Serving Related Occupations
Office and Administrative Support Occupations
Healthcare Support Occupations
Personal Care and Service Occupations
Transportation and Material Moving Occupations
Building and Grounds Cleaning and Maintenance Occupations
Construction and Extraction Occupations
Installation, Maintenance, and Repair Occupations
Community and Social Service Occupations
Business and Financial Operations Occupations
Arts, Design, Entertainment, Sports, and Media Occupations
Computer and Mathematical Occupations
Legal Occupations
Management Occupations
Education, Training, and Library Occupations
Life, Physical, and Social Science Occupations
Architecture and Engineering Occupations
Farming, Fishing, and Forestry Occupations
Protective Service Occupations
Production Occupations
Employment
Maj
or
Occ
up
atio
nal
Gro
up
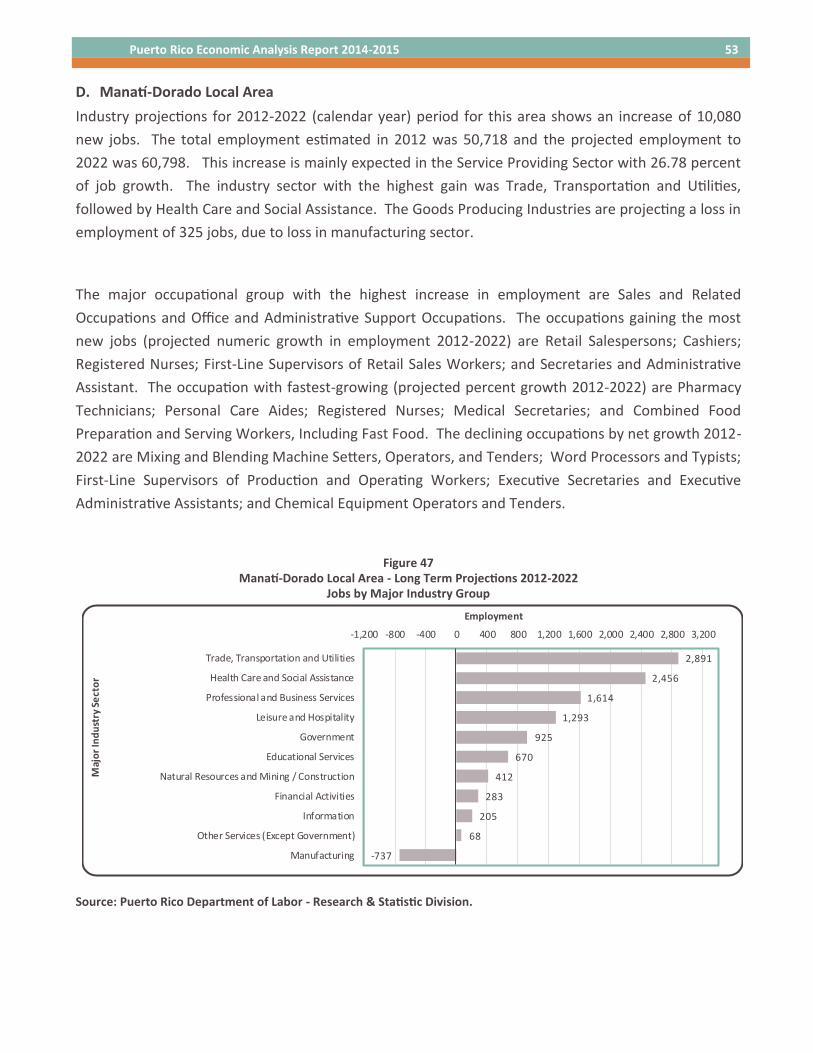
Puerto Rico Economic Analysis Report 2014-2015 53
D. Manatí-Dorado Local Area
Industry projections for 2012-2022 (calendar year) period for this area shows an increase of 10,080
new jobs. The total employment estimated in 2012 was 50,718 and the projected employment to
2022 was 60,798. This increase is mainly expected in the Service Providing Sector with 26.78 percent
of job growth. The industry sector with the highest gain was Trade, Transportation and Utilities,
followed by Health Care and Social Assistance. The Goods Producing Industries are projecting a loss in
employment of 325 jobs, due to loss in manufacturing sector.
The major occupational group with the highest increase in employment are Sales and Related
Occupations and Office and Administrative Support Occupations. The occupations gaining the most
new jobs (projected numeric growth in employment 2012-2022) are Retail Salespersons; Cashiers;
Registered Nurses; First-Line Supervisors of Retail Sales Workers; and Secretaries and Administrative
Assistant. The occupation with fastest-growing (projected percent growth 2012-2022) are Pharmacy
Technicians; Personal Care Aides; Registered Nurses; Medical Secretaries; and Combined Food
Preparation and Serving Workers, Including Fast Food. The declining occupations by net growth 2012-
2022 are Mixing and Blending Machine Setters, Operators, and Tenders; Word Processors and Typists;
First-Line Supervisors of Production and Operating Workers; Executive Secretaries and Executive
Administrative Assistants; and Chemical Equipment Operators and Tenders.
Figure 47 Manatí-Dorado Local Area - Long Term Projections 2012-2022
Jobs by Major Industry Group
Source: Puerto Rico Department of Labor - Research & Statistic Division.
2,891
2,456
1,614
1,293
925
670
412
283
205
68
-737
-1,200 -800 -400 0 400 800 1,200 1,600 2,000 2,400 2,800 3,200
Trade, Transportation and Utilities
Health Care and Social Assistance
Professional and Business Services
Leisure and Hospitality
Government
Educational Services
Natural Resources and Mining / Construction
Financial Activities
Information
Other Services (Except Government)
Manufacturing
Employment
Maj
or
Ind
ust
ry S
ect
or

Puerto Rico Economic Analysis Report 2014-2015 54
Figure 48
Manatí-Dorado Local Area - Long Term Projections 2012-2022 Employment Outlook by Major Occupational Group
Source: Puerto Rico Department of Labor - Research & Statistic Division.
2,162
1,409
1,287
1,032
662
479
426
425
389
386
319
273
180
176
174
110
74
44
41
35
0 500 1,000 1,500 2,000 2,500
Sales and Related Occupations
Office and Administrative Support Occupations
Healthcare Practitioners and Technical Occupations
Food Preparation and Serving Related Occupations
Education, Training, and Library Occupations
Transportation and Material Moving Occupations
Building and Grounds Cleaning and Maintenance Occupations
Construction and Extraction Occupations
Production Occupations
Personal Care and Service Occupations
Installation, Maintenance, and Repair Occupations
Healthcare Support Occupations
Management Occupations
Community and Social Service Occupations
Business and Financial Operations Occupations
Protective Service Occupations
Architecture and Engineering Occupations
Life, Physical, and Social Science Occupations
Computer and Mathematical Occupations
Arts, Design, Entertainment, Sports, and Media Occupations
Employment
Maj
or
Occ
up
atio
nal
Gro
up

Puerto Rico Economic Analysis Report 2014-2015 55
D. Ponce Local Area
Industry projections for 2012-2022 (calendar year) period for this area shows an increase of 48 new
jobs. The total employment estimated in 2012 was 51,015 and the projected employment to 2022
was 51,063. This increase is mainly expected in the Service Providing Sector with 2.04 percent of job
growth. The industry sector with the highest gain was Health Care and Social Assistance, followed by
Trade, Transportation and Utilities. The Goods Producing Industries are projecting a loss in
employment of 869 jobs, due to loss in manufacturing sector.
The major occupational group with the highest increase in employment are Professional and Business
Services and Sales and Related Occupations. The occupations gaining the most new jobs (projected
numeric growth in employment 2012-2022) are Registered Nurses; Retail Salespersons; Janitors and
Cleaners; Combined Food Preparation and Serving Workers, including Fast Food; and Medical
Secretaries. The occupation with fastest-growing (projected percent growth 2012-2022) are
Pharmacy Technicians; Registered Nurses; Medical Secretaries; Carpenters; and Combined Food
Preparation and Serving Workers, including Fast Food. The declining occupations by net growth 2012-
2022 are Office Clerks, General; Secondary School Teachers; Executive Secretaries and Executive
Administrative Assistants; Elementary School Teachers; and Laborers and Freight, Stock, and Material
Movers, Hand.
Figure 49 Ponce Local Area - Long Term Projections 2012-2022
Jobs by Major Industry Group
Source: Puerto Rico Department of Labor - Research & Statistic Division.
1,323
776
484
330
186
99
40
-28
-711
-909
-1,542
-2,000 -1,600 -1,200 -800 -400 0 400 800 1,200 1,600 2,000
Health Care and Social Assistance
Trade, Transportation and Utilities
Professional and Business Services
Leisure and Hospitality
Financial Activities
Information
Natural Resources and Mining / Construction
Other Services (Except Government)
Educational Services
Manufacturing
Government
Employment
Maj
or
Ind
ust
ry S
ect
or

Puerto Rico Economic Analysis Report 2014-2015 56
Figure 50 Ponce Local Area - Long Term Projections 2012-2022 Employment Outlook by Major Occupational Group
Source: Puerto Rico Department of Labor - Research & Statistic Division.
652
565
280
236
93
66
40
-3
-12
-20
-24
-29
-42
-68
-94
-98
-296
-307
-400
-503
-1,000 -500 0 500 1,000
Healthcare Practitioners and Technical Occupations
Sales and Related Occupations
Food Preparation and Serving Related Occupations
Building and Grounds Cleaning and Maintenance Occupations
Personal Care and Service Occupations
Healthcare Support Occupations
Construction and Extraction Occupations
Arts, Design, Entertainment, Sports, and Media Occupations
Legal Occupations
Life, Physical, and Social Science Occupations
Management Occupations
Architecture and Engineering Occupations
Community and Social Service Occupations
Installation, Maintenance, and Repair Occupations
Business and Financial Operations Occupations
Transportation and Material Moving Occupations
Office and Administrative Support Occupations
Protective Service Occupations
Education, Training, and Library Occupations
Production Occupations
Employment
Maj
or
Occ
up
atio
nal
Gro
up

Puerto Rico Economic Analysis Report 2014-2015 57
D. San Juan Local Area
Industry projections for 2012-2022 (calendar year) period for this area shows an increase of 14,288
new jobs. The total employment estimated in 2012 was 265,590 and the projected employment to
2022 was 279,878. This increase is mainly expected in the Service Providing Sector with 5.75 percent
of job growth. The industry sector with the highest gain was Professional and Business Services,
followed by Health Care and Social Assistance. The Goods Producing Industries are projecting a loss in
employment of 63 jobs, due to loss in manufacturing sector.
The major occupational group with the highest increase in employment are Sales and Related
Occupations and Healthcare Practitioners and Technical Occupations. The occupations gaining the
most new jobs (projected numeric growth in employment 2012-2022) are Security Guards; Retail
Salespersons; Janitors and Cleaners; Registered Nurses; and Secretaries and Administrative Assistant.
The occupation with fastest-growing (projected percent growth 2012-2022) are Postal Service Mail
Carriers; Postal Service Clerks; Interpreters and Translators; Market Research Analysts and Marketing
Specialists; and Home Health Aides. The declining occupations by net growth 2012-2022 are Police
and Sheriff’s Patrol Officers; Word Processors and Typists; Office Clerks, General; Executive Secretaries
and Executive Administrative Assistants; and Food Preparation Workers.
Figure 51 San Juan Local Area - Long Term Projections 2012-2022
Jobs by Major Industry Group
Source: Puerto Rico Department of Labor - Research & Statistic Division.
7,706
5,302
3,318
2,666
2,329
1,672
846
-170
-909
-1,218
-7,254
-10,000 -8,000 -6,000 -4,000 -2,000 0 2,000 4,000 6,000 8,000 10,000
Professional and Business Services
Health Care and Social Assistance
Trade, Transportation and Utilities
Financial Activities
Leisure and Hospitality
Information
Natural Resources and Mining / Construction
Other Services (Except Government)
Manufacturing
Educational Services
Government
Employment
Maj
or
Ind
ust
ry S
ect
or

Puerto Rico Economic Analysis Report 2014-2015 58
Figure 52 San Juan Local Area - Long Term Projections 2012-2022
Employment Outlook by Major Occupational Group
Source: Puerto Rico Department of Labor - Research & Statistic Division.
2,612
1,449
1,295
1,275
1,067
1,003
860
841
614
568
507
435
407
363
362
356
308
166
26
-63
-77
-86
-500 0 500 1,000 1,500 2,000 2,500 3,000
Sales and Related Occupations
Healthcare Practitioners and Technical Occupations
Food Preparation and Serving Related Occupations
Building and Grounds Cleaning and Maintenance Occupations
Office and Administrative Support Occupations
Business and Financial Operations Occupations
Management Occupations
Computer and Mathematical Occupations
Personal Care and Service Occupations
Construction and Extraction Occupations
Healthcare Support Occupations
Transportation and Material Moving Occupations
Arts, Design, Entertainment, Sports, and Media Occupations
Production Occupations
Installation, Maintenance, and Repair Occupations
Architecture and Engineering Occupations
Education, Training, and Library Occupations
Legal Occupations
Life, Physical, and Social Science Occupations
Farming, Fishing, and Forestry Occupations
Protective Service Occupations
Community and Social Service Occupations
Employment
Maj
or
Occ
up
atio
nal
Gro
up

Puerto Rico Economic Analysis Report 2014-2015 59
D. Sur Central Local Area
Industry projections for 2012-2022 (calendar year) period for this area shows an increase of 2,644 new
jobs. The total employment estimated in 2012 was 24,554 and the projected employment to 2022
was 27,198. This increase is mainly expected in the Service Providing Sector with 17.29 percent of job
growth. The industry sector with the highest gain was Trade, Transportation and Utilities, followed by
Health Care and Social Assistance. The Goods Producing Industries are projecting a loss in
employment of 238 jobs, due to loss in manufacturing sector.
The major occupational group with the highest increase in employment are Sales and Related
Occupations and Office and Food Preparation and Serving Related Occupations. The occupations
gaining the most new jobs (projected numeric growth in employment 2012-2022) are Elementary
School Teachers; Cashiers; Retail Salespersons; Construction Laborers; and Combined Food
Preparation and Serving Workers, including Fast Food. The occupation with fastest-growing
(projected percent growth 2012-2022) are Combined Food Preparation and Serving Workers, including
Fast Food; Registered Nurses; First-Line Supervisors of Retail Sales Workers; Construction Laborers;
and Secretaries and Administrative Assistants. The declining occupations by net growth 2012-2022
are Word Processors and Typists; First-Line Supervisors of Production and Operating Workers;
Inspector, Testers, Sorters, Samplers, and Weighers; Data Entry Keyers; and Production, Planning, and
Expediting Clerks.
Figure 53
Sur Central Local Area - Long Term Projections 2012-2022 Jobs by Major Industry Group
Source: Puerto Rico Department of Labor - Research & Statistic Division.
934
493
393
354
308
225
147
100
55
20
-385
-500 -300 -100 100 300 500 700 900 1,100
Trade, Transportation and Utilities
Health Care and Social Assistance
Leisure and Hospitality
Professional and Business Services
Educational Services
Government
Natural Resources and Mining / Construction
Financial Activities
Information
Other Services (Except Government)
Manufacturing
Employment
Maj
or
Ind
ust
ry S
ect
or

Puerto Rico Economic Analysis Report 2014-2015 60
Figure 54
Sur Central Local Area - Long Term Projections 2012-2022 Employment Outlook by Major Occupational Group
Source: Puerto Rico Department of Labor - Research & Statistic Division.
422
372
328
294
252
248
183
174
156
87
77
73
55
42
41
22
12
-16
-181
-300 -200 -100 0 100 200 300 400 500
Sales and Related Occupations
Food Preparation and Serving Related Occupations
Office and Administrative Support Occupations
Education, Training, and Library Occupations
Construction and Extraction Occupations
Healthcare Practitioners and Technical Occupations
Building and Grounds Cleaning and Maintenance Occupations
Transportation and Material Moving Occupations
Life, Physical, and Social Science Occupations
Healthcare Support Occupations
Management Occupations
Personal Care and Service Occupations
Installation, Maintenance, and Repair Occupations
Protective Service Occupations
Community and Social Service Occupations
Business and Financial Operations Occupations
Arts, Design, Entertainment, Sports, and Media Occupations
Architecture and Engineering Occupations
Production Occupations
Employment
Maj
or
Occ
up
atio
nal
Gro
up

Puerto Rico Economic Analysis Report 2014-2015 61
D. Sureste Local Area
Industry projections for 2012-2022 (calendar year) period for this area shows an increase of 5,001 new
jobs. The total employment estimated in 2012 was 42,778 and the projected employment to 2022
was 47,779. This increase is mainly expected in the Service Providing Sector with 19.96 percent of
job growth. The industry sector with the highest gain was Health Care and Social Assistance, followed
by Trade, Transportation and Utilities. The Goods Producing Industries are projecting a loss in
employment of 1,173 jobs, due to loss in manufacturing sector.
The major occupational group with the highest increase in employment are Sales and Related
Occupations and Office and Administrative Support Occupations. The occupations gaining the most
new jobs (projected numeric growth in employment 2012-2022) are Retail Salespersons; Registered
Nurses; Cashiers; Janitors and Cleaners; and Cooks, Fast Food. The occupation with fastest-growing
(projected percent growth 2012-2022) are First-Line Supervisors of Food Preparation and Serving
Workers; Registered Nurses; Preschool Teachers; Teacher Assistants; and Customer Service
Representatives. The declining occupations by net growth 2012-2022 are Packaging and Filling
Machine Operators and Tenders; Team Assemblers; Sewing Machine Operators; Industrial Engineers;
and Molding, Coremaking, and Casting Machine Setters, Operators, and Tenders, Metal and Plastic.
Figure 55 Sureste Local Area - Long Term Projections 2012-2022
Jobs by Major Industry Group
Source: Puerto Rico Department of Labor - Research & Statistic Division.
1,598
1,567
932
708
510
441
253
183
120
45
-1,356
-2,000 -1,500 -1,000 -500 0 500 1,000 1,500 2,000
Health Care and Social Assistance
Trade, Transportation and Utilities
Professional and Business Services
Leisure and Hospitality
Government
Educational Services
Financial Activities
Natural Resources and Mining / Construction
Information
Other Services (Except Government)
Manufacturing
Employment
Maj
or
Ind
ust
ry S
ect
or

Puerto Rico Economic Analysis Report 2014-2015 62
Figure 56 Sureste Local Area - Long Term Projections 2012-2022 Employment Outlook by Major Occupational Group
Source: Puerto Rico Department of Labor - Research & Statistic Division.
952
737
735
633
531
389
330
273
175
156
151
138
111
92
91
51
27
-12
-53
-567
-800 -400 0 400 800 1,200
Sales and Related Occupations
Office and Administrative Support Occupations
Healthcare Practitioners and Technical Occupations
Food Preparation and Serving Related Occupations
Education, Training, and Library Occupations
Building and Grounds Cleaning and Maintenance Occupations
Transportation and Material Moving Occupations
Construction and Extraction Occupations
Healthcare Support Occupations
Protective Service Occupations
Management Occupations
Community and Social Service Occupations
Business and Financial Operations Occupations
Installation, Maintenance, and Repair Occupations
Personal Care and Service Occupations
Computer and Mathematical Occupations
Arts, Design, Entertainment, Sports, and Media Occupations
Life, Physical, and Social Science Occupations
Architecture and Engineering Occupations
Production Occupations
Employment
Maj
or
Occ
up
atio
nal
Gro
up

Puerto Rico Economic Analysis Report 2014-2015 63
D. Suroeste Local Area
Industry projections for 2012-2022 (calendar year) period for this area shows an increase of 2,397 new
jobs. The total employment estimated in 2012 was 38,705 and the projected employment to 2022
was 41,102. This increase is mainly expected in the Service Providing Sector with 11.37 percent of
job growth. The industry sector with the highest gain was Health Care and Social Assistance, followed
by Trade, Transportation and Utilities. The Goods Producing Industries are projecting a loss in
employment of 1,054 jobs, due to loss in manufacturing sector.
The major occupational group with the highest increase in employment are Healthcare Practitioners
and Technical Occupations; and Office and Administrative Support Occupations. The occupations
gaining the most new jobs (projected numeric growth in employment 2012-2022) are Registered
Nurses; Secretaries and Administrative Assistants; Combined Food Preparation and Serving Workers;
including Fast Food; Medical Secretaries; and Cashiers. The occupation with fastest-growing
(projected percent growth 2012-2022) are Pharmacy Technicians; Registered Nurses; Medical
Secretaries; Combined Food Preparation and Serving Workers; Including Fast Food; and Preschool
Teachers. The declining occupations by net growth 2012-2022 are Sewing Machine Operators; Team
Assemblers; Farmworkers and Laborers, Crop, Nursery, and Greenhouse; Secondary School Teachers;
Word Processors and Typists.
Figure 57 Suroeste Local Area - Long Term Projections 2012-2022
Jobs by Major Industry Group
Source: Puerto Rico Department of Labor - Research & Statistic Division.
1,291
897
542
533
113
93
29
17
-2
-1,147
-2,000 -1,500 -1,000 -500 0 500 1,000 1,500 2,000
Health Care and Social Assistance
Trade, Transportation and Utilities
Leisure and Hospitality
Professional and Business Services
Financial Activities
Natural Resources and Mining / Construction
Other Services (Except Government)
Government
Educational Services
Manufacturing
Employment
Maj
or
Ind
ust
ry S
ect
or

Puerto Rico Economic Analysis Report 2014-2015 64
Figure 58 Suroeste Local Area - Long Term Projections 2012-2022
Employment Outlook by Major Occupational Group
Source: Puerto Rico Department of Labor - Research & Statistic Division.
639
462
448
396
200
193
149
122
111
107
96
60
45
40
25
10
8
-16
-48
-653
-800 -400 0 400 800
Healthcare Practitioners and Technical Occupations
Office and Administrative Support Occupations
Food Preparation and Serving Related Occupations
Sales and Related Occupations
Construction and Extraction Occupations
Healthcare Support Occupations
Building and Grounds Cleaning and Maintenance Occupations
Transportation and Material Moving Occupations
Education, Training, and Library Occupations
Installation, Maintenance, and Repair Occupations
Personal Care and Service Occupations
Management Occupations
Business and Financial Operations Occupations
Community and Social Service Occupations
Protective Service Occupations
Arts, Design, Entertainment, Sports, and Media Occupations
Life, Physical, and Social Science Occupations
Architecture and Engineering Occupations
Farming, Fishing, and Forestry Occupations
Production Occupations
Employment
Maj
or
Occ
up
atio
nal
Gro
up

Puerto Rico Economic Analysis Report 2014-2015 65
VIII. Other Publications
A. Participation of Women in Labor Force
The statistical data of the past 44 years reflect a significant
growth in the participation of women in the process of
production of goods and services. In 2014, women
represent 42 percent of the working force of Puerto Rico,
an increase of 11 percentage points compared to the 1970
(31 percent). From 1970 until the 2014 our economy has
generated 304,000 jobs, and 70 percent of them are
women. For 2014, the women's labor participation rate is 32 percent while for men 49 percent.
Distribution by Age
The distribution by age of employed women was as follows: 68 percent had between 25 and 54
years, 24 percent between 16 and 24 years, and the remaining 8 percent women 55 years and older.
The number of female employment after 44 years in 2014 was 430,000 representing 43 percent of
total employment. The median age of women in the labor market was 40-year-old. The data
indicates that 77 percent of employed women have between 25 and 54 years. However, younger
women group between 16 and 24 years reflect a reduction in participation in the labor market,
accounting for 9 percent of women's employment. This probably reflects the increase in post-
secondary and tertiary education. Meanwhile, the female population 55 years and older represents
almost 14 percent of employed women.
Educational Level
In 2014, 74 percent of employed women (316,000) has one year or more of college studies (53
percentage points higher than in the 1970; 23 percent have some level of high school (10-12 years).
While women with some degree of elementary or middle school, only represent 2 percent of
women's employment. The median of education is maintained in 13.3 years.
Marital Status and Relation with the Head of Household
In 2014, there are 162,000 women working and fulfilling the function of being the main source of
income to the household. The proportion of employed women as head of family increased from 17
percent to 38 percent between 1970 and 2014. In 2014 there are 96,000 women sharing family head
of household.

Puerto Rico Economic Analysis Report 2014-2015 66
Industrial Composition
The service sector now represents the primary source of employment for women (160,000); It is
followed by public administration with 106,000 female employees. Another important sector is trade,
employing 105,000 workers. It is important to point out that from 1995 the size of female employment
in the commercial sector moved to manufacturing (see table 5). The manufacturing sector, which
accounted for 28 percent of the employment of women in the 1970, today represents 6 percent
equivalent to 26,000 workers. The sectors where there is less participation of women are agriculture,
construction, and transportation. In summary, service sectors, public administration and trade are the
main sources of employment for women
Occupational Composition
After 44 years, women have increased their participation in professional and office occupations, where
more than half of the positions are occupied by females. In 2014, the estimate number of women
employed in professional and office occupations is 150,000 and 123,000 respectively. These
occupational groups today represent 63 percent of women's employment. Although women occupied
more professional jobs than men and are better prepared academically, have less participation in
occupations managerial, executive and administrative than men, (men 57 percent and women 43
percent). The estimated number of women in managerial and administrative positions in 2014 is
50,000, representing 12 percent of women's employment.
Wage Composition
In 2014, women earned a median weekly salary of $283.30 while men’s weekly salary was $290.00.
Unemployment
Data from 2014 shows women's unemployment rate at 12.1 percent which represents an average of
59,000 unemployed females. For this period, 76 percent of women looking for work are between 25
and 54 years. However, the highest unemployment rate is among women aged 16-24 (25 percent). A
significant change is the progress of the unemployed women in relation to their educational level. In
2014, the unemployed women have a median of education of 13.2 years, far exceeding the average
schooling of the unemployed man (12.8). The most recent data reflects that 36 percent of unemployed
women are heads of households, a decrease of 5 percent when compared with 2010. By economic
sector we observe that 71 percent of women looking for work in the 2014 come from the following
sectors: trade, services and public administration.

Puerto Rico Economic Analysis Report 2014-2015 67
Outside the Workforce
In 1990, the total number of women outside the workforce was 919,000, these unemployed women
accounted for 84 percent on the total and for 2014 this amount is 1,036,000. Of this amount, 49
percent performs tasks at home, 16 percent is studying, 10 percent are disabled, 13% retired, 7
percent are considered very young or very old, 3 percent said other unspecified reasons and around
2 percent reported having a disease or condition of health, lack of skills or experience or they don't
want to work.

Puerto Rico Economic Analysis Report 2014-2015 68
B. Employment and Unemployment Status of Persons 60 and Over
Population
The civilian population 16 years and over by 2014 population was
estimated at 2,858,000 persons, with a median education of 12.9 years.
The percentage distribution by years of school completed reflected that
the 75.9% of the population completed at least one year of college. This is
equivalent to 2,153,000 people, of whom the 59.4% have one year or more
of post-secondary studies.
Workforce
The estimated labor force of Puerto Rico for 2014 was 1, 145,000 persons.
The composition of the workforce by level of education was as follows: 582,000 have a college degree,
120,000 with college education without a degree, 328,000 completed high school, 79,000 completed
7th to 11th grade, 25,000 elementary level or less, 4,000 in special education and 6,000 did not report.
From these data it appears that 90% of the labor force has a high school diploma or more.
Employment
The average employment for the year 2014 was 986,000 persons, of which 559,000 were males and
427,000 females. Estimates indicate that six of every ten persons employed in Puerto Rico have one
year or more of post-secondary studies. If we workers with a high school diploma in this group, these
account for 90.8% of total employment). As result the median education of employees was estimated
at 13.2 school years. Of the 624,000 workers with post-secondary in 2014, 348,000 persons have a
Bachelor's degree or more, equivalent to the 35.3% of total employment. The estimate of workers with
vocational associate or technical degree was 175,000, while 101,000 have post-secondary studies
without a degree.
Unemployment
The estimate unemployed persons for the year 2014 was 159,000. The percentage distribution of the
unemployed by educational level attained was: (35.6%) high school, (30.6%) non-degree or vocational
associate – technical grade, post-secondary studies (19.1%) Bachelor's degree or more. This means
that five of every ten unemployed persons in Puerto Rico have one year or more of post-secondary
studies. This partially reflects a labor force among the population with a high level of schooling. The
median of education of unemployed people was 13.0 degrees.

Puerto Rico Economic Analysis Report 2014-2015 69
Unemployment Rate
The average rate of unemployment for the year 2014 was 13.9%. Comparing to the year 2010
(16.4%), represents a reduction of 2.5 percentage points.
Out of the Labor Force
More than half of the civilian population of 16 years and over is not involved in the production of
goods or services. The average for 2014 was 1,713,000 persons, with a median education of 12.6
years. This group is mainly composed of persons in domestic activities (30.2%); attending school
(18.4%), disabled (14.1%) and retired (21.1%).

Puerto Rico Economic Analysis Report 2014-2015 70
C. Labor Force by Educational Level
Population
The civilian population 16 years and over by 2014 population was
estimated at 2,858,000 persons, with a median education of 12.9
years. The percentage distribution by years of school completed
reflected that the 75.9% of the population completed at least one
year of college. This is equivalent to 2,153,000 people, of whom
the 59.4% have one year or more of post-secondary studies.
Workforce
The estimated labor force of Puerto Rico for 2014 was 1, 145,000
persons. The composition of the workforce by level of education was as follows: 582,000 have a
college degree, 120,000 with college education without a degree, 328,000 completed high school,
79,000 completed 7th to 11th grade, 25,000 elementary level or less, 4,000 in special education and
6,000 did not report. From these data it appears that 90% of the labor force has a high school diploma
or more.
Employment
The average employment for the year 2014 was 986,000 persons, of which 559,000 were males and
427,000 females. Estimates indicate that six of every ten persons employed in Puerto Rico have one
year or more of post-secondary studies. If we workers with a high school diploma in this group, these
account for 90.8% of total employment). As result the median education of employees was estimated
at 13.2 school years. Of the 624,000 workers with post-secondary in 2014, 348,000 persons have a
Bachelor's degree or more, equivalent to the 35.3% of total employment. The estimate of workers with
vocational associate or technical degree was 175,000, while 101,000 have post-secondary studies
without a degree.
Unemployment
The estimate unemployed persons for the year 2014 was 159,000. The percentage distribution of the
unemployed by educational level attained was: (35.6%) high school, (30.6%) non-degree or vocational
associate – technical grade, post-secondary studies (19.1%) Bachelor's degree or more. This means
that five of every ten unemployed persons in Puerto Rico have one year or more of post-secondary
studies. This partially reflects a labor force among the population with a high level of schooling. The
median of education of unemployed people was 13.0 degrees.

Puerto Rico Economic Analysis Report 2014-2015 71
Unemployment Rate
The average rate of unemployment for the year 2014 was 13.9%. Comparing to the year 2010
(16.4%), represents a reduction of 2.5 percentage points.
Out of the Labor Force
More than half of the civilian population of 16 years and over is not involved in the production of
goods or services. The average for 2014 was 1,713,000 persons, with a median education of 12.6
years. This group is mainly composed of persons in domestic activities (30.2%); attending school
(18.4%), disabled (14.1%) and retired (21.1%).

Puerto Rico Economic Analysis Report 2014-2015 72
D. Physically Disability Persons in Puerto Rico
Results of the Survey
As revealed by the survey, 286,000 persons 16 years and over
mentioned to have some type of disabilities. This represents 9.9
percent of the non-institutional population 16 years or over
(2,880,000) for March 2014. Gender distribution for this age
group 151,000 male and 135,000 female. From the total of
persons reported to have some type of disabilities, 2.5 percent or
(7,000) claimed to be fitted for work. The distribution by type of
disabilities was: 69% claim some type of physical disable; 25.9
percent mental disable; and 3.8 percent sensorial disable.
When analyzing the type of disability by gender, the male
population represents 50.3 percent of physical disable and 59.5 with mental disable.
By Age Group
By age group, persons 55 years and over represents 62.2 percent of the non civilian population with
some type of disabilities in Puerto Rico. In addition 56.3 percent of the total person with some type of
disable completed high school or one year or more of college education.
Employment and Unemployment
The employment status for disable persons in Puerto Rico indicates that 2.5 percent participate in the
labor market. The amount of disable persons in the workforce was estimated in 7,000 for 2014, of
which 4,000 are male and 3,000 are females. The male population shows a participation rate in the
labor force of 2.7 percent slightly over women with 2.2 percent. The estimated employed disable
persons for the period was estimated in 5,000. This amount represents .05 percent of the total
employment in Puerto Rico in March 2014 (1,000,000). The private sector shows the highest number
of disable employees persons with 2000.
The results of the survey show that there was little disable persons looking for jobs during March of
2014. The largest amount of disable persons are found out of the labor force (280,000). This amount
represents 16.3 percent of the group of persons out of the labor force in Puerto Rico during March of
2014 (1,715,000).

Puerto Rico Economic Analysis Report 2014-2015 73
E. Puerto Rican Employees Belonging to a Labor Union
Introduction
During October 2014, the Bureau of Labor Statistics in Puerto
Rico, conducted a special survey to identify how many
employed workers were part of labor union. The survey was
conducted together with the labor force survey (CPI). In the
study, 86% of the selected housing units (3,300 units) for the
referenced month were interviewed. This study is conducted
every two years. The results were obtained using the same
methodology used for the labor force housing survey.
Results
� In October 2014, not seasonally adjusted employees in Puerto Rico, was estimated in 983,000
persons, of which, 10% or 98,000 indicated to belong to some sort of labor union. Gender
composition for this group was 56,000 males and 42,000 females.
� The estimated number of employees affiliated to a labor organization was 61,000 or 62.3% of
the unionized workers. The remaining employees belong to some type of labor organization
detailed as follows: Brotherhood, 22,000; Associations 11,000; other type of organizations, 5000.
� Results obtained demonstrate a 10% participation of the non seasonally adjusted labor force in
some type of labor union. This number represents a 2.2 % reduction when compared to the
estimated 12.2% registered in October 2012.
� The economic sectors with most participation of affiliated employees to a labor organization
are: public Administration 32.7%, followed by Transportation, Communications and Public
Utilities with 31.5%.
� Finally, the study shows 73.8% employees working in the public sector in October 2014 , while
the private sector showed only 21.4% .

Puerto Rico Economic Analysis Report 2014-2015 74
Silvia Soto Pérez Acting Assistant Secretary for Planning Noel Zayas Moró Economist Research & Statistic Division Bureau of Labor Statistics Prudencio Rivera Martínez Building, 17TH Floor 505 Muñoz Rivera Ave. Hato Rey, Puerto Rico 00918 PO BOX 195540 San Juan, Puerto Rico 00919-5540 Phone: (787) 754-5300 Ext. 3000 Fax: (787) 754-5360 Email: [email protected] [email protected] Visit our website:
www.mercadolaboral.pr.gov