puma racing engine excellent - · pdf filecopyright david baker and puma race engines there is...
TRANSCRIPT

1/52
PUMA RACING
2/52
Table of contents
1 PUMA RACE ENGINES - PEUGEOT 205 8 VALVE .................................................... 4 1.1 BLOCKS AND CRANKS ......................................................................................... 4 1.2 CYLINDER HEAD .................................................................................................... 5 1.3 HEAD BOLTS ........................................................................................................... 7 1.4 INDUCTION SYSTEMS ........................................................................................... 8 1.5 EXHAUST SYSTEMS .............................................................................................. 8 1.6 CAMSHAFTS ............................................................................................................ 9 1.7 STANDARD ENGINES POWER OUTPUTS ........................................................ 10 1.8 THE 160 BHP SCAM .............................................................................................. 10 1.9 TUNED ENGINES .................................................................................................. 12
1.9.1 PRICES ............................................................................................................ 12 1.9.2 Technical Advice .............................................................................................. 13
2 PUMA RACE ENGINES - ENGINE CAPACITY AND COMPRESSION RATIOS ... 14 2.1 COMPRESSION RATIO ......................................................................................... 14
3 PUMA RACE ENGINES - POWER AND TORQUE .................................................... 15 3.1.1 TORQUE .......................................................................................................... 15 3.1.2 WORK .............................................................................................................. 15 3.1.3 POWER ............................................................................................................ 15 3.1.4 HORSEPOWER ............................................................................................... 16 3.1.5 BHP and HP ..................................................................................................... 16 3.1.6 HOW TORQUE AND POWER RELATE ...................................................... 16 3.1.7 Bloody Car Magazines ..................................................................................... 19
4 PUMA RACE ENGINES - INJECTOR SIZING ............................................................ 21 4.1.1 Choosing The Carb Size ................................................................................... 23
5 PUMA RACE ENGINES - ENGINE CALIBRATION & CHIP TUNING .................... 24 5.1 Fuel Mixture ............................................................................................................. 24 5.2 Ignition Timing ........................................................................................................ 25 5.3 High Octane Fuel ..................................................................................................... 25 5.4 Why Don't The OE Manufacturers Get It Right? ..................................................... 26 5.5 Chip Tuning .............................................................................................................. 26 5.6 Calibrating A Modified Engine ................................................................................ 27 5.7 Performance Increases From Modified Chips .......................................................... 27
6 PUMA RACE ENGINES - LIGHTENING FLYWHEELS - AN EXERCISE IN ROTATIONAL DYNAMICS .................................................................................................. 28
6.1 Other Rotating Components ..................................................................................... 31 7 PUMA RACE ENGINES - THE DANGERS OF ROLLING ROAD "FLYWHEEL" BHP FIGURES ........................................................................................................................ 32 8 PUMA RACE ENGINES - COASTDOWN LOSSES .................................................... 34
8.1 Engine dynamometers .............................................................................................. 37 8.2 Rolling road dynamometers ..................................................................................... 38 8.3 Hub dynamometers .................................................................................................. 39
8.3.1 Coast Down Losses .......................................................................................... 40 8.3.2 True Transmission Losses ................................................................................ 40 8.3.3 Converting wheel bhp to flywheel bhp and vice versa .................................... 41
8.4 Dyno comparisons .................................................................................................... 42 8.5 Tyre Pressure ............................................................................................................ 42

3/52
9 Summary .......................................................................................................................... 44 10 PUMA RACE ENGINES - CONTACT DETAILS ..................................................... 50
10.1 Terms Of Business ................................................................................................... 51

4/52
1 PUMA RACE ENGINES - PEUGEOT 205 8 VALVE
The 205 was Peugeot's attempt to really see off the other hot hatches such as the XR2/3 and Golf Gti. The power output is very high compared to other engines of the time and was a result of Peugeot paying a lot of attention to engine design detail. The legacy of this high output is that it is not as simple to improve the power as with other engines that are in a lower state of tune as standard. A great many modified engines that both I and colleagues in the trade see, have LESS power than standard and the companies selling engine conversions tend to boast the most ridiculously inflated power claims compared to companies specializing in other marques. Copyright David Baker and Puma Race Engines
Let's compare the 1.9 Gti engine with the Golf 8 valve and see how Peugeot got so much power. The 1.9 has a claimed 130 PS (128 bhp) compared to the Golf's 112/115 PS (110/113 bhp) in 1.8 or 2.0 litre form. Firstly Peugeot made the bore larger at 83mm and this allowed them to fit larger valves - 41.6mm compared to the Golf GTi's 40mm items. This 8% increase in valve area is worth about 10 bhp. The head was given large ports and a decent shape and flows very well for a standard item. The induction system was carefully designed to flow well and flows enough to allow even well modified engines to breathe ok. Peugeot got the exhaust system bang on - it flows well, has good tuned lengths and an excellent manifold design - whatever you do, don't waste money on an aftermarket system - you won't get more power - you'll probably get a fair bit less. When it rusts away go and buy a genuine Peugeot item - not a pattern part. Finally Peugeot topped the engine off with a really good camshaft. Most 8 valve engines of this size have about 400 thou valve lift as standard and a fast road cam from Piper or Kent etc will add another perhaps 30 to 40 thou to that. The Pug 1.9 has 445 thou lift as standard and fairly long duration as well. Nearly 10 degrees more than most other standard 8v engines. It's already more than a match for an aftermarket fast road cam for most other engines. In fact it really wants more compression ratio than the stock 9.4:1 to work properly but more on that anon. The good exhaust and big cam add the other 5 or so bhp that similar engines lack.
So in effect the Peugeot engine is already the equivalent of a fast road tuned Golf. Given that the exhaust and induction system are so good what can we do to improve the power further? Well the main area left to improve is the cylinder head but it takes really well developed port shapes to give more flow and that takes flowbench time. There is also some power available from even higher lift/longer duration cams but at the expense of some tractability. We'll look at both areas later.
1.1 BLOCKS AND CRANKS
Both the 1.6 and 1.9 share the same 83mm bore and the capacity comes from different crank strokes - 73mm and 88mm respectively. The wet liner engine is strong and reliable with a few idiosyncrasies to watch out for. The liners have no shims underneath and must protrude above the top of the block by the right amount to seal properly. This relies on accurate machining at the factory as the clearance is not adjustable. 4 to 5 thou is the figure to look for - too much lower than this and leaking head gaskets and/or water in the sump can result. Over time the liners tend to distort to a slightly oval shape because of the constant piston thrust in one direction. However, if you remove the liners and leave them on a shelf for a while they seem to go back round again - weird but true. A good tip when rebuilding an engine that is still in good enough condition to not warrant new liners is to refit them turned 180
5/52
degrees round in the block. Most of the wear takes place on the thrust side of the engine and rotating the liners lets the relatively unworn side seal against the rings better.
Beware when removing and refitting the cylinder head not to turn the crank until the head bolts are done back up or the pistons will move the liners. The liners just sit on machined recesses at the base of the block and are sealed with thin rubber O rings. Move them and they are unlikely to seal again without new O rings and the consequence will be water leaking from the block into the sump oil.
Peugeot did a huge amount of messing about over the years with the number and arrangement of plain and grooved main bearing shells, the reasons for which have always eluded me. The Haynes manual comments on the complexity of it all and states that when they stripped their own test engine it didn't even have one of the bearing combinations listed in the official Peugeot charts. Other engines nearly always have 5 grooved bearings in the block and 5 plain in the caps for very good reasons of oil supply to the crank. That's the way I build the Peugeots too, regardless of year, and they run perfectly happily like this of course. Peugeot actually finally settled on this combination anyway for later 8 valve engines and the 16 valve engine. Maybe they read my tuning articles.
The rods are very sturdy and survive race use happily enough so road use is no problem for them even on tuned engines. Standard pistons rarely cause problems either except for sustained use over 7,500 rpm. Copyright David Baker and Puma Race Engines
Early engines had an oil pump drive which relied only on the friction of the tightened crank pulley nut to turn it - no woodruff key or other locking system. This strikes me as one of the worst bits of engine design I have ever seen and the first time I rebuilt one of these engines I was convinced for ages that I'd lost a part somewhere. I know someone whose Mi16 engine grenaded because of not tightening that bolt up properly and after a few miles with no oil pressure everything came to a very expensive halt. You have been warned.
The centre main cap has two bolts holding it in from the side of the block. If you can't get the crank out do make sure you've removed these two first as well as the two nuts inside the block before you start hitting things with hammers and breaking stuff.
1.2 CYLINDER HEAD
Early 1.6s had smaller valves than late models but then went to the 41.6mm inlet and 34.5mm exhaust of the 1.9 engine. From then on there is no difference between the cylinder heads of late 1.6 and 1.9 engines and in fact they aren't even stamped with the engine size. The exhaust valve is perhaps a bit small but little extra power comes from fitting larger ones and the expense is not warranted except perhaps for big budget race engines. The inlet valve can be usefully increased in size though and 43.5mm will just clear the bores although 43mm is the normal big valve option I offer for road engines. As I said above, more 205s get badly modified by so called "expert" engine tuners than any other make of car. The cylinder head doesn't escape their attentions. I've seen a £400 "fully ported" head from one of the less reputable Peugeot "specialists" where the badly worn guides hadn't been replaced, the seats hadn't been recut, the valves hadn't been refaced and the porting consisted of a bit of polishing with a flapwheel in the areas that could be reached with the guides still in the head. Not surprisingly it didn't make any more power although 160 bhp was the claim. It
6/52
must have taken nearly an hour to do that head ! A properly ported one takes several days of carefully detailed work.
Cam bearing wear can be a problem on high mileage engines especially if there has been any bottom end damage. Bits of crank bearing material tend to circulate with the oil and chew up the cam bearings and as these are machined directly into the head there is not much you can do to rectify it. Guides wear out pretty fast too - especially on the exhaust side and any decent head mods should include new guides if they are outside the wear limits. Copyright David Baker and Puma Race Engines
There is not as much scope for improving flow compared with many other heads because Peugeot did such a good job as standard in the quest for that 128 bhp. Port shape is critical to getting better flow and it is the seats, valve throat and short side bend that need the most work. The main part of the port is plenty big enough as standard and needs no enlarging but as it is the easy part to reach, inept tuners take huge amounts of metal out here to make it look as though something constructive has been done. This drops the port airspeed and hurts low rpm power without increasing total airflow at all. 3 angle seats are a must and reshaping the valves in the seat area helps too. The guides have to come out to do the work properly and one sign of a badly modified head is lumps missing from the guides where they've been hit by the porting cutters.
With the optimum port and valve seat shapes it is possible to squeeze about 8% to 10% extra flow and power potential out of the standard valve sizes. So about 10 to 12 bhp on a std engine and proportionally more in conjunction with other tuning mods. Polishing and enlarging the straight part of the port without removing the guides or cutting the seats properly won't achieve anything at all except to make the head look superficially pretty. Sadly most heads fall into this category.
Given how well the std head flows it is big valve heads that make the most sense and achieve the best value for money per bhp gained. With larger seat inserts, 43mm inlet valves and the port shapes properly worked to get the most out of the bigger valves it is possible to get an extra 15% bhp. That's about 18 bhp on a std engine and 20 or more on a tuned one. On a race engine a properly ported BV head can easily be worth 30 bhp.
With detailed flow bench work and multi angle valve seats it's possible to squeeze even more flow out of the head but we're now into the realm of race engines and costs of over £1000 for the headwork.
Bear in mind that the standard cam is similar in duration to an aftermarket fast road offering for most other engines anyway and really needs more compression ratio than Peugeot used (9.4:1) to make it work properly so a skim up to 10:1 helps both idle quality and power. A 31cc chamber volume (stock is 34.5cc) which equates to about 0.75mm off the head gets the job done. The last thing you ever need on these engines is one of those thicker head gaskets Peugeot sell that are meant to compensate for a light skim and get the compression ratio back to standard. No one in their right mind would want to build one of these engines with less than the stock CR. Longer duration cams require even more CR as with any other engine. Mild rally cams of about 285 degrees duration like the Catcams 4900340 or my own Puma002 need about 11:1 which is about a 2mm skim. +. For very high compression ratios in a 1.9 it's best to start with either the pistons from the 1.6 which have a smaller dish
7/52
volume so you don't have to skim so much off the head or high comp forged items. Fitting 1.6 pistons into an otherwise standard 1.9 will raise the CR to just over 11:1.
Breaking the cam caps when refitting the cam is something amateur mechanics seem to do with monotonous regularity. The caps are numbered 1 to 5 from the flywheel end of the engine not the cam pulley end. Each cap and journal has a different diameter. Fit a small cap to a bigger journal and you'll snap it in half while doing it up. You can check which cap fits where quite easily first by matching them to the lower half of the bore before fitting the cam. Lay them out in order, and the right way round before fitting any of them. If you break a cap you can't just get one from another engine. They're line bored to suit that head only. Break one and your head is now scrap. The money you tried to save by doing the job yourself rather than entrusting it to a professional has just gone up in smoke.
1.3 HEAD BOLTS
The Peugeot recommended tightening sequence puts an absurd amount of stretch into the head bolts which weakens both them and the threads in the block.. It's not uncommon for the block threads to strip or the bolts to break when either fitting a head or trying to remove the existing bolts. When fitting a head it's essential to do the following. Make sure the threads in the block are clean and free from corrosion and debris. The best way to do this is run a tap through them with some oil on it as a lubricant. As the bolts are 11mm thread size very few people are going to have a tap. A serviceable alternative can be made by grinding flutes into the threads of an old head bolt on the edge of a grinding wheel. New bolts must be well greased with moly grease both on the threads and under the bolt head. Finally rather than use the Peugeot stretch method I tighten these bolts in three stages - 25, 50 and then 75 ft lbs or an additional 1/4 turn whichever comes first. Some bolts will take the full 75 ft lbs and some won't. This loads them sufficiently to clamp the gasket properly but doesn't unduly stretch them and allows them to be reused. I also find it a good idea to tighten them fully, leave the engine for 24 hours to allow any gasket compression to take place and then retighten them one at a time in the normal sequence i.e. starting from the centre of the head and working out. Undo a bolt, tighten back to 50 ft lbs and then to 75 ft lbs or 1/4 turn whichever comes first and repeat for the other bolts. Bolts which wouldn't take the full 75 ft lbs the first time often will once the gasket has sat a while under compression. It's a good idea to do this again once the engine is run in. Once the head is fitted it isn't a bad idea to fill the bottom of the external block thread holes with grease or silicone to stop water getting in there and working its way up and corroding the new bolts. That will hopefully ensure that at rebuild time the bolts will come out easily without breaking or stripping the threads in the block.
Favourite trick for newbs trying to replace the cylinder head themselves is to forget that one bolt has a long spacer under it to prevent the bolt breaking through into the cylinder block. Do please try and make a note of which spacer came from where before you add yourself to the long and growing list of plonkers who scrap their engine block while torquing the head bolts up. Basic common sense ought to suffice in that when you drop the bolts into the bolt holes one sticks up a lot further than the rest but basic common sense seems to be a commodity in short supply these days.

8/52
1.4 INDUCTION SYSTEMS
The standard induction is a plenum manifold with a single butterfly and Bosch LE fuel injection. The manifold has big runners and flows plenty of air to work nicely with even well modified big valve heads. The LE injection system measures the air flow by means of an air flap which opens progressively as more air flows into the engine. The ECU then hopefully injects the right amount of fuel based on what the air flap meter is telling it. This works fine except at low rpm with long duration cams. The reason is that the air flap likes the airflow to be steady and in one direction all the time. Big cams cause the airflow to pulse strongly at low rpm and this makes the flap vibrate which confuses the ECU and leads to erratic idling. At higher rpm once the engine has "come on the cam" everything smoothes out and works fine again. Even with the standard cam the engine isn't renowned for having the best idle characteristics in the world and if you want to retain a good idle then stick to short duration cams (under 275 degrees). If you aren't bothered too much about idle quality then hotter cams will work fine once the revs are up over 2000 or so. Fitting a mappable ECU controlled by a throttle position sensor and doing away with the air flap meter eliminates the idle problem but is costly. You might as well pay the extra and go straight to throttle bodies as mess with the standard induction system to that extent.
Fitting DCOE carbs is another way of eliminating the air flap problem and is worth a few more bhp. Maybe 10 bhp depending on how highly tuned the engine is. They are also easier to calibrate than a fuel injection system but won't get anywhere near the same economy or tractability. Note that the Mangoletsi DCOE inlet manifold, which is the most commonly available one, needs an awful lot of work to match its ports up with those of the cylinder head. As cast it only has tiny holes through the runners which are very restrictive. It takes a good couple of hours with a grinder to remove the required aluminium and port the manifold properly so be prepared for the cost of this if you want the engine to produce the power it should be capable of. Copyright David Baker and Puma Race Engines
The ultimate induction system is throttle bodies with mappable injection and ignition. This will add 15 or more bhp just from the extra airflow and also allow you to use longer duration cams without losing tractability. The total additional power potential is therefore pretty high. Cost is around £1400 plus fitting and setting up.
1.5 EXHAUST SYSTEMS
This can be a nice short section. The standard Peugeot systems are excellent and on a standard or road tuned engine you'll be wasting your money fitting anything else. Only on rally or race engines with long duration cams might it pay to fit a tubular 4-2-1 type manifold and larger bore system but that's outside the scope of this road oriented tuning guide. Also beware of non Peugeot standard replacement systems. You might save a few pounds but also lose a goodly chunk of bhp into the bargain. I had one experience some years ago where a non standard system lost over 50 bhp on a tuned 1.9. Yes I did say 50 bhp. With a big valve head and rally cam the engine only made 70 bhp at the wheels until the small bore fast fit exhaust system was spotted under the car. With this replaced with a decent system power went up to 120 at the wheels.
9/52
1.6 CAMSHAFTS
Because the standard cam is a fairly rorty item anyway it pays not to go too mad in this area, especially if the standard air flap induction system is being retained and idle quality is important to you. The usual choices for a road car with the standard induction system are the Kent PT31/36 (same cam) or the Piper 270. Kent claim 14 bhp and Piper 20 bhp which I've said for a long time are fairly outrageous claims. Recently I took time out to do my own measurements of both those cam profiles which came up with pretty shocking results. The Kent PT36 actually has slightly LESS duration than the standard cam and the Piper 270 only has a degree or two more rather than the ten degrees you would expect from the quoted duration. Other than having a few thou more lift, both of those cam profiles graph out as more or less identical to the standard Peugeot cam. Close enough at least that in my opinion they can't materially affect the power curve. I calculate that the Kent one will just about match the standard cam and the Piper one maybe add 2 bhp at most.
My recommendation to anyone considering buying either the Kent PT31/36 or Piper 270 in the hope of getting a significant power increase over the standard Gti cam is simple - don't.
This is all pretty depressing stuff. You can form your own views on the ethics of companies that sell products that are so similar to the standard item and yet claim such huge power increases to get you to buy them. It has now given me cause to wonder just how effective the mild/fast road cam offerings for other engines are. Without doing detailed measurements or back to back dyno tests which are expensive and time consuming you have no real idea of whether the costly purchase you are considering is going to be a waste of money. I don't have the time or resources to measure every cam on the market but I'll be publishing on here everything I do measure.
The hotter cam offerings than the above such as the rally and race ones at least do have more duration than standard and so really will alter the power curve. However they aren't going to work happily with the standard air flap meter and so are best used with carbs or throttle bodies or in actual rally or race engines. My recommendation for a road car if you're going to retain the standard induction system is stick with the standard cam. There simply is no magic way to design any road cam that gives appreciably more power than this without losing the idle quality and the low rpm power.
I rarely see a 1.9 cam with lobe wear but nearly every 1.6 cam I come across has severe wear. Why this is I couldn't say. The 1.6 cams have chamfered edges to the lobes (the 1.9 cams don't) and often the wear is so great that the chamfer has worn away. Maybe they are also made from a different material. The buckets will usually have corresponding wear and be severely concave if the lobes are badly worn. Always put a straight edge across each bucket when a head is being rebuilt and make sure the surface is dead flat. Measure every lobe with a vernier. All the inlet lobes should be the same height as should all the exhausts.
Finally, note that Peugeot changed the bolt that holds the cam pulley on from a 12mm diameter bolt on very early engines to a 10mm bolt on later ones. As with the crank bearings, why on earth they messed around with something which was fine to start with I have no idea. Maybe the smaller bolt saved 0.1 of a penny per engine and they were going through hard times. All Kent and Piper cams use blanks with the original 12mm thread in them so if you have an engine with a 10mm bolt you'll need to go and buy the 12mm one from a Peugeot
10/52
dealer to be able to fit the new cam. Catcams use the 10mm thread size on their cams so your existing bolt will normally be the right one.
The Peugeot specified exhaust valve clearance of 0.35 - 0.45mm is too large in my opinion and can lead to a noisy valve train. Similarly the recommendation of 0.25mm from some of the performance cam manufacturers is too small and an engine that gets very hot could see the valves being held off the seats and burning out. I use 0.30 - 0.35mm on exhaust valves and 0.20 - 0.25mm on inlets. That applies to any cam, performance ones as well as standard ones.
1.7 STANDARD ENGINES POWER OUTPUTS
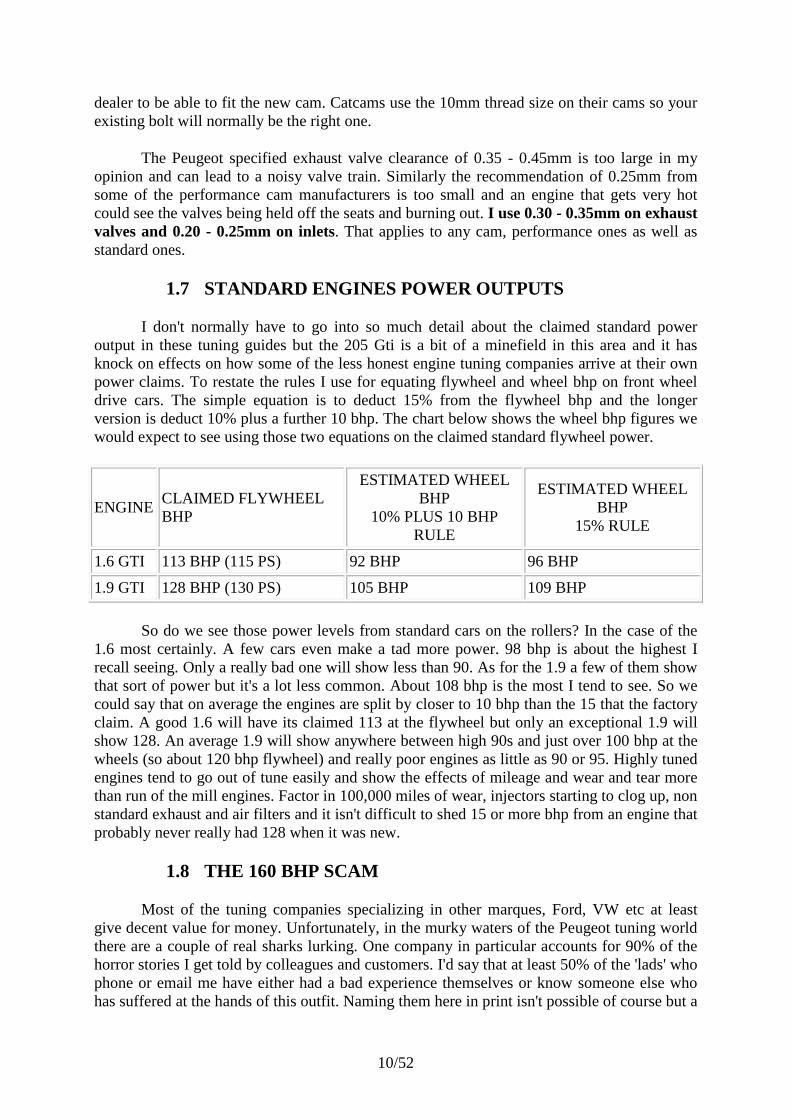
I don't normally have to go into so much detail about the claimed standard power output in these tuning guides but the 205 Gti is a bit of a minefield in this area and it has knock on effects on how some of the less honest engine tuning companies arrive at their own power claims. To restate the rules I use for equating flywheel and wheel bhp on front wheel drive cars. The simple equation is to deduct 15% from the flywheel bhp and the longer version is deduct 10% plus a further 10 bhp. The chart below shows the wheel bhp figures we would expect to see using those two equations on the claimed standard flywheel power.
ENGINE CLAIMED FLYWHEEL BHP
ESTIMATED WHEEL BHP
10% PLUS 10 BHP RULE
ESTIMATED WHEEL BHP
15% RULE
1.6 GTI 113 BHP (115 PS) 92 BHP 96 BHP
1.9 GTI 128 BHP (130 PS) 105 BHP 109 BHP
So do we see those power levels from standard cars on the rollers? In the case of the 1.6 most certainly. A few cars even make a tad more power. 98 bhp is about the highest I recall seeing. Only a really bad one will show less than 90. As for the 1.9 a few of them show that sort of power but it's a lot less common. About 108 bhp is the most I tend to see. So we could say that on average the engines are split by closer to 10 bhp than the 15 that the factory claim. A good 1.6 will have its claimed 113 at the flywheel but only an exceptional 1.9 will show 128. An average 1.9 will show anywhere between high 90s and just over 100 bhp at the wheels (so about 120 bhp flywheel) and really poor engines as little as 90 or 95. Highly tuned engines tend to go out of tune easily and show the effects of mileage and wear and tear more than run of the mill engines. Factor in 100,000 miles of wear, injectors starting to clog up, non standard exhaust and air filters and it isn't difficult to shed 15 or more bhp from an engine that probably never really had 128 when it was new.
1.8 THE 160 BHP SCAM
Most of the tuning companies specializing in other marques, Ford, VW etc at least give decent value for money. Unfortunately, in the murky waters of the Peugeot tuning world there are a couple of real sharks lurking. One company in particular accounts for 90% of the horror stories I get told by colleagues and customers. I'd say that at least 50% of the 'lads' who phone or email me have either had a bad experience themselves or know someone else who has suffered at the hands of this outfit. Naming them here in print isn't possible of course but a
11/52
trawl through the postings in the various online Peugeot forums might reveal one name based in the north west of England cropping up more often than others. Their most commonly promised power claim for a road tuned 1.9 is 160 bhp. A ported standard valve head and a fast road cam of some description (usually some mythical French made cam for which any further details are too secret to give out) are supposedly all that is required to get this increase.
Take the power output of a decent standard 1.9 as being around 120 bhp and you're looking at another 40 bhp to get up to 160. If a properly modified standard valve head is worth about 10 bhp and a tractable cam another 5 then something doesn't quite add up here - even assuming that the work was done to a high standard which it probably isn't going to be. Even with a rally cam the figures don't make sense. I've had the dubious pleasure of stripping one such supposed 160 bhp engine which the owner found to be very little faster than when he took it in for the work to be done and later showed 108 bhp at the wheels on an independent set of rollers - about the same as a good standard one. The head work is described earlier in this article so no surprise that it represented no power gain. The celebrated and rather secret "French" cam was perhaps even more interesting. It bore all the same casting marks as a standard cam which was intriguing. Putting a dial gauge on the lobes revealed the standard 445 thou lift. Measuring the entire lobe profile and drawing it out on a graph failed to spot any further differences. So almost certainly it really was made in France - and had been living quite happily in that engine ever since Peugeot fitted it on the production line. £300 for the pleasure of keeping the cam you drove in with is hardly what I call value for money. The best bit was the subsequent two page letter trying to justify how a "good" standard engine only made 90 at the wheels and so 108 bhp represented a huge gain due to their expert workmanship and equated to the promised 160 flywheel. I think anyone who has to rely on 52 bhp of non existent transmission losses to justify their work should be in a different line of business.
What this '160 bhp' engine actually delivers is about 108 bhp at the wheels which equates to the standard Peugeot claimed 130 bhp. Now that's about 10 bhp up on what an average standard engine really makes but a country mile off the claimed 160 bhp. In fact 160 bhp from the standard valve sizes and induction system with a road cam just isn't remotely possible. 150 bhp is achievable with a big valve head and mild rally cam (122 bhp wheel bhp) and high 150's (128/130 wheel bhp) with a hotter cam such as a PT27.
The customer had however failed to get a single thing established in advance or in writing. Such as the exact make and part number of the cam he was paying for, whether the valve seats would be recut, the guides replaced or any other detail. A Piper, Kent, Catcam or any other known cam will have a part number stamped on the end and a specification in the catalogue which can be checked against if required. If a company is reluctant to tell you the lift, duration and timing figures of the cam they are trying to sell you then ask yourself why. If you don't want to join the ever growing list of lads who have suffered at the hands of this company then get as much as you can in writing before paying for work - the exact scope of modifications, whether guides will be replaced, 3 angle seats cut, the cam lift and duration, the expected power output at the wheels as well as the flywheel. If your questions don't get answered then go elsewhere.
So what power outputs are realistically possible with best quality work? Copyright David Baker and Puma Race Engines
12/52
1.9 TUNED ENGINES
The power outputs below are for 1.9 GTi engines. 1.6 GTi engines will show about 10 to 15 bhp less with the same mods and produce peak power and peak torque at higher rpm. Everyone claims much higher figures but it's up to you to decide what you believe. Obviously final power output will depend on the condition of the bottom end, having a decent free flowing exhaust system, manufacturing tolerances in various components and proper rolling road setup.
Average std 1.9 engine - 120 bhp
• Std bottom end, ported std valve head, CR increased to 10:1 - plus 10/12 bhp. • Std bottom end, ported big valve 43mm valve head, CR increased to 10:1 - plus 18/20
bhp • As above plus mild rally cam (Catcam 4900340 or similar) - plus 30 bhp • Full rally spec engine on std induction - As above plus 290 degree duration cam (PT27
or similar) and 11.5:1 CR - plus 38 bhp. • Idle will be rough below 1200 rpm but otherwise this spec can work nicely for off
road engines. Mapped ignition helps. • 43mm valve head, DCOE's/TB's, std cam, 10:1 CR - plus 35 bhp • 43mm valve head, DCOE's/TB's, mild rally cam, (Catcam 4900340 or similar) 11:1
CR - plus 45 bhp • 43mm valve head, DCOE's/TB's, full rally cam, (Kent PT27 or similar) 11.5:1 CR -
plus 53 bhp
1.9.1 PRICES
Ported standard valve head chemical clean, skim, 3 angle seats is £550. If the valve guides need renewing the additional cost is £6 per guide. Most heads require new exhaust guides. High mileage heads may need new inlet guides. Refitting of the valves and springs is included FOC if stem seals are being supplied by us as part of a gasket set or if you supply us with the new seals from your own gasket set. Otherwise the head will be returned unassembled for you to fit your own stem seals and valves.
43mm big valve head on big inlet inserts, £750. Other comments and valve guide prices as per the std valve head. However I always prefer to fit new inlet guides as well on BV heads because OE guides are usually not very concentric to the valve seat insert.
Race heads - big valves, specialised port work, multi angle valve seats - POA
The skim included in the basic head price is a light skim to clean up the gasket face. Different spec engines will need different compression ratios and heavy skims to raise CR will attract extra cost. Approx £20 to raise to 10:1 and £40 to raise to 11:1.
Measuring and balancing chamber volumes if required - priced on time spent.
Complete head gasket set £35 - includes head gasket, cam cover gasket, valve stem seals, inlet and exhaust manifold gaskets, cam seals etc
13/52
Head bolt set - £15
Valve stem seal set - £7
Shimming of the valve train to suit the cam used - £60 plus any new shims required.
Race Valve Spring System - uprated single valve springs and a thick steel shim washer to set the correct preload which replaces the 0.5mm Peugeot shim. Fits with the standard valve caps and stem seals and raises the rpm limit from the 7,200 rpm of the standard spring to 8,200 rpm which suffices for the vast majority of race tuned engines without using such high spring rates that abnormal cam wear is created. As easy to fit as the standard springs and avoids the cost and complexity of the double valve spring systems on the market which generate very high loadings and also require non standard valve caps to be used and machining done to the head. The cost of fitting these double valve spring systems will exceed the base price of the springs so our single spring system is a very cost effective option.
Supplied to fit with cams lifting up to12.5mm. Higher lifts can be accomodated with modifications to the shim washer. If used with cams with less than 12mm lift then also fit the standard 0.5mm shim underneath the steel shim supplied. In all cases the engine builder must check that there is at least 1mm free clearance before the spring goes coilbound as the fitted height will vary depending on the head casting, the valve length and how the valve seats have been cut - £75
Lighten and balance flywheel - £80 The Mi16/Gti6 type flywheels with timing teeth can't be lightened unless the teeth are machined off and you would only want to do this if the car is to be run on carbs or some other system which doesn't take crank timing references off the flywheel teeth.
Non standard cams with larger cam lobes can foul the inside of the lifter bore area. This needs to be machined before the valves are fitted and costs £20 to £30 depending on the cam profile if done during other head work.
1.9.2 Technical Advice
I can't answer emails from people who want to know why their car won't start on rainy Tuesday mornings or why their engine blows smoke out of the exhaust every time they start it up. Despite the polite request on the contacts page I still get lots of "please help" emails from people who don't want to buy anything but think I'll be a good source of free technical advice. Newsflash - there's only me here and I don't sit at the pc all day waiting for emails to answer. I have engines to build. I used to at least try and find time to send a brief "sorry but I can't help" reply to these but nowadays they just get deleted so please don't waste your time typing. The place to ask is on the car newsgroups and when I have time I try to answer as many of these as I can. This article is the intellectual property and copyright of David Baker and Puma Race Engines. Reproduction in whole or in part without written permission is strictly prohibited. Last modified 3rd March 2011.
14/52
2 PUMA RACE ENGINES - ENGINE CAPACITY AND COMPRESSION RATIOS
There are often questions in newsgroups about how to calculate engine capacity and compression ratio. Rather than rely on charts or rough estimates it is very simple to do all the calculations yourself.
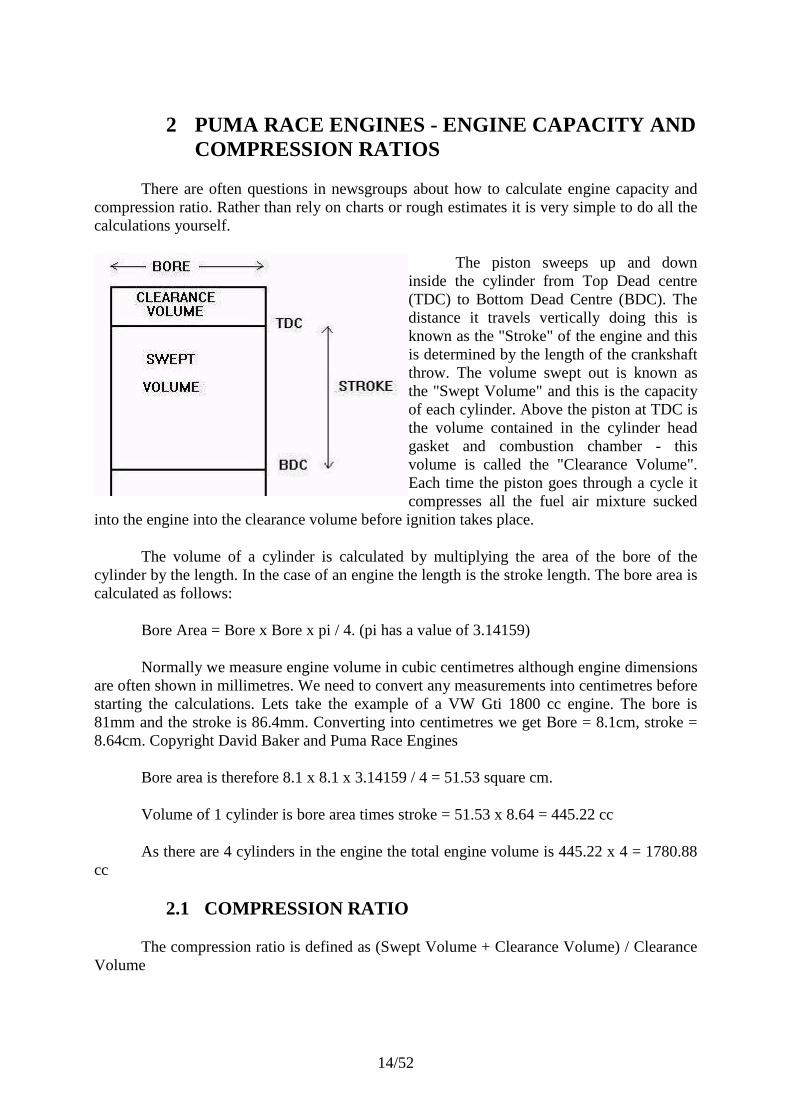
The piston sweeps up and down inside the cylinder from Top Dead centre (TDC) to Bottom Dead Centre (BDC). The distance it travels vertically doing this is known as the "Stroke" of the engine and this is determined by the length of the crankshaft throw. The volume swept out is known as the "Swept Volume" and this is the capacity of each cylinder. Above the piston at TDC is the volume contained in the cylinder head gasket and combustion chamber - this volume is called the "Clearance Volume". Each time the piston goes through a cycle it compresses all the fuel air mixture sucked
into the engine into the clearance volume before ignition takes place.
The volume of a cylinder is calculated by multiplying the area of the bore of the cylinder by the length. In the case of an engine the length is the stroke length. The bore area is calculated as follows:
Bore Area = Bore x Bore x pi / 4. (pi has a value of 3.14159)
Normally we measure engine volume in cubic centimetres although engine dimensions are often shown in millimetres. We need to convert any measurements into centimetres before starting the calculations. Lets take the example of a VW Gti 1800 cc engine. The bore is 81mm and the stroke is 86.4mm. Converting into centimetres we get Bore = 8.1cm, stroke = 8.64cm. Copyright David Baker and Puma Race Engines
Bore area is therefore 8.1 x 8.1 x 3.14159 / 4 = 51.53 square cm.
Volume of 1 cylinder is bore area times stroke = 51.53 x 8.64 = 445.22 cc
As there are 4 cylinders in the engine the total engine volume is 445.22 x 4 = 1780.88 cc
2.1 COMPRESSION RATIO
The compression ratio is defined as (Swept Volume + Clearance Volume) / Clearance Volume
15/52
We already know the swept volume of each cylinder from above - let's assume the clearance volume of each cylinder is 55.6cc - what is the compression ratio?
Compression ratio = (445.22 + 55.6) / 55.6 = 9.0
If we divide the swept volume alone by the clearance volume we get a number which is 1 less than the compression ratio: 445.22 / 55.65 = 8.0
This makes it easy to calculate the clearance volume we need in order to obtain a given compression ratio. What clearance volume do we need if we want to raise the compression ratio of the engine to 10.0? We simply divide the swept volume by 1 less than the compression ratio we need to obtain: 445.22 / 9.0 = 49.5cc for a compression ratio of 10.0. Thus we need to skim the head or fit higher compression pistons until the clearance volume drops from 55.6cc to 49.5cc.
3 PUMA RACE ENGINES - POWER AND TORQUE
Ask most people who are interested in tuning their car what the engine's power output is and they will be able to tell you. Ask about the torque or the torque per litre and chances are you get a blank look. Power and torque are just twin aspects of the same maths that determines how an engine performs and anyone wanting to tune an engine ought to benefit from a better understanding of the what the figures mean. To start we need to explain some definitions.
3.1.1 TORQUE
Torque is a twisting force about an axis of rotation. It is measured in units of force times distance from the axis. When you tighten a bolt you exert a torque on it. If the spanner is 1 foot long and you exert a force of 10 pounds on the end of it then you apply a torque of 10 foot pounds. If the spanner is 2 feet long then the same force would apply a torque of 20 foot pounds. Whether the torque applied creates movement or not is a separate issue. If the bolt has already been tightened to a torque of 50 foot pounds and you apply a spanner to it using a torque of 20 foot pounds then it won't move any further.
3.1.2 WORK
Work is also measured in units of force times distance but there is a subtle distinction between Torque and Work. For work to take place there must be movement involved. Work can be defined as the product of force times distance moved. Lets imagine we have a sack of grain on the floor weighing 100 pounds and we want to lift it onto a table 3 feet high - we would need to do 300 foot pounds of work against gravity to achieve this.
3.1.3 POWER
Power is the rate at which work is done. The more power a thing generates, the more work it can do in a given space of time. Lets imagine we ask a small child and an adult to both lift the sack of grain above onto the table. The adult might be able to lift the whole sack in one go but the child would probably not. However the child could take a pan and lift the grain one panful at a time until the whole 100 pounds was on the table. It would take longer but the end

16/52
result would be the same. Both the child and the adult would have done 300 foot pounds of work but at different rates - we can therefore say that the adult was more "powerful" than the child.
If the adult lifted the whole bag in one go in 5 seconds then he would have done work at the rate of 300 foot pounds in 5 seconds - i.e. 300 x 60/5 = 3,600 foot pounds per minute. If the child took 1 minute with the pan then his rate of doing work would be 300 foot pounds per minute - only 1 twelfth the rate of the adult. In other words the adult generated 12 times as much power as the child.
The more power a car engine generates, the more work it can do in a given period of time. This work might be driving the car at high speed against air resistance, moving the car up a steep hill or just accelerating the car rapidly from rest.
3.1.4 HORSEPOWER
It was James Watt who refined Newcomen's steam engine design and turned it into a machine capable of doing work at a reasonably efficient rate. The most common applications of steam power in the early days were pumping water or lifting coal from mines. As far as coal is concerned it was horses that did most of this work before the coming of steam power.
Watt needed to be able to rate the power output of his steam engines in order to advertise them. He decided that the most sensible unit of power to compare them to was the rate at which a horse could do work. He tested the ability of a variety of horses to lift coal using a rope and pulley and eventually settled on the definition of a "Horsepower" as 33,000 foot pounds per minute - or 550 foot pounds per second. In fact the horses he tested could not keep up a steady work rate as high as this (he actually averaged them at 22,000 foot pounds per minute) but being a conservative man he added 50% to the rate he measured in case other people had more powerful horses than he had tested. Maybe modern engine builders might take note of the good sense of James Watt and not be quite so optimistic in the power claims for their own engines!!
So a horse walking at a comfortable speed of 5 feet per second would need to raise a weight of 110 pounds to do work at the rate of 1 Horsepower. Not so hard you might think - in fact a strong man can do that amount of work - but only in short bursts. A horse can easily do work at a faster rate than this but again not without rest. A steam engine, provided you keep it fueled can run continuously. Watt's measurement was designed to take account of the fact that machines can run for ever but animals or men need to stop and rest from time to time. Copyright David Baker and Puma Race Engines
3.1.5 BHP and HP
All the B means is "brake". The old word for a dyno - because the engine torque was measured by applying a brake to the flywheel rather than a torque converter or electrical motor which is how it's done nowadays. There's no other difference between the two and they both just mean horsepower.
3.1.6 HOW TORQUE AND POWER RELATE
17/52
The final part of the story is to see how we calculate power from torque or vice versa. Let's imagine we have a pulley at the top of a mine that is 1 foot in radius - or 2 feet in diameter. At the bottom of the mine, at the end of a rope leading round the pulley is a bag of coal weighing 100 pounds. Instead of using a horse to pull on the rope let's connect an engine to the pulley - perhaps by bolting the pulley to the crankshaft of the engine.
In order to lift the coal we need to apply a torque of 100 foot pounds to the pulley because the coal is pulling down with a force of 100 pounds applied at 1 foot from the axis of rotation. In other words the Torque applied is the Weight times the Radius of the pulley. If the engine turns the pulley at 1 revolution per minute how much work is being done?
Well for each turn of the pulley the coal will rise the same amount as the circumference of the pulley which is 2 pi times the radius = 3.14 x 2 = 6.28 feet. So in 1 minute the engine will do 628 foot pounds of work. Copyright David Baker and Puma Race Engines
We can rearrange the above in terms of torque and speed:
The rate of work being done (or Power) is Force x Distance per minute = Weight x radius x 2 pi x rpm foot pounds per minute. However we already know that Weight times Radius = Torque so we can equally say:
Power = Torque x 2 pi x rpm
To turn this into Horsepower we need to divide by 33,000. Our final equation therefore becomes:
Horsepower = Torque x 2 pi x rpm / 33000 which simplifies to: Horsepower = Torque x rpm / 5252.
This is the universal equation that links torque and horsepower. It doesn't matter whether we are talking about petrol engines, diesel engines or steam engines. If we know the rpm and the torque we can calculate horsepower. If we know horsepower and rpm we can calculate torque by rearranging the equation above: Torque = Horsepower x 5252 / rpm
Hopefully you can also see that when an engine is turning at 5252 rpm, its torque and horsepower figure is the same. Next time you see a graph of the torque and horsepower of an engine check to see that the lines cross at 5252 rpm. If not then the graph is wrong. This only applies of course if the power is being measured in horsepower and the torque in foot pounds and both lines are shown on the same axes. There are many other units in which torque and horsepower can be measured - for example power can be measured in Watts and torque in Newton metres. Unless we need to convert to such continental measures we can usually stick to horsepower and foot pounds.
One measure to be aware of though is the "continental horsepower" or PS. This stands for "PferdeStarke" - the German translation of "horse power". In France you sometimes see the same measure being called a "CV" for Cheval Vapeur. This measure was chosen in Europe as being the closest thing to a horsepower that could be expressed in nice round metric units - 75 kilogramme metres per second to be exact. It is commonly used by car manufacturers nowadays and tends to get used synonymously with bhp although it is actually a slightly

18/52
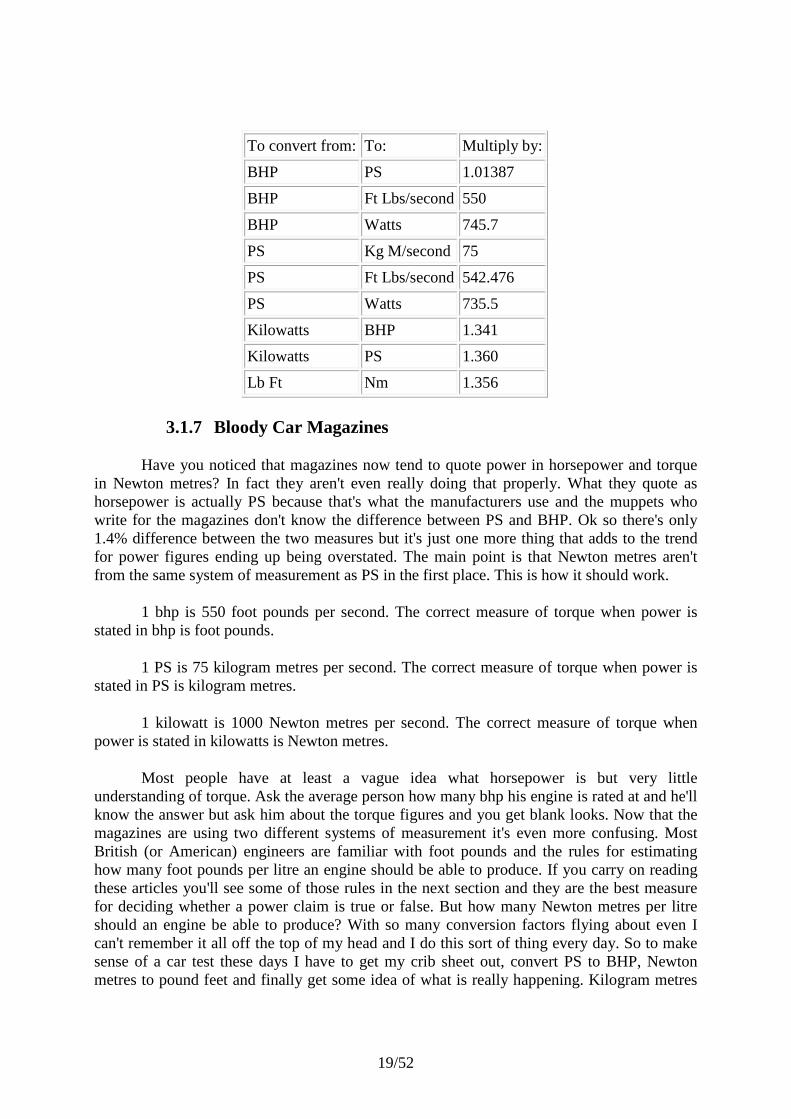
smaller unit of power. One PS is about 98.6% of one bhp. The conversion table below covers the units most commonly used to express power and torque.
19/52
To convert from: To: Multiply by:
BHP PS 1.01387
BHP Ft Lbs/second 550
BHP Watts 745.7
PS Kg M/second 75
PS Ft Lbs/second 542.476
PS Watts 735.5
Kilowatts BHP 1.341
Kilowatts PS 1.360
Lb Ft Nm 1.356
3.1.7 Bloody Car Magazines
Have you noticed that magazines now tend to quote power in horsepower and torque in Newton metres? In fact they aren't even really doing that properly. What they quote as horsepower is actually PS because that's what the manufacturers use and the muppets who write for the magazines don't know the difference between PS and BHP. Ok so there's only 1.4% difference between the two measures but it's just one more thing that adds to the trend for power figures ending up being overstated. The main point is that Newton metres aren't from the same system of measurement as PS in the first place. This is how it should work.
1 bhp is 550 foot pounds per second. The correct measure of torque when power is stated in bhp is foot pounds.
1 PS is 75 kilogram metres per second. The correct measure of torque when power is stated in PS is kilogram metres.
1 kilowatt is 1000 Newton metres per second. The correct measure of torque when power is stated in kilowatts is Newton metres.
Most people have at least a vague idea what horsepower is but very little understanding of torque. Ask the average person how many bhp his engine is rated at and he'll know the answer but ask him about the torque figures and you get blank looks. Now that the magazines are using two different systems of measurement it's even more confusing. Most British (or American) engineers are familiar with foot pounds and the rules for estimating how many foot pounds per litre an engine should be able to produce. If you carry on reading these articles you'll see some of those rules in the next section and they are the best measure for deciding whether a power claim is true or false. But how many Newton metres per litre should an engine be able to produce? With so many conversion factors flying about even I can't remember it all off the top of my head and I do this sort of thing every day. So to make sense of a car test these days I have to get my crib sheet out, convert PS to BHP, Newton metres to pound feet and finally get some idea of what is really happening. Kilogram metres
20/52
don't even translate nicely into Newton metres because the conversion is the value of g which is 9.81.
Puma Race Engines - Calculating Air Demand and Filter Size
Efficient air filtration is an essential part of any good engine installation both to produce the maximum possible horsepower and keep dust and debris out of the engine. To estimate the required filter size for a given engine it's helpful to start by knowing how much air an engine actually uses to produce a given amount of power. This can be done by direct measurement with a flow meter as part of an engine dyno setup but in the absence of that we can deduce a lot from the fuel consumption and air/fuel ratios that engines commonly require.
The Brake Specific Fuel Consumption (BSFC) of an engine is the mass of fuel per horsepower per hour it uses. Traditionally it's been measured in lbs per bhp per hour although those Johny Foreigners are apparently now doing it in grams per kWhr which of course being proper chaps we'll ignore completely and stay resolutely fixed in the previous century. There is a wealth of data on BSFC out there in technical books and on the Intergoogles. Modern petrol engines, regardless of design, tend to operate in a fairly narrow band of BSFC figures so we can take generic data and apply it to most situations.
Petrol engines being air supply throttled operate much less efficiently at low throttle openings when the cylinders are not filling completely. However we are primarily concerned with full throttle operation and peak power so we can ignore that. Efficiency tends to peak around the same revs as peak torque and good engines can see BSFC figures there around 0.42 to 0.43 lbs per hp per hour. As revs rise so do internal frictional losses and efficiency drops i.e. the engine needs more air per flywheel bhp but this is partially offset by the air/fuel ratio richening as the engine approaches peak power rpm. At peak power rpm BSFC figures tend to be between 0.5 and 0.55 and above this they worsen even further as power drops and frictional losses continue to increase. The worst case scenario with race engines that need to go right to the rev limiter all the time would be about 0.6.
At anything below peak power and full throttle opening modern cat equipped engines are constrained to run stoichiometric air/fuel ratio of about 14.7 lbs of air per lb of fuel. At peak power road engines are calibrated for about 13:1 and race engines ideally a bit richer at 12.6:1 for optimum power output. The last thing we need to know is that air weighs about 1 lb per 13.1 cubic feet. We can now start putting the above data together to calculate air and fuel requirements.
At peak torque an engine achieving a BSFC of 0.43 is using 43 lbs of fuel per hour for every 100 horsepower it produces. At the stoichiometric A/F ratio of 14.7 it's therefore using 632 lbs of air per hour, i.e. 10.5 lbs per minute which times 13.1 equates to about 140 cubic feet of air per minute (CFM).
At peak power a road engine achieving a BSFC of 0.53 on an A/F ratio of 13 is therefore using 53 / 60 x 13 x 13.1 = 150 CFM per 100 bhp.
Worst case scenario of a race engine revving well past peak power is 60 / 60 x 12.6 x 13.1 = 165 CFM per 100 bhp.
21/52
The last step is to translate air consumption in CFM into required filter size and for high efficiency paper or cotton filter elements it's reckoned that you need about 1 square inch of filter area for every 6 CFM to achieve good filtration without causing a power loss. Foam elements are less efficient so you'll need a somewhat bigger filter for a given power output. For road engines we therefore require about 150 CFM / 6 = 25 square inches of filter area for every 100 bhp the engine produces. For race engines where every last bhp counts you'd want to go about 10% bigger and for severe use in really dusty and dirty conditions like deserts and off-roading it pays to go bigger still, say an extra 50% to be on the safe side. There is of course no downside to using a filter bigger than necessary so if you have the space fit the biggest one you can afford. It'll require cleaning or replacing less frequently as a bonus.
As far as fuel requirement goes we can also use the above to calculate the pump size required. Worst case scenario of an engine achieving a BSFC of 0.6 is 60 lbs of fuel per hour for every 100 bhp which is 1 lb per minute which equates to just over a pint. To be on the safe side and allow for wear and tear on the pump and flow losses in the fuel piping if you fit a pump with a rating of 1.25 to 1.5 pints per minute for every 100 bhp the engine produces you'll be fine. Most OE equipment road car EFI fuel pumps flow about 3 pints per minute so they're good for at least 250 bhp when they're new.
4 PUMA RACE ENGINES - INJECTOR SIZING
Most engines are fuel injected these days and modified ones often need larger fuel injectors if the power output has been increased substantially. Going too large on the injector size causes its own problems though because the pulse duration needed at idle and cruise will become very short and sensitive to exact calibration. In an ideal world we want the injectors to run at about 80% to 90% duty cycle so they have a little spare capacity in hand but are no bigger than necessary.
Duty cycle is the percentage of time the injectors spend open. Obviously at 100% duty cycle the injectors never close which is clearly undesirable.
Injectors are rated by their fuel flow in cc/minute at a specific fuel pressure. This is usually 3 bar (43.5 psi) but sometimes you see charts showing flow at different test pressures. You need to be able to standardise flows given at different test pressures to be able to properly compare injectors. Flow is proportional to the square root of the test pressure. In other words as pressure doubles flow only increases by root 2 or 1.41. So to translate flow at one pressure into flow at another we need to do the following.
New flow = tested flow x square root (target pressure / test pressure)
For example. We have a rating of 200 cc/min at 3.5 bar. What would the flow be at 3 bar?
Flow = 200 x square root (3 / 3.5) = 185 cc/min
1 bar is 100 kPa or 14.5 psi which is a little lower than atmospheric pressure (14.7 psi).
The next step is to understand how fuel flow is related to bhp potential but this isn't straightforward and no single formula will apply to every engine despite what you may read
22/52
on the internet. The amount of fuel an engine needs to develop a given amount of horsepower varies with many things.
1. Mechanical efficiency. Frictional losses in the engine reduce the power developed in the cylinders to that shown at the crankshaft in dyno testing. The lower these losses the more flywheel power you'll get for a given amount of fuel. Dry sumped engines for example will gain flywheel bhp for no extra fuel due to reduced oil drag losses round the crankshaft. Piston ring friction, crank bearing losses etc all contribute to this mechanical efficiency.
2. Thermal efficiency. High compression ratios develop more power from a given amount of fuel but increase the susceptibility to detonation. Thermal barrier coating of piston crowns, valves, combustion chambers etc can reduce internal heat losses. Engines with well designed combustion chamber shapes need less ignition advance and produce more power from a given amount of fuel/air charge.
3. Fuel/air ratio required. Most normally aspirated engines need very similar F/A ratios for best power but heavily turbocharged ones often use richer mixtures to help cooling and suppress detonation. A good guide to estimate the bhp potential for a normally aspirated engine is to proceed as follows.
a) Calculate the injector flow in cc/min at the fuel pressure actually being used with the equation above.
b) Multiply the flow of each injector by the total number of injectors and divide the result by 6. This will give you a safe working bhp allowance at a duty cycle of about 85%.
Example. Injector flow for a 4 cylinder engine is 185 cc/min. BHP potential at 85% duty cycle is 185 x 4 / 6 = 123 bhp.
Alternatively to work out the required injector size from the target horsepower, multiply bhp by 6 and divide by the number of injectors.
Example. Target bhp is 200 for a 4 cylinder engine. Required minimum injector size is 200 x 6 / 4 = 300 cc/min.
For forced induction engines add 20% to the above figure to give yourself some leeway for rich mixture settings.
Puma Race Engines - Choke Sizes
The first thing to get right when setting up sidedraft or downdraft carbs is the choke size. Chokes that are too small cost top end power but are good for low rpm tractability and economy. Chokes that are too large not only hurt tractability but also lose top end power and the fuel consumption will be terrible. Get the choke sizes right and you can achieve 30 mpg or more on twin carbs in normal driving. Go too big on them and under 20 mpg is very easy to find.
The Weber tuning manual gives a choke size chart based on cylinder size and the expected rpm at which peak power will occur. It isn't the easiest thing to use if you have no idea what rpm the engine might run to with a given set of tuning mods. An alternative way of choosing the choke size is based on expected engine bhp. Of course once the engine is on the dyno or rolling road different sizes can be tried as part of a thorough calibration session if you

23/52
have the money to pay for that but the chart below will put you very close. It applies only to setups with one choke per cylinder. It can be used for any sidedraft or downdraft carb such as Weber DCOE or Dellorto DHLA. The chart is based on best top end bhp. If you want to sacrifice a few bhp at the top end for better low rpm power and economy then go 1mm or at most 2mm smaller than the chart suggests.
BHP
4 Cylinder engine
BHP
6 Cylinder Engine
BHP
8 Cylinder Engine
Choke Size
mm
93 140 186 26
100 150 200 27
108 162 216 28
116 174 232 29
124 186 248 30
132 198 264 31
141 212 282 32
150 225 300 33
159 239 318 34
169 254 338 35
179 269 358 36
189 284 378 37
199 299 398 38
210 315 420 39
220 330 440 40
232 348 464 41
243 365 486 42
255 383 510 43
267 401 534 44
279 419 558 45
291 437 582 46
4.1.1 Choosing The Carb Size
A good rule of thumb is that if the suggested choke size is within 7mm of the carb size then move up to the next sized carb. So a 40mm carb would be good up to a 33mm choke and 150bhp. A 45mm carb up to a 38mm choke and 200 bhp etc. Always use the smallest carb this rule allows. For a 30mm choke you'll get more power and tractability with a 40mm carb than a 45mm one.
24/52
Main jet size can be estimated from the choke size on which it's almost totally dependant. For a standard or mildly tuned engine with a mild cam multiply the choke size by 4 so a 30mm choke would need a 120 main jet as a starting point. For engines with very big cams or big chokes selected for maximum power at the expense of tractability the mains might need to be a bit bigger than this because there won't be a very high depression across the chokes to get the fuel moving. Sometimes you might even have to go a bit smaller but 4 times the choke size will always get the engine running reasonably well. Air corrector jets are usually in the 160 to 180 range but they really only affect high rpm fuel mixture and can be left until last to calibrate. Idle jets and emulsion tubes are very dependent on the engine size and cam duration so let your rolling road sort these out.
The key is getting the choke size right first though. Too many rolling road operators just leave the chokes as is and try and optimise the jetting around them because they're expensive and they don't always have a full range of sizes in stock or simply because they never think to check or have no idea what size to change to. If you've bought your carbs second hand and they were originally jetted for a completely different engine the chokes could be anything from 30mm or less for a standard road engine to 38mm or 40mm for a 2 litre race one. You're wasting your time and money trying to tune any engine if the chokes are more than a couple of mm away from the ideal size.
5 PUMA RACE ENGINES - ENGINE CALIBRATION & CHIP TUNING
To operate properly an engine needs the correct amount of fuel at all times and the correct ignition timing. Getting these factors right is essential after any tuning modifications have been done and is called calibration.
5.1 Fuel Mixture
The power generated by any petrol engine comes from the fuel burned inside the cylinders. Any fuel needs oxygen to burn though and that comes from the air. We have seen in previous articles that an engine is really an air pump. The amount of power produced is directly related to the amount of air the engine can process per minute. Tuning modifications are designed to enable the engine to flow more air - just squirting in more fuel without improving the air flow does nothing for power. Every molecule of fuel needs to combine with exactly the right number of oxygen molecules if it is to burn completely and release its energy. For best power the ratio of the weight of air to fuel to achieve this is about 12.6 to one. So for every 12.6 lbs of air the engine processes we can burn 1 lb of petrol. We call that an air/fuel ratio of 12.6 to 1. For best economy the ratio is weaker - modern cars are set up to use an A/F ratio of about 15 to 1 at part throttle for good cruise economy. At full throttle the mixture is richened to maximize power output.
If the A/F ratio is weaker than 12.6 then power drops because the engine could be burning more fuel with that amount of air. If the ratio is richer than 12.6 then power also drops - the excess fuel can't burn because there is not enough oxygen present and just gets pumped out again along with the rest of the exhaust gases. Also this excess fuel displaces some of the air that the engine could otherwise have processed. Whether an engine has carbs or fuel injection the calibration must be correct at all rpms and throttle positions. Copyright David Baker and Puma Race Engines
25/52
Carbs are calibrated by changing the size of the various fuel jets. Bigger jets let more fuel through for a given amount of air. The standard car will have been calibrated by the manufacturer but if the engine is modified in any way then the fuel mixture may no longer be correct. The solution is to take the car to a rolling road dyno where the A/F ratio can be measured and altered with different jets if necessary. In principle a fuel injected car is no different. The ECU stores on a chip a map of how much fuel the engine needs at different speeds and throttle positions to achieve the correct mixture. Signals from the crank sensor and throttle sensor tell the ECU what is happening. The ECU then looks up those positions in its internal map and triggers the injectors for exactly the right amount of time.
5.2 Ignition Timing
It takes one or two milliseconds from the time the spark occurs until all the fuel/air mixture in the cylinder is fully alight and expanding. The spark plugs therefore need to be fired a little while before the piston reaches Top Dead Centre so as to get the fuel mixture burning at the right time to push the piston down and generate power. When measured in crank degrees rather than seconds this time delay is called ignition advance. The perfect time to trigger the spark depends again on engine speed and throttle position. Cars used to use a mechanical distributor to set the spark timing. Nowadays it is normally done by the ECU in a similar way to how the fuel mixture is controlled. The ECU stores another map on its chip of how much ignition advance is required which operates just like the fueling map. Copyright David Baker and Puma Race Engines
The amount of ignition advance required depends on the engine design. In fact it is directly linked to how fast the fuel/air mixture burns. The faster the burn obviously the less ignition advance is required. Average figures would be between about 10 crank degrees at idle to about 30 degrees at peak rpm. The required advance usually increases with rpm up to about 3,000 to 4,000 rpm and then stays fairly constant. It also needs to increase at low throttle openings because the mixture in partially filled cylinders burns more slowly. If the spark is fired too early (over advanced) then the mixture starts to burn too soon and tries to push the piston backwards down the way it came before it reaches TDC - very bad for power and can create detonation which is a major cause of engine damage. If the spark is fired too late (retarded) the piston has already gone part of the way down the bore on the power stroke before the mixture is alight and much of the effectiveness of the energy released is lost so again engine power drops.
If I had £1 for every person who thinks that more ignition advance is a good thing in its own right I'd be a rich man. Like most other things, more advance is only good if there isn't enough to start with. Excessive advance is just as detrimental to power output as insufficient advance but it's also potentially much more harmful to the engine. In fact the better the engine design the less advance is required and other things being equal, an engine that requires less advance because its mixture burns faster will produce more power. A fast burn is obtained by using compact combustion chambers and plenty of swirl and turbulence in the fuel/air mixture.
5.3 High Octane Fuel
High octane fuel does NOT give an engine more power in its own right. The fuel itself doesn't contain or release more energy than low octane fuel. In fact it often has less. What it does do is resist detonation better which allows the engine designer to use a higher
26/52
compression ratio without having to retard the ignition timing. It's the higher compression ratio that produces the extra power. If you build an engine with too much compression ratio for the fuel octane being used then the engine will detonate or 'pink' at high throttle openings. To stop this happening the ignition advance has to be reduced below what the engine would ideally like for best power. This stops the detonation but loses more power than the extra compression ratio was giving in the first place. In nearly all cases when detonation is present you'll get more power for a given fuel octane by reducing the compression ratio and advancing the timing again. Obviously the ideal is to use fuel with a higher octane value, add compression ratio and still be able to leave the ignition adavance alone.
Many modern high performance engines have knock sensors built in to detect detonation. When they detect this happening they reduce the ignition advance until the detonation stops. In this way they can adjust for poor fuel without the engine suffering damage but the power drops. They will therefore perform best on higher octane fuels. For basic engines without knock sensors if there is no detonation with the ignition timing correctly set then you'll get no more power by using high octane fuel because the engine design doesn't need it. You also won't get more power by increasing the ignition advance because again the engine doesn't need it. Only by increasing the compression ratio will the higher octane fuel become of any benefit.
5.4 Why Don't The OE Manufacturers Get It Right?
Well that depends on your point of view. The OE manufacturers have a number of criteria other than just maximising power. They need to retain reliability, good fuel economy, allow for poor fuel, hot and cold operating conditions and what happens to the engine as it wears. Setting the fuel mixture to exactly 12.6 and the ignition timing to the optimum for best power is all well and good if everything else stays perfect. But if the engine overheats or you fill up with a bad tank of fuel those settings might cause detonation and consequent engine damage. Using a fuel/air ratio of 13 or 13.5 instead of 12.6 might lose only 2% power but gain 5% economy. Using a couple of degrees less than the optimum ignition advance allows a safety margin for low octane fuel or engine overheating with again only a minor loss of power. The standard calibration settings are what they feel is the best balance of reliability, economy and power. In my own opinion, most OE engine calibration settings are a very good compromise and not worth messing around with. Copyright David Baker and Puma Race Engines
5.5 Chip Tuning
The chip is where the fuel and ignition maps are stored in the ECU of a modern engine. The aim of non standard chips is to take advantage of any compromises the OE manufacturer has made to the standard calibration settings which reduce power in favour of economy or reliability. The scope for improvements is usually very small though. The best that can normally be achieved is to remove any flat spots in the power curve and find a couple of % extra power by richening the mixture up to 12.6 and losing any safety margin in the ignition timing settings. The penalty is often significantly worse fuel consumption, unreliability, poor starting and the power increase is often not even noticeable. It takes a day or less of dyno time to establish the new map settings for a particular vehicle and each chip costs a couple of pounds. Total development cost perhaps a few hundred pounds. The selling price of £200 to £400 from then on for a chip costing £2 means a huge amount of profit for
27/52
both the chip company and the fitting agent. To keep those sales rolling along nicely it isn't surprising that the power claims tend to be somewhat inflated.
Why people are prepared to spend so much on a 'performance' chip is beyond me. Everyone nowadays is familiar with how much computer components cost. A PC motherboard is maybe £60 and a complex piece of software that took millions to develop might be £30. For a map that took a day to develop when each new chip itself costs £2 it strikes me that to pay £200 or more is madness. Still it's your money I guess.
On a turbocharged engine the chip might also control the boost pressure. There are genuine possibilities for good power increases in this case although it isn't really any more complex than adjusting a mechanical wastegate. The penalty for excessive boost pressure is detonation and engine life measured in weeks though. On a normally aspirated engine the chip can't make any difference to how the engine physically operates and can't increase the airflow potential. You therefore can't just "bolt on power" with a chip swap - it is purely a calibration device, not a tuning device. No different in principle to getting a carb jetted properly. Claims of 30% extra power from chip tuning is purest nonsense - 3% is more like it. If the OE manufacturers were that bad at calibrating their cars considering the millions they spend on doing it they'd be out of business in weeks. Copyright David Baker and Puma Race Engines
5.6 Calibrating A Modified Engine
Any time the airflow potential of an engine is substantially modified - by that I mean ported cylinder head, exhaust system, different carb or manifold, longer duration camshaft etc - the fuel and ignition requirements also change. Whether the engine has carbs and a distributor, or ECU controlled fuel and ignition, the principles of calibration are the same. The best place to get this sort of work done is on a rolling road dyno or engine dyno.
engine is operated under load and the fuel/air ratio and power are measured. Adjustments are then made to bring the mixture back to the optimum settings. On a carb by changing the jets and in an ECU system by changing the internal map (or chip) that the ECU works from. The ignition advance can then also be altered a couple of degrees at a time to see if power goes up or down at different rpm.
An engine can be modified in an infinite number of different ways. Even similar sounding specs might work very differently. For instance a ported head might increase airflow by nothing at all if it has been done badly or 30% if it has been done well. The settings from someone else's similar sounding engine might be nothing like right for your own. By the same token a "performance chip" designed to squeeze a couple of % extra power out of a standard engine is useless for a modified engine if the map settings it contains are not what the modified engine now wants. Sadly it seems to be commonplace for people to believe that a chip is a performance item in its own right and that by fitting one it will magically make any possible combination of cam, exhaust and head mods work properly together. Nothing could be further from the truth. Copyright David Baker and Puma Race Engines
5.7 Performance Increases From Modified Chips
So far I haven't seen a single definitive test where the acceleration of a "chipped" standard normally aspirated car actually improved. I've seen plenty of rolling road tests showing supposed increases in power and comments about improved "driveability" during
28/52
road testing. Bring out the stopwatch though and these improvements seem to be rather harder to pin down. Several years ago one of the car magazines did a reasonably scientific test on a BMW as I recall. Performance chips from two different manufacturers were tested against the standard item in a 0-60 sprint at a test track. 5 runs were performed for each chip and the times averaged to remove any bias. Within a tenth of a second they stayed the same in all cases despite the extra horsepower claims. If anyone knows of a properly conducted test that shows the opposite I'd be interested to read it.
6 PUMA RACE ENGINES - LIGHTENING FLYWHEELS - AN EXERCISE IN ROTATIONAL DYNAMICS
When the flywheel of a car is lightened it can have a great effect on acceleration - much more than just the weight saving as a proportion of the total vehicle weight would account for. This is because rotating components store rotational energy as well as having to be accelerated in a linear direction along with the rest of the car's mass. The faster a component rotates, the greater the amount of rotational kinetic energy that ends up being stored in it. The engine turns potential energy from fuel into kinetic energy of motion when it accelerates a vehicle. Any energy that ends up being stored in rotating components is not available to accelerate the car in a linear direction - so reducing the mass (or more properly the "moment of inertia") of these components leaves more of the engine's output to accelerate the car. It can be useful to know how much weight we would need to remove from the chassis to equate to removing a given amount of weight from the flywheel (or any other rotating component). There is more than one way of solving this equation - we can work out the torque and forces acting on the various components and hence calculate the accelerations involved - also we can solve it by considering the kinetic energy of the system. The latter approach is simpler to explain so this is the one shown below. Copyright David Baker and Puma Race Engines
Let's imagine we take two identical cars - to car A we add 1 Kg of mass to the circumference of the flywheel at radius "r" from the centre. To car B we add exactly the right amount of mass to the chassis so that both cars continue to accelerate at the same rate. If we accelerate both cars for the same amount of time they will end up at the same speed and will have absorbed the same amount of kinetic energy from the engine. In other words, the additional 1 Kg in the flywheel of car A will have stored the same amount of kinetic energy as the additional M Kg of mass in the chassis of car B. To solve the problem of the size of M we need to use the following definitions:
• V - the speed of either car after the period of acceleration • R - the tyre radius • G - the total gearing (i.e. the number of engine revolutions for each tyre revolution) • r - the flywheel radius (i.e. the radius at which the extra mass has been added to car A) • M - the amount of mass added to the chassis of car B
Kinetic energy is proportional to ½mv² - the kinetic energy stored in the extra chassis mass in car B is therefore ½MV².
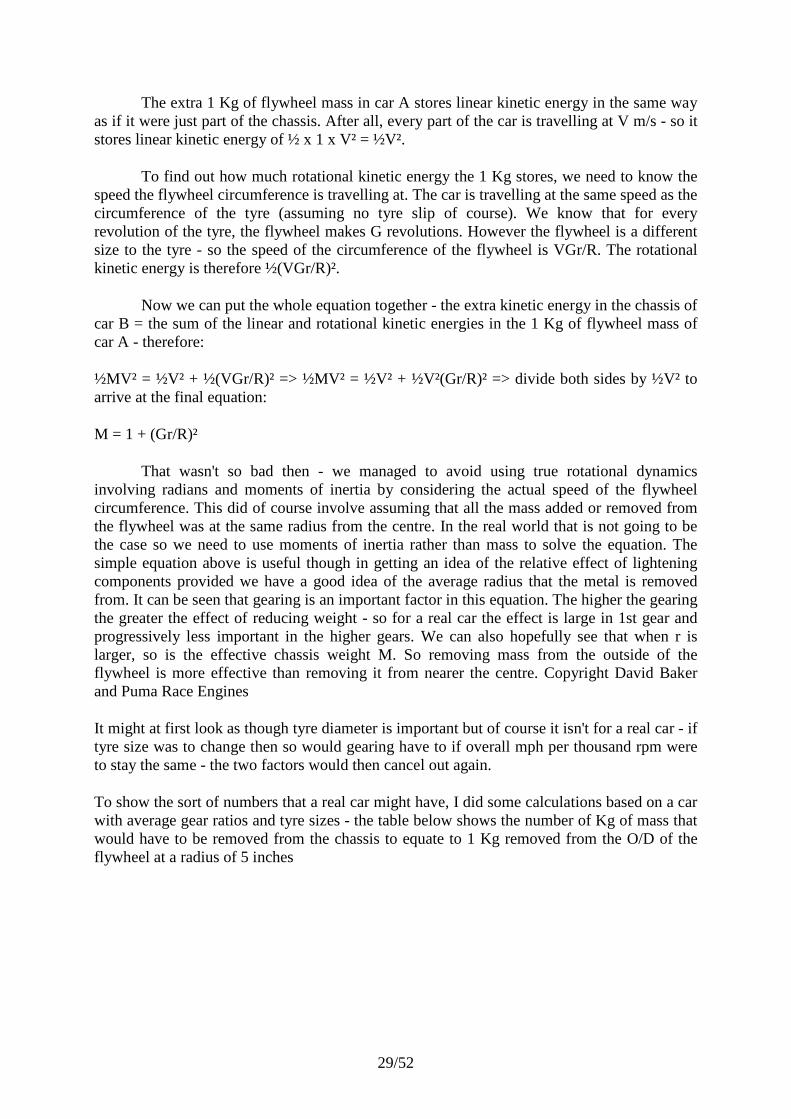
29/52
The extra 1 Kg of flywheel mass in car A stores linear kinetic energy in the same way as if it were just part of the chassis. After all, every part of the car is travelling at V m/s - so it stores linear kinetic energy of ½ x 1 x V² = ½V².
To find out how much rotational kinetic energy the 1 Kg stores, we need to know the speed the flywheel circumference is travelling at. The car is travelling at the same speed as the circumference of the tyre (assuming no tyre slip of course). We know that for every revolution of the tyre, the flywheel makes G revolutions. However the flywheel is a different size to the tyre - so the speed of the circumference of the flywheel is VGr/R. The rotational kinetic energy is therefore ½(VGr/R)².
Now we can put the whole equation together - the extra kinetic energy in the chassis of car B = the sum of the linear and rotational kinetic energies in the 1 Kg of flywheel mass of car A - therefore:
½MV² = ½V² + ½(VGr/R)² => ½MV² = ½V² + ½V²(Gr/R)² => divide both sides by ½V² to arrive at the final equation:
M = 1 + (Gr/R)²
That wasn't so bad then - we managed to avoid using true rotational dynamics involving radians and moments of inertia by considering the actual speed of the flywheel circumference. This did of course involve assuming that all the mass added or removed from the flywheel was at the same radius from the centre. In the real world that is not going to be the case so we need to use moments of inertia rather than mass to solve the equation. The simple equation above is useful though in getting an idea of the relative effect of lightening components provided we have a good idea of the average radius that the metal is removed from. It can be seen that gearing is an important factor in this equation. The higher the gearing the greater the effect of reducing weight - so for a real car the effect is large in 1st gear and progressively less important in the higher gears. We can also hopefully see that when r is larger, so is the effective chassis weight M. So removing mass from the outside of the flywheel is more effective than removing it from nearer the centre. Copyright David Baker and Puma Race Engines
It might at first look as though tyre diameter is important but of course it isn't for a real car - if tyre size was to change then so would gearing have to if overall mph per thousand rpm were to stay the same - the two factors would then cancel out again.
To show the sort of numbers that a real car might have, I did some calculations based on a car with average gear ratios and tyre sizes - the table below shows the number of Kg of mass that would have to be removed from the chassis to equate to 1 Kg removed from the O/D of the flywheel at a radius of 5 inches
30/52
. GEAR MASS KG
1 39
2 12
3 6
4 4
5 3
So in first and second gear this is a pretty important effect - I built an engine recently and managed to remove nearly 3 Kg from the outside of the standard flywheel - so that would be equivalent to lightening the car by over 100 Kg in 1st gear - not to be sneezed at in terms of acceleration from rest. With special steel or aluminium flywheels even more "moment of inertia" can be saved. The recent trend in racing engines to using very small and light paddle clutches and flywheels is therefore more effective in terms of the overall performance of the vehicle than it might first appear. Copyright David Baker and Puma Race Engines
There's a final consequence of the "flywheel effect" being dependent on gearing. Small highly tuned, high revving engines need to run much higher (numerically) gearing than large, low tuned engines. This means that the effect can be very pronounced on them. Bike engines are a good case in point, especially as they are now starting to be used in cars so much. A 100 bhp bike engine might only be 600cc and rev to 12,000 rpm. A 100 bhp car engine might be 2 litres and rev to 5,500 rpm. Put the bike engine in a car and you'll need to run a final drive ratio twice as high as for the car engine. As the flywheel effect is proportional to the square of gearing, it will be 4 times as high for the bike engine. You could therefore be talking about 1kg off the flywheel being equivalent to 160kg off the weight of the car. That's why bike engines have such small multiplate clutches to keep the moment of inertia down. On the other side of the coin, it's not worth spending much money lightening the flywheel of a 7 litre Chevy engine revving to under 5,000 and geared for 60 mph in first as the vehicle will be very insensitive to the reduction in weight. Copyright David Baker and Puma Race Engines
If you are going to get your standard cast iron road car flywheel lightened then be sure to take it to a proper vehicle engineer and not just your local machine shop. Take off too much material and it might be weakened so much that it explodes in use. Given that flywheels (at least in rear wheel drive cars) tend to be situated about level with your feet, it isn't worth the extra acceleration if you lose both feet when the ring gear comes out through the side of the transmission tunnel like a buzz saw at 7,000 rpm. There are plenty of ex racing drivers hobbling about on crutches who'll tell you that this can and does happen. On FWD cars the effects can even more unpleasant - a flywheel entering the cabin can give you a split personality starting from just below the waist that will put quite a crimp in your day. Also when you remove any weight from the flywheel it will need re-balancing again properly. We'll be happy to do the job for you if you don't know of an experienced engineering shop.
Addenda (May 2002). A friend, Garry, told me an interesting story the other day which relates to my warning above about lightening flywheels properly. He was at the local engine reconditioners chatting to the proprietor about having a cylinder head skimmed. At the back of the workshop, one of the lads who worked there was lightening a flywheel on the

31/52
lathe. Suddenly there was an almighty bang and a lot of swearing so Garry and the owner went back to see what had happened. The lad had been removing material from the centre of the flywheel, just outboard of where the 6 crankshaft bolt holes are. For starters this is a stupid place to remove material because it is a highly stressed area and also much less effective in terms of the reduction in inertia than removing material from the rim of the flywheel. Anyway, to cut a long story short this idiot had machined right through the flywheel leaving the centre attached to the chuck of the lathe and the rest had flown off and bounced across the workshop. It made me wonder what would have happened if he'd stopped just short of machining right through, say with only 1mm thickness of material left, without realising how thin and weak he'd made it. It would then have failed in the car, maybe at high rpm, and done the sort of damage I describe above. The moral is clear. Get critical work like this done by someone who knows what they are doing.
An average cost to lighten and rebalance a cast iron flywheel it £80 but best to email and ask about your specific application first.
6.1 Other Rotating Components
All other components which rotate absorb energy in addition to them having to be accelerated linearly along with the chassis. Components which rotate at engine speed like flywheels are the most cost effective ones to lighten in terms of their equivalent chassis mass but it pays not to overlook the mass of any rotating component. The next major category is items which rotate at wheel speed - wheels, tyres, discs etc. These don't rotate as fast as engine components but they can be very heavy. The average car wheel and tyre weigh about 45 lbs together. A good rule of thumb is that in addition to its own normal weight a wheel speed item adds the equivalent of an extra 3/4 of its mass to the effective chassis mass and this figure is not dependent on gearing so it stays a constant at all times. It's a smaller effect than the flywheel effect which can be many times its own mass in first gear but still important. Let's say you fit wide wheels and tyres to your car. If each corner weighs an extra 10 lbs more than the standard items then the effective increase in chassis mass is 40 lbs for the direct weight plus another 30 lbs being 3/4 of the direct mass - a total of 70 lbs. On a light car like a Westfield or hillclimb single seater this could be between 5% and 7% of the effective total car weight. Equivalent to knocking the same percentage off the engine's power in acceleration terms. That's why F1 and other high tech series designers strive so hard to reduce weight in this area and use magnesium instead of aluminium for wheels and the thinnest possible carcasses for tyres. It also reduces unsprung weight of course which helps the suspension and handling. Even on a 1 ton road car the effect of heavy wheels and tyres can be noticeable in terms of reduced acceleration. Wider tyres also absorb a bit more power in friction which doesn't help either if the engine is on the small side. Copyright David Baker and Puma Race Engines
The other few rotating items, gearbox internals, camshafts etc are generally of small diameter and not worth lightening because of their consequent low inertia. One thing I can promise you is that the current fad for anodised aluminium cam pulleys which then usually get hidden behind a cover anyway won't make a scrap of difference to your engine because of the few grams weight they save. They may well wear out and cost you your entire engine if the teeth strip off the belt though. Aluminium is not really the material for gears and sprockets but when did fashion and common sense ever go together?
32/52
Finally, you see some frankly unbelievable comments on car forums about lightened flywheels such as "they might make the car faster on the flat but it'll be slower up hills because that's where inertia helps you." Yeah right, heavy things go up hills so much better than light ones. That must be why all those trucks I overtake on the motorway come flying back past me up the next rise and then I overtake them again on the way down. A lightened flywheel has exactly the same effect as making the car lighter - no more no less. It will make the car faster everywhere - up hills, down hills, round my lady's chamber.
Also lightening the flywheel does NOT give the engine any more horsepower just like removing a sack of cement from the boot doesn't either. It simply leaves more of the horsepower available to accelerate the car because less is wasted in accelerating the flywheel.
Is there a downside? The only one of note is the idle quality. To get really smooth low rpm idle you need some flywheel mass to smooth the power pulses as each piston goes over TDC. This is more important the fewer cylinders the engine has. However in my experience it's simply not possible to lighten a standard cast iron flywheel so much that it greatly affects the idle quality. In fact some standard cars like Peugeots manage with very light flywheels anyway whereas others use a lot more mass most of which is unnecessary. For a track car none of this is even an issue though.
Any other upsides? One thing you'll find is the car will slow down much faster under engine braking because it doesn't have the flywheel inertia dragging it on. I much prefer a road car to be like this and you'll find you need to use the brakes less in normal driving.
7 PUMA RACE ENGINES - THE DANGERS OF ROLLING ROAD "FLYWHEEL" BHP FIGURES
I've written more about rolling roads and dynos than just about anything else on this web site. It shouldn't be hard to guess that one of the things I really dislike is the nonsense flywheel power figures that get bandied around in the car magazines and by tuning firms based on rolling road tests where only the wheel bhp figure was really measured with any accuracy. Plenty of people have expressed a view to me that it doesn't really matter whether the figures are accurate or not as long as they are repeatable and you can tell whether you achieved a decent power gain from your tuning modifications. My answer to that is that the only data that is of any use to someone who tries to do things scientifically is accurate data. In previous articles I make it clear that the only figure you should place any reliance on from a rolling road test is the wheel bhp figure. The dangers of relying on the supposed "flywheel" bhp figure is illustrated below from an actual tuning session I attended some years ago. Copyright David Baker and Puma Race Engines
In the mid 1990s I used to build a lot of CVH engines for the Fiesta XR2 Challenge and also the Stock Hatch series. The class rules mean that the engines have to stay standard internally and any power gains can only be achieved by very careful blueprinting and attention to detail. Building identical engines over and over again isn't really very interesting and after winning the XR2 Challenge for three years in succession I moved on to other types of engine. I still build the occasional race CVH these days and a couple of years ago I was approached by a competitor (we'll call him Steve) in the Stock Hatch series who felt his engine was underpowered and wanted to discuss me building him a new one over the winter break. He'd built his current engine himself but had never had it set up on a rolling road on the

33/52
basis that being basically standard it should be fine on the standard ignition timing and carb jetting. I suggested it would be a good idea to pay for a tuning session to find out how underpowered it was and that would help decide what needed to be done during the rebuild. I recommended a rolling road local to myself that I could pop down to during the tuning session and have a chat about things.
He duly booked a day and I said I'd turn up an hour or so after his start time to see how things had gone. A bog standard XR2 engine is rated at 96 PS by Ford (that's about 94 bhp) and they show about 75 bhp at the wheels on an accurate set of rollers. With the exhaust system and carb mods that this race series allows I expect to see about 80 bhp on a home built engine and up to 10 bhp more for one I've blueprinted myself. So the target power figures for this test day were fairly clear - to me at least. When I arrived at the rolling road premises the job seemed to be just about finished. The fueling and ignition timing had been checked and adjusted and a couple of power runs made. Copyright David Baker and Puma Race Engines
I asked the tuning guy (let's call him John), how things had gone. He said it was actually a pretty good engine and was showing about 100 bhp which was a decent bit up on standard. He was happy enough with this and Steve the driver looked happy but I wondered how this tied in with an engine that was supposedly underpowered. The first thing that should strike anyone used to reading my website is I don't take a blind bit of notice of flywheel bhp figures so I asked John to let me see the wheel bhp data and that's when things started to go downhill.
This alleged 100 bhp engine was only making 69 bhp at the wheels. That's 6 bhp down on a standard car and at least 11 down on what I expected a home built Stock Hatch engine to make. The ridiculous 31 bhp the system was adding for transmission losses was blinding this supposedly experienced rolling road operator to the fact that the engine was actually crap. Now John knew my views about wheel and flywheel bhp well enough because we'd discussed them many times but he still wouldn't look any further than the flywheel figure his machinery was producing.
So I asked them both to explain to me step by step what had been checked and how. First thing they'd done was the ignition timing. The Ford Figure is 12 degrees BTDC with the vacuum advance pipe disconnected. In my experience the race engines like a bit more advance than this. It turned out that the driver had never realised the vacuum pipe should be disconnected and when John had checked the timing he'd forgotten too. They both thought it was set at 12 BTDC but when I put the strobe light on the car myself it showed the timing was actually at 3 degrees ATDC with the pipe disconnected. In other words the vacuum advance had been adding 15 degrees to the centrifugal advance and the true timing was retarded by this 15 degrees. Now that's about the most basic tuning mistake you can ever make and no professional worth his salt should have been caught out by something that stupid. With the timing properly set to 14 BTDC, which is where I normally run them, the power leapt to 80 bhp at the wheels. Copyright David Baker and Puma Race Engines
I asked John somewhat tongue in cheek what he thought about the previous 100 bhp at the flywheel now. I think the answer was mainly in the form of a red face and some muttering. Next thing I checked was the fuel mixture. 5% CO is the figure to aim for on a race engine but a lot of rolling road operators think it's safer and less chance of the owner melting a piston and coming back to complain if you set them up a bit rich. Sure enough this one was at about 7% and I had to almost force a by now somewhat unhappy John to decrease the main
34/52
jet by one size. With the CO showing 5% the power went up another 2 bhp to 82 bhp at the wheels.
The outcome of the story was rather ironic. John didn't knock a penny off the tuning bill despite the fact that he'd cocked most of it up to start with. I spent an hour sorting things out which I didn't ask for payment for because I'd only intended to go there for a break and a chat. The engine was now so powerful that it was fully competitive and I never heard back from the owner and effectively did myself out of an engine rebuild. I suppose I should have kept my mouth shut and let Steve trail round at the back of the pack for the rest of the season. I'd have got an engine rebuild out of it and a reputation as a miracle worker because the very least he would have gained with one of my engines was the missing 13 bhp we found that day with a proper tuning session.
The moral is clear. By relying on a nonsense flywheel figure it looked like the engine was producing its target power output. So no one had been motivated to check any further to discover their mistakes in the timing and jetting. Basically just stupidity compounded on top of even more stupidity. There's another angle to this as well. Very few standard engines actually make as much power as the manufacturers claim. Partly because the average engine has already done 50,000 miles and is over the hill and partly because the quoted power figures will be towards the top end of what a randomly selected batch of engines would produce even if they were in tip top condition. But because nearly all rolling roads produce inflated power figures it makes a below average engine look better than it really this. The brilliant bit is this - the rolling road operators then say "well my rollers must be accurate because every standard engine I test shows the standard bhp figure". The total lack of logic in this is so mind blowing it renders me almost speechless (although thank god I can still type). Using engines that on average will be 5% or more below the claimed power output to justify as accurate rolling roads that on average read at least 5% high. Copyright David Baker and Puma Race Engines
8 PUMA RACE ENGINES - COASTDOWN LOSSES
To round off the articles on power and torque, here is a real example of how the coastdown losses from an actual car were measured on a rolling road dyno. Some time ago I asked a colleague to run a series of tests for me on their rollers. What we needed was a car with a reasonably well quantifiable flywheel bhp and one that we could run in any gear without getting wheelspin on the rollers. This ruled out modified cars that had not been on an engine dyno and anything with too much power. Some time later a completely standard cvh engined Fiesta XR2i came into their workshop and this seemed as good a choice as any. The engine was in good condition and absolutely unmodified according to the owner - a good chance therefore of it producing close to the quoted horsepower.
The aim of the test was to see how wheel bhp and coastdown losses change depending on which gear you run the test in. The rolling road in question is a Bosch flywheel system, which means it has a heavy flywheel attached to the rollers and the system works out power according to how quickly the car can accelerate this large mass. It can't take "steady state" power figures which can be a hindrance when setting up fuel and ignition systems but on the other hand there is nothing for the operator to tinker with and distort the readings - you just sit in the car and floor the throttle and wait for the run to reach maximum rpm. At this point you can put the car in neutral while it "coasts back down" and the system measures these coastdown losses. Some dyno systems then add these losses back to the wheel bhp and call the result "flywheel horsepower". Proponents of this method claim that the "flywheel
35/52
horsepower" figures so produced are more consistent and repeatable than wheel bhp figures. Hopefully this article will show the pitfalls in relying on coastdown losses by means of this real example - anyway on with the plot. Copyright David Baker and Puma Race Engines
Ford quote 110PS (i.e. about 108.5 bhp) as the standard flywheel power for the car in question. Obviously every individual engine will differ slightly and this quoted figure can only be a guide to the spread of power outputs that a selection of engines would produce. To restate my own rules for estimating wheel bhp from flywheel bhp - about 15% transmission losses for front wheel drive cars and 17% for rear wheel drive is a rule of thumb. This tends to overstate the losses for high powered engines and understate them for smaller ones. A more sophisticated guide is to deduct 10% of the flywheel power plus another 10 bhp for FWD and 12% plus another 10bhp for RWD cars. The XR2i is FWD of course so if we apply those two rules to 108.5 flywheel bhp we get either 92 or 88 bhp at the wheels respectively. So that's the sort of level of wheel bhp that one would be expecting if the quoted flywheel bhp is correct.
To run the test, the car was warmed up and given a couple of runs on the rollers to stabilize the temperature of the tyres, gearbox oil and engine. A power run and a coastdown were then done in each of 3rd, 4th and 5th gear with a few minutes for the car to cool down between each run to keep the figures consistent. So first let's look at the how the wheel bhp changed in each gear. The figures are as follows:
• 3rd gear - 95 bhp at the wheels • 4th gear - 92 bhp at the wheels • 5th gear - 88 bhp at the wheels
So why do the figures show a drop in power as a higher gear is used? The engine of course is producing exactly the same flywheel power regardless of which gear the car is in - what is changing here is the real transmission and tyre losses. A higher gear means that the tyre speed on the rollers goes up too - this leads to more power being absorbed as heat and friction - the measured wheel bhp therefore goes down a bit. There are other factors at work here too but it is not the aim of this particular article to go into all of these in depth. The key thing is that the figures show a reasonable and predictable trend and are in the estimated bhp range calculated above. Copyright David Baker and Puma Race Engines
It makes the point though that there is no such thing as just one true wheel bhp for a given car on a given set of rollers - it depends on tyre pressure, gear ratio and a host of other things that have already been covered in previous articles. Now devotees of the "coastdown loss" system would say that it should compensate for this - it should reflect the larger losses in higher gears by showing a larger coastdown loss which when added back to the wheel bhp ought to give a flywheel bhp that stays the same in each gear. So let's now look at the coastdown losses that were measured on each of those runs and see if they actually do what is claimed. The coastdown losses were as follows:
• 3rd gear - 17 bhp coastdown loss • 4th gear - 27 bhp coastdown loss • 5th gear - 44 bhp coastdown loss
We can add those losses back to the wheel bhp to get the estimated flywheel bhp that so many rolling roads these days quote you.
36/52
• 3rd gear - 95 + 17 = 112 bhp • 4th gear - 92 + 27 = 119 bhp • 5th gear - 88 + 44 = 132 bhp
Well clearly something isn't working here. The coastdown losses (whatever it is that they are actually measuring) are rising much more in a higher gear than the actual transmission losses are, leading to larger "flywheel" bhp figures in the higher gears. The engine is producing the same power all the time and although we can never know for certain exactly how much power this particular engine had, we can be fairly certain it isn't far away from the factory quoted power. Even the 3rd gear "flywheel" figure is a tad on the high side but it is within the realms of possibility - the figures in the other two gears are obviously not.
The wheel bhp data show a consistent and understandable pattern. Adding back the coastdown losses leads to power figures which vary much more and make less sense. The point to remember is this - if the coastdown losses really were an accurate measurement of the true transmission losses then we would expect to end up with the same estimated flywheel bhp in all 3 gears. The fact that this does not happen means by definition that the coastdown losses are measuring something other than true transmission losses - in turn this means that adding them back to wheel bhp cannot result in true flywheel bhp. The fact that they result in horsepower numbers much larger than the 108.5 bhp claimed for this engine only go to reinforce the message. Copyright David Baker and Puma Race Engines
So the moral, for the last time hopefully, is to look at the wheel bhp as well as (or preferably instead of) the estimated flywheel bhp. It won't be a figure you can take for gospel and it will change from day to day and from rolling road to rolling road. With a modicum of common sense in keeping the test conditions the same and applying reasonable amounts for transmission losses it will get you "in the ball park" of what the true flywheel figure might be. The flywheel figure generated from coastdown losses though, can vary from the sublime to the ridiculous. Every now and then it might come up with a realistic bhp number but it might equally well be a country mile out.
To estimate true flywheel power from wheel power just apply the rules given at the start of this articles in reverse.
FWD cars - add 10 to the wheel bhp and then divide the result by 0.9 RWD cars - add 10 to the wheel bhp and then divide the result by 0.88
Remember these are estimates. The only way of knowing true flywheel bhp for a particular engine is to run that engine on an engine dyno.
PUMA RACE ENGINES - MEASURING ENGINE POWER
There is in fact no way of directly measuring power - all types of dynamometer measure torque and then power is calculated from the formula we saw in the previous articles - BHP = Torque (ft/lbs) x rpm/5252. This basic equation is the cornerstone of all engine design and development work. Two main methods of measuring power are used in the automotive industry - (1) measurement at the crankshaft of the engine or (2) measurement at the driving wheels. We'll look at both of these separately.

37/52
8.1 Engine dynamometers
If we want to know the power of the engine alone then an engine dynamometer (or dyno) is used. This is how nearly all manufacturers rate the output of car engines. The engine is bolted into a cradle and connected to the dyno with a prop shaft which bolts onto the back of the crankshaft (or the flywheel). The power figures measured in this way are therefore usually called "flywheel power". The dyno is essentially a "brake" which can apply a known torque (or "load") to the engine. When the engine is holding a steady speed under a given dyno load then the torque being applied by the dyno must be exactly equal to the torque being produced by the engine. If this were not so then the engine would either accelerate or decelerate. Let's say we want to know the engine torque at full throttle at 3,000 rpm. The throttle is gradually opened and at the same time the load applied by the dyno is increased - eventually by juggling the amount of load applied we get to the situation where the throttle is fully open and the rpm is steady at 3,000. The torque being applied is written down and then the operation would be repeated at say 4,000 rpm. Soon we get a complete chart of torque at all engine speeds. Of course we could also measure part throttle power if desired. Copyright David Baker and Puma Race Engines
Modern dynos are computer controlled and can generate power and torque curves very rapidly without the operator having to manually adjust throttle and load controls. They can be programmed to measure every so many rpm, say in 250 or 500 rpm steps - or they can measure a continuous torque curve while the engine accelerates at a preset rate. This can be used to simulate how the engine would actually operate in a particular gear when installed in the car.
There are various ways in which the dyno load can be applied. Older dynos use a hydraulic system with a rotor inside a water filled cavity - rather similar to the torque convertor in an automatic gearbox. Modern dynos generate the load with large electric motors. Even a simple friction disk or drum brake will work fine and this is where the name "brake" in Brake Horsepower came from. The important thing is that the load is able to be measured accurately and that there are no frictional losses in the system that escape measurement.
In order for dyno results to be comparable and universally understood there are a number of things that need to be closely controlled during the measurement process:
Operating Conditions
Air temperature, pressure and humidity affect the amount of power an engine produces. Cold dense air means a greater mass of oxygen per power cycle and thus more power is generated (provided of course that air/fuel mixture is properly calibrated for the conditions prevailing). There are formulae that can be used to calculate how much the measured power would change if the test conditions were different. This enables dyno results to be "corrected" back to standard conditions to enable comparison with anyone else's test results. Sadly however there is no one universally accepted set of "standard" conditions because different automotive bodies in different countries use different standards to calibrate to. "SAE" power standards are used in the USA and sometimes in England. "DIN" standards are used on the continent and there are a few other oddball systems just to confuse the issue. So just because your car is rated at 100 bhp and a friends at 110 bhp doesn't necessarily mean
38/52
that his engine is more powerful - it depends whether both measurements were corrected to the same standard conditions. Copyright David Baker and Puma Race Engines
One of the tricks I've seen used to get bigger "corrected" bhp numbers is to use a very high ambient temperature reading for the dyno test. If the operator measures the temperature close to the engine rather than well away from it then obviously he will get a reading that is much higher than ambient. When the bhp numbers are corrected back to a lower standard ambient temperature they will increase. I saw an engine dyno sheet the other day where the ambient air temperature in February, in England was supposedly 37 degrees C. Now either that test was done with the temperature probe sat right on top of the engine or it's a part of country I don't yet know about where I would very much like to live !!
Engine Ancillaries
When installed in the car, the engine has to drive a number of items like the alternator and power steering pump which sap power. Also the exhaust and air filter systems will reduce power to some extent. If the engine is tested without any of these ancillaries fitted then it will show much higher power figures. The Americans used to rate their engines like this back in the fifties and sixties and often the installed power of the engine would only be 2/3 of the claimed figure in the sales blurb. This used to be called "gross" flywheel power and if the ancillaries were fitted the power was called "net" flywheel power. Nowadays the gross system, which was very misleading, is not used and all modern published data should be "net flywheel" power. Major manufacturers abide by rigorous standards which set out how the engine should be installed on the dyno to simulate closely the "in car" conditions. Net power has nothing to do with it being measured at the wheels as so many people seem to think. That's wheel bhp which is measured on a rolling road dyno and is discussed below.
8.2 Rolling road dynamometers
Also called chassis dynamometers, these are used to measure power at the driving wheels. This avoids the inconvenience of having to remove the engine to test it if a tuning modification has been made. However, it means that the power figures obtained will be lower than the flywheel power because of the frictional losses in the drivetrain and tyres. This leads to one of the biggest sources of confusion, error and plain misinformation in the tuning industry. You see, as discussed above, all major manufacturers quote flywheel power so it is understandable that people want to know if the hard earned cash they spent on tuning mods increased the power of their engine and by how much. To know this for certain means knowing how much the transmission losses are. There is enormous pressure on rolling road operators to be able to quote flywheel bhp rather than wheel bhp and most operators now run proprietary software systems which "supposedly" print out flywheel power.
PROBLEM !! - THESE SOFTWARE SYSTEMS DO NOT AND CANNOT WORK !!
Yes - I know - the whole chassis dyno tuning industry quotes flywheel figures and here's me saying none of it works. So I'd better explain some more and then you can make your own mind up.
First, let's look at how a chassis dyno works. The car is driven onto a rig so that the driving tyres are resting between two steel rollers. The torque is measured at different speeds in exactly the same way as an engine dyno works except that it is torque at the rollers rather
39/52
than torque at the flywheel. The braking load is applied to one of the rollers by either a hydraulic (water brake) or electrical system again in just the same way as the engine dyno would apply a torque to the crankshaft of the engine. The same universal equation at the top of the page can then be used to calculate bhp at the rollers by knowing the torque and the rpm of the rollers (NOT the rpm of the engine at this stage) - but if the engine rpm is measured simultaneously then we can know roller bhp at a particular engine rpm. The BIG problem with all this is if any tyre slip is taking place. Remember these are smooth steel rollers which over time get quite polished. How much grip do you think you would get if roads were made of polished steel rather than tarmac? The effects of tyre slip are complex (i.e. I don't pretend to fully understand them myself!) but what I do know is that you can get some really strange bhp figures from highly tuned engines on narrow tyres and the readings are invariably too high not too low.
What is a transmission loss ? Well all mechanical systems suffer from friction and a proportion of the power fed into a system will get dissipated by friction and turn into heat and noise. Note the key phrase there - "power fed into a system". For there to be a loss there must be an input - simple and obvious yes but we'll see the relevance in a minute. When your car is parked overnight with the engine switched off, the transmission losses are obviously zero. When the car is running then some proportion of the flywheel power will be lost in the gearbox, final drive, drive shaft bearings, wheel bearings and tyres. For a given mechanical system these losses will usually stay close to a particular fixed %. For example if the loss percentage was 10% (just picking a nice round number for ease of explanation) and the car cruising on a level road was developing 20 bhp at the crankshaft then 2 bhp would get absorbed as friction. Under full power, say 100 bhp, then 10 bhp would get absorbed.
Now it is true that not every component in a transmission system absorbs a fixed % of the input power. Some components like oil seals and non driven meshed gears (as in a normal car multi speed gearbox) have frictional losses which are not affected by the input torque. These losses do increase with speed of course but at a given rpm can be taken to remain constant even if the engine is tuned to give more power. We'll look at real world transmission loss percentages later. Finally, the biggest source of loss in the entire transmission system of a car is in the tyres - they account for half or more of the total losses between the flywheel and the rollers. Each set of driven gears, i.e. the final drive gear or the particular gearbox ratio that you happen to be testing the car in, only absorbs about 1% to 2% of the engine's power.
8.3 Hub dynamometers
Hub dynamometers are starting to become more commonplace nowadays. These work by lifting the car off the ground, removing the wheels and bolting individual dyno units to the wheel hubs. The obvious effect of this on power measurements is that tyre losses are removed from the equation. The power now being measured is flywheel power minus anything lost in the gearbox, differential and driveshaft bearings. Most of these losses are proportional to flywheel power whereas it's tyre losses that tend to be speed related and less affected by input power. So we would expect, and indeed see, power figures that are close to a constant percentage of flywheel power. The Swedish Rototest Institute has been testing production cars, and a few modified ones, for several years now on a very accurately calibrated and carefully managed hub dyno system so they have a huge database of standardised tests showing how hub power and torque compare to manufacturer's claimed flywheel figures. Something over 640 tests last time I looked. They don't try and measure flywheel power, as
40/52
indeed you can't on anything other than an engine dyno, and their technical articles which are well worth reading explain why just as I'm also doing here.
Rototest Web Site
What is clear from their data is that regardless of how much flywheel bhp an engine is producing the hub figures are on average close to a constant percentage less than that. On FWD cars the hub bhp is about 93% of flywheel and RWD cars which lose a little more power because of having to turn the drive through 90 degrees show about 91% of flywheel bhp. When you see data on their site with different losses it's because the claimed manufacturer's figures are wrong, usually on the high side of course.
8.3.1 Coast Down Losses
Ok - so how do these software systems that supposedly measure transmission losses so as to "predict" back to the flywheel bhp work. The power curve at the wheels is taken in the usual way as explained above. Then, at peak rpm, the operator puts the car into neutral and lets the rollers slow down under the drag of the tyres and transmission. The software then measures this drag (or "coast down loss") as "negative" power and adds it to the wheel power to get back to the supposed flywheel power. BUT - and hopefully you've all spotted the problem now - the engine is not feeding any power into the drivetrain while the car is in neutral - in fact it isn't even connected to the drivetrain any more!! Whatever drag this is that's being measured it has nothing at all to do with the proportion of the flywheel power that gets lost as friction when the engine is powering the car in the normal way. The engine could now be an 800 bhp F1 engine or a 30 bhp mini engine for all it matters because it isn't connected to the gearbox or feeding any power into it.
Obviously this "coast down loss" is something to do with the transmission and tyres but it is not the true transmission loss - in fact this coast down loss should never be expected to change for a given car at a particular rpm regardless of how much you tune the engine whereas a true transmission loss will increase as the engine power increases because it is dependent to a large extent on the amount of power being fed into the transmission. I've seen a car that over time was tuned from 90 bhp at the wheels to 125 bhp at the wheels and the "coast down loss" stayed the same for every power run to within a fraction of a horsepower - exactly as you would have predicted. As the engine was tuned to give more power the "true" transmission losses must have also increased to some extent but these chassis dyno systems don't, and can't, show this happening. Copyright David Baker and Puma Race Engines
8.3.2 True Transmission Losses
So is there any way of really measuring the true transmission loss of a car? Yes - only one - by measuring the flywheel power on an accurate engine dyno, the wheel power on an accurate chassis dyno and taking one away from the other. There is no way on God's green earth of finding out the true transmission loss just by measuring the power at the wheels.
So hopefully that's got you all thinking a bit more now instead of just taking for granted the "flywheel" figure you were given last time you took your car to the rollers. Even worse is the fact that some of these software systems allow the operator to just programme in the % transmission loss he wants the system to add to the wheel figures. So if that isn't a nice easy way to show some big fat flywheel bhp then I don't know of a better one. It's certainly a
41/52
lot easier than actually doing some proper development work to make the engine perform better - just dial in a bigger transmission loss and bingo - the same wheel bhp now turns into a bigger flywheel bhp - happy customer, happy dyno man - just a shame it was all sleight of hand. See the end of this article if you doubt that this sort of thing really happens.
So what should you do when you take your car to a rolling road? Firstly, make sure you get printouts that show the wheel bhp and not just the flywheel bhp. Then at least you can see if they look sensible in comparison. If you have a desperate need to know the flywheel bhp then you will have to estimate it - there's no other way short of using an engine dyno.
The average front wheel drive road car with between 100 and 200 bhp loses about 15% of the engine bhp as transmission losses.
The average rear wheel drive road car with between 100 and 200 bhp loses about 17% of the engine bhp as transmission losses.
The 2% increase in losses over front wheel drive is because the differential has to turn the drive through 90 degrees at the back axle which soaks up a bit more of the engine's power. Copyright David Baker and Puma Race Engines
4wd cars will have higher losses because of the extra differentials and other power transmission components. The tyre and main gearbox losses will be the same though. Correlating the performance of vehicles with the both 4wd and 2wd options (Audi's and the Sierra Cosworth are examples) shows 4wd transmission losses to be about 5% higher than rwd. 22% seems to be a good average.
What each individual car loses is an unknown - it will depend on tyre sizes and pressure, suspension angles and other things, but it shouldn't be far from the figures above. For sure though, no 2wd car in the world, unless it has flat tyres and a gearbox full of sand, loses anything like 30% of the engine's power in the transmission and tyres as many rolling road operators would try to have you believe. In general though it is fair to say that low powered cars have higher % losses than high powered cars. This is because some of the frictional losses are independent of engine power and so represent a bigger drain on a small engine. For example, a 60 bhp Fiesta will have around 14 to 15 bhp total transmission and tyre loss (25%) whereas a 90 bhp XR2 will only have about 17 to 18 bhp loss (20%) - a smaller % obviously. By the time you get to RWD cars with engines in the 300 to 500+ bhp range, losses can eventually drop to as little as 12% to 14% or so.
8.3.3 Converting wheel bhp to flywheel bhp and vice versa
To reflect the fact that % losses are high for low powered cars and vice versa I use the following equations which have been found to correlate well with real world transmission losses.
FWD cars - add 10 bhp to the wheel figure and divide the result by 0.9
RWD cars - add 10 bhp to the wheel figure and divide the result by 0.88
4WD cars - add 10bhp to the wheel figure and divide the result by 0.84
42/52
To estimate the expected wheel bhp from a known flywheel bhp just reverse the equations
FWD - multiply flywheel power by 0.9 and then deduct a further 10 bhp
RWD - multiply flywheel power by 0.88 and then deduct a further 10 bhp
4WD - multiply flywheel power by 0.84 and then deduct a further 10 bhp
Remember, these percentages are not "gospel" - they are good realistic averages. The measured wheel bhp can change depending on tyre pressure, tyre size, suspension angles and other things which won't affect flywheel power - so the actual transmission loss % will also change. It pays to try and standardize as many of these things as possible if you intend to do a series of power runs over a period of time. Always use the same tyre pressure because this is a factor which can easily change from day to day and make sure the tracking is correct on a fwd car. Copyright David Baker and Puma Race Engines
Also please remember that the manufacturer's claimed power figures for a standard car are not gospel either. Even engines in perfect condition can vary by plus or minus 5% due to manufacturing tolerances. High mileage or poorly maintained engines can be well below the claimed output. It is no proof that a rolling road flywheel bhp estimate is correct just because it comes out as the same figure as the manufacturer's. Always compare with the measured wheel bhp to see if the transmission losses agree with the data above.
8.4 Dyno comparisons
Imagine we take a car with a true 200 flywheel bhp engine to each of the various types of dyno. Assuming accurate dynos which is by no means always the case and calibration standards can be very lax then we would expect to see the following results.
FWD
Engine dyno - 200 bhp
Hub Dyno - 200 x 0.93 = 186 bhp
Wheel dyno - (200 x 0.9) - 10 = 170 bhp
RWD
Engine dyno - 200 bhp
Hub dyno - 200 x 0.91 = 182 bhp
Wheel dyno - (200 x 0.88) - 10 = 166 bhp
8.5 Tyre Pressure
Some time ago I had three almost identical race cars set up together in a group session at a rolling road. The engines were very similar except for minor differences in the camshafts fitted. One showed 118 bhp at the wheels, another showed 124 and the third showed only 98.
43/52
The operator spent ages I'm told (I wasn't there) trying to find why the third car was so poor. It wasn't till the next day when that particular owner was checking things before the race that he noticed that the tyres only had 7 psi in them - the car had sat unchecked over the winter and no-one had bothered to standardize the pressures before the dyno test. In the race, that car went just as well as the other two and if anything was slightly the fastest of the three. That gives you some idea of how much power a set of flat tyres can absorb.
As you tune a particular car, the losses won't increase exactly in proportion to the power because as mentioned above, some components in the transmission have fixed losses which are not dependent on engine power. However, neither you nor the dyno operator will have any real idea of exactly how the losses have changed so you might as well just continue to apply the percentages above to give some sort of realistic guide to the new flywheel bhp. Copyright David Baker and Puma Race Engines
What sort of % transmission loss do these software systems show? - well for normal road cars in the 100 to 200 bhp category, I've seen as high as 35% and as low as 10%. So take the same car with 100 bhp at the wheels to 2 different rollers and you might get anything from 110 bhp to 140 bhp being "predicted" as the flywheel figure. In reality 100 bhp at the wheels will be no more than about 120 bhp at the flywheel. If being told a bigger figure makes you happy then good for you - the car won't go any faster and you'll be no nearer to knowing whether you really got more power out of it than standard.
Another good way of bumping up the power figures on rolling road tests, as mentioned above under engine dynos, is by "playing about" with the air temperature and pressure corrections . If you dial in your own "standard" conditions as being freezing cold with the barometer going off the scale, or you put the temperature probe near the engine, you can get the system to add huge amounts of power to what was actually measured. So make sure you know if such corrections were made or not and to what standards they were made if any. Plenty of rollers still just quote the measured figure because they don't have computer systems to do the calculations.
Hopefully it should be apparent that 100 bhp is not just 100 bhp and end of story. It depends how it was measured, where it was measured, what corrections were applied and of course whether the dyno was even accurate in the first place. So I don't get too excited anymore when I see other people quote huge power outputs for their engine mods. If my engines still beat their ones on the track then they can quote whatever power figure they like. As the saying goes - "when the flag drops, the bullshit stops". Copyright David Baker and Puma Race Engines
Finally, the best rolling road con I've heard of to date is from a friend (before I knew him I hasten to add) who took his VW Passat to a well known VW specialist in the Oxford area for one of their proprietary "air box mods" which they said would give an extra 10 bhp. Sure enough he came away with a lighter wallet and a printout which showed 10 bhp more at the flywheel. It wasn't until you examined the printout carefully though, that it became apparent that the power at the wheels had dropped from 125 to 120 but the "coast down losses" had gone up by 15 bhp to give a net 10 bhp extra "predicted power" at the flywheel. The car, he says, felt slightly slower, which of course it was - by 5 bhp and that's a poor way to spend your hard earned money. Exactly how they fiddled the rollers to show such a hugely increased "coast down loss" I'll leave you all to speculate on.
44/52
The moral of the story is clear - if you don't know the power at the wheels you don't know diddly-squat - so as the man in Hill St Blues used to say - "be careful out there folks".
Here's a very good article by a Canadian tuning company on dynos and transmission losses - SDS dyno article - their main tech page has lots of other good stuff too and you'll see a link to it back on my mainmenu page.
9 Summary
The "coast down loss" which some rolling roads add to the measured wheel bhp is not an accurate estimate of real transmission and tyre losses and will not give a reliable measure of flywheel bhp except by coincidence in some cases. Copyright David Baker and Puma Race Engines
Average real transmission and tyre losses are about 10% of the flywheel power plus 10bhp for FWD cars and 12% plus 10bhp for RWD cars. This equates to about 15% to 17% for cars of "average" power output.
VW technical also quote their cars as losing, on average, about 15% of the flywheel power in the transmission and tyres.
The chassis dyno division of Bosch UK also suggest 15% as being a realistic estimate of transmission losses.
Hub dynos will show a fairly constant percentage loss of flywheel bhp regardless of engine size or power of about 7% for fwd cars and 9% for rwd ones.
Be wary of "correction" factors for temperature and pressure which are often used to PUMA RACE ENGINES - POWER AND TORQUE - 2
We've seen in the previous article how torque and power are defined and calculated - now let's look more closely at how they relate to engine design. The concept of an engine's torque output seems to be confusing to many people judging by newsgroup threads but it needs to be clearly understood if one is to design the best ways to improve power output.
Torque can be thought of as the instantaneous turning force generated at the crankshaft. As such it is a measure of the amount of energy being developed in the engine during EACH operating cycle - in other words a function of the amount of air/fuel mixture being burned per cycle. Copyright David Baker and Puma Race Engines
Power can be thought of as a measure of the amount of energy being developed in the engine per minute - in other words a function of the amount of air/fuel mixture being burned per cycle multiplied by the number of cycles per minute. So power is torque times speed as we have already seen.
To increase torque we need to either process more air/fuel mixture per cycle or extract more energy from the air/fuel that is processed. We can do the latter in a variety of ways including:
45/52
1. Improving mechanical efficiency with attention to design of such things as bearings, piston rings etc.
2. Increasing compression ratio which extracts more energy from the mixture being burned.
3. Optimising fueling and ignition timing. We'll look at the above another time - for now lets concentrate on getting more air/fuel mixture into the engine.
We can simplify even further by leaving out the fuel part of "air/fuel" mixture as this is really a calibration issue and falls under 3) above. It is increasing the air consumption that is the real problem and in fact it is not a bad idea to think of an engine as an air pump. The better we can make this pump work the more torque and power we can generate. Our problem of increasing torque output has now ended up as a problem of getting more air into the engine each cycle. There are only 2 ways to do this:
1) To increase the engine size. This is not always an option or at least not always a cost effective option. We may be running in a racing class where the engine size is limited or we may own an engine where parts such as longer stroke crankshafts or bigger pistons are expensive. As a general rule though, a bigger cylinder will process more air per cycle than a smaller one unless limited by other factors.
2) To increase the filling efficiency of the cylinders - i.e. to increase "Volumetric Efficiency". If a cylinder is 500cc in volume but processes only 400cc of air each cycle we can say that the volumetric efficiency is 80%. In fact to be absolutely correct it is normal to express VE in terms of mass of air not volume but that is getting more complicated than is needed for now. To get into the cylinder, the air has to pass through the carb or injection system, the inlet manifold and finally through the port and valve. The more restrictive to flow each of these components is, the harder it is for the air to get through them. By testing each of these items on a flow bench and modifying them to increase their flow capacity we can allow the air an easier passage into the cylinder and this will increase not only VE and therefore torque but also allow the engine to run at higher speeds and increase peak horsepower. Copyright David Baker and Puma Race Engines
In fact the ultimate horsepower potential of any engine is really a function of the flow capacity of the induction system. By just increasing engine size, say with a longer stroke crank, we will increase torque at low rpm but not necessarily increase peak horsepower by much at all. The flow capacity of the induction system imposes the ultimate limit on the amount of air that the engine can process per minute and whether we have a small engine running at high speed or a big engine running at low speed, it is total airflow per minute that matters. The only real difference between a 3 litre car engine producing 200 bhp and a 3 litre Formula 1 engine producing 800 bhp is the flow capacity of the cylinder head.
We can also increase airflow per cycle by opening the valves for longer or to a higher lift. This has its downside though because long duration camshafts don't work well at low engine speeds and while this might be ok for a race engine it is not what we want for a road engine. Increasing the airflow capacity of the induction system has very little downside although there can still be minor adverse effects on low speed performance. As a general rule it is much better to have a high flow induction system and be able to use a short duration camshaft to achieve the desired horsepower than vice versa. The most restrictive part of the induction system and therefore the part that often shows the greatest benefits from being improved is the cylinder head. In fact the flow efficiency of the cylinder head is the key to

46/52
good engine design and is the reason why modern engines are increasingly being designed with 4 or more valves per cylinder rather than 2. More valves mean more valve area and it is valve area that limits flow. Cylinder head design merits its own section and we'll discuss it in detail in other articles.
To conclude our look at torque and power let's see what sort of figures engines actually produce. The charts below show the manufacturers quoted outputs for a variety of road engines.
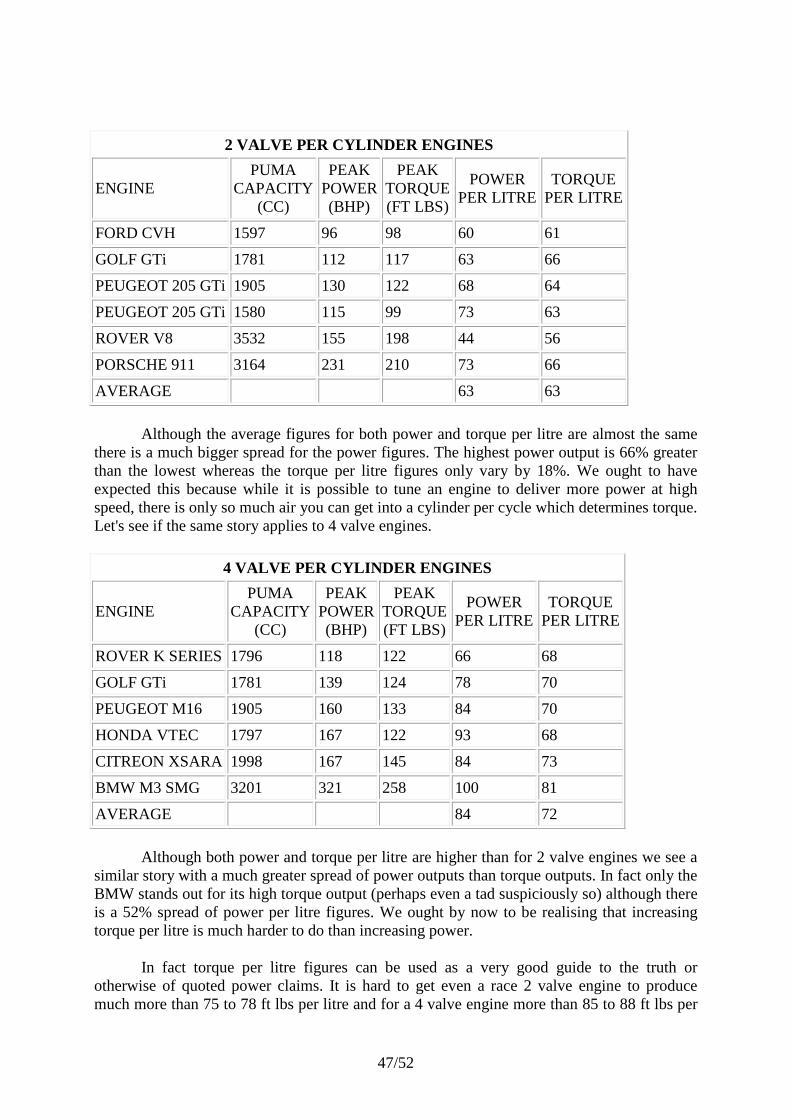
47/52
2 VALVE PER CYLINDER ENGINES
ENGINE PUMA
CAPACITY (CC)
PEAK POWER (BHP)
PEAK TORQUE (FT LBS)
POWER PER LITRE
TORQUE PER LITRE
FORD CVH 1597 96 98 60 61
GOLF GTi 1781 112 117 63 66
PEUGEOT 205 GTi 1905 130 122 68 64
PEUGEOT 205 GTi 1580 115 99 73 63
ROVER V8 3532 155 198 44 56
PORSCHE 911 3164 231 210 73 66
AVERAGE 63 63
Although the average figures for both power and torque per litre are almost the same there is a much bigger spread for the power figures. The highest power output is 66% greater than the lowest whereas the torque per litre figures only vary by 18%. We ought to have expected this because while it is possible to tune an engine to deliver more power at high speed, there is only so much air you can get into a cylinder per cycle which determines torque. Let's see if the same story applies to 4 valve engines.
4 VALVE PER CYLINDER ENGINES
ENGINE PUMA
CAPACITY (CC)
PEAK POWER (BHP)
PEAK TORQUE (FT LBS)
POWER PER LITRE
TORQUE PER LITRE
ROVER K SERIES 1796 118 122 66 68
GOLF GTi 1781 139 124 78 70
PEUGEOT M16 1905 160 133 84 70
HONDA VTEC 1797 167 122 93 68
CITREON XSARA 1998 167 145 84 73
BMW M3 SMG 3201 321 258 100 81
AVERAGE 84 72
Although both power and torque per litre are higher than for 2 valve engines we see a similar story with a much greater spread of power outputs than torque outputs. In fact only the BMW stands out for its high torque output (perhaps even a tad suspiciously so) although there is a 52% spread of power per litre figures. We ought by now to be realising that increasing torque per litre is much harder to do than increasing power.
In fact torque per litre figures can be used as a very good guide to the truth or otherwise of quoted power claims. It is hard to get even a race 2 valve engine to produce much more than 75 to 78 ft lbs per litre and for a 4 valve engine more than 85 to 88 ft lbs per
48/52
litre. For big budget engines where a lot of time and money has been spent on dyno testing of inlet and exhaust manifold lengths and diameters then of course it is possible to push the limits higher. With well developed cylinder heads, good inductions systems (i.e. sidedraft carbs or even better, multi butterfly throttle body systems) and efficient full race camshafts it is possible to modify small bore road car engines into race ones producing around 80 ft lbs per litre for 2 valve designs and low 90s ft lbs per litre for 4 valve designs. You'll very rarely see figures that high though unless serious development work has been done. Obviously it's much easier to get high torque and power outputs if the starting point is a custom designed big bore small stroke racing engine with lots of valve area rather than a small bore long stroke road car one. The general tuning article looks at power and torque targets for modified road car engines in more detail. Copyright David Baker and Puma Race Engines
It is possible to increase peak torque even further by selecting the intake and exhaust lengths to "pulse tune" the engine most efficiently at peak torque rpm. This will reduce peak power though and as maximising power is the primary goal for a competition engine this strategy is not normally of any use. Occasionally there are race series where the engines have to abide by an rpm limit which is lower than that at which they could otherwise produce best power. In such cases the engines will be tuned to maximize output at the limited rpm which can lead to torque/litre figures approaching 100 ft/lbs per litre. The reduction in peak power this creates is of no consequence if the engine is not allowed to rev that high. Such torque figures should not be used as a guide to what is possible from conventional best tuning on a non rev limited engine though. I have still to come across reliable data for any engine producing more than about 93 to 94 ft/lbs per litre where ultimate power was the aim - except of course for unreliable estimated "flywheel" power and torque figures derived from rolling road wheel bhp measurements in which case the sky is the limit. I once saw a rolling road power curve where peak torque was supposedly 120 ft/lbs per litre from a 4 valve engine of fairly uninspiring design. Even the operator finally admitted something didn't look right when we went through the maths together. The conclusion was that there had been massive wheelspin during that power run and none of the figures generated were of any use at all.
When you see power claims that look suspicious, calculate the torque values using the formulae in the previous article. If you see peak torque values higher than those suggested above then I suggest you start to get, if not suspicious, then at least very analytical. Modern motorbike engines are quite similar to custom race car engines in terms of them being short stroke, 4 valve etc and although I have no data to hand I think it would be interesting to see the sort of torque per litre figures being claimed for them given that they achieve well over 100 bhp per litre. If anyone wants to summarize some power specs for me I would be grateful. Copyright David Baker and Puma Race Engines
You might think that it is only possible to get 100% Volumetric Efficiency from an engine - after all when a cylinder is full of air at atmospheric pressure surely that is the end of the story. What this fails to take into account though is what is called "Pulse Tuning" which is taking advantage of the pressure waves which exist in the induction and exhaust system. These pressure pulses can actually ram air into the cylinder to achieve up to 130% VE although it takes very carefully designed pipe lengths and diameters to achieve this and the effect only works over fairly narrow rpm bands - usually with a corresponding adverse effect somewhere else in the rpm range. We can see by now that there is a close relationship between VE and torque per litre and it might be reasonable to ask if it is possible to calculate one from the other. Well the full answer is no because the torque achieved also depends on burn efficiency, mechanical efficiency and other things. A rough guide though is that if you
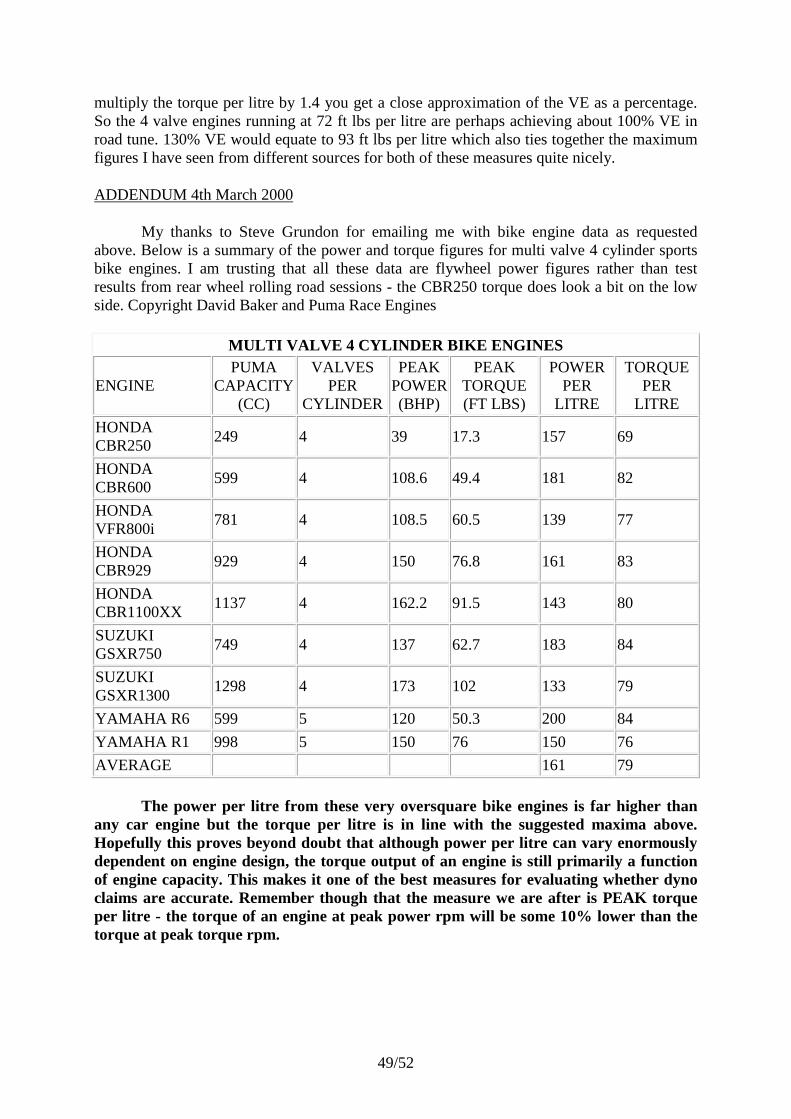
49/52
multiply the torque per litre by 1.4 you get a close approximation of the VE as a percentage. So the 4 valve engines running at 72 ft lbs per litre are perhaps achieving about 100% VE in road tune. 130% VE would equate to 93 ft lbs per litre which also ties together the maximum figures I have seen from different sources for both of these measures quite nicely.
ADDENDUM 4th March 2000
My thanks to Steve Grundon for emailing me with bike engine data as requested above. Below is a summary of the power and torque figures for multi valve 4 cylinder sports bike engines. I am trusting that all these data are flywheel power figures rather than test results from rear wheel rolling road sessions - the CBR250 torque does look a bit on the low side. Copyright David Baker and Puma Race Engines
MULTI VALVE 4 CYLINDER BIKE ENGINES
ENGINE PUMA
CAPACITY (CC)
VALVES PER
CYLINDER
PEAK POWER (BHP)
PEAK TORQUE (FT LBS)
POWER PER
LITRE
TORQUE PER
LITRE
HONDA CBR250
249 4 39 17.3 157 69
HONDA CBR600
599 4 108.6 49.4 181 82
HONDA VFR800i
781 4 108.5 60.5 139 77
HONDA CBR929
929 4 150 76.8 161 83
HONDA CBR1100XX
1137 4 162.2 91.5 143 80
SUZUKI GSXR750
749 4 137 62.7 183 84
SUZUKI GSXR1300
1298 4 173 102 133 79
YAMAHA R6 599 5 120 50.3 200 84
YAMAHA R1 998 5 150 76 150 76
AVERAGE 161 79
The power per litre from these very oversquare bike engines is far higher than
any car engine but the torque per litre is in line with the suggested maxima above. Hopefully this proves beyond doubt that although power per litre can vary enormously dependent on engine design, the torque output of an engine is still primarily a function of engine capacity. This makes it one of the best measures for evaluating whether dyno claims are accurate. Remember though that the measure we are after is PEAK torque per litre - the torque of an engine at peak power rpm will be some 10% lower than the torque at peak torque rpm.
50/52
10 PUMA RACE ENGINES - CONTACT DETAILS
Before clicking on the link below please read this because it might save you some typing. Despite the paragraph below I still keep receiving emails asking for help with cars that aren't running right. I build engines - I don't service, tune or get involved in any way with vehicle electrics, fuel injection or any other aspect of general maintenance. I used to try and answer every email but time no longer allows that. Apologies in advance but emails asking for general car advice or tuning advice where it's clear you don't actually want to buy anything will not get answered so please post them to the car newsgroups. I also do not have time to enter into detailed correspondence with people wanting further discussion about technical issues of the type covered on my site. I am happy to receive brief suggestions for further articles but whether they get written or not depends on my spare time.
A fair proportion of emails are from people who say they have just read the tuning article relevant to their engine and then ask for prices and power outputs for head work or something else similar like cam choice that is already covered in detail in the article! One of the reasons for putting so much information in the articles was to save having to type it all out dozens of times a month for everyone who emails so if you fall at this first simple hurdle your email isn't going to get answered - sorry.
EMAILS
Please note before you email that I'm only taking enquiries when so listed on the main page. I can't deal with emails at other times.
Email address - David Baker @ [email protected]
Please use an email title with the engine type or product/service you are enquiring about. Untitled or vaguely titled emails tend to get lost in amongst the reams of spam that invade my post box every day and are likely to get deleted. They are also much more difficult to find again later in amongst the thousands of documents in my email filing cabinet. Emails as enclosures are usually spam or contain something nasty so if your mail system does that rather than use straight html and there isn't a title which makes it obvious it's a genuine enquiry I won't open them. I try to deal with emails in my spare time in the evenings from Monday to Thursday. Emails received at a weekend or on a Friday probably won't get dealt with until the following Monday night. When I'm very busy or flooded with emails it may take longer to reply. Anything that starts "Hi Mate" or "pal" gets deleted before it gets read.
PAYMENTS
Please make cheques payable to D. Baker and NOT to Puma Race Engines or any other variant on that theme. I am looking into the possibility of taking credit card payments or maybe Paypal but the high charges levied by the credit card companies to small businesses (3% to 4%) don't make this cost effective at present. Cheques take at least a week to reach me and clear so please allow at least 14 days to get parts paid for that way. A bank transfer is quicker.
Online Bank Transfer
51/52
This is the easiest way to pay in the UK. Saves me a trip to the bank and the time it takes for a cheque to clear. Payments can be made to:
HSBC Bank, 31 St Peter's Court, High Street, Chalfont St Peter, Buckinghamshire, SL9 9QQ.
Account name: David R Baker Bank Sort Code: 401769 Account Number: 81156284
International Bank Account Number (IBAN): GB32MIDL40176981156284
When making international transfers to me into pounds sterling please ensure you specify to pay all bank charges that the transfer incurs including those levied at the receiving end. This seems to be free at my end from europe but can be up to £8 from other parts of the world.
Transfers from another branch of HSBC clear immediately and from other banks in about 3 days.
ADDRESS
Feb 2007. I'm moving workshop at the moment so I'll notify the current delivery address for parts and/or mail as needed.
If you are sending a letter/cheque for items ordered please include an email address with the letter in case I need to get in touch. The fact that you may well have emailed an enquiry only recently won't help me because I'll never find it if it's more than a day or two old and already buried under hundreds of other emails.
There isn't much point paying a lot of money to send items (flywheels, cylinder heads etc) to me on a next day or special delivery service. All that happens is they'll arrive before I'm up in the morning, the courier leaves a card through the door and I then have to drive into the post office or arrange another delivery later in the week. In fact the extra cost pretty much guarantees a later delivery than normal post.
10.1 Terms Of Business
50% deposit in advance for cylinder head work. Deposit as advised for engine build work depending on materials/labour content. Full payment in advance for items ordered by post. For all jobs, cheque or bank transfer to clear before despatch for the balance due or cash on collection.
I charge for extra time spent on jobs answering emails asking me for advice on matters over and above those things covered in the agreed price. Some customers agree a price and specification and then leave me alone to get on with things until the job is finished. Others

52/52
bombard me with emails asking for advice on every other aspect of the car and engine you could possibly imagine. Every hour I spend dealing with emails is an hour I'm not in the workshop earning a living so from now on I charge for my time spent answering anything that isn't strictly necessary for completion of the agreed job. Time spent on emails will therefore be charged at the prevailing workshop rate (currently £50 per hour, September 2005, and subject to change without notice) subject to a minimum charge of £10 per email answered. Interest will be charged on overdue balances and storage fees may be charged on items not collected after completion of work.
Please note: I do not have any facilities for working on cars - this is strictly an engine/cylinder head workshop. Engines need to be removed and refitted by the customer or their agent and delivered to me.