pumping test analysis with a handheld calculator
TRANSCRIPT


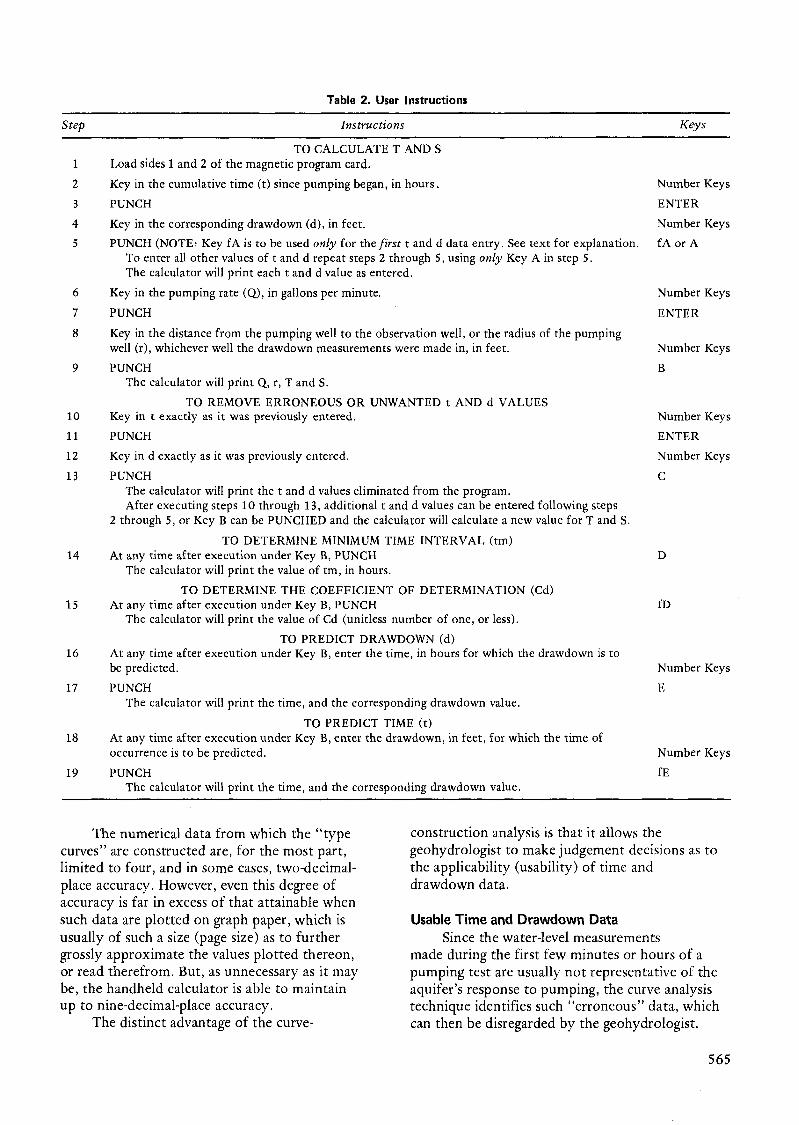


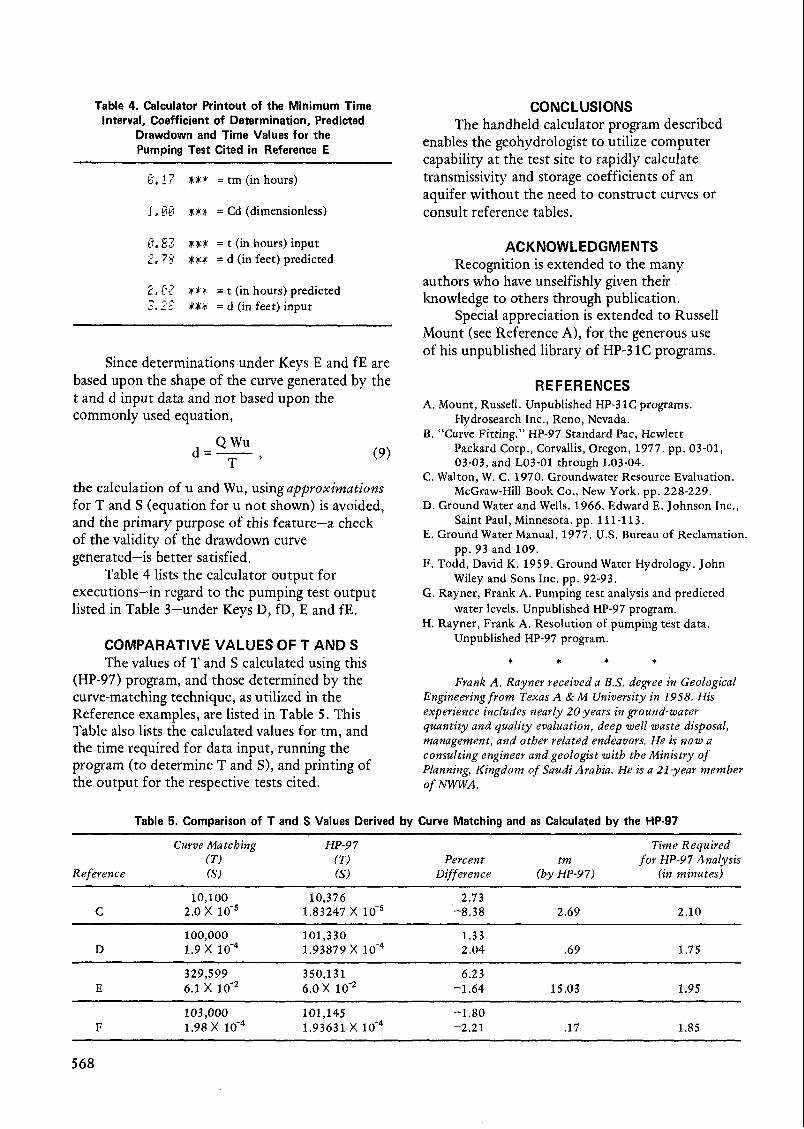
Table 4. Calculator Printout of the Minimum Time Interval, Coefficient of Determination, Predicted
Drawdown and Time Values for the Pumping Test Cited in Reference E
8, 17 W t = tm (in hours)
f , fi6 f$ij = Cd (dimensionless)
0. e3 .3 7 I 3 i
2, fi? .rP$ = t (in hours) predicted 3 . LC .W+ = d (in feet) input
wx.+: = t (in hours) input #I#: = d (in feet) predicted
7 .- .-
Since determinations under Keys E and fE are based upon the shape of the curve generated by the t and d input data and not based upon the commonly used equation,
( 9 )
the calculation of u and Wu, using approximations for T and S (equation for u not shown) is avoided, and the primary purpose of this feature-a check of the validity of the drawdown curve generated-is better satisfied.
Table 4 lists the calculator output for executions-in regard to the pumping test output listed in Table 3-under Keys D, fD, E and fE.
COMPARATIVE VALUES OF T AND S The values of T and S calculated using this
(HP-97) program, and those determined by the curve-matching technique, as utilized in the Reference examples, are listed in Table 5 . This Table also lists the calculated values for tm, and the time required for data input, running the program (to determine T and S), and printing of the output for the respective tests cited.
CONCLUSIONS The handheld calculator program described
enables the geohydrologist to utilize computer capability at the test site to rapidly calculate transmissivity and storage coefficients of an aquifer without the need to construct curves or consult reference tables.
ACKNOWLEDGMENTS Recognition is extended to the many
authors who have unselfishly given their knowledge to others through publication.
Special appreciation is extended to Russell Mount (see Reference A), for the generous use of his unpublished library of HP-3 1C programs.
REFERENCES A. Mount, Russell. Unpublished HP-3 1C programs.
Hydrosearch Inc., Reno, Nevada. B. “Curve Fitting.” HP-97 Standard Pac, Hewlett
Packard Corp., Corvallis, Oregon, 1977. pp. 03-01, 03-03, and L03-01 through L03-04.
C. Walton, W. C. 1970. Groundwater Resource Evaluation. McGraw-Hill Book Co., New York. pp. 228-229.
D. Ground Water and Wells. 1966. Edward E. Johnson Inc., Saint Paul, Minnesota. pp. 111-113.
E. Ground Water Manual. 1977. U.S. Bureau of Reclamation. pp. 93 and 109.
F. Todd, David K. 1959. Ground Water Hydrology. John Wiley and Sons Inc. pp. 92-93.
G. Rayner, Frank A. Pumping test analysis and predicted water levels. Unpublished HP-97 program.
H. Rayner, Frank A. Resolution of pumping test data. Unpublished HP-97 program.
* * * * Frank A . Rayner received a B.S. degree in Geological
Engineering f r o m Texas A & M University in 1958. His experience includes nearly 20 years in ground-water quantity and quality evaluation, deep well waste disposal, management, and athe? related endeavors. He is now a consulting engineer and geologist with the Ministry of Planning, Kingdom of Saudi Arabia. He is a 21-year member of NWWA.
Table 5. Comparison of T and S Values Derived by Curve Matching and as Calculated by the HP-97
Curve Matching HP-9 7 Time Required (T) ( T ) Percent tm f o r HP-97 Analysis
Reference ( S ) (S) Difference (by HP-97) (in minutes)
10,100 10,376 2.73 C 2.0 x 1.83247 X lo-’ -8.38 2.69 2.10
~ ~
100,000 101,330 1 .33 D 1.9 x 1.93879 X lob4 2.04 .69
-
1.75 ~~~~
329,599 350,13 1 E 6.1 x lo-’ 6 .0x
~ ~~ - ~- ~
6.23 -1.64 15.03
~
1.95
103,000 101,145 -1.80 F 1.98 x 1.93631 X -2.21 .17 1.85
568