pure water san diego: surface water augmentation water san diego: surface water augmentation 2015...
TRANSCRIPT

Pure Water San Diego: Surface Water Augmentation2015 Clarke Prize Conference
October 30, 2015
contributors, acknowledgments
Water Quality Solutions Inc Imad Hannoun
Trussell Technologies Inc Rhodes Trussell, Shane Trussell, Brian Pecson
Flow Science Inc John List, Susan Paulson, Li Ding
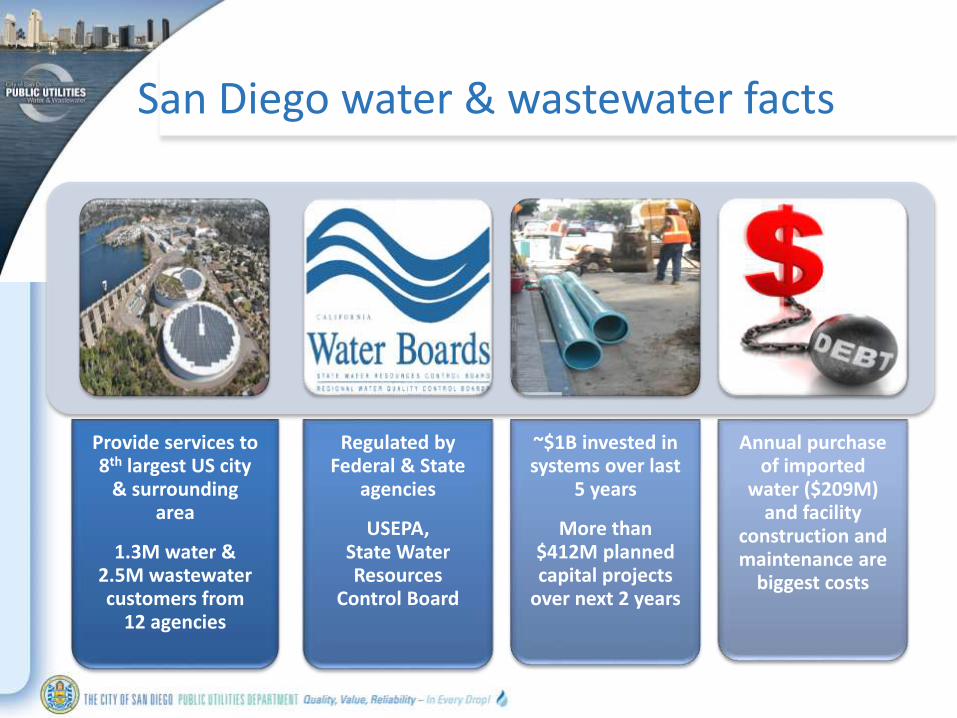
San Diego water & wastewater facts
Provide services to 8th largest US city
& surrounding area
1.3M water & 2.5M wastewater customers from
12 agencies
Regulated by Federal & State
agencies
USEPA, State Water Resources
Control Board
~$1B invested in systems over last
5 years
More than $412M planned capital projects
over next 2 years
Annual purchase of imported
water ($209M) and facility
construction and maintenance are
biggest costs

Two hundred years ago:San Diego Mission Dam and Flume


A century ago: big dams for San Diego
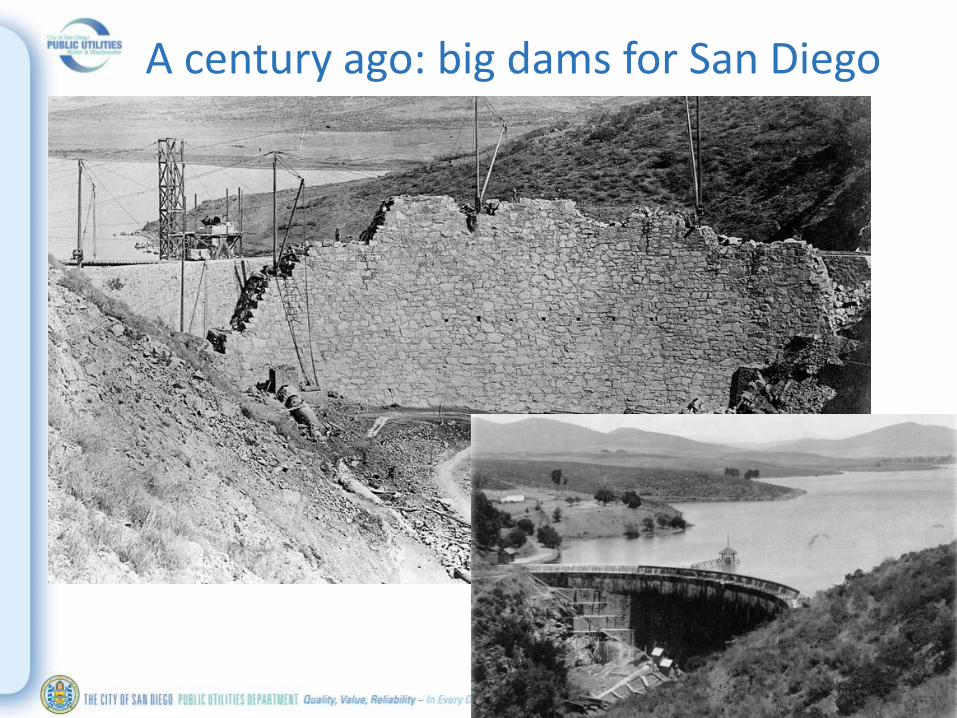
A century ago: big dams for San Diego

A decade ago: ag to urban transfers
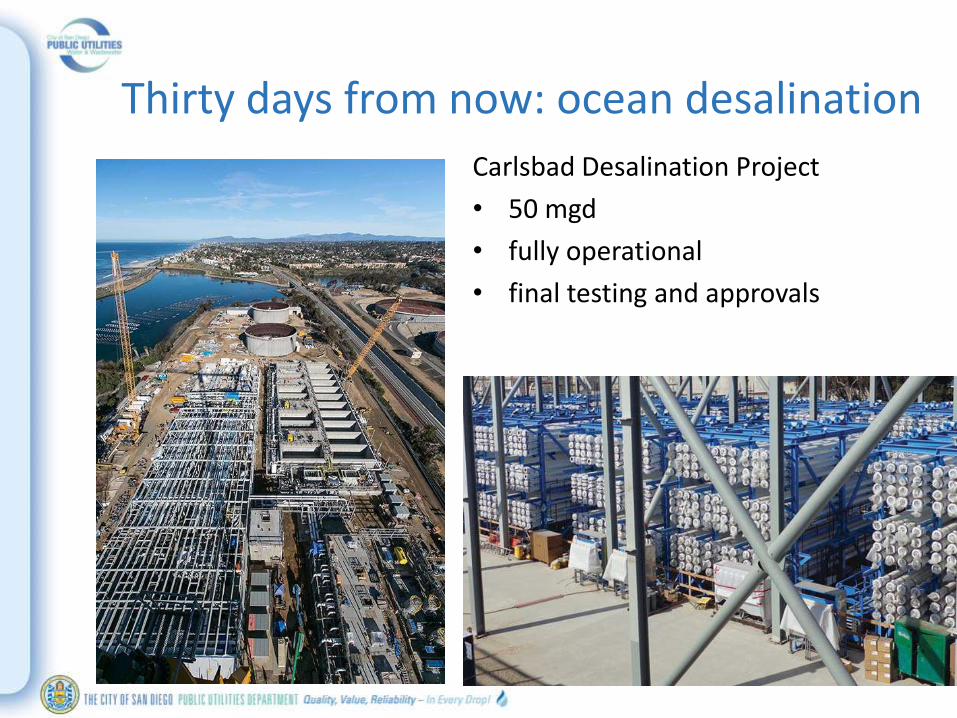
Thirty days from now: ocean desalination
Carlsbad Desalination Project
• 50 mgd
• fully operational
• final testing and approvals

San Diego is downstream
San DiegoSan Diego
SAN DIEGO IS
DOWNSTREAM
SAN DIEGANS ARE
CRANKY ABOUT
WATER
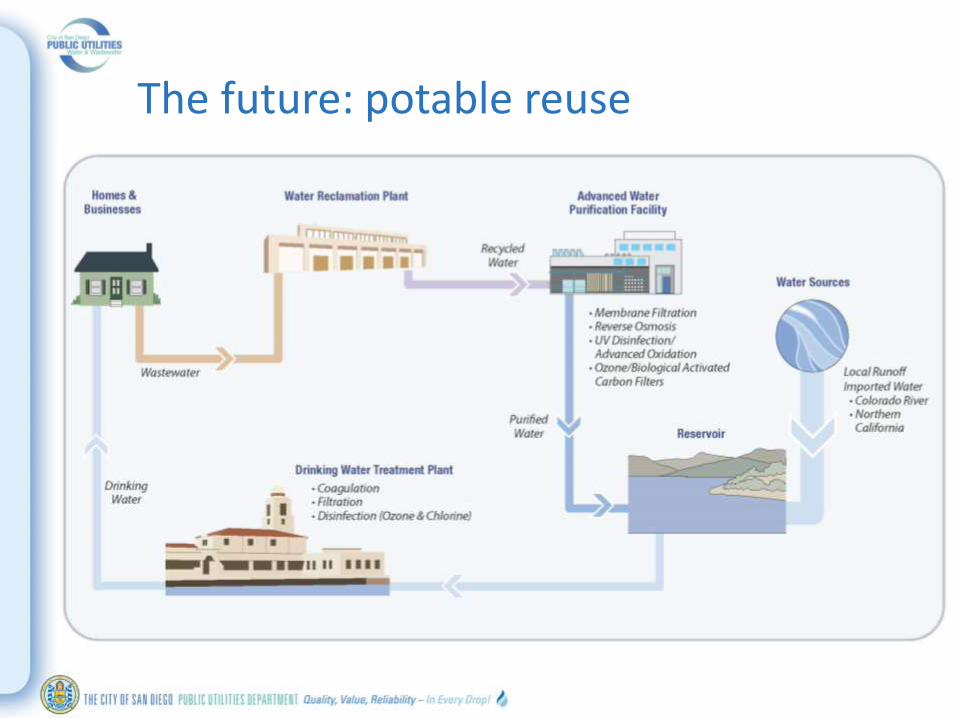
The future: potable reuse
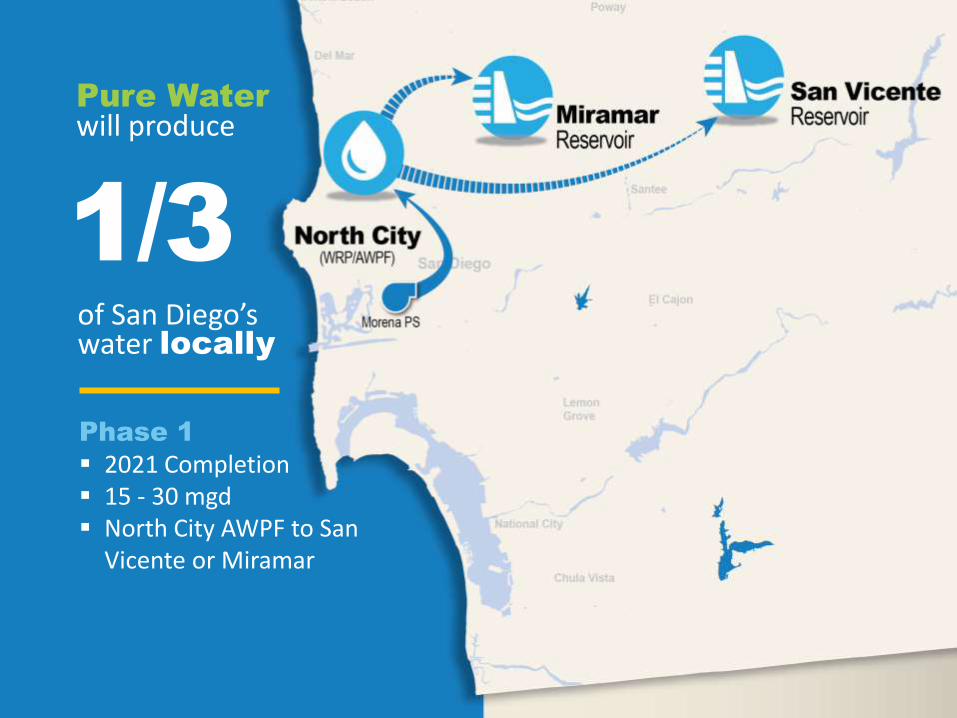
1/3
Pure Water
will produce
Phase 1
2021 Completion 15 - 30 mgd North City AWPF to San
Vicente or Miramar
of San Diego’swater locally
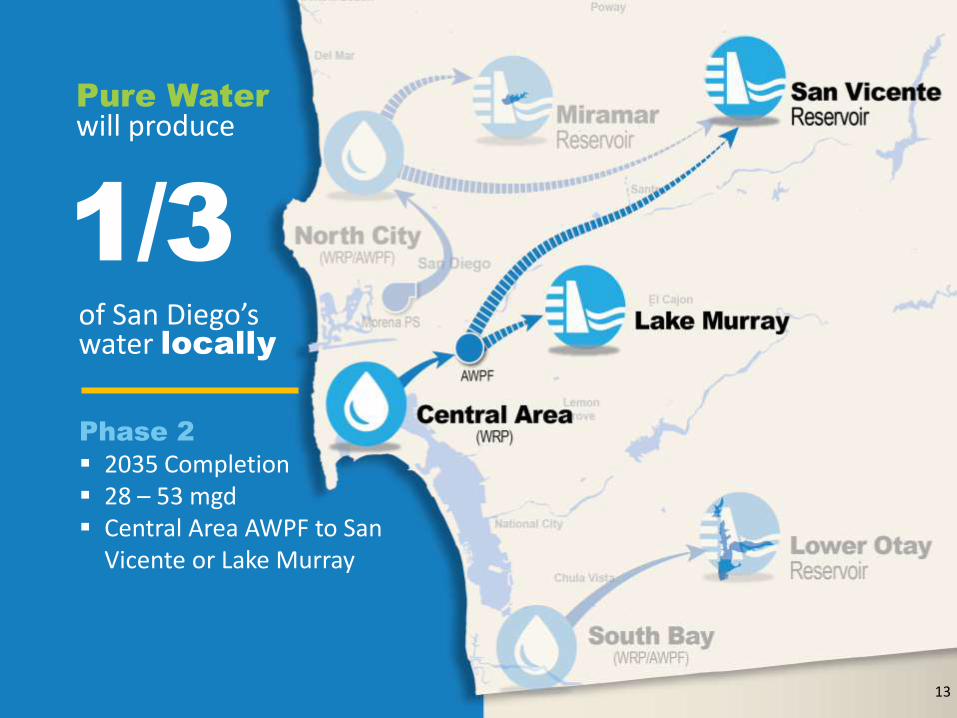
Phase 2
2035 Completion 28 – 53 mgd Central Area AWPF to San
Vicente or Lake Murray
1/3
Pure Water
will produce
of San Diego’swater locally
13

Phase 3
(as needed)
2035 Completion 0 - 15 mgd South Bay AWPF to Otay
Pure Water
will produce
1/3of San Diego’swater locally
14
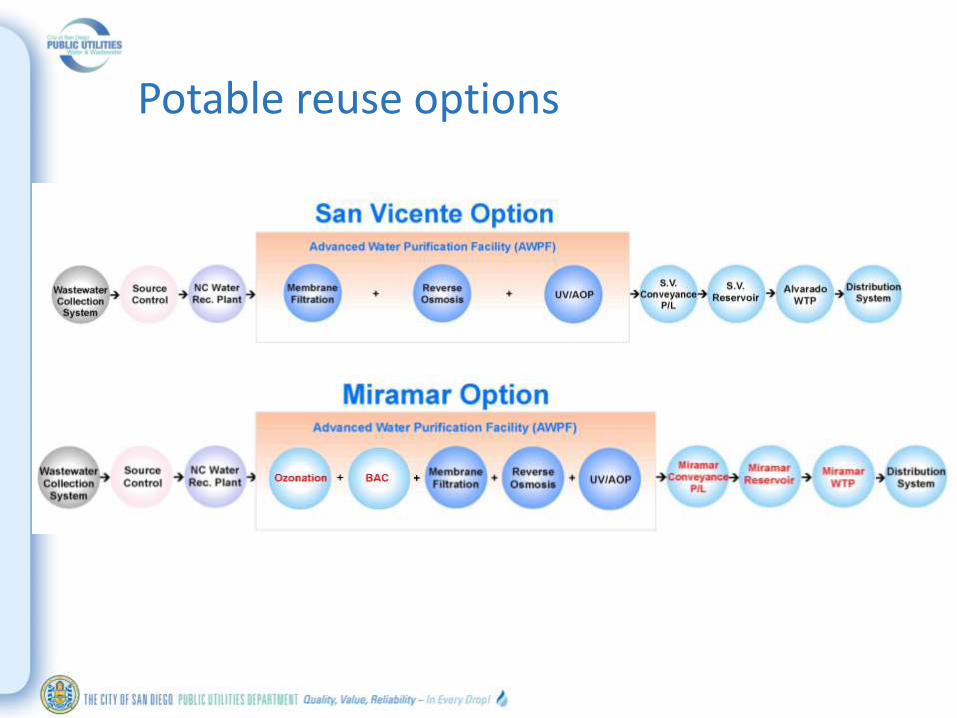
Potable reuse options

The role of the reservoir in a potable reuse project
The reservoir serves as an environmental buffer that provides:
• Time to respond to a treatment failure at the Advanced Water Purification Facility
• Attenuation of pathogens introduced with purified water
– Dilution
– Inactivation [aka “die off”]
• Mitigation of chemical toxins, through dilution
17
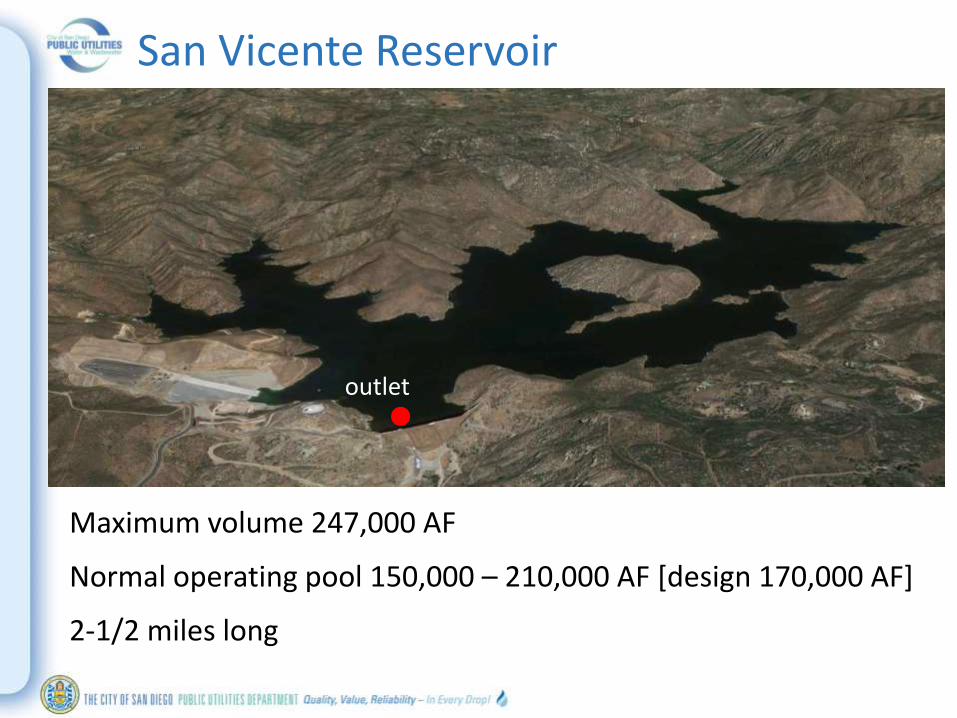
San Vicente Reservoir
Maximum volume 247,000 AF
Normal operating pool 150,000 – 210,000 AF [design 170,000 AF]
2-1/2 miles long
outlet
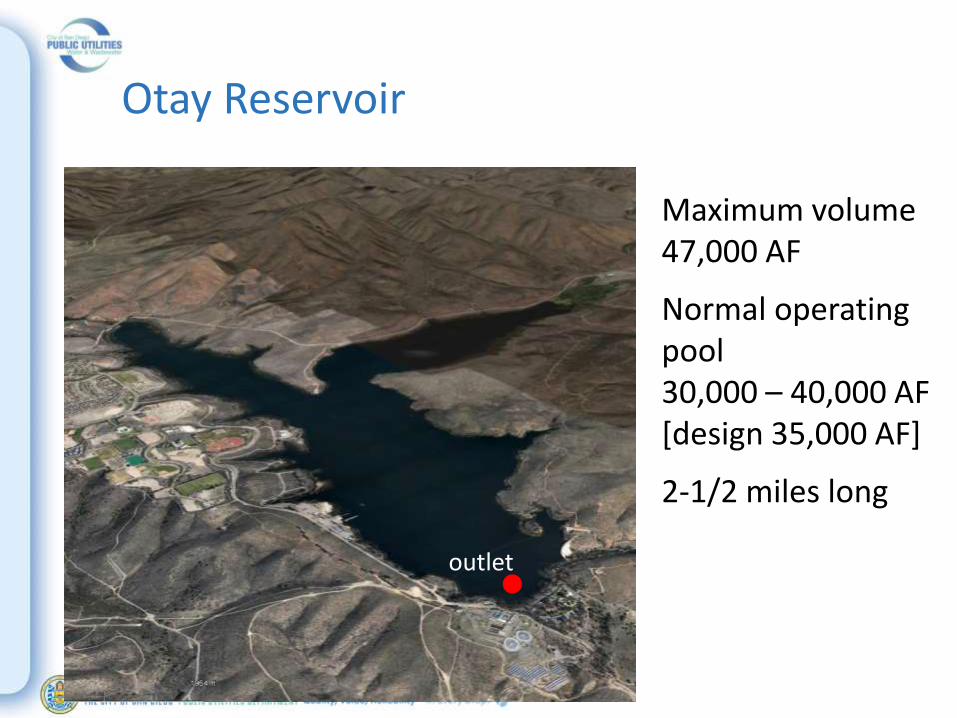
Otay Reservoir
Maximum volume 47,000 AF
Normal operating pool 30,000 – 40,000 AF [design 35,000 AF]
2-1/2 miles long
outlet

Miramar Reservoir
Maximum volume 7,200 AF
Normal operating pool 5,500 – 6,200 AF [design 5,800 AF]
1 mile longoutlet
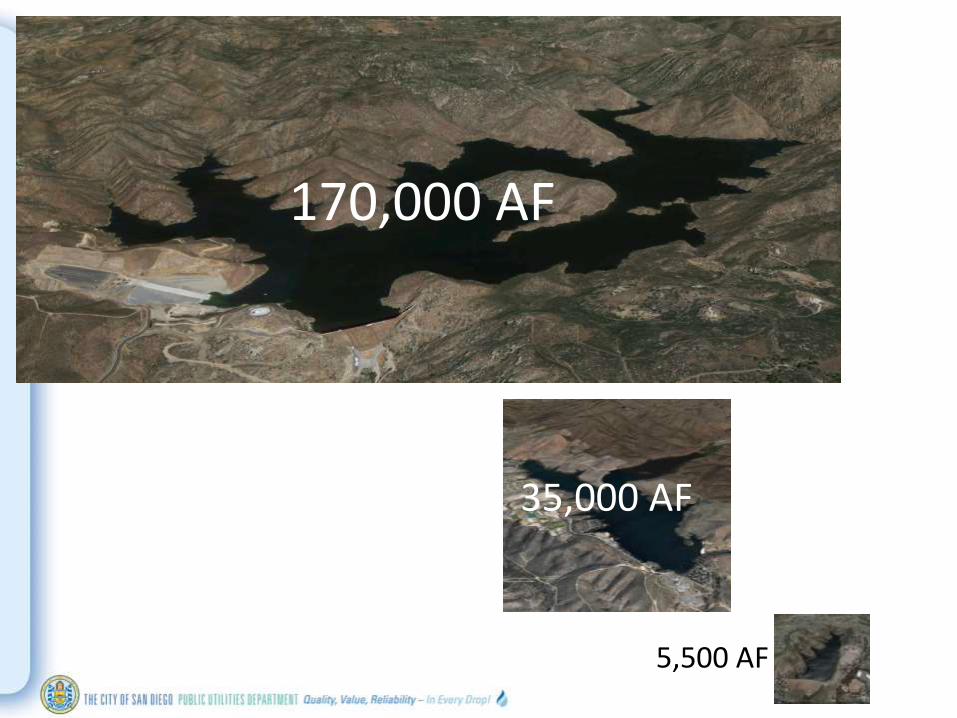
170,000 AF
35,000 AF
5,500 AF

State Water Board [DDW] draft regulationsfor surface water augmentation
1a] 1% (100:1) dilution of any 24 hour inflow of purified water, measured at the outlet
or
1b] 10% (10:1) dilution any 24 hour inflow of purified water, measured at the outlet, plus an independent treatment step providing one additional log-reduction of virus, Cryptosporidium, and Giardia
and
2] six month theoretical retention time
NWRI (2015). Final Panel Meeting Report #5: Surface Water Augmentation – IPR Criteria Review. Based on an Expert Panel Meeting Held June 2-3, 2015

Study approach for San Diego reservoirs:
three-dimensional hydrodynamic model
23
ELCOM (Estuary, Lake and Coastal Ocean Model)
CAEDYM (Computational Aquatic Ecosystem Dynamic Model)

Model inputs
model grid
inflow & outflow rates
inflow & outflow water quality
temperature
salinity
nutrients
algae (chlorophyll)
pH
dissolved oxygen
meteorological data
wind speed
wind direction
solar radiation
air temperature
relative humidity
rain

Model outputs
water quality module
total phosphorus
soluble phosphorus
nitrate
ammonia
total nitrogen
dissolved oxygen
algae (chlorophyll)
pH
total organic carbon
3-D hydrodynamic model
water velocities
reservoir level
temperature
salinity
conservative tracer
decaying tracer
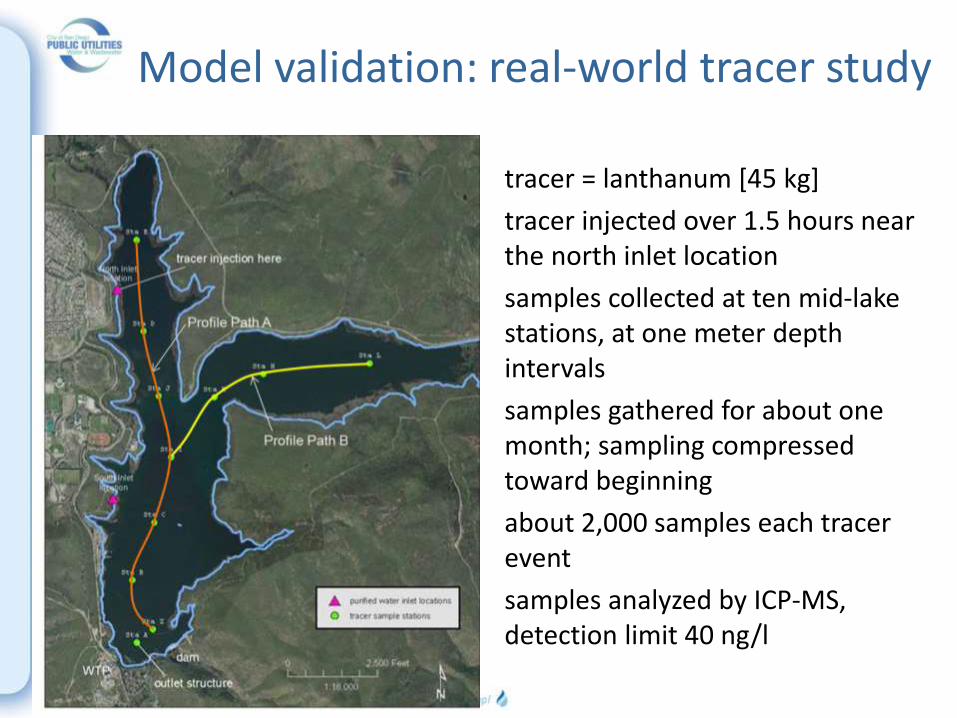
Model validation: real-world tracer study
tracer = lanthanum [45 kg]
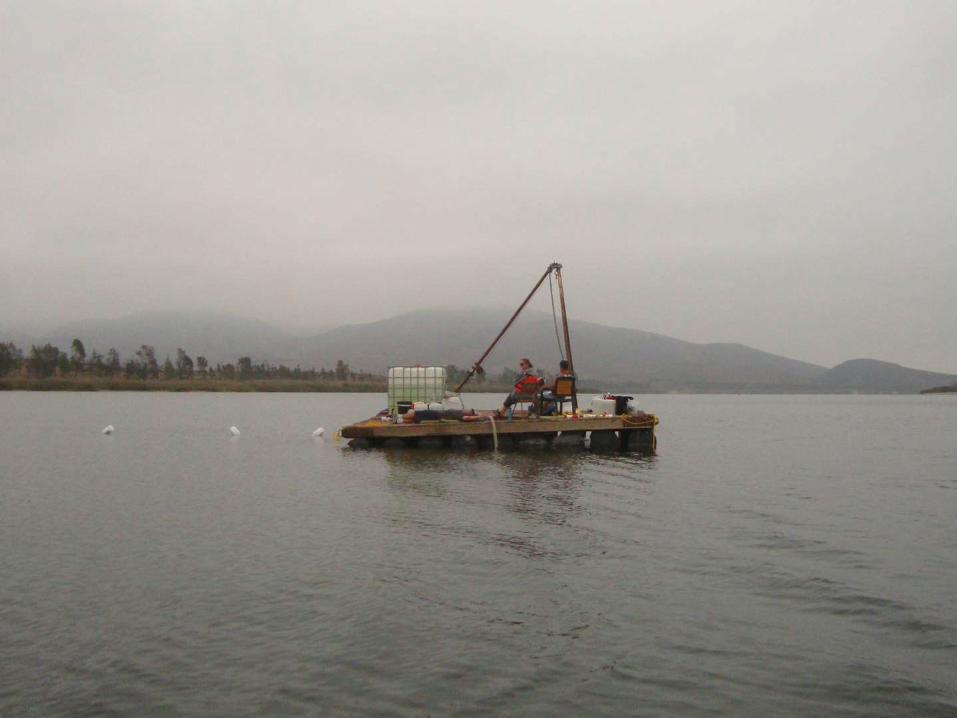
tracer injected over 1.5 hours near the north inlet location
samples collected at ten mid-lake stations, at one meter depth intervals
samples gathered for about one month; sampling compressed toward beginning
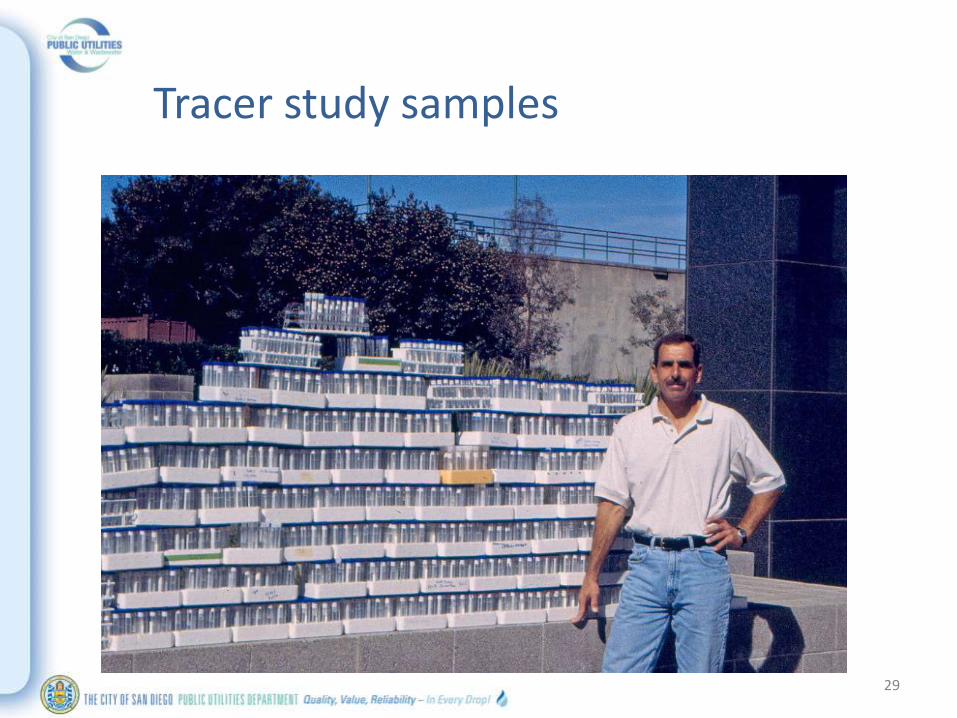
about 2,000 samples each tracer event
samples analyzed by ICP-MS, detection limit 40 ng/l
Page 27

BACKGROUND SLIDES
• Bullet
Page 28
29
Tracer study samples

Model validation: real-world tracer study
two tracer studies to validate the model
spring, April and May 2014
summer, July and August 2014
tracer injected July 15
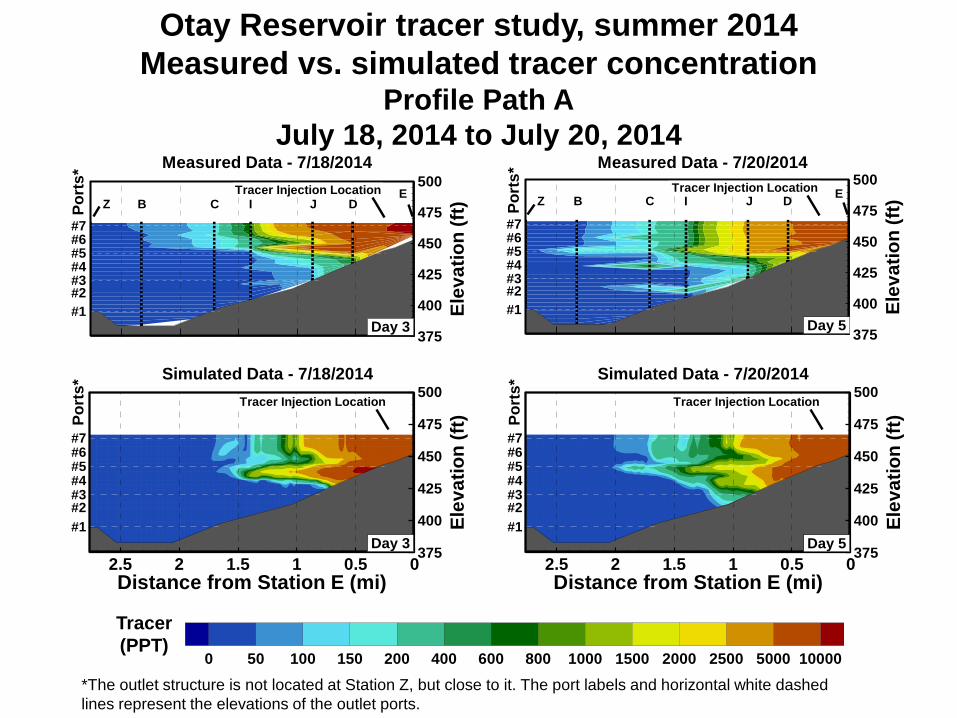
Otay Reservoir tracer study, summer 2014
Measured vs. simulated tracer concentration Profile Path A
July 18, 2014 to July 20, 2014
JE
DB ICZE
DJICBZ
Measured Data - 7/16/2014
Simulated Data - 7/16/2014
Measured Data - 7/18/2014
Simulated Data - 7/18/2014
Tracer Injection Location Tracer Injection Location
Tracer Injection LocationTracer Injection Location
Distance from Station E (mi)
Ele
va
tio
n(f
t)
00.511.522.5375
400
425
450
475
500
Day 1
Distance from Station E (mi)
Ele
va
tio
n(f
t)
00.511.522.5375
400
425
450
475
500
0 50 100 150 200 400 600 800 1000 1500 2000 2500 5000 10000
Day 3
Tracer
(PPT)
*The outlet structure is not located at Station Z, but close to it. The port labels and horizontal white dashed
lines represent the elevations of the outlet ports.
Distance from Station E (mi)
Ele
va
tio
n(f
t)
00.511.522.5375
400
425
450
475
500
Day 3
Po
rts
*
#7#6#5#4
#2#3
#1
Distance from Station E (mi)
Ele
va
tio
n(f
t)
00.511.522.5375
400
425
450
475
500
Day 5
Po
rts
*
#7#6#5#4#3#2
#1
Ele
va
tio
n(f
t)
375
400
425
450
475
500
Day 5
Po
rts
*
#7#6#5#4
#2#3
#1Ele
va
tio
n(f
t)
375
400
425
450
475
500
Day 3
#7#6#5#4#3#2
#1
Po
rts
*
JE
DB ICZE
DJICBZ
Measured Data - 7/18/2014
Simulated Data - 7/18/2014
Measured Data - 7/20/2014
Simulated Data - 7/20/2014
Tracer Injection Location Tracer Injection Location
Tracer Injection LocationTracer Injection Location
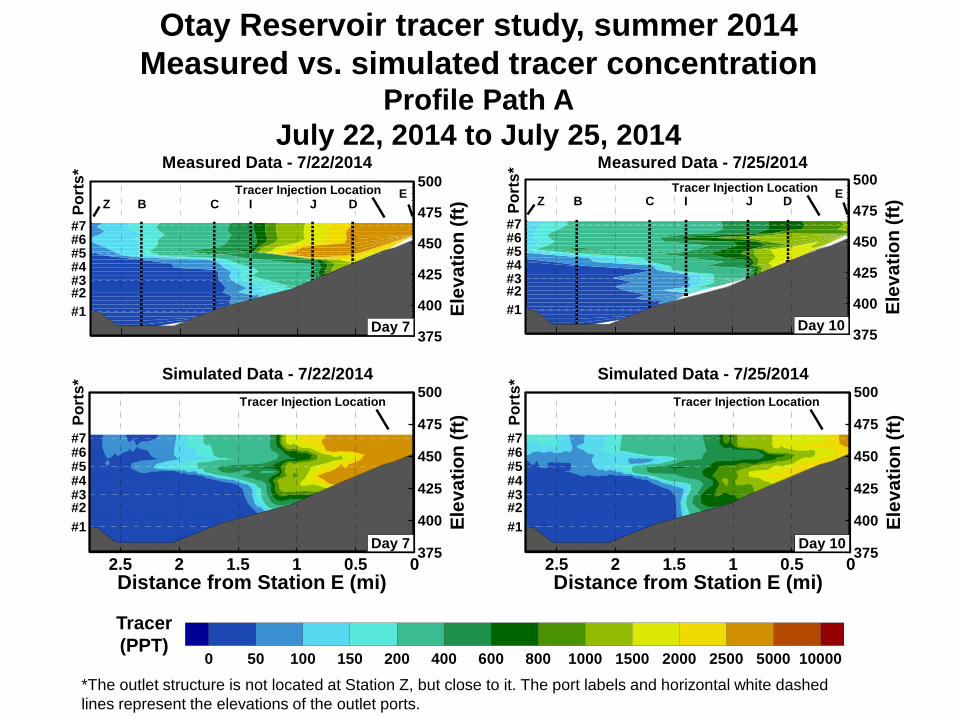
Otay Reservoir tracer study, summer 2014
Measured vs. simulated tracer concentration Profile Path A
July 22, 2014 to July 25, 2014
JE
DB ICZE
DJICBZ
Measured Data - 7/16/2014
Simulated Data - 7/16/2014
Measured Data - 7/18/2014
Simulated Data - 7/18/2014
Tracer Injection Location Tracer Injection Location
Tracer Injection LocationTracer Injection Location
Distance from Station E (mi)
Ele
va
tio
n(f
t)
00.511.522.5375
400
425
450
475
500
Day 1
Distance from Station E (mi)
Ele
va
tio
n(f
t)
00.511.522.5375
400
425
450
475
500
0 50 100 150 200 400 600 800 1000 1500 2000 2500 5000 10000
Day 3
Tracer
(PPT)
*The outlet structure is not located at Station Z, but close to it. The port labels and horizontal white dashed
lines represent the elevations of the outlet ports.
Distance from Station E (mi)
Ele
va
tio
n(f
t)
00.511.522.5375
400
425
450
475
500
Day 10
Po
rts
*
#7#6#5#4#3#2
#1
Distance from Station E (mi)
Ele
va
tio
n(f
t)
00.511.522.5375
400
425
450
475
500
Day 7
Po
rts
*
#7#6#5#4#3#2
#1
Ele
va
tio
n(f
t)
375
400
425
450
475
500
Day 10
Po
rts
*
#7#6#5#4#3#2
#1Ele
va
tio
n(f
t)
375
400
425
450
475
500
Day 7
#7#6#5#4#3#2
#1
Po
rts
*
JE
DB ICZE
DJICBZ
Measured Data - 7/22/2014
Simulated Data - 7/22/2014
Measured Data - 7/25/2014
Simulated Data - 7/25/2014
Tracer Injection Location Tracer Injection Location
Tracer Injection LocationTracer Injection Location
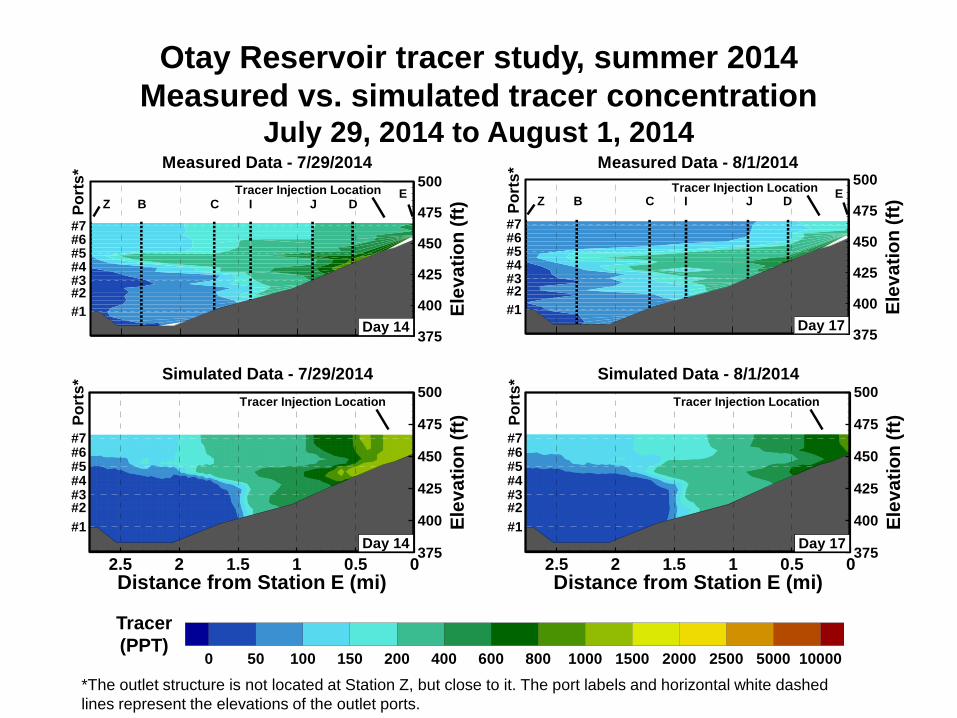
Otay Reservoir tracer study, summer 2014
Measured vs. simulated tracer concentration July 29, 2014 to August 1, 2014
JE
DB ICZE
DJICBZ
Measured Data - 7/16/2014
Simulated Data - 7/16/2014
Measured Data - 7/18/2014
Simulated Data - 7/18/2014
Tracer Injection Location Tracer Injection Location
Tracer Injection LocationTracer Injection Location
Distance from Station E (mi)
Ele
va
tio
n(f
t)
00.511.522.5375
400
425
450
475
500
Day 1
Distance from Station E (mi)
Ele
va
tio
n(f
t)
00.511.522.5375
400
425
450
475
500
0 50 100 150 200 400 600 800 1000 1500 2000 2500 5000 10000
Day 3
Tracer
(PPT)
*The outlet structure is not located at Station Z, but close to it. The port labels and horizontal white dashed
lines represent the elevations of the outlet ports.
Distance from Station E (mi)
Ele
va
tio
n(f
t)
00.511.522.5375
400
425
450
475
500
Day 14
Po
rts
*
#7#6#5#4#3#2
#1
Distance from Station E (mi)
Ele
va
tio
n(f
t)
00.511.522.5375
400
425
450
475
500
Day 17
Po
rts
*
#7#6#5#4#3#2
#1
Ele
va
tio
n(f
t)
375
400
425
450
475
500
Day 17
Po
rts
*
#7#6#5#4#3#2
#1Ele
va
tio
n(f
t)
375
400
425
450
475
500
Day 14
#7#6#5#4#3#2
#1
Po
rts
*
JE
DB ICZE
DJICBZ
Measured Data - 7/29/2014
Simulated Data - 7/29/2014
Measured Data - 8/1/2014
Simulated Data - 8/1/2014
Tracer Injection Location Tracer Injection Location
Tracer Injection LocationTracer Injection Location
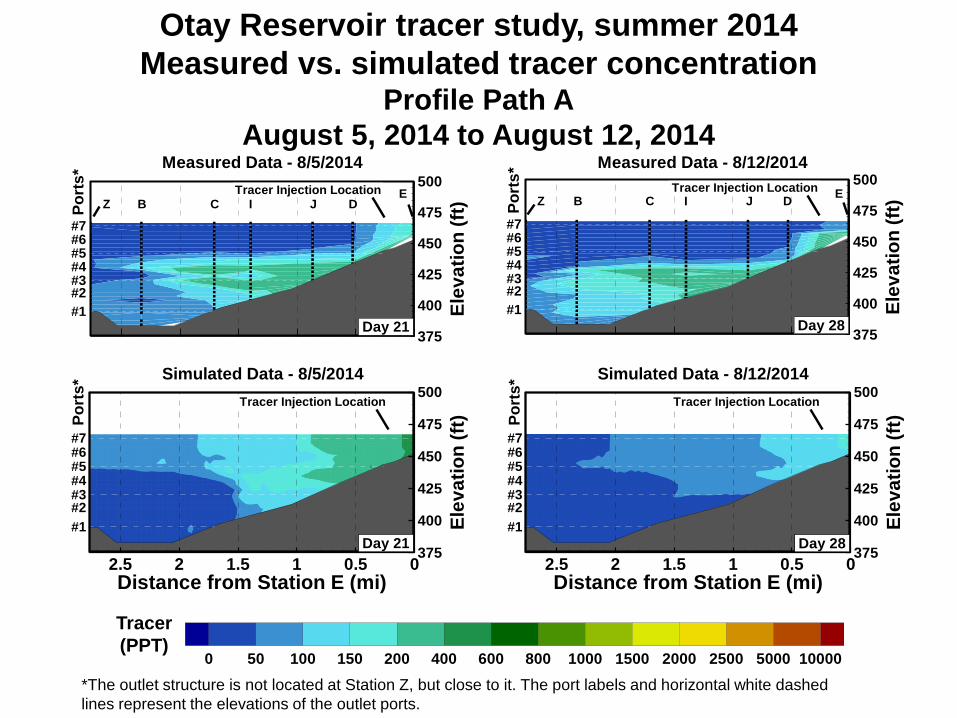
Otay Reservoir tracer study, summer 2014
Measured vs. simulated tracer concentration Profile Path A
August 5, 2014 to August 12, 2014
JE
DB ICZE
DJICBZ
Measured Data - 7/16/2014
Simulated Data - 7/16/2014
Measured Data - 7/18/2014
Simulated Data - 7/18/2014
Tracer Injection Location Tracer Injection Location
Tracer Injection LocationTracer Injection Location
Distance from Station E (mi)
Ele
va
tio
n(f
t)
00.511.522.5375
400
425
450
475
500
Day 1
Distance from Station E (mi)
Ele
va
tio
n(f
t)
00.511.522.5375
400
425
450
475
500
0 50 100 150 200 400 600 800 1000 1500 2000 2500 5000 10000
Day 3
Tracer
(PPT)
*The outlet structure is not located at Station Z, but close to it. The port labels and horizontal white dashed
lines represent the elevations of the outlet ports.
Distance from Station E (mi)
Ele
va
tio
n(f
t)
00.511.522.5375
400
425
450
475
500
Day 28
Po
rts
*
#7#6#5#4#3#2
#1
Distance from Station E (mi)
Ele
va
tio
n(f
t)
00.511.522.5375
400
425
450
475
500
Day 21
Po
rts
*
#7#6#5#4#3#2
#1
Ele
va
tio
n(f
t)
375
400
425
450
475
500
Day 28
Po
rts
*
#7#6#5#4#3#2
#1Ele
va
tio
n(f
t)
375
400
425
450
475
500
Day 21
#7#6#5#4#3#2
#1
Po
rts
*
JE
DB ICZE
DJICBZ
Measured Data - 8/5/2014
Simulated Data - 8/5/2014
Measured Data - 8/12/2014
Simulated Data - 8/12/2014
Tracer Injection Location Tracer Injection Location
Tracer Injection LocationTracer Injection Location

San Vicente Reservoir model scenarios:
reservoir operations, inlet locations, inflow rate
Page 35 35
3 purified water inflow rates4 inlet locations3 operating conditions2 reservoir outlets
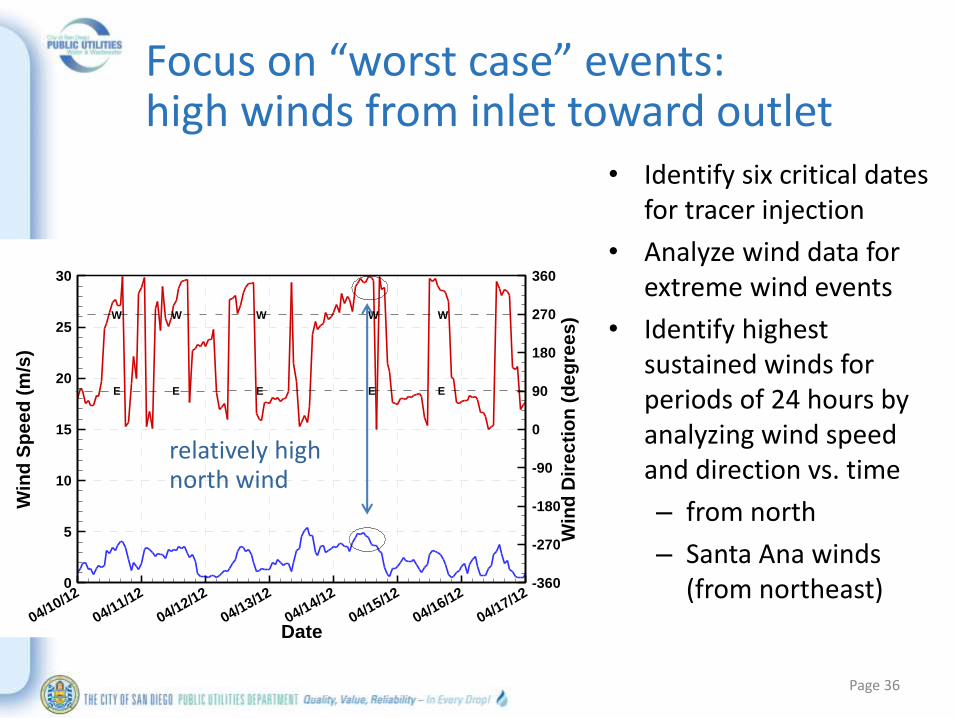
Focus on “worst case” events:high winds from inlet toward outlet
• Identify six critical dates for tracer injection
• Analyze wind data for extreme wind events
• Identify highest sustained winds for periods of 24 hours by analyzing wind speed and direction vs. time
– from north
– Santa Ana winds (from northeast)
Page 36
Date
Win
dS
pe
ed
(m/s
)
Win
dD
ire
cti
on
(de
gre
es
)
04/10/12
04/11/12
04/12/12
04/13/12
04/14/12
04/15/12
04/16/12
04/17/120
5
10
15
20
25
30
-360
-270
-180
-90
0
90
180
270
360
EE E EE
W W W W W
relatively high north wind
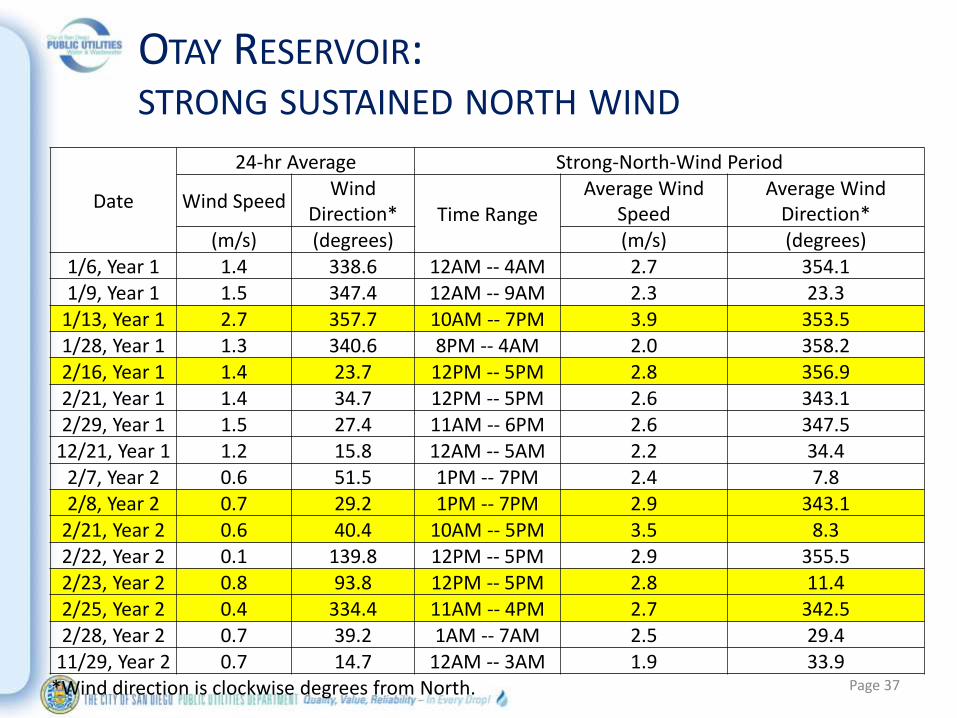
OTAY RESERVOIR: STRONG SUSTAINED NORTH WIND
Page 37
Date
24-hr Average Strong-North-Wind Period
Wind SpeedWind
Direction* Time RangeAverage Wind
SpeedAverage Wind
Direction*(m/s) (degrees) (m/s) (degrees)
1/6, Year 1 1.4 338.6 12AM -- 4AM 2.7 354.11/9, Year 1 1.5 347.4 12AM -- 9AM 2.3 23.3
1/13, Year 1 2.7 357.7 10AM -- 7PM 3.9 353.51/28, Year 1 1.3 340.6 8PM -- 4AM 2.0 358.22/16, Year 1 1.4 23.7 12PM -- 5PM 2.8 356.92/21, Year 1 1.4 34.7 12PM -- 5PM 2.6 343.12/29, Year 1 1.5 27.4 11AM -- 6PM 2.6 347.5
12/21, Year 1 1.2 15.8 12AM -- 5AM 2.2 34.42/7, Year 2 0.6 51.5 1PM -- 7PM 2.4 7.82/8, Year 2 0.7 29.2 1PM -- 7PM 2.9 343.1
2/21, Year 2 0.6 40.4 10AM -- 5PM 3.5 8.32/22, Year 2 0.1 139.8 12PM -- 5PM 2.9 355.52/23, Year 2 0.8 93.8 12PM -- 5PM 2.8 11.42/25, Year 2 0.4 334.4 11AM -- 4PM 2.7 342.52/28, Year 2 0.7 39.2 1AM -- 7AM 2.5 29.4
11/29, Year 2 0.7 14.7 12AM -- 3AM 1.9 33.9*Wind direction is clockwise degrees from North.

San Vicente Reservoir model results: Concentration of 24-hour purified water inflow at reservoir outlet
modeled as conservative tracer Extended Drought;1/2 Design Inlet Location; PW Inflow = 68 MGD; Open Port #2
Run #25: 24-Hour Conservative Tracers1/2 Inlet Location; Extended Drought Scenario;
PW Inflow = 68 MGD; Open Port #2
TracerRelease
Tracer Released on 12/2/2006
Days after tracer release
Tra
ce
r(%
)
0 5 10 15 200.0
0.4
0.8
1.2
1.6
2.0
Tracer Released on 11/29/2007
Days after tracer release
Tra
ce
r(%
)
0 5 10 15 200.0
0.4
0.8
1.2
1.6
2.0
TracerRelease
Tracer Released on 1/6/2007
Days after tracer release
Tra
ce
r(%
)
0 5 10 15 200.0
0.4
0.8
1.2
1.6
2.0
Tracer Released on 1/21/2007
Days after tracer release
Tra
ce
r(%
)0 5 10 15 20
0.0
0.4
0.8
1.2
1.6
2.0
Tracer Released on 1/14/2007
Days after tracer release
Tra
ce
r(%
)
0 5 10 15 200.0
0.4
0.8
1.2
1.6
2.0
Tracer Released on 12/2/2007
Days after tracer release
Tra
ce
r(%
)
0 5 10 15 200.0
0.4
0.8
1.2
1.6
2.0
38

Run #26: 24-Hour Conservative Tracers1/4 Inlet Location; Extended Drought Scenario;
PW Inflow = 68 MGD; Open Port #2
TracerRelease
Tracer Released on 12/2/2006
Days after tracer release
Tra
ce
r(%
)
0 5 10 15 200.0
0.4
0.8
1.2
1.6
2.0
Tracer Released on 11/29/2007
Days after tracer release
Tra
ce
r(%
)
0 5 10 15 200.0
0.4
0.8
1.2
1.6
2.0
TracerRelease
Tracer Released on 1/6/2007
Days after tracer release
Tra
ce
r(%
)
0 5 10 15 200.0
0.4
0.8
1.2
1.6
2.0
Tracer Released on 1/21/2007
Days after tracer release
Tra
ce
r(%
)0 5 10 15 20
0.0
0.4
0.8
1.2
1.6
2.0
Tracer Released on 1/14/2007
Days after tracer release
Tra
ce
r(%
)
0 5 10 15 200.0
0.4
0.8
1.2
1.6
2.0
Tracer Released on 12/2/2007
Days after tracer release
Tra
ce
r(%
)
0 5 10 15 200.0
0.4
0.8
1.2
1.6
2.0
San Vicente Reservoir model results: Concentration of 24-hour purified water inflow at reservoir outlet
modeled as conservative tracer Extended Drought; 1/4 Design Inlet Location; PW Inflow = 68 MGD; Open Port #2
39
Date
Tra
ce
r(%
)
Jan-07 Feb-07 Mar-07 Apr-07 May-07 Jun-07 Jul-07 Aug-07 Sep-07 Oct-07 Nov-07 Dec-070
0.05
0.1
0.15
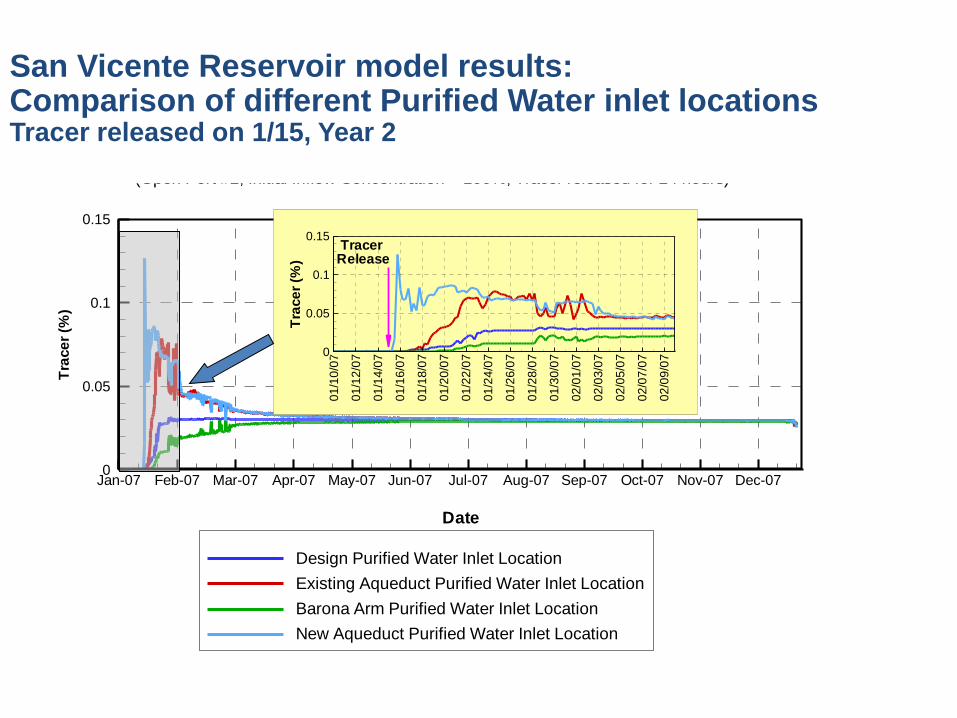
Design Purified Water Inlet Location
Existing Aqueduct Purified Water Inlet Location
Barona Arm Purified Water Inlet Location
New Aqueduct Purified Water Inlet Location
Tracer Concentrations From Different AWT Discharge LocationsAWT Tracer Released on 1/15/07: Concentration in Outflow
(Open Port #2; Initial Inflow Concentration = 100%; Tracer released for 24 hours)
Tra
ce
r(%
)
01
/10
/07
01
/12
/07
01
/14
/07
01
/16
/07
01
/18
/07
01
/20
/07
01
/22
/07
01
/24
/07
01
/26
/07
01
/28
/07
01
/30
/07
02
/01
/07
02
/03
/07
02
/05
/07
02
/07
/07
02
/09
/070
0.05
0.1
0.15TracerRelease
San Vicente Reservoir model results:Comparison of different Purified Water inlet locations Tracer released on 1/15, Year 2

San Vicente Reservoir model results:
Overall minimum dilution at various inlet locations
“worst of the worst-case scenarios”Extended Drought; Open Port 2
287
105
249
161
65
104 105
75
Ov
era
llM
inim
um
Dilu
tio
n
0
100
200
300
400
PW Inflow = 27 MGD
PW Inflow = 68 MGD
DesignInlet Location
Existing AqueductInlet Location
1/2 DesignInlet Location
1/4 DesignInlet Location

Independent Advisory Panel
Savage Dam at Otay Reservoir, January 2014
Full ten-member IAP met four times in 2009 - 2011
Four-member limnology subcommittee has met eight times with two more meetings planned to complete work at Otay
Reconvened full IPA to consider the Miramar Option, October 2015
42
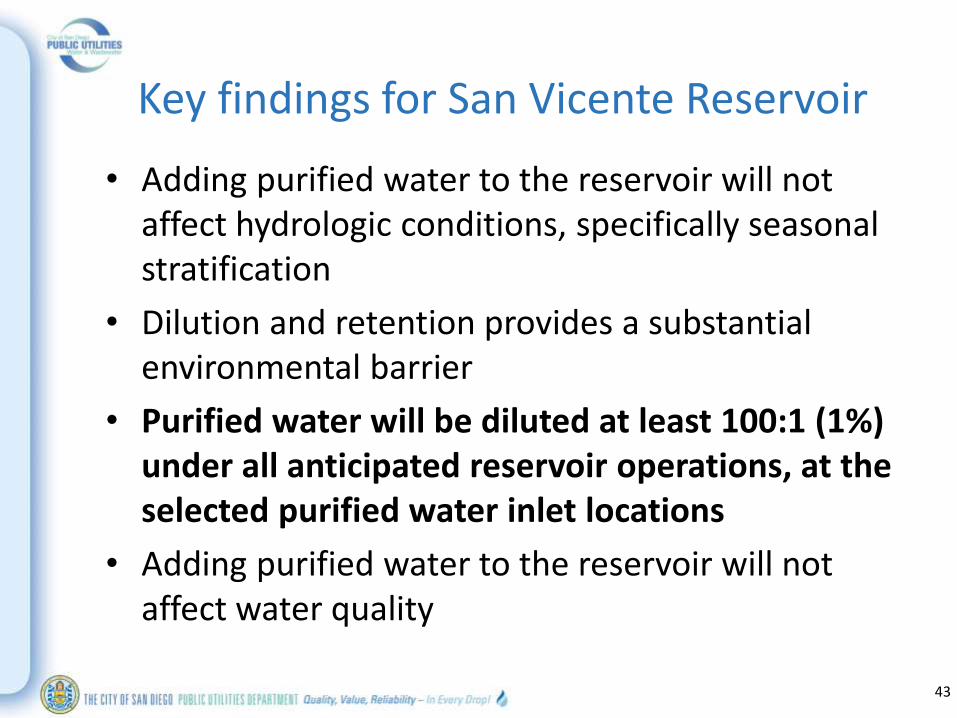
Key findings for San Vicente Reservoir
• Adding purified water to the reservoir will not affect hydrologic conditions, specifically seasonal stratification
• Dilution and retention provides a substantial environmental barrier
• Purified water will be diluted at least 100:1 (1%) under all anticipated reservoir operations, at the selected purified water inlet locations
• Adding purified water to the reservoir will not affect water quality
43

Page 44
Key findings for San Vicente Reservoir: inlet location, dilution, and time
44

north inlet location
south inlet location
outlet
Otay Reservoir: model scenarios:reservoir operations, inlet locations, inflow rate

Days after tracer release
Tra
ce
r(%
)
0 5 10 15 200.0
0.2
0.4
0.6
0.8
1.0
Tracer Released on 1/13, Year 1
Tra
ce
rR
ele
as
e
Days after tracer release
Tra
ce
r(%
)
0 5 10 15 200.0
0.2
0.4
0.6
0.8
1.0
Tracer Released on 2/21, Year 2
Days after tracer release
Tra
ce
r(%
)
0 5 10 15 200.0
0.2
0.4
0.6
0.8
1.0
Tracer Released on 2/16, Year 1
Tra
ce
rR
ele
as
e
Days after tracer releaseT
rac
er
(%)
0 5 10 15 200.0
0.2
0.4
0.6
0.8
1.0
Tracer Released on 4/14, Year 1
Days after tracer release
Tra
ce
r(%
)
0 5 10 15 200.0
0.2
0.4
0.6
0.8
1.0
Tracer Released on 3/4, Year 1
Days after tracer release
Tra
ce
r(%
)
0 5 10 15 200.0
0.2
0.4
0.6
0.8
1.0
Tracer Released on 6/30, Year 2
Otay Reservoir model resultsConcentration of 24-hour purified water inflow at reservoir outlet
PW inflow=15 MGD; Low WSEL
North Inlet Location (NIL) South Inlet Location (SIL)
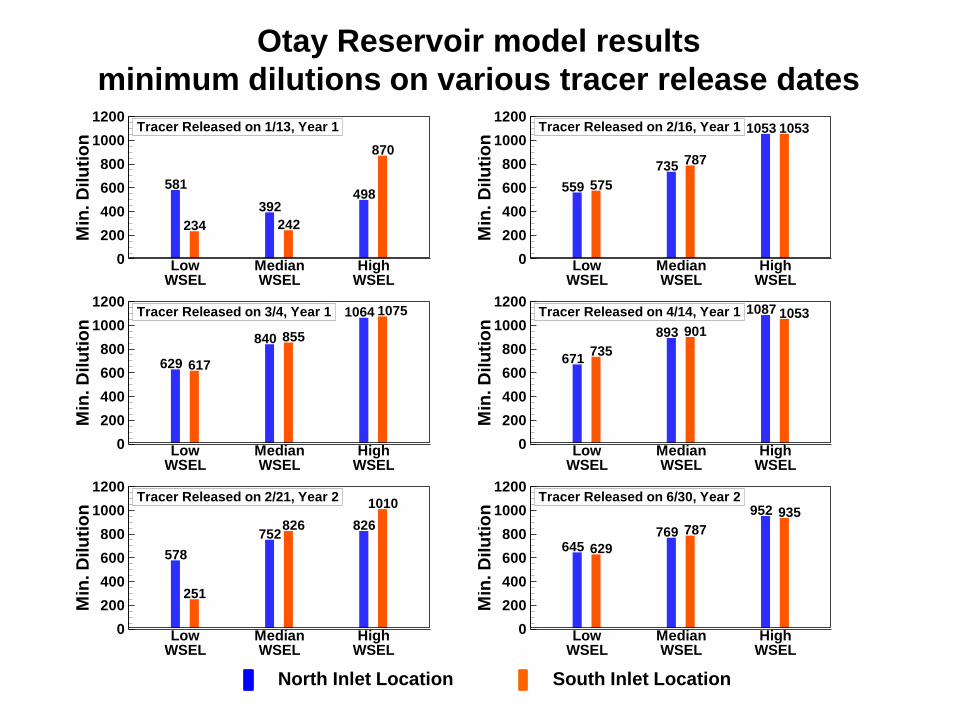
Otay Reservoir model results
minimum dilutions on various tracer release dates
581
234
392
242
498
870
Min
.D
ilu
tio
n
0
200
400
600
800
1000
1200
LowWSEL
MedianWSEL
HighWSEL
Tracer Released on 1/13, Year 1
559 575
735 787
1053 1053
Min
.D
ilu
tio
n
0
200
400
600
800
1000
1200
LowWSEL
MedianWSEL
HighWSEL
Tracer Released on 2/16, Year 1
629 617
840 855
1064 1075
Min
.D
ilu
tio
n
0
200
400
600
800
1000
1200
LowWSEL
MedianWSEL
HighWSEL
Tracer Released on 3/4, Year 1
671735
893 901
1087 1053
Min
.D
ilu
tio
n
0
200
400
600
800
1000
1200
LowWSEL
MedianWSEL
HighWSEL
Tracer Released on 4/14, Year 1
578
251
752826 826
1010
Min
.D
ilu
tio
n
0
200
400
600
800
1000
1200
LowWSEL
MedianWSEL
HighWSEL
Tracer Released on 2/21, Year 2
645 629
769 787
952 935
Min
.D
ilu
tio
n
0
200
400
600
800
1000
1200
LowWSEL
MedianWSEL
HighWSEL
Tracer Released on 6/30, Year 2
North Inlet Location South Inlet Location
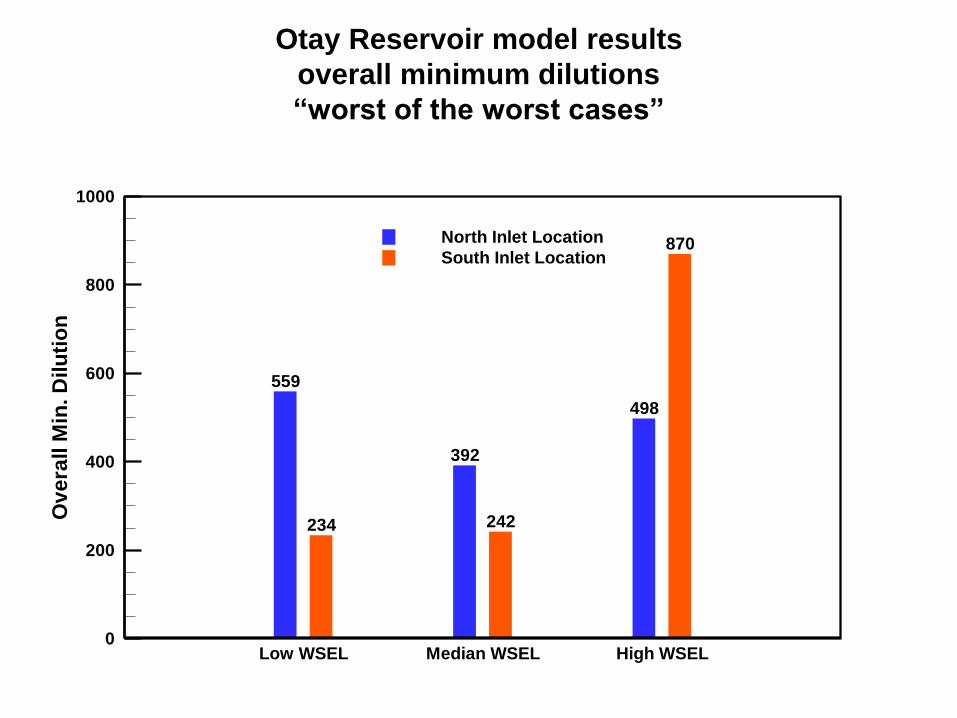
Otay Reservoir model results
overall minimum dilutions
“worst of the worst cases”
559
234
392
242
498
870
Ov
era
llM
in.D
ilu
tio
n
0
200
400
600
800
1000
North Inlet Location
South Inlet Location
Low WSEL Median WSEL High WSEL
Key findings for Otay Reservoir
• Similar to San Vicente Reservoir
• Purified water will be diluted at least 100:1 (1%) under all anticipated reservoir operations, at either purified water inlet location
• Minimum dilutions are typically 300:1 to 600:1
• Overall minimum dilutions [worst of worst case] at Otay are greater than at San Vicente, even thought total volume is about 1/5
– Otay is not very windy
– purified water inflow rate is less
– distance from inlet to outlet is greater49
Anticipated findings for Miramar Reservoir
• scaling down from San Vicente or Otay to Miramar should provide reasonable estimates of dilution
• Miramar is one fifth the volume of Otay, and the purified water inflow rate is double; thus at Miramar expect dilutions (1/5) x (1/2) = one tenth of Otay
• expect dilutions at Miramar to be 30:1 to 60:1, and always greater than 10:1
• theoretical retention time < 6 months [ ̴2months]
50

Title
• Text
• Text
5151

conclusions
“Most agree a surface water reservoir does provide additional public health protection
provides additional response retention time
provides an opportunity for dilution”
“A reservoir of any size can make an important contribution to public health protection in a potable reuse project . . . ”
R. Rhodes Trussell, Trussell Technologies, Inc., presentation to DDW Advisory Panel, 20 Oct 2015

Summary: criteria for the reservoirin a surface water augmentation project
• Metric for dilution is at hand
Dilution of a 24 hour inflow, measured at the reservoir outlet
Can be calculated with modeling or measured with real-world tracer studies
• Reservoir volume is important for dilution
• Distance from inlet to outlet is also important
• Metric for response retention time yet to be worked out

Questions?


Miramar Option: Time to Respond
• “Time to respond” to off-specification treatment at the AWPF, such that no inadequately treated purified water reaches the potable water treatment plant
• A metric for “time to respond” must relate to AWPF treatment monitoring and operational actions
• “Time to respond” is provided by conveyance time in pipeline and residence time in reservoir
56

57
time in conveyance pipeline~ 3 hours
residence timein reservoir
AWPF
57

105 ft deep
55 ft deep
25 ft deep
58

Description of Miramar Reservoir
• Constructed in 1960
• Earth-fill dam, 1190 ft. long, 155 ft. tall
• Maximum reservoir volume is 7,200 AF
• Reservoir surface area ~170 acres
• Catchment
– 650 acres total
– City owns 370 acres
– 540 housing units
• Runoff from developed areas mostly diverted away
59