purification and antioxidant properties of rice bran
TRANSCRIPT

Louisiana State UniversityLSU Digital Commons
LSU Historical Dissertations and Theses Graduate School
1998
Purification and Antioxidant Properties of RiceBran (Gamma)-Oryzanol Components.Zhimin XuLouisiana State University and Agricultural & Mechanical College
Follow this and additional works at: https://digitalcommons.lsu.edu/gradschool_disstheses
This Dissertation is brought to you for free and open access by the Graduate School at LSU Digital Commons. It has been accepted for inclusion inLSU Historical Dissertations and Theses by an authorized administrator of LSU Digital Commons. For more information, please [email protected].
Recommended CitationXu, Zhimin, "Purification and Antioxidant Properties of Rice Bran (Gamma)-Oryzanol Components." (1998). LSU HistoricalDissertations and Theses. 6642.https://digitalcommons.lsu.edu/gradschool_disstheses/6642

INFORMATION TO USERS
This manuscript has been reproduced from the microfilm master. UMI
films the text directly from the original or copy submitted. Thus, some
thesis and dissertation copies are in typewriter face, while others may be
from any type o f computer printer.
The quality of this reproduction is dependent upon the quality of the
copy submitted. Broken or indistinct print, colored or poor quality
illustrations and photographs, print bleedthrough, substandard margins,
and improper alignment can adversely afreet reproduction.
In the unlikely event that the author did not send UMI a complete
manuscript and there are missing pages, these will be noted. Also, if
unauthorized copyright material had to be removed, a note will indicate
the deletion.
Oversize materials (e.g., maps, drawings, charts) are reproduced by
sectioning the original, beginning at the upper left-hand comer and
continuing from left to right in equal sections with small overlaps. Each
original is also photographed in one exposure and is included in reduced
form at the back o f the book.
Photographs included in the original manuscript have been reproduced
xerographically in this copy. Higher quality 6” x 9” black and white
photographic prints are available for any photographs or illustrations
appearing in this copy for an additional charge. Contact UMI directly to
order.
UMIA Bell & Howell Information Company
300 North Zeeb Road, Ann Arbor MI 48106-1346 USA 313/761-4700 800/521-0600
Reproduced with permission of the copyright owner. Further reproduction prohibited without permission.

Reproduced with permission of the copyright owner. Further reproduction prohibited without permission.

PURIFICATION AND ANTIOXIDANT PROPERTIES OF RICE BRANy-ORYZANOL COMPONENTS
A Dissertation
Submitted to the Graduate Faculty o f the Louisiana State University and
Agricultural and Mechanical College In partial fulfillment o f the
Requirements for the degree o f Doctor o f Philosophy
In
The Department o f Food Science
byZhimin Xu
B.S., East China University o f Science and Technology, 1985 M.S., Louisiana State University, 1994
May 1998
Reproduced with permission of the copyright owner. Further reproduction prohibited without permission.

UMI Number: 9824499
UMI Microform 9824499 Copyright 1998, by UMI Company. All rights reserved.
This microform edition is protected against unauthorized copying under Title 17, United States Code.
UMI300 North Zeeb Road Ann Arbor, MI 48103
Reproduced with permission of the copyright owner. Further reproduction prohibited without permission.

ACKNOWLEDGEMENTS
The author wishes to express his most sincere appreciation to his major
professor, Dr. J. Samuel Godber, Professor, Department o f Food Science, for his
precious and patient guidance, encouragement, and advice during the investigation and
the preparation o f this dissertation.
Appreciation is also extended to Dr. Maren Hegsted, Professor o f the
Department o f Human Ecology, Dr. Simon M. Shane, Professor of the Department of
Epidemiology, Dr. Micheal J. Keenan, Associate Professor o f the Department of
Human Ecology, and Dr. Leslie C. Plhak, Assistant Professor of the Department of
Food Science for their advice, instructions, and for their serving as members of the
examination committee. Thanks are also extended to Dr. Douglas L. Park, Head o f the
Department o f Food Science, for his support during this research.
The author would like to express his deepest gratitude to his parents and sister
for their tremendous encouragement, support, and love during this endeavor.
Most o f all, the author wishes to thank his wife, Mrs. Zhiyi Liang, for her
endless and priceless inspiration, understanding, sacrifice, and love. He would also like
to thank his son, Leon Xu, for his wonderful love. It is to them that this work is
dedicated.
ii
Reproduced with permission of the copyright owner. Further reproduction prohibited without permission.

TABLE OF CONENTS
page
ACKNOWLEDGMENTS.................................................................................................... ii
LIST OF TABLES...............................................................................................................vi
LIST OF FIGURES.............................................................................................................vii
ABSTRACT......................................................................................................................... ix
CHAPTER 1INTRODUCTION................................................................................................................. 1
CHAPTER 2REVIEW OF LITERATURE............................................................................................... 32.1. Nutritional values o f rice bran.......................................................................................32.2. y-Oryzanol of rice bran.................................................................................................. 42.3. Extraction, purification, separation, identification, quantification of
components o f y-oryzanol.........................................................................................52.3.1. Solvent extraction..........................................................................................52.3.2. Supercritical fluid extraction........................................................................ 62.3.3. Low pressure chromatography in purification o f y-oryzanol......................72.3.4. Preparative scale HPLC in purification and isolation of
individual component of y-oryzanol...........................................................82.3.5. Separation of components of y-oryzanol.......................................................92.3.6. Identification and quantification o f y-oryzanol............................................9
2.4. Oxidation and antioxidation........................................................................................ 112.4.1. Principle of lipid oxidation..........................................................................112.4.2. Effect o f oxygen and temperature on lipid oxidation................................ 122.4.3. Principle of antioxidation.............................................................................12
2.5. Natural antioxidants......................................................................................................142.6. Methods of evaluation of antioxidant activity using lipid systems...........................16
2.6.1. Accelerated stability methods.....................................................................162.6.2. Chemical generation methods.....................................................................172.6.3. Enzymatic generation methods.................................................................. 17
2.7. Measurement of oxidative products............................................................................182.7.1. Chemical methods.......................................................................................182.7.2. Direct spectrophotometric methods........................................................... 182.7.3. Chromatographic methods..........................................................................19
Reproduced with permission of the copyright owner. Further reproduction prohibited without permission.

CHAPTER 3MATERIALS AND METHODS....................................................................................... 223.1. Separation and Identification of components o f y-oryzanol......................................22
3.1.1. Chemicals and materials............................................................................. 223.1.2. Extraction of crude oil.................................................................................223.1.3. Semi-purification o f y-oryzanol in a low pressure
silica column................................................................................................233.1.4. Purification of y-oryzanol using a preparative scale
normal phase HPLC...................................................................................233.1.5. Separation of individual components of y-oryzanol
in an analytical reverse phase HPLC.........................................................243.1.6. Hydrolysis and derivatization......................................................................243.1.7. Gas chromatography (GC) and mass spectrometry (MS)........................ 25
3.2. Solvent and supercritical fluid extraction o f y-oryzanol......................................... 263.2.1. Chemical and materials...............................................................................263.2.2. Solvent extraction using hexane with saponification................................263.2.3. Solvent extraction using hexane without saponification.......................... 273.2.4. Solvent extraction using various solvents................................................. 273.2.5. Supercritical fluid extraction...................................................................... 273.2.6. Quantification for y-oryzanol..................................................................... 283.2.7. Isolation and purification of major components of
y-oryzanol using a preparative scale reverse phase column.................... 293.2.8. Statistical analysis....................................................................................... 29
3.3. Quantitative analysis of antioxidant activity using linoleic acid model.................. 303.3.1. Chemical and materials...............................................................................303.3.2. Accelerated oxidation processing in linoleic acid.....................................303.3.3. Analysis of hydroperoxides of linoleic acid.............................................. 313.3.4. Statistical analysis........................................................................................ 32
CHAPTER 4RESULTS AND DISCUSSION......................................................................................... 364.1. Separation and identification o f components of y-oryzanol..................................... 364.1.1. Extraction o f crude oil..............................................................................................36
4.1.2. Semi-purification o f y-oryzanol using a low pressuresilica column................................................................................................37
4.1.3. Purification of y-oryzanol using a preparative scalenormal phase HPLC...................................................................................37
4.1.4. Separation of individual components o f y-oryzanolin an analytical reverse phase HPLC.........................................................38
4.1.5. Absorption spectrums o f components o f y-oryzanolusing a spectrophotometer..........................................................................39
4.1.6. Mass spectras of components o f y-oryzanol using a GC-MS................... 394.1.7. Components of y-oryzanol.......................................................................... 42
iv
Reproduced with permission of the copyright owner. Further reproduction prohibited without permission.

4.2. Solvent and supercritical fluid extraction of y-oryzanol........................................ 444.2.1. Solvent extraction o f y-oryzanol using hexane
with and without saponification.................................................................444.2.2. Solvent extraction o f y-oryzanol using different
ratios mixture solvent at different temperatures....................................... 454.2.3. Concentration of y-oryzanol in extracted oil at different
extraction times using mixture solvent(hexane:isopropanol = 50:50, v/v) at 60°C................................................ 46
4.2.4. Yield o f extract using supercritical fluid extraction(SFE) under different conditions................................................................47
4.2.5. Yields and concentrations o f y-oryzanol in extractsusing SFE at different times and temperatures........................................ 48
4.2.6. Comparison of yields and concentrations o f y-oryzanolin extracts between SFE and solvent extraction....................................... 49
4.3. Quantitative analysis of antioxidant activities o f a-tocopherol, ferulic acid and the three major y-oryzanol componentsusing a linoleic acid model.................................................................................... 504.3.1. Hydroperoxides and hydroxides of linoleic acid...................................... 504.3.2. Developing quantitative analysis o f hydroperoxides
o f linoleic acid.............................................................................................514.3.3. Linoleic acid model.................................................................................... 534.3.4. Profile o f production of hydroperoxides in
a-tocopherol treatment.............................................................................. 554.3.5. Profile o f production of hydroperoxides in
ferulic acid treatment.................................................................................. 564.3.6. Antioxidant activity of a-tocopherol at
different ratios to linoleic acid....................................................................594.3.7. Antioxidant activity of ferulic acid at
different ratios to linoleic acid....................................................................604.3.8. Antioxidant activities of three major components
o f y-oryzanol at different ratio to linoleic acid..........................................61
CHAPTER 5SUMMARY AND CONCLUSIONS................................................................................. 87
REFERENCES.....................................................................................................................91
VITA......................................................................................................................................97
v
Reproduced with permission of the copyright owner. Further reproduction prohibited without permission.

LIST OF TABLES
Table 1. Advantages and disadvantages o f natural antioxidants.....................................14
Table 2. Composition of tested solvent in solvent extraction(unit: percentage of volume)............................................................................................. 28
Table 3. Molecular masses and major fragmentation ion of TMSether derivatives of each peak collected in reverse-phase HPLC.....................................41
Table 4. Yield o f extracted oil and concentration of y-oryzanol in the extracted oil from 1 g rice bran using hexane with and without saponification..................................................................................................................... 45
Table 5. Yields and concentration of y-oryzanol from 7.0 g of rice branin extract at different peroid o f extract time and temperature..........................................49
Table 6. Comparison of yields and concentrations of y-oryzanolin extracts between SFE and solvent extraction............................................................... 50
Table 7. Productions o f hydroperoxides o f control, a-tocopherol, and ferulic acid treatment after 120 and 200 minutes of oxidation (treatment component: linoleic acid molar ratio = 1 : 250).............................................58
vi
Reproduced with permission of the copyright owner. Further reproduction prohibited without permission.

LIST OF FIGURES
Figure 1. Molecular structure of cycloartenyl ferulate, 24-methylenecycloartanyl ferulate, and campesteryl ferulate.................................................................21
Figure 2. Device of supercritical fluid extraction.............................................................33
Figure 3. Waters preparative HPLC (Delta Prep 400) fluid pathwaybefore and after modification.............................................................................................34
Figure 4. Apparatus o f accelerated oxidation processing................................................ 35
Figure 5. Chromatogram o f crude rice bran oil in the low pressuresilica column........................................................................................................................63
Figure 6. Chromatogram of semi-purified y-oryzanol in the normal-phase preparative HPLC................................................................................................................64
Figure 7. Chromatogram o f high purity of y-oryzanol in the analyticalreverse phase HPLC for collecting fraction......................................................................65
Figure 8. Chromatogram of crude rice bran oil in the analyticalreverse phase HPLC............................................................................................................66
Figure 9. Spectrum of absorption o f sitostanyl ferulate.................................................. 67
Figure 10. Mass spectra and total ion chromatogram of sitostanol-TMSin GC/MS............................................................................................................................. 68
Figure 11(a). Molecular structures o f identified components of y-oryzanol..................69
Figure 11(b). Molecular structures of identified components of y-oryzanol..................70
Figure 12. The possible manner of formation of m/z 129 in sterol-TMSand m/z 229 in A7-stenol-TMS...........................................................................................71
Figure 13. Hydrolysis o f campesteryl ferulate under alkali condition........................... 72
Figure 14. Concentration o f y-oryzanol in extracted oil using differentsolvent ratios at 30,45, and 60°C for 60 min....................................................................73
Figure 15. Concentrations o f y-oryzanol in extracted oil using the solventmixture hexane : isopropanol (50 :50, v/v) after 30,45, and 60 min at 60°C.................74
vii
Reproduced with permission of the copyright owner. Further reproduction prohibited without permission.

Figure 16. Yield o f extract of SFE at different extraction timesand temperatures...................................................................................................................75
Figure 17. Yield of y-oryzanol in extract of SFE at different extractiontimes and temperatures........................................................................................................ 76
Figure 18. Chromatogram of extract o f SFE in the reverse phasepreparative HPLC.................................................................................................................77
Figure 19. Chromatograms of hydroperoxides and hydroxides oflinoleic acid at different oxidation times............................................................................78
Figure 20. Mechanism o f formation o f hydroperoxides and hydroxides of linoleic acid during autooxidation................................................................................. 79
Figure 21. Chromatograms of hydroperoxides and hydroxides oflinoleic acid with a-tocopherol (a-tocopehrol: linoleic acid molar ratio = 1:250)at different oxidation times.................................................................................................. 80
Figure 22. Chromatograms of hydroperoxides and hydroxides oflinoleic acid with ferulic acid (ferulic acid : linoleic acid molar ratio = 1:250)at different oxidation times.................................................................................................. 81
Figure 23. Rates of production of total hydroperoxides o f linoleic acidwith different ratios o f component to linoleic acid and control....................................... 82
Figure 24. Production o f hydroperoxides o f linoleic acid with differentmolar ratios of a-tocopherol to linoleic acid after 200 min oxidation............................. 83
Figure 25. Chromatograms of hydroperoxides of linoleic acid with cycloartenyl ferulate (cycloartenyl ferulate: linoleic acid molar ratio = 1 : 250) at different oxidation times................................................................................................. 84
Figure 26. Chromatograms of hydroperoxides of linoleic acid with 24-methylene cycloartanyl ferulate(24-methylene cycloartanyl ferulate : linoleic acid molar ratio = 1 :250) at different oxidation times.................................................................................................85
Figure 27. Chromatograms of hydroperoxides of linoleic acid withcampesteryl femlate (campesteryl ferulate: linoleic acid molar ratio = 1 : 250)at different oxidation times.................................................................................................86
Reproduced with permission of the copyright owner. Further reproduction prohibited without permission.

ABSTRACT
A high purity y-oryzanol was obtained from crude rice bran oil using a normal
phase preparative scale HPLC. It was used in implementing a reverse phase HPLC
method for separating each individual component o f y-oryzanol present in rice bran oil.
Ten fractions were isolated in the reverse phase HPLC method. The ten components of
y-oryzanol were identified. Three of these, cycloartenyl ferulate, 24-methylene
cycloartanyl ferulate, and campesteryl ferulate, were major components of y-oryzanol.
The yield of y-oryzanol without saponification was significantly higher than that
with saponification in solvent extraction. The solvent mixture with 50% hexane and
50% isopropanol (v/v.) at an temperature of 60°C for 60 min produced the highest yield
of y-oryzanol among test solvents and conditions. However, the yield of y-oryzanol in
supercritical fluid extraction under temperature 50°C, pressure 680 atm, and time 25
min was approximately four times higher than the highest yield o f solvent extraction.
Also, high concentration of y-oryzanol in extract (50 - 80%) was obtained by collecting
the extract between 15-20 min o f extraction under this optimized condition.
A quantitative method for determining four hydroperoxide isomers o f linoleic
acid, 9HPODE(t,c), 9HPODE(t,t), 13HPODE(c,t), and 13HPODE(t,t), using a normal
phase HPLC with a UV detector was developed. The sensitivity and specificity o f the
HPLC method were sufficient to measure the production of the four hydroperoxide
isomers when linoleic acid was incubated at 37°C with constant air flow. a-Tocopherol
and ferulic acid showed significant antioxidant activity via low productions of
ix
Reproduced with permission of the copyright owner. Further reproduction prohibited without permission.

hydroperoxides, compared to control. Based on the relative production of each
hydroperoxide, the mechanisms of antioxidants, scavenging singlet oxygen or
scavenging peroxyl free radicals, were also determined. Different profiles of
production o f each hydroperoxide in the linoleic acid model with a-tocopherol and
ferulic acid indicated that they possess different mechanisms o f antioxidation.
The three components of y-oryzanol evidenced significant antioxidant activity
when they were mixed with linoleic acid in a molar ratio o f 1:100 and 1:250 but not in a
molar ratio of 1:500. The antioxidant mechanisms of the three major components of y-
oryzanol were similar to that of ferulic acid.
x
Reproduced with permission of the copyright owner. Further reproduction prohibited without permission.

CHAPTER 1
INTRODUCTION
y-Oryzanol was first extracted from rice bran oil and considered to be a single
component. Later it was determined to be a mixture of ferulate (4-hydroxy-3-
methoxycinnamic acid) esters of triterpene alcohols. Major components o f y-oryzanol
were identified as ferulate esters o f cycloartenol, 24-methylene cycloartanol, and
campesterol (Norton, 1995; Rogers et al., 1993; Seitz, 1989).
y-Oryzanol was considered to be an important fraction, along with tocotrienols
and unsaponifiables in the hypocholesterolemic property of rice bran oil (Seetharamaiah
and Chandrasekhara, 1988, 1989; Sharma and Rukmini, 1986). y-Oryzanol was also
reported to possess antioxidant activity in stabilizing lipid (Duve and White, 1991;
Sonntag, 1979). This antioxidative property may help to protect against various
vascular diseases and cancers in biological systems that generally result from cell
damage caused by free radicals. However, the efficiency and mechanism o f the
antioxidant capacity of y-oryzanol fractions are less understood. Therefore, the purpose
o f this study was to investigate the antioxidant properties of the major y-oryzanol
components. y-Oryzanol components antioxidant activities will be compared with that
o f a-tocopherol and ferulic acid under identical experimental conditions. Results o f this
study may help us to understand the antioxidant properties of y-oryzanol components
and clarify the potential nutritional value o f rice bran.
Extraction, purification, separation, identification, and quantification o f the y-
oryzanol components would be necessary before a reliable nutrition study could be
1
Reproduced with permission of the copyright owner. Further reproduction prohibited without permission.

2
performed. Traditional solvent extraction with saponification was used in extraction of
y-oryzanol from rice bran. However, the effects o f solvent polarity and saponification
on efficiency o f y-oryzanol extraction from rice bran have not been reported. Currently,
supercritical fluid extraction is being suggested for lipid extraction. It may have higher
efficiency and greater advantage than the traditional solvent extraction in y-oryzanol
extraction. This study investigated the effects o f solvent polarity and saponification,
and optimum conditions of supercritical fluid extraction in y-oryzanol extraction.
Separation and identification of components of y-oryzanol from rice bran using
analytical reverse or normal phase HPLC methods have been reported (Diack and
Saska, 1994; Evershed et al., 1988; Norton, 1995; Rogers et al., 1993; Seitz, 1989).
Although the three major components, ferulate esters of cycloartenol, 24-methylene
cycloartanol, and campesterol, were identified in most of these reports using a reverse
phase HPLC method, other components were still unknown or identified tentatively due
to low levels o f these minor components in rice bran and incomplete separation.
Furthermore, since standards of these components are not available, the quantitative
methods for the individual components of y-oryzanol in those reports were not
adequate. In this study, improved separation, identification, and quantification of
individual component of y-oryzanol were obtained and purification o f the major
components of y-oryzanol using preparative scale liquid chromatography was
developed.
Reproduced with permission of the copyright owner. Further reproduction prohibited without permission.

CHAPTER 2
REVIEW OF LITERATURE
2.1. Nutritional values of rice bran
Rice is one o f the major crops in Louisiana. It was estimated that in Louisiana
about 620,000 acres o f rice were planted and 1.44 million tons rough rice was produced
in 1992, which accounted for 16% o f the total U.S. rice production. Rice products are
important agronomic commodities for Louisiana agricultural business. The value-added
processing o f rice by-products, such as rice bran, could potentiate more efficient
utilization o f rice resources and improve economic return from the Louisiana rice crop.
Rice as harvested is referred to as paddy where the kernel is fully sealed by the
rice hull. The hull is removed to yield brown rice, in the first milling operation, which
is still enclosed by a bran layer. The outer layer is removed from the rice kernel to yield
white rice in the second milling operation. The separated brown layer in this stage is
called rice bran. The amount of rice bran is 8-12% of the total weight o f brown rice. It
is an underutilized by-product. Most of it is utilized only as livestock feed or must be
disposed of.
The major components o f rice bran are approximately 12 - 22 % oil, 11 - 17 %
protein, 6 -14 % fiber, 10-15 % moisture, and 8-17 % ash (Saunders, 1990). Rice bran
also is rich in a variety o f vitamins and minerals. These include thiamin, niacin, vitamin
E, phosphorus, potassium, magnesium, and silicon. Rice bran oil and dietary fiber have
3
Reproduced with permission of the copyright owner. Further reproduction prohibited without permission.

4
been shown to most greatly contribute to the potential o f rice bran in lowering serum
cholesterol level.
The lipid in rice bran contains oleic acid (38.4 %), linoleic acid (34.4 %), and
linolenic acid (2.2 %) as unsaturated fatty acids, and palmitic (21.5 %) and stearic acid
(2.9 %) as saturated fatty acids. The unsaponifable fraction o f rice bran (4.2 %)
includes tocopherols and tocotrienols (0.08 %), y-oryzanol (1.6 %), and squalene
(0.32 %) (Hemavathy and Prabhakar, 1987; Rukmini and Raghuram, 1991). y-Oryzanol
was considered to be an important fraction, along with tocotrienols and other
unsaponifiables in the hypocholesterolemic property o f rice bran oil (Rukmini and
Raghuram, 1991; Saunders, 1990; Seetharamaiah and Chandrasekhara, 1988, 1989;
Sharma and Rukmini, 1986). The fiber in rice bran contains both insoluble and soluble
fiber. Which have been reported to significantly lower serum cholesterol (Slavin and
Lampe, 1992).
High levels o f tocopherols and tocotrienols in rice bran are important in
protection against oxidation of rice bran oil. y-Oryzanol was also reported to possess
antioxidant activity in stabilizing lipid (Duve and White, 1991; Ramarathnam et al.,
1989; Sonntag, 1979). However, the efficiency and mechanism of antioxidation o f the
y-oryzanol fraction were not discussed in these reports.
2.2. y-Oryzanol of rice bran
y-Oryzanol was first extracted from rice bran oil and considered to be a single
component. Later it was determined to be a mixture o f ferulate (4-hydroxy-3-
methoxycinnamic acid) esters o f triterpene alcohols. Major components o f y-oryzanol
Reproduced with permission of the copyright owner. Further reproduction prohibited without permission.

5
were identified as cycloartenyl ferulate, 24-methylene cycloartanyl ferulate, and
campesteryl ferulate (Figure 1). They occupy about 70% of the total weight o f y-
oryzanol in rice bran (Norton, 1995).
2.3. Extraction, purification, separation, identification, and quantification of components of y-oryzanol
2.3.1. Solvent extraction
Since y-oryzanol is readily dissolved in organic solvents, hexane was typically
used in extraction o f y-oryzanol from rice bran (Diack and Saska, 1994; Rogers et al.
1993; Seitz, 1989; Norton, 1994). However, all components of y-oryzanol contain an
alcohol group in the ferulate portion, which brings about a relatively low polarity of
these components. They may also be soluble in low polar solvents, such as isopropanol
and ethyl acetate, in addition to the non-polar solvents, hexane or heptane. The solvent
strength o f extraction may affect the extractability of y-oryzanol from rice bran. The
effects of various solvents on the yield of y-oryzanol in extraction have not been
reported.
Another unclear factor in extraction is the effect o f saponification on the
efficiency of extraction. In previous studies, saponfication was performed prior to the
solvent extraction (Diack and Saska, 1994; Rogers et al. 1993; Seitz, 1989; Norton,
1994). Saponification, which is important for reducing interfering lipids and for
breaking down the matrix of rice bran for improved recovery o f extraction, may have a
negative effect in the extraction of y-oryzanol. It is possible that the ester bond between
the ferulate and triterpene components of y-oryzanol also is broken down under alkali
Reproduced with permission of the copyright owner. Further reproduction prohibited without permission.
6
condition. This could result in decomposition o f y-oryzanol and decrease the yield o f
extraction. The effect o f saponification on yield o f y-oryzanol in solvent extraction has
not been reported.
2.3.2. Supercritical fluid extraction
Supercritical fluid extraction (SFE) o f lipid has received attention as an
alternative to organic solvent extraction. Supercritical carbon dioxide has been shown
to be an ideal solvent for extracting certain lipids. Supercritical carbon dioxide
extraction in place o f solvent extraction was studied intensively (Bhaskar et al., 1993;
Garcia et al., 1996; Froning et al., 1990; List et al., 1993; Merkle and Larick, 1993;
Tsuda et al., 1995). Carbon dioxide is changed to supercritical fluid beyond the
supercritical point (73 atm, 31°C). Supercritical carbon dioxide has unique solvating
characteristics, since supercritical fluids have lower viscosity and diffuse more rapidly
into a sample matrix than conventional solvents. Supercritical carbon dioxide is non
toxic, non-flammable, and low cost in chemical extraction, compared to solvents used
in traditional extraction. These advantages may make it preferred in food and
pharmaceutical industries.
Most studies o f SFE on lipid extraction focused on yield of extractable material.
The supercritical fluid pressure, temperature, and time were optimized for obtaining as
much extract from sample as possible. Garcia et al. (1996) reported that the condition
of the highest yield o f extract from rice bran in their study was the highest pressure and
temperature allowable in their system (28MPa and 70°C) and the yield was only 16-
60% o f that obtained by solvent extraction with hexane. Tsuda et al. (1995) indicated
Reproduced with permission of the copyright owner. Further reproduction prohibited without permission.

7
that the yield of extract from seed coat decreased when temperature increased above
40°C at constant pressure.
Since the principle of SFE is similar to solvent extraction, extractability of a
compound depends on the relationship of its chemical characteristic and strength of
supercritical fluid. For each compound there exists a unique extractability under
different condition o f supercritical fluid that is a combination of factors, such as
extraction temperature, supercritical fluid pressure, and extraction time. In theory,
components in a sample are extracted in an ordered manner from sample matrix under
ideal conditions o f supercritical fluid extraction. As supercritical fluid removes
components during extraction, fractionation o f the extract becomes possible and
convenient. Therefore, supercritical fluid extraction can be used not only in extracting
components from sample but also in fractionating the components at the same time.
Fractionating components of interest during extraction has the advantage o f gaining a
higher concentration o f the component than is possible with traditional solvent
extraction. This can reduce the cost and time o f purifying specific components of
interest from the extract inherent in traditional solvent extraction. Application of
supercritical fluid for the purpose of extraction o f y-oryzanol has not been reported in
previous studies.
2.3.3. Low pressure chromatography in purification of y-oryzanol
After solvent extraction, crude rice bran oil containing a large amount o f various
lipids, besides y-oryzanol, is obtained. To purify y-oryzanol from interfering lipids in
crude oil, a low pressure chromatography technique is usually applied. Boven et al.
Reproduced with permission of the copyright owner. Further reproduction prohibited without permission.

8
(1997) reported that an aluminum oxide and silica gel column were used to isolate the
free sterol and minor compounds from rice bran oil, respectively. Kuroda et al. (1977)
used a silica gel column to obtain the sterol lipid fraction from rice bran oil. Hexane
mixed with another relatively high polarity solvent was used to flush the low pressure
column. y-Oryzanol was fractionated and collected when it eluted from the column.
Most interfering lipids were removed. Because of low resolution in low pressure
column chromatography, y-oryzanol was only partially purified and individual
components of y-oryzanol could not be isolated.
2.3.4. Preparative scale HPLC in purification and isolation of individual component of y-oryzanol
y-Oryzanol may be purified on a relatively large scale using preparative scale
HPLC. Application of preparative scale HPLC in purifying and isolating individual
components of y-oryzanol has not been studied. Preparative scale HPLC has been
gaining attention over the past few years, particularly in the pharmaceutical industry.
This type of chromatography makes use of stainless steel columns able to withstand
high pressure (up to 1500 psi.) and packed with small-size particles (10 to 30 p m ). The
preparative scale HPLC is similar to analytical HPLC, except for the size of the column
and capability of the mobile phase pump. It can be loaded with a relative large sample
with high column efficiencies. However, the preparative scale HPLC is considered to
be a very expensive technique, difficult to use, not really applicable on a large scale,
and limited to very high added value products (Ganetsos and Barker, 1993). The
amount of sample loading should be as great as possible within required resolution.
Otherwise, preparative HPLC results in high cost per product unit.
Reproduced with permission of the copyright owner. Further reproduction prohibited without permission.

9
2.3.5. Separation of components of y-oryzanol
Initially, y-oryzanol was analyzed from rice bran oil using thin layer
chromatography (TLC) technology. It was isolated as a single compound due to the
limitation of resolution of TLC, even though y-oryzanol is a mixture of ferulate esters o f
triterpene alcohols.
Lately, high performance liquid chromatography (HPLC) has been applied in
the study of y-oryzanol. Normal and reverse phase HPLC analyses were performed to
separate the components o f y-oryzanol. In normal phase HPLC, y-oryzanol was
separated into two fractions that were mixtures o f two or more individual components
o f y-oryzanol (Diack and Saka, 1994). Compared to normal phase HPLC, reverse phase
HPLC had higher resolution in separation. Usually, four fractions can be obtained
(Norton, 1995; Rogers et al., 1993). However, some components of y-oryzanol still
were not separated individually. This limits identification and quantification o f each of
the components of y-oryzanol. Therefore, the method of separating minor components
of y-oryzanol needs to be improved.
2.3.6. Identification and quantification of y-oryzanol
Gas chromatography-mass spectrometry (GC-MS) is a convenient method to
identify structure of unknown compounds. From mass spectrum, the information of
molecular weight and main structural aspects o f compounds can be accessed.
Components of y-oryzanol are difficult to mobilize with the gas phase in a GC column
since their temperatures of volatilization are above 400°C. They have to be split into
relatively small molecule (triterpene alcohol and ferulic acid) or estertified to reduce the
Reproduced with permission of the copyright owner. Further reproduction prohibited without permission.

10
attractive force between molecules by modifying their polar groups and lowering their
temperatures o f volatilization. These components possess ester bonds that connect the
triterpene alcohol and ferulic acid. They can be saponified in alkali solution to break
down their ester bond. Triterpene alcohol and ferulic acid are formed during
saponification. Since the only difference between y-oryzanol components is in the
structures of their triterpene alcohols, they can be identified according to their triterpene
alcohol structures in the mass spectrums. Triterpene alcohols are not easily volatilized
compounds either. They are usually derivatized to less polar compounds before
analysis in the GC-MS. Norton (1995) and Rogers et al. (1993) reported that
bis(trimethylsily)-trifluoroacetamide (BSTFA) was used to derivatize the triterpene
alcohol to form a volatile trimethylsilyl (TMS) ether derivative after the triterpene was
produced in the saponification.
Using this method, three o f four fractions were obtained in reverse phase HPLC
and identified as cycloartenyl ferulate, 24-methylene cycloartanly ferulate and
campesteryl ferulate (Norton, 1995; Rogers et al., 1993). These are the major
components of y-oryzanol. However, some fractions remained unidentified. They may
be mixtures of more than one component of y-orzyanol due to unsatisfactory separation,
which makes identification of these individual components difficult.
In Norton (1995) and Rogers et al. (1993), one o f the major components o f y-
oryzanol was used as a standard for all fractions in quantification since high purity
standards for each component were not available commercially and were difficult to
prepare. Thus, it was not deemed to be a satisfactory quantification method.
Reproduced with permission of the copyright owner. Further reproduction prohibited without permission.

11
2.4. Oxidation and antioxidation
2.4.1. Principle of lipid oxidation
The process of autoxidation consists of three steps, initiation, propagation, and
termination. In the initiation step, radicals are produced. These radicals react with
unsaturated fatty acids to form lipid hydroperoxides and generate other free radicals in
the propagation step. Reactions during propagation constitute a chain reaction until the
termination step. In the termination step, one radical reacts with another radical that
pairs odd electrons and forms a non radical product. These three steps are listed below.
Initiation: LH -> L» + H •
LOOH -» LO* + HO*
2LOOH -» LO* + LOO* + HzO
Propagation: L* + 0 2 LOO*
LOO* + LH -> LOOH + L*
Termination: LOO* + LOO* -> non radical product
LOO* + L* -> non radical product
L* + L* -> non radical product
Lipid oxidation produces hydroperoxides, the primary oxidation products, which
are colorless and odorless. These products are labile and readily produce a number of
secondary products, such as alkanes, alcohols, aldehydes, and acids. Some of the
secondary products are more odor-active and volatile. Therefore, secondary products
Reproduced with permission of the copyright owner. Further reproduction prohibited without permission.

12
contribute undesirable sensory characteristics to food. In the body, the primary
products also affect functions of cell membranes and many o f the secondary products
are highly reactive and react with the body's biological components, such as protein,
DNA, and lipids. This results in a number of diseases and tissue injuries, such as those
of the lungs, heart and cardiovascular system, kidneys, liver, gastrointestinal tract,
blood, eye, skin, muscle, brain, and with the processes of aging, mutagenesis, and
carcinogenesis (Foote, 1968; Gollnick, 1968; Nawar, 1985).
2.4.2. Effect of oxygen and temperature on lipid oxidation
Oxygen is an important factor inducing prooxidant states o f lipids. The most
activated species o f oxygen is singlet oxygen ^Ch). The electronic structure of the
activated form of oxygen facilitates its activity with lipids (Halliwell and Gutteridge,
1989). This step is listed below.
l0 2 + LH -> LOOH
Temperature is another important factor affecting oxidation of lipids. The rate
of oxidation increases with temperature. Oxidation occurs via the initial formation of
hydroperoxides. High temperatures can cause much isomerization to take place and
produce a variety o f secondary or breakdown products (Parkin and Damodaran, 1993).
2.4.3. Principle of antioxidation
Generally, an antioxidant is a compound that can terminate the free radical chain
reaction by donating hydrogen or electrons to free radicals and convert them to more
Reproduced with permission of the copyright owner. Further reproduction prohibited without permission.
13
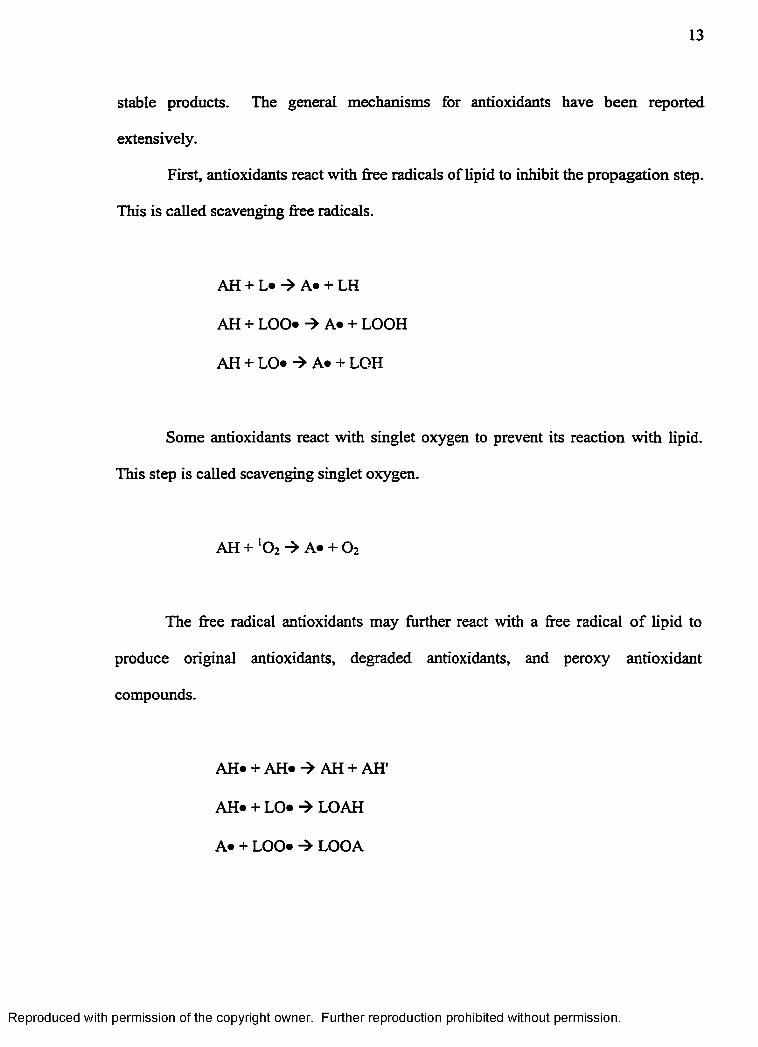
stable products. The general mechanisms for antioxidants have been reported
extensively.
First, antioxidants react with free radicals of lipid to inhibit the propagation step.
This is called scavenging free radicals.
AH + L* -> A* + LH
AH + LOO* -» A* + LOOH
AH + LO* -> A* + LOH
Some antioxidants react with singlet oxygen to prevent its reaction with lipid.
This step is called scavenging singlet oxygen.
AH + l0 2 -» A* + 0 2
The free radical antioxidants may further react with a free radical o f lipid to
produce original antioxidants, degraded antioxidants, and peroxy antioxidant
compounds.
AH* + AH* -> AH + AH'
AH* + LO* LOAH
A* + LOO* -» LOOA
Reproduced with permission of the copyright owner. Further reproduction prohibited without permission.

14
2.5. Natural antioxidants
Antioxidants from natural sources include phenolic and polyphenolic
compounds, chelators, antioxidant vitamins and enzymes. They are involved in the
control o f food autooxidation and rancidity. Also, they are associated with reducing
risk of cardiovascular diseases, cancer, cataracts, and other diseases o f aging.
Recently, the use o f natural antioxidants has been emphasized because of
increasing limitations on the use of synthetic antioxidants, which have been suggested
to have health implications. In general, natural antioxidants are preferred by consumers
because they are considered safe. Rajalakshmi and Narasimhan (1995) listed some of
the advantages and disadvantages of natural antioxidants (Table 1).
Table 1. Advantages and disadvantages of natural antioxidants
Advantages Disadvantages1. Readily accepted by the consumer, as considered to be safe and not a "chemical"
2. No safety tests required by legislation if a component of a food that is "generally recognized as safe" (GRAS)
1. Usually more expensive if purified and less efficient i f not purified.
2. Properties o f different preparations vary if not purified
3. Safety often not known.
4. May impart color, aftertaste, or off- flavor to the product.
Many reports have been published on the identification of naturally occurring
antioxidants from plants, animals, microbial sources, and other sources. Studies have
led to the identification of active ingredients and antioxidant components o f natural
compounds, such as rosemary, green tea, sesame seed, canola seed, and ginger (Burton
Reproduced with permission of the copyright owner. Further reproduction prohibited without permission.

15
and Ingold, 1984; Teral, 1989; Chimi et al., 1991; Marinova and Yanishieva, 1994).
Most natural antioxidants are flavonoids and related compounds in plant extracts and
phenolics in spices and herbs (Pratt, 1991).
Flavonoids with antioxidative function exist in fruits and vegetables, oilseeds,
tomatoes, onions, etc. and phenolic acids with antioxidant activity occur widely in
oilseeds and leaf extracts. The various active components identified in mustard seeds
and rapeseeds include cinnamic, ferulic, caffeic, sinapic, salicylic, and vanillic acids
(Kozlowska et al., 1990). Phenolic acids with antioxidant properties have also been
reported in soybeans, cottonseed, and peanuts.
Ferulic acid is a part of the structural components of y-oryzanol. Ohta et al.
(1994) identified ferulic acid sugar esters as active components in com bran
hemicellulose fragments. Activities of ferulic acid sugar esters were stronger than that
of free ferulic acid in the microsomal lipid peroxidation system.
Another part o f the structural components o f y-oryzanol, sterol (triterpene), also
was found to have antioxidative activity. Takagi and Iida (1980) reported that the
antioxidative activity o f canary seed extract (Phalaris canariensis) was due to various
sterols such as gramisterol, cycloartenol, sitosterol, campesterol, and triterpene alcohol
ester of caffeic acid.
Antioxidative function of y-oryzanol have been reported (Duve and White,
1991; Sonntag, 1979). The phenolic hydroxyl group in the feralate esters of y-oryzanol
may be responsible for its antioxidative function. Additional research is needed to
understand the nature o f antioxidant function in y-oryzanol.
Reproduced with permission of the copyright owner. Further reproduction prohibited without permission.

16
2.6. Methods of evaluation of antioxidant activity using lipid systems
Oxidative stability o f lipids with addition o f an antioxidant can be used to
evaluate antioxidant activity. Oxidative products are produced while lipids are oxidized
under a constant artificial condition. The number o f oxidative products indicates the
extent of oxidation. When an antioxidant is in the lipid system, the greater amounts of
oxidative products indicate lower antioxidant activity. The oxidative products are
usually quantified by chemical, instrumental, and sensory methods. Generally, there are
three methods for preparing artificial environmental conditions o f lipid oxidation,
accelerated stability, chemical generation, and enzymatic generation methods.
2.6.1. Accelerated stability methods
Accelerated stability methods are extensively used in evaluating antioxidant
activity of a compound. These tests are performed by increasing temperature and
oxygen concentration in a lipid system. Frankel (1991) reviewed and reported the
limitations of these tests. Reliable results were obtained when the test was done at room
temperature. But the disadvantage of this test was that it was time consuming and had
low sensitivity in monitoring oxidative products due to lower concentration. When high
temperature was used in the test, more numerous disadvantages occurred and affected
the results even though the test time was short. These disadvantages are: 1) the
solubility of oxygen decreases at elevated temperatures; 2 ) side reactions such as
polymerization and cyclization become important and may not be relevant to normal
room temperature; 3) most antioxidants are subject to significant decomposition at high
temperature.
Reproduced with permission of the copyright owner. Further reproduction prohibited without permission.

17
2.6.2. Chemical generation methods
Chemical systems to generate oxygen radicals are reported extensively. Sources
for OH free radicals comprise Fenton systems in aqueous solutions (Puppo, 1992) or
specific generation systems in organic solvents (Grant et al., 1984; Tezuka, 1988).
However, the Fenton system is not clearly understood as reactions of OH free radicals
or the strongly oxidizing ferryl species can not be discriminated on the basis o f kinetic
or analytical data (Rush and Koppenol, 1986; Rush et al., 1986). Niki (1990) stated that
peroxyl radicals result from oxygen attachment to alky radicals formed after
thermolysis o f a number of azo compounds. This system has been applied to study
flavonoid antioxidants (Ariga and Hamano, 1990). Chemical generation of alkoxyl
radicals via the organic Fenton reaction is a poor system for kinetic studies due to the
multitude o f radicals formed (Greenley and Davies, 1992).
2.6.3. Enzymatic generation methods
Enzymatic sources include xanthine oxidase (Cotelle et al., 1992) or the
NADPH oxidase of phagocytes (Pagonis et al., 1986), which generate predominantly
singlet oxygen. These enzymatic reactions are accompanied by production of unknown
levels of H2O2 . The H2O2 may form unpredictable levels o f OH free radicals by
reacting with trace metal ions in the Fenton reaction. Lipoxygenase usually generates
fatty acid peroxyl radical (Aziz et al. 1971; Grosch and Laskawy, 1979). Since these
are produced in close proximity to the prosthetic site, they may not be freely diffusible
and would not be capable o f reacting with antioxidants.
Reproduced with permission of the copyright owner. Further reproduction prohibited without permission.

18
2.7. Measurement of oxidative products
2.7.1. Chemical methods
Various chemical methods have been developed to measure hydroperoxides,
hydroxides, free fatty acids, and decomposition products, especially aldehydes, short
chain free fatty acid, and ketones. Peroxide value (PV) is the most common measure o f
oxidative rancidity. The sample is reacted with a saturated aqueous solution o f
potassium iodide, and the iodine liberated by the peroxides is titrated with a standard
solution of sodium thiosulfate (AOCS, 1994).
The thiobarbituric acid (TBA) test also is widely used in monitoring oxidation o f
lipids. It is based on the color reaction o f TBA with malonaldehyde. The colored
solution is measured at a wavelength of 532 nm. The Kreis test is another colorimetric
method based on the reaction of phloroglucinol with epoxyaldehydes and
malonaldehyde. The anisidine value depends on the reaction of aldehydes, especially 2-
alkenals, with /j-anisidine, and the reaction products are measured at 350 nm. The
carbonyl value is a measure of the carbonyl compounds formed during oxidation.
Volatile carbonyl products are converted to 2,4-dinitrophenylhydrazone derivatives in
the assay (Henick et al., 1954)
The advantages of these methods are that they are fast and simple. However, the
disadvantages are low accuracy and specificity, and poor repeatability.
2.7.2. Direct spectrophotometric methods
Since hydroperoxides and conjugated dienes have stronger absorption in the UV
region at 234 nm, direct spectrophotometric methods can be used. The extent o f
Reproduced with permission of the copyright owner. Further reproduction prohibited without permission.
19
formation o f hydroperoxides is indicated by the increased absorbency measured at a
wavelength of 234 nm. However, besides hydroperoxides, many compounds are
produced during oxidation or originally existed in the lipid system that also have
stronger absorption at this wavelength. This causes the method to lack sensitivity and
specificity.
Recently, electron spin resonance (ESR) spectroscopy has been used extensively
in detecting free radicals. It is based on the absorption o f microwave energy emitted by
the promotion of an electron to a higher energy level when the sample is placed in a
variable magnetic field. The ESR technique is more suitable in biological and food
systems. Compared to traditional spectrophotometric methods, sample matrix usually
does not largely affect results in the ESR method. The ESR method has high sensitivity
and employs simple sample treatment, but is expensive and not commonly available in
labs.
2.7.3. Chromatographic methods
Gas chromatographic (GC) methods are widely used for the measurement of
volatile compounds, either by headspace analysis or by direct injection. Oxidation
products o f lipids, such as 2-heptanal, 2-decanal, 2,4-decadienal, 2,4-heptadienal,
hexanal and pentane, are measured by GC. The disadvantage of GC is that the
oxidation o f lipids is accelerated in sample preparation and chromatography under high
temperature. This affects the reliability o f results.
High performance liquid chromatography is another chromatography technique
to measure hydroperoxides, hydroxides, and secondary oxidation products. The
Reproduced with permission of the copyright owner. Further reproduction prohibited without permission.
20
advantage of the HPLC method is that decomposition of the relatively labile
hydroperoxides and other oxidative products is reduced. The difficulty in using HPLC
methods is poor sensitivity in detection due to low concentration of hydroperoxides and
other products. UV and post-column reaction detection systems are usually used in
these methods. For the UV detector, the wavelength is set at 234 nm, which is the
maximum absorbency for polyunsaturated fatty acid hydroperoxides (DeMeyer et al.,
1991). In DeMeyer et al. (1991), two hydroperoxides, 13-hydroxyoctadecadienoic and
15-hydroxyeicosatrienoic acid, were quantified using a reversed phase column.
However, quantification o f four hydroperoxides of linoleic acid using HPLC have not
been reported. For post-column reaction detection systems, certain chemicals are used
to react with these oxidation products that elute from the HPLC column to produce high
absorbency substances (Akasaka, 1993; Miyazawa et al., 1994; Yamamoto, 1994).
These methods have higher sensitivity than direct UV detection.
Reproduced with permission of the copyright owner. Further reproduction prohibited without permission.

21
Cycloartenyl ferulate
24-Methylene cycloartanyl ferulate
ICampesteryl ferulate
Figure 1. Molecular structure of cycloartenyl ferulate, 24-methylene cycloartanyl ferulate, and campesteryl ferulate.
Reproduced with permission of the copyright owner. Further reproduction prohibited without permission.

CHAPTER 3
MATERIALS AND METHODS
3.1. Separation and identification of components of y-oryzanol
3.1.1. Chemicals and materials
All solvents were HPLC grade. Hexane was from Curtin Matheson Scientific
Inc. ( Houston, TX). Ethyl acetate was from EM Science (Gibbstown, NJ). Methanol
and dichloromethane were from Mallinckrodt Baker Inc. (Paris, KY). Acetonitrile and
acetic acid were from Fisher Scientific Inc. (Fair Lawn, NJ). Ascorbic acid and sodium
sulfate anhydrous were from Sigma (St. Louis, MO). Rice bran was a gift from the
Riviana Rice Mill (Abbeville, LA).
3.1.2. Extraction of crude oil
Twenty five gram of rice bran were placed in a 500-mL round bottom flask with
1 g ascorbic acid, 35 mL hexane, and 15 mL ethyl acetate. The flask was attached to a
rotary evaporator (RE 121, Brinkmann Inc. Switzerland) and placed in a 60°C water bath
for 40 min with 180 rpm. Then 25 mL distilled water was added to the flask. The flask
was placed on the rotary evaporator with the same temperature water bath and rotation
speed for 10 min. Solvent and rice bran residual were separated by filtration. Rice bran
residual was extracted a total o f three times using this process. The extracts o f the three
extractions were pooled and centrifuged at 4000xg for 10 min. The organic solvent
22
Reproduced with permission of the copyright owner. Further reproduction prohibited without permission.

23
layer was transferred to a 200-mL Erlenmeyer flask. Crude oil was obtained after the
solvent in the flask was evaporated in the rotary evaporator under vacuum at 60°C.
3.1.3. Semi-purification of y-orzyanol in a low pressure silica column
A glass column (2.5 cm x 25 cm) packed with 20 g silica (Grade 62) (EM
Industry Inc. NJ) was used to remove the triglycerides and other lipids. The solvent
consisted o f hexane and ethyl acetate. The first step o f the clean-up employed 50 mL of
the solvent (hexane : ethyl acetate = 9:1) for flushing through the column. In the next
step, 50 mL of the solvent (hexane : ethyl acetate = 7:3) was flowed through the column
and the eluant was collected. Then the column was washed with 50 mL of hexane :
ethyl acetate (5:5) and the semi-purified y-oryzanol was obtained after the solvent was
evaporated.
3.1.4. Purification of y-oryzanol using a preparative scale normal phase HPLC
The preparative HPLC system consisted o f Waters (Milford, MA) PrePak RCM
base packed with three 25 mm x 10 cm Prep Nova-Pak HR silica (particle size 6 pm)
cartridges and a Guard-Pak insert, a U6 K manual injector, a 510 pump, and a 481 LC
spectrophotometer detector. A Baseline 810 Chromatography workstation (Waters) was
used to record the chromatogram and calculate concentrations. The mobile phase was
4% (v/v.) ethyl acetate in hexane at a flow-rate o f 21.6 mL / min. The fraction of y-
oryzanol was monitored at 330 nm which is the X. ^ for y-oryzanol. The fraction of y-
oryzanol was collected and dried under nitrogen flow. High purity y-oryzanol was
prepared after drying.
Reproduced with permission of the copyright owner. Further reproduction prohibited without permission.

24
3.1.5. Separation of individual components of y-oryzanol in an analytical reverse phase HPLC
The analytical HPLC system that was used consisted o f a Dynatech (Baton
Rouge, LA) autosampler LC-241, a Waters 510 pump, a Hewlett-Packard (San
Fernando, CA) UV-VIS diode-array detector (Series 1050), and a 25 cm x 4.6 mm
diameter column of Microsorb-MV (Rainin Instrument Company, Woburn, MA).
The detector was set at 330 nm and 450 nm as reference. The mobile phase consisted of
methanol, acetonitrile, dichloromethane, and acetic acid (50:44:3:3, by vol.) and the
flow-rate was 1.4 mL / min.
Each peak was collected in a 15-mL test tube using a Gilson 202 fraction
collector (Beltline-Middleton, WI) and absorbence (330 nm) was measured using a
Gilford Response UV-VIS spectrophotometer (Okerlin, OH). Mobile phase was
evaporated under nitrogen flow. Each component standard was obtained after drying.
These components were used for TMS derivatization and GC-MS analysis for
identification and quantification.
The concentration o f y-oryzanol was the sum of concentration o f each individual
component o f y-orzyanol.
3.1.6. Hydrolysis and derivatization
The component obtained from the collected peak was hydrolyzed with 1 mL of
0.1 N sodium hydroxide in methanol at 80°C (water bath) for 30 min. Ultra-high-purity
nitrogen was flushed through the test tube for 15 sec during the addition of alkali. Then
the test tube was tightly capped as quickly as possible. One milliliter o f 0.1 N
hydrochloride and 2 mL ethyl acetate were added to the solution after hydrolysis. The
Reproduced with permission of the copyright owner. Further reproduction prohibited without permission.

25
solution was centrifuged at lOOOxg. Then the upper organic layer was transferred to a
10-mL test tube containing sodium sulfate anhydrous. The lower layer was mixed with
2 mL ethyl acetate and extracted again. The upper organic layer was combined with the
previous collection in a 10-mL test tube after the centrifugation. The sodium sulfate
anhydrous was removed by filtering and the organic solvent was evaporated under
nitrogen flow. The trimethylsilyl (TMS) ether derivative of the component was
obtained by adding to the test tube 0.1 mL pyridine and 0.1 mL
bis(trimethylsily)trifluoroacetamide (BSTFA) (Supelco Inc., Bellefonte, PA) that
contained 1% trimethylchlorosilane. The reaction was performed at 30°C (water bath)
for 30 min.
3.1.7. Gas chromatography (GC) and mass spectrometry (MS)
Derivatized components were determined using a SPB-5 fused silica column
(Supelco Inc., Bellefonte, PA) that was 30 m length x 0.25 mm i.d. x 0.1 pm film
thickness and a Hewlett-Packard 5790A GC coupled with 5970B mass selective
detector (MSD). Helium was used as the carrier gas and maintained at a flow rate of
1.5 mL / min. Injection was splitless and injection temperature was 250°C. Oven
temperature was programmed from 150 to 280°C at a ramp rate o f 5°C / m in. The
initial and final hold times were 0 and 9 min, respectively. MSD conditions were as
follows: capillary direct MS interface temperature, 280°C; ion source temperature,
280°C; ionization voltage, 70eV; mass range, 30 - 550 m/z\ scan rate, 1.67 scans / sec;
and electron multiplier voltage, 1800 V.
Reproduced with permission of the copyright owner. Further reproduction prohibited without permission.

26
3.2. Solvent and supercritical fluid extraction of y-oryzanol
3.2.1. Chemical and materials
All solvents were HPLC grade. Hexane was from Curtins Matheson Scientific
Inc. ( Houston, TX). Ethyl acetate was from EM Science (Gibbstown, NJ). Methanol,
isopropanol, and dichloromethane were from Mallinckrodt Baker Inc. (Paris, KY).
Acetonitrile and acetic acid were from Fisher Scientific Inc. (Fair Lawn, NJ). Ascorbic
acid, sodium hydroxide, and sodium sulfate anhydrous were from Sigma (St. Louis,
MO). Carbon dioxide used in supercritical fluid extraction was from BOC Gases
(Riverton, NJ). Rice bran was a gift of the Riviana Rice Mill (Abbeville, LA).
3.2.2. Solvent extraction using hexane with saponification
One gram o f rice bran was suspended in 5 mL distilled water in a 25-mL test
tube. Two-tenth gram of ascorbic acid and 0.1 mL of 80% (w/v) sodium hydroxide
were added to the test tube. The mixture was vortexed and incubated in a 60°C water
bath for 30 min. The test tube was centrifuged 200xg for 15 min after 5 mL hexane was
added and vortexed. The organic layer was collected in a funnel. The residual was
mixed with 5 mL hexane and centrifuged again. The organic layer was combined with
the previous collection. Distilled water was added to the funnel to rinse the organic
layer. After the funnel was allowed to stand for 10 min, the distilled water was drained.
The rinse step was repeated twice. Then, the organic layer was transferred to a conical
tube. The extract was obtained after the organic solvent was completely evaporated
under nitrogen flow.
Reproduced with permission of the copyright owner. Further reproduction prohibited without permission.

27
3.2.3. Solvent extraction using hexane without saponification
One gram of rice bran was suspended in 5 mL distilled water in a 25-mL test
tube. Two-tenths gram o f ascorbic acid were added to the test tube. The mixture was
vortexed and incubated in a 60°C water bath for 30 min. Five mL hexane was added to
the test tube. The test tube was centrifuged at 200xg for 15 min. The organic layer was
transferred to a conical tube. The residual was mixed with 5 mL hexane and
centrifuged again. The two organic layers were combined and evaporated. The extract
was obtained after the organic solvent was completely evaporated under nitrogen flow.
3.2.4. Solvent extraction using various solvents
The composition o f solvents in extraction is listed in Table 2. One gram of rice
bran and 5 mL of each solvent was added to a 25-mL test tube. The mixture was
vortexed and incubated in a water bath of defined temperature. Then the test tube was
centrifuged at 2 0 0 xg. The suspension was collected in a conical tube. The residue was
mixed with 5 mL of the same solvent or solvent mixture and centrifuged again. The
two suspensions were then combined. Solvent in suspension was completely
evaporated under nitrogen flow to obtain the extract. This process was replicated three
times.
3.2.5. Supercritical fluid extraction
Supercritical fluid extraction was performed using a Dionex SFE-703
supercritical fluid extractor (Dionex Corporation, Sunnyvale, CA). Carbon dioxide
(Grade 5.5) was used as a supercritical fluid. Figure 2 shows the typical device used in
supercritical fluid extraction. The pressure o f carbon dioxide was maintained at 680
Reproduced with permission of the copyright owner. Further reproduction prohibited without permission.

28
atm during extraction. The temperature of each extraction was 30, 40, 45, 50, 55, 60,
and 75 °C, respectively. Seven gram o f rice bran was weighed and packed in the
extraction cell o f the supercritical fluid extractor. Five mL hexane was added to a
collection vial. After collection, hexane was evaporated under nitrogen flow to obtain
extract.
Table 2. Composition of tested solvent in solvent extraction (unit: percentage of volume)No. of Solvent 1 2 3 4 5 6 7 8 9
Hexane 1 0 0 75 50 25 0 75 50 25 0
Ethyl Acetate 0 25 50 75 1 0 0 0 0 0 0
Isopropanol 0 0 0 0 0 25 50 75 1 0 0
3.2.6. Quantification for y-oryzanol
y-Oryzanol was quantified using a reverse-phase HPLC method. A C l 8 column
(Rainin Instrument Company, Woburn, MA), a Waters 510 pump (Waters, Milford,
MA), a Dyntech autosampler (Baton Rouge, LA), and a diode-array UV-VIS detector
(Hewlett-Packard, San Fernando, CA), were employed in the HPLC system. The
mobile phase consisted of methanol, acetonitrile, dichloromethane, and acetic acid (50 :
44 : 3 : 3). Flow rate was controlled at 1.4 mL /min and components were detected at
330 nm. Maxima chromatography workstation (Waters, Milford, MA) was used as
signal recorder and to calculate each concentrations of individual component of y-
Reproduced with permission of the copyright owner. Further reproduction prohibited without permission.

29
oryzanol. The concentration of y-oryzanol was obtained by summing all individual
components.
3.2.7. Isolation and purification of major components of y-oryzanol using a preparative scale reverse phase column
A Waters (Milford, MA) Delta Prep 400 HPLC system was modified in order to
load precise amounts in any sample size for both small and large scale columns (Figure
3). A PrePak RCM base packed with two 25 mm x 10 cm Prep Nova-Pak HR C l 8
(particle size 6 pm) cartridges and a Guard-Pak insert was used as a preparative scale
column to isolate and purify the three major components, cycloartenyl ferulate, 24-
methylene cycloartanly ferulate, and campesteryl ferulate of y-oryzanol. The
wavelength of the Waters 470 UV detector was 330 nm. Signal o f detector was
recorded using a Maxima chromatography workstation (Waters, Milford, MA). The
isolated components were collected using a Waters fraction collector (Milford, MA).
The A, B, C, and D tubing for delivering mobile phase in Prep Delta 400 HPLC system
were assigned to methanol, acetonitrile, dichloromethane, and acetate acid, respectively.
The ratio o f mobile phase was 50% A, 44% B, 3% C, and 3%D. The flow rate o f
mobile phase was 18 mL / min.
3.2.8. Statistical analysis
Replication for each solvent extraction was three times and for each supercritical
fluid extraction was six times. The experimental data were analyzed using the General
Linear Model procedure o f the Statistical Analysis System (SAS, 1994). Significant
difference between means was considered at P<0.05.
Reproduced with permission of the copyright owner. Further reproduction prohibited without permission.

30
3.3. Quantitative analysis of antioxidant activity using a linoleic acid model
3.3.1. Chemical and materials
All solvents were HPLC grade. Hexane was from Curtin Matheson
Scientific Inc. (Houston, TX). Isopropanol was from Mallinckrodt Baker Inc. (Paris,
KY). Ethyl ether and acetic acid were from Fisher Scientific Inc. (Fair Lawn, NJ). a -
Tocopherol, ferulic acid, and linoleic acid were from Sigma Company (St. Louis, MO).
3.3.2. Accelerated oxidation processing in linoleic acid
a-Tocopherol, ferulic acid, and the three high purity components of y-orzyanol,
cycloartenyl ferulate, 24-methylene cycloartanyl ferulate, and campesteryl ferulate,
obtained from the preparative scale reverse phase HPLC (described above) were
prepared at concentrations of 0.08, 0.16, and 0.40 mM in hexane as treatment solutions.
A pure hexane solvent was used as control. Linoleic acid solution (40 mM) was
prepared by dissolving 1.1202 g of linoleic acid in 100 mL of hexane. Then, 5 mL of
the linoleic acid solution and 5 mL o f each treatment or control solution were mixed in
a 25-mL test tube. The molar ratio o f treatment to linoleic acid was 1:100 (0.40 mM
treatment solution), 1:250 (0.16 mM treatment solution), and 1:500 (0.08 mM treatment
solution). An aliquot o f 500 pL of the mixing solution was transferred to a HPLC vial
to determine initial concentrations o f hydroperoxides. Then, the test tube was incubated
in a 37°C water bath. Tubing connected to compressed air (BOC Gases, Port Allen,
LA) was emerged in the test tube with the end o f the tubing touching the bottom o f test
tube. The apparatus of accelerated oxidation processing is shown in Figure 4. The flow
rate of air was controlled at 0.2 mL/min. Time o f sampling was scheduled at 40, 80,
Reproduced with permission of the copyright owner. Further reproduction prohibited without permission.

31
120, 160, and 200 min from the beginning o f incubation. In the sampling step, 500 pL
was taken from the solution and added to a HPLC vial after vortexing the solution well.
3.3.3. Analysis of hydroperoxides of linoleic acid
The hydroperoxides of linoleic acid were determined using a normal phase
HPLC method. The HPLC system consisted of a Waters (Milford, MA) 510 pump, a
680 automated gradient controller, a 715 ultra sample processor, a Hewlett Packard
(San Fernando, CA) UV-VIS diode-array detector, and a Baseline 810 chromatography
workstation (Waters, Milford, MA), and Zorbax SIL (Du-Pont Co., Wilmington, DE)
column. The mobile phase consisted of hexane, ethyl ether, isopropanol, acetic acid
(100:15:0.1:0.1) and flow rate (min, mL / min) was 0-18, 1.8; 17-18, 1.8-2.0; 19-39,
2.0; 39-40, 2.0-1.8 . Absorbance at 234 nm was monitored with the UV-VIS detector.
The standards of hydroperoxides and hydroxides of linoleic acid, 9-hydroperoxy-10-
trans, 12-cis-octadecadienoic acid, 9-hydroperoxy-1 Q-trans, 12-rra/zs-octadecadienoic
acid, 13-hydroperoxy-9-c/s,ll-rra/is-octadecadienoic acid, 13-hydroperoxy-9-rra/is,ll-
rra/ts-octadecadienoic acid, 9-hydroxy-1 Q-trans, 12-c/s-octadecadienoic acid, 9-
hydroxy-1 Q-trans, 12 -rra«5 -octadecadienoic acid, 13-hydroxy-9-c/^,l l-trans-
octadecadienoic acid, and 13-hydroxy-9-fra/r.y, 11 -fraws-octadecadienoic acid were from
Sigma (St. Louis, MO). Production of each hydroperoxide of linoleic acid at every
sampling time was obtained by deducting initial concentration from final concentration.
Total production of hydroperoxides was obtained by summing all
hydroperoxides. The rate (slope) of total production of hydroperoxides over time was
used to evaluate the antioxidant activity for each tested compound.
Reproduced with permission of the copyright owner. Further reproduction prohibited without permission.

32
3.3.4. Statistical analysis
Each treatment was evaluated in the linoleic acid model three times for
antioxidant activity. The production of each hydroperoxide o f linoleic acid was
analyzed using the General Linear Model procedure of the Statistical Analysis System
(SAS 1994). The rates of total production of hydroperoxides were analyzed using the
Regression Model of the Statistical Analysis System (SAS 1994). The significant
difference between rates for two compounds was considered at P < 0.05.
Reproduced with permission of the copyright owner. Further reproduction prohibited without permission.

Reproduced
with perm
ission of the
copyright ow
ner. Further
reproduction prohibited
without
permission.
restrictorExtraction chamberPump vent
Condenser
Collectionvial
CO
Extraction cell
Figure 2. Device of supercritical fluid extraction.
OJu>

34
Switching valve- O
< u s >Pump
Inlet of solvent
oPurge valve
Column switching valve
Static mixer □ □ injector va lveQ
Inlet o f sample (for large scale column)
o-Inlet o f sample
(for small scale column)
Largescale
column
Outlet to detector
Smallscale
column
(a) Before
Purge valve
SwitchingrOn
valve■o
Injector valve (
Column switching valve.
Static mixer
<LL9Inlet of solvent
Pump
Inlet o f sample (for large scale column)
Inlet of sample "(for small and large
scale column)
column
Smallscale
column
Oudet to detector
(b) After
Figure 3. Waters preparative HPLC (Delta Prep 400) fluid pathway before and after modification.
Reproduced with permission of the copyright owner. Further reproduction prohibited without permission.

35
U
00.S*cocooooU .a.c
CO
r2o
*oajcoW*O13oaco
CO3COa*a*<
a>300
E
Reproduced with permission of the copyright owner. Further reproduction prohibited without permission.

CHAPTER 4
RESULTS AND DISCUSSION
4.1. Separation and identification of components of y-oryzanol
4.1.1. Extraction o f crude oil
Crude oil o f rice bran was extracted using a solvent extraction method without
saponifcation. Saponification has usually been employed in most lipid extractions from
plant and animal tissues. This procedure could remove interfering triglycerides and
other hydrolyzable materials and aid to release lipid from sample matrix. A saturated
aqueous solution o f Na2C0 3 or KOH was used in rice bran oil extraction by Norton
(1995) and Diack and Saska (1994), respectively. However, saponification may also
hydrolyze the ester bond between triterpenoids and ferulic acid components of y-
oryzanol to produce ferulic acid and triterpenoids. The effect o f saponification on
extraction of y-oryzanol will be reported in the next section of this chapter. The yield of
y-oryzanol in extract obtained using hexane was lower than that that using a mixture of
hexane and ethyl acetate (7:3, v/v). This ratio o f hexane and ethyl acetate produced a
higher yield of y-oryzanol, compared to hexane, or other ratios o f hexane and ethyl
acetate. Details o f the effect of solvent polarity on the yield o f y-oryzanol are also
reported in the next section of this chapter. Ascorbic acid was added during extraction
in order to prevent the oxidation reaction from occurring. Three and half gram of crude
oil was obtained from 25 g of rice bran under this extraction condition.
36
Reproduced with permission of the copyright owner. Further reproduction prohibited without permission.
37
4.1.2. Semi-purification of y-oryzanol using a low pressure silica column
Figure 5 is a chromatogram o f crude rice bran oil flushed by different ratios o f
hexane and ethyl acetate in a low pressure silica column. The amount loaded on the
column was 3.5 g crude oil in 10 mL of hexane. Most of the low polarity lipid was
flushed out of the column with 50 mL of the solvent mixture hexane : ethyl acetate (9:1,
v/v). y-Oryzanol was eluted when the ratio of the mixture was changed to 7:3 (hexane :
ethyl acetate, v/v). This eluent was collected and dried under nitrogen flow from which
seven-tenths gram of semi-purified y-oryzanol was obtained.
4.1.3. Purification of y-oryzanol using a preparative scale normal phase HPLC
Five commercial silicas were compared for their resolution in separating the
individual components of y-oryzanol from rice bran oil (Diack and Saska, 1994). The
Nova-Pak (Waters) silica was found to possess the most desirable attributes o f the five
silicas. In this study, three 25 mm x 10 cm Prep Nova-Pak HR silica cartridges and a
Guard-Pak insert were used as a preparative scale normal phase column to purify y-
oryzanol from semi-purified y-oryzanol. The semi-purified y-oryzanol obtained from the
low pressure chromatography was diluted with dichloromethane and injected on the
preparative HPLC column. The chromatogram of semi-purified y-oryzanol in the
normal phase preparative scale HPLC is shown in Figure 6 . The y-oryzanol peak was
eluted at 35 to 42 min and collected. The profile of the chromatogram was the same as
that of Diack and Saska (1994) in analytical normal phase HPLC. There were several
fractions occurring before y-oryzanol eluted from the column, since semi-purified y-
Reproduced with permission of the copyright owner. Further reproduction prohibited without permission.

38
oryzanol contained a relatively high amount o f interfering lipids, such as triglycerides,
tocopherols, and tocotrienols.
The solvent o f the y-oryzanol fraction was evaporated, yielding approximately
36 mg o f purified y-oryzanol from the 0.7 g o f semi-purified y-oryzanol.
4.1.4. Separation of Individual components of y-oryzanol in an analytical reverse phase HPLC
Figures 7 and 8 are the chromatograms o f y-oryzanol components in an
analytical reverse phase HPLC after injecting high purity y-oryzanol and crude rice bran
oil obtained directly from solvent extraction, respectively. The numbered peaks in
Figure 7 were collected for identification o f their structures using GC-MS. Components
o f y-oryzanol in rice bran oil were separated using reverse-phase HPLC methods by
Evershed et al. (1988), Norton (1994 and 1995), Rogers et al. (1993), and Seitz (1989).
However, the resolutions of these separations were not entirely satisfactory and some
peaks had not been identified. Acetonitrile / /z-butanol / acetic acid / water (94:3:2:1,
v/v.) was used as the mobile phase in Norton (1995), which produced the highest
resolution of separation among these methods. In this study, the mixture of methanol /
acetonitrile / dichloromethane / acetic acid (50:44:3:3, v/v) was used as the mobile
phase with a run time of 42 min. The resolution o f separation was visibly improved
with a greater number o f separated peaks. The components in peak 3, 4, and 6 in Figure
8 were major components of y-oryzanol from rice bran. This was similar to the results
o f Norton (1995), Rogers et al. (1993), and Evershed et al. (1988). However, some
minor components that were not found in these studies, such as peak 1, 2, 5, 7, 8 , 9, and
Reproduced with permission of the copyright owner. Further reproduction prohibited without permission.

39
10, were observed in this study. Although a large amount of high purity y-oryzanol was
loaded on the analytical column, with responses that were out of range for the detector,
peaks of non-y-oryzanol components were much smaller than that found with the
loading of a small amount o f crude rice bran oil (Figure 7 and 8 ). This indicated that
most interfering lipids of rice bran oil were removed efficiently after purification using
low pressure and preparative scale normal phase chromatography.
4.1.5. Absorption spectrums of components of y-oryzanol using a spectrophotometer
The spectrum of absorbency of one component of y-oryzanol, sitostanly ferulate,
is shown in Figure 9. All of the individual components had similar absorption curves
with highest absorbance at a wavelength of 330 nm. This result is comparable to that of
Diack and Saska (1994).
4.1.6. Mass spectras of components of y-oryznaol using GC-MS
The total ion chromatogram (TIC) o f gas chromatograph-mass spectrometry
(GC/MS) of an individual TMS derivative, sitostanol-TMS ether, is shown in Figure 10
as an example. Sitostanol-TMS ether showed a single major peak in the chromatogram.
Peaks having retention time less than 15 min in the GC chromatogram were by-products
of derivatization, such as trifluoroacetamide, trimethylsilyltrifluoroacetamide, and
ferulate-TMS ether. The retention times o f TMS derivatives of components of y-
oryzanol varied from 24 to 28 min in each GC chromatogram.
Table 3 lists molecular ion and major fragment ions in mass spectra o f each
individual TMS derivative. The structures that were constructed based on the
information from mass spectras are depicted in Figure 11(a) and 11(b). A fair number
Reproduced with permission of the copyright owner. Further reproduction prohibited without permission.

40
of useful fragment ions were used to interpret structure of components produced in
electron ionization. In low mass range o f every mass spectrum, there were m/z 73 and
75 ions, which had relatively high abundance peak. The two ions were explained as
((CH3)3Si)+ and (HO=Si(CH3)2)+, respectively. Also, the presence of an ion at m/z 147
was ((CH3)2Si=0 -Si (CH3)3)+ formed from two or more TMS groups in a molecule
(Evershed, 1993). The molecular ion of each individual TMS derivative appeared in
this study, even though some were o f low intensity. The (M-15)+ was not a major
fragment ion. However, (M - TMS)+ and (M - TMS - CH3)+ were obtained as relatively
high abundance ions in each mass spectra. For cycloartenol-TMS and 24-methylene
cycloartanol-TMS, (M - TMS - CH3 - CH3 - CH2 + H)+ was an important major
fragment ion that did not appear in A7-stenol-TMS, sterol-TMS, and stanol-TMS. It
may have occurred because methyl groups in the structure o f the triterpene of
cycloartenol-TMS and 24-methylene cycloartanol-TMS were readily taken from the
molecule during ionization. Many major fragment ions of stanol-TMS in mass spectra
were larger than that of A7-stenol-TMS or sterol-TMS by two units of mlz. The reason
for this is that there is no double bond in triterpene structure o f stanol-TMS, which does
occur in the structure of A7-stenol-TMS and sterol-TMS. The most difficult aspect of
identification for these components was in distinguishing A7-stenol-TMS and sterol-
TMS since they have the same molecular weight and similar structure. The differences
in mass spectra between them in this study were the m/z 129 that was a moderate ion in
A7-stenol-TMS but one of the highest ions in sterol-TMS. In contrast, the mlz 229 that
was of lower abundance in sterol-TMS was a higher abundance ion in A7-stenol-TMS.
Reproduced with permission of the copyright owner. Further reproduction prohibited without permission.

41
Table 3. Molecular masses and major fragmentation ion o f TMS ether derivatives o f each peak collected in reverse-phase HPLC______________________________________Peak Molecular ion (mlz) Maior Fragment ions (mlz) Identification
1 484 379,255,229,213, 173,159, 145, 143, 129,119,105, 93,73
A7-Stigmastenol-TMS
2 484 394,379,355, 255,213,173, 159, 45, 143,129,119, 105,95, 73
Stigmasterol-TMS
3 498 408, 393,365, 339,297,255, 203, 187,159,149,131,95,81,69
Cycloartenol-TMS
4 512 422,407,379,297, 203, 187, 175, 173, 159,135, 95, 73, 69
24-MethyleneCycloartanol-TMS
5 472 382,367,255,229,213, 173, 159, 145, 129,121, 107, 95, 85, 75
A7-Campestenol-TMS
6 472 382, 367,234, 289, 261, 255, 213, 173, 159,129,121, 107, 95, 85, 75
Campesterol-TMS
7 486 471, 396, 381, 255, 229, 213, 173, 159, 145,129,121,105, 95, 75
A?-Sitostenol-TMS
8 486 396, 381,357, 275, 255, 213, 173, 159, 145, 129, 121, 105, 95, 75
Sitosterol-TMS
9 474 384, 369,257, 215, 173, 161, 147, 129, 121, 107, 95, 85, 75
Campestanol-TMS
1 0 488 473, 398, 383, 359, 305, 257, 215, 173, 161,147,129,121, 105, 95,75
Sitostanol-TMS
The relatively high intensity m/z 229 ion was a characteristic o f A7-stenol
compound (Gustafsson et al., 1966). Figure 12 shows the most probable mechanism of
formation of mlz 129 and m/z 229 in the sterol-TMS and A7-stenol-TMS, respectively.
For the sterol-TMS, carbon 1, 2, and 3 together with TMS were readily lost during
Reproduced with permission of the copyright owner. Further reproduction prohibited without permission.

42
ionization and formed the mlz 129 fragment ion. For the stenol-TMS, the loss of the
TMS group, the carbon 16 and 17, and the side chain of carbon 17 often occurs at the
same time. The molecular weight of the residual ion was mlz 229.
4.1.7. Components of y-oryzanol
From mass spectras o f TMS derivatives and absorbence curves of components
of y-oryzanol, ten components were positively identified in this study. They are listed
in Table 3 according to the order of retention time in the chromatogram of crude rice
bran oil in the analytical reverse phase HPLC (Figure 8 ). The molecular size o f each
component o f y-oryzanol is very close. Therefore, the molecular size was not an
important factor that affected the retention time o f each component in chromatography.
It is suggested that the peak retention times o f components o f y-oryzanol in the
analytical reverse phase HPLC are largely dependent on the number and positions of
double bonds, since they are related to the polarity of compounds, although the
relationship is not strong. Evidence was found that the retention time of components
containing two double bonds was less than that o f components having one double bond
or no double bond. Components having a double bond on a side chain of the triterpene
eluted prior to the components having a double bond in the triterpene.
The three largest peaks were cycloartenyl ferulate (peak 3), 24-methylene
cycloartanyl ferulate (peak 4), and campesteryl ferulate (peak 6 ). These are the major
components o f y-oryzanol in rice bran oil. This result was consistent with other studies
(Evershed et al., 1988; Norton, 1995; Rogers et al., 1993). Compared to the three major
components in rice bran oil, the peak areas of other components were much smaller.
Reproduced with permission of the copyright owner. Further reproduction prohibited without permission.

43
This situation usually is a limitation in implementing separation conditions for all
components o f y-oryzanol since minor components are readily neglected when they are
eluted with a major component. Peaks 8 and 9 that were identified as sitosteryl ferulate
and campestanyl ferulate, respectively, were not separated as two individual peaks in
Evershed et al. (1988) and Rogers et al. (1993). They occurred as a single peak in their
chromatograms and were considered as sitosteryl ferulate (Evershed et al., 1988) or a
mixture o f sitosteryl ferulate and cycloartanyl ferulate (Rogers et al., 1993). Although
they were separated in Norton (1995), one was identified as sitostanyl ferulate, which
differs from this study and the other was considered an unknown. Stigmasteryl ferulate
was reported to elute with campesteryl ferulate in a single peak (Rogers et al., 1993).
However, they were successfully separated as two individual peaks in this study.
Stigmasteryl ferulate was peak 2, with a shorter retention time. This supports the
contention that a component with more double bonds in the triterpene portion or in its
side chain has shorter retention time in reverse phase HPLC. The last peak in our
chromatogram was identified as sitostanyl ferulate. This was an unknown peak in
Rogers et al. (1993) and identified as cycloartanyl ferulate in Norton (1995).
In this study, four o f the ten identified components, A7-Stigmastenyl ferulate,
A7-campestenyl ferulate, A7-sitostenyl ferulate, and campestanyl ferulate, which were
not reported to be in rice bran oil previously, were separated and identified. They had
much smaller peak areas. The successful separation in this study has contributed to the
purification o f y-oryzanol from crude rice bran oil using low pressure chromatography
Reproduced with permission of the copyright owner. Further reproduction prohibited without permission.
44
and preparative scale normal phase HPLC. After y-oryzanol was highly purified, a
highly concentrated y-oryzanol could be injected in a relatively large amount on the
analytical column without losing resolution. This is beneficial in implementing
separation because minor components produced relatively high detector responses
under these conditions.
4.2. Solvent and supercritical fluid extraction of y-oryzanol
4.2.1. Solvent extraction of y-oryzanol using hexane with and without saponification
A significant difference between the concentrations o f y-oryzanol in extracted
oil using hexane with and without saponification is shown in Table 4. The
concentration of y-oryzanol in extracted oil without saponificaton was about two times
higher than that with saponification. The structure of y-oryzanol may be decomposed
during saponification because the ester bond between ferulic acid and the triterpene
component o f y-oryzanol was hydrolyzed under alkali condition (Figure 13). Although
the advantage o f saponification in many lipid extractions is breaking down the matrix of
sample to free compounds of interest and reducing interfering lipids, it has a significant
reverse effect on the yield of y-oryzanol in extraction. Norton (1995) reported that 3.4
mg y-oryzanol per gram of rice bran oil was extracted when saponificatoin was
performed using a saturated aqueous solution o f Na2C0 3 . Roger et al. (1993) also
reported that 0.115 to 0.787 mg y-oryzanol per gram could be extracted from refined
rice bran oils that were pretreated using alkali solutions. These concentrations were
lower than that without saponification in this study.
Reproduced with permission of the copyright owner. Further reproduction prohibited without permission.

45
Table 4. Yield o f extracted oil and concentration o f y-oryzanol in the extracted oil from 1 g rice bran using hexane with and without saponification_________________________
Weight o f oil extract (g)
Cone, of y-oryzanol in oil extract (mg/g)
With saponification 0.14 ±0.01 4.6 ± 0.5Without saponification 0.15 ±0.01 9.8 ± 0.2
4.2.2. Solvent extraction of y-oryzanol using different solvent ratios at different temperatures
The weights o f extracted oil obtained using different solvent mixtures were very
close and approximately 0.13 to 0.15 g per gram o f rice bran. However, there were
significant differences between concentrations of y-oryzanol in these extracted oils.
Figure 14 shows the concentrations of y-oryzanol in extracted oils obtained using
different solvent ratios. There were three groups that had significantly higher
concentrations. High concentrations of y-oryzanol could be extracted from rice bran
with solvent mixtures o f hexane : isopropanol (50:50, v/v) at 45°C, hexane : isopropanol
(75:25, v/v) at 60°C and hexane : isopropanol (50:50, v/v) at 60°C. Lower
concentrations of y-oryzanol were extracted with hexane : isopropanol (25:75, v/v) at
30°C and hexane: isopropanol (0:100, v/v) at 30°C. The other solvent mixtures at
different temperatures extracted intermediate concentration of y-oryzanol. Figure 14
also shows a trend towards a positive relationship between concentration o f y-oryzanol
in extracted oil and extraction temperature. This may be related to the physical property
of the matrix of the sample, which is more penetrable at higher temperatures and causes
y-oryzanol to be released from the matrix. Temperature o f extraction was an especially
important factor affecting concentration of y-oryzanol when isopropanol was used.
Reproduced with permission of the copyright owner. Further reproduction prohibited without permission.

46
Both highest and lowest concentrations o f y-oryzanol in extracted oil were obtained
when using solvents containing isopropanol. For solvents containing ethyl acetate, the
effect o f temperature on concentration o f y-oryzanol was not significant. The solvents
containing ethyl acetate or only hexane readily penetrated the rice bran matrix to extract
y-oryzanol regardless o f the physical property o f sample matrix as affected by
temperature. This may be due to the fact that these solvents had lower polarity and
preferentially extract lipids. A lower affinity for non-polar lipid and lower penetration
capability o f isopropanol compared to hexane or ethyl acetate may be due to it is higher
polarity and viscosity. Therefore, the extraction using solvents containing a high
percentage of isopropanol depended on high temperatures to assist in loosening the
structure of the sample matrix and increase mobility o f isopropanol. When the solvent
contained isopropanol and had greater access to lipids, there was greater capacity to
extract y-oryzanol than solvents containing ethyl acetate or only hexane. However,
temperatures above 60°C in solvent extraction have disadvantages in practice, such as
evaporation of extraction solvent.
4.2.3. Concentration of y-oryzanol in extracted oil at different extraction times using hexane : isopropanol (50:50, v/v) at 60°C
Concentrations at 30, 45, and 60 min were 11.0, 11.6, and 11.7 mg y-oryzanol
per gram o f extracted oil, respectively (Figure 15) when using hexane : isopropanol
(50:50, v/v) at 60°C. Significant differences occurred between 30 vs. 45 min and 30 vs.
60 min. However, the difference in concentration between 45 and 60 min was not
significant. Therefore, the extraction time could be shortened to 45 min without
significantly affecting the concentration o f y-oryzanol in extracted oil.
Reproduced with permission of the copyright owner. Further reproduction prohibited without permission.

47
4.2.4. Yield of extract using supercritical fluid extraction (SFE) under different conditions
Figure 16 shows the yield o f extract of SFE at different extraction times and
various temperatures. The yields o f extract in 10 min extraction time were significantly
increased at 55, 60, and 75°C. For extraction temperatures above 55°C, yields were the
highest and changed slightly after 10 min extraction. For extraction temperatures of 30,
40 and 45°C, yields continued to increase over time. The effect of higher extraction
temperature in SFE may be similar to that in solvent extraction where it may alter the
physical property o f the sample matrix and make it more penetrable by extraction fluid.
Therefore, high extraction temperature in SFE resulted in higher yield at shorter
extraction times.
The range o f yields of extracts in 20 min extraction time was 0.64 g at 30°C to
0.92 g at 60°C from 7 g o f rice bran. The percentage yield of extract from rice bran was
9.1 to 13.1 %. Yields were lower than that of solvent extraction (approximately 14%).
Garcia et al. (1996) reported that the highest yields for SFE were obtained at a pressure
of 28 MPa (280 atm) and a temperature o f 70°C for four hours, but total yield was only
7.1 %. Also, they concluded that the yield of y-oryzanol could be improved with more
severe extraction conditions. In this study, however, the yield of extract at higher
extraction temperature (75°C) was not significantly higher than that of 55 and 60°C.
Tsuda et al. (1995) found that the yield of extracts at 40°C also was higher than that of
60 and 80°C. It is suggested that severe SFE conditions may not assist to increase yield
of extract. It is possible that more extract escaped from the vent of the SFE system
because it was not condensed in the collection vial due to high extraction temperature
Reproduced with permission of the copyright owner. Further reproduction prohibited without permission.

48
and pressure. Therefore, yield o f extract was not positively associated with extraction
temperature. However, long extraction times with lower extraction temperatures also is
not good practice since it results in high consumption of expensive supercritical carbon
dioxide.
4.2.5. Yields and concentrations of y-oryzanol in extracts using SFE at different times and temperatures
Figure 17 shows the yields of y-oryzanol in extracts at different extraction time
and temperature using SFE. In 10 min extraction, the increase of y-oryzanol in extract
was significantly higher at extraction temperatures of 55, 60, and 75°C compared to
lower temperatures. After 10 min, however, y-oryzanol in extract did not increase
further at these extraction temperatures. Furthermore, the y-oryzanol in extracts at
extraction temperatures of 60 and 75°C for 20 min was significantly lower than that of
extraction temperature o f 50°C. In the first 10 min of extraction, a large amount of
extractable material in rice bran was already extracted at these higher extraction
temperatures (Figure 17). During 10 to 20 min extraction, a lesser amount o f
extractable material in rice bran was extracted at these temperatures. Because y-
oryzanol and other components were more mobile in the SFE system at lower
concentration and higher extraction temperature, they did not condense completely in
the collection vial and escaped from the vent. Thus, yields of y-oryzanol did not
increase further.
Table 5 lists yields and concentrations (above 100 mg per gram extract) o f y-
oryzanol in extracts at different extraction times. The highest yield of y-oryzanol in
Reproduced with permission of the copyright owner. Further reproduction prohibited without permission.

49
SFE was in 15 - 20 min at 45°C extraction temperature and highest concentration in
extract was at 15 -20 min at 50°C extraction temperature. From the results in Table 5, it
is suggested that y-oryzanol could be concentrated and extracted from the sample matrix
under a period of optimum extraction conditions. This is an important consideration
that may establish SFE as a valuable method in chemical extraction and separation. The
high concentration of y-oryzanol in extract obtained from SFE without the use o f toxic
organic solvents may be preferred in food and pharmaceutical industries. SFE
conditions can be selected based on extraction either for high yield or high
concentration of y-oryzanol. However, limitations o f the SFE device, such as
fluctuation o f flow rate and pressure that are important factors in extraction, caused
relatively high standard deviations.
Table 5. Yields and concentration o f y-oryzanol from 7.0 g o f rice bran in extract at different peroid of extract time and temperature__________________________________Temperature (°C) Time (min) Yield (mg) Cone, (mg/g)
40 15-20 9.3 ± 1.7 A 332.3 ±136.8 B,C45 15-20 1 1 . 8 ± 0 . 8 A 227.7 ± 65.4 B,C
2 0 -2 5 7.7 ±3.7 A 45* 00 4* o K- 00
0°
>—*50 15-20 7.8 ±3.7 A 674.6 ±148.1 A
2 0 -2 5 0.9 ±0.7 B 132.1 ± 81.8 CSignificant difference between groups without same letter.
4.2.6. Comparison of yields and concentrations of y-oryzanol in extracts between SFE and solvent extraction
Table 6 lists the yields and concentrations of y-oryzanol in extracts obtained
from solvent extraction and SFE, respectively. The yield o f SFE was three times higher
than that o f solvent extraction. Also, a large amount of solvent and time consumed in
Reproduced with permission of the copyright owner. Further reproduction prohibited without permission.

50
solvent extraction were eliminated in the SFE method. Furthermore, a much higher
concentration o f y-oryzanol was obtained in SFE when extract was collected during a
specific period (15 - 20 min) o f extraction time.
This process would allow higher loading on preparative scale columns for
purification o f individual components o f y-oryzanol and eliminate the need for low
pressure chromatography to concentrate the y-oryzanol (as described previously). The
extract o f SFE could be loaded on the preparative scale column directly without any
purification step. A chromatogram o f the extract o f SFE in preparative scale reverse
phase HPLC is shown in Figure 18. Compared to solvent extraction, SFE eliminated
the use o f expensive organic solvent in extraction, nitrogen for evaporating solvent, and
the need for a low pressure chromatography clean up procedure, which were necessary
in solvent extraction.
Table 6 . Comparison o f yields and concentrations o f y-oryzanol in extracts between SFE and solvent extraction
Item Solvent extraction1 SFE5 SFE3
Yield (mg /g o f rice bran) 1 . 6 8 ± 0 . 0 2 5 .39 ± 0.43 1.11 ±0.07Cone, (mg/ g o f extract) 1 1 . 8 ±0 . 2 51.0 ±5.5 674.6 ±148.1extraction with hexane : isopropanol (50:50) at 60°C for 60 min.
Extraction under 680 ATM at 50°C for 25 min.Extraction under 680 ATM at 50°C and collection between 15-20 min.
4.3. Quantitative analysis of antioxidant activities o f a-tocopherol, ferulic acid and the three major y-oryzanol components using a linoleic acid model
4.3.1. Hydroperoxides and hydroxides of linoleic acid
In this study, four hydroperoxides and hydroxides of linoleic acid were
separated using normal phase HPLC. Figure 19 shows chromatograms of
Reproduced with permission of the copyright owner. Further reproduction prohibited without permission.

51
hydroperoxides and hydroxides of linoleic acid during oxidation. The mechanism o f
formation o f hydroperoxides of linoleic acid is shown in Figure 20. Linoleic acid is
much more susceptible to oxidation because its structure contains 1,4-pentadiene. The
methylene group at position 11 is highly vulnerable during free radical attack (Nawar,
1996). Two conjugated dienes with free radicals, 10-,12- and 9-,11-, are formed after
linoleic acid reacts with free radical. Generally, the new double bond that is formed has
trans structure after geometric isomerization, which has lower energy than the cis
structure (Nawar, 1996). Thus, 9-hydroperoxy-10-trans, 12-m-octadecadienoic acid
(9HPODE(t,c)), 9-hydroperoxy-10-trans, 12-mzns-octadecadienoic acid (9HPODE(t,t)),
13 -hydroperoxy-9-m, 11 -rra/is-octadecadienoic acid (13HPODE(c,t)), and 13-
hydroperoxy-9-rra/ts,ll-rra/w-octadecadienoic acid (13HPODE(t,t)) are produced as
primary oxidation products of linoleic acid. Also, 9-hydroxy-10-trans, 12-cis-
octadecadienoic acid (9HODE(t,c)), 9-hydroxy-1 0-trans, 12-fra/z.s-octadecadienoic acid
(9HODE(t,t)), 13-hydroxy-9-cw,ll-/ra«s-octadecadienoic acid (13HODE(c,t)), and 13-
hydroxy-9-tra/is,ll-rra/is-octadecadienoic acid (13HODE(t,t)) are produced during the
sequence o f free radical chain reactions.
4.3.2. Developing quantitative analysis of hydroperoxides of linoleic acid
Currently, the methods that are used to analyze hydroperoxides involve
monitoring the formation o f conjugated diene at absorbance at 234 nm or by titrating
iodine which is oxidized from I' by hydroperoxides (Corongiu and Banni, 1994; Jessup
et al., 1994). These methods lack sensitivity and specificity to give reliable oxidation
status of lipids. To overcome these deficiencies, chromatography methods are being
Reproduced with permission of the copyright owner. Further reproduction prohibited without permission.

52
developed to analyze hydroperoxides. Thomas et al. (1992) and Guido et al. (1993)
utilized gas chromatography to perform this analysis. Although gas chromatography
enhances the sensitivity and specificity of analysis, it has disadvantages due to complex
derivatization of sample and decomposition of hydroperoxides during high temperature
analyses. In HPLC methods, post-column chemiluminescence reactions were used to
convert hydroperoxide to products that had high sensitivity for detectors since UV
detection was considered to be of low sensitivity for lower concentrations o f
hydroperoxides (Miyazawa et al., 1994; Yamamoto et al., 1994). However, many
factors related to the post-column reaction, such as temperature and pulse of flow rate,
reduce the chances of obtaining satisfactory results. The low response of the UV
detector in analyzing hydroperoxides may result not only from low concentrations of
hydroperoxides in sample but also incomplete separation. In incomplete separation,
each hydroperoxides may not be formed as a significant fraction at high enough
concentration to obtain satisfactory detector responses. In this study, sufficient
resolution of each hydroperoxide was obtained using an analytical normal phase HPLC
column and UV detector after the separation conditions for hydroperoxides of linoleic
acid were optimized (Figure 19). However, the fractions of hydroxides o f linoleic acid
were not as significant as that of hydroperoxides. The concentration of hydroxides may
be much lower than that o f hydroperoxides in oxidation of linoleic acid. Also,
hydroxides are not as important as hydroperoxides as indicators o f the degree of lipid
oxidation. Therefore, hydroperoxides of linoleic acid were quantified in this study to
evaluate oxidation status o f linoleic acid.
Reproduced with permission of the copyright owner. Further reproduction prohibited without permission.

53
The order o f elution o f the eight products separated using a normal phase HPLC
column was 13HPODE(c,t), 13HPODE(t,t), 9HPODE(t,c), 9HPODE(t,t), 13HODE(c,t),
13HODE(t,t), 9HODE(t,c), and 9HODE(t,t). Since the structure and molecular weight
o f linoleic acid hydroperoxides and hydroxides are highly similar, it is difficult to
separate them individually within a short retention time. The total running time was 40
min with gradient flow rate o f mobile phase that contained hexane, diethyl ether,
isopropanol, and acetic acid. Since the short wavelength (234 nm) used in the UV
detector was very close to the UV cutoff wavelength of diethyl ether, isopropanol, and
acetic acid, the baselines o f chromatograms were slightly shifted and noisy.
4.3.3. Linoleic acid model
Lipid oxidation involves many environmental factors, such as light, oxygen, free
radicals, and metal ions (Gordon, 1990; Frankel, 1991). Many model systems have
been employed to investigate oxidation of lipids and antioxidant activities of
compounds. Frankel (1991) reviewed and reported the limitation o f accelerated
stability models, which were performed by increasing temperature and oxygen
concentration in a lipid system. Reliable results were obtained when at room
temperature. However, a lower yield of oxidation products in mild conditions made
quantitative determination within hours more difficult. Chemical system models to
generate oxygen radicals have also been studied intensively. Sources for OH free
radicals comprised Fenton systems in aqueous solutions (Puppo, 1992) or specific
generation systems in organic solvents (Grant et al., 1984; Tezuka, 1988). However,
these models were much more complex and more difficult to understand due to the
Reproduced with permission of the copyright owner. Further reproduction prohibited without permission.

54
multitude of radicals formed (Greenley and Davies, 1992). Enzymatic generation
models also had limitations in the investigation o f antioxidant activity because o f the
restrictive structure o f enzymes.
On the another hand, the thiobarbituric acid (TBA) test also is a widely used
approach in monitoring oxidation o f lipids. However, the test results were questionable
due to many factors (Chirico, 1994). The chromogens that the test depends on are
formed by various aldehydes, besides malondialdehyde. The heating step in the test
results in further oxidation of sample and an overestimated value. Malondialdehyde is a
secondary oxidation product that is not sensitive in evaluating the degree of oxidation in
short time. Thus, the TBA test has low sensitivity and specificity in determination of
early stages of oxidation.
Figure 19 gives the chromatograms o f hydroperoxides and hydroxides of
linoleic acid at 0, 120, and 200 min in the linoleic acid model used in this study. The
four hydroperoxides increased significantly with increasing oxidation time under
continuous input o f air (0.2 mL/min) to the linoleic acid model. However, the changes
of the four hydroxides were not as great. These results reflected the status o f oxidation
in early stages o f lipid oxidation. As primary oxidation products, hydroperoxides were
produced in large quantities by oxidation reactions during the early stage of oxidation.
Their rate of formation exceeded their rate of decomposition. From Figure 19 and the
control group o f Table 7, the increasing amounts o f 13HPODE(t,t) and 9HPODE(t,t)
were significantly higher than that o f 13HPODE(c,t) and 9HPODE(t,c) during oxidation
with air. This imbalance or disproportional formation o f hydroperoxide isomers
Reproduced with permission of the copyright owner. Further reproduction prohibited without permission.
55
indicated that different formation mechanisms exist between HPODE (t,t) and HPODE
(t,c) or HPODE (c,t). Hydroperoxide molecules containing trans,trans are more
thermodynamically favorable to be formed than that having trans, cis or cis, trans during
continuous air input. Nawar (1996) also reported that 9- and 13- cis,trans diene
hydroperoxides undergo interconversion, along with some geometiric isomerization
forming trans, trans- isomers. Therefore, the major hydroperoxides o f linoleic acid
formed after lipids are attacked by singlet oxygen were hydroperoxides containing
trans,trans structure. Each hydroperoxide may also be produced by the free radical
chain reaction involving radicals existing in the system prior to the input of air. The
significant change of concentration for each hydroperoxide in the linoleic acid model
using the HPLC method demonstrated that this system could be used in quantitative
determination of the status of linoleic acid oxidation. It is very sensitive and fast since
the determination can be completed in hours. Also, the mild conditions o f oxidation in
this model, 37°C and gentle input o f air, resulted in more reliable experimental data than
some other models that used severe or complex oxidative conditions (Frankel, 1991).
4.3.4. Profile of production of hydroperoxides in a-tocopherol treatm ent
Figure 21 shows the chromatograms of hydroperoxides and hydroxides of
linoleic acid after adding a-tocopherol (a-tocopherol: linoleic acid molar ratio = 1:250)
at 0, 120, and 200 min. Compared to the control, the concentration change of each
hydroperoxide was slight (Table 7). Significant antioxidant activity o f a-tocopherol
was observed in this linoleic acid model. From Figure 21 and Table 7, the production
of 13HPODE(c,t) and 9HPODE(t,c) was significantly higher than that o f 13HPODE(t,t)
Reproduced with permission of the copyright owner. Further reproduction prohibited without permission.

56
and 9HP0DE(t,t) in the a-tocopherol treatment, even though all were much lower than
the control. The profile o f production o f these hydroperoxides in the a-tocopherol
treatment was contrasted to changes in the control. a-Tocopherol had high antioxidant
activity against oxidation due to air. This indicated that the singlet oxygen, which is a
major contributor to the formation of hydroperoxides containing trans,trans structure,
was reduced largely after adding a-tocopherol to the linoleic acid model. Also, the free
radical chain reaction caused by radicals initially existing in the system and producing
hydroperoxides was mostly inhibited in view of slight production of hydroperoxides
containing trans.cis or cis,trans structure. Two primary antioxidation mechanisms for
a-tocopherol, chain-breaking electron donor and chain-breaking acceptor mechanism
were discussed in Briviba and Sies (1994). In the chain-breaking electron donor
mechanism, a-tocopherol reacts with peroxy radical by readily transferring a hydrogen
atom to the peroxy radical to produce the more stable hydroperoxide. The chain-
breaking acceptor mechanism includes singlet oxygen scavenging. Clough et al. (1979)
reported that singlet oxygen scavenging is more predominant and hydroperoxydienone
tocopherol is formed after a-tocopherol quenched a singlet oxygen. The results in this
study supported their explanations and a-tocopherol appears to have a strong ability in
scavenging singlet oxygen and free radicals, such as peroxyl radical.
4.3.5. Profile of production of hydroperoxides in ferulic acid treatment
Figure 22 shows the chromatograms of hydroperoxides and hydroxides of
linoleic acid with ferulic acid (ferulic acid : linoleic acid molar ratio = 1:250) at
different oxidation times (0, 120, and 200 min). The production of hydroperoxides in
Reproduced with permission of the copyright owner. Further reproduction prohibited without permission.

57
ferulic acid treatment are listed in Table 7. Antioxidant activity o f ferulic acid was
observed through lower concentrations o f each hydroperoxide, compared to the control
group. Different profiles for production o f the hydroperoxides were observed between
ferulic acid and a-tocopherol treatment. The production o f hydroperoxides containing
trans, trans structure in the ferulic acid group was significantly higher than that in the a -
tocopherol group. However, the production of hydroperoxides containing trans.cis or
cis,trans was lower in ferulic acid treatment than a-tocopherol treatment. Therefore,
the mechanism of antioxidation of ferulic acid was not the same as that of a-tocopherol.
The antioxidant activity o f ferulic acid appeared mostly in reducing free radical
reactions due to radicals, such as peroxy radical, which initially existed in the system or
were produced during oxidation. The ability of ferulic acid to scavenge singlet oxygen
was not as high as a-tocopherol. Ferulic acid, as a type of phenolic acid, has been
reported to have antioxidant activity (Marinova and Yanishieva, 1994). Generally,
phenolic antioxidants inhibit lipid oxidation by trapping the peroxy radical to yield the
hydroperoxide. They prevent the reaction of lipid and peroxy radical to produce the
lipid radical and propagate free radical chain reactions. The results obtained for ferulic
acid treatment support this explanation. Also, the ability o f trapping the peroxy radical
in the ferulic acid group was stronger than that o f the a-tocopherol group. The
mechanism of antioxidant activity of ferulic acid is primarily in quenching peroxy
radicals in linoleic acid to prevent further generation o f free radicals.
Reproduced with permission of the copyright owner. Further reproduction prohibited without permission.

Reproduced
with perm
ission of the
copyright ow
ner. Further
reproduction prohibited
without
permission.
Table 7. Production of hydroperoxides of control, a-tocopherol, and ferulic acid treatment after 120 and 200 minutes of oxidation (treatment component: linoleic acid molar ratio = 1 : 250)
Products 13HPC>DE(c,t) 13HPODE(t,t) 9HPODE(t,c) 9HPIDDE(t,t)Time (min) 1 2 0 2 0 0 1 2 0 2 0 0 1 2 0 2 0 0 1 2 0 2 0 0
Control 225.7±36.1 316.2±56.9 517.9±77.7 950.4±76.0 71.8± 8 . 6 134.1± 6.7 185.5±31.5 370.8±14.8a-Tocopherol 78.7± 7.9 119.7± 9.6 41.0± 3.3 54.2± 3.8 50.7±6.1 78.7± 6.3 26.8± 2 .1 34.6± 2.8Ferulic acid 48.9± 3.9 70.5± 7.8 151.0±22.6 244.8±39.2 24.7± 1.5 61.0±7.3 60.8± 4.9 100.2±15.0
00
59
4.3.6. Antioxidant activity of a-tocopherol at different ratios to linoleic acid
The rates of hydroperoxide production in linoleic acid with a-tocopherol (a-
tocopherol : linoleic acid molar ratio = 1:100, 1:250, and 1:500) are shown in Figure
23(a), 23(b), 23(c) respectively. Antioxidant activity of a-tocopherol was indicated by
significantly lower rates o f hydroperoxide production. In contrast to other components
that reduced the production of hydroperoxides as the antioxidant ratio increased, a -
tocopherol did not maintain the lowest rate o f production of hydroperoxides when the
molar ratio was increased to 1:100. This suggests that increasing concentration of a-
tocopherol in linoleic acid above a certain level did not increase antioxidant activity
further and even reduced its activity. Jung and Min (1990) reported that tocopherols
had significant prooxidant effects at higher concentration. Figure 24 shows the
increased concentration o f individual hydroperoxide in the linoleic acid model after 2 0 0
min with three different ratios of a-tocopherol. The high rate of hydroperoxide
production at a higher ratio of a-tocopherol was due primarily to the formation of
hydroperoxides containing cis,trans or trans.cis structure. At the same time,
hydroperoxides containing trans, trans were extensively inhibited by a-tocopherol.
Therefore, high concentration of a-tocopherol still demonstrated scavenging of singlet
oxygen to prevent formation of trans,trans hydroperoxides but appeared to elicit
prooxidant activity by accelerating free radical reactions that produce cis, trans and
trans.cis hydroperoxides.
Reproduced with permission of the copyright owner. Further reproduction prohibited without permission.
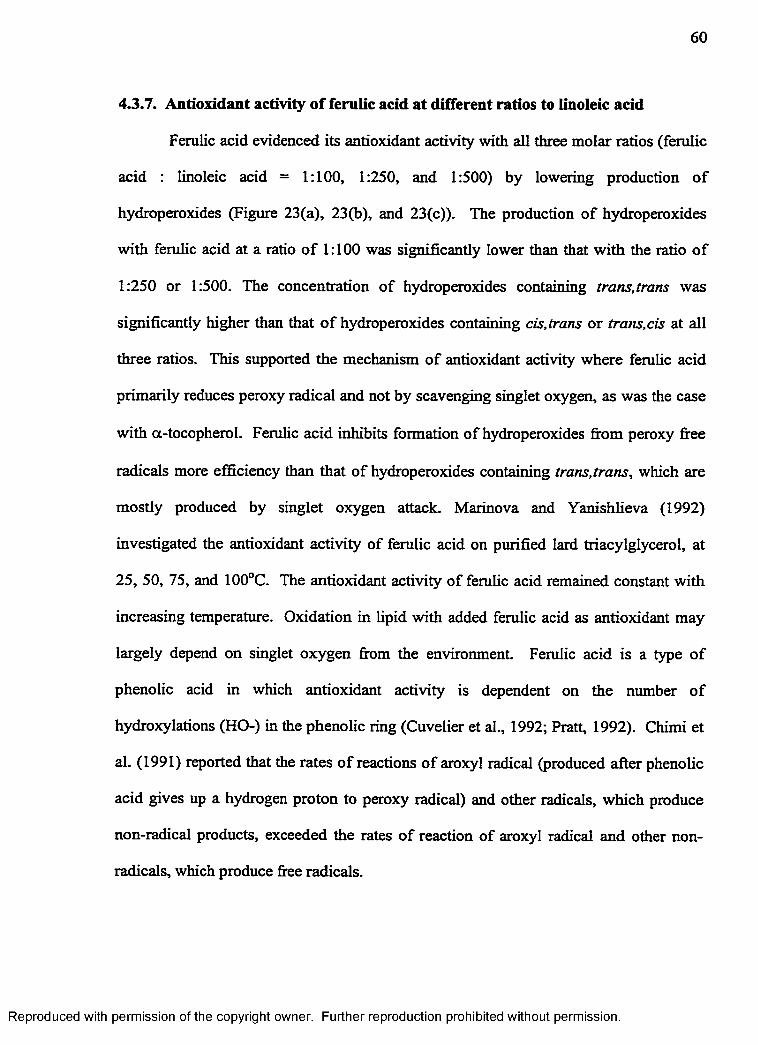
60
4.3.7. Antioxidant activity of ferulic acid at different ratios to linoleic acid
Ferulic acid evidenced its antioxidant activity with all three molar ratios (ferulic
acid : linoleic acid = 1:100, 1:250, and 1:500) by lowering production o f
hydroperoxides (Figure 23(a), 23(b), and 23(c)). The production o f hydroperoxides
with ferulic acid at a ratio o f 1 : 1 0 0 was significantly lower than that with the ratio o f
1:250 or 1:500. The concentration o f hydroperoxides containing trans,trans was
significantly higher than that o f hydroperoxides containing cis,trans or trans.cis at all
three ratios. This supported the mechanism of antioxidant activity where ferulic acid
primarily reduces peroxy radical and not by scavenging singlet oxygen, as was the case
with a-tocopherol. Ferulic acid inhibits formation of hydroperoxides from peroxy free
radicals more efficiency than that of hydroperoxides containing trans,trans, which are
mostly produced by singlet oxygen attack. Marinova and Yanishlieva (1992)
investigated the antioxidant activity of ferulic acid on purified lard triacylglycerol, at
25, 50, 75, and 100°C. The antioxidant activity of ferulic acid remained constant with
increasing temperature. Oxidation in lipid with added ferulic acid as antioxidant may
largely depend on singlet oxygen from the environment. Ferulic acid is a type of
phenolic acid in which antioxidant activity is dependent on the number o f
hydroxylations (HO-) in the phenolic ring (Cuvelier et al., 1992; Pratt, 1992). Chimi et
al. (1991) reported that the rates o f reactions o f aroxyl radical (produced after phenolic
acid gives up a hydrogen proton to peroxy radical) and other radicals, which produce
non-radical products, exceeded the rates of reaction of aroxyl radical and other non
radicals, which produce free radicals.
Reproduced with permission of the copyright owner. Further reproduction prohibited without permission.

61
4.3.8. Antioxidant activities of the three major components of y-oryzanol at different ratios to linoleic acid
Three major components of y-oryzanol, cycloartenyl ferulate, 24-methylene
cycloartanyl ferulate, and campesteryl ferulate, demonstrated significantly lower rates
o f hydroperoxide production at the ratios o f 1:100 and 1:250 (Figure 23(a) and 23(b)).
This observation indicated that the three components of y-oryzanol possess antioxidant
activity and supported the observation of antioxidant activity o f y-oryzanol in previous
studies (Duve and White, 1991; Sonntag, 1979). Antioxidant activities o f these
components decreased significantly with decreasing concentration in the linoleic acid
model.
Figures 25, 26, and 27 show the chromatograms o f hydroperoxides and
hydroxides o f linoleic acid with each of the three components o f y-oryzanol (component
: linoleic acid molar ratio = 1:250) at different oxidation times (0, 120, and 200 min).
The profiles o f concentration changes of individual hydroperoxide in linoleic acid
models with each o f the three components were similar to those with ferulic acid. The
concentrations o f hydroperoxides containing trans,trans increased much more than did
the concentrations o f hydroperoxides containing trans.cis and cis,trans. This suggests
that the mechanism of antioxidation of components of y-oryzanol was the same as that
o f ferulic acid. The antioxidant activity o f these components relied on the phenolic
hydroxyl group in the ferulate portion of their overall structure. Cuvelier et al. (1992)
and Pratt (1992) reported that other components of phenolic acid compounds are
important factors that affect antioxidant activity. Ohta et al. (1994) found that
antioxidant activities of ferulic acid sugar esters were stronger than that of free ferulic
Reproduced with permission of the copyright owner. Further reproduction prohibited without permission.

62
acid in a microsomal lipid peroxidation system. In the linoleic acid model o f this study,
free ferulic acid had higher activity than the three ferulic acid sterol esters did at the
three different ratios, especially at a lower concentration molar ratio (1:500). The
triterpene portion o f y-oryzanol may affect its antioxidant activity.
Sterol (triterpene), a part o f these components, was reported to have
antipolymerization activity in heated oils (Tian and White, 1994; White and Armstrong,
1986; Yan and White, 1990). The side chain o f sterol is important for the
antipolymerization activity (Tian and White, 1994). Takagi and Iida (1980) reported
that the antioxidant activity of canary seed extract (Phalaris canariensis) was due to
various sterols such as gramisterol, cycloartenol, sitosterol, campesterol, and triterpene
alcohol esters o f caffeic acid. Since the hydroxyl o f sterol, which would potentate
antioxidant activity in the sterol portion, is not free in y-oryzanol, the sterol component
of y-oryzanol may not contribute to antioxidant activity.
The rate o f production o f hydroperoxides in the linoleic acid model with each of
the three major components o f y-oryzanol was significantly higher than that of a -
tocopherol at ratios of 1:250 and 1:500. However, at a ratio of 1:100, the rates of
production o f hydroperoxides of these components were lower than that of a-
tocopherol. Therefore, antioxidant activities of the three components o f y-oryzanol
were significantly lower than that o f a-tocopherol or ferulic acid at lower
concentrations in the linoleic acid model.
Reproduced with permission of the copyright owner. Further reproduction prohibited without permission.

Reproduced
with perm
ission of the
copyright ow
ner. Further
reproduction prohibited
without
permission.
j?oa8fc*ouaoO
oo G \
00
mooo
o o
13 25 38 50 63 75 88
Volume o f mixture so lv e n t (mL)
— ■ — C o n e . ♦ HEX:EA
100 113 125
Figure 5. Chromatogram of crude rice bran oil in the low pressure silica column.
Perc
enta
ge
(voL
) of
ethy
l ac
etat
e in
solv
ent

64
-O
-O
_0
oo D oo
nsi■Hac
N
Reproduced with permission of the copyright owner. Further reproduction prohibited without permission.
Figu
re 6
. Ch
rom
atogr
am
of se
mi-p
urifi
ed
y-or
yzan
ol in
the
no
rmal
phas
e pr
epar
ative
H
PLC.

65
ON
sO
_D
I I Ia
O Q3«OA
Reproduced with permission of the copyright owner. Further reproduction prohibited without permission.
Figu
re 7.
Chro
mato
gram
of
high
purit
y y-
oryz
anol
in
the
anal
ytic
al r
evers
e ph
ase
HPLC
for
col
lectin
g fra
ctio
n.

66
ON
00
CN
DOo
AII*ac
0H
» N« H O A O l X
Reproduced with permission of the copyright owner. Further reproduction prohibited without permission.
Figu
re 8
. Ch
rom
atogr
am
of cru
de
rice
bran
oil in
the
an
alyt
ical
rev
erse
ph
ase
HPL
C.

67
VO
oo«N
00c
4>>
c35
>% C CO -*—»COO
Oc_o&oCO-OCQQ-iOa58o.
C/3
O nOt-c3(JO
<nt— NO
u eq iosq v
Reproduced with permission of the copyright owner. Further reproduction prohibited without permission.

68
V* B
W
wmi ’
CO
UOc
COsH
coo"3Cmo
ob0 os 61oco
oT3CCdcd
o«DCl.C/5COCO
Ou300h
Reproduced with permission of the copyright owner. Further reproduction prohibited without permission.

69
1)
2)
3)
4)
5)
A7-Stigmastenyl ferulate
Stigmasteryl ferulate
HCycloartenyl ferulate
CI^OHi c r -
24-Methylene cycloartanyl ferulate
A7-Campestenyl ferulate
Figure 11(a). Molecular structures o f identified components o f y-orzyanol.
Reproduced with permission of the copyright owner. Further reproduction prohibited without permission.

7)
8)
9)
Campesteryl ferulate
c^o.Hi
A7-Sitostenyl ferulate
CH£>.
H'°a x r ^Sitosteryl ferulate
Xo
10)CI|0.
Campestanyl ferulate
X.Sitostanyl ferulate
Figure 11(b). Molecular structures o f identified components of y-orzyanol.
Reproduced with permission of the copyright owner. Further reproduction prohibited without permission.

71
Reproduced with permission of the copyright owner. Further reproduction prohibited without permission.

Reproduced with permission of the copyright owner. Further reproduction prohibited without permission.
Figu
re 13
. Hy
drol
ysis
of ca
mpe
stery
l fer
uate
unde
r alk
ali c
ondi
tion.

Reproduced
with perm
ission of the
copyright ow
ner. Further
reproduction prohibited
without
permission.
12.00
11.00
f-Ho0a£ 10.00 l-lO<+HocJ
o 9 .0 0 u
8.00O <N
o
Temp.(°C)
—♦ — 30
— A — 60
R a tio o f m ix tu re s o lv e n t
H-Significantly high group; L~significantly low group; EA~Ethyl acetate; HEX--Hexane; ISOP-lsopropanol.
Figure 14. Concentration of y-oryzanol in extracted oil using different solvent ratios at 30,45, and 60°C for 60 min.
-Ju>

Reproduced
with perm
ission of the
copyright ow
ner. Further
reproduction prohibited
without
permission.
1 2 .5 0
12.00 -
2 H-50 CQaN
&° 11.00 ocjoo
1 0 .5 0
10.00
3 0 4 5 6 0
T im e (m in )
Signitlcant difference (P<0.05) is expressed by different letters.
Figure 15. Concentration ofy-oryzanol in extracted oil using the solvent mixture hexane: isopropanol (50 :50, v/v) after 30,45, and 60 min at 60°C.

Reproduced
with perm
ission of the
copyright ow
ner. Further
reproduction prohibited
without
permission.
Temp.(°C) - ♦ - 3 0
- • - 4 0
—♦—45
- * - 5 0
- a - 55
- A - 60
- * - 7 5
0 5 10 15 20 25
Time (min)
Significant difference (P<0.05) is expressed by different letters.
Figure 16. Yield of extract of SFE at different extraction times and temperatures.
23 0.8
Ui

Reproduced
with perm
ission of the
copyright ow
ner. Further
reproduction prohibited
without
permission.
50
45
40
2 30 -
Th
k T em p. (°C)
# in
jfH^M
▼ JU
i r M- ■ — 40
. Jvl• ■ ^ 45
MI ( m — 0— 50
: = p 55
° L-- - A - 60
__^ __-75
T im e (m in )
Significant difference (P<0.05) is expressed by different letters.
25
Figure 17. Yield ofy-oryzanol in extract of SFE at different times and temperatures.
ON

77
_ 0
_ 0
_ 0
□0 o o
3cV *
tr*0
Reproduced with permission of the copyright owner. Further reproduction prohibited without permission.
Figu
re 18
. Ch
rom
atogr
am
of ex
tract
of SF
E in
the
reve
rse
phas
e pr
epar
ative
H
PLC.

78
Reproduced with permission of the copyright owner. Further reproduction prohibited without permission.

Reproduced
with perm
ission of the
copyright ow
ner. Further
reproduction prohibited
without
permission.
13 12 I I 10 9
R,-C =C-C-C=C-R2-COOH
13 12 11 10 9
R,-C=C-C=C-C-R 2 - c o o h
13 12 11 10 9 ' I '
R!-C=C-C=C-COOH-R2 - c o o h (9HPODE)
13 12 I I 10 9
r , - c . - c = c - c = c - r 2 - c o o h
13 12 11 10 9
R!-HOOC-C=C-C=C-R2 - c o o h (13HPODE)
Figure 20. Mechanism of formation of hydroperoxides of linoleic acid during autooxidation
- 4VO

80
_ s
_ s
.8
S
CN JSt-_ S
S
_ S
_a
X--
CUQOasO n
CUQOasON
cuQOasro
uSTQoasn
CDQOcuasON
CJ<-TSTQOcuXO '
CUQOcuXro<N
CDQOcuXr*1
<L>JZCUoo01a
»
£*o•
03O* |H
*22 o
CO(U
CO<L>6■*-*co
•
a12’xo-MC<ou..a>
•a> NJS
'O
-acB
i ®CO < N a> .. T3 „
IIx § .2 2 2
" o S
« 3I 3I— r_)oo .2 - €
Oa
jzCuhO
O«S2ja
V 2 <Dac cu o o5 2 60 •
E 3 ,
CN<L>
Reproduced with permission of the copyright owner. Further reproduction prohibited without permission.
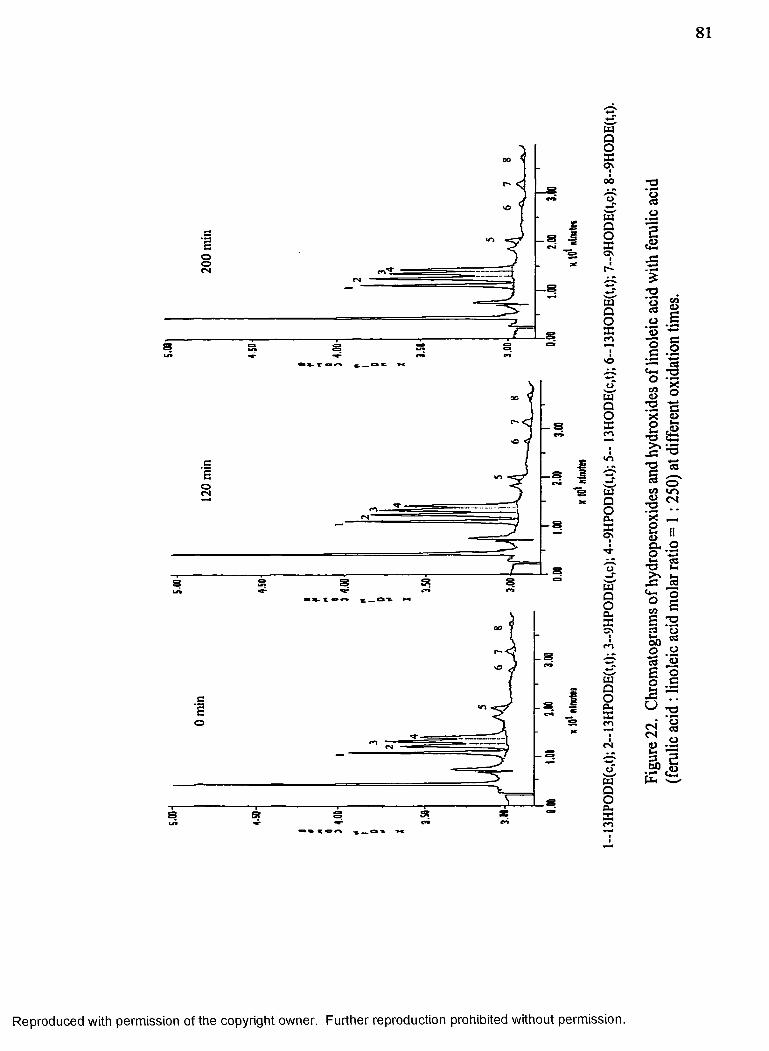
81
T' X
- So
sB
o
&S
tuQOSCO n
aQOSCO N
uQO33mII\o
tuQoscco
wQOcuXO N
wQOcuSCON
wQOcuXm
PJQOcuXm
OC3
s£
•o"3 °>
s §
II— rt ti-i *o° * u °
3 3 § 2 S
■a 5C -C ^3 3eo o
3 -- x _
2 ii Cu O0 ’-X t - 03
T 3 u .> N U .JZ cS'rt °° £CO c1 --« CJ & « o 303 «S ©O C3
3 -^ T3
s ' oa> Jsl ) gfe w
Reproduced with permission of the copyright owner. Further reproduction prohibited without permission.

82
Ecua.o;o><oh -ucuow
T3>»
UeoO
2000.0
1500.0 -
(a) 1 : 1 0 0 in mole
1000.0
500.0
40 80 120 160
Ecucu
uaXol _ua.o
•a>*
soU40 80 120 160
Oxidation time (mm)
200
200
240Oxidation time (min)
2000.0(b) 1:250 in mole
1500.0
1000.0
500.0
0.0
240
2000.0(c) 1: 500 in moleEcucu
1500.0
1000.0
500.0oco(_>
0.0
0 40 80 120 160 200 240Oxidation time (min)
^Control • Cycloartcnvl ferulate + 24-Methylene cycloartany! ferulate A Campesteryl ferulate 0 Tocopherol A Ferulic acid
Significant difference in rate (P<0.05) is expressed by different letters
Figure 23. Rates of production of total hydroperoxides of linoleic acid with different ratios of component to linoleic acid and control.
Reproduced with permission of the copyright owner. Further reproduction prohibited without permission.

lission of the
copyright ow
ner. Further
reproduction prohibited
without
permission.
CD
sp.p.ao
auupoU
Ratio:
H 1:100
H 1 :250
H 1 :500
300.0
250.0 -
200.0
15 0 .0
100.0
5 0 .0
0.0
1 3 H P O D E ( c , t ) 1 3 H P O D E ( t , t ) 9 H P O D E ( t , c ) 9 H P O D E ( t , t )
T y p e o f h y d r o p e r o x id e
Significant difference (P<0.05) is expressed by different letters on the two bars in a cluster.
Figure 24. Production o f hydroperoxides o f linoleic acid with different molar ratios o f a-tocopherol to linoleic acid after 200 min oxidation.
00u>

Reproduced
with perm
ission of the
copyright ow
ner. Further
reproduction prohibited
without
permission.
5 .o p -200 min
u¥
TI0
X
3 .5 0 -
3 .0 0 -
1.000.00
5 .00-120 min
4 .50-
m¥Hs
I0
3 .5 0 -
3 .0 0 -
0.00 1 .OO
5.00- 0 min
4 .50-
II¥
I4 .0 0 -TI
0
X
3 .0 0 -
0.00 1 .OOk IQ1 M inu tes k l o ' M inutes * M inutes
l-13HPODE(c,t); 2-13HPODE(t,t); 3-9HPODE(t,c); 4-9HPODE(t,t).
Figure 25. Chromatograms o f hydroperoxides o f linoleic acid with cycloartenyl ferulate (cycloartenyl ferulate : linoleic acid molar ratio = 1 : 250) at different oxidation times.
00

Reproduced
with perm
ission of the
copyright ow
ner. Further
reproduction prohibited
without
permission.
s.oo-0 min
4 . 5 0 -
3 . 5 0 -
3 . 0 0 -
0,00 1.00
5.00-200 min
4 . 5 0 -
5 4 . 0 0 -
3 . 5 0 -
3 . 0 0 -
0,00 1.00
5.00- 120 min
4 .5 0 -
M¥A05
TlI0
X3 . 50 -
3 . 00 -
0.00 1.00
x 101 n ln u te s x n inu te* x 101 n in u tn s
1—13HPODE(c,t); 2-13HPODE(t,t); 3-9HPODE(t,c); 4-9HPODE(t,t).
Figure 26. Chromatograms o f hydroperoxides o f linoleic acid with 24-methylene cycloartanyl ferulate (24-methylene cycloartanyl ferulate : linoleic acid m olar ratio = 1 : 250) at different oxidation times.
00

86
intnLit CO
m4
3C
o
X
uaQOcuXa\
r.O »
CS
oo© oin
CO
■^-lon r_O t
Ooinin
■n4
oX
Lit 00
wQOcuasC\
usQOcuasm
USQOcua:co
m4
C
o
X
■3>T o n ,
Reproduced with permission of the copyright owner. Further reproduction prohibited without permission.
Figu
re 27
. Ch
rom
atog
ram
s of
hydr
oper
oxid
es o
f lin
oleic
acid
with
cam
peste
ryl
feru
late
(c
ampe
stery
l fer
ulate
: l
inolei
c aci
d m
olar
rati
o =
1 : 2
50)
at di
ffere
nt o
xida
tion
times
.

CHAPTER 5
SUMMARY AND CONCLUSIONS
y-Oryzanol is a mixture of ferulate esters of triterpene alcohols. Ten ferulate
esters o f trierpene alcohols, A7-stigmastenyl ferulate, stigmasteryl ferulate, cycloartenyl
ferulate, 24-methylene cycloartanyl ferulate, campestenyl ferulate, campesteryl ferulate,
stigmastenyl ferulate, sitosteryl ferulate, compestanyl ferulate, and sitostanyl ferulate,
were identified in y-oryzanol from rice bran oil. Three o f these, cycloartenyl ferulate,
24-methylene cycloartanyl ferulate, and campesteryl ferulate, are major components.
They occupy approximately 70% of y-oryzanol. A reverse phase HPLC method was
successfully developed to isolate and quantify each of these ten components.
y-Oryzanol can be extracted from rice bran using traditional solvent extraction
or supercritical fluid extraction. Saponification that usually is more beneficial and used
in solvent extraction reduced the yield o f y-oryzanol in half, compared to extraction
without saponification. A solvent mix of 50% hexane and 50% isopropanol at 60°C
extraction temperature extracted the highest yield of y-oryzanol from rice bran among
solvents of hexane, ethyl acetate, isopropanol, mixtures o f hexane and ethyl acetate, and
mixtures o f hexane and isopropanol. The time o f extraction using a solvent mix o f 50%
hexane and 50% isopropanol at 60°C was 45 to 60 min. Supercritical fluid extraction
significantly improved the yield of y-oryzanol from rice bran. The yield of y-oryzanol
in the supercritical fluid extraction at a temperature of 50°C, pressure 680 atm, and time
87
Reproduced with permission of the copyright owner. Further reproduction prohibited without permission.

88
25 min was approximately four times higher than that o f solvent extraction.
Fractionating o f extract in the supercritical fluid extraction was successfully used in
gaining high concentration o f y-oryzanol in extract. The high concentration (50 - 80%)
o f y-oryzanol was obtained by collecting extract between 1 5 - 2 0 min under these
extraction conditions. This was sixty times purer than that obtained from solvent
extraction.
Purification using low pressure chromatography before isolating individual
components in preparative scale HPLC was necessary to concentrate y-oryzanol
extracted with solvents because the extract contained high levels o f interfering lipids.
However, extract with a high concentration of y-oryzanol obtained from the
supercritical fluid extraction could be directly loaded onto the preparative scale HPLC
without the need for concentration. This avoided the need for large amounts of solvent
and time in solvent extraction and purification. In normal phase preparative scale
HPLC, it was not possible to isolate individual components of y-oryzanol. y-Oryzanol
eluted from the normal phase column as one fraction. In reverse phase preparative scale
HPLC, individual components of y-oryzanol were successfully separated.
A mild oxidation model was implemented for evaluating antioxidant activity o f
compounds. Linoleic acid in hexane with continuing air input at 37°C proved to be a
sensitive and highly specific HPLC quantitative method. Four hydroperoxide isomers
o f linoleic acid were measured to observe the oxidation status o f linoleic acid during
oxidation. Also, the mechanism of antioxidant function could be observed by the
relative production of trans.trans hydroperoxides, and trans.cis and cis.trans
Reproduced with permission of the copyright owner. Further reproduction prohibited without permission.

89
hydroperoxides. Antioxidant activity via scavenging peroxyl or oxyl free radicals could
be seen in a lower production o f trans.cis or cis,trans hydroperoxides and a higher
production o f trans.trans hydroperoxides. Antioxidant activity via scavenging singlet
oxygen had the opposite effect. From this linoleic acid model, different antioxidant
mechanisms between a-tocopherol and ferulic acid were observed. The mechanism o f
the three major components o f y-oryzanol was similar to that o f ferulic acid based on
the changes in each hydroperoxide. The ferulate portion o f the three components
appeared to be responsible for their antioxidant activities.
The three major components of y-oryzanol had significant antioxidant activity
when mixed with linoleic acid in molar ratios o f 1:100 and 1:250; however, antioxidant
activities were not presented when the molar ratio decreased to 1:500. Ferulic acid had
significant antioxidant activity in all three molar ratios (1:100, 1:250, and 1:500). a -
Tocopherol showed significantly stronger antioxidant activity at molar ratios o f 1:250
and 1:500 than that of the three components o f y-oryzanol. However, it had the lowest
antioxidant activity at a molar ratio of 1:100. This suggests that a-tocopherol may have
prooxidant activity at high concentration in the linoleic acid model.
In conclusion, ten ferulate esters of trierpene alcohol, A7-stigmastenyl ferulate,
stigmasteryl ferulate, cycloartenyl ferulate, 24-methylene cycloartanyl ferulate,
campestenyl ferulate, campesteryl ferulate, stigmastenyl ferulate, sitosteryl ferulate,
compestanyl ferulate, and sitostanyl ferulate, were identified in y-oryzanol from rice
bran oil. y-Oryzanol extracted from rice bran using supercritical fluid extraction had
significantly higher yield and concentration o f y-oryzanol under optimized conditions,
Reproduced with permission of the copyright owner. Further reproduction prohibited without permission.

90
which could be directly loaded on reverse phase preparative HPLC to isolate individual
components o f y-oryzanol. The three major components o f y-oryzanol, cycloartenyl
ferulate, 24-methylene cycloartanyl ferulate, and campesteryl ferulate, had significant
antioxidant activities in the linoleic acid oxidation model in molar ratios o f 1 : 1 0 0 and
1:250. Their activities were not as high as that o f ferulic acid and a-tocopherol in the
linoleic acid oxidation model, except for a-tocopherol in the ratio of 1 :1 0 0 .
Reproduced with permission of the copyright owner. Further reproduction prohibited without permission.
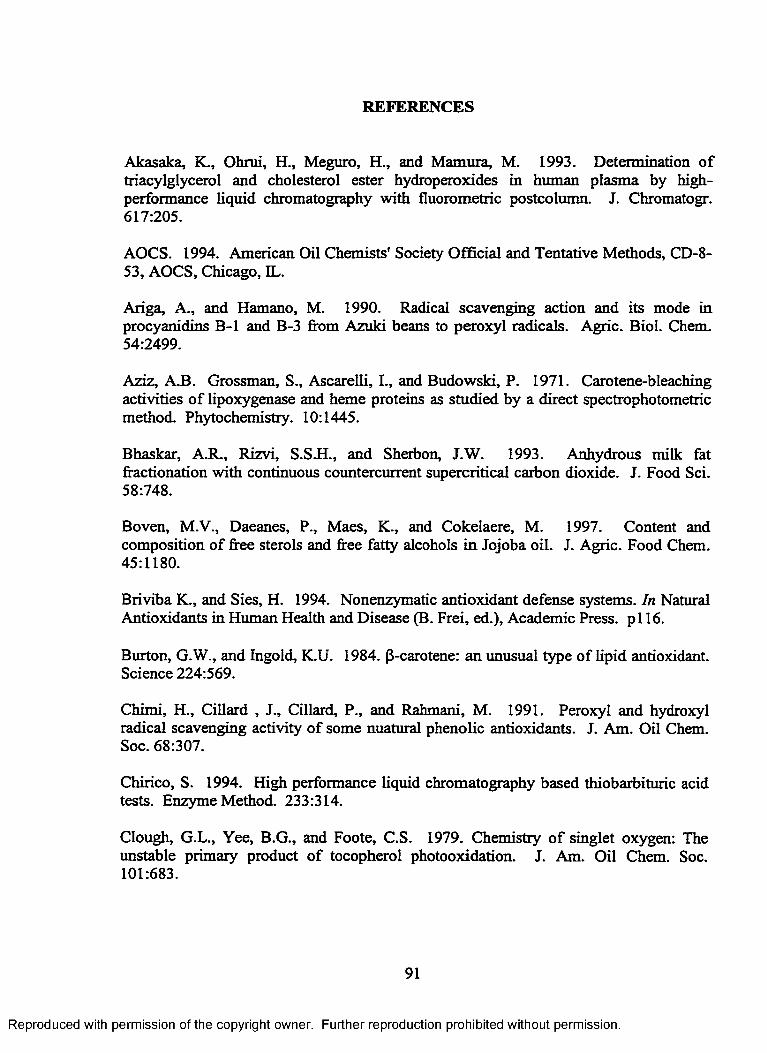
REFERENCES
Akasaka, K., Ohrui, H., Meguro, H., and Mamina, M. 1993. Determination of triacylglyceroi and cholesterol ester hydroperoxides in human plasma by high- performance liquid chromatography with fluorometric postcolumn. J. Chromatogr. 617:205.
AOCS. 1994. American Oil Chemists' Society Official and Tentative Methods, CD-8 - 53, AOCS, Chicago, IL.
Ariga, A., and Hamano, M. 1990. Radical scavenging action and its mode in procyanidins B-l and B-3 from Azuki beans to peroxyl radicals. Agric. Biol. Chem. 54:2499.
Aziz, A.B. Grossman, S., Ascarelli, I., and Budowski, P. 1971. Carotene-bleaching activities o f lipoxygenase and heme proteins as studied by a direct spectrophotometric method. Phytochemistry. 10:1445.
Bhaskar, A.R., Rizvi, S.S.H., and Sherbon, J.W. 1993. Anhydrous milk fat fractionation with continuous countercurrent supercritical carbon dioxide. J. Food Sci. 58:748.
Boven, M.V., Daeanes, P., Maes, K., and Cokelaere, M. 1997. Content and composition of free sterols and free fatty alcohols in Jojoba oil. J. Agric. Food Chem. 45:1180.
Briviba K., and Sies, H. 1994. Nonenzymatic antioxidant defense systems. In Natural Antioxidants in Human Health and Disease (B. Frei, ed.), Academic Press, pi 16.
Burton, G.W., and Ingold, K.U. 1984. (5-carotene: an unusual type of lipid antioxidant. Science 224:569.
Chimi, H., Cillard , J., Cillard, P., and Rahmani, M. 1991. Peroxyl and hydroxyl radical scavenging activity of some nuatural phenolic antioxidants. J. Am. Oil Chem. Soc. 68:307.
Chirico, S. 1994. High performance liquid chromatography based thiobarbituric acid tests. Enzyme Method. 233:314.
Clough, G.L., Yee, B.G., and Foote, C.S. 1979. Chemistry o f singlet oxygen: The unstable primary product of tocopherol photooxidation. J. Am. Oil Chem. Soc. 101:683.
91
Reproduced with permission of the copyright owner. Further reproduction prohibited without permission.

92
Corongiu, F.P., and Banni, S. 1994. Detection o f conjugated dienes by second derivative ultraviolet spectrophotometry. Methods Enzymol. 233:303.
Cotelle, N., Bernier, J.L., Henichart, JJP., Catteau, J.P., Gaydou, E., and Wallet, J.C. 1992. Scavenger and antioxidant properties o f ten synthetic flavones. Free Radical Biol. Med. 13:211.
Cuvelier, M.E., Richard, H., and Berset, C. 1992. Comparison o f the antioxidative activity o f some acid-phenols: Structure-activity relationship. Biosci. Biotech. Biochem. 56:324.
DeMeyer, G.R., Bult, H., and Herman, A.G. 1991. Early atherosclerosis is accompanied by a decreased rather than an increased accmulation o f fatty acid hydroxyderivatives. Biochem. Pharmacol. 42:279.
Diack, M. and Saska, M. 1994. Separation o f vitamin E and y-oryzanol from rice bran oil by normal-phase chromatography. J. Am. Oil Chem. Soc. 71:1211.
Duve, J.K. and White, P.J. 1991. Extraction and identification o f antioxidants in oats. J. Am. Oil Chem. Soc. 68:365.
Evershed, R.P. 1993. Advances in silylation. In Handbook o f Derivatives for Chromatography (K. Blau, and J.M. Halket, eds), John Wiley & Sons, New York. p51.
Evershed, R.P., Spooner, N., Prescott, M.C., and Goad, L.J. 1988. Isolation and characterisation of intact steryl ferulates from seeds. J. Chromatogr. 440:23.
Foote, C.S. 1968. Mechanisms of photosensitized oxidation. Science 162:963.
Frankel. E.N. 1991. Recent advances in lipid oxidation. J. Sci. Food Agric. 54:495.
Froning, G.W., Wehling, R.L., Cuppett, S.L., Pierce, M.M., Niemann, L., and Siekman, D.K. 1990. Extraction of cholesterol and other lipids from dried egg yolk using supercritical carbon dioxide. J. Food Sci. 55:85.
Ganetsos, G., and Barker, P.E. 1993. Developments in large-scale batch chromatography. In Preparative and Production Scale Chromatography (G. Ganetsos, and P.E. Barker, eds.), Marcel Dekker, Inc., New York. p i.
Garcia, A., Lucas, A.D., Rincon, J., Alvarez, A., Gracia, I., and Garcia, M.A. 1996. Supercritical carbon dioxide extraction of fatty and waxy material from rice bran. J. Am. Oil Chem. Soc. 73:1127.
Reproduced with permission of the copyright owner. Further reproduction prohibited without permission.

93
Gollnick, K. 1968. Photooxygenation Reaction in Solution. In Advances in Photochemistry, Vol 6 , (W.A. Noyes, G.W. Hammond, and J.N. Pitts, eds.), Interscience Publishers, New York. p i.
Gordon, M.H. 1990. The mechanism o f antioxidant action in vitro. In Food Antioxidants (B. J. F. Hudson, ed.), Elsevier Applied Science, New York. p i.
Grant, R.D., Rizzardo, E., and Solomon, DJi. 1984. 2-(t-Butylazo)prop-2-yl hydroperoxide: A convenient source o f hydroxyl radicals in organic media. J. Chem. Soc. Chem. Commun. 13:867.
Greenley, T.L., and Davies, M J. 1992. Detection o f radicals produced by reaction o f hydroperoxides with rat liver microsomal fractions. Biochem. Biophys. Acta. 1116:192.
Grosch, W., and Laskawy, G. 1979. Co-oxidation o f carotenes requires one soybean lipoxygenase isoenzyme. Biochem. Biophys. Acta. 575:439.
Guido, D.M., McKenna, R., and Mathews, W.R. 1993. Quantitation of hydroperoxy- eicosatotraenoic acids and hydroxy-eicosatetraenoic acid as indicators of lipid peroxidation using gas chromtography-mass sepectrometry. Anal. Biochem. 209:123.
Gustafsson, B.E., Gustafsson, J.A., and Sjovall, J. 1966. Intestinal and fecal sterol in germfree and conventional rats. Acta Chem. Scand. 20:1827.
Halliwell, B. and Gutteridge, J.M.C. 1989. Lipid peroxidation: a radical chain reaction. In Free Radicals in Biology and Medicine, (B. Halliwell, and J.M.C. Gutteridge, eds.), Clarendon Press, Oxford, p 18 8 .
Hemavathy, J. and Prabhakar, J.V. 1987. Lipid composition of rice (Oryza sativa L .) bran. J. Am. Oil Chem. Soc. 64:1016.
Henick, A.S., Benca, M.F., and Mitchell, J.H. 1954. Estimating carbonyl compounds in rancid fats and foods. J. Am. Oil Chem. Soc. 31:88.
Jessup, W., Dean, R.T., and Gerbicki, J.M. 1994. Iodometric determination o f hydroperoxides in lipids and proteins. Methods Enzymol. 233:289.
Jung, M.Y., and Min, D.B. 1990. Effects o f a-, y-, and P-tocopherols on oxidative stability o f soybean oil. J. Food Sci. 55:1464.
Reproduced with permission of the copyright owner. Further reproduction prohibited without permission.

94
Kozlowska, H., Naczk, M., Shahidi, F., and Zademowski, R. 1990. Phenolic acids and tannins in rapessed and canola. In Canola and Rapeseed: Production, Chemistry, Nutrition, and processing Technology (F. Shahidi, ed.), Van Nostrand Reinhold, New York. pl93.
Kuroda, N., Ohnishi, M., and Fujino, Y. 1977. Sterol lipids in rice bran. Cereal Chem. 54:997.
List, G.R., King, J.W., Johnson, J.H., Warner, K., and Mounts, T.L. 1993. Supercritical CO2 degumming and physical refining of soybean oil. J. Am. Oil Chem. Soc. 70:473.
Marinova, E.M., and Yanishieva, N.V. 1992. Effect of temperature on the antioxidative action o f inhibitors in lipid autoxidation. J. Sci. Food Agric. 60:313.
Marinova, E.M., and Yanishieva, N.V. 1994. Effect of lipid unsaturation on the antioxidative activity o f some phenolic acids. J. Am. Oil Chem. Soc. 71:427.
Merkle, J.A. and Larick, D.K. 1993. Triglyceride content of supercritical carbon dioxide extracted fractions of beef fat. J. Food Sci. 58:1237.
Miyazawa, T., Fujimoto, K., Suzuki, T., and Yasuda, K. 1994. Determination of Phospholipid hydroperoxides using luminol chemiluminescence-high-performance liquid chromatography. Method enzymol. 233:324.
Nawar, W.W. 1996. Lipids. In Food Chemistry (O.R. Fennema, ed.), Marcel Dekker Inc., New York. p225.
Nawar, W.W. 1985. Lipids. In Food Chemistry (O.R. Fennema, ed.), Marcel Dekker, Inc. New York, p i39.
Nicolosi, R.J., Rogers, E.J., Ausman, L.M., and Orthoefer, F.T. 1993. Rice bran oil and its health benefits. In Rice Science and Technology. (W.E. Marshall, and J.I. Wadsworth, eds.), Marcel Dekker, Inc., New York. p421.
Niki, E. 1990. Free radical initiators as source of water- or lipid-soluble peroxyl radicals. Methods Enzymol. 186:100.
Norton, R.A. 1994. Isolation and identification of steryl cinnamic acid derivatives from com bran. Cereal Chem. 71:111
Norton, R.A. 1995. Quantitation of steryl ferulate and /7-coumarate esters from com and rice bran. Lipids. 30:269.
Reproduced with permission of the copyright owner. Further reproduction prohibited without permission.

95
Ohta, T., Yamasaki, S., Egashira, Y., and Sanada, H. 1994. Antioxidative activity of com bran hemicellulose fragments. J. Agric. Food Chem., 42:653.
Pagonis, C., Tauber, A.I., Pavlotsky, N., and Simons, E.R. 1986. Flavonoid impairment of neutrophil response. Biochem. Pharmacol. 35:237.
Parkin, K.L. and Damodaran, S. 1993. Food technology and nutrition. In Encyclopaedia o f Food Science, (R. Macrae, R.K. Robinson, and M.J. Sadler, eds.), Academic Press, New York. p3375.
Pratt, D.E. 1992. Natural antioxidants from plant materials. In Phenolic Compounds in Food and Their Effects on Health II, antioxidants and Cancer Prevention (M.T. Huang, C.T. Ho, and C.Y. Lee, eds.), American Chemical Society, Washington, D.C. p54.
Puppo, A. 1992. Effect of flavonoids on hydroxyl radical formation by fenton-type reactions; influence o f the iron chelator. Phytochemistry. 31:85.
Rajalakshmi, D., and Narasimhan, S. 1995. Food antioxidants: sources and methods of evaluation. In Food Antioxidants: Technological, Toxicological, and Health Perspectives (D.L. Madhavi, S.S Deshpande, and D.K. Sabunkhe, eds), Marcel Dekker, Inc., New York. p65.
Rogers, E.J., Rice S.M., Nicolosi, R.J., Carpenter, D.R., McClelland, C.A., and Romanczyk, L.J. 1993. Identification and quantitation of y-oryzanol components and simultaneous assessment of tocols in rice bran oil. J. Am. Oil Chem. Soc. 70:301.
Rukmini, C. and Raghuram, T.C. 1991. Nutritional and biochemical aspects o f the hypolipidemic action o f rice bran oil: a review. J. Am. Col. Nutr. 10:593.
Rush, J.D., and Koppenol, W.H. 1986. Oxidizing intermediates in the reaction of ferrous EDTA with hydrogen peroxide. J. Biol. Chem. 261:6730.
Rush, J.D., Maskos, Z., and Koppenol, W.H. 1986. Distinction between hydroxyl radical and ferryl species. Method Enzymol. 186:148.
SAS. 1994. User's Guide, Version 6.1 ,4th ed., SAS Institute, Cary, NC.
Saunders, R.M. 1990. The properties o f rice bran as a food stuff. Cereal Foods World. 35:632.
Seetharamaiah, G.S. and Chandrasekhara, N. 1988. Hypocholesterolemic activity o f y- oryzanol in rats. Nutr. Rep. Int. 38:927.
Reproduced with permission of the copyright owner. Further reproduction prohibited without permission.

96
Seetharamaiah, G.S. and Chandrasekhara, N. 1989. Studies on hypocholesterolemic acitvity o f rice bran oil. Atherosclerosis. 78:219.
Seitz, L.M. 1989. Stanol and sterol esters o f ferulic and p-coumaric acids in wheat, com, rye, and triticale. J. Agric. Food Chem. 37:662.
Sharma, R.D. and Rukmini, C. 1986. Rice bran oil and hypocholesterolemic in rats. Lipid. 21:715.
Slavin J.L. and Lampe, J.W. 1992. Health benefits o f rice bran in human nutrition. Cereal Foods World. 37:10.
Sonntag, N.O.V. 1979. Composition and characteristics o f individual fats and oils. In Bailey’s Industrial Oil and Fat Products. Vol 1. (D. Swem, ed.), Wiley, New York. pl22
Takagi, T., and Iida, T. 1980. Antioxidant for fats and oils from canary seed: Sterol and triterpene alcohol esters of caffeic acid. J. Amer. Oil Chem. Soc. 57:326.
Teral, J. 1989. Antioxidant activity of p-carotene-related carotenoids in solution. Lipids. 24:659.
Tezuka, T. 1988. The Role of Oxygen in Chemistry and Biochemistry. Stud. Org. Chem. 33:157.
Tian, L.L., and White, P.J. 1994. Antipolymerization activity of oat extract in soybean and cotton seed oils under frying conditions. J. Am. Oil Chem. Soc. 71:1087.
Tsuda, T., Mizuno, K., Ohshima, K., Kawakishi, S., and Osawa, T. 1995. Supercritical carbon dioxide extraction of antioxidative components from Tamarind (Ta.marind.us indica L.) seed coat. J. Agric. Food Chem. 43:2803.
White, P.J. and Armstrong, L.S. 1986. Effect o f selected oat sterols on the deterioration of heated soybean oil. J. Am. Oil Chem. Soc. 63:525.
Yamamoto, Y. 1994. Chemiluminescence-based high-performance liquid chromatography assay of lipid hydroperoxides. Methods Enzymol. 233:319.
Yan, P.S., and White, P.J. 1990. Linalyl acetate and other compounds with related structures as antioxidants in heated soybean oil. J. Agric. Food Chem. 38:1904.
Reproduced with permission of the copyright owner. Further reproduction prohibited without permission.

VITA
The author was bom in Shanghai, China on May 23, 1964. He graduated from
East China University o f Science and Technology with a bachelor's degree of science in
the Department o f Biochemistry in July 1985, and then was employed as a research
associate in a research institute in Shanghai.
In January 1992, he was accepted in the Graduate School o f Louisiana State
University. He studied in the Department o f Food Science and worked as a graduate
research assistant.
After graduation with a master o f science degree in December 1994, he
continued his doctoral studies in the Department of Food Science at Louisiana State
University and worked as a graduate research assistant.
The author married Ms. Zhiyi Liang in 1991 and his son, Leon Xu, was bom in
1994.
The author is currently a candidate for the degree of Doctor o f Philosophy in
Food Science.
97
Reproduced with permission of the copyright owner. Further reproduction prohibited without permission.

DOCTORAL EXAMINATION AND DISSERTATION REPORT
Candidate: Zhimin Xu
Major Field: Food Science
Title of Dissertation: Purification and Antioxidant Properties of RiceBran y-Oryzanol Components
Approved:
or Professor and Chairman
Dean of the Graduate School
EXAMINING COMMITTEE:
Date of nation:
December 10, 1997
Reproduced with permission of the copyright owner. Further reproduction prohibited without permission.

IMAGE EVALUATION TEST TARGET (Q A -3 )
A
A
1.0
l.l
1.25
1 ^
|161 * 0
1.4
2.2
2.0
1.8
1.6
150mm
6 "
A P P L IE D IIVMGE . In c-= = 1653 East Main S treet
- = ~- Rochester. NY 14609 USA - = ~ — Phone: 716/482-0300
- = ~ - = Fax: 716/288-5989
0 1993. Applied Image. Inc.. All Rights Reserved
with permission of the copyright owner. Further reproduction prohibited without permission.