purpose discussion/summary - calstrs
TRANSCRIPT

TEACHERS’ RETIREMENT BOARD
REGULAR MEETING Item Number: 3 SUBJECT: Actuarial Experience Study CONSENT: ATTACHMENT(S): 3_ ACTION: X DATE OF MEETING: February 1, 2017 / 120 mins. INFORMATION: PRESENTER(S): Nick Collier and Mark Olleman, Milliman
Rick Reed and David Lamoureux
PURPOSE Adopt actuarial assumptions to be used in the administration and actuarial valuations of CalSTRS benefit programs, beginning with the June 30, 2016 actuarial valuations. The actuarial valuations are scheduled to be presented in April. DISCUSSION/SUMMARY An actuarial experience study is a periodic review of the demographic and economic assumptions and methods used to determine the funded status and the contribution rate needed to fully fund the system. To ensure CalSTRS remains a financially sound retirement system, it is important to periodically perform an experience study to ensure the assumptions adopted by the board are reasonable and reflect the actual experience of the system. An experience study has historically been completed every four years. The last experience study was completed and presented to the board in February 2012. This experience study was originally scheduled to be completed and presented to the board in February 2016. In February 2016, staff received approval from the board to delay the completion of the experience study in part to provide the actuaries the opportunity to study recent mortality improvement trends by considering one additional year of data and to investigate implementing a new methodology for setting mortality assumptions referred to as generational mortality. Milliman is recommending the adoption of this new methodology. The experience study was performed by Milliman, Inc., CalSTRS’ consulting actuary. As part of their study, they reviewed not only the actuarial assumptions but also the actuarial methodology and funding methods used in the actuarial valuations of the Defined Benefit (DB) Program, the Defined Benefit Supplement (DBS) Program and the Cash Balance Benefit (CBB) Program. A copy of their experience study report is attached to this item. Based on the results of their study and their best estimate of future experience, Milliman is recommending changes to some of the economic and demographic assumptions used in the actuarial valuations as well as minor changes to other miscellaneous methods and assumptions.
TRB7

Regular Meeting – Item 3 February 1, 2017 Page 2 This agenda item will focus on the recommended changes having the greatest impact on funding and contribution levels. For additional details on all the changes recommended by Milliman, please refer to the attached report. Mr. Nick Collier and Mr. Mark Olleman of Milliman will be at the board meeting to present the results of the experience study and respond to questions about the process, the results and the recommendations. Proposed Changes to Economic Assumptions Several changes to economic assumptions are recommended for adoption. The key changes are for the assumptions for price inflation, investment return and wage growth. The assumption for price inflation is currently 3.00%. Over the last twenty years, actual price inflation has been lower and is expected to remain below 3% in the future. As a result, the recommendation is to lower price inflation from 3.00% to 2.75%. Consistent with the recommendation to decrease the price inflation assumption, the recommendation is also to lower the general wage growth assumption by 0.25%, from 3.75% to 3.50%. Based on CalSTRS capital market assumptions and the recommended 2.75% inflation assumption, there is a less than 50% probability that the current 7.50% return assumption for the DB program will be achieved over the long term. As a result, the recommendation is to lower the investment return assumption to 7.25%. Note that the recommendation is to also lower the investment return assumption of the DBS and CBB programs by 0.25%. Below is a table summarizing the recommended changes to key economic assumptions.
Summary of Recommended Changes to Key Economic Assumptions
Economic Assumption Current Assumption Recommended Assumption Price Inflation 3.00% 2.75% Wage Growth 3.75% 3.50%
Investment Return – DB & DBS 7.50% 7.25% Investment Return – CBB 7.00% 6.75%
Proposed Changes to Demographic Assumptions Several changes to demographic assumptions are recommended for adoption. The most important change is for the mortality assumption. A change is recommended to reflect improvements in life expectancies that have occurred since the last study and to use a different approach to reflect expected future improvements in life expectancies using generational mortality.
TRB8
Regular Meeting – Item 3 February 1, 2017 Page 3 The current mortality assumption uses a static approach to reflect mortality improvements. A static approach involves the use of improvements built into the mortality assumption that remains the same for all years into the future, until the assumption is revised. The current mortality assumption adds a level of conservatism through the use of tables for existing retirees and separate static tables with additional margins for future retirees. Alternatively, a generational mortality assumption involves the use of a base mortality table and a projection table to reflect expected annual reductions in mortality rates at each age, resulting in increases in life expectancies each year into the future. This method is more dynamic and is expected to result in a more robust reflection of future improvements in mortality and reduce the need to change mortality assumptions as a result of future experience studies. The recommendation includes the adoption of base tables by gender and types of benefits to reflect current life expectancies and of a projection scale for future improvements in life expectancies. The recommended projection scale is 110% of the ultimate portion of the MP-2016 scale published by the Society of Actuaries. This represents an assumption of 1.1% annual improvements in mortality for ages less than 85, gradually decreasing to assuming no improvements for ages beyond 115. The proposed changes in the mortality assumption will result in higher assumed life expectancies compared to the current assumption. This is in part due to the adoption of generational mortality but also because life expectancies have increased since the completion of the last study. Page 6 of the experience study report provides additional information on the impact on life expectancies. In addition to the changes to the mortality assumption, several other changes to demographic assumptions are being recommended, including:
• Increases to rates of service retirement for all members • Decreases in the rates of disability for Coverage A members • Changes to termination and refund rates • Changes to assumptions for individual salary increases for merit
Overall, the proposed changes to the demographic assumptions have a greater impact on funding and contribution levels than the proposed changes to the economic assumptions. Further information on the impact can be found below and on page 9 of the attached report. Impact on Contribution and Funding Levels of the DB Program The adoption of the recommend assumptions will result in a lowering of the funded ratio for the DB program. As a result, there will be a need for higher contributions in the future to reach full funding by 2046. Below is a table showing a summary of the impact of the proposed assumption changes on both the funded ratio and the contribution rate level needed to reach full funding by 2046. Note that the table provides an estimate of the funded ratio as of June 30, 2016 reflecting the estimated
TRB9

Regular Meeting – Item 3 February 1, 2017 Page 4 impact of the investment return of about 1% for fiscal year 2015-16. The actual June 30, 2016 funded ratio will be set by the June 30, 2016 valuation that will be presented to the board in April.
Estimated Impact of Recommended Assumption Changes Funded
Ratio Total Level Contribution
Rate Needed to Reach Full Funding
June 30, 2015 Valuation 68.5% 31.15% Estimated Impact of 1% Return in FY 15-16 -1.3% 0.86% Estimated June 30, 2016 Valuation 67.2% 32.01% - Impact of Proposed Demographic Assumptions -1.7% 1.95% - Impact of Proposed Economic Assumptions -1.6% 1.62%
Estimated Impact of All Assumption Changes -3.3% 3.57% Estimated June 30, 2016 Valuation with Proposed Assumption Change
63.9% 35.58%
Page 9 of the experience study report provides additional details on the impact of each assumption change. With the board’s ability to adjust contribution rates for the State and employers in the future, the DB program is still expected to reach full funding by 2046 under the proposed assumptions. However, reaching full funding by 2046 will require the State, employers and the 2% at 62 members to contribute more. The impact for each group is discussed below. Impact on the State Contribution Rate Currently, the State contribution rate, including the purchasing power benefit contribution of 2.5 percent, is 8.828 percent of payroll. Under the 2014 funding plan, the board has the authority to adjust the State contribution rate beginning July 1, 2017, and each year thereafter until 2046. These increases are limited to no more than 0.5 percent of payroll above the rate in effect the previous fiscal year. Under the proposed assumption, the State contribution rate is expected to increase by 0.5% of payroll on July 1, 2017, and could continue to increase annually by up to 0.5 percent in subsequent years, depending upon the investment experience and the funded status of plan at each valuation date. Assuming future returns are 7.25% each year, the State rate is expected to increase by 0.5% of payroll for each of the next 5 years as illustrated on page 12 of the experience study report. Note that the budget recently released by Governor Brown anticipates a rate increase for the State effective July 1, 2017. The budget includes $2.8 billion for state contributions to CalSTRS. This figure assumes CalSTRS will adopt new mortality assumptions, implement a reduction to
TRB10

Regular Meeting – Item 3 February 1, 2017 Page 5 the investment return assumption, and exercise its authority to increase state contributions by 0.5%. In dollar terms, the 0.5% increase is projected to result in an additional $153 million in contributions, which is included in the $2.8 billion. The budget summary include the following statement:
“The proposed funding is consistent with the funding strategy signed into law in 2014, and positions CalSTRS on a sustainable path forward, eliminating the unfunded liability in about 30 years.”
Impact on the Employer Contribution Rate Under the 2014 funding plan, the employer Defined Benefit Program contribution rate will continue to increase by set amounts each year until it reaches 19.1 percent of payroll beginning July 1, 2020. In accordance with the schedule established in law, employer contribution rates will increase to 14.43 percent of payroll on July 1, 2017. Employers will not be subject to any additional rate increases next year as a result of changes in actuarial assumptions. However, beginning July 1, 2021, the law authorizes the board to adjust the employer contribution rate, if necessary, to fully fund the remaining unfunded liability. Changes in actuarial assumptions are expected to increase the unfunded liability and will likely result in a need for higher contributions in the future. Any adjustments in employer rates after 2020 are limited to one percent annually and the employer contribution rate cannot exceed 20.25 percent of payroll. Depending upon future valuations and the actuarial assumptions set by the board, employer contribution rates could reach up to 20.1 percent of payroll beginning July 1, 2021, and 20.25 percent beginning July 1, 2022. The estimated impact on employer rates assuming future returns are 7.25% each year is illustrated on page 12 of the experience study report. Impact to 2% at 62 Member Contribution Rate Under the Public Employees’ Pension Reform Act of 2013 (PEPRA), 2% at 62 members are required to pay at least one-half the normal cost of their Defined Benefit Program benefits. The normal cost is the annual cost applied to each year of service that is necessary to adequately fund the benefit over time. The normal cost does not include costs associated with amortizing, or paying down, any unfunded liabilities. The proposed changes in actuarial assumptions will result in a higher normal cost. Current law states that the contribution rate for PEPRA members should be adjusted if the normal cost increases by more than 1% since the last time the member contribution rate was set. When the contribution rate for 2% at 62 members was last set, the normal cost was 15.9% of payroll. Under the proposed assumptions, the normal cost is estimated to be 16.91% of payroll, an increase of 1.01% since the last time it was used to set member contribution rate. The normal
TRB11

Regular Meeting – Item 3 February 1, 2017 Page 6 cost will not be finalized until the board approves the 2016 valuation in April and could fluctuate due changes in plan demographics. If the normal cost remains at or above 16.9% of payroll in the 2016 valuation, the 2% at 62 members will have to pay for half of the increase, rounded to the nearest quarter of a percent. Based on the estimated normal cost, the contribution rate for 2% at 62 members would increase by 0.5% of salary effective July 1, 2017. The 2% at age 62 population has been increasing steadily over the last few years. Generally, new teachers hired on or after January 1, 2013 are covered under the 2% at 62 formula. On June 30, 2014, there were close to 20,000 PEPRA members in CalSTRS. The number of 2% at 62 members has increased by about 20,000 each year. The most recent information available is as of June 30, 2016. As of June 30, 2016, there were 60,942 active members covered by the 2% at age 62 formula. Below is a pie chart showing the distribution of members as of June 30, 2016.
Based on the growth over the last three years in the number of CalSTRS active members subject to the 2% at 62 formula, we estimate there will be about 80,000 2% at 62 active members on July 1, 2017. Based on this estimate, close to 20% or one in five active members may have to contribute more to CalSTRS effective July 1, 2017 if the contribution rate for 2% at 62 members increases. Impact on Member Calculations Once the board adopts new actuarial assumptions to be used in the actuarial valuations of the various programs, these same actuarial assumptions will also be used in member calculations.
60,942 14%
377,595 86%
Count of CalSTRS Active Members (As of June 30, 2016)
2% at Age 62 Formula (PEPRA)
2% at Age 60 Formula
TRB12

Regular Meeting – Item 3 February 1, 2017 Page 7 The implementation of the new assumptions will occur at different times for member calculations. For service credit purchases, new assumptions adopted by the board will be reflected in the service credit purchase factors the board will be asked to adopt at the April meeting. These factors will become effective July 1, 2017 and are expected to increase. The impact of the assumption change has not yet been quantified. The actual impact will be provided in April when the Board will be asked to adopt the new factors. For all other member calculations such as retirement options, the new assumptions will be implemented effective January 1, 2018 for retirements effective on or after that date. This gives staff time to implement the factors in the existing computer systems and is also consistent with past practices. When a member elects an option at retirement, they pay for it through a reduction in benefit. The proposed assumptions will impact the amount of the reduction needed to fund the benefit. The impact of the proposed assumption changes on retirement factors is expected to be minimal and in many cases may benefit members, resulting in smaller reduction in benefits due to the fact members will be expected to live longer. Trends Toward Lower Expected Return Assumptions The appropriate assumption for investment returns should reflect the expectation for the individual plan based on that plan’s asset allocation. Different pension systems will have different asset allocations, different methods of setting the investment return assumption and, therefore, reasonably different investment return assumptions. It can be instructive, however, to be aware of the assumption adopted by other systems. Recent economic conditions have seen continuing declines in long-term government bond interest rates that serve as the foundation of capital market returns. This has resulted in a general lowering of the expected returns (at least over the medium term) from the various asset classes and translated into a lowering of the investment return assumption by many public pension plans across the nation. This trend can be observed when looking at information compiled by the National Association of State Retirement Administrators (NASRA). NASRA provided staff with updated information for public plans in the US going back to 2001. The information provided to CalSTRS reflects known changes adopted by public plans in the US through the end of 2016. The information covers 127 public plans. Among the 127 plans, 65 have reduced their investment return assumption since 2012. The median investment return assumption was 8.00% in 2011 and is now 7.5%. The number of plans with an investment return assumption below 7.50% has been steadily increasing since 2009. In 2009, only 6 of these plans had an assumption below 7.5%. Today, 34 of these plans have an assumed investment return of 7.25% or less. Of these 34 plans, 17 have adopted an assumption of 7% or less.
TRB13

Regular Meeting – Item 3 February 1, 2017 Page 8 Recent CalPERS Decision Last December, the CalPERS Board had a workshop around managing the funding risk that lead to a discussion of the appropriate investment return assumption to use for funding the retirement benefits of CalPERS members. The discussion focused on the appropriate level of funding risk CalPERS should take going forward considering CalPERS current funding levels in an environment where cash flows are negative and where the system becomes more sensitive to investment performance over time as it continues to mature. Emphasis was placed on how market conditions have changed since their most recent asset allocation study, the increased levels of uncertainty associated with economic forecasts and the implications of having lower than expected returns over the next 10 years. Several CalPERS stakeholders representing both employers and members spoke at the meeting on the proposal to lower the assumed investment return. Although a common message from stakeholders at CalPERS was an acknowledgment it was reasonable to expect lower investment returns going forward, some argued too much emphasis was put on market expectations over the next ten years, ignoring expected higher returns long term. Most stakeholders requested the CalPERS Board consider the financial impact of an assumption change on employers and members and phase any assumption change over time to mitigate the impact. In the end, the CalPERS Board voted to lower the investment return assumption from its current level of 7.5% down to 7.0%. In response to many stakeholders requesting that the impact be phased over time, the CalPERS Board decided to lower the investment return assumption over three actuarial valuations. CalPERS will first lower the investment return assumption to 7.325% for their 2016 actuarial valuations. The investment return assumption will then be lowered further to 7.25% for the 2017 actuarial valuations and finally to 7.0% for the 2018 actuarial valuations. The lowering of the investment return assumption over three years means the impact of the assumption change on CalPERS PEPRA members will be phased-in over the three years. In addition, the CalPERS Board decided to further phase the impact on employer rates. The contribution amounts needed to pay for the increases in unfunded liability resulting from the assumption changes will each be phased over five years. As a result, employers will not see the full impact in their contribution rates for at least eight years. It is interesting to note that CalPERS employers will be impacted by the assumption change at different times. The State will first have to make additional contributions to CalPERS effective this coming July 1st. Public agencies and schools employers will not have to contribute more as a result of the assumption change until fiscal year 2018-19. CalPERS school employers are expected to have their contribution rates fully reflect the impact of the CalPERS assumption change by fiscal year 2024-25. CalPERS has not yet released an official estimate for the projected contribution rate for CalPERS school employers. However, information presented at the CalPERS Board meeting in December indicates the contribution rate for school employers will likely double from its current level of 13.888% of payroll.
TRB14

Regular Meeting – Item 3 February 1, 2017 Page 9 Note that the decision to lower the investment return assumption at CalPERS did not include any other assumption changes. The decision was made ahead of CalPERS next regular experience study which is expected to be completed and presented to the CalPERS Board in 2018. Our recommended change to the investment return assumption also includes a recommendation to lower the inflation assumption from 3.00% to 2.75%. CalPERS price inflation assumption was previously lowered to 2.75% in 2012. Alternative Investment Return Assumptions The recommend assumption for the investment return is to lower it to 7.25%. The attached report also includes information on the impact of keeping the investment return at 7.5% and lowering the investment return assumption further to 7.00%. Keeping the assumption to 7.50% is not recommended since the probability of achieving this return is less than 50%. Going to 7.00% would be an acceptable alternative if the board wanted to add another level of conservatism in the actuarial assumptions by increasing the likelihood the investment assumption will be met long term. Going to 7% would result in a need for additional contributions from the State and the employers. These contribution increases would occur over time as the board exercises its limited ability to increase contribution rates. For employers, contribution rates are set through fiscal year 2020-21 according to the schedule established in the funding plan. As a result, employers would not see additional increases in contribution rates until fiscal year 2021-2022 regardless of the decision made by the board around the actuarial assumptions. As shown on page 13 of the attached experience study report, changes in actuarial assumptions are expected to result in a need for higher employer contributions starting in fiscal year 2021-22. If the board adopts an investment return assumption of 7%, employer contributions are expected to be slightly greater in fiscal 2021-22 than they would be under an assumption of 7.25%. For the State, as stated earlier, adopting an investment return assumption of 7.25% is expected to result in increases of 0.5% of payroll in the State rate for each of the next five years. If the board adopts an investment return assumption of 7%, the State rate is expected to have to increase by 0.5% of payroll each year for at least the next ten years. Actual increases will depend upon the investment experience and the funded status of plan on each future actuarial valuation date. Page 13 of the attached experience study report contains charts comparing the projected State and employer contribution rates through fiscal year 2045-46 under the different investment return assumptions. As discussed earlier, 2% at 62 PEPRA active members are subject to rate increases when the normal cost for their benefit increases by more than 1%. If the board decided to lower the assumption to 7.00%, the normal cost is estimated to be about 2% higher which would be expected to translate into a 1% increase in the contribution rate for these members. These
TRB15

Regular Meeting – Item 3 February 1, 2017 Page 10 members currently contribute 9.205% of their salary. They would have to contribute 10.205%. Note that 2% at 60 members are currently contributing 10.25% of their salary. As stated earlier, it is expected that adopting the proposed assumptions will result in an increase in the member contribution rate of 0.5%, to 9.705% of salary. A decision to remain at 7.50% would result in no change to the member contribution rate for the 2% at 62 members. Because of the board’s ability to increase contribution rates for the State and employers and the additional contributions from 2% at 62 members, the DB program is projected to be approximately 100% funded in 2046 under all three sets of assumptions. As discussed in this agenda item, the financial implications for the State, employers and members will be different depending on the assumptions the board adopts. Independent Review of the Experience Study Staff retained the services of an actuarial firm, in this case Cheiron, to perform an independent review of this experience study and the proposed assumptions. Based on their review, Cheiron believes that the proposed assumptions are reasonable and the work performed by Milliman on the experience study meets the Actuarial Standards of Practice. As part of their review, Cheiron provided some recommendations regarding alternative approaches to set mortality, termination and retirement rate assumptions to consider in future experience studies. Representatives from Cheiron will be present to answer any questions board members may have regarding their review of the experience study or the recommended assumptions. A copy of the external review of the experience study is attached to this item. RECOMMENDATION Staff recommends the board adopt the proposed actuarial assumptions and methods recommended by Milliman, Inc., CalSTRS’s consulting actuary, including the adoption of a generational mortality assumption to better reflect future expected improvements in life expectancy and a lowering of the investment return assumption to 7.25%.
TRB16

Milliman Actuarial Valuation
Issued December 30, 2016
California State Teachers’ Retirement System Experience Analysis July 1, 2010 – June 30, 2015
February 2017 Meeting
Prepared by:
Mark C. Olleman, FSA, EA, MAAA Principal and Consulting Actuary
Nick J. Collier, ASA, EA, MAAA Principal and Consulting Actuary
Julie D. Smith, FSA, EA, MAAA Actuary
Milliman, Inc. 1301 Fifth Avenue, Suite 3800 Seattle, WA 98101-2605 Tel +1 1 206 624 7940 milliman.com
Attachment 1 Regular Meeting - Item 3
February 1, 2017
TRB17
Offices in Principal Cities Worldwide
This work product was prepared solely for CalSTRS for the purposes described herein and may not be appropriate to use for other purposes. Milliman does not intend to benefit and assumes no duty or liability to other parties who receive this work. Milliman recommends that third parties be aided by their own actuary or
other qualified professional when reviewing the Milliman work product.
ctrj0291.docx 003 STR 17/003.STR.17.2016 / MCO/NJC/JDS/nlo
1301 Fifth Avenue Suite 3800 Seattle, WA 98101-2605 USA
Tel +1 206 624 7940 Fax +1 206 623 3485
milliman.com
December 30, 2016
Teachers’ Retirement Board California State Teachers’ Retirement System
Dear Members of the Board:
It is a pleasure to submit this report of our investigation of the experience of the California State Teachers’ Retirement System (CalSTRS) for the period July 1, 2010 through June 30, 2015. The results of this investigation are the basis for the actuarial assumptions and methods to be used in the actuarial valuations to be performed as of June 30, 2016. The actuarial valuations as of June 30, 2016 will become the cornerstone for analyzing the funding status of the System’s Defined Benefit (DB) Program, Defined Benefit Supplement (DBS) Program, and the Cash Balance Benefit (CBB) Program. The new assumptions will also be used for the June 30, 2017 actuarial projection of the Supplemental Benefit Maintenance Account (SBMA) and June 30, 2016 valuation of the Medicare Premium Payment (MPP) Program. The purpose of this report is to communicate the results of our review of the actuarial methods and the economic and demographic assumptions to be used in the completion of the upcoming valuations. Several of our recommendations represent changes from the prior methods or assumptions and are designed to better anticipate the emerging experience of CalSTRS. We have provided financial information showing the estimated impact of the recommended assumptions, as if they had been reflected in the June 30, 2015 actuarial valuation. We believe the recommended assumptions provide a reasonable estimate of anticipated experience affecting CalSTRS. Nevertheless, the emerging costs will vary from those presented in this report to the extent that actual experience differs from that projected by the actuarial assumptions. Future actuarial measurements may differ significantly from the current measurements presented in this report due to factors such as the following:
Plan experience differing from the actuarial assumptions, Future changes in the actuarial assumptions, Increases or decreases expected as part of the natural operation of the methodology used for these
measurements (such as potential additional contribution requirements due to changes in the plan’s funded status), and
Changes in the plan provisions or accounting standards.
Due to the scope of this assignment, we did not perform an analysis of the potential range of such measurements.
Attachment 1 Regular Meeting - Item 3
February 1, 2017
TRB18

Teachers’ Retirement Board
December 30, 2016 Page 2
This work product was prepared solely for CalSTRS for the purposes described herein and may not be appropriate to use for other purposes. Milliman does not intend to benefit and assumes no duty or liability to other parties who receive this work. Milliman recommends that third parties be aided by their own actuary or
other qualified professional when reviewing the Milliman work product.
ctrj0291.docx 003 STR 17/003.STR.17.2016 / MCO/NJC/JDS/nlo
In preparing this report, we relied without audit on information (some oral and some in writing) supplied by CalSTRS’ staff. This information includes, but is not limited to, statutory provisions, employee data, and financial information. In our examination, after discussion with CalSTRS and certain adjustments, we have found the data to be reasonably consistent and comparable with data used for other purposes. Since the experience study results are dependent on the integrity of the data supplied, the results can be expected to differ if the underlying data is incomplete or missing. It should be noted that if any data or other information is inaccurate or incomplete, our determinations might need to be revised. This investigation of experience report recommends assumptions to be used in the valuation to provide an estimate of the System’s financial condition as of a single date. The valuation can neither predict the System’s future condition nor guarantee future financial soundness. Actuarial valuations do not affect the ultimate cost of System benefits, only the timing of System contributions. While the valuation is based on an array of individually reasonable assumptions, other assumption sets may also be reasonable and valuation results based on those assumptions would be different. No one set of assumptions is uniquely correct. Determining results using alternative assumptions is outside the scope of our engagement. Milliman’s work is prepared solely for the internal business use of CalSTRS. To the extent that Milliman's work is not subject to disclosure under applicable public records laws, Milliman’s work may not be provided to third parties without Milliman's prior written consent. Milliman does not intend to benefit or create a legal duty to any third party recipient of its work product. Milliman’s consent to release its work product to any third party may be conditioned on the third party signing a Release, subject to the following exceptions:
(a) The System may provide a copy of Milliman’s work, in its entirety, to the System's professional service advisors who are subject to a duty of confidentiality and who agree to not use Milliman’s work for any purpose other than to benefit the System.
(b) The System may provide a copy of Milliman’s work, in its entirety, to other governmental entities, as required by law.
No third party recipient of Milliman's work product should rely upon Milliman's work product. Such recipients should engage qualified professionals for advice appropriate to their own specific needs. The consultants who worked on this assignment are pension actuaries. Milliman’s advice is not intended to be a substitute for qualified legal or accounting counsel. The signing actuaries are independent of the plan sponsor. We are not aware of any relationship that would impair the objectivity of our work. On the basis of the foregoing, we hereby certify that, to the best of our knowledge and belief, this report is complete and accurate and has been prepared in accordance with generally recognized and accepted actuarial principles and practices. We would like to acknowledge the help in the preparation of the data for this investigation given by the CalSTRS staff. We look forward to our discussions and the opportunity to respond to your questions and comments at your next meeting.
Attachment 1 Regular Meeting - Item 3
February 1, 2017
TRB19

Teachers’ Retirement Board
December 30, 2016 Page 3
This work product was prepared solely for CalSTRS for the purposes described herein and may not be appropriate to use for other purposes. Milliman does not intend to benefit and assumes no duty or liability to other parties who receive this work. Milliman recommends that third parties be aided by their own actuary or
other qualified professional when reviewing the Milliman work product.
ctrj0291.docx 003 STR 17/003.STR.17.2016 / MCO/NJC/JDS/nlo
We are members of the American Academy of Actuaries and meet the Qualification Standards of the American Academy of Actuaries to render the actuarial opinion contained herein. Respectfully submitted,
Nick J. Collier, ASA, EA, MAAA Mark C. Olleman, FSA, EA, MAAA Principal and Consulting Actuary Principal and Consulting Actuary Julie D. Smith, FSA, EA, MAAA Actuary
MCO/NJC/JDS/nlo
Attachment 1 Regular Meeting - Item 3
February 1, 2017
TRB20

Experience Analysis (2010-2015) California State Teachers’ Retirement System
This work product was prepared solely for CalSTRS for the purposes described herein and may not be appropriate to use for other purposes. Milliman does not intend to benefit and assumes no duty or liability to other parties who receive this work. Milliman recommends that third parties be aided by their own actuary or other qualified professional when reviewing the Milliman work product.
i
ctrj0291.docx
Table of Contents
Page
Section 1: Executive Summary ....................................................................................................................... 1
Section 2: Economic Assumptions ............................................................................................................... 15
Section 3: Actuarial Methods and Miscellaneous Assumptions ............................................................... 31
Section 4: Salary Increases Due to Promotion and Longevity (Merit) ...................................................... 37 Exhibit 4-1 Total Rates of Increase in Salary Due to Merit and Longevity All Members
(Excluding Actual General Wage Growth) ...................................................................................... 38 Exhibit 4-2 Annual Rates of Increase in Salary by Entry Age Due to Merit and Longevity
(Excluding Actual General Wage Growth) ...................................................................................... 39
Section 5: Retired Mortality ........................................................................................................................... 41 Exhibit 5-1 Mortality for Service (Healthy) Retirees – Males ............................................................................ 45 Exhibit 5-2 Mortality for Service (Healthy) Retirees – Females ........................................................................ 46 Exhibit 5-3 Mortality for Disabled Retirees – Males .......................................................................................... 47 Exhibit 5-4 Mortality for Disabled Retirees – Females ..................................................................................... 48 Exhibit 5-5 Mortality for Beneficiaries – Males.................................................................................................. 49 Exhibit 5-6 Mortality for Beneficiaries – Females ............................................................................................. 50
Section 6: Probability of Death from Active Status ..................................................................................... 51
Section 7: Service Retirement from Active Status ...................................................................................... 53 Exhibit 7-1 Service Retirement Rates (2% at 60 Members) Males—Less than 25 Years of Service .............. 55 Exhibit 7-2 Service Retirement Rates (2% at 60 Members) Females—Less than 25 Years of Service .......... 56 Exhibit 7-3 Service Retirement Rates (2% at 60 Members) Males—25 to 30 Years of Service ...................... 57 Exhibit 7-4 Service Retirement Rates (2% at 60 Members) Females—25 to 30 Years of Service .................. 58 Exhibit 7-5 Service Retirement Rates (2% at 60 Members) Males—30 or more Years of Service ................. 59 Exhibit 7-6 Service Retirement Rates (2% at 60 Members) Females—30 or more Years of Service ............. 60
Section 8: Disability Retirement .................................................................................................................... 61
Section 9: Other Terminations of Employment (Withdrawal)..................................................................... 63 Exhibit 9-1 Termination by Years of Service – Males ....................................................................................... 64 Exhibit 9-2 Termination by Years of Service – Females .................................................................................. 65
Section 10: Probability of Refund Upon Vested Termination ...................................................................... 67
Attachment 1 Regular Meeting - Item 3
February 1, 2017
TRB21

Experience Analysis (2010-2015) Table of Contents California State Teachers’ Retirement System (continued)
This work product was prepared solely for CalSTRS for the purposes described herein and may not be appropriate to use for other purposes. Milliman does not intend to benefit and assumes no duty or liability to other parties who receive this work. Milliman recommends that third parties be aided by their own actuary or other qualified professional when reviewing the Milliman work product.
ii
ctrj0291.docx
Appendix A-1: Summary of Proposed Assumptions ......................................................................................... 69 Table A.1 List of Major Valuation Assumptions .............................................................................................. 71 Table A.2 Mortality .......................................................................................................................................... 72 Table A.3 Service Retirement ......................................................................................................................... 73 Table A.4 Disability Retirement ....................................................................................................................... 74 Table A.5 Withdrawal ...................................................................................................................................... 75 Table A.6 Probability of Refund ...................................................................................................................... 76 Table A.7 Merit Salary Increases .................................................................................................................... 77 Table A.8 Supplemental Assumptions ............................................................................................................ 78 Table A.9 Custom Mortality Table Key ........................................................................................................... 80
Appendix A-2: Cash Balance Benefit Program Actuarial Methods and Assumptions ................................... 81 Table A-2.1 List of Major Valuation Assumptions for CBB Program .................................................................. 82 Table A-2.2 Mortality .......................................................................................................................................... 83
Appendix A-3: Defined Benefit Supplement Program Actuarial Methods and Assumptions ........................ 85 Table A-3.1 List of Major Valuation Assumptions for DBS Program .................................................................. 86 Table A-3.2 Mortality .......................................................................................................................................... 87
Attachment 1 Regular Meeting - Item 3
February 1, 2017
TRB22

Experience Analysis (2010-2015) California State Teachers’ Retirement System
This work product was prepared solely for CalSTRS for the purposes described herein and may not be appropriate to use for other purposes. Milliman does not intend to benefit and assumes no duty or liability to other parties who receive this work. Milliman recommends that third parties be aided by their own actuary or other qualified professional when reviewing the Milliman work product.
1
ctrj0291.docx
Section 1: Executive Summary
Overview
Any actuarial valuation is based on certain underlying assumptions. The results of the actuarial valuation, including the determination of the sufficiency of the contributions being made by members, employers, and the state, are highly dependent on the assumptions that the actuary uses to project the future benefit payments and then to discount the future benefits to determine the present values. Thus, the assumptions are critical in assisting the system in adequately monitoring the funding of the promised benefits.
To ensure the on-going reasonableness of the assumptions used in the valuation, they should be studied regularly. This process is called an experience analysis (or experience study).
Summary of Results
This section describes the key findings of this experience analysis of the California State Teachers’ Retirement System (CalSTRS) for the period July 1, 2010 through June 30, 2015. Note that because 2016 valuation data was not available when the experience study commenced, we have performed a five-year study ending in 2015.
We are recommending several changes to the demographic assumptions, as well as certain changes to the economic assumptions. Throughout this report, we will refer to our recommended assumptions as the “proposed” assumptions and the current assumptions as the “expected” assumptions.
Following are the three significant changes that we are recommending, with the first two having the greatest expected impact.
■ Investment Return Assumption: Based on CalSTRS capital market assumptions and our recommended 2.75% inflation assumption, we believe there is slightly less than a 50% probability that the current return assumption for the DB Program (7.50%) will be met over the long term. We are recommending a decrease in this assumption to 7.25%.
■ Mortality Assumption: We are recommending changes in the mortality assumptions to reflect recent experience and expected future improvements in mortality. In particular, we are recommending a generational mortality assumption. Generational mortality explicitly recognizes that mortality rates are expected to gradually decline in the future. The overall impact of this change is an increase in life expectancies.
■ Wage Growth Assumption: We are recommending a decrease in the general wage growth assumptions (from 3.75% to 3.50%) to reflect recent experience and lower future expectations. This assumption will also be used to project payroll in the future.
All other recommended changes are expected to have lesser impacts on the funded status of the system.
Attachment 1 Regular Meeting - Item 3
February 1, 2017
TRB23

Experience Analysis (2010-2015) California State Teachers’ Retirement System Executive Summary
This work product was prepared solely for CalSTRS for the purposes described herein and may not be appropriate to use for other purposes. Milliman does not intend to benefit and assumes no duty or liability to other parties who receive this work. Milliman recommends that third parties be aided by their own actuary or other qualified professional when reviewing the Milliman work product.
2
ctrj0291.docx
Summary of Results (continued)
If adopted, the new assumptions would result in a decrease in the Funded Ratio and an increase in the Projected Level Funding Rate needed, as compared to the current assumptions. This is discussed further in the Financial Impact section at the end of the Executive Summary.
Summary of Recommend Changes (Economic)
The following table shows a summary of our recommendations for the economic assumptions.
Summary of Recommend Changes (Demographic)
The following table shows a summary of our recommendations for the demographic assumptions (i.e., those relating to member behavior).
DB Program CBB / DBS ProgramsCurrent Recommended Current Recommended
Consumer Price Inflation 3.00 % 2.75 % 3.00 % 2.75 %Net Real Rate of Return 4.50 4.50 4.00/4.50 4.00/4.50Investment Return (1) 7.50 % 7.25 % 7.00/7.50 % 6.75/7.25 %
Interest on Member Accounts 4.50 % 3.00 % 7.00/7.50 % 6.75/7.25 %
Consumer Price Inflation 3.00 % 2.75 % n/a n/aReal Wage Inflation 0.75 0.75 n/a n/aWage Growth (2) 3.75 % 3.50 % n/a n/a
Portfolio Standard Deviation N/A % N/A % 13.90/13.20 % 15.00/13.00 %
1. Net of investment and administrative expenses.2. Payroll growth is assumed to equal wage growth (See Payroll Increase discussion).
Demographic Assumption Recommended Changes
MortalityHealthy Retired Members Increase Life ExpectancyBeneficiaries Increase Life ExpectancyDisabled Members Increase Life ExpectancyActive Members Increase Life Expectancy
Service RetirementRetirement from Active Membership Small Increase Overall
Add Assumption for 2% @ 62 MembersRetirement from Vested Membership Increase Age to 62 for 2% @ 62 Members
DisabilityCoverage A Lower RatesCoverage B No Change
Other Terminations of MembershipTermination Increases < 10 yrs / Decreases > 10 yrsProbability of Refund Reduce for 5-10 years of service
Salary Increases for Merit Small Increases and Decreases
Miscellaneous AssumptionsLoad for Sick Leave Service ReductionProbability of Marriage Small ReductionNumber of Children No ChangeOffsets for Death & Disability No Offsets AssumedValuation of Current Inactive Members Explicitly Value Deferred BenefitSplit between 1990 and New Benefits Estimate based on Retirement Year for Current Retirees
Attachment 1 Regular Meeting - Item 3
February 1, 2017
TRB24

Experience Analysis (2010-2015) California State Teachers’ Retirement System Executive Summary
This work product was prepared solely for CalSTRS for the purposes described herein and may not be appropriate to use for other purposes. Milliman does not intend to benefit and assumes no duty or liability to other parties who receive this work. Milliman recommends that third parties be aided by their own actuary or other qualified professional when reviewing the Milliman work product.
3
ctrj0291.docx
Summary of Recommend Changes (Demographic) (continued)
All assumptions recommended for the DB Program are also recommended to be used for the June 30, 2017 actuarial projection of the Supplemental Benefit Maintenance Account (SBMA) and the June 30, 2016 valuation of the Medicare Premium Payment (MPP) Program. Additional economic and demographic assumptions unique to the MPP Program will be developed in conjunction with the actuarial valuation.
Economic Assumptions
Section 2 discusses the economic assumptions: price inflation, general wage growth (includes price inflation and productivity), payroll growth, interest credit on member accounts, and the investment return assumption. We have recommended changes to the current economic assumptions, with the most significant of these being a reduction in the investment return assumption for the DB Program.
As discussed in Section 2, price inflation historically has averaged higher than the current 3.00% assumption; however, experience over the last twenty years and forecasts for future inflation are lower. We are recommending the assumption be lowered from 3.00% to 2.75%. We are recommending a decrease in the general wage growth assumption (from 3.75% to 3.50%) consistent with our recommended reduction in price inflation. Over the last 50 years, wages have exceeded price inflation by 0.6%. We are recommending the difference between wage growth and inflation remain at 0.75%, resulting in a total general wage growth assumption of 3.50%. This assumption will also be used to project future payroll. Based on CalSTRS’ current capital market assumptions and target asset allocation, the current 7.50% investment return assumption (net of administrative expenses) for the DB Program slightly exceeds the expected median long-term return. As discussed in more detail in Section 2, lower expected price inflation also argues for a lower expected return. Therefore, we are recommending a reduction in this assumption to 7.25%. As previously noted, this has the most significant impact of all our recommendations. We are also recommending the DBS Program assumption continue to be set equal to the DB Program (7.25%) since the DBS Program assets are invested similarly to the DB Program. For the CBB Program, we are recommending the assumption be set to 6.75% (0.50% less than the DB Program) due to the different asset mix.
Note that our conclusion that the recommended investment return assumption, and the alternates discussed, are reasonable is based on the advice of experts, in this case the capital market assumptions adopted by CalSTRS based on advice from their investment staff and consultants.
We are recommending a decrease in the interest assumed to be credited to members’ accounts in the DB Program (from 4.50% to 3.00%). Since 2004, the actual return on two-year treasuries (which the interest rate is based on) has averaged less than price inflation. Therefore, we are recommending a reduction in the assumed interest credit so that it is closer to the price inflation assumption.
Attachment 1 Regular Meeting - Item 3
February 1, 2017
TRB25

Experience Analysis (2010-2015) California State Teachers’ Retirement System Executive Summary
This work product was prepared solely for CalSTRS for the purposes described herein and may not be appropriate to use for other purposes. Milliman does not intend to benefit and assumes no duty or liability to other parties who receive this work. Milliman recommends that third parties be aided by their own actuary or other qualified professional when reviewing the Milliman work product.
4
ctrj0291.docx
Economic Assumptions (continued)
For the CBB and DBS Programs, we recommend retaining the current practice of setting the assumed interest credit on member accounts equal to the investment return assumption, as the intention is to allocate all investment earnings to the member accounts over the long term.
Under board policy, the calculation of the additional earnings credits for the CBB and DBS Programs is based on the funded ratio of the respective program and certain thresholds. These thresholds are based on the standard deviation of the program’s portfolio and are reviewed with the experience study. We recommend the assumed standard deviation be set equal to 15.0% for the DBS Program (previously 13.9%) and 13.0% for the CBB Program (previously 13.2%). Note that the standard deviation of the DBS Program reflects the impact of the SBMA interest credit guarantee, as discussed at the end of Section 2.
Actuarial Methods and Miscellaneous Assumptions
Section 3 discusses the actuarial methods and other miscellaneous assumptions used in the valuation and administration of the system.
We are recommending changes in this area as follows:
■ Sick Leave – Reduction in the additional sick leave members are assumed to have at retirement.
■ Probability of Eligible Survivor – Reduction in the probability an active member will have an eligible survivor to 85% of males (from 90%) and 65% of females (from 70%).
■ Benefit Offsets – Assume no offsets for other public benefits expected to be paid to future survivors and disabilities.
■ Option Factors – Update the assumed adjustments to the valuation mortality tables for Options 2 and 6.
■ Valuation of Inactive Members – Explicitly value the deferred service retirement benefit for inactive members by estimating the compensation amount (which is not provided on the valuation data). Previously, the actuarial obligations for inactive members was estimated by applying a load to the member contributions.
■ 1990 Benefits for Retirees – To split the retiree benefits between 1990 benefits and new benefits, the difference between the one-year and three-year final compensation is estimated. We are recommending the estimate be made based on actual salaries by year of retirement. Currently, a flat adjustment is made for all years.
Demographic Assumptions
Sections 4-10 discuss the demographic assumptions. Unlike the economic assumptions, which are more global in nature, the demographic assumptions are based heavily on recent CalSTRS experience. Demographic assumptions are used to predict future member behavior (e.g., when will the member retire? how long will the member live?).
From a cost perspective, the most significant change to the demographic assumptions that we are recommending is the strengthening of the mortality assumption (i.e., increased life expectancies).
Attachment 1 Regular Meeting - Item 3
February 1, 2017
TRB26

Experience Analysis (2010-2015) California State Teachers’ Retirement System Executive Summary
This work product was prepared solely for CalSTRS for the purposes described herein and may not be appropriate to use for other purposes. Milliman does not intend to benefit and assumes no duty or liability to other parties who receive this work. Milliman recommends that third parties be aided by their own actuary or other qualified professional when reviewing the Milliman work product.
5
ctrj0291.docx
Demographic Assumptions (continued)
When reviewing the sections on demographic assumptions, please note the following:
■ Our analysis uses the Actual-to-Expected (A/E) ratio to measure how well the current assumptions fit actual experience. For example, if the service retirement A/E is 80%, it indicates that there were 20% fewer actual service retirements than expected, and that we should consider decreasing the assumption. By decreasing the expected rates, the result is a higher ratio, in this case closer to 100%.
■ When we refer to the “proposed” assumptions, these are the assumptions that we are recommending. The current assumptions are also referred to as the “expected” assumptions.
■ For many of the assumptions, we show graphs of our analysis displaying the actual experience for the study (blue bar), the actual experience from the prior study (green bar), the current assumption (dark red line), and the new proposed assumption (orange line).
The recommended rates are shown in detail in Appendix A.
Individual Salary Increases due to Promotion and Longevity (Merit)
Section 4 discusses the individual salary increases due to promotion and longevity – the merit component of salaries. Overall, the results of our last two salary studies show increases have been close to the current rates predicted (as shown in the following graph). We are recommending small changes to this assumption to better fit the actual pattern, primarily increases in the 5-to-15 years of service range. See Section 4 for more details on this analysis.
0.0%
1.0%
2.0%
3.0%
4.0%
5.0%
6.0%
1 4 7 10 13 16 19 22 25 28 31 34 37 40
Mer
it In
crea
se
Years of Service
Salary Increases Less Wage Inflation -- All Members
Actual Prior Study Expected Proposed
Attachment 1 Regular Meeting - Item 3
February 1, 2017
TRB27

Experience Analysis (2010-2015) California State Teachers’ Retirement System Executive Summary
This work product was prepared solely for CalSTRS for the purposes described herein and may not be appropriate to use for other purposes. Milliman does not intend to benefit and assumes no duty or liability to other parties who receive this work. Milliman recommends that third parties be aided by their own actuary or other qualified professional when reviewing the Milliman work product.
6
ctrj0291.docx
Mortality after Retirement
The mortality assumption is used to predict the life expectancy of both members currently in pay status and those expected to receive a benefit in the future. We are recommending small changes in the mortality assumptions that predict how long members are currently living. We are also recommending the addition of a projection scale that reflects the gradual year-to-year improvement in mortality that is expected to occur in the future. This approach is sometimes referred to as “generational mortality” because it assumes that succeeding generations of members will live longer than the preceding generations. Overall, the new mortality assumption will result in an increase in life expectancy compared to the prior assumption. This is partly due to the modified approach, but it is primarily due to adjustments we made to reflect the lower mortality observed over the recent study period. Additional details are provided in Section 5.
The following table shows that the recommended mortality tables project that members retiring in the next year will live approximately the same number of years as are projected by the current assumptions.
For members early in their career who will not be retiring for a number of years, the expectation is that they will live two to three years longer than is projected by the current assumptions. Note that this generation of members (those retiring 30 years from now) is expected to live significantly longer than the prior generation (those retiring in the current year) due to the projection of mortality improvement for an additional 30 years under the generational mortality approach.
Service Retirement
Overall, the number of service retirements from active status was close to what the assumptions predicted, although there were some differences in the various service groups. In particular, members with between 25 and 30 years of service retired at a higher rate than expected during the period.
We are recommending some modifications in the service retirement rates for 2% at 60 members to reflect actual experience. In particular, we have proposed raising the rates for 25 to 30 years of service and slightly reducing the rates at 30 or more years of service.
Expected Lifetime for Future Retirees (Retiring in 2016)
Males FemalesCurrent Proposed Current Proposed
Age at Retirement 62.0 62.0 62.0 62.0
Expected Future Lifetime 25.9 25.6 27.9 28.3
Expected Age at Death 87.9 87.6 89.9 90.3
Expected Lifetime for Future Retirees (Retiring in 2046)
Males FemalesCurrent Proposed Current Proposed
Age at Retirement 62.0 62.0 62.0 62.0
Expected Future Lifetime 25.9 28.2 27.9 30.7
Expected Age at Death 87.9 90.2 89.9 92.7
Attachment 1 Regular Meeting - Item 3
February 1, 2017
TRB28

Experience Analysis (2010-2015) California State Teachers’ Retirement System Executive Summary
This work product was prepared solely for CalSTRS for the purposes described herein and may not be appropriate to use for other purposes. Milliman does not intend to benefit and assumes no duty or liability to other parties who receive this work. Milliman recommends that third parties be aided by their own actuary or other qualified professional when reviewing the Milliman work product.
7
ctrj0291.docx
Service Retirement (continued)
We have also recommended separate service retirement rates for the 2% at 62 members. These rates are slightly lower overall than the rates for the 2% at 60 members and reflect an expected later retirement age for 2% at 62 members due to the maximum benefit percentage being at an older age. Note that there is no service retirement experience for these members, since they are a relatively new group.
The table below illustrates the actual number of service retirements, along with the expected number based on the proposed assumptions, for males and females combined.
Further analysis is shown in Section 7 of this report.
Disability Retirement
Overall, the actual number (2,448) of disability retirements was slightly lower than what the assumptions predicted (2,659). We are recommending reduced rates of disability retirement for Coverage A and no changes to Coverage B. Further analysis is shown in Section 8 of this report.
Other Terminations of Employment
The actual rates of termination were lower than the assumptions predicted, primarily early in a member’s career; therefore, we are recommending reductions in these rates. Additionally, we have proposed higher rates later in a member’s career. This is illustrated in the following graph, which shows rates of termination by years of service for females. Note that the shift in the termination rate pattern between the prior and current studies is primarily due to a change in methodology we use to account for rehires and is not representative of a shift in member behavior. Further analysis is shown in Section 9 of this report.
Number of Service Retirements (2% at 60) -- Proposed
Actual ProposedActual /
Proposed
Less than 25 Years of Service 26,363 26,948 98% 25 to 30 Years of Service 9,319 8,816 106% 30 Years or More of Service 19,435 20,780 94% Total 55,117 56,544 97%
0%
2%
4%
6%
8%
10%
12%
14%
16%
1 2 3 4 5-9 10-14 15-19 20-24 25-29 30&Over
Annu
al P
roba
bilit
y of
With
draw
al
Years of Service
Actual 2016 Actual 2011 Expected Proposed
Attachment 1 Regular Meeting - Item 3
February 1, 2017
TRB29

Experience Analysis (2010-2015) California State Teachers’ Retirement System Executive Summary
This work product was prepared solely for CalSTRS for the purposes described herein and may not be appropriate to use for other purposes. Milliman does not intend to benefit and assumes no duty or liability to other parties who receive this work. Milliman recommends that third parties be aided by their own actuary or other qualified professional when reviewing the Milliman work product.
8
ctrj0291.docx
Probability of Refund upon Vested Termination
The actual number of refunds (6,594) paid to vested members at termination was greater than the assumptions predicted (5,551). We are recommending small increases in this assumption. The changes are for entry ages less than 40 and are primarily for service levels between five and ten years. The results based on the proposed assumptions are shown below. Further analysis is shown in Section 10 of this report.
Financial Impact of the Recommended Assumptions (DB Program)
The following exhibit shows the expected financial impact the proposed changes would have on the funding of the DB Program. If the proposed changes are adopted, the total level funding rate needed would increase (relative to if the changes were not made). The Funded Ratio of the DB Program would decrease under the new assumptions.
The financial impact was evaluated by performing additional valuations with the June 30, 2015 valuation data and reflecting the proposed assumption changes. We then projected the results to June 30, 2016 with a 1.0% investment return for the fiscal year ended June 30, 2016. The actual financial impact will vary somewhat for the June 30, 2016 valuation due to year-to-year changes.
The 35.58% level funding rate needed represents an estimated 3.57% increase in the combined state and employer contribution rates that would be needed as of June 30, 2016 as compared to the prior assumptions. Additional projections are shown at the end of this section.
Actual to Proposed Number of RefundsGender Actual Proposed RatioMales 2,140 2,141 100%
Females 4,454 4,266 104%
Total 6,594 6,407 103%
Attachment 1 Regular Meeting - Item 3
February 1, 2017
TRB30

Experience Analysis (2010-2015) California State Teachers’ Retirement System Executive Summary
This work product was prepared solely for CalSTRS for the purposes described herein and may not be appropriate to use for other purposes. Milliman does not intend to benefit and assumes no duty or liability to other parties who receive this work. Milliman recommends that third parties be aided by their own actuary or other qualified professional when reviewing the Milliman work product.
9
ctrj0291.docx
Financial Impact of the Recommended Assumptions (DB Program) (continued)
As shown in the table, the proposed change in the economic assumption and the mortality change have the largest impact. The impact on the Normal Cost rate are shown separately for the 2% at 60 and 2% at 62 members. Note that the impact of the proposed mortality changes on the 2% at 62 members is greater because they are on average younger and therefore are expected to experience greater improvement in mortality than the 2% at 60 members. All 2016 values are estimates.
Normal Cost % FundedTotal Level
Funding2% at 60 2% at 62 Ratio Rate Needed
June 30, 2015 Actuarial Valuation 18.22% 15.61% 68.5% 31.15%
Estimated Impact of 1% FYE2016 Return 0.00% 0.00% -1.3% 0.86%
June 30, 2016 Actuarial Valuation (Est.) 18.22% 15.61% 67.2% 32.01%
Demographic Assumptions
Termination Rate Changes -0.11% -0.07% 0.3% -0.31%
Probability of Refund Changes 0.00% 0.01% 0.0% 0.00%
Service Retirement Rate Changes 0.11% 0.20% -0.2% 0.25%
Disability Retirement Rate Changes 0.00% 0.00% 0.0% 0.00%
Merit Salary Rate Changes 0.25% 0.10% 0.0% 0.20%
Miscellaneous Assumption Changes(1) -0.03% -0.02% 0.1% -0.07%
Mortality Rate Changes 0.39% 0.68% -1.9% 1.87%
Inactive Member Valuation Changes 0.00% 0.00% 0.0% 0.01%
Demographic Subtotal 0.61% 0.90% -1.7% 1.95%
Economic Assumptions Interest on Member Accounts (3.00%) Wage Inflation and Payroll Growth (3.50%) Consumer Price Inflation (2.75%) Investment Return (7.25%) 0.49% 0.40% -1.6% 1.62%
Total Assumption Change 1.10% 1.30% -3.3% 3.57%
June 30, 2016 Actuarial Valuation (Est.) 19.32% 16.91% 63.9% 35.58% with All Changes
1. Assumptions for number of children, eligible spouse, sick leave credit at retirement, and benefit offsets.
Attachment 1 Regular Meeting - Item 3
February 1, 2017
TRB31

Experience Analysis (2010-2015) California State Teachers’ Retirement System Executive Summary
This work product was prepared solely for CalSTRS for the purposes described herein and may not be appropriate to use for other purposes. Milliman does not intend to benefit and assumes no duty or liability to other parties who receive this work. Milliman recommends that third parties be aided by their own actuary or other qualified professional when reviewing the Milliman work product.
10
ctrj0291.docx
Financial Impact – Alternative Investment Return Assumptions
Note that the recommended assumptions are not the only set of assumptions that would be considered reasonable. Within the parameters discussed in Section 2 (subsection “Possible Alternative Assumptions”), it would be reasonable for the board to select alternative economic assumptions. We have provided the estimated financial impact of two alternative investment return assumptions.
The table below shows the potential impact of a 7.00% investment return assumption.
The table below shows the potential impact of a 7.50% investment return assumption.
Financial Impact – Member Contribution Rates
Contribution rates for 2% at 60 members are based on a fixed schedule and are not impacted by the assumptions.
Contribution rates for 2% at 62 members are based on the group’s Normal Cost rate and therefore may ultimately be impacted by the assumptions. In general, the rate is set equal to the base member contribution rate of one-half of the Normal Cost rate plus a fixed adjustment for the annual benefit adjustment. However, the base member contribution rate does not change if the increase or decrease in the Normal Cost rate for members is less than 1% of pay since the last adjustment.
Under the recommended assumptions, the Normal Cost rate for 2% at 62 members is 16.91% of pay. This compares to the rate at last adjustment of 15.90% of pay. Since the change is close to 1% of pay, it is possible that when the 2016 valuation is completed, the Normal Cost rate for 2% at 62 members may exceed 16.90% and we would therefore recommend an adjustment to the member rate. If this were to occur, we estimate that the increase would be in the neighborhood of 0.5% of pay.
Normal Cost % FundedTotal Level
Funding2% at 60 2% at 62 Ratio Rate Needed
June 30, 2016 Actuarial Valuation (Est.) 18.22% 15.61% 67.2% 32.01%
Recommended Demographic Changes 0.61% 0.90% -1.7% 1.95%
Economic Asssumptions with 7.00% Return 1.75% 1.47% -3.6% 3.82%
June 30, 2016 Actuarial Valuation (Est.) 20.58% 17.98% 61.9% 37.78% (with assumption changes)
Normal Cost % FundedTotal Level
Funding2% at 60 2% at 62 Ratio Rate Needed
June 30, 2016 Actuarial Valuation (Est.) 18.22% 15.61% 67.2% 32.01%
Recommended Demographic Changes 0.61% 0.90% -1.7% 1.95%
Economic Asssumptions with 7.50% Return -0.73% -0.68% 0.5% -0.51%
June 30, 2016 Actuarial Valuation (Est.) 18.10% 15.83% 66.0% 33.45% (with assumption changes)
Attachment 1 Regular Meeting - Item 3
February 1, 2017
TRB32

Experience Analysis (2010-2015) California State Teachers’ Retirement System Executive Summary
This work product was prepared solely for CalSTRS for the purposes described herein and may not be appropriate to use for other purposes. Milliman does not intend to benefit and assumes no duty or liability to other parties who receive this work. Milliman recommends that third parties be aided by their own actuary or other qualified professional when reviewing the Milliman work product.
11
ctrj0291.docx
Financial Impact – Member Contribution Rates (continued)
If the recommended assumptions were adopted but the investment return assumption were lowered to 7.00%, it would be almost certain that there would be an increase in the contribution rate for 2% at 62 members. If this were to occur, we estimate that the increase would be in the neighborhood of 1.0% of pay. Conversely if a 7.50% investment return assumption was adopted, we would not expect a change in the member rates would be needed.
Financial Impact – Projected 2046 Funding
The 2015 valuation showed the DB Program was projected to be fully funded by 2046 under the funding arrangement adopted in 2014. Applying the recommended assumptions to the 2015 valuation results in lower expected returns (due to the lower investment return assumption) and an increase in the time the expected benefits are to be paid (due to longer life expectancies). Under the recommended assumptions, the contributions to the DB Program are still projected to be sufficient to reach full funding by 2046; however, higher state and employer contribution rates (relative to those projected in the 2015 valuation report) would be required, with the increase primarily falling on the state.
Under the 7.00% and 7.50% investment return assumption scenarios, the DB Program would also be projected to be approximately 100% funded in 2046. Increases in the state and employer contribution rates would also be expected but to varying degrees.
The projection assumptions are the same as those stated on page 6 of our 2015 DB Program valuation report, except for the reflection of the assumptions recommended in this report and the inclusion of the estimated FYE2016 investment return of 1.0%.
Financial Impact – Projected State and Employer Contribution Rates
The financial analysis shown previously quantified the impact of the proposed assumptions on the contributions needed in total. The graph on the next page shows the projected impact on the total state contribution rate (excluding the SBMA contribution). The blue line shows the projected state contribution rate assuming no changes in assumptions, but reflecting the estimated 1.0% return for the prior fiscal year. The red line with red triangles shows the projected state contribution rate if the recommended demographic and economic changes are adopted.
Attachment 1 Regular Meeting - Item 3
February 1, 2017
TRB33

Experience Analysis (2010-2015) California State Teachers’ Retirement System Executive Summary
This work product was prepared solely for CalSTRS for the purposes described herein and may not be appropriate to use for other purposes. Milliman does not intend to benefit and assumes no duty or liability to other parties who receive this work. Milliman recommends that third parties be aided by their own actuary or other qualified professional when reviewing the Milliman work product.
12
ctrj0291.docx
Financial Impact – Projected State and Employer Contribution Rates (continued)
To provide an apples-to-apples comparison, we have shown the projections assuming a 7.25% return in each future year.
The graph below shows parallel information for the employer contribution rate. It shows an increase in the employer contribution rate under the new assumptions, but a much smaller increase than previously illustrated for the state.
0%2%4%6%8%
10%12%14%16%18%20%
2015 2020 2025 2030 2035 2040 2045
Fiscal Year Beginning
Projected Total Employer Contribution Rate Reflects Market Value of Assets
Old Assump (7.50%) New Assump (7.25%)
0%2%4%6%8%
10%12%14%16%18%20%
2015 2020 2025 2030 2035 2040 2045
Fiscal Year Beginning
Projected State Contribution Rate (Excludes SBMA)Reflects Market Value of Assets
Old Assump (7.50%) New Assump (7.25%)
Attachment 1 Regular Meeting - Item 3
February 1, 2017
TRB34

Experience Analysis (2010-2015) California State Teachers’ Retirement System Executive Summary
This work product was prepared solely for CalSTRS for the purposes described herein and may not be appropriate to use for other purposes. Milliman does not intend to benefit and assumes no duty or liability to other parties who receive this work. Milliman recommends that third parties be aided by their own actuary or other qualified professional when reviewing the Milliman work product.
13
ctrj0291.docx
Financial Impact – Projected State and Employer Contribution Rates under Alternative Return Assumptions
The following two graphs repeat the graphs from the prior page but add two lines to show the projected contribution rates assuming all recommended demographic changes are adopted with an investment return assumption that is either 0.25% higher or lower than the recommended 7.25%. Once again, all of the scenarios illustrated assume that 7.25% is earned each year in the future, regardless of the assumed investment return for the particular scenario. The first graph shows that a lower investment return assumption causes the contribution rates to higher in the short term but lower in the long term. The converse is true if the return assumption is set higher.
The graph below shows parallel information for the employer contribution rate. It shows a much smaller difference in the employer contribution rate under the alternate return assumptions than was shown above for the projected state contribution rate.
0%2%4%6%8%
10%12%14%16%18%20%
2015 2020 2025 2030 2035 2040 2045
Fiscal Year Beginning
Projected State Contribution Rate (Excludes SBMA)Reflects Market Value of Assets
Old Assump New Assump (7.25%)New Assump (7.00%) New Assump (7.50%)
0%2%4%6%8%
10%12%14%16%18%20%
2015 2020 2025 2030 2035 2040 2045
Fiscal Year Beginning
Projected Total Employer Contribution Rate Reflects Market Value of Assets
Old Assump (7.50%) New Assump (7.25%)New Assump (7.00%) New Assump (7.50%)
Attachment 1 Regular Meeting - Item 3
February 1, 2017
TRB35

Experience Analysis (2010-2015) California State Teachers’ Retirement System Executive Summary
This work product was prepared solely for CalSTRS for the purposes described herein and may not be appropriate to use for other purposes. Milliman does not intend to benefit and assumes no duty or liability to other parties who receive this work. Milliman recommends that third parties be aided by their own actuary or other qualified professional when reviewing the Milliman work product.
14
ctrj0291.docx
Financial Impact of the Recommended Assumptions (CBB and DBS Programs)
The following tables show the expected financial impact the proposed changes would have on the funded status of the CBB and DBS Programs. The proposed changes would have no impact on the obligation for active and inactive members of either plan, since these obligations are equal to the sum of the members’ account balances.
There would be a small impact on the obligation for retirees due to the proposed changes in mortality and the investment return assumption. As the retiree obligation is only a small portion of the total obligation, the overall impact is very minor. Note that funded ratios shown are as of June 30, 2015. Values as of June 30, 2016 are expected to be a few percentage points less due to the actual return for the year ended June 30, 2016 being less than the interest credited to the accounts for the period.
Financial Impact of the Recommended Assumptions (SBMA)
The funding of the SBMA is currently projected to be sufficient at the 85% purchasing power level. There is some margin for possible adverse experience in the future. For example, if inflation was slightly higher than assumed for the next few years, the current funding is still expected to provide the same level of benefits. The recommended assumptions would increase this margin, since the lower inflation assumption would project lower purchasing power benefits. This would be somewhat offset by the lower investment return assumption.
Revised Assumptions and Methods
Appendix A illustrates the Summary of Actuarial Assumptions as it will appear in the June 30, 2016 valuation report, if all recommended assumptions and methods are adopted. Proposed changes in assumptions are highlighted in yellow. The recommended assumptions are for use with CalSTRS funding calculations. Modifications to the assumptions to be used for the GASB 67/68 valuation will be addressed at a separate time.
CBB Program -- Financial Impact of Recommended Assumptions
Funded Ratio
June 30, 2015 Actuarial Valuation 113.20%
Mortality Rate Change -0.05% Investment Return Assumption 6.75% -0.03%
June 30, 2015 Actuarial Valuation Changes 113.12%
DBS Program -- Financial Impact of Recommended Assumptions
Funded Ratio
June 30, 2015 Actuarial Valuation 114.52%
Mortality Rate Change -0.23%
Investment Return Assumption 7.25% -0.20%
June 30, 2015 Actuarial Valuation Changes 114.09%
Attachment 1 Regular Meeting - Item 3
February 1, 2017
TRB36

Experience Analysis (2010-2015) California State Teachers’ Retirement System
This work product was prepared solely for CalSTRS for the purposes described herein and may not be appropriate to use for other purposes. Milliman does not intend to benefit and assumes no duty or liability to other parties who receive this work. Milliman recommends that third parties be aided by their own actuary or other qualified professional when reviewing the Milliman work product.
15
ctrj0291.docx
Section 2: Economic Assumptions
Actuarial Standard of Practice (ASOP) No. 27, Selection of Economic Assumptions for Measuring Pension Obligations, provides guidance to actuaries giving advice on selecting economic assumptions for measuring obligations under defined benefit plans. Because no one knows what the future holds, the best an actuary can do is to use professional judgment to estimate possible future economic outcomes. These estimates are based on a mixture of past experience, future expectations, and professional judgment. The actuary should consider a number of factors, including the purpose and nature of the measurement, and appropriate recent and long-term historical economic data. However, the standard explicitly advises the actuary not to give undue weight to recent experience.
Recent changes in ASOP No. 27 have restricted what assumptions satisfy the standard. In particular, previously any assumption within the “best-estimate” range (a wide range in our opinion) was likely to satisfy the standard. To meet the new standard, the assumption “reflects the actuary’s estimate of future experience” and “it has no significant bias (i.e., it is not significantly optimistic or pessimistic)…” We believe this reduces the range of assumptions that would be considered reasonable.
Each economic assumption should individually satisfy this standard. Furthermore, with respect to any particular valuation, each economic assumption should be consistent with every other economic assumption over the measurement period.
After completing the selection process, the actuary should review the set of economic assumptions for consistency. This may lead the actuary to recommend the same inflation component in each of the economic assumptions proposed.
This section will discuss the economic assumptions. In our opinion, the economic assumptions recommended in this report have been developed in accordance with ASOP No. 27. The following table summarizes our recommendations (changes are shown in bold). Note that this is not the only set of assumptions that would be considered reasonable. In the prior section, we show the financial impact of the recommended economic assumptions, plus the impact of investment return assumptions that are either 0.25% higher or lower than the recommended 7.25% (for the DB Program).
DB Program CBB / DBS ProgramsCurrent Recommended Current Recommended
Consumer Price Inflation 3.00 % 2.75 % 3.00 % 2.75 %Net Real Rate of Return 4.50 4.50 4.00/4.50 4.00/4.50Investment Return (1) 7.50 % 7.25 % 7.00/7.50 % 6.75/7.25 %
Interest on Member Accounts 4.50 % 3.00 % 7.00/7.50 % 6.75/7.25 %
Consumer Price Inflation 3.00 % 2.75 % n/a n/aReal Wage Inflation 0.75 0.75 n/a n/aWage Growth (2) 3.75 % 3.50 % n/a n/a
Portfolio Standard Deviation N/A % N/A % 13.90/13.20 % 15.80/13.00 %
1. Net of investment and administrative expenses.2. Payroll growth is assumed to equal wage growth (See Payroll Increase discussion).
Attachment 1 Regular Meeting - Item 3
February 1, 2017
TRB37

Experience Analysis (2010-2015) California State Teachers’ Retirement System Economic Assumptions
This work product was prepared solely for CalSTRS for the purposes described herein and may not be appropriate to use for other purposes. Milliman does not intend to benefit and assumes no duty or liability to other parties who receive this work. Milliman recommends that third parties be aided by their own actuary or other qualified professional when reviewing the Milliman work product.
16
ctrj0291.docx
1. Price Inflation
Use in the Valuation When we refer to inflation in this report, we are referring to price inflation. The inflation assumption has an indirect impact on the results of the actuarial valuation through the development of the assumptions for the investment return, the interest rate on member accounts, the general wage increases and the payroll increase assumption. It also has a direct impact on the actuarial projection of the SBMA, as it will be used to determine the expected future purchasing power payments. The long-term relationship between inflation and investment return has long been recognized by economists. The basic principle is that the investors demand a “real return” – the excess of actual investment returns over inflation. If inflation rates are expected to be high, investors will demand investment returns that are also expected to be high enough to exceed inflation, while lower inflation rates will result in lower expected investment returns, at least in the long run. The current valuation assumption for inflation is 3.00% per year. Our recommendation is to lower the assumption to 2.75%.
Historical Perspective The data for inflation shown below is based on the national Consumer Price Index, US City Average, All Urban Consumers (CPI-U) as published by the Bureau of Labor Statistics. Although economic activities in general, and inflation in particular, do not lend themselves to prediction on the basis of historical analysis, historical patterns and long term trends are a factor to be considered in developing the inflation assumption. There are numerous ways to review historical data, with significantly differing results. The tables below show the compounded annual inflation rate for various 10-year periods, and for the 50-year period ended in December 2015. Note that the 50-year average is heavily influenced by the inflation of the late 1970’s and early 1980’s.
CPIDecade Increase
2006-2015 1.9%1996-2005 2.5%1986-1995 3.5%1976-1985 7.0%1966-1975 5.7%
Prior 50 Years1966-2015 4.1%
Attachment 1 Regular Meeting - Item 3
February 1, 2017
TRB38

Experience Analysis (2010-2015) California State Teachers’ Retirement System Economic Assumptions
This work product was prepared solely for CalSTRS for the purposes described herein and may not be appropriate to use for other purposes. Milliman does not intend to benefit and assumes no duty or liability to other parties who receive this work. Milliman recommends that third parties be aided by their own actuary or other qualified professional when reviewing the Milliman work product.
17
ctrj0291.docx
Historical Perspective (continued)
These are national statistics. The inflation assumption as it relates to the investment return assumption should be based more on national and even global inflation; whereas, the inflation assumption used in the SBMA projection and the wage growth and payroll growth assumptions for the DB Program is tied to inflation in California. We believe that although there have been historical differences between U.S. and California CPI changes, in the long term there should be a high correlation. For comparison, the average CPI increase for California has been 4.2% for the 50-year period 1966-2015, compared to the national average of 4.1%.
The following graph shows historical national CPI increases. Note that the actual CPI increase has generally been less than 3.00% during the most recent 25 years.
0%2%4%6%8%
10%12%14%16%
1960 1970 1980 1990 2000 2010
Historical CPI-U
CPI-U Flat 3.00%
Attachment 1 Regular Meeting - Item 3
February 1, 2017
TRB39

Experience Analysis (2010-2015) California State Teachers’ Retirement System Economic Assumptions
This work product was prepared solely for CalSTRS for the purposes described herein and may not be appropriate to use for other purposes. Milliman does not intend to benefit and assumes no duty or liability to other parties who receive this work. Milliman recommends that third parties be aided by their own actuary or other qualified professional when reviewing the Milliman work product.
18
ctrj0291.docx
Peer System Comparison
According to the Public Plans Database (a survey of over 150 state and local systems maintained by a collaboration between the Center for Retirement Research at Boston College, the Center for State and Local Government Excellence, and the National Association of State Retirement Administrators), the average inflation assumption for statewide systems has been steadily declining. As of the most recent study, the most common assumption is 3.00%, so CalSTRS is in the mainstream. However, it should be noted that the survey is based on valuations that are almost entirely from 2013 or 2014, and we believe that further declines have occurred since then. The following graph shows this distribution.
Forecasts of Inflation Since the U.S. Treasury started issuing inflation indexed bonds, it is possible to
determine the approximate rate of inflation anticipated by the financial markets by comparing the yields on inflation indexed bonds with traditional fixed government bonds. Current market prices as of December 2016 suggest investors expect inflation to be about 2.1% over the next 30 years.
CalSTRS’ investment consultants also have lower expectations of inflation, with Meketa projecting 2.1% over the next 10 years and PCA projecting 2.5% over the next 20 years.
Additionally, we reviewed the expected increase in the CPI by the Office of the Chief Actuary for the Social Security Administration. In the 2016 Trustees Report, the projected average annual increase in the CPI over the next 75 years under the intermediate cost assumptions was 2.60%.
0% 10% 20% 30% 40% 50%
2.50% orless
2.75%
3.00%
3.25%
3.50%
Above3.50%
Percent of Retirement Systems Using Assumption
Price Inflation AssumptionPublic Plans Database
CalSTRS
Attachment 1 Regular Meeting - Item 3
February 1, 2017
TRB40

Experience Analysis (2010-2015) California State Teachers’ Retirement System Economic Assumptions
This work product was prepared solely for CalSTRS for the purposes described herein and may not be appropriate to use for other purposes. Milliman does not intend to benefit and assumes no duty or liability to other parties who receive this work. Milliman recommends that third parties be aided by their own actuary or other qualified professional when reviewing the Milliman work product.
19
ctrj0291.docx
Recommendation The consumer price inflation assumption does not directly impact the funding of the DB Program; however, it is used to determine the sufficiency of the SBMA funding to pay purchasing power benefits. It is also used in the determination of the investment return assumption, the assumed interest credit to member accounts, and the wage growth assumption. We recommend the long-term assumed inflation rate be decreased to 2.75% per year to reflect lower forecasts.
Consumer Price Inflation
Current Assumption 3.00% Recommended Assumption 2.75%
Attachment 1 Regular Meeting - Item 3
February 1, 2017
TRB41

Experience Analysis (2010-2015) California State Teachers’ Retirement System Economic Assumptions
This work product was prepared solely for CalSTRS for the purposes described herein and may not be appropriate to use for other purposes. Milliman does not intend to benefit and assumes no duty or liability to other parties who receive this work. Milliman recommends that third parties be aided by their own actuary or other qualified professional when reviewing the Milliman work product.
20
ctrj0291.docx
2. Wage Growth
Use in the Valuation
Estimates of future salaries are based on two assumptions: 1) general wage increases and 2) merit increases. Rates of increase in the general wage level of the membership are directly related to inflation, while individual salary increases due to promotion and longevity occur even in the absence of inflation. The promotion and longevity assumptions, referred to as the merit scale, will be reviewed with the other demographic assumptions. The current assumption is for wage growth to be 0.75% above the inflation assumption.
Historical Perspective We have used statistics from the Social Security Administration on the National Average Wage dating from 1966 to 2015. There are numerous ways to review this data. For consistency with our observations of other indices, the table below shows the compounded annual rates of wage growth for various 10-year periods and for the 50-year period ending in 2015. The excess of wage growth over price inflation represents “productivity” (or the increase in the standard of living, also called the real wage inflation rate).
These are national statistics for all jobs. For comparison, the average increase in the real wage for members of CalSTRS has been 0.3% for the most recent 30-year period. This is significantly less than the national average which increased 0.9% more than inflation over the last 30 years.
Forecasts of Future Wages
Wage inflation has been projected by the Office of the Chief Actuary of the Social Security Administration. In the 2016 Trustees Report, the ultimate long-term annual increase in the National Average Wage is estimated to be 1.2% higher than the Social Security intermediate inflation assumption of 2.7% per year.
Wage CPI Real WageDecade Growth Increase Inflation
2006-2015 2.4% 1.9% 0.5%1996-2005 4.1% 2.5% 1.6%1986-1995 3.9% 3.5% 0.4%1976-1985 6.9% 7.0% -0.1%1966-1975 6.4% 5.7% 0.7%
Prior 50 Years1966-2015 4.7% 4.1% 0.6%
Attachment 1 Regular Meeting - Item 3
February 1, 2017
TRB42

Experience Analysis (2010-2015) California State Teachers’ Retirement System Economic Assumptions
This work product was prepared solely for CalSTRS for the purposes described herein and may not be appropriate to use for other purposes. Milliman does not intend to benefit and assumes no duty or liability to other parties who receive this work. Milliman recommends that third parties be aided by their own actuary or other qualified professional when reviewing the Milliman work product.
21
ctrj0291.docx
Reasonable Range and Recommendation
Over the last 50 years, the actual experience, on a national basis, has been close to the current assumption. We believe that wages will continue to grow at a greater rate than prices over the long term, although not to the extent projected by Social Security. We are recommending that the long-term assumed real wage inflation rate remain at 0.75% per year.
Real Wage Inflation Rate
Current Assumption 0.75%
Recommended Assumption 0.75%
The wage growth assumption is the total of the consumer price inflation assumption and the real wage inflation rate. If the real wage inflation assumption remains at 0.75% and the price inflation assumption decreases to 2.75%, this would result in a total wage growth assumption of 3.50%.
Payroll Increase Assumption
The aggregate payroll of CalSTRS is expected to increase, without accounting for the possibility of an increase in membership (our current and recommended assumption is that no growth in membership will occur). Note that we believe the zero population growth is a reasonable assumption. Although we do not have projections of active teacher population, the California Department of Finance publishes a projection of school age children on their website. This projects a relatively stable student population over the next 10 years, with an average annual decrease of less than 0.04% per year. Given that there is a correlation between the number of students and the number of teachers, we believe this supports the zero growth assumption for the number of active teachers. The current payroll increase assumption is equal to the general wage growth assumption of 3.75%. It is our recommendation to set these two assumptions to be equal, unless there is a specific circumstance that would call for an alternative assumption. In the case of CalSTRS, members hired in 2013 and later are subject to a more restrictive definition of creditable compensation and therefore are expected to have slightly lower pay than comparable members hired prior to 2013. Based on our analysis, this is expected to reduce future payroll by about 0.02% per year. We believe this difference is not material, and we are not recommending any adjustment to the payroll increase adjustment to account for the new creditable compensation definition. We are recommending that the payroll increase assumption be reduced to 3.50% to continue to be consistent with the general wage growth assumption. Note that if CalSTRS was closed to new teachers, that event would significantly impact this assumption.
Attachment 1 Regular Meeting - Item 3
February 1, 2017
TRB43

Experience Analysis (2010-2015) California State Teachers’ Retirement System Economic Assumptions
This work product was prepared solely for CalSTRS for the purposes described herein and may not be appropriate to use for other purposes. Milliman does not intend to benefit and assumes no duty or liability to other parties who receive this work. Milliman recommends that third parties be aided by their own actuary or other qualified professional when reviewing the Milliman work product.
22
ctrj0291.docx
3. Investment Return
Use in the Valuation The investment return assumption is one of the primary determinants in the calculation of the expected cost of the System’s benefits, providing a discount of the future benefit payments that reflects the time value of money. This assumption has a direct impact on the calculation of liabilities, normal costs, and the factors for optional forms of benefits. The current investment return assumption for the CalSTRS DB and DBS Programs is 7.50% per year, net of administrative and investment-related expenses. For the CBB Program, the assumed return is 7.00%. Our recommendation is to decrease both assumptions by 0.25%.
Expected Long-Term Investment Return
We have determined the expected long-term investment return. As input, we have used the CalSTRS capital market assumptions (from Item 7 of the June 2015 Investment Committee meeting) and CalSTRS’ target asset allocation (adopted at the November 2015 regular board meeting). CalSTRS’ target asset allocation is summarized in the following table:
1. CBB assets are not separately invested and receive earnings based on the total plan assets excluding real estate and private equity. This is Milliman's estimate of the effective CBB allocation.
Note that the actual composition of the Risk Mitigating Strategies (RMS) asset class has not yet been determined. For purposes of this analysis, we have used the RMS allocation shown in Meketa’s memorandum for the November, 2015 Investment Committee meeting (see INV99 of item 10). We also modeled various alternative compositions of the RMS asset class and found the impact was fairly small, ranging from a decrease of 0.1% to an increase of 0.1% in the expected return, as compared to the target allocation used in our analysis.
Combining the capital market assumptions with the target asset allocation policy, we calculate the long-term (20 years) expected rate of return to be 7.47% (7.37% after adjusting for administrative expenses, which are discussed later). This expected return is the median return on a geometric basis for all State Teachers’ Retirement Plan (STRP) assets and compares to the median compounded return of 7.4% reported by Meketa and PCA in their November, 2015 board presentation.
Target AllocationDB & DBS CBB(1)
Global Equity 47 % 64 % Private Equity 13 0 Real Estate 13 0 Inflation Sensitive 4 5 Risk Mitigation Strategies 9 10 Fixed Income 12 18 Cash 2 3 Total 100 % 100 %
Attachment 1 Regular Meeting - Item 3
February 1, 2017
TRB44

Experience Analysis (2010-2015) California State Teachers’ Retirement System Economic Assumptions
This work product was prepared solely for CalSTRS for the purposes described herein and may not be appropriate to use for other purposes. Milliman does not intend to benefit and assumes no duty or liability to other parties who receive this work. Milliman recommends that third parties be aided by their own actuary or other qualified professional when reviewing the Milliman work product.
23
ctrj0291.docx
Capital Market Assumptions
The capital market assumptions used in our analysis are from Agenda Item 7 (pages INV28-INV30) of the June 2015 Investment Committee meeting. They do not exactly map one-to-one to the target asset allocation, as some of the asset classes from the capital market assumptions are subclasses of those listed in the target allocation. We used a similar breakdown of asset allocation as that reported by Meketa in their memorandum for the November 2015 Investment Committee meeting (see INV99 of item 10). The allocation used is shown below:
1. 20-year geometric average. 2. Used Milliman capital market assumptions for cash.
Impact of Lower Assumed Inflation on Expected Long-Term Investment Return
The CalSTRS capital market assumptions are based on the price inflation assumption of 3.0% used in the most recent valuation. Using a lower inflation assumption, as we are recommending, would result in lower capital market assumptions and a lower expected return. Inflation has a high correlation with bond yields, so lower expected inflation will generally correlate with lower bond yields in the long term. This may be somewhat offset by increased values of existing bonds when inflation decreases, making existing yields more attractive. In total, we would expect a 0.25% decrease in the inflation component of the capital market assumptions would result in a decrease in expected bond returns, but somewhat less than 0.25%. Additionally, there is a correlation between inflation and equity returns. Investors expect a risk premium (the excess over the risk-free rate of return that an investment is expected to yield) when purchasing equities or other risky investments. To the extent the risk-free rate is low, which is correlated with low inflation, the price of the equity will decline, assuming the risk premium does not change.
Expected StandardAllocation Return(1) Deviation
US Equity 24% 7.3 % 18.5 % Non-US Equity 23 7.4 21.0 Private Equity 13 9.2 25.0 TIPS 1 2.7 7.3 Investment Grade Bonds 11 3.1 6.0 Cash(2) 2 2.0 1.0 High Yield Bonds 1 5.3 13.8 Private Real Estate 13 7.4 18.0 Infrastructure 3 7.0 14.0 Global Macro 1 5.7 7.0 CTA (Trend Following) 4 5.5 17.0 Systematic Risk Premia 1 5.2 14.0 Long Treasury 3 3.1 18.0 Total 100 %
Attachment 1 Regular Meeting - Item 3
February 1, 2017
TRB45

Experience Analysis (2010-2015) California State Teachers’ Retirement System Economic Assumptions
This work product was prepared solely for CalSTRS for the purposes described herein and may not be appropriate to use for other purposes. Milliman does not intend to benefit and assumes no duty or liability to other parties who receive this work. Milliman recommends that third parties be aided by their own actuary or other qualified professional when reviewing the Milliman work product.
24
ctrj0291.docx
Investment and Administrative Expenses
The investment return used for the valuation is assumed to be net of all investment and administrative expenses. It is our understanding that CalSTRS’ capital market assumptions are effectively net of investment expenses (except for some small indexing fees), so we only adjust for administrative expenses. The following table shows the ratio of total administrative expenses to the fair market value of CalSTRS assets over the last 10 fiscal years ending June 30. The expense ratio is calculated as the total administrative expense divided by the ending asset balance at fair market value.
The ratio of administrative expenses to market assets has averaged close to 0.10% over the period shown. This amount does not have a direct impact on the actuarial valuation results, but it does provide a measure of the return on investments that will be needed to meet the actuarial assumption used for the valuation. For example, if the investment return assumption is set equal to 7.50%, then CalSTRS would need to earn a return on its assets, net of investment expenses, of about 7.60% in order to net the current 7.50% assumed return for funding purposes. It will also impact the discount rate used in the GASB 67/68 Financial Reporting Valuation, since GASB requires the discount rate to be gross of administrative expenses.
($million) Market Admin. ExpenseFYB Assets Expense Ratio2006 144,212$ 106 0.07%2007 172,378 109 0.062008 161,498 113 0.072009 118,430 140 0.122010 129,768 110 0.082011 155,346 138 0.092012 151,318 137 0.092013 166,349 154 0.092014 190,312 145 0.082015 191,822 180 0.09
Attachment 1 Regular Meeting - Item 3
February 1, 2017
TRB46

Experience Analysis (2010-2015) California State Teachers’ Retirement System Economic Assumptions
This work product was prepared solely for CalSTRS for the purposes described herein and may not be appropriate to use for other purposes. Milliman does not intend to benefit and assumes no duty or liability to other parties who receive this work. Milliman recommends that third parties be aided by their own actuary or other qualified professional when reviewing the Milliman work product.
25
ctrj0291.docx
Peer System Comparison
According to the Public Fund Survey, the average investment return assumption for statewide systems has been steadily declining. As of the most recent study, the median rate is 7.50%. The following chart shows a progression of the distribution of the investment return assumptions. In 2001, very few systems had an assumption of 7.5% or lower and over 80% had an assumption of 8.0% or greater. As of fiscal year 2016, over 50% have an assumption of 7.5% or less and this is continuing to trend down.
Capital Market Assumptions Relative to Others
As noted, our analysis of the expected return has been based on the CalSTRS capital market assumptions. Although we believe these are reasonable, it should be noted that there is currently a fair amount of variation among investment professionals. For example, the expected 30-year return based on Milliman’s capital market assumptions is less than 7.0%; however, it should be noted that Milliman’s capital market assumptions are based on a lower inflation assumption than the proposed assumption of 2.75%. The lower underlying inflation assumption will tend to lead to a lower expected return.
Impact on Contribution Rates and Funding
Under current law, a change in the investment return assumption (or almost any assumption) can impact the contribution rates paid by the 2% at 62 members, the employers and the state. The financial impact of the recommended changes in assumptions is shown at the end of the Executive Summary.
One feature of CalSTRS’ funding is that the changes in the state contribution rate are not symmetrical. That is, increases in any year are limited to 0.50% of the applicable payroll, but there is no limit to decreases, except that the state supplemental rate cannot go below 4.311% of pay until the 1990 UAO is paid off. This means that if the assumptions understate the future costs, it may take a long time for future adjustments to reach the appropriate actuarial level.
Attachment 1 Regular Meeting - Item 3
February 1, 2017
TRB47

Experience Analysis (2010-2015) California State Teachers’ Retirement System Economic Assumptions
This work product was prepared solely for CalSTRS for the purposes described herein and may not be appropriate to use for other purposes. Milliman does not intend to benefit and assumes no duty or liability to other parties who receive this work. Milliman recommends that third parties be aided by their own actuary or other qualified professional when reviewing the Milliman work product.
26
ctrj0291.docx
Expected Return for the CBB Program
The assets of the CBB Program are a subset of the STRP assets; however, the return credited to the CBB Program assets is based on a different allocation that excludes the private equity and real estate asset classes. Currently, the investment return assumption for this program is 0.5% less than the DB Program to account for this.
We performed similar modeling for the allocation of the CBB Program and found that the expected return is 0.6% less than that for the DB Program. Therefore, we believe that continuing the assumption that the CBB Program return is 0.5% less than the DB Program is reasonable.
Additional Impact of Change
The investment return assumption also impacts the following:
■ Optional Forms of Payment: CalSTRS members may elect to receive their DB Program benefit in several forms. The member’s unmodified benefit amount is reduced to reflect the actual form of payment elected based on the investment return assumption and mortality rates used. Lowering the investment return assumption used in this calculation will tend to increase the expected cost of the optional form of payment and will therefore result in a slightly greater reduction in the benefit amount (all other things being equal).
■ Service Purchase Costs: CalSTRS members may purchase service under certain circumstances. Some of these service purchases base the cost on the investment return assumption. If the actual rate of return earned in the long term is less than the investment return assumption used in the service purchase cost calculation, the system will have charged the member less than the true cost, and the employer will ultimately have to make up this shortfall. Conversely, if the actual rate of return earned in the long term is greater than the investment return assumption, the system will have charged the member more than the full cost, and the employer will have to contribute less in the future.
■ Interest Credited to SBMA: As previously noted, the DB Program investment return assumption will be used to credit interest to the SBMA.
Possible Alternative Assumptions
Based on this analysis, our recommendation is to lower the investment return assumption by 0.25%; however, it is not the only assumption that the board could adopt that we would consider reasonable. In the prior section, we have shown the financial impact of the two alternative investment return assumptions discussed below. We also believe it would be reasonable to lower the investment return an additional 0.25% (0.50% total reduction). The argument for doing this is that although we may expect a 7.25% return over the next 20 years, the general consensus is that returns in the next 10 years are expected to be lower. As much as any of these projections are certain, the board may want to give a greater weight to the near term, since the board may feel that it has a higher likelihood of being realized than the higher returns expected after 10 years. Additionally, bond yields have declined since June 2015 when the CalSTRS capital market assumptions were established.
Attachment 1 Regular Meeting - Item 3
February 1, 2017
TRB48

Experience Analysis (2010-2015) California State Teachers’ Retirement System Economic Assumptions
This work product was prepared solely for CalSTRS for the purposes described herein and may not be appropriate to use for other purposes. Milliman does not intend to benefit and assumes no duty or liability to other parties who receive this work. Milliman recommends that third parties be aided by their own actuary or other qualified professional when reviewing the Milliman work product.
27
ctrj0291.docx
Possible Alternative Assumptions (continued)
Alternatively, the board could elect to make no change in the investment return assumption. The argument for keeping the assumption is that although the expected returns over the next 20 years are projected to be slightly less than the current assumption, funding a retirement system entails an even longer time horizon. For example, CalSTRS’ time horizon to pay off the UAO is 30 years as of 2016. Further, the investment consultants that we work with that have capital market assumptions with a 30-year horizon are generally projecting higher returns than over shorter periods.
Conclusion
Based on portfolio analysis, the current 7.50% investment return assumption for the DB and DBS Programs is fractionally greater than the expected long-term median return (net of administrative expenses), based on CalSTRS’ capital market assumptions. In other words, over a 30-year period there is a 47% probability of achieving a 7.5% return, after adjusting for all expenses, based on the CalSTRS capital market assumptions (prior to any potential adjustment for the proposed reduction in the price inflation assumption). We are recommending a reduction in this assumption to 7.25% to reflect the fractionally lower expectation, as well as the lower recommended inflation assumption. For the CBB Program, we are recommending a reduction to 6.75% due to the different asset mix.
Investment Return (net of all expenses)
DB & DBS CBB Current Assumption 7.50% 7.00%
Recommended Assumption 7.25% 6.75%
Attachment 1 Regular Meeting - Item 3
February 1, 2017
TRB49

Experience Analysis (2010-2015) California State Teachers’ Retirement System Economic Assumptions
This work product was prepared solely for CalSTRS for the purposes described herein and may not be appropriate to use for other purposes. Milliman does not intend to benefit and assumes no duty or liability to other parties who receive this work. Milliman recommends that third parties be aided by their own actuary or other qualified professional when reviewing the Milliman work product.
28
ctrj0291.docx
4. Interest on Member Accounts
Use in the Valuation
This assumption is used to predict the level of future member account balances. In the DB Program, the account balance may be refunded upon termination of membership. In the CBB and DBS Programs, all benefits are dependent on the level of the account balance. The current assumption is 4.50% per year for the DB Program. For the CBB and DBS Programs, the assumed interest credit is set equal to the investment return assumption.
DB Program The board’s policy is to credit interest to member accounts in an amount to be calculated annually based on the rate paid on two-year Treasury notes for the previous 12 months. The rate can go no higher than the actuarial assumed investment return, nor lower than a current passbook rate. In light of this policy, the actuarial assumption in the valuation has been set equal to the assumed increase in the Consumer Price Index plus a margin to reflect the yield in excess of inflation on two-year Treasuries. The following table shows the average excess yield of two-year Treasuries over inflation since 1999.
As shown in the table, since 2003 the excess has been negative in many years as the average increase in the two-year Treasury rate has been less than inflation. For the four years prior to that, the average excess of the two-year Treasury rate over the CPI was 2.9%. We are recommending a partial reflection of the recent experience, so that the assumption decreases to 3.00%, which is 0.25% above the recommended inflation assumption.
Excess Yield over Inflation on 2-Year Treasuries
Year CPI2-Year
Treasury Rate Excess1999 1.6% 5.0% 3.4%2000 3.2 5.7 2.5 2001 3.5 6.0 2.5 2002 1.1 3.5 2.4 2003 3.0 2.4 (0.6) 2004 1.7 1.8 0.1 2005 3.0 2.6 (0.4) 2006 3.6 4.1 0.5 2007 2.4 5.0 2.6 2008 4.0 3.9 (0.1) 2009 0.2 1.8 1.6 2010 2.1 0.9 (1.2) 2011 2.1 0.7 (1.4) 2012 2.9 0.3 (2.6) 2013 2.0 0.3 (1.7) 2014 1.1 0.3 (0.8) 2015 0.0 0.7 0.7 2016 1.0 0.8 (0.2)
Attachment 1 Regular Meeting - Item 3
February 1, 2017
TRB50

Experience Analysis (2010-2015) California State Teachers’ Retirement System Economic Assumptions
This work product was prepared solely for CalSTRS for the purposes described herein and may not be appropriate to use for other purposes. Milliman does not intend to benefit and assumes no duty or liability to other parties who receive this work. Milliman recommends that third parties be aided by their own actuary or other qualified professional when reviewing the Milliman work product.
29
ctrj0291.docx
CBB and DBS Programs
For the CBB and DBS Programs, the board’s policy is to credit interest to member accounts based on the statutory minimum rate for the year, plus a portion of the returns in excess of the statutory minimum. The board has the authority to establish a reserve for short-term fluctuations in the actual returns from year to year so that the minimum credit can be allocated from current invested assets. Nevertheless, the long-term intention is to allocate all of the investment earnings to the member accounts. Therefore, the assumed long-term credit to member accounts should be the same as the recommended investment return assumption for the DBS Program (7.25% per year) and the CBB Program (6.75% per year).
Recommendation Our recommended assumptions are shown in the following table.
Interest on Member Accounts
DB CBB and DBS Current Assumption 4.50% 7.50% (DBS)
7.00% (CBB)
Recommended Assumption 3.00% 7.25% (DBS) 6.75% (CBB)
Attachment 1 Regular Meeting - Item 3
February 1, 2017
TRB51

Experience Analysis (2010-2015) California State Teachers’ Retirement System Economic Assumptions
This work product was prepared solely for CalSTRS for the purposes described herein and may not be appropriate to use for other purposes. Milliman does not intend to benefit and assumes no duty or liability to other parties who receive this work. Milliman recommends that third parties be aided by their own actuary or other qualified professional when reviewing the Milliman work product.
30
ctrj0291.docx
5. CBB and DBS Program Standard Deviation
Use in the Valuation
The standard deviation is not directly used in the valuation, but it is used in the determination of additional earnings credits.
CBB and DBS Programs Standard Deviation
Under board policy, the additional earnings credits for the CBB and DBS Programs are based on the funded ratio of the respective program and certain thresholds. These thresholds are based on the standard deviation of the program’s portfolio. The analysis so far has focused on the expected return for the STRP assets. However, the DB and DBS Program assets are only a portion of the total STRP assets. A growing portion of the STRP assets is attributable to the SBMA. In 2007, the SBMA represented only 2% of the total STRP assets. This percentage has grown to over 6% in 2015, and we project it will increase to around 15% over the next 30 years. By law, the SBMA is guaranteed a return equal to the valuation assumption, so the SBMA portion of the STRP assets will experience no volatility return. Consequently, the rest of the assets will have higher return volatility than the total STRP assets.
We used stochastically generated returns based on the total asset allocation to estimate the impact of the SBMA guarantee on the volatility of the remainder of the assets. In comparing the assets excluding the SBMA to the total STRP assets, we found an increase in volatility as measured by the standard deviation (13.0% to 15.0%). As previously discussed in the investment return section, the CBB Program assets are based on a separate allocation. We estimate that the standard deviation of the CBB Program allocation is 13.0%. Note that our understanding is that the CBB Program return is not affected by the return credited to the SBMA.
Recommendation Our recommended assumptions are shown in the following table.
Standard Deviation for Additional Earnings Credits
DBS CBB Current Assumption 13.9% 13.2%
Recommended Assumption 15.0% 13.0%
Attachment 1 Regular Meeting - Item 3
February 1, 2017
TRB52
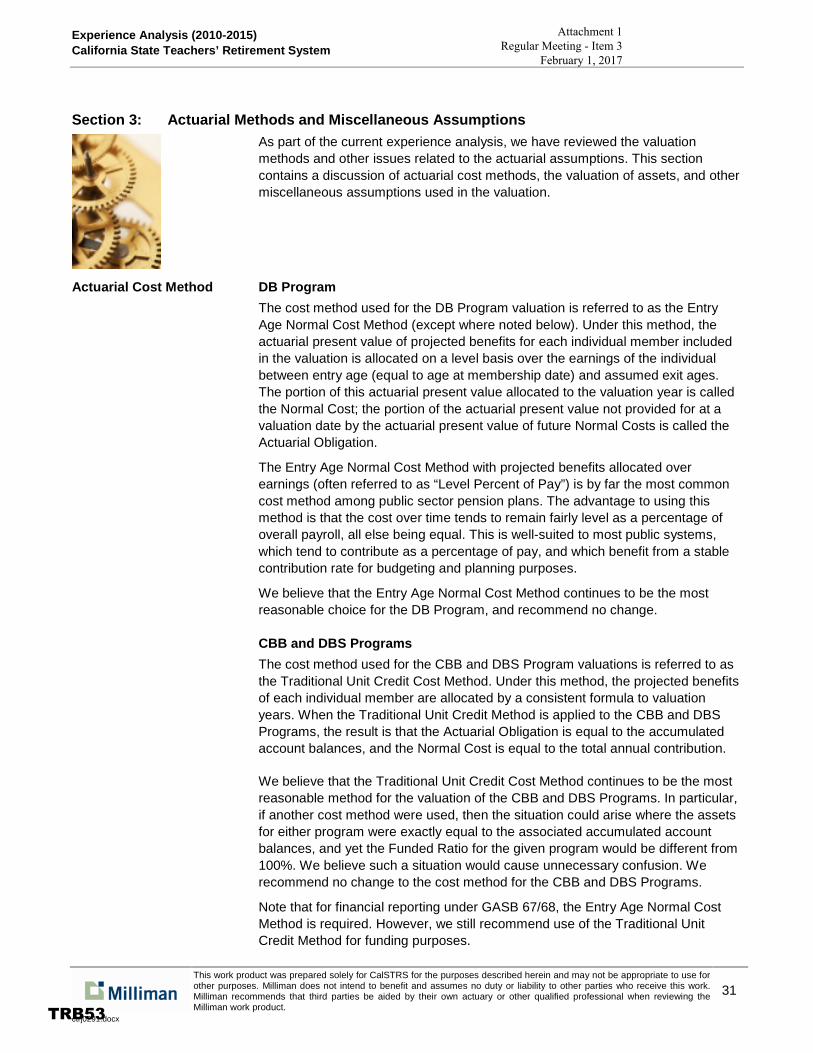
Experience Analysis (2010-2015) California State Teachers’ Retirement System
This work product was prepared solely for CalSTRS for the purposes described herein and may not be appropriate to use for other purposes. Milliman does not intend to benefit and assumes no duty or liability to other parties who receive this work. Milliman recommends that third parties be aided by their own actuary or other qualified professional when reviewing the Milliman work product.
31
ctrj0291.docx
Section 3: Actuarial Methods and Miscellaneous Assumptions
As part of the current experience analysis, we have reviewed the valuation methods and other issues related to the actuarial assumptions. This section contains a discussion of actuarial cost methods, the valuation of assets, and other miscellaneous assumptions used in the valuation.
Actuarial Cost Method DB Program The cost method used for the DB Program valuation is referred to as the Entry Age Normal Cost Method (except where noted below). Under this method, the actuarial present value of projected benefits for each individual member included in the valuation is allocated on a level basis over the earnings of the individual between entry age (equal to age at membership date) and assumed exit ages. The portion of this actuarial present value allocated to the valuation year is called the Normal Cost; the portion of the actuarial present value not provided for at a valuation date by the actuarial present value of future Normal Costs is called the Actuarial Obligation.
The Entry Age Normal Cost Method with projected benefits allocated over earnings (often referred to as “Level Percent of Pay”) is by far the most common cost method among public sector pension plans. The advantage to using this method is that the cost over time tends to remain fairly level as a percentage of overall payroll, all else being equal. This is well-suited to most public systems, which tend to contribute as a percentage of pay, and which benefit from a stable contribution rate for budgeting and planning purposes.
We believe that the Entry Age Normal Cost Method continues to be the most reasonable choice for the DB Program, and recommend no change. CBB and DBS Programs The cost method used for the CBB and DBS Program valuations is referred to as the Traditional Unit Credit Cost Method. Under this method, the projected benefits of each individual member are allocated by a consistent formula to valuation years. When the Traditional Unit Credit Method is applied to the CBB and DBS Programs, the result is that the Actuarial Obligation is equal to the accumulated account balances, and the Normal Cost is equal to the total annual contribution.
We believe that the Traditional Unit Credit Cost Method continues to be the most reasonable method for the valuation of the CBB and DBS Programs. In particular, if another cost method were used, then the situation could arise where the assets for either program were exactly equal to the associated accumulated account balances, and yet the Funded Ratio for the given program would be different from 100%. We believe such a situation would cause unnecessary confusion. We recommend no change to the cost method for the CBB and DBS Programs.
Note that for financial reporting under GASB 67/68, the Entry Age Normal Cost Method is required. However, we still recommend use of the Traditional Unit Credit Method for funding purposes.
Attachment 1 Regular Meeting - Item 3
February 1, 2017
TRB53

Experience Analysis (2010-2015) California State Teachers’ Retirement System Actuarial Methods and Miscellaneous Assumptions
This work product was prepared solely for CalSTRS for the purposes described herein and may not be appropriate to use for other purposes. Milliman does not intend to benefit and assumes no duty or liability to other parties who receive this work. Milliman recommends that third parties be aided by their own actuary or other qualified professional when reviewing the Milliman work product.
32
ctrj0291.docx
Actuarial Cost Method (continued)
MPP Program There are no active members eligible for the MPP Program, so no Normal Cost is calculated. The actuarial obligation for the MPP Program is equal to the value of all benefits expected to be paid in the future. This obligation, less any assets currently residing in the Teachers’ Health Benefit Fund (THBF), is included with the obligation of the DB Program. SBMA Program No Normal Cost or actuarial obligation is calculated for funding, because only an actuarial projection is done, not a valuation. Therefore, no cost method is needed for funding purposes. For financial reporting under GASB 67/68, the Entry Age Normal Cost Method is required.
Valuation of Assets (DB Program)
The valuation of assets for an actuarial valuation of a defined benefit pension plan may be thought of in a different light than the value of assets for a retirement system’s financial statement. The purpose in a financial statement disclosure is to make a representation of the current value of the assets on a fair value basis. Because the underlying calculations in the actuarial valuation are long term in nature, and one of the goals of the actuarial valuation process is to measure the funding stability of the DB Program, it can be advantageous to smooth out short-term fluctuations in the fair value of assets. Like the majority of large public retirement systems, the DB Program uses an asset smoothing method to determine the Actuarial Value of Assets. Under this method, the assets are valued using a delay of the recognition of investment gains or losses. The expected actuarial value is the prior year’s actuarial value increased with net cash flow of funds, and all increased with interest during the past year at the expected investment return assumption. One-third of the difference between the expected actuarial value of assets and the Fair Market Value of assets is added to the expected actuarial value of assets to arrive at the Actuarial Value of Assets.
The following chart shows a history of the Actuarial Value of Assets compared to the Fair Market Value of Assets.
$- $20 $40 $60 $80
$100 $120 $140 $160 $180 $200
2001 2003 2005 2007 2009 2011 2013 2015
($bi
llion
s)
Fair Market Value Actuarial Value
Attachment 1 Regular Meeting - Item 3
February 1, 2017
TRB54

Experience Analysis (2010-2015) California State Teachers’ Retirement System Actuarial Methods and Miscellaneous Assumptions
This work product was prepared solely for CalSTRS for the purposes described herein and may not be appropriate to use for other purposes. Milliman does not intend to benefit and assumes no duty or liability to other parties who receive this work. Milliman recommends that third parties be aided by their own actuary or other qualified professional when reviewing the Milliman work product.
33
ctrj0291.docx
Valuation of Assets (DB Program) (continued)
Asset smoothing is a valuable tool for addressing contribution volatility. As CalSTRS moves to a variable rate funding arrangement, it is a good time to consider whether the current asset smoothing method continues to be appropriate. CalSTRS current method that smooths gains and losses over roughly three years provides a reasonable compromise between minimizing volatility and not straying too far from the market value. The only concern is that a shorter period (three years is shorter than the period most public plans use) could lead to significant year-to-year contribution rate volatility. However, there are caps on how much the state and employer contribution rates can increase, so this should mitigate that volatility. We recommend retaining the current method.
Valuation of Assets (CBB and DBS Programs)
The assets are valued at Fair Market Value and the Gain and Loss Reserve acts as a smoothing technique. We recommend this method be continued.
Miscellaneous Assumptions
Valuation of Current Inactive Members: The data we receive for inactive members does not include salary information. To estimate the value of retirement benefits for current inactive members, we have projected the member’s contribution account with assumed interest to the assumed retirement age (discussed in the next paragraph). We then have estimated the value based on a ratio of the member’s projected account at retirement. We are recommending moving to a more direct valuation of inactive members this year. We propose doing this by retrieving the inactive member’s final compensation information from the active data in the year they were most recently active. For those we cannot locate on the active data, we propose estimating their compensation based on the average active compensation in the year the member terminated. Based on the compensation information and the age and service data, we can then estimate the benefit amount and value it accordingly. More details on this calculation are provided in Appendix A-1.
Inactive Member Retirement Age: We have studied the age at which inactive members commence retirement benefits. Based on the experience analysis, the average age at which such members retired over the period is 60.6. Our current assumption is age 60. We are recommending retaining the age 60 assumption for 2% at 60 members. Given the lower percentage factors for the 2% at 62 members, we are recommending a later assumed retirement age for inactive members of age 62.
Number of Children: We studied the number of children for surviving spouses and disability retirements. Based on this analysis, we are recommending no change in the number of children assumed for male and female members. The following table shows the results of our study of married members. Note that the number of children only reflects those expected to be eligible for survivor or disability benefits (generally age 21 or less).
Member's Gender
Actual # of Children
Current Assumption
Proposed Assumption
Male 0.70 0.65 0.65
Female 0.46 0.50 0.50
Attachment 1 Regular Meeting - Item 3
February 1, 2017
TRB55

Experience Analysis (2010-2015) California State Teachers’ Retirement System Actuarial Methods and Miscellaneous Assumptions
This work product was prepared solely for CalSTRS for the purposes described herein and may not be appropriate to use for other purposes. Milliman does not intend to benefit and assumes no duty or liability to other parties who receive this work. Milliman recommends that third parties be aided by their own actuary or other qualified professional when reviewing the Milliman work product.
34
ctrj0291.docx
Miscellaneous Assumptions (continued)
Assumed Offsets: A portion of disability and survivor benefits may be reduced (offset) if the member or beneficiary is receiving other public benefits related to the member’s death or disability. We studied the benefit offset amounts for surviving spouses and disability retirements. Based on the current experience analysis, the actual offsets were significantly less than assumed. This is similar to findings from the prior study. Our analysis showed only 14 total members were having offsets applied to their benefits and the average offset was only 0.3% of final average compensation. Our recommendation is to assume no offsets for future death and disability benefits, but continue to value the offsets as they actually occur, thereby producing minimal actuarial gains at that time.
Probability of Eligible Survivor: Surviving beneficiaries may be eligible for a survivor benefit if a member dies during active employment. The valuation assumes a certain percentage of members will have an eligible survivor. The current assumption is that 90% of males and 70% of females will have an eligible survivor. We were unable to perform a statistically valid study of this assumption as we cannot identify deaths where the benefit is a refund of contributions, but we can look at other retirement systems. Based on recent studies of other California retirement systems we have performed, we recommend a reduction to 85% of males and 65% of females.
Sick Leave Load: We have studied the unused sick leave for those members who retired during the study period. We found that this service was generally proportional to credited service. On average, new retirees had 0.41 years of unused sick leave service and 24.1 years of credited service (including unused sick leave service). This implies that sick leave service is approximately 1.73% of non-sick leave credited service. The current assumption is a 2.0% load on credited service to account for future sick leave service; we recommend adjusting this to 1.8%. The following graph shows the results of our study.
Option Factors: In general, option factors are based on the valuation assumptions. If changes in the mortality rates or investment return assumptions are adopted, the options factors should be updated to reflect these changes. Additionally, CalSTRS makes assumptions specific to the option factor, as discussed, below.
0.0%
0.5%
1.0%
1.5%
2.0%
2.5%
3.0%
5 10 15 20 25 30 35 40
Total Service at Retirement
Ratio of Eligible Sick Leave Service to Service Credit at Retirement
Attachment 1 Regular Meeting - Item 3
February 1, 2017
TRB56

Experience Analysis (2010-2015) California State Teachers’ Retirement System Actuarial Methods and Miscellaneous Assumptions
This work product was prepared solely for CalSTRS for the purposes described herein and may not be appropriate to use for other purposes. Milliman does not intend to benefit and assumes no duty or liability to other parties who receive this work. Milliman recommends that third parties be aided by their own actuary or other qualified professional when reviewing the Milliman work product.
35
ctrj0291.docx
Miscellaneous Assumptions (continued)
Members who retire and elect a 100% continuance benefit tend to have higher mortality in the first few years than the general population. We recommend the following adjustments be made to the mortality used in the calculation of the two options with a 100% continuance (Options 2 and 6):
Additionally, members who elect continuance benefits tend to have a higher proportion of male members than the general population. We recommend no change in the assumptions used in the calculation of the blended mortality rate for the optional factors:
For all other administrative factors, we recommend blended mortality rates assuming 30% male and 70% female, consistent with the current assumption. Based on a study of service retirements during the last five years, we found the benefit amount payable to male retirees was 30.8% of the total benefit amounts.
If generational mortality is adopted, mortality rates by age will change every year. In theory, this would cause the mortality rates used in the option factors to need to be updated every year. We recommend CalSTRS consider some simplification. One possibility would be to change the mortality tables used for the option factors only following each experience study, instead of every year. If this option were selected, the mortality tables should be projected to the midpoint of the period the options factors would apply. For example, if the option factors were to apply to 2017-2021, the mortality tables would be projected to 2019 using the projection scale discussed in Section 5.
Retirement Multiply Standard Mortality Rate byYear Actual Expected Proposed
Male Mortality1st 131% 240% 175%2nd 138% 140% 140%3rd 83% 120% 120%4th 64% 105% 105%
Female Mortality1st 313% 400% 350%2nd 149% 240% 180%3rd 150% 150% 150%4th 119% 110% 115%
Male PercentageOption Actual Expected Proposed
2 78.2% 80% No Change3 47.4% 55% No Change4 84.6% 75% No Change5 50.0% 70% No Change6 47.7% 50% No Change7 26.9% 30% No Change9 40.2% 45% No Change
Attachment 1 Regular Meeting - Item 3
February 1, 2017
TRB57

Experience Analysis (2010-2015) California State Teachers’ Retirement System Actuarial Methods and Miscellaneous Assumptions
This work product was prepared solely for CalSTRS for the purposes described herein and may not be appropriate to use for other purposes. Milliman does not intend to benefit and assumes no duty or liability to other parties who receive this work. Milliman recommends that third parties be aided by their own actuary or other qualified professional when reviewing the Milliman work product.
36
ctrj0291.docx
Miscellaneous Assumptions (continued)
Estimated Impact of 1-Year Final Compensation: To isolate the value of the 1990 benefits for current retirees, CalSTRS provides the value of the increased benefit for various components of the new benefits (career average bonus, longevity bonus, ad hoc COLA, sick leave, etc.) on the retiree valuation data, where "new benefits” are those attributable to benefit changes after 1990. The increase in benefit amount for those member who are eligible to have their final average calculation based on one year (instead of three years) is not provided on the data. The current assumption is that the increase for these members is equal to 5% of the estimated 1990 benefit. We are recommending a change to this approach to estimate the impact of using one-year compensation on a year-by-year basis. We determined the impact for each year by comparing the actual final compensation for each retiree eligible for the one-year final compensation with their estimated three-year final compensation. The results are as follows:
1. Compensation amounts are earnable amounts and are monthly figures.
We are recommending the actual increase, as shown in the table above, be applied to the individual’s 1990 benefit to determine the new benefit attributable to the one-year final compensation. Note that this is only applied to the benefits of retirees who were eligible for the one-year final compensation. For retirement years prior to 2002, 5.0% is used. For retirement years after 2016, 4.3% is used. 4.3% represents the assumed 3.5% general wage growth assumption plus 0.8% for merit. We recommend this table be updated with each following experience analysis study.
Retirement Actual 1-Year Est. 3-YearYear Final Comp Final Comp Increase2002 6,115 5,727 6.8%2003 6,202 5,964 4.0%2004 6,451 6,174 4.5%2005 6,495 6,293 3.2%2006 6,685 6,458 3.5%2007 7,067 6,702 5.5%2008 7,148 6,809 5.0%2009 7,140 6,966 2.5%2010 7,235 7,146 1.2%2011 7,230 7,141 1.2%2012 7,389 7,249 1.9%2013 7,335 7,162 2.4%2014 7,363 7,127 3.3%2015 7,637 7,323 4.3%2016 7,923 7,547 5.0%
Attachment 1 Regular Meeting - Item 3
February 1, 2017
TRB58

Experience Analysis (2010-2015) California State Teachers’ Retirement System
This work product was prepared solely for CalSTRS for the purposes described herein and may not be appropriate to use for other purposes. Milliman does not intend to benefit and assumes no duty or liability to other parties who receive this work. Milliman recommends that third parties be aided by their own actuary or other qualified professional when reviewing the Milliman work product.
37
ctrj0291.docx
Section 4: Salary Increases Due to Promotion and Longevity (Merit)
Results
Estimates of future salaries are based on assumptions for two types of increases:
1) Increases in each individual's salary due to promotion or longevity, which occur even in the absence of inflation (merit increases); and
2) Increases in the general wage level of the membership, which are directly related to inflation and increases in productivity.
In Section 2, we recommend that the second of these rates, the general wage inflation, be lowered to 3.50%. See that section of the report for discussion. This section addresses the first of these rates, the merit salary increase. The merit increases shown in this section are calculated as the total increase for each individual, less the observed general wage inflation during the five-year study period of 1.11%.
Exhibit 4-1 shows the actual merit increases in salary over the period July 1, 2010 – June 30, 2015. Increases were higher earlier in a member’s career (lower service) and then decreased over time, consistent with the current assumptions. Overall, the actual increases were close to those predicted by the current assumptions, although there were some small differences in the pattern in the first 15 years.
The current salary assumptions are separated by entry age. Exhibit 4-2 shows the average increases by entry age group. This exhibit illustrates the varying pattern of merit increases based on the age at which a member enters the system. Specifically, at any given service level, members with younger entry ages tend to receive larger merit increases.
Recommendation Based on the results of the prior two experience studies, we are recommending small changes in the pattern of the merit increase assumption, primarily in the first 15 years of employment.
Attachment 1 Regular Meeting - Item 3
February 1, 2017
TRB59

Experience Analysis (2010-2015) California State Teachers’ Retirement System Salary Increases Due to Promotion and Longevity (Merit)
This work product was prepared solely for CalSTRS for the purposes described herein and may not be appropriate to use for other purposes. Milliman does not intend to benefit and assumes no duty or liability to other parties who receive this work. Milliman recommends that third parties be aided by their own actuary or other qualified professional when reviewing the Milliman work product.
38
ctrj0291.docx
Exhibit 4-1 Total Rates of Increase in Salary Due to Merit and Longevity All Members (Excluding Actual General Wage Growth)
0.0%
1.0%
2.0%
3.0%
4.0%
5.0%
6.0%
1 4 7 10 13 16 19 22 25 28 31 34 37 40
Mer
it In
crea
se
Years of Service
Actual Prior Study Expected Proposed
Attachment 1 Regular Meeting - Item 3
February 1, 2017
TRB60

Experience Analysis (2010-2015) California State Teachers’ Retirement System Salary Increases Due to Promotion and Longevity (Merit)
This work product was prepared solely for CalSTRS for the purposes described herein and may not be appropriate to use for other purposes. Milliman does not intend to benefit and assumes no duty or liability to other parties who receive this work. Milliman recommends that third parties be aided by their own actuary or other qualified professional when reviewing the Milliman work product.
39
ctrj0291.docx
Exhibit 4-2 Annual Rates of Increase in Salary by Entry Age Due to Merit and Longevity (Excluding Actual General Wage Growth)
0%
1%
2%
3%
4%
5%
6%
1-5 6-10 11-15 16-20 21+Years of Service
EA 20-24 EA 25-29 EA 30-34 EA 35-39 EA 40-44 EA 45+
Attachment 1 Regular Meeting - Item 3
February 1, 2017
TRB61

This work product was prepared solely for CalSTRS for the purposes described herein and may not be appropriate to use for other purposes. Milliman does not intend to benefit and assumes no duty or liability to other parties who receive this work. Milliman recommends that third parties be aided by their own actuary or other qualified professional when reviewing the Milliman work product.
40
ctrj0291.docx
This page intentionally left blank.
Attachment 1 Regular Meeting - Item 3
February 1, 2017
TRB62

Experience Analysis (2010-2015) California State Teachers’ Retirement System
This work product was prepared solely for CalSTRS for the purposes described herein and may not be appropriate to use for other purposes. Milliman does not intend to benefit and assumes no duty or liability to other parties who receive this work. Milliman recommends that third parties be aided by their own actuary or other qualified professional when reviewing the Milliman work product.
41
ctrj0291.docx
Section 5: Retired Mortality
In this section we look at the results of the study of actual and expected death rates of retired members. We studied rates of mortality among healthy and disabled retired members, as well as beneficiaries. Valuation mortality is a critical assumption, since, if members live longer than expected, we will be understating the true cost of the future plan obligations. Mortality has been improving in this country and is expected to continue to improve. Recent studies by the Society of Actuaries have shown marked increases in life expectancies since their previous study in 2000. We recommend using generational mortality tables (see later discussion) to account for projected future improvements in mortality. Generational mortality is reflected by including a mortality improvement scale that projects small annual decreases in mortality rates. The Actuarial Standards of Practice require expected future mortality improvements to be considered in selecting the assumption. Using generational mortality tables achieves this. If generational mortality tables are not used, a margin in the mortality assumption should be used to account for future improvements in mortality.
Results Overall, we found the number of deaths over the study period for healthy retirees was very close to the number predicted by the current rates: 28,636 actual deaths, compared to 28,322 expected deaths for a total actual/expected ratio of 101%. For disabled retiree mortality, the overall actual/expected ratio was 93%, indicating disabled retirees are living longer than the current assumptions are predicting. (See graphs at the end of this section for details). In general, we propose mortality rates such that the ratio of actual-to-proposed deaths will be close to, but slightly above, 100%, if a projected mortality improvement scale is used. In our experience studying the mortality of public pension plan retirees, we have consistently found that retirees with larger benefits tend to live the longer than retirees with smaller benefits. We have studied the mortality for CalSTRS with an adjustment for actual benefit amounts and found this to be true, although the impact is less than we have observed in most other systems, probably because members of CalSTRS are relatively homogenous. Our proposed mortality assumptions take this into account by including a small margin (actual-to-proposed ratio slightly greater than 100%).
Attachment 1 Regular Meeting - Item 3
February 1, 2017
TRB63

Experience Analysis (2010-2015) California State Teachers’ Retirement System Retired Mortality
This work product was prepared solely for CalSTRS for the purposes described herein and may not be appropriate to use for other purposes. Milliman does not intend to benefit and assumes no duty or liability to other parties who receive this work. Milliman recommends that third parties be aided by their own actuary or other qualified professional when reviewing the Milliman work product.
42
ctrj0291.docx
Results (continued)
The following shows a summary of the results of the study. Detailed results are shown graphically on the following pages.
Generational Mortality Tables
There is a trend in the actuarial profession to use generational mortality tables, which explicitly reflect expected future improvements in mortality. Generational mortality tables include a base table and a projection table. The projection table reflects the expected annual reduction in mortality rates at each age. Therefore, each year in the future, the mortality at a specific age is expected to decline slightly (and people born in succeeding years are expected to live slightly longer). For example, if the mortality rate at age 75 is 2.00% for a member currently aged 75 and the projected improvement is 1.00%, the mortality rate at age 75 for a member currently aged 74 will be 1.98% [2.00% x (100.00% - 1.00%)]. Therefore, the life expectancy for a 75-year old in the current year will be less than a 75-year old in the next year. This can result in significant differences in life expectancies when projecting improvements 30-plus years into the future. One of the main benefits of generational mortality tables is the valuation assumptions should effectively update each year to reflect improved mortality, and the base tables should rarely need to be changed. One reason we had not recommended generational mortality previously is that issues with the calculation of option factors would have been administratively unfeasible. Our understanding from CalSTRS staff is that the calculation of option factors and service purchases, which by law use the valuation assumptions, can be made compatible with the use of generational mortality tables.
Projection Scale for Mortality Improvement
There is a strong consensus in the actuarial community that future improvements in mortality should be reflected in the valuation assumptions. There is less consensus, however, about how much mortality improvement should be reflected. The most recent projection scale published by the Society of Actuaries (SOA) incorporates a complex matrix of rates of improvement that vary by both age and birth year. Ultimately, the projection scale (Scale MP-2016) goes to a flat 1% annual improvement in years 2032 and later for ages 85 or less.
Actual to Expected Actual to ProposedStatus Actual Expected A/E Ratio Actual Proposed A/P Ratio
Healthy Male 12,017 11,511 104% 12,017 11,362 106% Healthy Female 16,619 16,811 99% 16,619 15,549 107% Healthy Total 28,636 28,322 101% 28,636 26,911 106%
Disabled Male 496 527 94% 496 468 106% Disabled Female 943 1,023 92% 943 915 103% Disabled Total 1,439 1,550 93% 1,439 1,383 104%
Beneficiary Male 1,085 1,175 92% 1,085 1,150 94% Beneficiary Female 3,345 3,424 98% 3,345 3,196 105% Beneficiary Total 4,430 4,599 96% 4,430 4,346 102%
Grand Total 34,505 34,471 100% 34,505 32,640 106%
Attachment 1 Regular Meeting - Item 3
February 1, 2017
TRB64

Experience Analysis (2010-2015) California State Teachers’ Retirement System Retired Mortality
This work product was prepared solely for CalSTRS for the purposes described herein and may not be appropriate to use for other purposes. Milliman does not intend to benefit and assumes no duty or liability to other parties who receive this work. Milliman recommends that third parties be aided by their own actuary or other qualified professional when reviewing the Milliman work product.
43
ctrj0291.docx
Projection Scale for Mortality Improvement (continued)
Our recommendation is to use 110% of the ultimate portion of the MP-2016 scale. In other words, our recommendation is to assume 1.1% annual improvements in mortality (for ages less than 85). We believe this reasonably reflects the long-term expectation of mortality improvement. We have compared our recommended projection scale with actual mortality improvement from the most recent 60 years of experience of the US Social Security system and found them to be reasonably consistent. As noted, the recommended projection scale is a flat 1.1% improvement through age 85. For subsequent ages, the projected improvement is fractionally less, grading down to 0.0% at age 115. For example, the projected improvement is 0.64% per year at age 100.
Recommendation We recommend strengthening the mortality assumption (i.e., increasing life expectancies), by slightly reducing mortality rates and adding a projection scale to reflect expected future improvements in mortality. Note that this brings the total healthy retiree actual/proposed ratio to 106% based on the base rates. We believe this combined with the projection scale allows for a reasonable expectation of future life expectancy increases. CalSTRS uses custom mortality tables to best fit the patterns of mortality among its members. These custom tables are based on standard mortality tables adjusted to fit CalSTRS experience. The table on the next page describes the new tables being recommended for healthy and disabled retirees. Note these are based a recent study of retiree pensioners published by the Society of Actuaries in 2014 (hence, the table name RP-2014). The White Collar version of these tables were used as we believe it best reflects the teacher population. Note that for beneficiaries of healthy and disabled retirees, we recommend that the mortality for healthy retirees be used, as observed experience showed a significant amount of consistency between retirees and beneficiaries.
Attachment 1 Regular Meeting - Item 3
February 1, 2017
TRB65

Experience Analysis (2010-2015) California State Teachers’ Retirement System Retired Mortality
This work product was prepared solely for CalSTRS for the purposes described herein and may not be appropriate to use for other purposes. Milliman does not intend to benefit and assumes no duty or liability to other parties who receive this work. Milliman recommends that third parties be aided by their own actuary or other qualified professional when reviewing the Milliman work product.
44
ctrj0291.docx
Recommendation (continued)
Rates of mortality among active members prior to retirement are discussed separately in Section 6 of this report.
Healthy (Service) Retirees and Beneficiaries -- Males
Current: RP-2000 Healthy Male White Collar -2 to age 70 smoothed to -1 at age 90
Proposed: RP-2014 Healthy Male White Collar -1 to age 70 smoothed to +1 at age 95
Healthy (Service) Retirees and Beneficiaries -- Females
Current: RP-2000 Healthy Female White Collar -4 to age 75 smoothed to -0 at age 90
Proposed: RP-2014 Healthy Female White Collar -4 to age 70 smoothed to +1 at age 95
Disabled Retirees -- Males
Current: Age < 70: 2% at age 40 & under, graded to 3.2% at age 70Age > 70: RP-2000 Male White Collar +7 at age 70 smoothed to +1 age 85(select rates in first three years, regardless of age)
Proposed: All Ages: RP-2014 Disabled Male -2(select rates in first three years, regardless of age)
Disabled Retirees -- Females
Current: Age < 70: 1.5% at age 40 & Less graded to 2.25% at age 70Age > 70: RP-2000 Female White Collar +6 at age 70 smoothed to +2 at age 80(select rates in first three years, regardless of age)
Proposed: All Ages: RP-2014 Disabled Female -2(select rates in first three years, regardless of age)
Notes: 1. All proposed tables use 110% of the MP-2016 Ultimate Projection Scale.2. All proposed tables to be used in the 6/30/2016 actuarial valuations include two years of
mortality improvement from the 2014 tables shown above.
Attachment 1 Regular Meeting - Item 3
February 1, 2017
TRB66

Experience Analysis (2010-2015) California State Teachers’ Retirement System Retired Mortality
This work product was prepared solely for CalSTRS for the purposes described herein and may not be appropriate to use for other purposes. Milliman does not intend to benefit and assumes no duty or liability to other parties who receive this work. Milliman recommends that third parties be aided by their own actuary or other qualified professional when reviewing the Milliman work product.
45
ctrj0291.docx
Exhibit 5-1 Mortality for Service (Healthy) Retirees – Males
All Ages
0%
2%
4%
6%
8%
10%
12%
14%
16%
18%
20%
57 62 67 72 77 82 87 92
Annu
al P
roba
bilit
y of
Dea
th
Age
Actual Prior Actual Expected Proposed
Expected Actual Proposed
Total Count 11,511 12,017 11,362 Actual / Expected 104% 106%
Attachment 1 Regular Meeting - Item 3
February 1, 2017
TRB67

Experience Analysis (2010-2015) California State Teachers’ Retirement System Retired Mortality
This work product was prepared solely for CalSTRS for the purposes described herein and may not be appropriate to use for other purposes. Milliman does not intend to benefit and assumes no duty or liability to other parties who receive this work. Milliman recommends that third parties be aided by their own actuary or other qualified professional when reviewing the Milliman work product.
46
ctrj0291.docx
Exhibit 5-2 Mortality for Service (Healthy) Retirees – Females
All Ages
0%
2%
4%
6%
8%
10%
12%
14%
16%
18%
20%
57 62 67 72 77 82 87 92
Annu
al P
roba
bilit
y of
Dea
th
Age
Actual Prior Actual Expected Proposed
Expected Actual Proposed
Total Count 16,811 16,619 15,549 Actual / Expected 99% 107%
Attachment 1 Regular Meeting - Item 3
February 1, 2017
TRB68

Experience Analysis (2010-2015) California State Teachers’ Retirement System Retired Mortality
This work product was prepared solely for CalSTRS for the purposes described herein and may not be appropriate to use for other purposes. Milliman does not intend to benefit and assumes no duty or liability to other parties who receive this work. Milliman recommends that third parties be aided by their own actuary or other qualified professional when reviewing the Milliman work product.
47
ctrj0291.docx
Exhibit 5-3 Mortality for Disabled Retirees – Males
All Ages
First Three Years of Retirement
0%
2%
4%
6%
8%
10%
12%
14%
16%
18%
20%
Year 0 Year 1 Year 2 <= 50 52 57 62 67 72 77 82
Annu
al P
roba
bilit
y of
Dea
th
Age / Duration
Actual Prior Actual Expected Proposed
Expected Actual Proposed
Total Count 527 496 468Actual / Expected 94% 106%
Expected Actual ProposedTotal Count 129 79 94
Actual / Expected 61% 84%
Attachment 1 Regular Meeting - Item 3
February 1, 2017
TRB69

Experience Analysis (2010-2015) California State Teachers’ Retirement System Retired Mortality
This work product was prepared solely for CalSTRS for the purposes described herein and may not be appropriate to use for other purposes. Milliman does not intend to benefit and assumes no duty or liability to other parties who receive this work. Milliman recommends that third parties be aided by their own actuary or other qualified professional when reviewing the Milliman work product.
48
ctrj0291.docx
Exhibit 5-4 Mortality for Disabled Retirees – Females
All Ages
First Three Years of Retirement
0%
2%
4%
6%
8%
10%
12%
14%
16%
18%
20%
Year 0 Year 1 Year 2 <= 50 52 57 62 67 72 77 82
Annu
al P
roba
bilit
y of
Dea
th
Age / Duration
Actual Prior Actual Expected Proposed
Expected Actual Proposed
Total Count 1,023 943 915Actual / Expected 92% 103%
Expected Actual ProposedTotal Count 223 188 186
Actual / Expected 84% 101%
Attachment 1 Regular Meeting - Item 3
February 1, 2017
TRB70

Experience Analysis (2010-2015) California State Teachers’ Retirement System Retired Mortality
This work product was prepared solely for CalSTRS for the purposes described herein and may not be appropriate to use for other purposes. Milliman does not intend to benefit and assumes no duty or liability to other parties who receive this work. Milliman recommends that third parties be aided by their own actuary or other qualified professional when reviewing the Milliman work product.
49
ctrj0291.docx
Exhibit 5-5 Mortality for Beneficiaries – Males
All Ages
0%
2%
4%
6%
8%
10%
12%
14%
16%
18%
20%
57 62 67 72 77 82 87 92
Annu
al P
roab
ility
of D
eath
Age
Actual Prior Actual Expected Proposed
Expected Actual Proposed
Total Count 1,175 1,085 1,150 Actual / Expected 92% 94%
Attachment 1 Regular Meeting - Item 3
February 1, 2017
TRB71

Experience Analysis (2010-2015) California State Teachers’ Retirement System Retired Mortality
This work product was prepared solely for CalSTRS for the purposes described herein and may not be appropriate to use for other purposes. Milliman does not intend to benefit and assumes no duty or liability to other parties who receive this work. Milliman recommends that third parties be aided by their own actuary or other qualified professional when reviewing the Milliman work product.
50
ctrj0291.docx
Exhibit 5-6 Mortality for Beneficiaries – Females
All Ages
0%
2%
4%
6%
8%
10%
12%
14%
16%
18%
20%
57 62 67 72 77 82 87 92
Annu
al P
roba
bilit
y of
Dea
th
Age
Actual Prior Actual Expected Proposed
Expected Actual Proposed
Total Count 3,424 3,345 3,196 Actual / Expected 98% 105%
Attachment 1 Regular Meeting - Item 3
February 1, 2017
TRB72

Experience Analysis (2010-2015) California State Teachers’ Retirement System
This work product was prepared solely for CalSTRS for the purposes described herein and may not be appropriate to use for other purposes. Milliman does not intend to benefit and assumes no duty or liability to other parties who receive this work. Milliman recommends that third parties be aided by their own actuary or other qualified professional when reviewing the Milliman work product.
51
ctrj0291.docx
Section 6: Probability of Death from Active Status
In this section we look at the results of the study of actual and expected death rates for members in active status. The current approach has been to use the same mortality rates for active members as for healthy retired members, but with an additional setback of two years to explicitly provide for assumed mortality improvements in the future. Consistent with the retired mortality assumption, we are recommending using a projection scale for active mortality to recognize expected improvements in future mortality.
Results The number of active deaths was slightly less than expected, with an actual-to-expected ratio of 96%. The proposed rates project similar mortality in the short term, but include the projection scale to reflect future improvements.
Recommendation We recommend new tables be adopted based on standard tables for white collar
employees. These tables are adjusted for consistency with CalSTRS experience. The recommended tables are as follows:
Actual to Expected Actual to ProposedStatus Actual Expected A/E Ratio Actual Proposed A/P Ratio
Active Male 807 795 101% 807 796 101% Active Female 1,105 1,194 93% 1,105 1,167 95% Active Total 1,912 1,989 96% 1,912 1,963 97%
Active Members -- Males
Current: RP-2000 Healthy Male White Collar -4 Projected to 2025 to age 70 smoothed to -3 at age 90
Proposed: RP-2014 Healthy Male White Collar Employee -2
Active Members -- Females
Current: RP-2000 Healthy Female White Collar -6 Projected to 2025 to age 75 smoothed to -2 at age 90
Proposed: RP-2014 Healthy Female White Collar Employee -2
Notes: 1. All proposed tables use 110% of the MP-2016 Ultimate Projection Scale.2. All proposed tables to be used in the 6/30/2016 actuarial valuations include two years of
mortality improvement from the 2014 tables shown above.
Attachment 1 Regular Meeting - Item 3
February 1, 2017
TRB73

This work product was prepared solely for CalSTRS for the purposes described herein and may not be appropriate to use for other purposes. Milliman does not intend to benefit and assumes no duty or liability to other parties who receive this work. Milliman recommends that third parties be aided by their own actuary or other qualified professional when reviewing the Milliman work product.
52
ctrj0291.docx
This page intentionally left blank.
Attachment 1 Regular Meeting - Item 3
February 1, 2017
TRB74

Experience Analysis (2010-2015) California State Teachers’ Retirement System
This work product was prepared solely for CalSTRS for the purposes described herein and may not be appropriate to use for other purposes. Milliman does not intend to benefit and assumes no duty or liability to other parties who receive this work. Milliman recommends that third parties be aided by their own actuary or other qualified professional when reviewing the Milliman work product.
53
ctrj0291.docx
Section 7: Service Retirement from Active Status
Exhibits 7-1 through 7-6 show the actual and expected rates of service retirement from active status. Our analysis of rates of service retirement was by attained age and gender, and only includes active members who are eligible for service retirement. Due to the different benefit provisions, we reviewed rates of retirement separately, depending on an individual member’s years of service. Therefore, there are essentially three service retirement assumption categories for 2% at 60 members:
1. Less than 25 years of service: This is the basic group.
2. Between 25 and 30 years of service: This group is eligible for one-year final compensation.
3. 30 or more years of service: This group is eligible for the career factor (additional 0.2% in percentage formula). Some members of this group will be eligible for the longevity bonus; however, this will be a declining group.
Exhibits 7-1 through 7-6 study retirements for the following groups:
■ Exhibit 7-1: Members with < 25 Years of Service – Males ■ Exhibit 7-2: Members with < 25 Years of Service – Females ■ Exhibit 7-3: Members with 25 to 30 Years of Service – Males ■ Exhibit 7-4: Members with 25 to 30 Years of Service – Females ■ Exhibit 7-5: Members with >=30 Years of Service – Males ■ Exhibit 7-6: Members with >=30 Years of Service – Females
Results For members with less than 25 years of service, the total actual retirements from
active service was very close to what the assumptions predicted. For members with 25 to 30 years of service, it was higher. For those with 30 or more years, it was slightly lower.
The table below illustrates the actual and expected number of decrements for males and females combined, split by service level.
Number of Service Retirements (2% at 60) -- Expected
Actual ExpectedActual /
Expected
Less than 25 Years of Service 26,363 27,014 98% 25 to 30 Years of Service 9,319 7,631 122% 30 Years or More of Service 19,435 21,422 91%
Total 55,117 56,067 98%
Attachment 1 Regular Meeting - Item 3
February 1, 2017
TRB75

Experience Analysis (2010-2015) California State Teachers’ Retirement System Service Retirement from Active Status
This work product was prepared solely for CalSTRS for the purposes described herein and may not be appropriate to use for other purposes. Milliman does not intend to benefit and assumes no duty or liability to other parties who receive this work. Milliman recommends that third parties be aided by their own actuary or other qualified professional when reviewing the Milliman work product.
54
ctrj0291.docx
2% at 62 Members
There is currently insufficient data to study service retirement rates for 2% at 62 members. We expect these members will have different retirement patterns than the 2% at 60 members due to lower benefit percentages and less generous provisions (e.g., no career bonus, longevity or one-year final compensation), although it is difficult to estimate at this point. There may still be some correlation with service, where members with more years of service have a higher probability of retirement; however, the differences at 25 and 30 years of service will not be as significant.
Recommendation 2% at 60 Members
We are recommending small changes to the retirement rates for members with less than 25 years and 30 or more years of service to better fit the observed patterns.
For members with 25 to 30 years of service, we are recommending an increase in the retirement rates, since the actual rates were greater than the expected rates. Note that this assumption is actually broken down into two pieces: 1) 25 to 27 years of service where we are recommending rates are set equal to 225% of the rates for service less than 25; and 2) 28 to 29 years of service where the rates are set equal to 125% of the rates for service less than 25. The current assumptions are adjustments of 200% and 100% respectively.
As illustrated in the following graphs, we have reflected only part of the recent experience. We have also taken the previous experience study into account to give more of a long-term picture of the recent retirement rates.
A comparison of the actual and expected retirements under the recommended assumptions is shown in the table below.
Recommendation 2% at 62 Members
Due to the lower benefit percentages for ages less than 65, we would expect that 2% at 62 members will retire somewhat later than the 2% at 60 members. Additionally, we would not expect the attainment of 25 and 30 years of service to have the same impact. We have recommended revised rates for 2% at 62 members that do not vary by service to reflect this. The proposed rates are shown in Table A-3.
Number of Service Retirements (2% at 60) -- Proposed
Actual ProposedActual /
Proposed
Less than 25 Years of Service 26,363 26,948 98% 25 to 30 Years of Service 9,319 8,816 106% 30 Years or More of Service 19,435 20,780 94% Total 55,117 56,544 97%
Attachment 1 Regular Meeting - Item 3
February 1, 2017
TRB76

Experience Analysis (2010-2015) California State Teachers’ Retirement System Service Retirement from Active Status
This work product was prepared solely for CalSTRS for the purposes described herein and may not be appropriate to use for other purposes. Milliman does not intend to benefit and assumes no duty or liability to other parties who receive this work. Milliman recommends that third parties be aided by their own actuary or other qualified professional when reviewing the Milliman work product.
55
ctrj0291.docx
Exhibit 7-1 Service Retirement Rates (2% at 60 Members) Males—Less than 25 Years of Service
0%
10%
20%
30%
40%
50%
55 56 57 58 59 60 61 62 63 64 65 66 67 68 69 70 71 72 73 74
Annu
al P
roba
bilit
y of
Ret
irem
ent
AgeActual Prior Actual Expected Proposed
<25 Years of Svc Expected Actual Proposed
Total Count 6,915 7,210 7,401Actual / Expected 104% 97%
Attachment 1 Regular Meeting - Item 3
February 1, 2017
TRB77
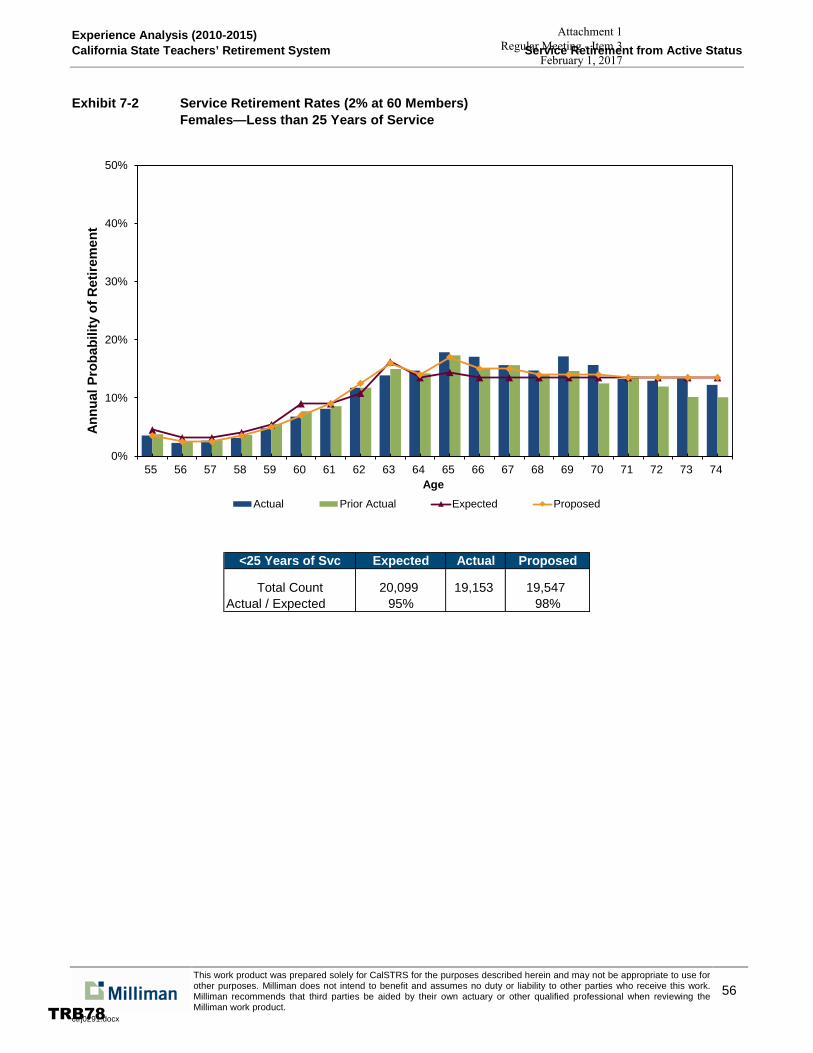
Experience Analysis (2010-2015) California State Teachers’ Retirement System Service Retirement from Active Status
This work product was prepared solely for CalSTRS for the purposes described herein and may not be appropriate to use for other purposes. Milliman does not intend to benefit and assumes no duty or liability to other parties who receive this work. Milliman recommends that third parties be aided by their own actuary or other qualified professional when reviewing the Milliman work product.
56
ctrj0291.docx
Exhibit 7-2 Service Retirement Rates (2% at 60 Members) Females—Less than 25 Years of Service
0%
10%
20%
30%
40%
50%
55 56 57 58 59 60 61 62 63 64 65 66 67 68 69 70 71 72 73 74
Annu
al P
roba
bilit
y of
Ret
irem
ent
AgeActual Prior Actual Expected Proposed
<25 Years of Svc Expected Actual Proposed
Total Count 20,099 19,153 19,547Actual / Expected 95% 98%
Attachment 1 Regular Meeting - Item 3
February 1, 2017
TRB78

Experience Analysis (2010-2015) California State Teachers’ Retirement System Service Retirement from Active Status
This work product was prepared solely for CalSTRS for the purposes described herein and may not be appropriate to use for other purposes. Milliman does not intend to benefit and assumes no duty or liability to other parties who receive this work. Milliman recommends that third parties be aided by their own actuary or other qualified professional when reviewing the Milliman work product.
57
ctrj0291.docx
Exhibit 7-3 Service Retirement Rates (2% at 60 Members) Males—25 to 30 Years of Service
0%
10%
20%
30%
40%
50%
55 56 57 58 59 60 61 62 63 64 65 66 67 68 69 70 71 72 73 74
Annu
al P
roba
bilit
y of
Ret
irem
ent
AgeActual Prior Actual Expected Proposed
25 to 30 Years of Svc Expected Actual Proposed
Total Count 1,851 2,342 2,291Actual / Expected 127% 102%
Attachment 1 Regular Meeting - Item 3
February 1, 2017
TRB79

Experience Analysis (2010-2015) California State Teachers’ Retirement System Service Retirement from Active Status
This work product was prepared solely for CalSTRS for the purposes described herein and may not be appropriate to use for other purposes. Milliman does not intend to benefit and assumes no duty or liability to other parties who receive this work. Milliman recommends that third parties be aided by their own actuary or other qualified professional when reviewing the Milliman work product.
58
ctrj0291.docx
Exhibit 7-4 Service Retirement Rates (2% at 60 Members) Females—25 to 30 Years of Service
0%
10%
20%
30%
40%
50%
55 56 57 58 59 60 61 62 63 64 65 66 67 68 69 70 71 72 73 74
Annu
al P
roba
bilit
y of
Ret
irem
ent
AgeActual Prior Actual Expected Proposed
25 to 30 Years of Svc Expected Actual Proposed
Total Count 5,780 6,977 6,525Actual / Expected 121% 107%
Attachment 1 Regular Meeting - Item 3
February 1, 2017
TRB80
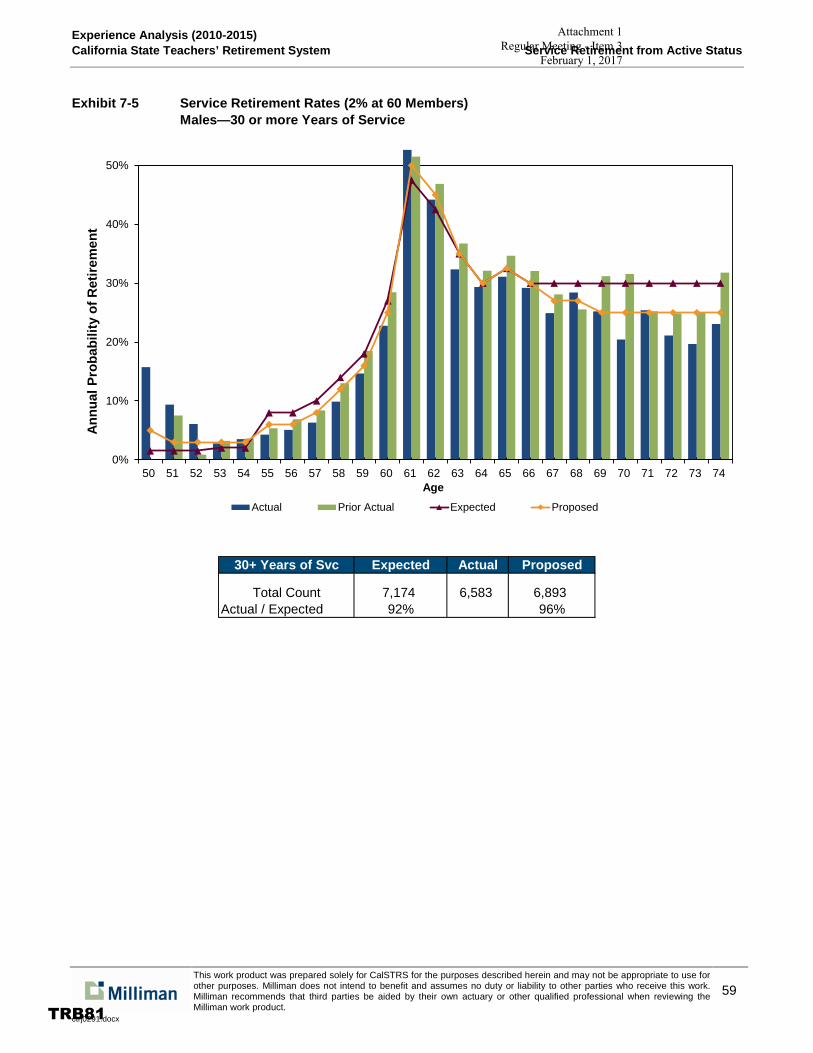
Experience Analysis (2010-2015) California State Teachers’ Retirement System Service Retirement from Active Status
This work product was prepared solely for CalSTRS for the purposes described herein and may not be appropriate to use for other purposes. Milliman does not intend to benefit and assumes no duty or liability to other parties who receive this work. Milliman recommends that third parties be aided by their own actuary or other qualified professional when reviewing the Milliman work product.
59
ctrj0291.docx
Exhibit 7-5 Service Retirement Rates (2% at 60 Members) Males—30 or more Years of Service
0%
10%
20%
30%
40%
50%
50 51 52 53 54 55 56 57 58 59 60 61 62 63 64 65 66 67 68 69 70 71 72 73 74
Annu
al P
roba
bilit
y of
Ret
irem
ent
AgeActual Prior Actual Expected Proposed
30+ Years of Svc Expected Actual Proposed
Total Count 7,174 6,583 6,893Actual / Expected 92% 96%
Attachment 1 Regular Meeting - Item 3
February 1, 2017
TRB81

Experience Analysis (2010-2015) California State Teachers’ Retirement System Service Retirement from Active Status
This work product was prepared solely for CalSTRS for the purposes described herein and may not be appropriate to use for other purposes. Milliman does not intend to benefit and assumes no duty or liability to other parties who receive this work. Milliman recommends that third parties be aided by their own actuary or other qualified professional when reviewing the Milliman work product.
60
ctrj0291.docx
Exhibit 7-6 Service Retirement Rates (2% at 60 Members) Females—30 or more Years of Service
0%
10%
20%
30%
40%
50%
50 51 52 53 54 55 56 57 58 59 60 61 62 63 64 65 66 67 68 69 70 71 72 73 74
Annu
al P
roba
bilit
y of
Ret
irem
ent
AgeActual Prior Actual Expected Proposed
30+ Years of Svc Expected Actual Proposed
Total Count 14,248 12,852 13,887Actual / Expected 90% 93%
Attachment 1 Regular Meeting - Item 3
February 1, 2017
TRB82

Experience Analysis (2010-2015) California State Teachers’ Retirement System
This work product was prepared solely for CalSTRS for the purposes described herein and may not be appropriate to use for other purposes. Milliman does not intend to benefit and assumes no duty or liability to other parties who receive this work. Milliman recommends that third parties be aided by their own actuary or other qualified professional when reviewing the Milliman work product.
61
ctrj0291.docx
Section 8: Disability Retirement
Results
CalSTRS allows a member to start receiving benefits prior to eligibility for service retirement if they become disabled.
Rates of disability are studied separately for Coverage A and Coverage B members due to the different benefit provisions. The following tables show the actual versus expected number of disabilities for Coverage A and Coverage B males and females. In all categories, there were fewer disabilities than expected.
Recommendation We are recommending decreasing the rates of disability slightly for Coverage A members.
Actual vs. Expected Disability RetirementsCoverage A
Actual ExpectedActual /
ExpectedMale 113 130 87%Female 311 389 80%Total 424 519 82%
Coverage B
Actual ExpectedActual /
ExpectedMale 543 570 95%Female 1,482 1,569 94%Total 2,024 2,140 95%
Actual vs. Proposed Disability Retirements
Coverage A
Actual ProposedActual /
ProposedMale 113 124 91%Female 311 354 88%Total 424 478 89%
Coverage B
Actual ProposedActual /
ProposedMale 543 570 95%Female 1,482 1,569 94%Total 2,024 2,140 95%
Attachment 1 Regular Meeting - Item 3
February 1, 2017
TRB83

This work product was prepared solely for CalSTRS for the purposes described herein and may not be appropriate to use for other purposes. Milliman does not intend to benefit and assumes no duty or liability to other parties who receive this work. Milliman recommends that third parties be aided by their own actuary or other qualified professional when reviewing the Milliman work product.
62
ctrj0291.docx
This page intentionally left blank.
Attachment 1 Regular Meeting - Item 3
February 1, 2017
TRB84

Experience Analysis (2010-2015) California State Teachers’ Retirement System
This work product was prepared solely for CalSTRS for the purposes described herein and may not be appropriate to use for other purposes. Milliman does not intend to benefit and assumes no duty or liability to other parties who receive this work. Milliman recommends that third parties be aided by their own actuary or other qualified professional when reviewing the Milliman work product.
63
ctrj0291.docx
Section 9: Other Terminations of Employment (Withdrawal)
This section of the report summarizes the results of our study of terminations of employment for reasons other than death, service retirement, or disability. Rates of termination vary by years of service – the greater the years of service, the less likely a member is to terminate employment. The current assumptions also vary by gender, with females having a slightly higher probability of terminating than males.
Results Overall, the actual number of terminations was close to expected, with males being very close to expected and females being slightly lower than expected. Note that we exclude retirement-eligible members from the study of non-retirement terminations. Additionally, we reduce the number of terminations by any rehires at the corresponding service level.
Recommendation
The results of the study are shown in Exhibits 9-1 and 9-2. As noted, the actual rates were close to the assumptions. Therefore, we have not recommended a change in the assumption. However, we did observe some difference for females at service levels between 10 and 25 years, with the actual rates being less than the assumptions. This appears to be due to a larger number of rehires during the study period. We will monitor this going forward to see if it develops into a trend.
Actual vs. Expected Terminations(1)
Actual ExpectedActual /
Expected
Males 12,498 13,460 93%Females 28,111 34,113 82%Total 40,609 47,573 85%
1. Excludes first year of service.
Attachment 1 Regular Meeting - Item 3
February 1, 2017
TRB85
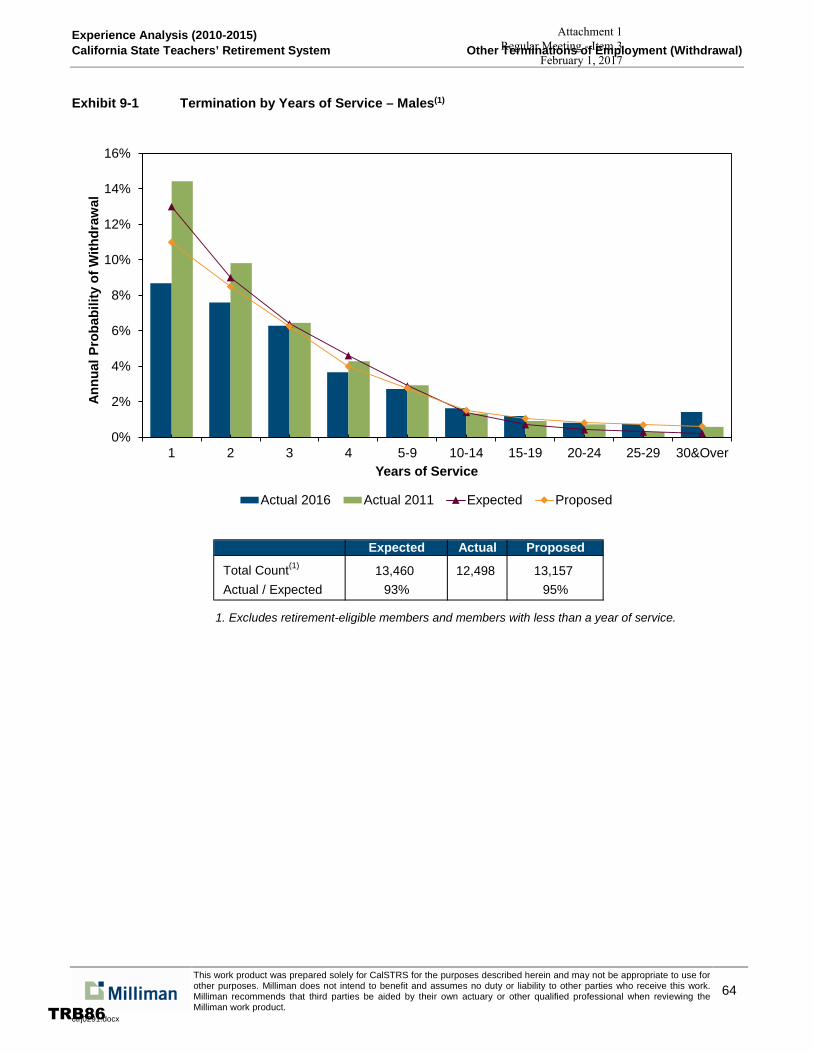
Experience Analysis (2010-2015) California State Teachers’ Retirement System Other Terminations of Employment (Withdrawal)
This work product was prepared solely for CalSTRS for the purposes described herein and may not be appropriate to use for other purposes. Milliman does not intend to benefit and assumes no duty or liability to other parties who receive this work. Milliman recommends that third parties be aided by their own actuary or other qualified professional when reviewing the Milliman work product.
64
ctrj0291.docx
Exhibit 9-1 Termination by Years of Service – Males(1)
1. Excludes retirement-eligible members and members with less than a year of service.
0%
2%
4%
6%
8%
10%
12%
14%
16%
1 2 3 4 5-9 10-14 15-19 20-24 25-29 30&Over
Annu
al P
roba
bilit
y of
With
draw
al
Years of Service
Actual 2016 Actual 2011 Expected Proposed
Expected Actual Proposed
Total Count(1) 13,460 12,498 13,157 Actual / Expected 93% 95%
Attachment 1 Regular Meeting - Item 3
February 1, 2017
TRB86
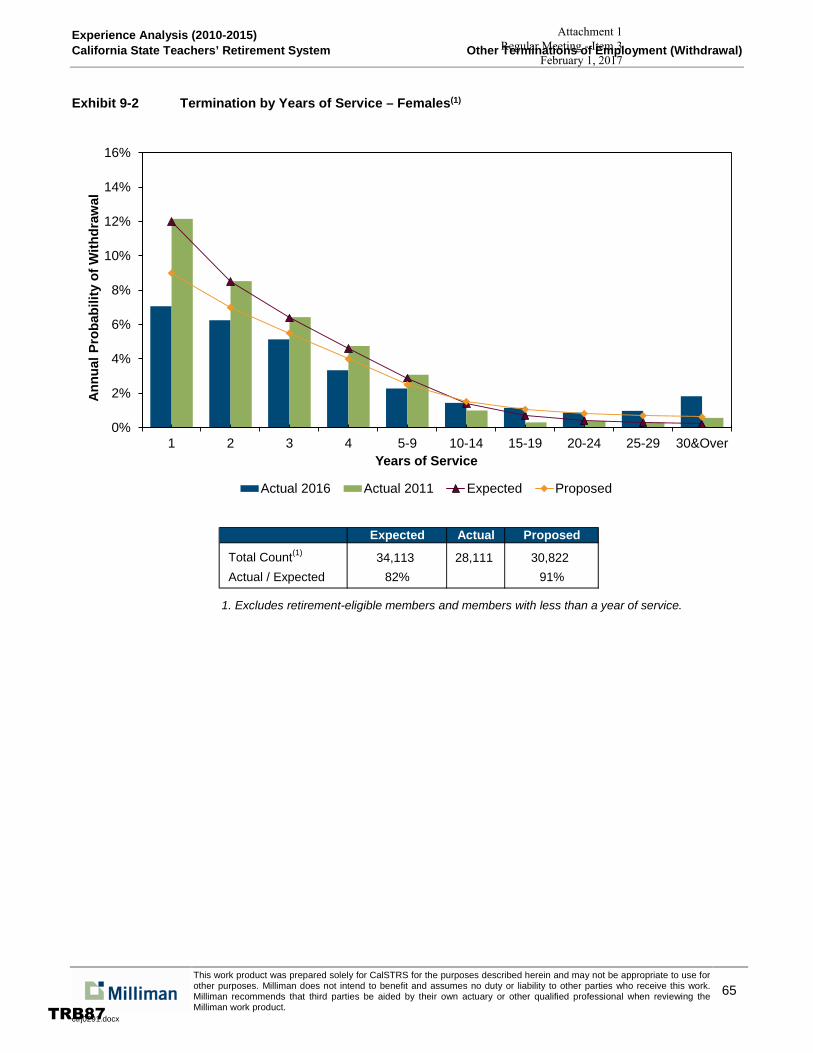
Experience Analysis (2010-2015) California State Teachers’ Retirement System Other Terminations of Employment (Withdrawal)
This work product was prepared solely for CalSTRS for the purposes described herein and may not be appropriate to use for other purposes. Milliman does not intend to benefit and assumes no duty or liability to other parties who receive this work. Milliman recommends that third parties be aided by their own actuary or other qualified professional when reviewing the Milliman work product.
65
ctrj0291.docx
Exhibit 9-2 Termination by Years of Service – Females(1)
1. Excludes retirement-eligible members and members with less than a year of service.
0%
2%
4%
6%
8%
10%
12%
14%
16%
1 2 3 4 5-9 10-14 15-19 20-24 25-29 30&Over
Annu
al P
roba
bilit
y of
With
draw
al
Years of Service
Actual 2016 Actual 2011 Expected Proposed
Expected Actual Proposed
Total Count(1) 34,113 28,111 30,822 Actual / Expected 82% 91%
Attachment 1 Regular Meeting - Item 3
February 1, 2017
TRB87

This work product was prepared solely for CalSTRS for the purposes described herein and may not be appropriate to use for other purposes. Milliman does not intend to benefit and assumes no duty or liability to other parties who receive this work. Milliman recommends that third parties be aided by their own actuary or other qualified professional when reviewing the Milliman work product.
66
ctrj0291.docx
This page intentionally left blank.
Attachment 1 Regular Meeting - Item 3
February 1, 2017
TRB88

Experience Analysis (2010-2015) California State Teachers’ Retirement System
This work product was prepared solely for CalSTRS for the purposes described herein and may not be appropriate to use for other purposes. Milliman does not intend to benefit and assumes no duty or liability to other parties who receive this work. Milliman recommends that third parties be aided by their own actuary or other qualified professional when reviewing the Milliman work product.
67
ctrj0291.docx
Section 10: Probability of Refund Upon Vested Termination
This section of the report deals with the rates at which employees elect a refund of their contributions upon termination of service. It only considers vested members who are not yet eligible for service retirement. Under the current assumptions, members who terminate with fewer years of service have a greater probability of electing to withdraw their contributions. All non-vested members are assumed to take a refund at termination. Note that the assumed probability of refund varies by entry age group.
Results
The following table shows actual and expected number of refunds split by entry age group. Note that each entry age shown represents the midpoint of a five-year entry age group (so Entry Age 22 represents the group with entry ages between 20 and 25, etc.). Members with higher entry ages (who are closer to retirement at a given level of service) have a lower probability of refund. In aggregate, the actual total number of refunds was somewhat higher than the assumptions predicted, mainly for members with between five and ten years of service.
Actual to Expected Number of Refunds
Males
Entry Age Actual Expected Ratio22 86 87 99%27 746 694 108%32 545 399 137%37 293 253 116%42 153 184 83%47 317 386 82%
Total 2,140 2,004 107%
Females
Entry Age Actual Expected Ratio22 451 383 118%27 1,998 1,390 144%32 846 599 141%37 435 373 117%42 308 312 99%47 416 490 85%
Total 4,454 3,548 126%
Grand Total 6,594 5,551 119%
Attachment 1 Regular Meeting - Item 3
February 1, 2017
TRB89

Experience Analysis (2010-2015) California State Teachers’ Retirement System Probability of Refund Upon Vested Termination
This work product was prepared solely for CalSTRS for the purposes described herein and may not be appropriate to use for other purposes. Milliman does not intend to benefit and assumes no duty or liability to other parties who receive this work. Milliman recommends that third parties be aided by their own actuary or other qualified professional when reviewing the Milliman work product.
68
ctrj0291.docx
Recommendation
Based on the experience, we are recommending increases in the assumed rates at which members withdraw their contributions from CalSTRS. The changes are for entry ages less than 40 and are primarily for service levels between five and ten years. The results based on the proposed assumptions are shown below.
Actual to Proposed Number of Refunds
Males
Entry Age Actual Proposed Ratio22 86 95 91%27 746 752 99%32 545 449 121%37 293 274 107%42 153 184 83%47 317 386 82%
Total 2,140 2,141 100%
Females
Entry Age Actual Proposed Ratio22 451 460 98%27 1,998 1,813 110%32 846 755 112%37 435 437 100%42 308 312 99%47 416 488 85%
Total 4,454 4,266 104%
Grand Total 6,594 6,407 103%
Attachment 1 Regular Meeting - Item 3
February 1, 2017
TRB90

Experience Analysis (2010-2015) California State Teachers’ Retirement System
This work product was prepared solely for CalSTRS for the purposes described herein and may not be appropriate to use for other purposes. Milliman does not intend to benefit and assumes no duty or liability to other parties who receive this work. Milliman recommends that third parties be aided by their own actuary or other qualified professional when reviewing the Milliman work product.
69
ctrj0291.docx
Appendix A-1: Summary of Proposed Assumptions (Changes in Yellow)
This section of the report discloses the actuarial methods and assumptions used in this actuarial valuation. These methods and assumptions have been chosen on the basis of recent experience of the DB Program and on current expectations as to future economic conditions. The assumptions are intended to estimate the future experience of the members of the DB Program and of the DB Program itself in areas that affect the projected benefit flow and anticipated investment earnings. Any variations in future experience from that expected from these assumptions will result in corresponding changes in estimated costs of the DB Program's benefits. Actuarial Cost Method
The accruing costs of all benefits with future accruals are measured by the Entry Age Normal Actuarial Cost Method. For measurements where no future service is earned (i.e., those with service fixed as of June 30, 2014), the actuarial obligation uses the Projected Unit Credit Actuarial Cost Method. The projected revenue in excess of the Normal Cost is tested for sufficiency to amortize the Unfunded Actuarial Obligation created by this method. Amortization is calculated on a level percentage of salary including general wage inflation but no increase or decrease in the number of active members.
Entry Age Normal Cost Method:
The actuarial present value of projected benefits for each individual member included in the valuation is allocated on a level basis over the earnings of the individual between entry age and assumed exit ages. The portion of this actuarial present value allocated to a valuation year is called the Normal Cost. For 2% at 60 members, the Normal Cost is based on the Coverage B benefit structure. For 2% at 62 members, the Normal Cost is based on their benefit structure. The portion of this actuarial present value not provided for at a valuation date by the actuarial present value of future Normal Costs is called the Actuarial Obligation. The excess of the Actuarial Obligation over the Actuarial Value of Assets is called the Unfunded Actuarial Obligation. If the Actuarial Value of Assets exceeds the Actuarial Obligation, the difference is called the Actuarial Surplus.
Entry Age: The ages at entry of future active members are assumed to average the same as the entry ages of the present active members they replace. If the number of active members should increase (or decrease), it is further assumed that the average entry age of the larger (or smaller) group will be the same, from an actuarial standpoint, as that of the present active group. Under these assumptions, the Normal Cost Rate will not vary significantly due to the termination of the present active membership, or with an expansion or contraction of the active membership.
Entry age is determined as age at membership date.
Projected Unit Cost Method:
This cost method is used for calculations of the actuarial obligation where there are no future service accruals. Under the PUC method, the actuarial present value of projected benefits for each individual member included in the valuation is determined based on the current service and salary projected to the age the member leaves active employment. The Normal Cost is $0, since no benefits are being earned.
Attachment 1 Regular Meeting - Item 3
February 1, 2017
TRB91

Experience Analysis (2010-2015) California State Teachers’ Retirement System Appendix A
This work product was prepared solely for CalSTRS for the purposes described herein and may not be appropriate to use for other purposes. Milliman does not intend to benefit and assumes no duty or liability to other parties who receive this work. Milliman recommends that third parties be aided by their own actuary or other qualified professional when reviewing the Milliman work product.
70
ctrj0291.docx
Asset Valuation Method
The assets are valued using a method that delays recognition of investment gains or losses. The expected actuarial value is the prior year’s actuarial value increased with net cash flow of funds, and all increased with interest during the past year at the expected investment return assumption. One-third of the difference between the expected actuarial value of assets and the Fair Market Value of assets is added to the expected actuarial value of assets to arrive at the Actuarial Value of Assets. The asset smoothing method was adopted for the 1999 Actuarial Valuation and is effective for the investment experience beginning in July of 1993.
Actuarial Assumptions
The Actuarial Standards Board has adopted Actuarial Standard of Practice No. 27, Selection of Economic Assumptions for Measuring Pension Obligations. This Standard provides guidance on selecting economic assumptions under defined benefit retirement programs such as the System. In our opinion, the economic assumptions have been developed in accordance with the Standard. The Actuarial Standards Board has adopted Actuarial Standard of Practice No. 35, Selection of Demographic and Other Noneconomic Assumptions for Measuring Pension Obligations. This Standard provides guidance on selecting demographic assumptions under defined benefit retirement programs such as the System. In our opinion, the demographic assumptions have been developed in accordance with the Standard. The assumptions are intended to estimate the future experience of the members of the DB Program and of the System itself in areas that affect the projected benefit flow and anticipated investment earnings. Any variations in future experience from that expected from these assumptions will result in corresponding changes in estimated costs of the Program's benefits. The demographic assumptions are listed in Table A.1 and illustrated at selected ages and duration combinations in Tables A.2 – A.7.
Payroll Growth Assumption
The wage growth assumption is equal to 3.50%, and the active population is assumed to be stable.
Attachment 1 Regular Meeting - Item 3
February 1, 2017
TRB92

Experience Analysis (2010-2015) California State Teachers’ Retirement System Appendix A
This work product was prepared solely for CalSTRS for the purposes described herein and may not be appropriate to use for other purposes. Milliman does not intend to benefit and assumes no duty or liability to other parties who receive this work. Milliman recommends that third parties be aided by their own actuary or other qualified professional when reviewing the Milliman work product.
71
ctrj0291.docx
Table A.1 List of Major Valuation Assumptions
I. Economic Assumptions
A. Investment Return 7.25% (net of investment and administrative expenses)
B. Interest on Member Accounts 3.00%
C. Wage Growth 3.50%
D. Inflation 2.75%
II. Demographic Assumptions
A. Mortality* Active - Male RP-2014 White Collar Employee Male set
back 2 years Table A.2
- Female RP-2014 White Collar Employee Female set back 2 years
Table A.2
Retired & - Male Beneficiary
2016 CalSTRS Retired Male Table A.2
- Female 2016 CalSTRS Retired Female Table A.2
Disabled - Male RP-2014 Disabled Retiree Male set back 2 years
Table A.2
- Female RP-2014 Disabled Retiree Female set back 2 years (select rates in first three years for both Males and Females)
Table A.2
*All proposed tables use 110% of the MP-2016 Ultimate Projection Scale. The combined base tables and projection scale specified contain a margin for expected future mortality improvement. See Table A.9 of this report for a key to the custom mortality tables used for CalSTRS.
B. Service Retirement Experience Tables Table A.3
C. Disability Retirement Experience Tables Table A.4
D. Withdrawal Experience Tables Table A.5
E. Probability of Refund Experience Tables Table A.6
F. Merit Salary Increases Experience Tables Table A.7
G. Supplemental Assumptions Experience Tables Table A.8
H. Custom Mortality Table Key Experience Tables Table A.9
Attachment 1 Regular Meeting - Item 3
February 1, 2017
TRB93

Experience Analysis (2010-2015) California State Teachers’ Retirement System Appendix A
This work product was prepared solely for CalSTRS for the purposes described herein and may not be appropriate to use for other purposes. Milliman does not intend to benefit and assumes no duty or liability to other parties who receive this work. Milliman recommends that third parties be aided by their own actuary or other qualified professional when reviewing the Milliman work product.
72
ctrj0291.docx
Table A.2(1) Mortality as of 6/30/2016
Active Members
Age Male Female 25 0.035% 0.014% 30 0.030 0.016 35 0.034 0.021 40 0.039 0.028 45 0.054 0.044 50 0.093 0.075 55 0.157 0.118 60 0.259 0.173 65 0.451 0.257
Retired Members and Beneficiaries(1)
Disabled Members (After Year 3)(1)
Age Male Female Male Female 50 0.243% 0.124% 1.868% 1.055% 55 0.358 0.213 2.172 1.320 60 0.480 0.283 2.464 1.558 65 0.682 0.427 2.867 1.861 70 1.091 0.704 3.556 2.416 75 1.958 1.294 4.689 3.438 80 3.592 2.482 6.491 5.092 85 6.907 4.950 9.430 7.566 90 13.297 10.051 14.273 11.159 95 22.668 18.791 21.289 16.477
Select minimum rates for disability:
First year of disability 4.0% 3.0% Second year of disability 3.5 2.5 Third year of disability 3.0 2.0
1. Projected improvement based on 110% of the MP-2016 Ultimate Projection Scale. Projection scale does not apply to select minimum rates.
Attachment 1 Regular Meeting - Item 3
February 1, 2017
TRB94

Experience Analysis (2010-2015) California State Teachers’ Retirement System Appendix A
This work product was prepared solely for CalSTRS for the purposes described herein and may not be appropriate to use for other purposes. Milliman does not intend to benefit and assumes no duty or liability to other parties who receive this work. Milliman recommends that third parties be aided by their own actuary or other qualified professional when reviewing the Milliman work product.
73
ctrj0291.docx
Table A.3 Service Retirement
DB Program – 2% at 60 Members DB Program –
2% at 62 Members Only for the 1990
Benefit Structure Under 30 Years(1) 30 or More Years All Years
Age Male Female Male Female Male Female Male Female
50 0.0% 0.0% 0.0% 0.0% 5.0% 5.0% 0.0% 0.0% 51 0.0 0.0 0.0 0.0 3.0 3.0 0.0 0.0 52 0.0 0.0 0.0 0.0 3.0 3.0 0.0 0.0 53 0.0 0.0 0.0 0.0 3.0 3.0 0.0 0.0 54 1.5 1.5 0.0 0.0 3.0 3.0 0.0 0.0 55 5.8 7.0 2.7 3.5 6.0 8.0 3.0 4.0 56 3.9 4.5 1.8 2.5 6.0 8.0 2.0 3.0 57 4.9 4.5 1.8 2.5 8.0 10.0 3.0 3.5 58 6.8 7.0 2.7 3.5 12.0 15.0 4.0 4.0 59 17.5 14.0 4.5 5.0 16.0 18.0 6.0 6.0 60 25.0 22.0 6.3 7.0 25.0 29.0 9.0 9.0 61 16.5 15.0 7.0 9.0 50.0 50.0 15.0 15.0 62 16.5 15.0 11.0 12.5 45.0 45.0 15.0 17.0 63 15.0 15.0 12.0 16.0 35.0 40.0 15.0 18.0 64 17.5 18.0 13.0 14.0 30.0 35.0 15.0 18.0 65 20.0 18.0 14.0 17.0 32.5 37.5 30.0 30.0 66 16.0 18.0 13.0 15.0 30.0 32.0 25.0 25.0 67 16.0 18.0 13.0 15.0 27.0 32.0 25.0 25.0 68 16.0 16.0 12.0 14.0 27.0 30.0 20.0 20.0 69 16.0 16.0 12.0 14.0 25.0 30.0 20.0 20.0 70 100.0 100.0 12.0 14.0 25.0 30.0 20.0 20.0 71 11.0 13.5 25.0 30.0 20.0 20.0 72 11.0 13.5 25.0 30.0 20.0 20.0 73 11.0 13.5 25.0 30.0 20.0 20.0 74 11.0 13.5 25.0 30.0 20.0 20.0 75 100.0 100.0 100.0 100.0 100.0 100.0
1. If credited service is equal to or greater than 25 but less than 28 years, the assumed retirement rates shown above for members with less than 25 years of credited service are multiplied by 225%. For example, a 63-year old female member with 26 years of credited service would have a 36.0% probability of retirement (2.25 times the rate for service less than 25 years of 16.0%). For members with 28 but less than 30 years of credited service, the rates are equal to 125% of the assumed retirement rates shown above for members with less than 25 years of credited service.
The assumptions shown above are for retirement from active status. It is assumed that all vested terminated members retire at age 60 (2% at 60 members) or age 62 (2% at 62 members).
Attachment 1 Regular Meeting - Item 3
February 1, 2017
TRB95

Experience Analysis (2010-2015) California State Teachers’ Retirement System Appendix A
This work product was prepared solely for CalSTRS for the purposes described herein and may not be appropriate to use for other purposes. Milliman does not intend to benefit and assumes no duty or liability to other parties who receive this work. Milliman recommends that third parties be aided by their own actuary or other qualified professional when reviewing the Milliman work product.
74
ctrj0291.docx
Table A.4 Disability Retirement
Coverage A
Age Male Female 25 0.018% 0.018% 30 0.027 0.027 35 0.045 0.054 40 0.072 0.081 45 0.099 0.099 50 0.144 0.198 55 0.189 0.252
Coverage B
Age Male Female 25 0.010% 0.020% 30 0.020 0.020 35 0.030 0.040 40 0.060 0.070 45 0.100 0.110 50 0.140 0.185 55 0.245 0.300 60 0.365 0.380 65 0.400 0.400 70 0.400 0.400
Attachment 1 Regular Meeting - Item 3
February 1, 2017
TRB96

Experience Analysis (2010-2015) California State Teachers’ Retirement System Appendix A
This work product was prepared solely for CalSTRS for the purposes described herein and may not be appropriate to use for other purposes. Milliman does not intend to benefit and assumes no duty or liability to other parties who receive this work. Milliman recommends that third parties be aided by their own actuary or other qualified professional when reviewing the Milliman work product.
75
ctrj0291.docx
Table A.5 Withdrawal
Year(1) Male Female
0 16.0% 15.0%
1 11.0 9.0 2 8.5 7.0 3 6.3 5.5 4 4.0 4.0 5 3.5 3.0
10 1.8 1.8
15 1.2 1.2
20 0.9 0.9
25 0.7 0.7
30 0.6 0.6
1. Based on elapsed service since membership date.
Attachment 1 Regular Meeting - Item 3
February 1, 2017
TRB97

Experience Analysis (2010-2015) California State Teachers’ Retirement System Appendix A
This work product was prepared solely for CalSTRS for the purposes described herein and may not be appropriate to use for other purposes. Milliman does not intend to benefit and assumes no duty or liability to other parties who receive this work. Milliman recommends that third parties be aided by their own actuary or other qualified professional when reviewing the Milliman work product.
76
ctrj0291.docx
Table A.6 Probability of Refund
Entry Ages – Male
Year(1) Under 25 25 - 29 30 - 34 35 - 39 40 and Up Under 5 100% 100% 100% 100% 100%
5 60 60 60 56 45
10 46 46 38 36 36
15 38 38 31 21
20 31 31 15
25 15 15
30 10
Entry Ages – Female
Year Under 25 25 - 29 30 – 34 35 - 39 40 and Up Under 5 100% 100% 100% 100% 100% 5 60 60 60 52 35 10 34 34 32 32 29 15 27 24 24 24 20 19 14 14 25 10 10 30 10
1. Based on elapsed service since membership date. Members who terminate with less than 5 years of credited service are assumed to have a 100% probability of refund.
Attachment 1 Regular Meeting - Item 3
February 1, 2017
TRB98

Experience Analysis (2010-2015) California State Teachers’ Retirement System Appendix A
This work product was prepared solely for CalSTRS for the purposes described herein and may not be appropriate to use for other purposes. Milliman does not intend to benefit and assumes no duty or liability to other parties who receive this work. Milliman recommends that third parties be aided by their own actuary or other qualified professional when reviewing the Milliman work product.
77
ctrj0291.docx
Table A.7 Merit Salary Increases
Entry Age - Annual Increase in Salaries Due to Merit
Year(1) Under 25 25 - 29 30 - 34 35 - 39 40 - 44 45 & up 0 6.4% 5.8% 5.3% 4.8% 4.5% 3.7% 1 6.4% 5.8% 5.3% 4.8% 4.5% 3.7% 2 6.0 5.5 5.0 4.5 4.3 3.5 3 5.6 5.3 4.8 4.3 4.1 3.3 4 5.4 5.0 4.5 4.1 3.9 3.0 5 5.2 4.8 4.3 3.9 3.8 2.8
10 3.7 3.4 3.0 2.7 2.5 1.8
15 1.8 1.7 1.5 1.2 1.2 0.9
20 1.3 1.2 1.2 0.8 0.8 0.6
25 1.1 1.0 0.9 0.6 0.6
30 0.9 0.8 0.7 0.5
35 0.8 0.7 0.6
40 0.8 0.7
45 0.8
1. Based on elapsed service since membership date.
Attachment 1 Regular Meeting - Item 3
February 1, 2017
TRB99

Experience Analysis (2010-2015) California State Teachers’ Retirement System Appendix A
This work product was prepared solely for CalSTRS for the purposes described herein and may not be appropriate to use for other purposes. Milliman does not intend to benefit and assumes no duty or liability to other parties who receive this work. Milliman recommends that third parties be aided by their own actuary or other qualified professional when reviewing the Milliman work product.
78
ctrj0291.docx
Table A.8 Supplemental Assumptions
PEPRA Coverage All members hired on or after the valuation date are assumed to be subject to the
provisions of PEPRA. Unused Sick Leave Credited Service is increased by 1.8%. Optional Forms Active and Inactive: Based on single life annuity assumed.
Retirees and Beneficiaries: Based on optional form in data.
Probability of Marriage Male: 85% Female: 65% Male spouses are assumed to be three years older than female spouses.
Number of Children Married members are assumed to have the following number of children:
Member’s Gender
Assumed Number of Children
Male 0.65 Female 0.50
Assumed Offsets The following offsets, expressed as a percentage of Final Compensation, are
assumed to cease at age 60:
Coverage A
Coverage B (including 2% at 62)
Male Female Male Female
Death 0.0% 0.0% 0.0% 0.0% Disability 0.0% 0.0% 0.0% 0.0%
Valuation of Salary and benefit information is not available on the valuation data Inactive Members provided for inactive members. Therefore, we estimate the projected retirement
benefits for inactive members as follows:
1) The inactive member’s earnable salary information is retrieved from when they were active by matching with a database of active valuation data back to 2001 and taking the highest earnable salary for the member during the period.
2) For those members who cannot be located on the active database (because they terminated prior to 2001 or another reason), their earnable salary is estimated based on 120% of the average earnable salary for all active members in the year the member terminated.
Attachment 1 Regular Meeting - Item 3
February 1, 2017
TRB100

Experience Analysis (2010-2015) California State Teachers’ Retirement System Appendix A
This work product was prepared solely for CalSTRS for the purposes described herein and may not be appropriate to use for other purposes. Milliman does not intend to benefit and assumes no duty or liability to other parties who receive this work. Milliman recommends that third parties be aided by their own actuary or other qualified professional when reviewing the Milliman work product.
79
ctrj0291.docx
3) The earnable salary amount from the prior steps is treated as the member’s final compensation with two additional adjustments. a. An additional load of 5% for all inactive members is applied to their
salary amount to account for potential post-termination increases in salary due to factors such as reciprocity.
b. Final compensation is increased by an additional 5% if the member has 25 or more years of credited service.
4) Based on the salary data described above and the birth date and credited service from the current year’s valuation data, the projected benefit amount is calculated and valued as a deferred service retirement.
5) All non-vested members are assumed to take an immediate refund of their member contributions.
Attachment 1 Regular Meeting - Item 3
February 1, 2017
TRB101

Experience Analysis (2010-2015) California State Teachers’ Retirement System Appendix A
This work product was prepared solely for CalSTRS for the purposes described herein and may not be appropriate to use for other purposes. Milliman does not intend to benefit and assumes no duty or liability to other parties who receive this work. Milliman recommends that third parties be aided by their own actuary or other qualified professional when reviewing the Milliman work product.
80
ctrj0291.docx
Table A.9 Custom Mortality Table Key
Notes: 1. All proposed tables use 110% of the MP-2016 Ultimate Projection Scale. Projection scale does not apply to select minimum rates.
2. All proposed tables to be used in the 6/30/2016 actuarial valuations include two years of mortality improvement from the 2014 tables shown above.
Healthy (Service) Retirees and Beneficiaries -- Males
Current: RP-2000 Healthy Male White Collar -2 to age 70 smoothed to -1 at age 90
Proposed: RP-2014 Healthy Male White Collar -1 to age 70 smoothed to +1 at age 95
Healthy (Service) Retirees and Beneficiaries -- Females
Current: RP-2000 Healthy Female White Collar -4 to age 75 smoothed to -0 at age 90
Proposed: RP-2014 Healthy Female White Collar -4 to age 70 smoothed to +1 at age 95
Disabled Retirees -- Males
Current: Age < 70: 2% at age 40 & under, graded to 3.2% at age 70Age > 70: RP-2000 Male White Collar +7 at age 70 smoothed to +1 age 85(select rates in first three years, regardless of age)
Proposed: All Ages: RP-2014 Disabled Male -2(select rates in first three years, regardless of age)
Disabled Retirees -- Females
Current: Age < 70: 1.5% at age 40 & Less graded to 2.25% at age 70Age > 70: RP-2000 Female White Collar +6 at age 70 smoothed to +2 at age 80(select rates in first three years, regardless of age)
Proposed: All Ages: RP-2014 Disabled Female -2(select rates in first three years, regardless of age)
Active Members -- Males
Current: RP-2000 Healthy Male White Collar -4 Projected to 2025 to age 70 smoothed to -3 at age 90
Proposed: RP-2014 Healthy Male White Collar Employee set back 2 years
Active Members -- Females
Current: RP-2000 Healthy Female White Collar -6 Projected to 2025 to age 75 smoothed to -2 at age 90
Proposed: RP-2014 Healthy Female White Collar Employee set back 2 years
Attachment 1 Regular Meeting - Item 3
February 1, 2017
TRB102

Experience Analysis (2010-2015) California State Teachers’ Retirement System
This work product was prepared solely for CalSTRS for the purposes described herein and may not be appropriate to use for other purposes. Milliman does not intend to benefit and assumes no duty or liability to other parties who receive this work. Milliman recommends that third parties be aided by their own actuary or other qualified professional when reviewing the Milliman work product.
81
ctrj0291.docx
Appendix A-2: Cash Balance Benefit Program Actuarial Methods and Assumptions
This section of the report discloses the actuarial methods and assumptions used in the Actuarial Valuation of CBB Program. These methods and assumptions have been chosen on the basis of recent experience of the DB Program and on current expectations as to future economic conditions.
The assumptions are intended to estimate the future experience of the members of the CBB Program and of the CBB Program itself in areas that affect the projected benefit flow and anticipated investment earnings. Any variations in future experience from that expected from these assumptions will result in corresponding changes in estimated costs of the CBB Program's benefits.
Actuarial Cost Method
The accruing costs of all benefits are measured by the Traditional Unit Credit Actuarial Cost Method. Under this method, the projected benefits of each individual member are allocated by a consistent formula to valuation years. The actuarial present value of future projected benefits allocated to the current year is called the Normal Cost. The actuarial present value of future projected benefits allocated to periods prior to the valuation year is called the Actuarial Obligation.
The Actuarial Obligation is equal to the accumulated account balances and the Normal Cost is equal to the total annual contribution.
Asset Valuation Method
The assets are valued at Fair Market Value.
Actuarial Assumptions
The Actuarial Standards Board has adopted Actuarial Standard of Practice No. 27, Selection of Economic Assumptions for Measuring Pension Obligations. This Standard provides guidance on selecting economic assumptions under defined benefit retirement programs such as the System. In our opinion, the economic assumptions have been developed in accordance with the Standard.
The Actuarial Standards Board has adopted Actuarial Standard of Practice No. 35, Selection of Demographic and Other Noneconomic Assumptions for Measuring Pension Obligations. This Standard provides guidance on selecting demographic assumptions under defined benefit retirement programs such as the System. In our opinion, the demographic assumptions have been developed in accordance with the Standard.
The assumptions are intended to estimate the future experience of the members of the CBB Program and of the System itself in areas that affect the projected benefit flow and anticipated investment earnings. Any variations in future experience from that expected from these assumptions will result in corresponding changes in estimated costs of the Program's benefits.
The demographic assumptions are listed in Table A-2.1 and illustrated at selected ages in Table A-2.2.
Attachment 1 Regular Meeting - Item 3
February 1, 2017
TRB103

Experience Analysis (2010-2015) California State Teachers’ Retirement System Appendix A
This work product was prepared solely for CalSTRS for the purposes described herein and may not be appropriate to use for other purposes. Milliman does not intend to benefit and assumes no duty or liability to other parties who receive this work. Milliman recommends that third parties be aided by their own actuary or other qualified professional when reviewing the Milliman work product.
82
ctrj0291.docx
Table A-2.1 List of Major Valuation Assumptions for CBB Program
I. Economic Assumptions
A. Investment Return 6.75% (net of investment and administrative expenses)
B. Interest on Member Accounts 6.75%
C. Wage Growth 3.50%
D. Inflation 2.75%
E. Standard Deviation of Portfolio 13.00%
II. Demographic Assumptions
A. Mortality(1)
Retired & - Male Beneficiary
2016 CalSTRS Retired Male Table A-2.2
- Female 2016 CalSTRS Retired Female Table A-2.2
Disabled - Male RP-2014 Disabled Retiree Male set back 2 years
Table A-2.2
- Female RP-2014 Disabled Retiree Female set back 2 years (select rates in first three years for both Males and Females)
Table A-2.2
1. All proposed tables use 110% of the MP-2016 Ultimate Projection Scale, except projections scale does not apply to select rates. The combined base tables and projection scale specified contain a margin for expected future mortality improvement. See Table A.9 of this report for a key to the custom mortality tables used for CalSTRS.
Note: Assumptions for active members do not apply to the CBB Program valuation, as each active and inactive member’s liabilities are equal to their account balance.
Attachment 1 Regular Meeting - Item 3
February 1, 2017
TRB104
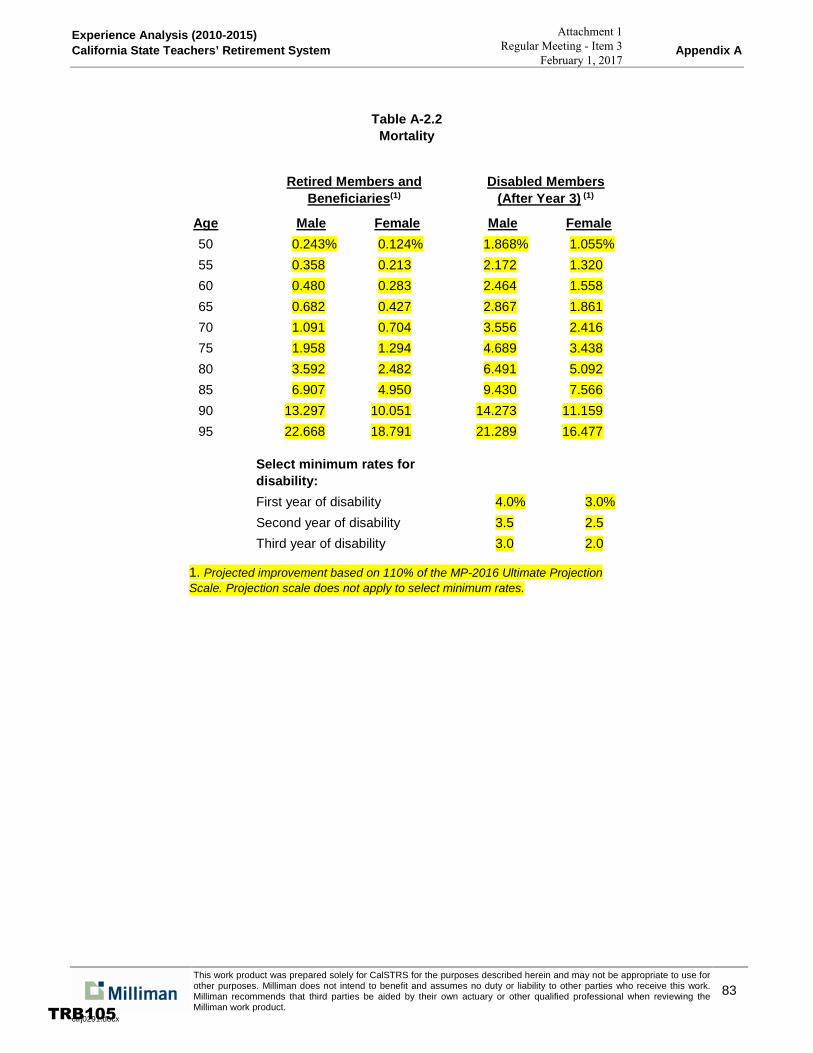
Experience Analysis (2010-2015) California State Teachers’ Retirement System Appendix A
This work product was prepared solely for CalSTRS for the purposes described herein and may not be appropriate to use for other purposes. Milliman does not intend to benefit and assumes no duty or liability to other parties who receive this work. Milliman recommends that third parties be aided by their own actuary or other qualified professional when reviewing the Milliman work product.
83
ctrj0291.docx
Table A-2.2 Mortality
Retired Members and Beneficiaries(1)
Disabled Members (After Year 3) (1)
Age Male Female Male Female 50 0.243% 0.124% 1.868% 1.055% 55 0.358 0.213 2.172 1.320 60 0.480 0.283 2.464 1.558 65 0.682 0.427 2.867 1.861 70 1.091 0.704 3.556 2.416 75 1.958 1.294 4.689 3.438 80 3.592 2.482 6.491 5.092 85 6.907 4.950 9.430 7.566 90 13.297 10.051 14.273 11.159 95 22.668 18.791 21.289 16.477
Select minimum rates for disability:
First year of disability 4.0% 3.0% Second year of disability 3.5 2.5 Third year of disability 3.0 2.0
1. Projected improvement based on 110% of the MP-2016 Ultimate Projection Scale. Projection scale does not apply to select minimum rates.
Attachment 1 Regular Meeting - Item 3
February 1, 2017
TRB105

This work product was prepared solely for CalSTRS for the purposes described herein and may not be appropriate to use for other purposes. Milliman does not intend to benefit and assumes no duty or liability to other parties who receive this work. Milliman recommends that third parties be aided by their own actuary or other qualified professional when reviewing the Milliman work product.
84
ctrj0291.docx
This page intentionally left blank.
Attachment 1 Regular Meeting - Item 3
February 1, 2017
TRB106

Experience Analysis (2010-2015) California State Teachers’ Retirement System
This work product was prepared solely for CalSTRS for the purposes described herein and may not be appropriate to use for other purposes. Milliman does not intend to benefit and assumes no duty or liability to other parties who receive this work. Milliman recommends that third parties be aided by their own actuary or other qualified professional when reviewing the Milliman work product.
85
ctrj0291.docx
Appendix A-3: Defined Benefit Supplement Program Actuarial Methods and Assumptions
This section of the report discloses the actuarial methods and assumptions used in the Actuarial Valuation of DBS Program. These methods and assumptions have been chosen on the basis of recent experience of the DB Program and on current expectations as to future economic conditions.
The assumptions are intended to estimate the future experience of the members of the DBS Program and of the DBS Program itself in areas that affect the projected benefit flow and anticipated investment earnings. Any variations in future experience from that expected from these assumptions will result in corresponding changes in estimated costs of the DBS Program's benefits.
Actuarial Cost Method The accruing costs of all benefits are measured by the Traditional Unit Credit Actuarial Cost Method. Under this method, the projected benefits of each individual member are allocated by a consistent formula to valuation years. The actuarial present value of future projected benefits allocated to the current year is called the Normal Cost. The actuarial present value of future projected benefits allocated to periods prior to the valuation year is called the Actuarial Obligation. The Actuarial Obligation is equal to the accumulated account balances and the Normal Cost is equal to the total annual contribution.
Asset Valuation Method
The assets are valued at Fair Market Value.
Actuarial Assumptions
The Actuarial Standards Board has adopted Actuarial Standard of Practice No. 27, Selection of Economic Assumptions for Measuring Pension Obligations. This Standard provides guidance on selecting economic assumptions under defined benefit retirement programs such as the System. In our opinion, the economic assumptions have been developed in accordance with the Standard. The Actuarial Standards Board has adopted Actuarial Standard of Practice No. 35, Selection of Demographic and Other Noneconomic Assumptions for Measuring Pension Obligations. This Standard provides guidance on selecting demographic assumptions under defined benefit retirement programs such as the System. In our opinion, the demographic assumptions have been developed in accordance with the Standard.
The assumptions are intended to estimate the future experience of the members of the DBS Program and of the System itself in areas that affect the projected benefit flow and anticipated investment earnings. Any variations in future experience from that expected from these assumptions will result in corresponding changes in estimated costs of the Program's benefits. The demographic assumptions are listed in Table A-3.1 and illustrated at selected ages in Table A-3.2.
Attachment 1 Regular Meeting - Item 3
February 1, 2017
TRB107

Experience Analysis (2010-2015) California State Teachers’ Retirement System Appendix A
This work product was prepared solely for CalSTRS for the purposes described herein and may not be appropriate to use for other purposes. Milliman does not intend to benefit and assumes no duty or liability to other parties who receive this work. Milliman recommends that third parties be aided by their own actuary or other qualified professional when reviewing the Milliman work product.
86
ctrj0291.docx
Table A-3.1 List of Major Valuation Assumptions for DBS Program
I. Economic Assumptions
A. Investment Return 7.25% (net of investment and administrative expenses)
B. Interest on Member Accounts 7.25%
C. Wage Growth 3.50%
D. Inflation 2.75%
E. Standard Deviation of Portfolio 15.00%
II. Demographic Assumptions
A. Mortality(1)
Retired & - Male Beneficiary
2016 CalSTRS Retired Male Table A-3.2
- Female 2016 CalSTRS Retired Female Table A-3.2
Disabled - Male RP-2014 Disabled Retiree Male set back 2 years
Table A-3.2
- Female RP-2014 Disabled Retiree Female set back 2 years (select rates in first three years for both Males and Females)
Table A-3.2
1. All proposed tables use 110% of the MP-2016 Ultimate Projection Scale. The combined base tables and projection scale specified contain a margin for expected future mortality improvement. See Table A.9 of this report for a key to the custom mortality tables used for CalSTRS.
Note: Assumptions for active members do not apply to the DBS Program valuation, as each active and inactive member’s liabilities are equal to their account balance.
Attachment 1 Regular Meeting - Item 3
February 1, 2017
TRB108

Experience Analysis (2010-2015) California State Teachers’ Retirement System Appendix A
This work product was prepared solely for CalSTRS for the purposes described herein and may not be appropriate to use for other purposes. Milliman does not intend to benefit and assumes no duty or liability to other parties who receive this work. Milliman recommends that third parties be aided by their own actuary or other qualified professional when reviewing the Milliman work product.
87
ctrj0291.docx
Table A-3.2 Mortality
Retired Members and Beneficiaries(1)
Disabled Members (After Year 3) (1)
Age Male Female Male Female 50 0.243% 0.124% 1.868% 1.055% 55 0.358 0.213 2.172 1.320 60 0.480 0.283 2.464 1.558 65 0.682 0.427 2.867 1.861 70 1.091 0.704 3.556 2.416 75 1.958 1.294 4.689 3.438 80 3.592 2.482 6.491 5.092 85 6.907 4.950 9.430 7.566 90 13.297 10.051 14.273 11.159 95 22.668 18.791 21.289 16.477
Select minimum rates for disability:
First year of disability 4.0% 3.0% Second year of disability 3.5 2.5 Third year of disability 3.0 2.0
1. Projected improvement based on 110% of the MP-2016 Ultimate Projection Scale. Projection scale does not apply to select minimum rates.
Attachment 1 Regular Meeting - Item 3
February 1, 2017
TRB109

California State Teachers’ Retirement System
Audit of Experience Analysis July 1, 2010 – June 30, 2015 Produced by Cheiron
February 2017 Meeting
Attachment 2 Regular Meeting - Item 3
February 1, 2017
TRB110

Table of Contents Section Page Section I Executive Summary .................................................................................................1 Section II Certification .............................................................................................................2 Section III Economic Assumptions ...........................................................................................3 Section IV Salary Increases Due to Promotion and Longevity..................................................9 Section V Demographic Methodology ...................................................................................13 Section VI Mortality ................................................................................................................14 Section VII Service Retirement .................................................................................................23 Section VIII Disability Retirement .............................................................................................27 Section IX Other Terminations of Employment ......................................................................30 Section X Probability of Refund Upon Vested Termination ..................................................32 Section XI Actuarial Methods and Miscellaneous Assumptions .............................................35 Section XII Review of Processes and Documentation ..............................................................39 Appendices Appendix A Glossary of Terms ..................................................................................................41
Attachment 2 Regular Meeting - Item 3
February 1, 2017
TRB111

CALIFORNIA STATE TEACHERS’ RETIREMENT SYSTEM AUDIT OF EXPERIENCE ANALYSIS – JULY 1, 2010 TO JUNE 30, 2015
SECTION I – EXECUTIVE SUMMARY
1
Summary of Findings Overall, we found the recommendations made by Milliman in the Experience Analysis from July 1, 2010 to June 30, 2015 to be reasonable, and we agree with the rationales and processes that led to their recommendations. As part of our audit, we reviewed the raw demographic data provided by CalSTRS, and found that our independent analysis of the System’s experience matched Milliman’s within a reasonable range, and generally supported their proposed assumptions. The following summarizes our key observations and recommendations (described in greater detail in this report), which we offer for Milliman and CalSTRS to consider in performing the next experience analysis:
• Consider developing base mortality tables using benefit-weighted CalSTRS experience, rather than adjusting standard tables.
• Reconsider (or provide additional information to support) the use of a select and ultimate assumption for predicting mortality experience for disabled retirees and for adjusting certain optional benefit forms. Alternatively, we recommend adjusting the select and ultimate assumptions to reflect the partial credibility of the data.
• Review the retirement assumptions at various service levels, especially those with 25 through 29 years of service, and the 2 percent at 62 rates.
• Review the methodology used to offset the termination decrements for rehires and consider whether the assumption should be based on attained or entry age as well as service.
• Review the methodology proposed by Milliman to simplify the calculation of the optional factors when using generational mortality assumptions.
We appreciate the time spent by Milliman to explain details of their methods and reconcile any discrepancies between our analyses. The details in the following sections are intended to support the findings described above as well as the verification of the reasonability of the assumptions proposed by Milliman.
Attachment 2 Regular Meeting - Item 3
February 1, 2017
TRB112

CALIFORNIA STATE TEACHERS’ RETIREMENT SYSTEM AUDIT OF EXPERIENCE ANALYSIS – JULY 1, 2010 TO JUNE 30, 2015
SECTION II – CERTIFICATION
2
The purpose of this report is to present the results of our independent replication and review of the experience analysis performed by Milliman for the California State Teachers’ Retirement System (CalSTRS). The experience analysis covers experience from July 1, 2010 through June 30, 2015. This report is for the use of CalSTRS in selecting methods and assumptions for the funding valuations of the Defined Benefit Program, the Cash Balance Benefit Program, and the Defined Benefit Supplement Program. In preparing our report, we relied on information (some oral and some written) supplied by CalSTRS. This information includes, but is not limited to, the plan provisions and membership data. We performed an informal examination of the obvious characteristics of the data for reasonableness and consistency in accordance with Actuarial Standard of Practice No. 23. To the best of our knowledge, this report and its contents have been prepared in accordance with generally recognized and accepted actuarial principles and practices that are consistent with the Code of Professional Conduct and applicable Actuarial Standards of Practice set out by the Actuarial Standards Board. Furthermore, as credentialed actuaries, we meet the Qualification Standards of the American Academy of Actuaries to render the opinion contained in this report. This report does not address any contractual or legal issues. We are not attorneys and our firm does not provide any legal services or advice. This report was prepared for CalSTRS for the purposes described herein. Other users of this report are not intended users as defined in the Actuarial Standards of Practice, and Cheiron assumes no duty or liability to any other user. Fiona Liston, FSA, EA, MAAA Principal Consulting Actuary William R. Hallmark, ASA, EA, FCA, MAAA Graham A. Schmidt, ASA, EA, FCA, MAAA Consulting Actuary Consulting Actuary
Attachment 2 Regular Meeting - Item 3
February 1, 2017
TRB113

CALIFORNIA STATE TEACHERS’ RETIREMENT SYSTEM AUDIT OF EXPERIENCE ANALYSIS – JULY 1, 2010 TO JUNE 30, 2015
SECTION III – ECONOMIC ASSUMPTIONS
3
Price Inflation Milliman recommended a reduction in the assumed rate of inflation from 3.00 percent to 2.75 percent in the Experience Analysis. We concur with the change as well as the rationale and process that led to the recommendation. In their report, Milliman indicated that current market prices (as of December 2016) show a break-even inflation rate of approximately 2.1 percent over the next 30 years. We concur with their calculation of the break-even inflation rate, the difference between the yield of inflation-indexed versus non-inflation indexed 30-year Treasury securities, and note that it is still significantly lower than the recommended assumption of 2.75 percent. However, market indicators of inflation can be quite volatile; the spread between the securities described above increased by approximately 50 basis points during 2016 alone. We also note that the latest survey of 10-year inflation forecasts published by the Federal Reserve Bank of Philadelphia shows 34 professional forecasts ranging from 1.74 percent to 2.90 percent with a median forecast of 2.22 percent. Milliman’s proposed assumption falls within this range. We recommend that at the time of the next review of economic assumptions, if the markets and forecasters continue to indicate lower expectations of future inflation, Milliman and the Board may wish to consider further reductions in the assumption. Wage Growth Milliman recommended maintaining an assumption that wages will grow at a rate of 0.75 percent above inflation over the long term. This assumption is used to project base wage growth for individuals, as well as to project the growth in overall payroll. Overall, we concur with the assumption as well as the rationale and process that led to the recommendation. In particular, we agree that wages are likely to be correlated with overall U.S. price inflation, as it is reasonable to expect that U.S. and California CPI increases will be highly correlated over the long term. We also agree that wages for CalSTRS members can be expected to grow at a level above that of price inflation, though at a lower rate than projected from some data sources. Milliman cites one projection, from the Office of the Chief Actuary of the Social Security Administration, that indicates a significantly higher estimate (1.2 percent per year) of long-term real wage growth above price inflation than reflected in the current 0.75 percent assumption. However, we note that the Social Security Administration (SSA) assumption, as well as the data sources cited by Milliman on historical wage growth, are based on increases in mean wages. Over the past 25 years, mean real wage growth (as measured by the SSA) averaged 0.77 percent per year. However, over the same time period the increase in the median real wage was only 0.42percent per year, as much of the growth in wages was clustered at the top end of the wage scale. Median real weekly non-farm wages have increased by only 0.21 percent from 1985-2015
Attachment 2 Regular Meeting - Item 3
February 1, 2017
TRB114
CALIFORNIA STATE TEACHERS’ RETIREMENT SYSTEM AUDIT OF EXPERIENCE ANALYSIS – JULY 1, 2010 TO JUNE 30, 2015
SECTION III – ECONOMIC ASSUMPTIONS
4
and by 0.24 percent from 2005-2015, based on the Bureau of Labor Statistics (BLS) Current Population Survey. We believe this may explain some, though not necessarily all, of the lower rate of real wage increases over the past 30 years by CalSTRS members compared to the national average, since the CalSTRS membership is not likely to include employees at the highest levels of the U.S. wage scale. We do have one recommendation related to the growth in wages for some members. Milliman noted that members hired in 2013 or later are subject to the provisions of the Public Employee Pension Reform Act (PEPRA), which includes a more restrictive definition of creditable compensation. Milliman concluded that the difference in overall payroll growth as a result of the modified definition of compensation is expected to be negligible (0.02 percent per year), and we do not dispute this conclusion. However, we also note that PEPRA applies an individual cap on pensionable compensation, which is subject to future indexation based on the increase in the CPI-U. We would therefore expect that the growth in the compensation cap would grow at the same rate as price inflation, not reflecting the 0.75 percent real wage growth assumption identified above. We recommend that Milliman specify in their valuation report (and in future experience analyses), what assumption is used to project the growth in the pensionable compensation cap. We also encourage Milliman to consider and disclose whether the slower growth in the compensation cap is expected to have any significant impact in the long-term growth in overall pensionable payroll. Investment Return Milliman recommended a 0.25 percent reduction in the investment return assumptions used by CalSTRS: from 7.50 percent to 7.25 percent for the DB and DBS Programs, and from 7.00 percent to 6.75 percent for the CBB Program, net of administrative and investment-related expenses. Milliman also stated that alternative assumptions, either 0.25 percent lower or higher than the recommended assumptions, would also be reasonable. We concur with the change in the recommended rates and the reasonability of the alternative assumptions, as well as the rationale and process that led to the recommendation. We reviewed the documentation referred to by Milliman in their analysis from the June 2015 and November 2015 Investment Committee meetings, and concluded that the mappings and application of the capital market assumptions onto the asset classes reflected in the target asset allocation (including the Risk Mitigation Strategies) appear reasonable. We verified the adjustments made for administrative expenses, and agreed with Milliman’s conclusion that any adjustments for additional investment expenses should be expected to be minimal. We also agree that a reduction in the price inflation component of the capital market expectations would generally result in a similar (though not necessarily identical) reduction in the overall nominal investment return expectation.
Attachment 2 Regular Meeting - Item 3
February 1, 2017
TRB115

CALIFORNIA STATE TEACHERS’ RETIREMENT SYSTEM AUDIT OF EXPERIENCE ANALYSIS – JULY 1, 2010 TO JUNE 30, 2015
SECTION III – ECONOMIC ASSUMPTIONS
5
Finally, we also ran the target allocation, as described in the November 2015 Investment Committee meeting materials, through the 2016 capital market assumptions (based on a 7-10 year time horizon) of several investment consultants not included in the set of consultants listed in the June 2015 Investment Committee materials (which included those of six outside consultants, in addition to PCA and Meketa). As Milliman noted in their review, there is not always a perfect one-to-one mapping of the asset classes described in the CalSTRS target allocation with those included in the capital market assumptions for each consultant, in particular for the subclasses included in the Risk Mitigation Strategies. However, we believe that the impact of any differences in the expectations for these classes should not significantly affect the overall portfolio expectations. The table below shows the results of this analysis:
We note that Milliman’s current and recommended real expected return for the CalSTRS DB and DBS portfolios (4.50 percent) is very close to the average real return expectation for these three consultant’s (after deducting 10 basis points for administrative expenses). We also note that the range of expectations lends support to Milliman’s conclusion that alternative investment return assumptions, both higher and lower, are reasonable. We also modeled the impact on the expected returns based on the capital market assumptions of these consultants, assuming the private equity and real estate classes were excluded from the asset allocation (with the allocations to the other classes increased proportionately to make up the difference). The impact was to reduce the average expected real return by 0.43 percent for the portfolio, slightly less than the 0.60 percent adjustment reported by Milliman based on CalSTRS’ capital market assumptions. However, the impact for one of the consultants in our survey was considerably lower than the other two (0.18 percent reduction, versus an average reduction of 0.56 percent for the other two), which was based on that consultant having a much lower expected return for the real estate class. Based on this information, we believe Milliman’s recommendation to use an expected return for the CBB Program 50 basis points lower than the return for the entire CalSTRS investment portfolio to be reasonable. [This is subject to confirmation that the asset returns credited to the CBB Program are based on the overall portfolio, excluding the private equity and real estate classes as described above; we could not find any documentation to support this policy in the Milliman report or in the CalSTRS Investment Policy contained in the Policy Manual.] Typically, we recommend that the discussion of the investment return assumption in an experience analysis contain some discussion of the likelihood of different investment returns for
StandardConsultant Nominal Inflation Real Deviation
Consultant 1 6.61% 2.50% 4.11% 14.05%Consultant 2 7.14% 2.20% 4.94% 11.59%Consultant 3 7.26% 1.98% 5.28% 11.97%
Average 7.00% 2.23% 4.77% 12.53%
CalSTRS Target Portfolio Return Expectations
Attachment 2 Regular Meeting - Item 3
February 1, 2017
TRB116

CALIFORNIA STATE TEACHERS’ RETIREMENT SYSTEM AUDIT OF EXPERIENCE ANALYSIS – JULY 1, 2010 TO JUNE 30, 2015
SECTION III – ECONOMIC ASSUMPTIONS
6
the target portfolio, not just the average expected return. Generally, this will take the form of a probability distribution of the expected returns. We note that Milliman does mention the likelihood (47 percent) of achieving the current expected return given CalSTRS’ 2015 capital market assumptions, but we would encourage them to include more information on the distribution and likelihood of potential returns in future experience analyses. Interest on Member Accounts Milliman recommended reductions in the assumed rate used to credit future member account balances: from 4.50 percent to 3.00 percent for the DB Program, and from 7.50 percent / 7.00 percent to 7.25 percent / 6.75 percent for the DBS and CBB Programs, respectively. We concur with these changes as well as the rationale and process that led to the recommendations. For the DB Program, the Board’s policy is currently to credit interest to the member contribution accounts based on a two-year Treasury rate. We agree with Milliman’s observation that the return on two-year Treasuries has been less than inflation over most of the past 10 years, and we agree with their recommendation that this experience should be only partially reflected in the forward-looking assumption, by adopting a long-term assumption which includes a low, but still slightly positive, real expected return on two-year Treasuries of 0.25 percent above the long-term inflation assumption. We suggest that in the next experience analysis, Milliman could include additional data to support their recommendation, in particular by showing the expected (real) return on a short-term Treasury asset class, as provided by the CalSTRS Investment Office and/or their external investment consultants. For the CBB and DBS Programs, the Board’s policy is currently to credit interest to member accounts based on a statutory minimum (tied to the 30-year Treasury note), plus an additional earnings credit. The additional earnings credit is set by Board policy, and is currently based on a procedure that compares the funded ratio of the Plan to certain thresholds, based on the assumed standard deviation of the investment portfolio. Milliman states that the “long-term intention is to allocate all of the investment earnings to the member accounts. Therefore, the assumed long-term credit to member accounts should be the same as the recommended investment return assumption…” We believe this approach to be reasonable, as the Board’s policy crediting policy could be adjusted by future Board action if the current policy were not meeting the long-term intention of crediting the investment returns to the member accounts. Actuarial Standard of Practice No. 4 states that the actuary “should consider using alternative valuation procedures, such as stochastic modeling, option-pricing techniques, or deterministic procedures in conjunction with assumptions that are adjusted to reflect the impact of variations in experience from year to year,” and the Statement specifically includes investment return gain-sharing procedures and cash balance crediting provisions as examples of plan provisions which may be difficult to measure without the use of such procedures.
Attachment 2 Regular Meeting - Item 3
February 1, 2017
TRB117

CALIFORNIA STATE TEACHERS’ RETIREMENT SYSTEM AUDIT OF EXPERIENCE ANALYSIS – JULY 1, 2010 TO JUNE 30, 2015
SECTION III – ECONOMIC ASSUMPTIONS
7
We note that the use of a stochastic modeling technique (or other alternative valuation procedure) may, though not necessarily, result in an average assumed crediting rate that differs from the expected return on the CBB or DBS assets, based on the current additional earnings crediting policy set by the Board. However, if the interest crediting assumption were modified to be different than the assumed return on assets (and thus the discount rate), it would have a feedback effect that would result in a changed funded ratio, and therefore modified additional earnings crediting. More importantly, the Standard of Practice also states that “the actuary should use professional judgment based on the purpose of the measurement and other relevant factors,” and we believe Milliman’s reliance on the long-term intention and nature of the program constitutes a reasonable exercise of professional judgment. However, in future analyses Milliman may wish to disclose whether alternative valuation procedures for determining the interest crediting assumption were considered. CBB and DBS Program Standard Deviation Milliman recommended assumed standard deviation rates for the assets of the DBS and CBB Programs (to be used in the additional earning crediting policies as described above) of 15.0 percent and 13.0 percent, respectively. We find these assumptions, as well as the process that led to the recommendations, to be reasonable. As part of our analysis of the investment return, we calculated the expected portfolio standard deviation for each of the three outside investment consultants in our survey, for both the overall CalSTRS portfolio and the CalSTRS portfolio excluding the private equity and real estate asset classes. The average standard deviations across the three consultants were 12.5 percent and 12.9 percent, based on the total and CBB portfolios, respectively, before adjusting for the value of the SBMA guarantee. We note that although the standard deviations are lower than that shown in the Milliman report (13.0 percent), we are not suggesting it is necessary to substitute the capital market assumptions of these other consultants for those of the CalSTRS investment office or the CalSTRS outside consultants, and we believe the results are close enough to the standard deviations shown in the Milliman report to support their recommendation. In order to determine the final recommended standard deviation for the DBS portfolio, Milliman included an adjustment to account for the fact that a portion of the overall return on CalSTRS assets will be used to cover the guaranteed return on the SBMA assets (stated by Milliman to be equal to the valuation assumption, under state law). We performed a similar analysis to that described by Milliman: computing the expected impact on the volatility of the non-SBMA assets, using a stochastic simulation of the overall portfolio returns and holding the return on the SBMA portion of the portfolio constant. Our calculated impact ranged from an average increase in the non-SBMA portfolio standard deviation of approximately 0.9 percent if the SBMA assets represent 6 percent of the overall CalSTRS portfolio (Milliman’s estimate of the current SBMA percentage of overall assets), up to approximately 2.4 percent if the SBMA assets represent 15 percent of the overall portfolio (Milliman’s estimate in 30 years).
Attachment 2 Regular Meeting - Item 3
February 1, 2017
TRB118

CALIFORNIA STATE TEACHERS’ RETIREMENT SYSTEM AUDIT OF EXPERIENCE ANALYSIS – JULY 1, 2010 TO JUNE 30, 2015
SECTION III – ECONOMIC ASSUMPTIONS
8
Milliman’s adjustment of the impact of the SBMA guarantee falls within this range, but we recommend that they explicitly state what level of SBMA assets they used to generate their adjustment of a 2 percent increase in the standard deviation for the DBS assets. We also recommend that Milliman explicitly state whether they have a different expected standard deviation for the overall CalSTRS portfolio (without adjusting for the SBMA guarantee) versus that for the CBB allocation, as it appears from their report that the expected volatility for both portfolios is roughly the same (13.0 percent).
Attachment 2 Regular Meeting - Item 3
February 1, 2017
TRB119

CALIFORNIA STATE TEACHERS’ RETIREMENT SYSTEM AUDIT OF EXPERIENCE ANALYSIS – JULY 1, 2010 TO JUNE 30, 2015
SECTION IV – SALARY INCREASES DUE TO PROMOTION AND LONGEVITY
9
Based on our independent analysis of salary increases due to promotion and longevity (merit increases) as summarized below, we believe Milliman’s proposed assumptions are reasonable. Estimated Actual Wage Inflation The table below shows the average earnable salary in each year of the experience analysis and the rate of increase between years. Over the period, the average annual increase was 1.6 percent.
Milliman notes that over the period, the average service also increased so part of the average increase is due to the increase in service. As a result, Milliman adjusted the average increase to 1.1 percent. We concur that the adjustment is reasonable. Salary Increases Due to Promotion and Longevity For our independent analysis of merit salary increases, we first determined the average merit increase for each year of service for each fiscal year by subtracting the actual increase shown in the table above from the average nominal increase for members who were active at both the beginning and end of the fiscal year. We computed a weighted average for the five-year period by adjusting salaries for each fiscal year to the last fiscal year. Finally, we adjusted the average by increasing it 0.5 percent to reflect the adjustment to actual wage inflation for the change in demographics applied by Milliman. The charts on the following three pages show our independently calculated average observed rates to the current and proposed assumptions.
Development of Actual Wage Inflation
Valuation Average Earnable Average ActualYear Count Service Salaries Salary Increase
2010 441,484 10.45 28,326,003,570$ 64,161$ 2011 429,531 10.78 27,522,112,217$ 64,075$ -0.1%2012 421,434 11.05 27,287,056,211$ 64,748$ 1.1%2013 416,572 11.31 27,317,536,911$ 65,577$ 1.3%2014 420,786 11.39 28,313,396,978$ 67,287$ 2.6%2015 429,460 11.33 29,889,018,352$ 69,597$ 3.4%
Attachment 2 Regular Meeting - Item 3
February 1, 2017
TRB120

CALIFORNIA STATE TEACHERS’ RETIREMENT SYSTEM AUDIT OF EXPERIENCE ANALYSIS – JULY 1, 2010 TO JUNE 30, 2015
SECTION IV – SALARY INCREASES DUE TO PROMOTION AND LONGEVITY
10
Attachment 2 Regular Meeting - Item 3
February 1, 2017
TRB121

CALIFORNIA STATE TEACHERS’ RETIREMENT SYSTEM AUDIT OF EXPERIENCE ANALYSIS – JULY 1, 2010 TO JUNE 30, 2015
SECTION IV – SALARY INCREASES DUE TO PROMOTION AND LONGEVITY
11
Attachment 2 Regular Meeting - Item 3
February 1, 2017
TRB122

CALIFORNIA STATE TEACHERS’ RETIREMENT SYSTEM AUDIT OF EXPERIENCE ANALYSIS – JULY 1, 2010 TO JUNE 30, 2015
SECTION IV – SALARY INCREASES DUE TO PROMOTION AND LONGEVITY
12
Based on our independent analysis, we believe the proposed merit salary increase assumptions are reasonable. We note that the average actual rates of merit salary increases we observed in the first year or two of service are generally higher than those observed or proposed by Milliman. However, the merit salary assumptions in these years are not expected to have a material impact on the Plan’s overall projected benefits, and we know from experience that there can be difficulties and inconsistencies in computing the actual rates of salary increase for members at the very beginning of their careers.
Attachment 2 Regular Meeting - Item 3
February 1, 2017
TRB123

CALIFORNIA STATE TEACHERS’ RETIREMENT SYSTEM AUDIT OF EXPERIENCE ANALYSIS – JULY 1, 2010 TO JUNE 30, 2015
SECTION V – DEMOGRAPHIC METHODOLOGY
13
Demographic Assumption Analysis Audit Methodology For the demographic assumptions in the experience analysis, we collected the same data used by Milliman in their analysis. We analyzed the data to independently determine the number of actual decrements by type and the number of exposures to those decrements. Cheiron uses a different methodology than Milliman to determine the exposures and observed probability of a given decrement when multiple decrements compete with each other. The different methodologies should produce similar, though not identical, numbers of expected decrements and similar assumptions. The first part of our analysis is to simply compare the number of actual decrements for each type of decrement and the number of expected decrements for the current assumption. If our independent analysis matches Milliman’s analysis within a reasonable range, CalSTRS can be confident that the basis on which assumptions are proposed is valid. There will inevitably be differences between our calculations and those produced by Milliman. For actual decrements, some are clear-cut, but there are always data issues where, for example, an active member one year is reported as inactive the next year and the type of decrement is not clear. There are also members who are eligible for retirement, but decrement as a termination instead of a service retirement. The treatment of these different situations in the data can vary, resulting in differences in the determination of the actual decrements used in the experience analysis. Similar differences in the number of members exposed to each decrement can lead to differences in the number of expected decrements. In the second part of our analysis, we use the observed rates from our independent analysis to develop a 90 percent confidence interval around the observed rate. The true rate during the experience analysis period falls within this range with 90 percent confidence. In general, we believe the assumption should fall within the 90 percent confidence interval unless there is reason to believe that the future experience will vary from the experience during the analysis period. Consequently, we compare the current and proposed assumptions to the confidence intervals to assess whether or not they are reasonable. Finally, for some of the assumptions, we explore whether a different or more refined structure to the assumption may be appropriate.
Attachment 2 Regular Meeting - Item 3
February 1, 2017
TRB124

CALIFORNIA STATE TEACHERS’ RETIREMENT SYSTEM AUDIT OF EXPERIENCE ANALYSIS – JULY 1, 2010 TO JUNE 30, 2015
SECTION VI – MORTALITY
14
Based on our independent analysis of the experience data, we believe the mortality assumptions proposed by Milliman are reasonable. As discussed below, we have a few recommendations to be considered for the next experience analysis. Data Comparison The base mortality rates were analyzed separately by gender for healthy retirees (and beneficiaries), disabled retirees, and active employees. The table below shows the comparison of actual deaths, expected deaths (based on the current assumptions), and the actual-to-expected ratio (A/E ratio) determined by Milliman to the same statistics determined in our independent analysis. There are some minor variations, but all of the A/E ratios are reasonably close. As a result, the data on which Milliman based its recommended assumption appears to be reasonable.
Healthy Annuitants As a rule of thumb, in order to have credible data to develop mortality rates, there should be 1,000 deaths. If there are 1,000 deaths in aggregate, the data is only sufficiently credible to fully adjust the curve of a published mortality table such that the A/E ratio is 100 percent. With over 12,000 male deaths and over 16,000 female deaths, CalSTRS has sufficient data to develop relatively refined tables based solely on its own data. Milliman has chosen to adjust the curves of the RP 2014 white collar mortality table with a different adjustment after age 70 than before age 70. In the future, consideration should be given to developing rates based on grouped ages solely from the CalSTRS data and graduating the rates for individual ages based on the grouped rates. Mortality rates should be studied on a benefits-weighted basis instead of just on counts. Higher income members tend to live longer than lower income members, and higher income members have larger benefits. The liability for a pension plan depends on how long the benefits are paid so
Comparison of Mortality Data
Milliman CheironService Healthy Disabled Active Healthy Disabled Active
MalesActual 12,017 496 807 12,114 505 817 Expected 11,511 527 795 11,595 515 808 A/E Ratio 104% 94% 102% 104% 98% 101%
FemalesActual 16,619 943 1,105 16,808 969 1,124 Expected 16,811 1,023 1,194 17,021 1,018 1,217 A/E Ratio 99% 92% 93% 99% 95% 92%
Attachment 2 Regular Meeting - Item 3
February 1, 2017
TRB125

CALIFORNIA STATE TEACHERS’ RETIREMENT SYSTEM AUDIT OF EXPERIENCE ANALYSIS – JULY 1, 2010 TO JUNE 30, 2015
SECTION VI – MORTALITY
15
if larger benefits are paid longer, that fact needs to be incorporated into the valuation. Milliman’s analysis, however, is based solely on counts. As a teacher retirement system, CalSTRS is relatively homogenous, making a benefits-weighted analysis somewhat less important. We note that the A/E ratios drop about 3 percent when switching to a benefits-weighted analysis. The charts below show the current and proposed assumptions compared to benefits-weighted observed rates and their associated confidence intervals.
Attachment 2 Regular Meeting - Item 3
February 1, 2017
TRB126

CALIFORNIA STATE TEACHERS’ RETIREMENT SYSTEM AUDIT OF EXPERIENCE ANALYSIS – JULY 1, 2010 TO JUNE 30, 2015
SECTION VI – MORTALITY
16
The proposed mortality rates appear to be reasonable, but in the future CalSTRS should consider a benefits-weighted analysis, as well as developing rates based solely on its own data. Disabled Annuitants Milliman proposed select and ultimate mortality rates for disabled retirees with flat mortality rates regardless of age for the first three years following disablement. For the ultimate tables, Milliman recommends the RP-2014 Disabled mortality tables set back two years for males and females. The charts on the next page show the observed rates and 90 percent confidence intervals for groups of ages compared to the current and proposed assumptions for the ultimate mortality rates. The proposed rates appear reasonable although they may understate the actual rates at some older ages.
Attachment 2 Regular Meeting - Item 3
February 1, 2017
TRB127

CALIFORNIA STATE TEACHERS’ RETIREMENT SYSTEM AUDIT OF EXPERIENCE ANALYSIS – JULY 1, 2010 TO JUNE 30, 2015
SECTION VI – MORTALITY
17
With far less than 1,000 deaths in each of the first three years following disablement, there is a question about the credibility of the data for a select assumption. In the charts on the following pages, the observed rates and 90 percent confidence intervals for groups of ages are compared to the current and proposed assumptions for the select year as well as the ultimate proposed assumption. To the extent the ultimate proposed assumption falls within the confidence interval of the observed select rates, there may not be justification for a select assumption.
Attachment 2 Regular Meeting - Item 3
February 1, 2017
TRB128

CALIFORNIA STATE TEACHERS’ RETIREMENT SYSTEM AUDIT OF EXPERIENCE ANALYSIS – JULY 1, 2010 TO JUNE 30, 2015
SECTION VI – MORTALITY
18
Attachment 2 Regular Meeting - Item 3
February 1, 2017
TRB129

CALIFORNIA STATE TEACHERS’ RETIREMENT SYSTEM AUDIT OF EXPERIENCE ANALYSIS – JULY 1, 2010 TO JUNE 30, 2015
SECTION VI – MORTALITY
19
Attachment 2 Regular Meeting - Item 3
February 1, 2017
TRB130

CALIFORNIA STATE TEACHERS’ RETIREMENT SYSTEM AUDIT OF EXPERIENCE ANALYSIS – JULY 1, 2010 TO JUNE 30, 2015
SECTION VI – MORTALITY
20
There is evidence that the mortality rates are higher in the first year after disablement, but the evidence weakens in the second year and is pretty much gone by the third year. In the first select year, the ultimate assumption is clearly below the confidence interval for the observed rates for females and also appears to be generally below the confidence intervals for males. In the second select year, the ultimate rate is below some of the confidence intervals for females, but is within the confidence intervals for males. In the third select year, the ultimate rate is within all of the confidence intervals except for females aged 40 through 49. In future analyses, we suggest that the credibility for a select assumption be explicitly considered and to the extent the data is partially credible, that it be blended with the ultimate rates.
Attachment 2 Regular Meeting - Item 3
February 1, 2017
TRB131

CALIFORNIA STATE TEACHERS’ RETIREMENT SYSTEM AUDIT OF EXPERIENCE ANALYSIS – JULY 1, 2010 TO JUNE 30, 2015
SECTION VI – MORTALITY
21
Active Employees The proposed mortality rates for active employees are based on the RP-2014 white-collar mortality tables set back two years. The charts below show the observed rates and 90 percent confidence intervals compared to the current and proposed assumptions. The proposed assumptions are reasonable.
Improvement Projection Scale We commend Milliman for recommending a change to use generational mortality assumptions. The assumption tables developed serve as a base table and the mortality rates in those tables are projected to improve according to a separately adopted projection scale. As Milliman notes, the latest projection scale from the Society of Actuaries is named MP-2016 and has different
Attachment 2 Regular Meeting - Item 3
February 1, 2017
TRB132

CALIFORNIA STATE TEACHERS’ RETIREMENT SYSTEM AUDIT OF EXPERIENCE ANALYSIS – JULY 1, 2010 TO JUNE 30, 2015
SECTION VI – MORTALITY
22
projection rates by age and year until it converges to a flat rate of 1.0 percent for ages under 85 for years 2032 and later. This method is intended to take the latest historical rates of improvement as a starting point and gradually converge to the ultimate rate over 20 years. There are a number of assumptions in this model that have a subjective component. Milliman recommends simplifying the model and using a flat annual rate of improvement of 1.1 percent. Based on our experience, we believe this assumption is reasonable, but would like to see a little more explanation as to why this assumption was selected as opposed to other reasonable assumptions. The Social Security data referenced by Milliman has been used to justify a wide range of mortality improvement assumptions. In addition, it is not clear from the experience analysis when the improvement scale is first applied. We assume the base tables were developed as of the midpoint of the experience analysis and the improvement scale is applied from that point forward, but Milliman should be explicit in their analysis.”
Attachment 2 Regular Meeting - Item 3
February 1, 2017
TRB133

CALIFORNIA STATE TEACHERS’ RETIREMENT SYSTEM AUDIT OF EXPERIENCE ANALYSIS – JULY 1, 2010 TO JUNE 30, 2015
SECTION VII – SERVICE RETIREMENT
23
Our independent analysis of the service retirement rates proposed by Milliman indicates that in aggregate the assumptions are reasonable. However, we have a number of suggestions for refining the service retirement assumptions in the future. In particular, we did not see sufficient justification for the difference between the rates for members with 25 through 27 years of service from those for members with 28 through 29 years of service. In addition, we suggest some additional service groups be explored for members with less than 25 years of service and for 2 percent at 62 members. Data Comparison Milliman provided us their determination of exposures to service retirement and the actual number of retirements by age for three different service groupings:
• Less than 25 years of service, • 25 through 29 years of service, and • 30 or more years of service.
The table below shows a comparison of the actual retirements and expected retirements under the current assumption from Milliman’s analysis and from our independent analysis.
It should be noted that in our analysis, we treated any member reported as terminating employment while eligible to retire as a service retirement. Excluding these members from actual service retirements would reduce our counts to 15,980 and 38,628 for males and females respectively. Milliman may want to consider how these members are treated in their analysis, recognizing that the appropriate treatment depends on whether termination and retirement assumptions compete in the valuation or not. 30 or More Years of Service The charts on the following page show the observed rates of service retirement and the 90 percent confidence intervals around those rates based on our analysis of the data compared to the current and proposed assumptions for members with 30 or more years of service. Where there is
Comparison of Service Retirement Data
Milliman CheironService <25 25 - 30 30 + Total <25 25 - 30 30 + Total
MalesActual 7,210 2,342 6,583 16,135 8,951 2,407 6,460 17,818 Expected 6,915 1,851 7,174 15,940 6,127 1,886 6,868 14,881 A/E Ratio 104% 127% 92% 101% 146% 128% 94% 120%
FemalesActual 19,153 6,977 12,852 38,982 23,037 6,889 12,435 42,361 Expected 20,099 5,780 14,248 40,127 18,551 5,880 13,440 37,872 A/E Ratio 95% 121% 90% 97% 124% 117% 93% 112%
Attachment 2 Regular Meeting - Item 3
February 1, 2017
TRB134

CALIFORNIA STATE TEACHERS’ RETIREMENT SYSTEM AUDIT OF EXPERIENCE ANALYSIS – JULY 1, 2010 TO JUNE 30, 2015
SECTION VII – SERVICE RETIREMENT
24
insufficient data to calculate a confidence interval, it is shown as extending from 0 percent to 100 percent.
Based on this analysis, we believe the assumptions proposed by Milliman are reasonable. 25 through 29 Years of Service For members with 25 through 27 years of service, Milliman proposed retirement rates equal to 225 percent of the rates for members with less than 25 years of service, and for members with 28 through 29 years of service Milliman proposed retirement rates equal to 125 percent of the rates for members with less than 25 years of service. We did not see an explanation or justification for
Attachment 2 Regular Meeting - Item 3
February 1, 2017
TRB135

CALIFORNIA STATE TEACHERS’ RETIREMENT SYSTEM AUDIT OF EXPERIENCE ANALYSIS – JULY 1, 2010 TO JUNE 30, 2015
SECTION VII – SERVICE RETIREMENT
25
using the rates for members with less than 25 years of service as the basis for these rates as opposed to an analysis of the data for members with 25 through 29 years of service. We also did not see an explanation or justification for the difference between the rates for 25 through 27 years of service and 28 through 29 years of service. We note that a similar comment was made in the audit of the prior experience analysis. The charts below show our analysis of the data for members with 25 through 29 years of service. The charts show the observed rates for members with 25 through 27 years of service, 28 through 29 years of service, and 25 through 29 years of service. The confidence intervals are shown based on the observed rates for 25 through 29 years of service. Finally, the proposed assumptions are shown separately for 25 through 27 years of service and 28 through 29 years of service.
Attachment 2 Regular Meeting - Item 3
February 1, 2017
TRB136

CALIFORNIA STATE TEACHERS’ RETIREMENT SYSTEM AUDIT OF EXPERIENCE ANALYSIS – JULY 1, 2010 TO JUNE 30, 2015
SECTION VII – SERVICE RETIREMENT
26
The difference in retirement rates between members with 25 through 27 years of service and members with 28 through 29 years of service does not appear to warrant separate assumptions and clearly doesn’t differ by as much as the proposed assumptions would indicate. On a weighted average basis, the proposed assumptions are reasonable in aggregate, but for future experience analyses, we strongly recommend that the service retirement assumption for members with 25 through 29 years of service be based on an analysis of the data of those members and consideration be given to not differentiating between the assumptions of those with 25 through 27 years of service versus those with 28 through 29 years of service. Less Than 25 Years of Service Milliman proposed separate service retirement rates for male and female members with less than 25 years of service. We believe these proposed assumptions are reasonable in aggregate, but a preliminary review of the data based on further breakdowns of years of service indicates that future analyses should consider separate assumptions for members with 20 through 24 years of service, 15 through 19 years of service and under 15 years of service. 2 Percent at 62 Members For the 2 percent at 62 members, Milliman correctly points out that there is insufficient data on which to base a retirement assumption and the retirement patterns are likely to be different than for the 2 percent at 60 members. As a result, the proposed rates are based primarily on professional judgment. We differ with some of these judgments. In particular, Milliman proposed the same retirement rates regardless of service, but generally retirement rates do vary by service. Benefits are generally lower (particularly prior to age 62) for the 2 percent at 62 members, and the 2 percent at 60 members receive a career factor adjustment and a longevity bonus after 30 years of service neither of which apply to 2 percent at 62 members. As a result, we would expect the 2 percent at 62 members to retire later and the impact of reaching 30 years of service to be less, but we would still expect the retirement rates to be higher for members with more service. We recommend that service-based retirement rates for 2 percent at 62 members be considered in the next experience analysis. 1990 Benefit Structure We note that there are separate retirement rates for the 1990 benefit structure, and we didn’t see an explanation or justification for these rates in either the experience analysis or the valuation report. We also haven’t analyzed the basis on which these rates should be set, but note that applying a different retirement rate for purposes of the 1990 benefit structure than for the post-1990 benefit structure for the same member can result in some anomalies. The member will not actually retire at separate times for purposes of the 1990 benefit structure and for purposes of the post-1990 benefit structure.
Attachment 2 Regular Meeting - Item 3
February 1, 2017
TRB137

CALIFORNIA STATE TEACHERS’ RETIREMENT SYSTEM AUDIT OF EXPERIENCE ANALYSIS – JULY 1, 2010 TO JUNE 30, 2015
SECTION VIII – DISABILITY RETIREMENT
27
Based on our independent analysis of disability retirement rates as summarized below, we believe Milliman’s proposed assumptions are reasonable. Data Comparison Milliman provided us their determination of exposures to disability retirement and the actual number of disability retirements by age for Coverage A and Coverage B. The table below shows a comparison of the actual disability retirements and expected disability retirements under the current assumption from Milliman’s analysis and from our independent analysis.
The counts and A/E ratios are very close, indicating that the basis for Milliman’s analysis is reasonable. Coverage A The charts on the next page show our analysis of the data for members with Coverage A. The charts show the observed rates and 90 percent confidence intervals for members from age 35 through 59 in five-year age groupings. The proposed assumptions remain within or very close to the confidence intervals at all ages, indicating that the assumptions are reasonable.
Comparison of Disability Data
Milliman CheironService Coverage A Coverage B Total Coverage A Coverage B Total
MalesActual 113 543 656 114 541 655 Expected 130 570 700 132 573 704 A/E Ratio 87% 95% 94% 87% 94% 93%
FemalesActual 311 1,482 1,793 312 1,492 1,804 Expected 389 1,569 1,958 391 1,577 1,968 A/E Ratio 80% 94% 92% 80% 95% 92%
Attachment 2 Regular Meeting - Item 3
February 1, 2017
TRB138

CALIFORNIA STATE TEACHERS’ RETIREMENT SYSTEM AUDIT OF EXPERIENCE ANALYSIS – JULY 1, 2010 TO JUNE 30, 2015
SECTION VIII – DISABILITY RETIREMENT
28
Coverage B The charts on the following page show our analysis of the data for members with Coverage B. The charts show the observed rates and 90 percent confidence intervals for members from age 35 through 69 in five-year age groupings. The proposed assumptions track the pattern of observed experience closely and remain within or very close to the confidence intervals, indicating that the assumptions are reasonable. In the future, CalSTRS may want to consider reductions in the disability rates at the younger ages if the observed experience continues to remain below the assumption.
Attachment 2 Regular Meeting - Item 3
February 1, 2017
TRB139

CALIFORNIA STATE TEACHERS’ RETIREMENT SYSTEM AUDIT OF EXPERIENCE ANALYSIS – JULY 1, 2010 TO JUNE 30, 2015
SECTION VIII – DISABILITY RETIREMENT
29
Attachment 2 Regular Meeting - Item 3
February 1, 2017
TRB140

CALIFORNIA STATE TEACHERS’ RETIREMENT SYSTEM AUDIT OF EXPERIENCE ANALYSIS – JULY 1, 2010 TO JUNE 30, 2015
SECTION IX – OTHER TERMINATIONS OF EMPLOYMENT
30
Data Comparison Milliman provided us their determination of gross terminations, rehires, and net terminations by attained age for various service groups. The table below compares the actual and expected number of net terminations under the current assumption determined by Milliman to our independent analysis for three service groups.
The counts and A/E ratios are very close, indicating that the basis for Milliman’s analysis is reasonable. Service-Based Net Termination Rates Our analysis of the service-based net termination rates indicates that they are reasonable assumptions. The rates for active members terminating employment are offset by rehires of members with the same total service as those terminating. Given the number of rehires in CalSTRS experience, we believe this to be a reasonable approach. It results in a higher liability for active members, but lower actuarial losses for rehires. Age and Service-Based Net Termination Rates In reviewing the data provided by Milliman, we noticed that the net termination rates also varied, sometimes significantly, by attained age. The chart on the next page shows an example of this pattern for females with 10 through 14 years of service.
Comparison of Net Termination Data
Milliman CheironService 1 - 4 5 - 14 15 + Total 1 - 4 5 - 14 15 + Total
MalesActual 6,073 4,955 1,470 12,498 5,319 5,044 1,868 12,231 Expected 7,765 4,882 814 13,460 7,433 4,800 1,053 13,287 A/E Ratio 78% 101% 181% 93% 72% 105% 177% 92%
FemalesActual 12,882 11,310 3,919 28,111 12,443 10,824 4,635 27,902 Expected 18,936 13,125 2,052 34,113 16,919 14,533 2,133 33,585 A/E Ratio 68% 86% 191% 82% 74% 74% 217% 83%
Attachment 2 Regular Meeting - Item 3
February 1, 2017
TRB141

CALIFORNIA STATE TEACHERS’ RETIREMENT SYSTEM AUDIT OF EXPERIENCE ANALYSIS – JULY 1, 2010 TO JUNE 30, 2015
SECTION IX – OTHER TERMINATIONS OF EMPLOYMENT
31
Milliman performed some additional analysis and discovered that the net termination rates did not appear to vary consistently by entry age. As a result, they recommended keeping the assumptions based on service only. The entry age and attained age approaches represent two different methods of addressing net termination rates. The entry age approach attempts to treat the member who terminates and subsequently rehires as if they never left employment. The missing years reduce the projected benefit, approximately offsetting what would otherwise be an increase in the normal cost rate upon rehire. When the member actually terminates, CalSTRS experiences an actuarial gain which is later offset by an actuarial loss when the member is rehired. To the extent the terminations and rehires for different individuals happen in the same year, the gains and losses may offset each other. The attained age approach, on the other hand, attempts to match each termination of employment with a similar rehire. For example, a 40-year old terminating with 10 years of service is offset by a rehire in the same year who is age 40 at the time of rehire and had 10 years of prior service. The actuarial gain from the member terminating should be offset by the actuarial loss of the rehire except to the extent salaries are different. One oddity of this approach is that because of the number of rehires from about age 40 through 45, the analysis shows some negative net termination rates at these ages. Neither method is perfect, and given the time constraints, we recommend that CalSTRS and Milliman consider the advantages and disadvantages of each approach as well as whether it would be materially more accurate to set net termination rates based on attained or entry age as well as service.
Attachment 2 Regular Meeting - Item 3
February 1, 2017
TRB142

CALIFORNIA STATE TEACHERS’ RETIREMENT SYSTEM AUDIT OF EXPERIENCE ANALYSIS – JULY 1, 2010 TO JUNE 30, 2015
SECTION X – PROBABILITY OF REFUND UPON VESTED TERMINATION
32
Based on our independent analysis of net refund rates as summarized below, we believe Milliman’s proposed assumptions are reasonable. Data Comparison Milliman provided us their determination of the actual and expected number of refunds by years of service for five-year entry age groups. The table below shows a comparison of the actual and expected refunds under the current assumption from Milliman’s analysis and from our independent analysis for each of the entry age groups.
Review of Proposed Assumptions The charts on the following pages show our analysis of the refund data for female members. (The analysis for male members showed similar patterns.) The charts show the observed rates and 90 percent confidence intervals for members in five-year entry age and five-year service groupings. The proposed assumptions track the pattern of observed experience and generally remain within or close to the confidence intervals, indicating that the assumptions are reasonable. In the future, CalSTRS may want to consider reductions in the refund rates at higher attained ages if the observed experience continues to remain below the assumption. Increases in refund rates may also be appropriate at some younger attained ages.
Comparison of Net Refund Data
Milliman CheironEntry Age Actual Expected A/E Ratio Actual Expected A/E Ratio
Males20 - 24 86 87 99% 108 103 105%25 - 29 746 694 107% 822 741 111%30 - 34 545 399 137% 573 421 136%35 - 39 293 253 116% 312 256 122%40 - 44 153 184 83% 146 187 78%
45 + 317 386 82% 229 301 76%Total 2,140 2,003 107% 2,190 2,009 109%
Females20 - 24 451 383 118% 541 449 121%25 - 29 1,998 1,390 144% 2,196 1,529 144%30 - 34 846 599 141% 899 659 136%35 - 39 435 373 117% 458 393 117%40 - 44 308 312 99% 301 311 97%
45 + 416 490 85% 370 452 82%Total 4,454 3,547 126% 4,765 3,792 126%
Attachment 2 Regular Meeting - Item 3
February 1, 2017
TRB143

CALIFORNIA STATE TEACHERS’ RETIREMENT SYSTEM AUDIT OF EXPERIENCE ANALYSIS – JULY 1, 2010 TO JUNE 30, 2015
SECTION X – PROBABILITY OF REFUND UPON VESTED TERMINATION
33
Attachment 2 Regular Meeting - Item 3
February 1, 2017
TRB144

CALIFORNIA STATE TEACHERS’ RETIREMENT SYSTEM AUDIT OF EXPERIENCE ANALYSIS – JULY 1, 2010 TO JUNE 30, 2015
SECTION X – PROBABILITY OF REFUND UPON VESTED TERMINATION
34
Attachment 2 Regular Meeting - Item 3
February 1, 2017
TRB145
CALIFORNIA STATE TEACHERS’ RETIREMENT SYSTEM AUDIT OF EXPERIENCE ANALYSIS – JULY 1, 2010 TO JUNE 30, 2015
SECTION XI – ACTUARIAL METHODS AND MISCELLANEOUS ASSUMPTIONS
35
Actuarial Cost Method For the DB Program, CalSTRS uses the entry age normal (EAN) cost method which allocates the present value of future benefits over the expected years of service of active participants. This method is the most widely used cost method among public sector pension plans and this is the method required under GASB 67 and 68. Milliman is correct in observing that an advantage to the method is that costs will tend to remain level over time as a percentage of payroll, if all assumptions are met. We find the EAN cost method reasonable and appropriate. For the CBB and DBS Programs, CalSTRS uses the Traditional Unit Credit (TUC or UC) Cost Method. This method is consistent with the funding objectives and long-term goals of these Programs, where the benefits are expected to be derived from the member’s accumulated account balances. The use of an alternative method, such as the EAN method, could result in a funded ratio for the Program different than 100 percent, even though ultimately the benefits will be based on the assets available (since there is currently no funding mechanism to make up for any shortfall if the assets of the Program consistently decline below the account balances, based on the minimum interest crediting rate.) If there are any significant developments in the funding status of the Program or governing legislation that would result in an expectation that the benefits payable were likely to exceed the assets based on the current contribution rates, then a reconsideration of the funding method would be appropriate. We agree that GASB 67/68 requires the use of the EAN method for financial reporting purposes. Actuarial Value of Assets The Actuarial Value of Assets for the DB Program is determined using a method that smoothes investment gains or losses over approximately a three-year period, with no corridor around the market value of assets. The primary purpose for smoothing out gains and losses over multiple years is to reduce contribution volatility. Smoothing the market gains and losses over a reasonable period of time to determine the Actuarial Value of assets is a generally accepted approach. We believe this method, which conforms to generally accepted practice, is reasonable. There are some systems that include a corridor around how far the Actuarial Value of Assets could diverge from market value; at the same time, it is generally accepted that smoothing over three years is sufficiently short to not need a corridor. Previously, CalSTRS did not fund on an actuarially-determined, variable contribution rate basis. If that were still the case, we would not see the need to use a smoothed Actuarial Value of Assets, in particular because GASB 67 now requires that the funding progress be disclosed using the market value of assets. However, now that CalSTRS is moving toward an actuarially-determined contribution policy, there is some justification to use a smoothed asset value for managing contribution rate volatility. We caution, however, that there are significant controls in statute on how much contributions can vary from year to year, and we encourage Milliman and
Attachment 2 Regular Meeting - Item 3
February 1, 2017
TRB146

CALIFORNIA STATE TEACHERS’ RETIREMENT SYSTEM AUDIT OF EXPERIENCE ANALYSIS – JULY 1, 2010 TO JUNE 30, 2015
SECTION XI – ACTUARIAL METHODS AND MISCELLANEOUS ASSUMPTIONS
36
CalSTRS to analyze the implications of combining an asset smoothing method with the statutory restrictions on contribution volatility. We agree with the use of the Market Value of Assets to determine the asset value for the CBB and DBS Programs, since the use of a smoothed value is not needed to manage the contribution rate volatility as described for the DB Program above. Valuation of Current Inactive Members Milliman recommended a change in the methodology used to estimate and value the benefits payable to currently inactive members. Previously, they estimated the value of these benefits by projecting the member’s contribution account with interest to the assumed retirement age, and then applying an adjustment to this result for the value of the benefits not provided by the member’s contributions. Milliman is proposing a more direct method of valuing these deferred benefits, by estimating a benefit using the service information contained in the actual data, in addition to the most recently available pay information for each individual (or an average pay amount, if no pay information for the individual can be found). We find their suggested methodology to be reasonable. We do not have the information available in our files to verify Milliman’s calculations of the deferred benefits for all individuals, since we do not have the full historical salary information for CalSTRS. However, we did verify that Milliman is applying their methodology as described for several individuals who both terminated and entered retirement status during the analysis period, as we did have the information necessary to confirm the calculations for these individuals. As part of our site visit, we recommended that Milliman test their proposed methodology for computing inactive members by comparing the estimated benefit amounts using their proposed procedures versus the actual retirement benefit amounts for individuals who had transitioned from termination to retirement status as of the most recently available valuation data. This back-testing demonstrated that the proposed procedures did result in smaller differences between the actual and estimated amounts than under the prior methodologies, though overall the estimated benefits were on average approximately 8 percent greater than the actual amounts. We support Milliman’s commitment to continue monitoring any significant discrepancies resulting from the estimation method as part of the annual gain/loss process. Inactive Member Retirement Age Milliman recommended the continued use of an assumed commencement age of 60 for 2 percent at 60 inactive members. We support this assumption, based on our own independent review of the data, which indicated an average commencement age of 60.95 (slightly higher than Milliman’s estimate of 60.6, but still reasonably close to the proposed assumption.) We also concur with Milliman’s recommendation to use an assumed commencement age of 62 for the 2 percent at 62 members, based on the differences in the benefit formula, and reflecting the fact
Attachment 2 Regular Meeting - Item 3
February 1, 2017
TRB147

CALIFORNIA STATE TEACHERS’ RETIREMENT SYSTEM AUDIT OF EXPERIENCE ANALYSIS – JULY 1, 2010 TO JUNE 30, 2015
SECTION XI – ACTUARIAL METHODS AND MISCELLANEOUS ASSUMPTIONS
37
that there is currently not enough information available to independently set an assumption for this group based on actual data. Number of Children We did not collect the information necessary to confirm Milliman’s recommendation to continue the current assumptions regarding the number of children assumed for active members. However, we note that this assumption, used for determining the number assumed eligible for minors’ survival and disability benefits, is not expected to have a significant impact on the overall valuation results. Assumed Offsets Similarly, we did not collect the information necessary to confirm Milliman’s recommendation to assume no offsets for future death and disability benefits, but to value the offsets as they occur (producing small actuarial gains). We believe this approach to be reasonable, especially given Milliman’s observation that less than 20 members are currently receiving such offsets, and it is consistent with the approach used in many other public retirement systems. Probability of Eligible Survivor Milliman stated in their experience analysis that they were unable to perform a statistically valid analysis of this assumption, based on the inability to identify deaths where the benefit is a refund of contributions. However, they have recommended a reduction in the assumption, to 85 percent for males and 65 percent for females, based on their recent analyses on other California public retirement systems. We do not find these proposed rates to be unreasonable, as they are reasonably close to the marital assumptions used by several of our clients. However, we recommend that Milliman attempt to come up with an approach to review these assumptions using the CalSTRS experience at the time of the next experience analysis, perhaps by reviewing a sample of individual records for those that include an active member death during a specified timeframe. If Milliman continues to be unable to perform a statistically valid analysis using the CalSTRS experience, we suggest they review the assumptions used by other large state teachers’ systems, not just California-based public plans. Sick Leave Load Milliman recommended a reduction in the load to account for future accumulation of unused sick leave from 2.0 percent to 1.8 percent of current credited service, based on an observation that new retirees had 0.41 years of unused sick leave service and 24.1 years of credited service at retirement. We support this assumption, based on our own independent review of the data, which indicated an average ratio of sick leave service to non-sick leave service of approximately 1.8 percent.
Attachment 2 Regular Meeting - Item 3
February 1, 2017
TRB148

CALIFORNIA STATE TEACHERS’ RETIREMENT SYSTEM AUDIT OF EXPERIENCE ANALYSIS – JULY 1, 2010 TO JUNE 30, 2015
SECTION XI – ACTUARIAL METHODS AND MISCELLANEOUS ASSUMPTIONS
38
Option Factors Milliman has recommended various changes to the assumptions used to compute the Plan’s option factors. We support Milliman’s recommendation that the option factors should be updated to reflect any changes to the mortality assumptions or investment return assumptions used in the actuarial valuation. We also support Milliman’s recommendations regarding the proportions of males versus females used to compute the various optional form adjustments; our review of the data for retirees electing these options indicated male versus female percentages reasonably close to those proposed. Milliman has also recommended adjustments (loads) to the mortality rates used to calculate the optional forms for the first four years after retirement for those members who elect a 100 percent continuance benefit (Options 2 and 6). Although these adjustments make some intuitive sense, we note that the information presented by Milliman reflects a substantially lower rate of elevated mortality for the males than both the current and proposed assumptions would indicate, with the actual mortality rates in the third and fourth years actually lower than the baseline mortality rates. As with the select and ultimate disability assumptions recommended by Milliman, we suggest that the credibility for a select assumption be explicitly considered, and to the extent the data is only partially credible, that any adjustments should be closer to 100 percent than the rates suggested by the data. Milliman has also recommended that CalSTRS consider simplifications that would allow the Plan to avoid updating the option factors every year if generational mortality assumptions are adopted. We support this recommendation, but we suggest that Milliman reconsider (or reword) their suggested methodology of projecting the mortality tables to the midpoint of the period the option factors would apply. Instead, we would recommend that CalSTRS consider calculating the option factors based on the full generational mortality tables, reflecting the annuity values for an individual expected to retire at the midpoint of the period the option factors would apply. As an example, if the option factors were to apply to 2017-2021, the age 60 option factors would be based on generational mortality assumptions for a member assumed to retire in 2019 at age 60 (i.e., the full generational tables for a member born in 1959). Estimated Impact of One-Year Final Compensation Milliman has recommended a change to the approach used to isolate the value of the 1990 benefits for current retirees, in particular to use a table which varies by year of retirement to estimate the increase in the benefit from the use of one-year versus three-year final average pay. We find this methodology to be reasonable, although we do not have the data necessary to verify the historical estimated three-year final average compensation amounts shown in the table. We suggest that when the table is updated in future experience analyses, Milliman consider whether the average increase be computed on a headcount, benefit amount, or compensation-weighted basis. We also concur with the method used to produce the assumption used for years after 2016 (i.e., adjusting by the wage growth plus ultimate merit salary assumption).
Attachment 2 Regular Meeting - Item 3
February 1, 2017
TRB149

CALIFORNIA STATE TEACHERS’ RETIREMENT SYSTEM AUDIT OF EXPERIENCE ANALYSIS – JULY 1, 2010 TO JUNE 30, 2015
SECTION XII – REVIEW OF PROCESSES AND DOCUMENTATION
39
As part of the scope of work, Cheiron performed a site visit at Milliman’s offices in Seattle in order to offer an opinion as to whether appropriate methods, checking, and reviews were followed in the preparation of the experience analysis and the MPP Program Assumption Letter. We were provided with paper files to review for the replication of the DBS, CBB, and MPP Valuation Reports and with access to their on-line filing system to review the electronic workfile on the experience analysis. They also provided the paper file from their having performed the 2014 DB plan valuation. Review of the 2014 DB plan valuation files showed no unanswered questions and a relatively small liability gain. The Actuarial Standards of Practice (ASOPs) provide a framework for the actuarial profession to operate. They identify what the actuary should consider, document, and disclose when performing an actuarial assignment. For preparing an experience analysis the relevant ASOPs are ASOP 35, Selection of Demographic and Other Noneconomic Assumptions for Measuring Pension Obligations and ASOP 27, Selection of Economic Assumptions for Measuring Pension Obligations. In reviewing Milliman’s files, we looked for evidence that these Standards were being followed. We also looked for evidence that appropriate procedures were being used to assure that qualified actuaries were involved in the process and that the work product was checked for mathematical accuracy and for concurrence by other appropriate actuaries. Milliman’s internal peer review process includes the requirement that there be a doer, a checker, and a peer review for each project. The files showed evidence that Milliman’s peer review procedure was followed and that two qualified actuaries were involved in selecting assumptions and recommending any changes to the existing assumptions. Milliman’s peer review form was filled in with the appropriate information that the doer and checker had gone through the files. The peer review section identified who would be the project’s peer reviewer, but it contained no check marks, comments, or signatures at the time we performed the on-site visit. The report was not finalized until a later date and we expect that this form has since been completed. There was evidence that a qualified health actuary was involved in the selection of the trend assumption recommended in the MPP Program Assumption Letter. Milliman uses a color coded file system to denote the area of practice. The file for the MPP valuation was colored purple to denote a health practice file. The signers of the actual letter appear to all be practicing pension actuaries, so while the file contains evidence of a credentialed health actuary’s involvement this does not come through in the final work product. Milliman may want to consider having a health actuary co-sign this letter and perhaps the actual MPP report, or at least to document the involvement of a qualified health consultant in developing the assumption. The ASOPs do allow the actuary to seek out the views of experts in areas for which such views may be instructive. The experience analysis was performed using an internal, FORTRAN program. There was sufficient evidence in the file to show that the specific FORTRAN programming that was used to manipulate CalSTRS data was prepared and reviewed by credentialed actuaries. There was no evidence that the underlying program that operated on the data was validated. We asked Nick Collier about whether the Milliman experience analysis system had been independently reviewed and he told us that he believes the Segal Company performs regular audits of LACERA and is able to verify the incidence and decrements in those analyses. Milliman has also used their
Attachment 2 Regular Meeting - Item 3
February 1, 2017
TRB150
CALIFORNIA STATE TEACHERS’ RETIREMENT SYSTEM AUDIT OF EXPERIENCE ANALYSIS – JULY 1, 2010 TO JUNE 30, 2015
SECTION XII – REVIEW OF PROCESSES AND DOCUMENTATION
40
system to audit other public sector plans and has been able to reasonably match the results of those analyses. This replication audit will be providing yet another procedure for testing the underlying program being used by Milliman. The file included evidence that aggregate decrements and exposures produced by the experience analysis tools produced results in keeping with the raw data. These checks were initialed by the principals. There was a notation in the file section regarding new procedures to value terminated vested member benefits. On the benefit trace, it said, “good match” but there was no elaboration. We asked Milliman if that meant they had been able to match the individual benefit calculation to the actual amount that a member who subsequently retired was eligible to receive, or if the comment had to do with comparing the revised methodology to the previous one. Apparently neither was the case. Milliman agreed that looking for people who recently moved from a terminated vested status to a retired status and comparing their benefits to those that would have been produced by the revised estimation technique would be a worthwhile exercise. Milliman subsequently performed this analysis and found that the revised techniques were producing liability figures that were closer to the amounts actually payable than did the earlier method. The only other area of concern in review of the files was why they counted so many members with over 30 years of service as terminations rather than retirements. In some experience analysis systems we are familiar with, those who terminate after becoming eligible for retirement are counted as retirements. Nick Collier pointed out that while the percent of terminations in this group was higher than those in the immediately preceding tranche, it was a relatively small number of participants. We discussed perhaps using confidence intervals in the display of such results to clarify the uncertainty inherent in developing a termination assumption for members with very high service. We also asked about the apparent discrepancy in the draft experience analysis report cost section which showed that a move to recognize all of the demographic changes and moving the investment return assumption to 7.25 percent (along with other economic assumption changes) produced a contribution rate of 37.79 percent when rerunning the 2015 valuation. It also showed that making the same changes but dropping the investment return assumption a further 0.25 percent to 7.00 percent produced a contribution rate of 37.78 percent. When we asked about this unusual result, Milliman found that this was an error in the reported 7.25 percent result, which was corrected before releasing their final report. In our opinion, Milliman’s work in preparing both the experience analysis and the MPP Program Assumption Letter meets the requirements of the ASOPs. The work was performed by appropriately credentialed actuaries, those who performed the work dated and initialed their involvement as did those who reviewed it. We reserve judgement on the signature of the peer review actuary in the case of the experience analysis report since it had not yet been finalized when we made the site visit, but we have no reason to believe that Milliman did not complete this step as well.
Attachment 2 Regular Meeting - Item 3
February 1, 2017
TRB151

CALIFORNIA STATE TEACHERS’ RETIREMENT SYSTEM AUDIT OF EXPERIENCE ANALYSIS – JULY 1, 2010 TO JUNE 30, 2015
APPENDIX A – GLOSSARY OF TERMS
41
1. 90 Percent Confidence Interval The 90 Percent Confidence Interval is the range around the observed rate in which the true rate during the experience analysis period is expected to fall 90 percent of the time. For example, if you flip a coin 10 times, you will not always observe five heads and five tails even though there is a 50 percent chance of heads and a 50 percent chance of tails. If you were to observe six heads, the 90 percent confidence interval would still encompass the true underlying probability of 50 percent and provides support to retain an assumption of 50 percent.
2. Actual The actual number of decrements of a specified type observed during the experience analysis period.
3. Actual-to-Expected Ratio (A/E Ratio) The ratio of the actual number of decrements observed during the experience analysis period to the expected number of decrements under either the current or the proposed set of assumptions. Ideally, this ratio would be 100 percent, unless there is reason to assume that future experience will differ from the experience during the analysis period.
4. Actuarial Cost Method A procedure for allocating the actuarial present value of projected benefits to time periods, usually in the form of a normal cost that is the amount allocated to a particular year and an Actuarial Liability that is the amount allocated to prior years.
5. Actuarial Gain or Loss The difference in Actuarial Liability from what was expected that is attributable to differences between actual experience and assumed experience.
6. Decrement In the experience analysis, a decrement refers to a change in an individual member’s status of a specified type. For example, there are a number of ways an active employee may change status including: service retirement, disability retirement, termination of employment, or death. Each of these is a type of decrement that is tabulated as part of the experience analysis.
Attachment 2 Regular Meeting - Item 3
February 1, 2017
TRB152

CALIFORNIA STATE TEACHERS’ RETIREMENT SYSTEM AUDIT OF EXPERIENCE ANALYSIS – JULY 1, 2010 TO JUNE 30, 2015
APPENDIX A – GLOSSARY OF TERMS
42
8. Expected The expected number of decrements of a specified type during the experience analysis period based on either the current or proposed set of assumptions.
9. Exposures The number of members exposed to a specified type of decrement during the period from one valuation date to the next.
10. Merit Salary Increases Salary increases above those provided across the board to all employees. These increases may be attributed to promotion, longevity, or merit.
11. Observed Rate The actual number of decrements of a specified type divided by the number of exposures to the same decrement.
12. Price Inflation The average change over time in the prices paid for a market basket of consumer goods and services. For purposes of the experience analysis, we use the measure, CPI-U, as published by the Bureau of Labor Statistics.
13. Wage Growth The average change over time in overall wages (also wage inflation).
Attachment 2 Regular Meeting - Item 3
February 1, 2017
TRB153

43
Attachment 2 Regular Meeting - Item 3
February 1, 2017
TRB154

Attachment 3 Regular Meeting – Item 3
February 1, 2017
PROPOSED RESOLUTION
OF THE TEACHERS' RETIREMENT BOARD
SUBJECT: Actuarial Experience Analysis
RESOLUTION NO. _____
WHEREAS, the Teachers’ Retirement Board has actuarial investigations of the
experience of the California State Teachers’ Retirement Plan performed every four years but gave approval in February 2016 to delay the completion of the investigation by one year in part to provide the actuaries the opportunity to study recent mortality improvement; and
WHEREAS, the consulting actuary, Milliman, Inc. has performed the necessary actuarial
studies using the data provided by the System and pertinent other data; and WHEREAS, the independent actuarial firm Cheiron has performed an independent
review of the actuarial investigation and the actuarial assumptions recommended by Milliman, Inc. and stated the proposed assumptions are reasonable, appropriate and were developed in accordance with generally accepted actuarial principles; and
WHEREAS, the Teachers’ Retirement Board has reviewed the actuarial investigation
results presented by the consulting actuary, Milliman, Inc.; therefore be it RESOLVED, that the Teachers’ Retirement Board adopts the actuarial assumptions
recommended by Milliman, Inc.
Adopted by: Teachers’ Retirement Board on February 1, 2017
_____________________ Reviewed by: JACK EHNES
Chief Executive Officer ____________________ Brian J. Bartow General Counsel
TRB155