purpose driven studynhp.mowr.gov.in/docs/hp2/pds/surface water/1123/mp_ sw...purpose driven study...
TRANSCRIPT

MADHYA PRADESH
WATER RESOURCES DEPARTMENT
WORLD BANK AIDED
HYDROLOGY PROJECT PHASE-II
Purpose Driven Study
“The Impact of Contaminated Shahpura Lake on
Ground Water Environment, Bhopal, MP”
Chief Engineer (BODHI)
Water Resources Department
Bhopal, (MP)
FINAL REPORT

Purpose Driven Study
“The impact of Shahpura Lake on Ground Water Environment, Bhopal”
Implementing agency : Water Quality Laboratory, Level II+ Ground Water
Survey Circle, Water Resources Department, Bhopal
Associated Institute : Department of Environmental Science and Limnology
Barkatullah University, Bhopal
Project Coordinator : Mr. S. K. Khare, Chief Engineer (BODHI)
Nodal Officer : Mr. C. S. Ramteke, Supdt. Geo Hydrologist, GWS,
Bhopal
Principal Investigator : Mr. S. S. Roy (Sr. Geo-Chemist)
Project Co-Investigator : Dr. Vipin Vyas (Sr. Lecturer)
Outsource Staff : 1. Dr. Satish Balapure (Limnologist Full Time)
: 2. Dr. Sumana Dutta (Limnologist Part-Time)
Technical Support
and data analysis
Special thanks to : Dr. M. K. Khanna (Retd. Supdt. Geo Hydrologist)
Under the World Bank Aided Hydrology Project Phase II, Purpose Driven Study was taken up for
developing a user friendly monitoring technique to support the water sector planner and administrators to
protect water bodies and provide potable quality of ground water abstracted from its fringe area. Main
objective is to study the ingress of sewage contaminated lake water into ground water and to tie up the
Limnological data with ground water quality. Collection of sample was initiated from May 2010 to
October 2012 from ground water located at upstream and downstream of water body, and lake water
samples at different locations coordinating the groundwater sites. Water quality parameters mainly
nutrients, organic matter along with Limnological observation viz. Phytoplankton/Zooplankton and
benthos density and diversity, chlorophyll estimation, sediment analysis, status fisheries, macrophytic
diversity and GIS mapping were carried out for better management plan and DPR preparation. The
complete data analyzed using Prati and BMWP indexing by the ground WQ Laboratory Bhopal and
compiled in this document carried till October 2012.
S. S. Roy Dr. Vipin Vyas (Sr. Geo-Chemist) (Sr. Lecturer)
Project Investigator Project Co-Investigator
Mr. Hemant Sharma Dr. Akhilesh Jinwal
Mrs Nirmala Bharti Miss Pushpa
Mr. Arun Shrivastava Mr. Mahesh Gedam

PROJECT AT A GLANCE
S No Description of items Details
1 Date of approval 06 August 2010
2 Date of completion 30 November 2012
Study area Shahpura lake basin
Toposheet 55E/8
Catchment area of lake 8.29 Sq. Km
Submergence area 0.96 Sq. Km
Gross storage 2.2 m. cub.
Live storage 2.07 m. cub.
Max. Water level 489.00 m
Geological formation Vindhyan Sand Stone & Deccan Trap Basalt
Existing abstraction shallow tube wells :
Purpose driven Peizometers :
Shoreline surface water locations :
Depth surface water locations :
- 16 Nos.
- 10 Nos.
- 13 Nos.
- 12 Nos.
Major source of surface water contamination 1. Kotra Main Drainage (North)
2. Charimli Drainage (North - East)
3. Shahpura drainage (East-South)
4. Dhobi Ghat (Eastern side of Lake)
Main use of lake water Washing, bathing, recreation, aquaculture
Major source of drinking water in fringe area Ground water using motorized tube wells
Type of water body Eutrophic
Socio economical features Well educated, understanding of
environmental degradation
Local impact on GW quality in fringe area Lined drainage/sewage disposal system

CONTENTS
Summary
1. Introduction:
1.1 Geology and Soil
1.2 Lithology
1.3 Climatic Conditions
2. Objectives of the P D S
2.1 Shahpura Lake
3 Methodology:
4 Water quality of Shahpura lake
4.1 Water quality observation of Shahpura Lake during November 2011 to
October 2012:
4.2 Water quality observation of Shahpura Lake: (Shore line)
4.3 Water quality observation of Peizometer (purpose driven-wells)
4.4 Water quality observation of Baseline (Ground water)
4.5 Sediment quality in Shahpura Lake
B. Biological
a. Phytoplankton
b. Zooplankton
c. Benthos
d. Macrophytes
e. Fish Fauna

5 Assessed of trophic status of lake using different index
5.1 Carlson Trophic State Index
5.2 Trophic status of Shahpura Lake by Nygard index
5.3 Biomonitoring indices using macrozoobenthos
6 Prediction of relationship between surface and ground water
6.1.1 Prati index:
6.1.2 Principal component analysis based on water quality parameters and
Limnological parameters:
7 Conclusion
8 Recommendation for further study and policy makers

1
Summary:
Due to insufficient surface water supply, ground water is the main source of drinking water supply in the
Shahpura lake basin study area. Downstream south-west region “Chuna Bhatti” residential area is the
recharge zone of the Shahpura lake and the tube wells and dug wells located close to the Shahpura lake in
both upstream (near Administrative Academy) and downstream (Chunna Bhatti area), groundwater
quality demonstrated major deterioration in its quality due to presence of toxic Nitrate, Phosphate,
Organic matter, pathogenic bacteria, for which the possible source is the sewage contaminated lake water.
Municipal septic disposal system are well lined and the residents belonged to higher socio economic
class and well versed with the environmental issues therefore possibility of any local effect on ground
water quality was negligible.
As the houses located around the watershed rely on individual well water supply, so to protect the human
health, it was found necessary to monitor the progressive degradation in ground water quality of the wells
as well as the surface water characteristics of Shahpura lake. The output may be helpful to identify the
management plan for providing safe drinking water and also to protect the water body and its ecosystem
from further possible damage.
A total duration of this project is 3 year and Limnological study was carryout one year from November
2011 to October 2012
Total 25 surface water sampling sites were studied under the PDS at different location (depth and
shoreline) at Shahpura lake. A total of 522 samples were collected and analysed mainly for pollution
parameters Ammonical Nitrogen, Nitrate and Phasphate (NH3-N, NO3-N, PO4) and organic matter along
with pH, electrical conductivity (EC), total dissolved solids (TDS), Ca2+
, Mg2+
, HCO3-, Cl
- and Na
+, K
+.
The Shahpura Lake which is supposed to be a possible source of contamination of ground water in its
fringe area was reported having very rich nutrients value such as nitrate and phosphate along with
ammonical nitrogen toxicity and organic matter in north eastern and north western side, where the raw
sewage from Kotra drainage, Charimli drainage and Shahpura drainage as point source is mixing into the
water body, to the maximum of 37.5 mg/l, 9.0 mg/l, 10 mg/l, 92 mg/l and average value 27.74 mg/l, 4.06
mg/l, 5.2 mg/l and 67.86 mg/l respectively.
Similarly stations located also reported high nutrient value (nitrate and phosphate) along with ammonical
nitrogen toxicity and organic matter to the maximum of 36.6 mg/l, 4.0 mg/l, 10.0 mg/l, 123 mg/l and
average value as 26.43 mg/l, 2.05 mg/l, 4.08 mg/l, and 80.76 mg/l respectively. Therefore it is observed
that the overall quality of water body is highly polluted and unsuitable for drinking, domestic, bathing and
recreational uses. The high contaminants level is also detrimental to fish cultivation and its growth and
turning the water body eutrophic.
Total 25 no. ground water samples in the fringe area of water body mostly used as source water for
drinking and community supply were collected from 15 no private shallow tub wells/dug wells and

2
newly built 10 No. purpose built Peizometers (30 mtr depth) within the periphery of 600 mtrs from
lake. A total of 409 GW samples were collected and analysed for mainly nutrient contamination viz
Nitrogen as Ammonical nitrogen (NH3-N), Nitrate (NO3), Phosphorous as total Phosphate (Total PO4),
Organic matter as Chemical Oxygen Demand (COD), pH, and also other physical and anthropogenic
elements viz. electrical conductivity (EC), total dissolved solids (TDS), Na+, K
+, Ca
2+, Mg
2+, HCO3
-, Cl
-,
F- and Iron (Fe
++). Presence of colliform bacteria were also reported in ground water mostly in the
downstream of water body situated in its southern part.
Upstream well water: Out of 15 ground water of upstream (north-west and north west side) reported
having very rich nutrients value such as nitrate and phosphate along with the organic matter to the
maximum value of 66.4 mg/l, 0.42 mg/l, and 52.8 mg/l and average value of 29.30 mg/l, 0.23 mg/l, and
18.56 mg/l respectively. 6 upstream peizometric well water situated both at north-west and north west
side of lake reported Ammonical Nitrogen toxicity above its permissible limit of <0.3 mg/l, with a
maximum value of 2.25 mg/l and an average of 0.63mg/l NH4-N.
Downstream Well water: Similarly stations located at south-west side of lake also reported high
nutrient value (nitrate and phosphate) along with organic matter to the maximum of 109.2 mg/l, 1.0 mg/l
and 64 mg/l and average value of 26.99 mg/l, 0.26 mg/l and 14.95 mg/l respectively. Whereas 7 domestic
wells located at downstream to waste-wear with massive basaltic sand stone formation reports low
contamination
Prati index of surface water based on the average value of 6 parameters namely pH, Dissolved oxygen,
Biochemical demand, Chemical demand, Nitrate, Ammonical nitrogen, and Phosphate establishes that
77% samples comes under doubtful and 23% under badly polluted category. Overall lake water quality is
in the category of unsuitable water class.
3 peizometer well at downstream reported maximum of 3.05 mg/l of ammonical nitrogen with an
average value of 1.08 mg/l NH4-N.
11 No. domestic GW stations out of 15 stations reported presence of organic matter greater than its
permissible value of 10 mg/lit Chemical Oxygen Demand (COD) with highest value of 64 mg/Litre and
phosphate 1.0 mg/l at G11-A (Downstream South west), average value 17.80 mg/lit during post monsoon.
The presence of organic matter in ground water flow establishes impact of contaminated surface water on
ground water environment and putting the ground water unsuitable for both drinking and domestic use.
Therefore observing the overall range of above mentioned contaminants in well water at both downstream
southern side (Chunna Bhatti residential area) and upstream north western side (Amrapali enclave) and
north eastern side (Near Academy building) of the lake, ground water are found contaminated from
external sources.
Prati index of ground water based on the average value of 3 parameters namely Chemical oxygen
demand, Nitrate and Phosphate establishes that 33.33% samples comes under doubtful and 63.60% under
slightly polluted category. Overall lake water quality is in the category of unsuitable water class.

3
In biological observation total 150 phytoplankton species was reported belonging to 5 groups namely,
Chlorophyceae, Cyanophyceae, Bacillariophyceae, Euglenophyceae and Dinophyceae .Group
Chlorophyceae had the highest number of species (52 species) followed by Euglenophyceae (34 species),
Bacillariophyceae (32 species), Cyanophyceae (29 species), and 2 species were varied between 10.5 to
2560 individuals/l. therefore 28 pollution indicator species was observed with rich density in the lake. The
maximum density of phytoplankton observed in southern part of the lake.
62 species of zooplankton was recorded where as group Rotifera had the highest number of species (43
species) followed by Protozoa and Cladocera (6 species), Copepoda and Cyclopoida (3 species), 1 species
of Ostracoda. The zooplankton density of Shahpura lake were varied between 740.5 to 1328 individuals/l.
in Shahpura lake following pollution indicator species was observed Lecane sp., Brachionus calyciflorus,
B falcatus, B quadridentatus, B budapestinensis, Asplanchna brightwellii, Filinia sp., and Daphnia sp
species were pollution indicator and among
A total of three phylums were noted during the entire study period viz., Arthropoda, Mollusca and
Annelida. A total number of 43 species were recorded from Shahpura lake come under Arthropoda was
dominant phylum with 25 sp. followed by Mollusca with 13 species and Annelida with 5 species. The
density of benthos of lake is 9866 – 31111 org/m2. The main dominance species of Arthropoda (group
Insecta) namely Chironomus, Ablabesmyia,Hydropsyche, Limnephilus, Proclalius,
Amphiagrion,Culicidae pupa,Hesperocorixa,Notonecta.Five species of Annelida namely Branchiura,
Lumbricullus,Glossiphornia complanata, Glossiphornia leteroculata, Helobdella stagnalis andthemost
dominant benthic species of Mollusca (group Gastropoda) namely Bellamyabengalensis,B. crassa, B.
crassispiralis, B. dissimilis,Indoplanorbis exustus, Physa,Thira tuberculata. The maximum pollution
indicators species was observed in southern part of the lake having rich density.
Total 11 species of macrophytes were reported during the study period. There were 2 species of
submerged Najas minor, Hydrilla verticillata, 2 species of free floating Pistia stratiotes, Eichhornia
crassipes and 7 shoreline species namely Polygonum glabrum, Cyperus articulatus, Sagittaria
sagittifolia, Begrgia cappensis, Nymphaea nouchali,Phragmites carka, Typha sp were recorded.
During the study period 6 culturable species of fishes i.e., Catla catla, Labeo rohita,
Cirrhinus mrigala, Hypophthalmichthys molitrix (Silver carp), Cyprinus carpio (Common carp),
Notopterus notopterus and Tilapia mossambica was recorded. Hypophthalmichthys molitrix,
Cyprinus carpio and Tilapia are exotic species. Tilapia is harmful for any aquatic system, having
large size in Shahpura lake which was more than half kg. During the local observation and
market survey this size of tilapia was not found in any other place of Madhya Pradesh. A total
fish production as per the Shahpura fisheries society of shahpra lake 70% of tilapia and 30% of
Indian major carps. It is clearly indicated that this aquatic system is fully disturbed.
Lake trophic status was assessed by using Nygards index shows Mixophycean highest value and
Carlsons trophic index showed that the lake was hyper eutrophic (polluted). BMWP value
reported heavy / severe pollution of Shahpura lake water.

4
1. Introduction:
Bhopal, the capital of the state of Madhya Pradesh is situated in the centre of India, at an altitude
of 505 M above seal level (Fig.1.1a). The city is located at longitude 77°12' - 77°40' eastern and
latitude 23°07' - 23°94' northern. It covers a total area of 284 sq km.
Due to insufficient surface water resources, ground water is the main water supply in the
Shahpura lake basin study area. Down stream south-west region of the Shahpura lake “Chuna
Bhatti” residential area is known as ground water sanctuary and used to supply untreated ground
water through hundreds of tanks to Bhopal urban area during summer season. Abstraction of
ground water is done using electrical motors.
Shahpura lake is a man made water body and used to collect the storm flow water received from
three major open drainage system called Kotra drainage north west side, Charimli drainage
northern side and Shahpura drainage at eastern side of lake. The drainage system carry direct
point source transferring the untreated municipal and house hold waste and human
excreta/animal faeces and diffused urban source runoff from city streets, gardening and
commercial activities in urban environment. Homes located around the watershed rely on
individual well water and have well lined municipal septic disposal system. Therefore
possibility of any local effect on ground water quality was negligible.
1.1 Geology and Soil: The geological formations underlying the Bhopal area – at the
eastern edge of the Malwa Plateau – are largely red sandstone strata, with the depth of the rock
varying according to the slopes. The top portions of the hillocks generally consist of hard red
soil, mixed with basaltic boulders. Black cotton soil is seen at various depths from 1 to 3.0m
Geohydrological distribution in Shahpura lake basin: In catchment area of lake, north and
north-western side lies deccan trap basaltic flow which have intertrapean bed or weathered basalt
zone with water (aquifer) at 15 to 18 mtr below ground level. In this are 3 no peizometers are
drilled.
Lake is situated on contact plain of vindhyan sand stone and deccen trap basalt. At downstream
zone of south, south-east and south-west where lies vindhyan sand stone and deccan trap basalt 7
no peizometers have been established. which is nearly about 25 mtr to 28 mtr below ground
level.

5
1.2 Lithology: The borehole cutting at regular intervals of two meters or whenever changes in
formation encountered was observed. The general Lithologs of peizometers in Vindhyan Sand
Stone Area and Deccan Trap Basalt area Area is given in Table -1.
Table 1: Hydrological boreholes drilled in the catchment area of Shahpura Lake Basin
Drilled
Depth
(mbgl)
Average Depth of
water level (bgl) –
pre-monsoon 2011
Water
bearing
Horizon
Lithology
30.0 mtr 16.0 mtr
(15 mtr to 18 mtr)
In Vindhyan
Sand Stone
Area
Weatherd Basult 0 - 6.15
Redbole 6.15 – 9.80
Vindhyan sandstone 9.80 – 21.30
Friable vindhyan sandstone compact 21.30
– 30.00
30.0 mtr 26.0 mtr
(25 mtr to 28 mtr)
In Deccan
Trap Basalt
area
Weatherd Basult 0 2.6
Massive basault 2.6 – 10.7
Vasicular basualt 10.7 – 14.7
Redbole & weatherd basult 14.7 – 18.8
Vindhyan sandstone compact 18.8 – 30.0
1.3 Climatic Conditions: The city enjoys a moderate climate. Normally temperature ranges
between 50oF and 104oF although highest temperature occasionally rises to 110oF. In such
moderate climate, residential areas can be developed at higher densities as three to four storied
buildings can be constructed without causing discomfort to the occupants.
The rainy season lasts from mid June to September, the winter from November to February, and
summer from March to June. October sees the transition from rainy to the winter season. The
average annual rainfall is round 1200 mm, falling predominantly during July and August. The
average number of rainy days is approximately 40.

6
Map 1: Peizometers of Shahpura lake basin

7
2. Objectives of the P D S:
Development of long term monitoring mechanism to keep vigil on progression of surface water
pollution by studying systematic & periodically physic-chemical parameters.
Monitoring of groundwater water quality to study ingress of chemical contamination into fringe area
aquifer used for drinking water supplies.
Study the impact of contaminants on biological diversity, tropic status of lake and identification of
the indicator species.
Tie up of Limnological data with ground water quality in the study area
2.1 Shahpura Lake
The study area Shahpura lake basin is situated in 23°12’25” latitude and 77°262’00” longitude
and it covers total area of 98 hectare.Shahpura lake is located at the South East end of Bhopal. In
1974 the capacity of this small water body was increased by the construction of an embracement.
Later on a drain that brings in the untreated domestic sewerage from the substantial part of new
Bhopal city was impounded into this lake. The over flow from this lake meets the river
Kaliasote, a tributary of river Betwa which ultimately is polluted by domestic sewage.
Upstream: Charimli and Shahpura residential areas are located at northern and eastern side of
lake comprising of major drainage viz. Kotra drain at north western and Shahpura drain at
eastern side.
Downstream: Planned residential area (Chuna Bhatti) at south - western side of the lake. At
Shahpura Lake, the entry of nutrients was due to the use of detergents and the influx of sewage
water from surrounding areas. It receives domestic raw sewage from surrounding habitation; so
also the activities like cattle washing, cloth washing, bathing, religious activities like idol
immersion etc. paves the way for high concentration of hazardous chemicals in the lake water.
The untreated wastewater contains effluent rich in nitrogen, phosphate, caustic soda and
detergent, etc.
Samples of groundwater and surface water were collected at monthly intervals and analysed for
physic chemical and biological properties. Diversity and density of phytoplankton, zooplankton
and benthos was also studied. Lake sediment samples were also collected for physicochemical
analysis.
8
It receives domestic raw sewage from surrounding habitation; so also the activities like cattle
washing, cloth washing, bathing, religious activities like idol immersion etc. paves the way for
high concentration of hazardous chemicals in the lake waters. The untreated wastewater contains
effluent rich in phosphate, caustic soda and detergent, etc.
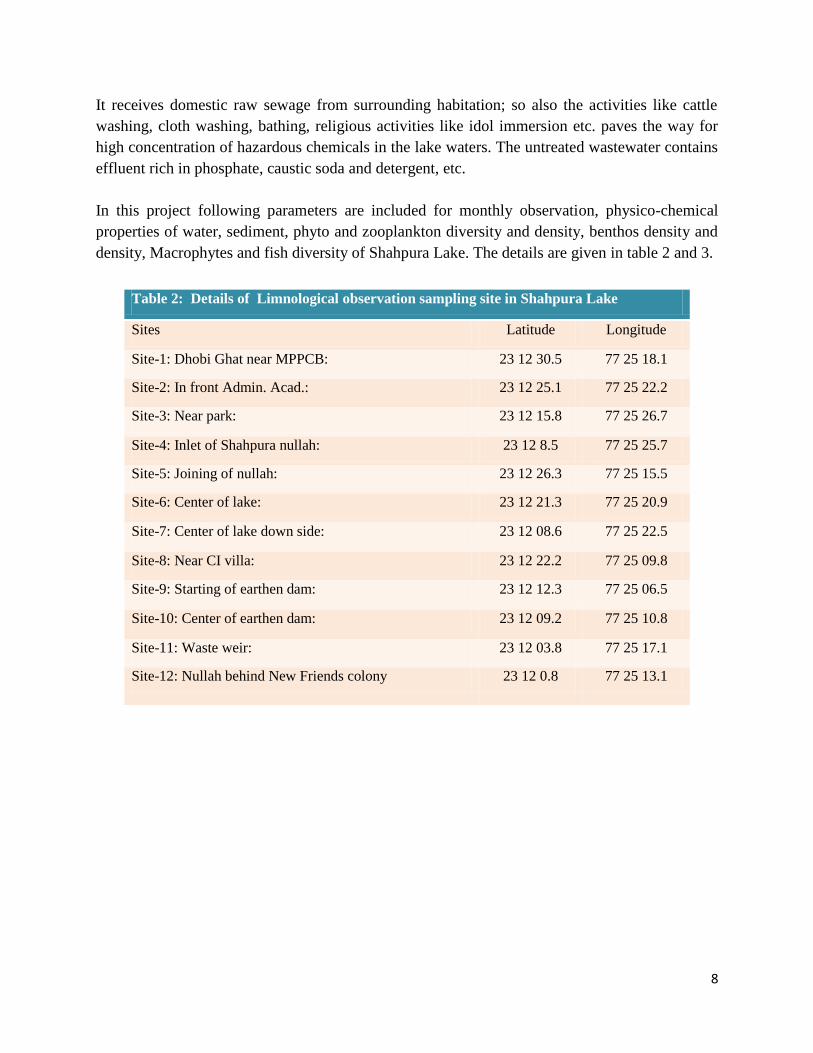
In this project following parameters are included for monthly observation, physico-chemical
properties of water, sediment, phyto and zooplankton diversity and density, benthos density and
density, Macrophytes and fish diversity of Shahpura Lake. The details are given in table 2 and 3.
Table 2: Details of Limnological observation sampling site in Shahpura Lake
Sites Latitude Longitude
Site-1: Dhobi Ghat near MPPCB: 23 12 30.5 77 25 18.1
Site-2: In front Admin. Acad.: 23 12 25.1 77 25 22.2
Site-3: Near park: 23 12 15.8 77 25 26.7
Site-4: Inlet of Shahpura nullah: 23 12 8.5 77 25 25.7
Site-5: Joining of nullah: 23 12 26.3 77 25 15.5
Site-6: Center of lake: 23 12 21.3 77 25 20.9
Site-7: Center of lake down side: 23 12 08.6 77 25 22.5
Site-8: Near CI villa: 23 12 22.2 77 25 09.8
Site-9: Starting of earthen dam: 23 12 12.3 77 25 06.5
Site-10: Center of earthen dam: 23 12 09.2 77 25 10.8
Site-11: Waste weir: 23 12 03.8 77 25 17.1
Site-12: Nullah behind New Friends colony 23 12 0.8 77 25 13.1

9
Map 2: Map of sampling site location in Shahpura lake
S-1
S-2
S-3
S-4
S-6
S-5
S-7
S-8
S-9
S-10 S-11
S-12

10
Map 3: Location map of Shahpura lake basin under HP-II PDS, Bhopal

11
Table 3: Sampling site locations at surface water, ground water and peizometer in Shahpura basin.
Code
Surface
water source
Latitude
(N)
Longitude
(E) code
Ground water
Source
Latitude
(N)
Longitude
(E) Code
Peizometers
station
Latitude
(N)
Longitude
(E)
S-1
Main untreated
source kotra
Nullah
23o13'2.9" 77
o25'6.6"
PZ 01 A
Near PHE
Office 23o12'55.1" 77
o25'6.5"
GW-1
Tube well of
BSNL
Extension 23o12'52.6" 77
o25'10.3" PZ 01 B
Near Sampada
Sanchanalaya 23o13'0.3" 77
o25'23.6"
S-2
joining of two
Nullah from
char imli
residential area
behind PCB
23o13'31.4" 77
o25'19.3"
GW-2
Tube well of
NCHSE 23o12'50.7" 77
o25'34.4" PZ02 NCHSE 23
o12'50.7" 77
o25'34.4"
S-3
Dhobi Ghat
Behind PCB
23o12'30.5" 77
o25'18.1"
GW-3
Tube well hand
pump 1100
Qtrs 23o12'40.6" 77
o25'35.1" PZ03
In front of
Administrative
Academy away
from Dug well 23o12'28.7" 77
o25'26.9"
S-4
In front of
Administrative
academy T
Shape Point
23o13'21.38" 77
o25'27.07"
GW-4
Dug well
Academy
Building 23o12'28.5" 77
o25'28.9" PZ04
In front of
Administrative
Academy near
from Dug well 23o12'29.5" 77
o25'28.4"
S-5
near Shahpura
Park
(Recreation
centre)
23o13'31.6" 77
o25'9.28"
GW-5
Tube well Rain
bow Treat 23o12'11.3" 77
o25'33.1"
S-6
Inflow of
sewage water
from
residential area
of shahpura
23o13'5.07" 77
o25'31.59"
S-7 Waste weir
GW-7A
Dug well
Seepage water
waste weir 23o12'2.1" 77
o25'15.3"
23o13'2.3" 77
o25'17.5"
GW-7B
Tube Well C-
Sector
Shahpura 23o12'56.7" 77
o25'12.9"
S-8
Central part of
the lake
23o13'13.81" 77
o25'19.56"
S-9
Behind C I
villa residential
GW-9
Tube well
Kashish 23o12'26.1" 77
o25'6.5" PZ 09A
Amrapali
enclave A 23o12'29.4" 77
o25'13.1"

12
colony Restaurent at
the road Side
23o12'26" 77
o25'10.7"
PZ 09B
Amrapali
Enclave B 23o12'27.1" 77
o25'12.9"
S-10 near Palm tree
GW-10
Tube well
Avtaar Singh
Bedi 23o12'21" 77
o25'4.1" PZ 10 A
In Avtaar
Singh Bedi
campus 23o12'21.4" 77
o25'5.2"
23o12'15.32" 77
o25'9.56"
PZ 10B
In Ram mandir
away from
Avtaar singh
bedi and across
the road 23o12'18.4" 77
o24'55.6"
S-11
Starting Point
of earthen dam
GW-11A
Dug well Jugal
Kishore 23o12'13.7" 77
o24'59.4"
GW-11B
Tube Well
jugal kishore 23o12'13.7" 77
o24'59.5"
23o13'11.34" 77
o25'6.87"
GW-11C
Tube well Shri
N R Khare 23o12'5.7" 77
o24'59"
S-12
Middle Point
of earthen dam
GW-12-A
Tube Well Dr
Dubey 23o12'7.4" 77
o25'3.4" PZ 12
Naveen higher
secondary
School 23o12'5.7" 77
o25'7.1"
GW -12 B
Tube Well Shri
Lobo 23o12'4.6" 77
o25'1.6"
23o13'6.9" 77
o25'12.01"
GW-12 C
Tube Well Dr
M.k. Khanna 23o11'59.3" 77
o24'57.5"
S-13
Nullah Behind
new friends
Colony( out
flow of waste
weir)
23o12'0.8" 77
o25'13.1"
GW-13
Tube well
H.No. 5 Mr
Murlichandani 23o11'52.4" 77
o25'3.8"

13
Map 4: Contour map of Shahpura lake basin

14
Map 5: Ward map of Shahpura lake basin

15
Map 6: Drainage map of Shahpura lake

16
Map 7: Buffer map of Shahpura lake

17
Map 8: Location map of constructed wetland on point source of Shahpura lake
Proposed sites for treatment plant

18
3. Methodology:
3.1 Water quality parameters: Standard methods (APHA, 1998; Trivedy et al., 1998)
and Standard analytical Procedure for water analysis (Draft version 1.0, August 1998) were
followed for the physical and chemical analysis of both surface and ground water.
Temperature was measured using mercury-filled centigrade thermometer. pH was measured
on the site using pen type pH meter. Winkler’s modified method (APHA, 1998) was used to
estimate oxygen concentration. In the laboratory, the samples were treated with concentrated
sulphuric acid to liberate the iodine equivalent to dissolved oxygen originally present. Exactly
100 ml of the sample was titrated against standard sodium thiosulphate solution of known
normality (0.025N) using starch as indicator. The values were expressed in mg/l.
Most important pollution indicator parameters supporting the PDS objectives such as
Nutrients (Nitrite-nitrate, phosphate), and Organic matter (COD) were estimated using UV
spectrophotometry, Ascorbic acid spectrophotometry and Open air reflux method
respectively.
Other general and mostly anthropogenic parameters such as Chloride was estimated by
Argentometric titration method, Total hardness, calcium and magnesium determined using
complex metrically by EDTA method and Sodium and potassium were determined by flame
photometric method using Digital flame photometer model 381 E.
3.2 Sediment analysis:
The sediment samples were collected with the help of Ekman grab and Peterson grab mud
sampler in polythin bottles for analysis. The sediment quality analysis was done using Adoni
(1985) and Trivedy et al., (1998).
3.3 Phytoplankton and Zooplanktons:
Qualitative: The samples were collected by filtering 50 liters of water through plankton net
(Mesh size No. 20). Plankton (phyto and zoo) samples were preserved in 100 ml plastic bottle
by using Lugol’s Iodine solution as preservative (Adoni,et al ., 1985). After preservation the
qualitative analysis was done by placing a drop of concentrated sample on glass slide and
covered with a cover slip. The glass slide with sample was placed under compound
microscope and focuses one edge of the glass cover. Biological organisms were identified
upto species level wherever possible.
19
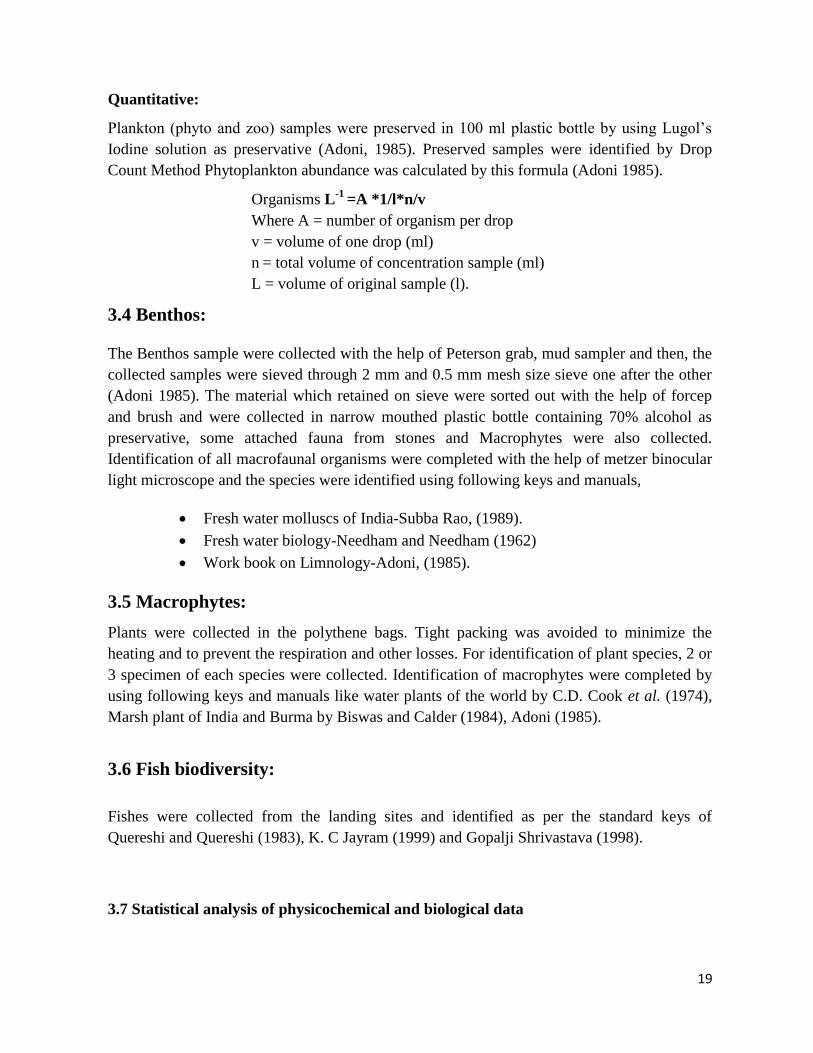
Quantitative:
Plankton (phyto and zoo) samples were preserved in 100 ml plastic bottle by using Lugol’s
Iodine solution as preservative (Adoni, 1985). Preserved samples were identified by Drop
Count Method Phytoplankton abundance was calculated by this formula (Adoni 1985).
Organisms L-1
=A *1/l*n/v
Where A = number of organism per drop
v = volume of one drop (ml)
n = total volume of concentration sample (ml)
L = volume of original sample (l).
3.4 Benthos:
The Benthos sample were collected with the help of Peterson grab, mud sampler and then, the
collected samples were sieved through 2 mm and 0.5 mm mesh size sieve one after the other
(Adoni 1985). The material which retained on sieve were sorted out with the help of forcep
and brush and were collected in narrow mouthed plastic bottle containing 70% alcohol as
preservative, some attached fauna from stones and Macrophytes were also collected.
Identification of all macrofaunal organisms were completed with the help of metzer binocular
light microscope and the species were identified using following keys and manuals,
Fresh water molluscs of India-Subba Rao, (1989).
Fresh water biology-Needham and Needham (1962)
Work book on Limnology-Adoni, (1985).
3.5 Macrophytes:
Plants were collected in the polythene bags. Tight packing was avoided to minimize the
heating and to prevent the respiration and other losses. For identification of plant species, 2 or
3 specimen of each species were collected. Identification of macrophytes were completed by
using following keys and manuals like water plants of the world by C.D. Cook et al. (1974),
Marsh plant of India and Burma by Biswas and Calder (1984), Adoni (1985).
3.6 Fish biodiversity:
Fishes were collected from the landing sites and identified as per the standard keys of
Quereshi and Quereshi (1983), K. C Jayram (1999) and Gopalji Shrivastava (1998).
3.7 Statistical analysis of physicochemical and biological data

20
3.7.1 Prati indexing: Component of Prati index for water quality assessment. This index is
based on 6 parameters namely %O2, BOD, COD, NH3, NO3 and PO4 and rates the water
quality from class 1 (unpolluted) up to class 5 (heavily polluted). It is used to classify
the water body as given bellow
Class Color-code Sum of points Quality
1 Blue 3 – 4.5 Very good, unpolluted
2 Green 4.6 – 7.5 good, slightly polluted
3 Yellow 7.6 – 10.5 moderate, doubtful
4 Orange 10.6 – 13.5 bed, polluted
5 Red 13.6 – 15 very bed, very polluted
3.7.2 Carlson’s trophic state index: It is used to classify the water body as given bellow. The
index ranges from 0-100 and has the advantage over the use of raw variables.
3.7.3 Biomonitoring indices using macrozoobenthos: In BMWP scoring they will give
certain score according to their sensitivity to pollution and finally the status of the
water body will be classified as Clean, Slightly polluted, Moderately polluted, Heavily
polluted and Severely polluted.
BMWP scoring table
S. No BMWP Score Water quality class Water quality
characteristics
1. 7 and more A Clean
2. 6-7 B Slight pollution
3. 3-6 C Moderate pollution
4. 2-5 D Heavy pollution
Carlson’s Trophic Classification of Lake.
TSI Chl P SD Trophic Class Status
<30-40 0-2.6 0-12 >8-4 Oligotrophic Good
40-50 2.6-20 12-24 4-2 Mesotrophic Moderate
50-70 20-56 24-96 2-0.5 Eutrophic Poor
70-100+ 56-155+ 96-
384+ 0.5-<0.25 Hypereutrophic
Critical
Chl- chlorophyll, P- Total phosphorous, SD- Secchi depth (Meters)

21
5. 0-2 E Severe pollution
3.7.4 Nygaard’s algal index for algal trophic status: Nygard (1949) proposed five indices
to evaluate the organic pollution of a water body on the basis of algal groups
(Myxophycean index, Chlorophycean index, Diatom index, Euglenophycean index
and compound index). These indices have been developed on the basis of the fact that
various algal groups have different tolerance to organic pollution and nutrient
enrichment.
Calculation of Nygard index
Index Oligotrophic Eutrophic
Myxophycean 0.0-0.4 0.1-3.0
Chlorophycean 0.0-0.7 0.2-9.0
Diatom 0.0-0.3 0.0-1.75
Euglenophycean 0.0-0.2 0.0-1.0
Compound 0.0-0.1 1.2-2.5

22
4. Water quality of Shahpura lake
A. Chemical observation
4.1 Water quality observation of Shahpura Lake during November 2011 to
October 2012:
Air temperature: The air temperature value ranged between 19-370C.The Maximum air
temperature value of 370C was recorded at Site-12, and While as Minimum value of 19
0C was
recorded at Site-12. The highest value of 370C was recorded in July and lowest value of 19
0C
was recorded in January at Shahpura Lake (Fig-1).
Water temperature: The Water temperature ranged between 16 to 290C. The Maximum
water temperature value of 290C was recorded at Site-2, and Minimum value of 16
0C was
recorded at Site-10. The highest value of 290C was recorded in April and lowest value of 16
0C
was recorded in February the Shahpura Lake 2012 (Fg-2).
Conductivity: Since the ions are the carries of electricity, the electrical conductivity of the
water raises according to the content of soluble salts in the water. The value ranged between
467 to 958 µs/cm. The highest value of 958 was recorded in May and lowest value of 467 was
recorded in September in the ShahpuraLake. The Maximum value of 958 was recorded at
Site-2 and Minimum value of 467 was recorded at Site -11 (Fig 3).
Total dissolved solids (TDS): Total dissolved solids are mainly the inorganic minerals and
sometimes some organic matter. The TDS value ranged between 215 to 631 mg/l. the highest
value of 631 mg/l was recorded May month and lowest value of 215 mg/l was recorded at
September in this Lake. The Maximum value of 631mg/l TDS was recorded at Site-2 and
while Minimum value of 215 mg/l was recorded at Site-11 in the Shahpura Lake 2012 (Fig 4).
pH: pH is the logarithm of the reciprocal of the hydrogen ion concentration in moles per liter.
There was significant change in the pH. The pH value ranged between 6.3 to 8.8. The highest
value of 8.8 was recorded in April and September and lowest value of 6.3 was recorded in
December. The Maximum values 8.8 were recorded at Site-6 and 11 and while as the
Minimum values 6.3 of was recorded at Site-9 (Fig 5).
Depth: The depth value ranged between 0.3 to 5.5 m. During the entire study period the
Maximum depth 5.5 m was recorded at Site-6, and Minimum depth 0.3 feet was recorded at
Site-12. The highest value of 5.5 m was recorded in September, and lowest value of 0.3 m was
recorded in July (Fig. 6).
Secchi transparency: The Secchi transparency value ranged between 18.25 to 51.5 cm. The
highest value of 51 cm was recorded in November and lowest value of 18.15 cm was recorded
in December in this Lake. The Maximum value of 51.5 cm Secchi transparency was recorded
at Site-3, and Minimum value of 18.25 cm was recorded at Site-10 at Shahpura Lake (Fig 7).

23
Turbidity (NTU): The turbidity value ranged between 2 to 96 NTU. The minimum turbidity
of 2 NTU was recorded on September at site 11 and while the maximum turbidity was
recorded 96 NTU in March at site 1. (Fig -8).
Dissolved oxygen: The D.O. value ranged between 1.6 to 13.2 mg/l. The highest value of
13.2 mg/l was recorded in January and lowest value of 1.6 mg/l was recorded in February
month. The Maximum dissolved oxygen (D.O.) value of 13.2 mg/l was recorded at Site-12.
While as Minimum value of 1.6 was recorded at Site-1 in the Shahpura Lake (Fig 9).
Alkalinity: The Carbonate alkalinity value ranged between 0 to 160 mg/l. the highest value of
160 mg/l noted in July month and lowest value of 0 mg/l was noted in February month at all
sites of Shahpura lake. The maximum value of carbonate alkalinity 160 mg/l was recorded at
Site-3 (Fig.10)
The Bicarbonate alkalinity value ranged between 16 to 308 mg/l. The highest value of 308
mg/l was noted in March and July and lowest value of 16 mg/l was noted in January. The
Maximum value of 308 mg/l was recorded at Site-1, site-4 and minimum value of 16 mg/l was
recorded at Site -2 in Shahpura Lake (Fig 11).
Total Hardness: The Total Hardness value ranged between 148 to 348 mg/l. During the
study period the highest value of 348 mg/l was noted in May month and lowest value of 148
mg/l was noted in September. The maximum value of total hardness 348 mg/l was recorded at
Site-4 and while as minimum value of 148 mg/l was recorded at Site-10 in this Lake (Fig 12).
Calcium Hardness: The Calcium Hardness value ranged between 37.61 to 78.4mg/l. The
highest value of 205m/l was noted in monsoon season and lowest value of 174mg/l was noted
in summer season. The maximum value of 212.8 mg/l was recorded at site-10 and minimum
value of 172.51 mg/l was recorded at site-5 in the Shahpura Lake 2012.
Magnesium Hardness: The Magnesium Hardness value ranged between 37.61 to 78.4mg/l.
The highest value of 75mg/l was recorded in Monsoon season and lowest value of 40mg/l was
recorded in Summer season. The Maximum value of 78.4 mg/l was recorded at Site-4 and
Minimum value of 37.61 mg/l was recorded at Site-10 in this Lake 2012.
Chloride: The chloride value ranged between 32 to 135 mg/l. The highest value of 135 mg/l
was noted in May month at site 4 and site -5 and lowest value of 32 mg/l was noted in
September at site-2 (Fig 13).
Biological Oxygen Demand (BOD): In present study BOD recorded between 3.2 to 19.2
mg/l. the highest value of BOD 19.2 mg/l recorded in December month and lowest value
of 3.2 mg/l recorded in November and October month .In spatial case maximum BOD
value 19.2 mg/l was recorded in Site -1 and minimum value of 3.2 mg/l was recorded in
Site-1 and Site 11 (Fig 14).

24
Chemical Oxygen Demand (COD): In present study COD recorded between 6.96 to
105.95 mg/l. The highest COD value 105.95 mg/l recorded in July month and lowest value
of 6.96 mg//l recorded in September .In spatial case maximum COD value of 105.95 mg/l
was recorded at Site-4 and minimum value of 6.96 mg/l recorded in Site-1 (Fig 15).
Nitrate: In present study Nitrate value ranged between 3.01 to 23.05 mg/l. The highest value
of 23.05 mg/l was noted in January and lowest value of 3.01 mg/l was noted in September.
During the present study period the Maximum value of 23.05 mg/l was recorded at Site-3 and
Minimum value of 3.01 mg/l was recorded at Site-9 (Fig 16).
Ammoniacal Nitrogen: The minimum ammonical nitrogen of 0 mg/l was recorded on
November and September at site 2, site 4, site 9, site 10 and site 12 while the maximum
ammonical nitrogen recorded was 2.97 mg/l on January month at site 1. (Fig -17).
Phosphate: The Phosphate value ranged between 0 to 4.43 mg/l. During the present study
period the highest value of 4.43 mg/l was recorded in May and lowest value of 0 mg/l was
recorded in September. The Maximum value of 4.43 mg/l was recorded at Site-7 and
Minimum value of 0 mg/l was recorded at Site-3 and 5 (Fig 18).

25
Fig 1: Graphical presentation of air temperature in Shahpura lake
Fig 2: Graphical presentation of water temperature in Shahpura lake
Fig 3: Graphical presentation of conductivity in Shahpura lake
0
5
10
15
20
25
30
35
40
S-1 S-2 S-3 S-4 S-5 S-6 S-7 S-8 S-9 S-10 S-11 S-12
Air
Te
mp
era
ture
(0
C)
Sampling sites
Nov-11
Dec-11
Jan-12
Feb-12
Mar-12
Apr-12
May-12
Jun-12
Jul-12
Sep-12
Oct-12
0
5
10
15
20
25
30
35
S-1 S-2 S-3 S-4 S-5 S-6 S-7 S-8 S-9 S-10 S-11 S-12
Wat
er
Te
mp
era
ture
(0
C)
Sampling sites
Nov-11
Dec-11
Jan-12
Feb-12
Mar-12
Apr-12
May-12
Jun-12
Jul-12
Sep-12
Oct-12
0
200
400
600
800
1000
1200
S-1 S-2 S-3 S-4 S-5 S-6 S-7 S-8 S-9 S-10 S-11 S-12
Co
nd
uct
ivit
y (µ
s/cm
)
Sampling sites
Nov-11
Dec-11
Jan-12
Feb-12
Mar-12
Apr-12
May-12
Jun-12
Jul-12
Sep-12
Oct-12

26
Fig 4: Graphical presentation of Total Dissolved Solids (TDS) in Shahpura lake Bhopal.
Fig 5: Graphical presentation of pH in Shahpura lake Bhopal.
Fig 6: Graphical presentation of depth in Shahpura lake Bhopal.
0
100
200
300
400
500
600
700
S-1 S-2 S-3 S-4 S-5 S-6 S-7 S-8 S-9 S-10 S-11 S-12
TDS
(mg/
l)
Sampling sites
Nov-11
Dec-11
Jan-12
Feb-12
Mar-12
Apr-12
May-12
Jun-12
Jul-12
Sep-12
Oct-12
0
2
4
6
8
10
12
S-1 S-2 S-3 S-4 S-5 S-6 S-7 S-8 S-9 S-10 S-11 S-12
pH
Sampling sites
Nov-11
Dec-11
Jan-12
Feb-12
Mar-12
Apr-12
May-12
Jun-12
Jul-12
Sep-12
Oct-12
0
1
2
3
4
5
6
1 2 3 4 5 6 7 8 9 10 11 12
De
pth
(m
)
Sampling sites Nov-11
Dec-11
Jan-12
Feb-12
Mar-12
Apr-12
May-12
Jun-12
Jul-12
Sep-12
Oct-12

27
Fig 7: Graphical presentation of secchi transparency in Shahpura lake Bhopal.
Fig 8: Graphical presentation of turbidity in Shahpura lake Bhopal.
Fig 9: Graphical presentation of dissolved oxygen (DO) in Shahpura lake Bhopal.
0
10
20
30
40
50
60
70
S-1 S-2 S-3 S-4 S-5 S-6 S-7 S-8 S-9 S-10 S-11 S-12
Secc
hi T
ran
spar
en
cy (
cm)
Sampling sites
Nov-11
Dec-11
Jan-12
Feb-12
Mar-12
Apr-12
May-12
Jun-12
Jul-12
Sep-12
Oct-12
0
20
40
60
80
100
120
S-1 S-2 S-3 S-4 S-5 S-6 S-7 S-8 S-9 S-10 S-11 S-12
Turb
idit
y (N
TU)
Sampling sites
Nov-11
Dec-11
Jan-12
Feb-12
Mar-12
Apr-12
May-12
Jun-12
Jul-12
Sep-12
Oct-12
0
2
4
6
8
10
12
14
S-1 S-2 S-3 S-4 S-5 S-6 S-7 S-8 S-9 S-10 S-11 S-12
Dis
solv
ed
Oxy
gen
(m
g/l)
Sampling sites
Nov-11
Dec-11
Jan-12
Feb-12
Mar-12
Apr-12
May-12
Jun-12
Jul-12
Sep-12
Oct-12

28
Fig 10: Graphical presentation of carbonate alkalinity in Shahpura lake Bhopal.
Fig 11: Graphical presentation of bicarbonate alkalinity in Shahpura lake Bhopal.
Fig 12: Graphical presentation of total hardness in Shahpura lake Bhopal.
0
20
40
60
80
100
120
140
160
180
S-1 S-2 S-3 S-4 S-5 S-6 S-7 S-8 S-9 S-10 S-11 S-12
Car
bo
nat
e a
lkal
init
y (m
g/l)
Sampling sites
Nov-11
Dec-11
Jan-12
Feb-12
Mar-12
Apr-12
May-12
Jun-12
Jul-12
Sep-12
Oct-12
0
50
100
150
200
250
300
350
400
S-1 S-2 S-3 S-4 S-5 S-6 S-7 S-8 S-9 S-10 S-11 S-12
Bic
arb
on
ate
alk
alin
ity
(mg/
l)
Sampling sites
Nov-11
Dec-11
Jan-12
Feb-12
Mar-12
Apr-12
May-12
Jun-12
Jul-12
Sep-12
Oct-12
0
50
100
150
200
250
300
350
400
S-1 S-2 S-3 S-4 S-5 S-6 S-7 S-8 S-9 S-10 S-11 S-12
Tota
l Har
dn
ess
(m
g/l)
Sampling sites
Nov-11
Dec-11
Jan-12
Feb-12
Mar-12
Apr-12
May-12
Jun-12
Jul-12
Sep-12
Oct-12

29
Fig 13: Graphical presentation of chlorides in Shahpura lake Bhopal.
Fig 14: Graphical presentation of biochemical oxygen demand in Shahpura lake Bhopal.
Fig 15: Graphical presentation of chemical oxygen demand in Shahpura lake Bhopal.
0
20
40
60
80
100
120
140
160
S-1 S-2 S-3 S-4 S-5 S-6 S-7 S-8 S-9 S-10 S-11 S-12
Ch
lori
de
(m
g/l)
Sampling sites
Nov-11
Dec-11
Jan-12
Feb-12
Mar-12
Apr-12
May-12
Jun-12
Jul-12
Sep-12
Oct-12
0
5
10
15
20
25
S-1 S-2 S-3 S-4 S-5 S-6 S-7 S-8 S-9 S-10 S-11 S-12
BO
D (
mg/
l)
Sampling sites
Nov-11
Dec-11
Jan-12
Feb-12
Mar-12
Apr-12
May-12
Jun-12
Jul-12
0
20
40
60
80
100
120
S-1 S-2 S-3 S-4 S-5 S-6 S-7 S-8 S-9 S-10 S-11 S-12
CO
D (
mg/
l)
Sampling sites
Nov-11
Dec-11
Jan-12
Feb-12
Mar-12
Apr-12
May-12
Jun-12
Jul-12
Sep-12
Oct-12

30
Fig 16: Graphical presentation of nitrate nitrogen in Shahpura lake Bhopal.
Fig 17: Graphical presentation of ammonical nitrogen in Shahpura lake Bhopal.
Fig 18: Graphical presentation of phosphate in Shahpura lake Bhopal.
0
1
2
3
4
5
6
S-1 S-2 S-3 S-4 S-5 S-6 S-7 S-8 S-9 S-10 S-11 S-12
Nit
era
te n
itro
gen
(m
g/l)
Sampling sites
Nov-11
Dec-11
Jan-12
Feb-12
Mar-12
Apr-12
May-12
Jun-12
Jul-12
Sep-12
Oct-12
0
0.5
1
1.5
2
2.5
3
3.5
S-1 S-2 S-3 S-4 S-5 S-6 S-7 S-8 S-9 S-10 S-11 S-12
Am
mo
nic
al n
itro
gen
(m
g/l)
Sampling sites
Nov-11
Dec-11
Jan-12
Feb-12
Mar-12
Apr-12
May-12
Jun-12
Jul-12
Sep-12
Oct-12
0
1
2
3
4
5
6
S-1 S-2 S-3 S-4 S-5 S-6 S-7 S-8 S-9 S-10 S-11 S-12
Ph
osp
hat
e (
mg/
l)
Sampling sites
Nov-11
Dec-11
Jan-12
Feb-12
Mar-12
Apr-12
May-12
Jun-12
Jul-12
Sep-12
Oct-12

31
Table 4: Water quality of Shahpura lake during November 2011 to October 2012
Parameters
1 2 3 4 5 6 7 8 9 10 11 12 13 14 15 16 17 18 19 20 20 21
S-1
Min 24.5 19.5 536 254 7.2 0.5 19 11 1.6 10 7.2 230 130 17.5 44.955 3.2 6.944 0.85 0.85 0.24 0.04 0.02
Max 33 28 928 594 8.6 1.5 52 96 8.7 82.8 308 294 231 186 132 54 74.4 4.31 6.94 4.62 0.525 1.01
Avg. 28.45 25 759.2 466 7.82 0.858 35.91 39 6.5 14.6 234 244 186.5 69.9 84.56 13.41 45.59 3.062 2.44 2.26 0.193 0.45
SD 3.02 2.72 121 107 0.364 0.3 10.05 25 2.1 25.1 86.4 82.9 31.84 45.4 25.466 14.7 20.48 1.002 1.72 1.47 0.21 0.36
S-2
Min 20.5 19 498 229 6.9 1.133 32 3 4.8 28 8.4 238 126 16.5 42.957 6.8 32 3.15 0.06 0.74 0.2 0.08
Max 33 29 958 613 8.4 2.8 58 52 10 100 292 306 228 200 164 36 90.2 4.967 11.3 4.69 0.625 0.47
Avg. 27.22 24.8 755.6 465 7.846 1.622 43.32 31 7.7 46.4 190 231 187.4 73.2 83.062 12.76 61.54 4.196 1.44 2.01 0.27 0.31
SD 3.58 2.99 118.7 110 0.407 0.568 6.934 14 1.4 33.2 95.6 81.9 31.01 62.5 31.555 9.08 17.58 0.643 3.49 1.49 0.227 0.17
S-3
Min 20.5 18.5 510 235 7.4 1.567 34 4 7.2 20 8 22 126 17.5 36.963 4.8 28.35 2.914 0.01 0.83 0.01 0.24
Max 32 27 838 536 8.6 4 63 51 10 160 324 282 232 164 112 52 83.24 5.207 22.8 4.54 0.425 0.7
Avg. 27.90 24.4 733.7 451 7.978 2.522 45.18 31 8.2 47.2 200 242 182.4 62.1 73.559 14.73 55.03 4.133 2.42 2.16 0.106 0.33
SD 3.27 2.68 94.44 96 0.393 0.689 7.837 14 1 50.6 81.5 74.2 30.94 42.9 20.691 13.48 15.83 0.852 7.15 1.28 0.18 0.26
S-4
Min 22 18 532 245 7.6 1.584 34 7 6 20 9.6 236 104 18 37.962 5.6 39.36 3.058 0.2 0.78 0.6 0.02
Max 33 27 840 538 8.6 4 59 47 10 119 336 348 256 186 135.93 54 106 7.2 21.4 4.42 0.6 0.46
Avg. 28.31 24.6 733 450 8.056 2.402 43.8 29 8.2 49.5 210 262 180.8 83.2 79.875 12.6 58.22 4.413 2.39 2.23 0.133 0.25
SD 3.07 2.63 89.2 95 0.334 0.674 7.363 12 1.4 27.3 90.2 94.3 43.75 52 31.957 14.24 21.95 1.217 6.7 1.35 0.263 0.16
S-5
Min 20 17.5 520 239 6.64 2 38 8 5.2 16 7.6 212 132 18 39.96 4.8 13 3.054 0.05 0.84 0.05 0.24
Max 33 27 830 531 8.4 3.5 52 62 10 84.5 280 312 200 172 135.93 44 83.24 4.827 25 5.06 0.34 0.56
Avg. 27.5 23.6 726.8 446 7.666 2.516 44.46 33 7.7 25.7 203 237 172.1 73.1 79.375 12.09 43.81 4.112 2.95 2.19 0.098 0.33
SD 3.51 3.03 89.26 94 0.601 0.496 4.687 16 1.8 27.4 76.3 82.6 21.32 46.6 30.697 11.47 20.65 0.692 7.33 1.61 0.141 0.23
S-6
Min 22 18 492 226 6.84 2.9 38 6 4.4 8 8 24 138 19.4 44.955 6 8.4 3.08 0.03 0.77 0.01 0.03
Max 32 27 853 546 8.8 5.5 66 45 9.6 95.3 284 268 224 178 132 46 83 5.15 7.38 4.66 0.25 1.22
Avg. 27.81 24.1 728.1 447 8.022 3.74 46.31 25 7.5 30.5 199 233 187.7 54.1 78.466 12.89 40.74 4.149 0.89 2.26 0.113 0.42
SD 2.72 2.79 96.13 97 0.497 0.797 7.489 13 1.5 26.7 79.1 70.1 23.06 44.9 29.923 12.03 24.54 0.805 2.28 1.39 0.091 0.47
S-7
Min 20 19 511 235 6.99 1.167 38 5 4 24 10 220 130 16 38.961 4.4 25.2 3.1 0.03 0.82 0.03 0.04
Max 32.5 27 850 544 9.7 4.5 54 46 10 109 328 312 232 182 140 42 77.96 5.18 9.98 4.78 1.275 0.76
Avg. 28.09 24 746.7 457 7.935 3.249 44.4 27 7.1 36.8 205 238 179.4 63.4 78.831 12.44 57.36 4.133 1.13 2.28 0.296 0.25
SD 3.73 2.77 90.01 92 0.708 1.028 4.704 13 2.1 28.6 79.5 82.4 30.95 48.5 28.282 11.48 17.38 0.784 3.11 1.46 0.549 0.3

32
1. Air Temperature (0C), 2. Water Temperature (
0C), 3. Conductivity (µs/cm), 4. Total Dissolved Solids (ppm), 5. pH, 6. Depth (m),
7. Secchi Transparency (cm), 8. Turbidity (NTU), 9. Dissolved Oxygen (mg./l), 10. Carbonate Alkalinity (mg/l), 11. Bicarbonate
Alkalinity (mg./l), 12. Total Hardness (mg./l), 13. Calcium Hardness (mg./l), 14. Magnesium Hardness (mg./l), 15. Chlorides (mg/l),
16. Biochemical Oxygen Demand (mg/l), 17. Chemical Oxygen Demand (mg/l), 18. Nitrate Nitrogen (mg/l), 19. Ammonical Nitrogen
(mg/l), 20. Phosphate (mg/l), 21. Total Iron (mg/l) and 22. Fluoride (mg/l)
Parameters
1 2 3 4 5 6 7 8 9 10 11 12 13 14 15 16 17 18 19 20 20 21
S-8
Min 20 18 486 224 7.01 1 36.5 4 1.6 24 8 18 130 18.5 38.961 4.4 8.4 1.8 0.01 0.8 0.01 0.06
Max 33 26 855 547 8.4 2.4 55 89 10 88.9 340 320 205.8 166 120 46 74.4 5.16 15.1 4.63 0.25 0.53
Avg. 27.00 23.6 733.6 450 7.966 1.43 43.65 35 6.7 43.7 189 246 179.2 74 74.65 12.75 48.79 3.943 1.66 2.18 0.088 0.3
SD 3.43 2.68 96.24 96 0.402 0.449 5.828 25 2.6 24 87.7 81.5 23.13 49.2 22.74 12.31 20.92 1.055 4.73 1.34 0.104 0.19
S-9
Min 20 17 504 232 6.3 1.2 22.3 5 4.8 0 11.6 212 134 20.4 41.958 7.2 14 2 0.03 0.68 0.02 0.01
Max 30 27 864 553 8.5 2.6 52 58 12 129 316 320 212 170 132 38 74.4 4.94 12.6 4.85 0.2 0.8
Avg. 26.13 23.3 733.1 449 7.722 1.804 41.16 28 7.9 41.7 217 245 177.7 75.8 74.196 12.64 43.7 3.91 1.4 2.16 0.079 0.32
SD 2.92 3.14 96.27 96 0.607 0.433 8.311 15 2.1 34.8 82.4 85.5 24.17 42.9 24.686 9.742 18.59 0.991 3.94 1.52 0.083 0.29
S-10
Min 20 16 507 233 6.95 3.2 18.25 3 4.4 18 5.2 244 150 12 40.959 6.4 21.6 3.193 0.05 0.81 0.05 0.06
Max 30 27 860 550 8.6 4.1 58 62 9 57.8 288 320 308 148 120 28 69.44 5.136 19.4 4.91 0.425 1.18
Avg. 24.90 22.4 740.5 455 7.85 3.563 43.7 31 6.2 23.6 203 254 202 58.5 72.833 12.15 40.78 4.252 2.09 2.43 0.13 0.48
SD 2.9901 3.66 96.08 98 0.51 0.32 11.41 19 1.4 16.3 81.5 86.8 50.08 43.1 21.227 7.498 13.65 0.698 6.09 1.46 0.171 0.42
S-11
Min 20 17.5 467 215 6.9 3 20.5 2 4 12 4 244 144 21.9 37.962 3.2 14 2.83 0.05 0.8 0.05 0.13
Max 32 28 837 536 8.8 4.8 62 46 9.2 56 288 320 248 152 133.93 42 83.24 5.04 8.94 4.54 1.1 1.06
Avg. 25.27 22.9 724.5 445 7.982 4.085 42.2 24 6.6 28.5 192 253 181.2 78.3 81.784 11.69 51.12 3.868 1.05 2.06 0.27 0.43
SD 4.24 3.6 98.47 97 0.49 0.521 11.15 16 1.6 21.7 76 86.8 27.79 46 26.787 11.07 23.3 1.514 2.78 1.5 0.469 0.36
S-12
Min 19 17 518 238 7.17 0.152 28 3 5.6 12 6.4 16 118 32.6 45.954 7.2 8.4 2.83 0.05 0.79 0.025 0.26
Max 37 27 843 540 8.7 1 58 52 13 73.6 276 340 232 164 111.94 56 104.2 5.019 9.22 4.69 0.675 1.12
Avg. 28.45 24.2 728.7 446 8.027 0.608 36.91 27 8.5 37.4 191 266 180.1 84 78.919 13.85 45.47 3.896 1.05 2.02 0.271 0.58
SD 5.15 3.06 86.06 91 0.46 0.252 9.005 19 2.3 22.1 76.2 87.7 34.3 40.1 20.265 14.62 27.95 1.513 2.87 1.51 0.298 0.39

33
4.2 Water quality observation of Shahpura Lake: (Shore line)
General parameter
pH: There was significant change in the pH value. The pH value ranged between 7.0 to 8.9.
The highest value of 8.9 was recorded during the month of May- 2012 and and lowest value
of 7.0 was recorded in Dec- 2010. The Maximum value 8.9 was recorded at Site S-12 while
as the Minimum values 7.0 was recorded at Site S-7 (Fig 19).
Electrical Conductivity: Since the ions are the carries of electricity, the electrical
conductivity of the water raises according to the content of soluble salts in the water. The
value ranged between 520 to 1120 µs/cm. The Max value of 1120 was recorded in june 2012
and Min value of 520 was recorded oct-2010 in the Shahpura Lake. The Maximum value of
1120 was recorded at Site S-2 and Minimum value of 520was recorded at Site S -13 (Fig 20).
Total dissolved solids (TDS): Total dissolved solids are mainly the inorganic minerals and
sometimes some organic matter. The TDS value ranged between 311to717 mg/l. the highest
value of 717 mg/l was recorded June-2012 at site S-2 and lowest value of 311 mg/l was
recorded at oct-2010 at the site of S-5 in this Lake. (Fig 21).
POLLUTION INDICATING PARAMETER
PERCENTAGE OF DISSOLVED OXYGEN:-The percentage D.O. has a great importance
in an aquatic eco-system. It is considered as the pollution indicator parameter. It is reflects the
biological activity taking place in a water body and also determines the biological changes,
which is due to aerobic and anaerobic organisms. A common observation was that the bottom
oxygen demand is low as compare to the surface water.
Percentage of D.O. ranged between 0.0 to 98.9%l in surface layer and in the bottom layer nil.
Dissolved oxygen in the bottom layer generally observed was low because of higher microbial
activity. Maximum D.O. percentage of 98.9% was observed at site S-10 being this point less
pollution is observed and minimum D.O percentage 0.0% was observed at site S-2 this may be
due to entry of raw sewage through char-imli nala (Fig 22).
NITRATE:-Nitrate is the important pollution indicating parameter. It is considered as
important plant nutrient. Nitrate is the most oxidized or stable form of nitrogen. In shahpura
lake the nitrate content of the water was in the range between 0.4 to 37.5mg/l. Higher
concentration 37.5 of nitrate was found in site of S-2 March-2011 this may be due to untreated

34
raw sewage. The raw sewage is the source of nitrate and phosphate in the water.Minimum
Nitrate 0.4 was observed at site S-5 in May-2012 during the pre-monsoon season. This may be
due to the site being far away from points of sewage water. (Fig 23).
T-PHOSPHATE:- In the aquatic ecosystem inorganic phosphate as soluble O-phosphate play
a dynamic role. The O-phosphate are readily taken up by the phytoplankton or lost to the
sediments. In the eutrophic region high phosphate content supports an increased level of
primary production till nitrogen become limiting. In Shahpura Lake range observed between
0.0 to 9.0 mg/l. the maximum T-phosphate 9.0mg/l was found at site S-4 in the month of
May-2010 this may be due to nearby dense macrophyte growth and religious activities and
minimum phosphate 0..0 was found at sites-5 this may be due to less pollution in this area.
(Fig 24).
CHEMICAL OXYGEN DEMAND (COD): COD is an important parameter for knowing
the quality of water, which analyzed by potassium dichromate open reflux method. High COD
value may be due to presence of long chain of hydro-carbon for Ex organic matter like amino
acid ,glucose. In shahpura lake COD range observed between 1.0 to 144.0mg/l. the maximum
COD 144.0 mg/l was observed at site S-2 during the month of Nov-2010 which has untreated
raw sewage and minimum COD 1.0 was observed at site S-12 Nov-2010 (Fig 25).
AMMONIACAL NITROGEN: When plants animal die, they decompose to produce
ammonia is an oxidized to nitrite which is unstable and gets oxidized to Nitrate which is
stable form of Nitrogen. As temperature increased NH3 gets released in to the atmosphere in
the form of gas. In a shapura lake NH3 range between0.0 to 10.0mg/l. the maximum NH3-N
10.0mg/l was observed at site S-1,S-2,S-12 during the month of April,Jan,May-2010 which is
very much higher than the permissible limit (0.3mg/l).This may be due to raw sewage
entering into the lake and NH3-N 0.0mg/l was observed at site S-5 May-2011,S-7 Nov-2011,
S-9 May&june-2012,S-10 Nov&Dec-2011,S-10 Feb&May-2012 and S-11Nov-2011 its
indicates NH3-N has converted to Nitrite to Nitrate. (Fig -26)
Fluoride: The fluoride value ranged between 0.0 to 1.5 mg/l. During the study period lowest
value observed 0.0mg/l and the highest value observed 1.5mg/l it was recorded at site S-01
Nov-2011.
Total Hardness: The Total Hardness value ranged between 120 to 340 mg/l. During the
study period the highest value of 348 mg/l was noted in Feb 2012 and lowest value of 120
mg/l was noted in june2010. The maximum value of total hardness 340 mg/l was recorded at
Site S-1 and while as minimum value of 120 mg/l was recorded at Site S-10 in this Lake .(Fig
27).

35
Major Ions
Carbonate (CO3-): The Carbonate value ranged between 0.0 to 40.0 mg/l. the highest value
of 40 mg/l noted in june-2012 maximum value of carbonate 40.0 mg/l was recorded at Site S-
8 (Fig.28) .
Bicarbonate (HCO3- ):Bicarbonate value ranged between 109 to 392 mg/l. The highest value
of 392 mg/l was noted in june -2011 and lowest value of 109mg/l was noted in June-2012.
The Maximum value of 392 mg/l was recorded at Site S-12, and minimum value of109 mg/l
was recorded at Site S -10 in Shahpura Lake (Fig 29).
Calcium Ion (Ca++
): The Calcium ion value ranging between 30.4 to 94mg/l. The highest
value of 94mg/l was noted in may-2012 and lowest value of 30.4mg/l was noted in Oct-2010.
The maximum value of 94 mg/l was recorded at site S-13 and minimum value of 30.4 mg/l
was recorded at site S-5 in the Shahpura Lake .
Magnesium ion(Mg++
): The Magnesium ion value ranged between 7.3 to 61.0mg/l. The
highest value of 61.0mg/l was recorded in May-2012 and lowest value of 7.3mg/l was
recorded in Feb-2011. The Maximum value of 61.0 mg/l was recorded at Site S-2 and
Minimum value of 7.3 mg/l was recorded at Site S-8 in this Lake.
Sodium (Na+): The sodium value ranging between 25.0 to 92.0mg/l. The highest value of
92.0mg/l was recorded in july-2010and june-2011 and lowest value of 25.0mg/l was recorded
in Feb-2011. The Maximum value of 92.0 mg/l was recorded at Site S-4&S-10 and Minimum
value of 25.0 mg/l was recorded at Site S-1 in this Lake.
Potassium(k+): The Potassium value ranging between 0.1 to 19.2mg/l. The highest value of
19.2mg/l was recorded in May-2010 and lowest value of 0.1mg/l was recorded in May-2011
and May-2012. The Maximum value of 19.2 mg/l was recorded at Site S-2and Minimum
value of 0.1mg/l was recorded at Site S-4&S-12 in this Lake.
Chloride: The chloride value ranged between 42 to 145 mg/l. The highest value of 145 mg/l
was noted in June-2011 at site S- 6 and lowest value of 42 mg/l was noted in September-2011
at site S-2 (Fig 30).
Sulphate: The sulphate value ranged between 4.0 to 92.0 mg/l. The highest value of 92.0
mg/l was noted in Dec-2011 at site S- 1 and lowest value of 4.0 mg/l was noted in Novr-2011
at site S-1 in the Shahpura lake.

36
General water quality parameters in Shahpura lake, Bhopal (MP) during year 2010 to 2012
Fig 19: Graphical presentation of pH in Shahpura lake.
Fig 20: Graphical presentation of Conductivity in Shahpura lake
Fig 21: Graphical presentation of TDS in Shahpura lake
7.4
7.6
7.8
8.0
8.2
8.4
8.6
S-1 S-2 S-3 S-4 S-5 S-6 S-7 S-8 S-9 S-10 S-11 S-12 S-13
pH
Sampling sites
2010 2011 2012
0.0
300.0
600.0
900.0
1200.0
S-1 S-2 S-3 S-4 S-5 S-6 S-7 S-8 S-9 S-10 S-11 S-12 S-13
Co
nd
icti
vit
y (
)
Sampling sites
2010 2011 2012
0.0
150.0
300.0
450.0
600.0
750.0
S-1 S-2 S-3 S-4 S-5 S-6 S-7 S-8 S-9 S-10 S-11 S-12 S-13
TD
S (
mg
/l)
Sampling sites
2010 2011 2012

37
Pollution indicator parameters in Shahpura lake, Bhopal
Fig 22: Graphical presentation of NH3-N in Shahpura lake
Fig 23: Graphical presentation of NO2-NO3 in Shahpura lake
Fig 24: Graphical presentation of T-PO4 in Shahpura lake
0.0 1.0 2.0 3.0 4.0 5.0 6.0 7.0 8.0 9.0
S-1 S-2 S-3 S-4 S-5 S-6 S-7 S-8 S-9 S-10 S-11 S-12 S-13
NH
3-N
(m
g/l
)
Sampling sites
2010 2011 2012
0.0
1.0
2.0
3.0
4.0
5.0
6.0
7.0
S-1 S-2 S-3 S-4 S-5 S-6 S-7 S-8 S-9 S-10 S-11 S-12 S-13
NO
2+
NO
3 (
mg
/l)
Sampling sites
2010 2011 2012
0.0
0.5
1.0
1.5
2.0
2.5
3.0
3.5
4.0
S-1 S-2 S-3 S-4 S-5 S-6 S-7 S-8 S-9 S-10 S-11 S-12 S-13
T-P
O4 (
mg
/l)
Sampling sites
2010 2011 2012

38
Fig 25: Graphical presentation of Iron in Shahpura lake
Fig 26: Graphical presentation of Fluoride in Shahpura lake
Fig 27: Graphical presentation of COD in Shahpura lake
0
0.05
0.1
0.15
0.2
0.25
0.3
0.35
0.4
0.45
S-1 S-2 S-3 S-4 S-5 S-6 S-7 S-8 S-9 S-10 S-11 S-12 S-13
Fe
(m
g/l
)
Sampling sites
2011 2012
0.0
0.1
0.2
0.3
0.4
0.5
0.6
0.7
0.8
S-1 S-2 S-3 S-4 S-5 S-6 S-7 S-8 S-9 S-10 S-11 S-12 S-13
F (m
g/l
)
Sampling sites
2010 2011 2012
0.0
10.0
20.0
30.0
40.0
50.0
60.0
70.0
80.0
90.0
100.0
S-1 S-2 S-3 S-4 S-5 S-6 S-7 S-8 S-9 S-10 S-11 S-12 S-13
CO
D (
mg
/l)
Sampling sites
2010 2011 2012

39
Fig 28: Graphical presentation of Temperature in Shahpura lake
Fig 29: Fig Graphical presentation of DO in Shahpura lake
Fig 30: Graphical presentation of Tot-H in Shahpura lake
21.5
22.0
22.5
23.0
23.5
24.0
24.5
25.0
25.5
S-1 S-2 S-3 S-4 S-5 S-6 S-7 S-8 S-9 S-10 S-11 S-12 S-13
Te
mp
ratu
re (
0C
)
Sampling sites
2010 2011 2012
0.0
1.0
2.0
3.0
4.0
5.0
6.0
7.0
S-1 S-2 S-3 S-4 S-5 S-6 S-7 S-8 S-9 S-10 S-11 S-12 S-13
DO
(m
g/l
)
Sampling sites
2010 2011 2012
0.0
50.0
100.0
150.0
200.0
250.0
300.0
350.0
S-1 S-2 S-3 S-4 S-5 S-6 S-7 S-8 S-9 S-10 S-11 S-12 S-13
To
tal H
ard
ne
ss (
mg
/l)
Sampling sites
2010 2011 2012

40
Major Ions in Shahpura lake
Fig 31: Graphical presentation of Ca ion in Shahpura lake
Fig 32: Graphical presentation of Mg ion in Shahpura lake
Fig 33: Graphical presentation of Sodium in Shahpura lake
0.0
10.0
20.0
30.0
40.0
50.0
60.0
70.0
80.0
90.0
S-1 S-2 S-3 S-4 S-5 S-6 S-7 S-8 S-9 S-10 S-11 S-12 S-13
Ca (
mg
/l)
Sampling sites
2010 2011 2012
0.0
5.0
10.0
15.0
20.0
25.0
30.0
35.0
40.0
S-1 S-2 S-3 S-4 S-5 S-6 S-7 S-8 S-9 S-10 S-11 S-12 S-13
Mg
(m
g/l
)
Sampling sites
2010 2011 2012
0.0
10.0
20.0
30.0
40.0
50.0
60.0
70.0
S-1 S-2 S-3 S-4 S-5 S-6 S-7 S-8 S-9 S-10 S-11 S-12 S-13
Na (
mg
/l)
Sampling sites
2010 2011 2012

41
Fig 34: Graphical presentation of Potassium in Shahpura lake
Fig 35: Graphical presentation of Chloride in Shahpura lake
Fig 36: Graphical presentation of Sulphate in Shahpura lake
0.0
1.0
2.0
3.0
4.0
5.0
6.0
7.0
8.0
S-1 S-2 S-3 S-4 S-5 S-6 S-7 S-8 S-9 S-10 S-11 S-12 S-13
K (
mg
/l)
Sampling sites
2010 2011 2012
0.0
20.0
40.0
60.0
80.0
100.0
120.0
S-1 S-2 S-3 S-4 S-5 S-6 S-7 S-8 S-9 S-10 S-11 S-12 S-13
Ch
lori
de
(m
g/l
)
Sampling sites
2010 2011 2012
0.0
10.0
20.0
30.0
40.0
50.0
60.0
70.0
S-1 S-2 S-3 S-4 S-5 S-6 S-7 S-8 S-9 S-10 S-11 S-12 S-13
SO
4 (
mg
/l)
Sampling sites
2010 2011 2012

42
Fig 37: Graphical presentation of Carbonate in Shahpura lake
Fig 38: Graphical presentation of Bi-Carbonate in Shahpura lake
0.0
2.0
4.0
6.0
8.0
10.0
12.0
14.0
16.0
S-1 S-2 S-3 S-4 S-5 S-6 S-7 S-8 S-9 S-10 S-11 S-12 S-13
CO
3 (m
g/l
)
Sampling sites
2010 2011 2012
0.0
50.0
100.0
150.0
200.0
250.0
300.0
350.0
S-1 S-2 S-3 S-4 S-5 S-6 S-7 S-8 S-9 S-10 S-11 S-12 S-13
HC
O3 (
mg
/l)
Sampling sites
2010 2011 2012

43
Table 5: Surface water (shore line) quality of Shahpura Lake (Year 2010)
State Water Quality Laboratory Level II +,Bhopal
Shoreline Surface Water Quality Data (April 2010 to June. 2012) of Shahpura Lake (WQ-PDS) HP II Year
2010 General Pollution indicator parameters
Hardness Major Ions
Parameter pH_GEN EC_GEN TDS NH3-N NO2+NO3 NO3-N p-TOT F COD Temp DO Har_T Ca Mg Na K Cl SO4 CO3 HCO3
Unit µmho/cm mg/L mg N/L mg N/L mg N/L mgP/L mg/L mg/L oC mg/L mgCaCO3/L mg/L mg/L mg/L mg/L mg/L mg/L mg/L mg/L
S-1
Avg 8.1 819.1 501.7 5.0 5.8 25.9 2.3 0.6 65.4 24.4 3.2 265.4 61.5 27.2 52.4 5.7 83.4 54.6 1.5 297.4
Max 8.3 1000.0 620.0 5.0 8.0 35.7 6.0 1.1 104.0 27.0 3.3 322.0 67.2 39.4 80.0 13.5 128.0 71.0 4.4 388.0
Min 8.0 688.0 448.0 5.0 3.8 16.9 0.0 0.1 38.0 20.0 3.0 220.0 56.8 14.6 38.0 1.0 66.0 40.0 0.0 226.5
SD 0.1 129.2 69.8 0.0 1.7 7.4 2.1 0.5 29.7 2.6 0.2 34.9 3.8 7.8 13.5 5.3 20.8 12.2 1.9 64.0
S-2
Avg 8.1 764.7 479.6 8.0 5.2 23.4 1.7 0.4 81.2 24.4 3.0 245.4 62.2 21.9 54.7 7.2 83.4 46.0 1.9 273.1
Max 8.4 830.0 535.0 9.0 9.0 40.1 3.0 1.0 144.0 27.0 3.1 256.0 67.2 24.3 72.0 19.2 114.0 74.0 5.8 341.6
Min 7.9 674.0 431.0 7.0 2.5 11.2 1.0 0.1 48.5 20.0 2.8 232.0 57.6 20.4 39.0 1.1 68.0 18.0 0.0 231.6
SD 0.2 67.7 39.4 1.4 2.4 10.7 0.8 0.4 38.2 2.6 0.2 10.4 3.5 1.2 9.9 7.3 16.1 21.3 2.5 39.8
S-3
Avg 8.3 701.9 455.3 1.0 2.7 12.2 3.2 0.4 25.9 24.4 3.4 237.4 57.0 23.1 52.9 5.4 82.4 49.6 6.1 241.9
Max 8.5 754.0 511.0 1.0 3.6 16.1 5.4 1.0 41.2 27.0 3.5 288.0 75.2 29.2 68.0 16.8 105.0 87.0 14.4 302.6
Min 8.0 595.0 380.0 1.0 1.6 7.1 0.0 0.0 11.4 20.0 3.2 200.0 40.0 18.5 35.0 1.4 62.0 26.0 2.2 193.7
SD 0.2 53.9 39.6 0.0 0.8 3.5 2.2 0.4 11.2 2.6 0.2 33.5 15.3 3.5 11.9 5.8 17.2 23.3 4.2 33.1
S-4
Avg 8.1 740.1 444.7 1.0 3.7 16.6 3.6 0.1 17.3 24.4 4.1 202.7 54.7 16.0 61.0 5.0 93.6 46.7 1.6 206.9
Max 8.5 949.0 524.0 1.0 7.2 32.1 9.0 0.3 25.7 27.0 4.2 236.0 73.6 23.3 88.0 12.0 121.0 60.0 4.8 239.1
Min 7.9 648.0 384.0 1.0 2.0 8.9 0.0 0.0 5.6 20.0 4.0 166.0 42.4 9.7 39.0 1.4 65.0 40.0 0.0 163.5
SD 0.2 110.0 45.4 0.0 2.0 9.1 3.7 0.1 7.2 2.6 0.1 27.9 11.1 4.9 20.7 4.6 25.1 7.5 1.8 27.3
S-5
Avg 8.1 711.0 448.9 1.0 2.6 11.5 0.6 0.4 23.5 24.4 4.4 230.6 55.5 22.3 54.7 5.9 87.7 44.4 3.5 232.9
Max 8.4 771.0 553.0 1.0 5.5 24.5 1.0 1.2 59.2 27.0 4.5 280.0 73.6 25.3 72.0 17.0 116.0 72.0 9.6 327.0
Min 7.7 565.0 311.0 1.0 0.8 3.6 0.0 0.0 10.0 20.0 4.2 174.0 30.4 10.7 36.0 1.4 62.0 26.0 1.0 166.4
SD 0.3 72.3 77.5 0.0 1.5 6.5 0.4 0.5 17.3 2.6 0.2 38.1 17.2 5.2 15.8 6.4 21.3 14.6 3.2 53.3
S-6
Avg 8.2 733.0 451.4 8.0 3.2 14.3 1.1 0.6 45.7 24.4 3.4 246.3 60.6 23.1 50.9 4.5 78.9 42.3 5.4 243.3
Max 8.4 880.0 524.0 8.0 5.9 26.3 2.0 1.0 123.0 27.0 3.5 280.0 73.6 25.3 64.0 15.2 98.0 75.0 14.4 307.4
Min 8.0 650.0 389.0 8.0 1.1 4.9 0.7 0.1 18.0 20.0 3.2 212.0 43.2 20.4 37.0 0.9 60.0 16.0 1.8 186.2
SD 2.2 230.3 141.5 0.0 2.1 9.5 1.6 0.3 30.8 6.4 1.6 74.4 19.0 9.2 19.3 3.9 28.9 21.3 6.8 81.8

44
Year
2010 General Pollution indicator parameters
Hardness Major Ions
Parameter pH_GEN EC_GEN TDS NH3-N NO2+NO3 NO3-N p-TOT F COD Temp DO Har_T Ca Mg Na K Cl SO4 CO3 HCO3
Unit µmho/cm mg/L mg N/L mg N/L mg N/L mgP/L mg/L mg/L oC mg/L mgCaCO3/L mg/L mg/L mg/L mg/L mg/L mg/L mg/L mg/L
S-7
Avg 7.9 685.6 430.0 1.6 2.5 11.2 0.6 0.3 30.2 24.4 4.9 224.0 56.5 20.1 53.3 5.3 82.3 47.9 2.8 225.8
Max 8.4 769.0 505.0 3.1 4.7 21.0 2.0 0.6 68.4 27.0 5.0 268.0 72.0 26.2 70.0 16.9 106.0 79.0 9.6 295.2
Min 7.0 550.0 370.0 0.1 1.1 4.9 0.0 0.1 8.0 20.0 4.8 200.0 38.4 9.7 38.0 1.4 58.0 28.0 0.0 195.0
SD 0.5 83.8 49.0 2.1 1.3 6.0 0.7 0.2 21.3 2.6 0.1 27.2 13.2 5.4 14.3 5.6 18.0 19.6 3.6 36.2
S-8
Avg 7.9 672.1 425.1 1.0 2.3 10.3 0.9 0.2 28.5 24.4 5.9 209.4 56.0 16.9 53.4 5.4 84.3 41.7 4.3 212.8
Max 8.5 810.0 524.0 1.0 2.8 12.5 2.0 1.0 64.0 27.0 5.9 290.0 78.4 22.8 72.0 16.8 115.0 62.0 24.0 292.8
Min 7.5 550.0 356.0 1.0 1.8 8.0 0.0 0.0 15.0 20.0 5.8 140.0 35.2 9.2 41.0 1.3 64.0 18.0 0.0 151.3
SD 0.4 95.7 63.8 0.0 0.4 1.9 0.8 0.4 20.0 2.6 0.1 57.6 16.1 5.0 13.2 6.2 18.3 15.2 9.0 54.8
S-9
Avg 7.9 762.0 449.3 4.0 3.3 14.6 1.3 0.1 44.1 24.4 3.9 225.7 59.7 18.6 49.9 5.3 80.4 48.7 0.7 261.1
Max 8.1 880.0 493.0 4.0 4.0 17.8 2.0 0.2 70.0 27.0 4.0 244.0 67.2 25.3 76.0 14.0 102.0 68.0 1.8 307.4
Min 7.8 648.0 415.0 4.0 2.3 10.3 0.0 0.0 20.0 20.0 3.8 212.0 54.4 14.6 38.0 1.1 66.0 40.0 0.0 226.3
SD 0.1 92.5 29.5 0.0 0.7 3.0 0.7 0.1 19.0 2.6 0.1 13.4 5.1 4.7 13.0 5.6 12.2 10.5 0.9 30.0
S-10
Avg 8.2 681.3 435.9 2.0 2.9 13.0 0.2 0.1 21.0 24.4 4.5 194.6 46.7 18.9 66.3 6.2 104.3 46.0 3.2 194.3
Max 8.4 724.0 463.0 2.0 4.2 18.7 0.3 0.2 24.0 27.0 4.6 234.0 65.6 32.1 92.0 15.0 140.0 70.0 4.6 235.5
Min 7.6 635.0 406.0 2.0 1.7 7.6 0.0 0.1 16.0 20.0 4.4 120.0 33.6 8.8 44.0 1.8 72.0 26.0 0.0 109.3
SD 0.3 33.8 18.9 0.0 1.1 5.0 0.1 0.1 2.6 2.6 0.1 35.9 11.9 8.2 18.7 5.8 27.9 19.6 1.6 40.0
S-11
Avg 8.2 699.6 442.9 0.1 3.1 13.8 0.5 0.3 36.1 24.4 3.8 229.1 56.3 21.5 55.6 5.7 83.0 48.4 6.3 239.5
Max 8.5 771.0 481.0 0.1 4.6 20.5 0.9 1.3 68.4 27.0 3.8 260.0 68.8 24.3 68.0 17.2 104.0 85.0 19.2 312.3
Min 7.8 615.0 393.0 0.1 1.7 7.6 0.3 0.0 15.0 20.0 3.7 192.0 38.4 18.5 37.0 1.4 53.9 20.0 1.3 195.3
SD 0.3 63.1 34.2 0.0 1.1 4.8 0.3 0.5 22.2 2.6 0.1 23.3 12.5 2.5 12.2 5.9 18.8 23.4 6.1 37.8
S-12
Avg 8.2 695.8 442.3 0.1 3.2 14.3 0.6 0.3 34.8 25.2 3.9 231.8 56.9 21.7 53.2 4.8 81.4 57.3 5.7 237.2
Max 8.5 794.0 545.0 0.1 4.6 20.5 1.3 0.6 73.0 27.0 4.1 268.0 73.6 26.2 68.0 16.9 104.0 90.0 19.2 322.1
Min 7.8 619.0 396.0 0.1 1.6 7.1 0.0 0.1 1.0 23.0 3.7 196.0 38.4 13.1 36.0 1.4 63.0 30.0 1.4 210.4
SD 0.3 80.0 54.7 0.0 1.2 5.4 0.4 0.2 32.9 1.8 0.2 24.5 14.6 4.8 12.1 6.0 18.1 22.7 6.8 42.5
S-13
Avg 8.1 627.3 425.3 1.5 5.0 22.4 0.5 0.1 32.1 24.0 5.2 246.7 63.2 21.6 38.7 2.6 66.1 58.7 4.9 248.3
Max 8.6 690.0 476.0 2.0 5.2 23.2 1.0 0.3 41.2 26.0 5.5 268.0 71.2 24.3 41.0 3.7 69.0 69.0 9.5 276.7
Min 7.5 520.0 370.0 1.0 4.7 21.0 0.1 0.0 20.0 23.0 5.0 208.0 52.8 18.5 36.0 1.5 64.0 53.0 0.0 213.4
SD 0.6 93.4 53.2 0.7 0.3 1.3 0.5 0.2 10.9 1.7 0.3 33.5 9.4 2.9 2.5 1.1 2.6 9.0 4.8 32.2
45
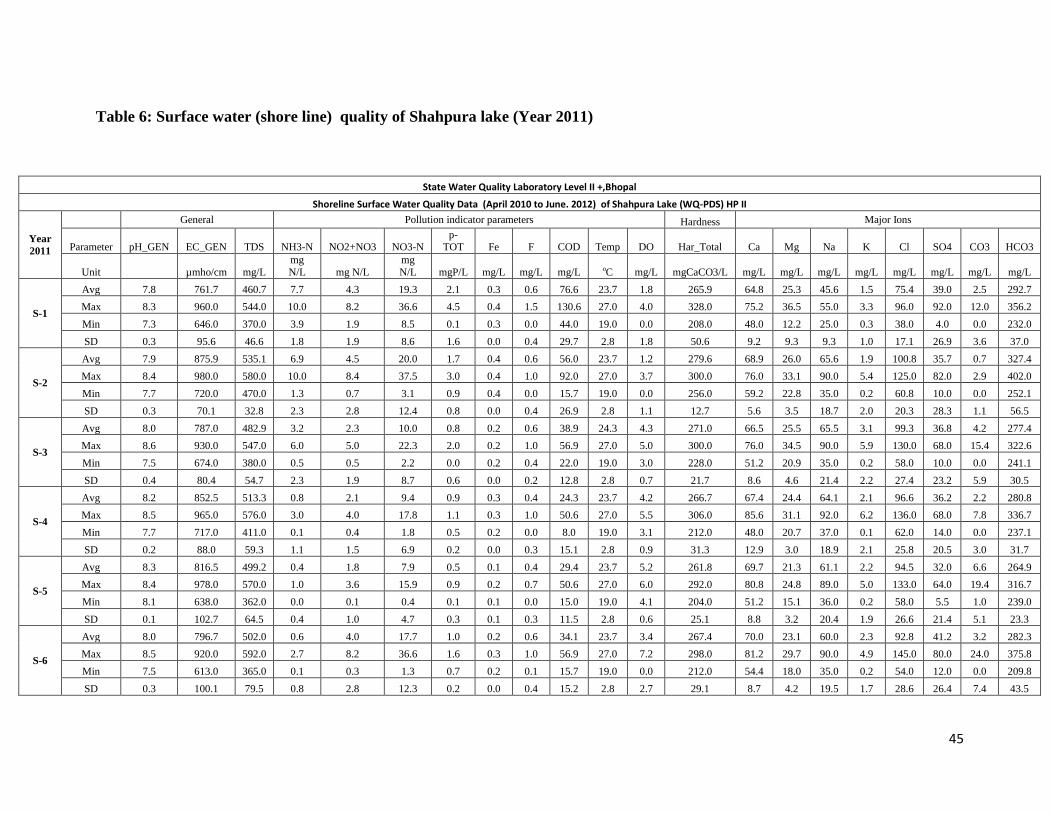
Table 6: Surface water (shore line) quality of Shahpura lake (Year 2011)
State Water Quality Laboratory Level II +,Bhopal
Shoreline Surface Water Quality Data (April 2010 to June. 2012) of Shahpura Lake (WQ-PDS) HP II
Year
2011
General Pollution indicator parameters Hardness Major Ions
Parameter pH_GEN EC_GEN TDS NH3-N NO2+NO3 NO3-N p-
TOT Fe F COD Temp DO Har_Total Ca Mg Na K Cl SO4 CO3 HCO3
Unit µmho/cm mg/L
mg
N/L mg N/L
mg
N/L mgP/L mg/L mg/L mg/L oC mg/L mgCaCO3/L mg/L mg/L mg/L mg/L mg/L mg/L mg/L mg/L
S-1
Avg 7.8 761.7 460.7 7.7 4.3 19.3 2.1 0.3 0.6 76.6 23.7 1.8 265.9 64.8 25.3 45.6 1.5 75.4 39.0 2.5 292.7
Max 8.3 960.0 544.0 10.0 8.2 36.6 4.5 0.4 1.5 130.6 27.0 4.0 328.0 75.2 36.5 55.0 3.3 96.0 92.0 12.0 356.2
Min 7.3 646.0 370.0 3.9 1.9 8.5 0.1 0.3 0.0 44.0 19.0 0.0 208.0 48.0 12.2 25.0 0.3 38.0 4.0 0.0 232.0
SD 0.3 95.6 46.6 1.8 1.9 8.6 1.6 0.0 0.4 29.7 2.8 1.8 50.6 9.2 9.3 9.3 1.0 17.1 26.9 3.6 37.0
S-2
Avg 7.9 875.9 535.1 6.9 4.5 20.0 1.7 0.4 0.6 56.0 23.7 1.2 279.6 68.9 26.0 65.6 1.9 100.8 35.7 0.7 327.4
Max 8.4 980.0 580.0 10.0 8.4 37.5 3.0 0.4 1.0 92.0 27.0 3.7 300.0 76.0 33.1 90.0 5.4 125.0 82.0 2.9 402.0
Min 7.7 720.0 470.0 1.3 0.7 3.1 0.9 0.4 0.0 15.7 19.0 0.0 256.0 59.2 22.8 35.0 0.2 60.8 10.0 0.0 252.1
SD 0.3 70.1 32.8 2.3 2.8 12.4 0.8 0.0 0.4 26.9 2.8 1.1 12.7 5.6 3.5 18.7 2.0 20.3 28.3 1.1 56.5
S-3
Avg 8.0 787.0 482.9 3.2 2.3 10.0 0.8 0.2 0.6 38.9 24.3 4.3 271.0 66.5 25.5 65.5 3.1 99.3 36.8 4.2 277.4
Max 8.6 930.0 547.0 6.0 5.0 22.3 2.0 0.2 1.0 56.9 27.0 5.0 300.0 76.0 34.5 90.0 5.9 130.0 68.0 15.4 322.6
Min 7.5 674.0 380.0 0.5 0.5 2.2 0.0 0.2 0.4 22.0 19.0 3.0 228.0 51.2 20.9 35.0 0.2 58.0 10.0 0.0 241.1
SD 0.4 80.4 54.7 2.3 1.9 8.7 0.6 0.0 0.2 12.8 2.8 0.7 21.7 8.6 4.6 21.4 2.2 27.4 23.2 5.9 30.5
S-4
Avg 8.2 852.5 513.3 0.8 2.1 9.4 0.9 0.3 0.4 24.3 23.7 4.2 266.7 67.4 24.4 64.1 2.1 96.6 36.2 2.2 280.8
Max 8.5 965.0 576.0 3.0 4.0 17.8 1.1 0.3 1.0 50.6 27.0 5.5 306.0 85.6 31.1 92.0 6.2 136.0 68.0 7.8 336.7
Min 7.7 717.0 411.0 0.1 0.4 1.8 0.5 0.2 0.0 8.0 19.0 3.1 212.0 48.0 20.7 37.0 0.1 62.0 14.0 0.0 237.1
SD 0.2 88.0 59.3 1.1 1.5 6.9 0.2 0.0 0.3 15.1 2.8 0.9 31.3 12.9 3.0 18.9 2.1 25.8 20.5 3.0 31.7
S-5
Avg 8.3 816.5 499.2 0.4 1.8 7.9 0.5 0.1 0.4 29.4 23.7 5.2 261.8 69.7 21.3 61.1 2.2 94.5 32.0 6.6 264.9
Max 8.4 978.0 570.0 1.0 3.6 15.9 0.9 0.2 0.7 50.6 27.0 6.0 292.0 80.8 24.8 89.0 5.0 133.0 64.0 19.4 316.7
Min 8.1 638.0 362.0 0.0 0.1 0.4 0.1 0.1 0.0 15.0 19.0 4.1 204.0 51.2 15.1 36.0 0.2 58.0 5.5 1.0 239.0
SD 0.1 102.7 64.5 0.4 1.0 4.7 0.3 0.1 0.3 11.5 2.8 0.6 25.1 8.8 3.2 20.4 1.9 26.6 21.4 5.1 23.3
S-6
Avg 8.0 796.7 502.0 0.6 4.0 17.7 1.0 0.2 0.6 34.1 23.7 3.4 267.4 70.0 23.1 60.0 2.3 92.8 41.2 3.2 282.3
Max 8.5 920.0 592.0 2.7 8.2 36.6 1.6 0.3 1.0 56.9 27.0 7.2 298.0 81.2 29.7 90.0 4.9 145.0 80.0 24.0 375.8
Min 7.5 613.0 365.0 0.1 0.3 1.3 0.7 0.2 0.1 15.7 19.0 0.0 212.0 54.4 18.0 35.0 0.2 54.0 12.0 0.0 209.8
SD 0.3 100.1 79.5 0.8 2.8 12.3 0.2 0.0 0.4 15.2 2.8 2.7 29.1 8.7 4.2 19.5 1.7 28.6 26.4 7.4 43.5

46
Year
2011
General Pollution indicator parameters Hardness Major Ions
Parameter pH_GEN EC_GEN TDS NH3-N NO2+NO3 NO3-N
p-
TOT Fe F COD Temp DO Har_Total Ca Mg Na K Cl SO4 CO3 HCO3
Unit µmho/cm mg/L
mg
N/L mg N/L
mg
N/L mgP/L mg/L mg/L mg/L oC mg/L mgCaCO3/L mg/L mg/L mg/L mg/L mg/L mg/L mg/L mg/L
S-7
Avg 8.3 746.8 466.6 0.1 2.7 11.8 0.6 0.4 0.2 42.9 23.7 5.7 262.5 66.4 23.5 49.1 1.5 77.5 24.4 3.9 258.3
Max 8.4 890.0 570.0 0.2 6.0 26.8 1.0 0.5 0.5 111.0 27.0 7.0 288.0 84.0 29.2 81.0 4.0 110.0 44.0 6.5 291.2
Min 8.0 578.0 328.0 0.0 0.5 2.2 0.0 0.3 0.0 11.5 19.0 4.1 212.0 48.0 16.0 29.0 0.2 42.0 16.0 0.0 234.3
SD 0.2 93.2 73.4 0.1 2.1 9.4 0.3 0.1 0.2 31.6 2.8 0.9 24.5 11.2 4.1 18.9 1.3 23.2 9.2 2.3 18.0
S-8
Avg 8.2 682.5 424.0 0.7 2.5 11.1 0.8 0.2 0.1 23.7 23.7 6.1 237.2 61.3 20.4 54.7 1.7 86.5 35.6 3.1 213.5
Max 8.4 880.0 540.0 1.2 3.0 13.4 1.5 0.2 0.4 38.0 27.0 6.8 308.0 75.0 34.1 86.0 3.6 130.0 60.0 6.7 283.2
Min 7.6 560.0 365.0 0.1 2.0 8.9 0.0 0.2 0.0 12.0 19.0 5.2 160.0 49.6 7.3 42.0 0.5 65.0 20.0 0.0 121.6
SD 0.3 104.1 64.2 0.5 0.4 1.6 0.4 0.0 0.2 10.4 2.8 0.5 49.4 9.6 8.2 17.1 1.0 22.8 17.0 2.5 56.9
S-9
Avg 8.3 760.7 459.3 0.3 2.5 11.2 0.8 0.2 0.4 38.1 23.7 3.8 259.8 60.1 26.3 55.8 1.4 85.1 29.0 5.0 260.0
Max 8.5 876.0 565.6 1.0 5.6 25.0 1.0 0.2 0.8 61.4 27.0 5.9 296.0 73.6 37.7 85.0 3.8 117.0 62.0 14.4 302.6
Min 8.1 625.0 344.0 0.0 0.6 2.7 0.4 0.1 0.0 7.9 19.0 0.3 212.0 48.0 20.4 31.0 0.2 48.0 10.0 0.0 239.1
SD 0.1 75.8 65.8 0.4 2.0 8.7 0.2 0.0 0.3 18.6 2.8 2.1 27.1 9.0 4.8 19.6 1.4 25.0 18.0 4.2 19.8
S-10
Avg 8.4 722.0 453.4 0.8 2.2 9.6 0.6 0.1 0.2 29.7 23.7 5.6 238.6 61.7 20.6 55.5 1.6 85.4 32.3 4.0 232.4
Max 8.5 780.0 499.0 3.0 4.0 17.8 1.1 0.2 0.6 43.0 27.0 8.0 276.0 73.6 31.1 88.0 4.0 132.0 68.0 6.2 272.8
Min 8.2 680.0 421.0 0.0 0.7 3.1 0.1 0.1 0.0 12.0 19.0 4.2 212.0 48.0 10.2 36.0 0.2 59.0 10.0 0.0 184.0
SD 0.1 29.8 24.5 1.1 1.4 6.4 0.4 0.0 0.2 10.9 2.8 1.1 21.3 8.0 7.2 18.2 1.3 21.1 21.2 2.3 31.9
S-11
Avg 8.4 745.6 462.8 0.1 2.7 11.8 0.7 0.1 0.5 33.6 23.7 4.4 258.0 61.9 25.1 52.6 1.2 79.7 28.3 8.5 263.5
Max 8.6 875.0 560.0 0.4 5.2 23.2 1.0 0.2 0.6 50.6 27.0 5.5 284.0 72.0 30.1 80.0 2.6 120.0 58.0 24.2 292.3
Min 8.1 655.0 371.0 0.0 0.6 2.7 0.4 0.1 0.0 17.9 19.0 3.2 216.0 49.6 21.4 36.0 0.1 56.0 11.0 1.0 247.3
SD 0.1 63.8 58.5 0.1 2.0 8.8 0.2 0.0 0.2 10.7 2.8 0.7 24.2 7.3 2.8 17.4 0.8 21.8 15.4 7.3 12.6
S-12
Avg 8.4 799.4 493.0 2.4 3.5 15.4 1.0 0.2 0.6 24.2 23.7 4.0 283.7 68.5 27.3 50.7 1.7 80.5 31.5 8.0 287.4
Max 8.6 940.0 581.1 10.0 5.2 23.2 4.0 0.4 1.1 50.6 27.0 6.0 322.0 80.0 34.0 65.0 4.6 104.0 65.0 15.1 392.5
Min 8.2 678.0 373.0 0.0 0.8 3.6 0.4 0.1 0.2 8.0 19.0 0.3 248.0 52.0 22.6 35.0 0.2 62.7 10.0 0.6 235.0
SD 0.1 93.0 66.9 3.8 1.7 7.7 1.1 0.1 0.3 15.2 2.8 2.0 24.9 9.7 3.8 9.6 1.4 14.3 18.8 3.7 45.8
S-13
Avg 8.4 778.8 491.2 0.8 3.1 13.8 0.8 0.2 0.6 29.9 23.7 4.7 260.7 69.2 21.3 58.4 1.7 93.9 24.9 8.9 273.7
Max 8.6 908.0 581.1 2.0 5.2 23.2 1.0 0.2 1.0 50.1 27.0 5.4 300.0 86.4 25.2 84.0 4.9 124.0 48.0 24.0 331.8
Min 8.0 701.0 423.0 0.1 0.5 2.2 0.2 0.2 0.3 17.9 19.0 3.0 220.0 52.8 19.4 42.0 0.2 68.2 10.0 0.0 252.0
SD 0.2 60.8 44.3 0.7 1.8 8.1 0.3 0.0 0.3 11.3 2.8 0.7 25.2 10.9 1.9 13.9 1.6 17.2 12.3 7.8 24.4

47
Table 7: Surface water (shore line) quality of Shahpura Lake (Year 2012)
State Water Quality Laboratory Level II +,Bhopal
Shoreline Surface Water Quality Data (April 2010 to June. 2012) of Shahpura Lake (WQ-PDS) HP II
Year
2012
General Pollution indicator parameters Hardness Major Ions
Parameter pH_GEN EC_GEN TDS
NH3-
N NO2+NO3
NO3-
N p-TOT Fe F COD Temp DO Har_Total Ca Mg Na K Cl SO4 CO3 HCO3
Unit µmho/cm mg/L mg N/L mg N/L
mg N/L mgP/L mg/L mg/L mg/L oC mg/L mgCaCO3/L mg/L mg/L mg/L mg/L mg/L mg/L mg/L mg/L
S-1
Avg 8.2 920.5 586.2 4.7 5.3 23.6 1.6 0.3 0.6 88.0 24.2 3.3 312.0 72.1 35.1 51.8 1.9 88.0 59.5 7.7 333.0
Max 8.3 1000.0 640.0 7.7 5.7 25.4 2.7 0.5 0.7 118.0 27.0 4.2 340.0 82.0 42.0 55.0 3.0 98.0 66.0 16.0 352.0
Min 7.9 820.0 520.0 0.3 4.9 21.9 0.3 0.2 0.6 72.0 19.0 1.5 276.0 66.0 27.0 45.0 1.3 76.0 54.0 0.0 312.0
SD 0.2 59.5 51.6 3.4 0.3 1.4 0.9 0.1 0.0 16.6 3.1 1.0 24.8 5.6 5.5 3.7 0.6 7.5 5.0 6.5 14.8
S-2
Avg 8.2 932.8 574.8 2.9 5.8 25.7 1.3 0.4 0.7 55.0 24.2 1.4 290.0 71.1 37.1 51.3 1.5 92.5 61.5 0.0 287.7
Max 8.4 1120.0 717.0 8.2 7.4 33.0 1.7 0.4 0.9 62.0 27.0 1.9 310.0 78.0 61.0 58.0 1.8 107.0 74.0 0.0 312.0
Min 8.0 787.0 504.0 0.5 3.4 15.2 0.9 0.3 0.6 40.0 19.0 1.0 272.0 63.1 25.0 41.0 1.2 78.0 48.0 0.0 266.0
SD 0.1 111.4 77.3 3.5 1.6 7.2 0.3 0.0 0.1 7.8 3.1 0.3 13.4 5.0 13.6 5.7 0.2 9.5 9.2 0.0 15.7
S-3
Avg 8.3 893.1 547.4 2.7 3.9 17.6 1.5 0.3 0.6 33.4 23.5 3.0 266.6 68.3 24.7 51.6 2.2 91.1 42.8 6.5 270.8
Max 8.5 980.0 604.0 4.2 5.3 23.6 2.5 0.4 0.7 70.9 27.0 3.8 284.0 74.0 28.0 65.0 3.9 110.0 56.0 24.0 300.0
Min 8.0 830.0 465.0 1.2 1.4 6.2 0.6 0.2 0.5 20.0 19.0 2.0 236.0 55.1 22.3 34.0 1.3 59.0 16.0 0.0 254.0
SD 0.2 49.6 45.6 1.1 1.3 5.6 0.6 0.1 0.1 16.6 3.0 0.7 15.5 6.1 1.9 11.0 0.8 19.3 14.4 10.0 17.7
S-4
Avg 8.4 912.2 557.7 0.2 3.1 14.0 1.3 0.3 0.7 13.7 24.2 2.8 278.0 71.2 30.8 51.2 2.4 104.8 52.5 13.0 292.7
Max 8.5 990.0 608.0 0.2 3.5 15.6 1.4 0.3 0.8 23.0 27.0 3.4 288.0 76.0 38.0 65.0 3.5 128.0 64.0 24.0 344.0
Min 8.2 863.0 512.0 0.1 2.6 11.7 1.1 0.3 0.6 6.5 19.0 2.1 264.0 64.0 25.4 39.0 1.1 81.0 38.0 0.0 262.0
SD 0.1 48.1 36.1 0.0 0.4 1.6 0.1 0.0 0.1 6.8 3.1 0.5 7.8 4.5 5.4 9.8 1.0 16.9 10.5 8.4 29.4
S-5
Avg 8.4 842.5 526.4 0.3 2.2 9.8 0.6 0.2 0.4 27.8 24.2 3.6 278.0 74.6 23.7 52.1 1.5 96.6 32.8 15.1 274.7
Max 8.5 900.0 580.0 0.8 3.2 14.3 1.3 0.3 0.5 32.2 27.0 4.3 292.0 83.1 34.0 62.0 2.0 126.0 44.0 36.0 310.0
Min 8.2 800.0 474.6 0.1 1.3 6.0 0.1 0.1 0.2 23.0 19.0 2.7 264.0 68.2 18.0 30.5 1.2 51.4 19.8 0.0 242.0
SD 0.1 35.9 43.4 0.3 0.8 3.4 0.5 0.1 0.1 3.7 3.1 0.6 10.9 5.0 5.7 11.2 0.4 26.7 8.2 15.0 26.2
S-6
Avg 7.9 853.1 536.4 0.3 4.1 18.2 1.1 0.3 0.5 34.5 24.2 2.1 289.0 73.4 24.9 57.3 3.2 105.8 63.7 0.0 288.3
Max 8.1 900.0 576.0 0.6 7.0 31.2 1.9 0.3 0.7 40.0 27.0 3.2 312.0 80.0 29.7 72.0 4.5 136.0 70.0 0.0 316.0
Min 7.7 758.9 469.2 0.2 1.1 5.0 0.8 0.2 0.4 26.0 19.0 1.2 272.0 64.3 21.3 50.0 2.1 90.0 55.0 0.0 242.0
SD 0.2 51.6 37.8 0.1 2.0 8.9 0.4 0.0 0.1 5.4 3.1 0.9 14.7 5.3 3.0 8.3 0.9 19.2 5.8 0.0 25.3
S-7 Avg 8.5 822.4 517.0 0.1 3.0 13.3 1.0 0.3 0.3 21.1 24.2 5.5 283.3 67.7 28.1 48.7 2.1 88.2 44.7 11.4 288.2
Max 8.6 900.0 576.0 0.2 3.5 15.6 1.8 0.3 0.4 24.0 27.0 5.8 312.0 70.2 34.0 54.0 3.1 106.0 52.0 24.0 300.0

48
Min 8.3 757.7 458.8 0.1 1.3 5.6 0.7 0.3 0.2 17.9 19.0 5.2 268.0 60.9 24.3 43.0 1.7 70.6 33.0 4.7 278.0
SD 0.1 55.8 46.6 0.0 0.9 3.9 0.4 0.0 0.1 2.3 3.1 0.2 15.5 3.5 3.8 3.5 0.5 14.3 6.7 7.2 9.6
S-8
Avg 8.3 748.8 487.3 0.5 3.0 13.3 0.8 0.3 0.4 23.7 24.2 5.2 255.7 60.7 25.4 52.2 2.4 95.7 43.7 13.3 234.0
Max 8.5 860.0 594.0 0.8 3.4 15.2 1.3 0.4 0.5 38.0 27.0 5.8 320.0 73.1 34.0 75.0 3.0 116.0 50.0 40.0 288.0
Min 8.2 640.0 410.0 0.1 2.5 11.2 0.4 0.2 0.2 12.0 19.0 4.8 200.0 45.0 19.9 40.0 1.9 72.0 30.0 0.0 190.0
SD 0.1 91.1 75.6 0.3 0.3 1.6 0.4 0.1 0.1 10.7 3.1 0.4 48.3 11.3 5.6 13.0 0.4 17.0 7.1 15.1 39.7
S-9
Avg 8.2 788.4 490.2 0.3 2.9 13.1 0.8 0.2 0.5 42.7 24.2 3.4 263.1 58.0 30.1 55.9 1.8 93.2 26.7 4.7 270.1
Max 8.6 880.0 564.0 0.6 3.6 16.1 1.1 0.3 0.6 64.0 27.0 4.5 278.0 60.0 36.0 72.0 2.3 110.0 40.0 12.0 290.0
Min 7.6 730.0 434.0 0.0 1.9 8.3 0.5 0.2 0.4 24.4 19.0 2.4 236.0 55.8 26.0 50.4 0.7 74.2 16.9 0.0 254.5
SD 0.4 64.0 52.4 0.3 0.7 3.0 0.3 0.0 0.1 13.0 3.1 0.9 15.9 1.7 3.7 8.2 0.6 15.5 8.6 5.4 14.9
S-10
Avg 8.2 788.3 502.9 0.1 2.6 11.6 1.0 0.2 0.3 40.7 24.2 3.8 291.1 67.6 29.8 48.7 1.9 85.3 25.3 6.0 284.0
Max 8.5 864.0 553.0 0.2 3.5 15.6 1.3 0.2 0.4 56.7 27.0 4.2 320.0 72.5 35.5 52.0 3.2 96.0 34.0 10.0 340.0
Min 7.6 747.6 462.3 0.0 1.3 5.7 0.8 0.2 0.2 35.0 19.0 3.2 264.0 58.5 23.4 44.0 0.6 73.9 15.7 0.0 256.0
SD 0.3 41.6 30.6 0.1 0.8 3.5 0.2 0.0 0.1 8.1 3.1 0.4 22.9 4.9 5.3 3.1 0.9 9.2 6.7 3.5 30.4
S-11
Avg 8.3 814.8 520.4 0.1 2.9 12.9 1.2 0.2 0.5 40.0 24.2 4.2 273.9 67.5 27.0 46.9 1.8 87.9 33.0 7.3 281.9
Max 8.5 912.0 584.0 0.3 5.0 22.3 1.4 0.3 0.6 63.0 27.0 4.6 292.0 73.7 29.2 60.0 2.9 108.0 44.0 12.0 310.0
Min 7.8 755.0 480.4 0.1 0.8 3.7 0.8 0.2 0.4 26.5 19.0 3.8 242.0 57.7 23.8 39.0 0.8 70.0 10.3 0.0 256.0
SD 0.3 60.6 45.6 0.1 1.5 6.5 0.2 0.0 0.1 12.5 3.1 0.4 17.9 5.6 2.0 7.7 0.8 14.8 12.5 5.9 19.5
S-12
Avg 8.4 846.5 538.8 0.5 3.9 17.4 1.3 0.3 0.6 29.2 23.0 3.9 296.3 73.6 30.6 50.3 2.3 92.4 39.0 7.3 291.0
Max 8.9 890.0 584.0 0.8 5.5 24.5 1.5 0.3 0.8 35.4 27.0 4.5 312.0 76.9 39.0 59.0 2.8 115.0 54.0 24.0 312.0
Min 8.1 777.0 497.0 0.3 3.1 13.9 1.2 0.3 0.6 22.0 19.0 3.2 280.0 67.3 26.7 40.0 1.9 73.2 30.0 0.0 264.0
SD 0.3 50.2 39.1 0.2 0.9 4.1 0.1 0.0 0.1 4.9 3.2 0.5 11.8 3.5 4.6 6.9 0.3 17.2 8.1 9.5 17.4
S-13
Avg 8.2 869.0 545.3 0.8 3.3 14.9 0.9 0.1 0.5 30.1 23.0 4.7 307.0 78.1 36.2 53.4 2.2 105.2 37.5 3.0 309.3
Max 8.5 890.0 570.0 1.7 3.8 16.9 1.6 0.3 0.7 34.0 27.0 5.9 340.0 94.0 54.0 56.0 3.2 116.0 46.0 10.0 346.0
Min 7.7 830.0 531.0 0.1 3.1 13.7 0.7 0.0 0.4 23.6 19.0 3.9 282.0 72.1 24.7 51.0 1.3 94.0 21.0 0.0 274.0
SD 0.3 23.4 15.5 0.6 0.2 1.1 0.3 0.1 0.1 3.8 3.2 0.8 22.2 8.4 10.5 1.7 0.8 8.8 9.2 4.7 27.8

49
4.3 Water quality observation of Peizometer (purpose driven-wells)
General parameter
pH: The pH value ranged between 7.1 to 8.5. The highest value of 8.5 was recorded
during the month of Oct-2011&Nov-2011 and lowest value of 7.1 was recorded in June-
2012. The Maximum value 8.5 was recorded at Site PZ-03,PZ-12 and the Minimum value 7.1
was recorded at Site PZ-03.
Electrical Conductivity: Since the ions are the carries of electricity, the electrical
conductivity of the water raises according to the content of soluble salts in the water.
Generally E.C. defines as mobility of the ions. The value ranged between 300 to 1520 µs/cm.
The Max value of 1520 µs/cm. was recorded in Feb-2012 and Min value of 300 µs/cm. was
recorded Sep-2011.The Maximum value of 1520 µs/cm was recorded at Site PZ-2 and
Minimum value of 400 µs/cm was recorded at Site PZ-10.
Total dissolved solids (TDS): Total dissolved solids are mainly the inorganic minerals and
sometimes some organic matter. The TDS value ranged between 192 to 972 mg/l. the highest
value of 972 mg/l was recorded Feb-2012 at site PZ-2 and lowest value of 192 mg/l was
recorded at Sep-2011 at the site of PZ-10B.
POLLUTION INDICATING PARAMETER
NITRATE:-Nitrate is the important pollution indicating parameter. It is considered as
important plant nutrient. Nitrate is the most oxidized or stable form of nitrogen. In Peizometer
site the nitrate content of the water was in the range between 8.0 to 186.0mg/l. Maximum
concentration 186.0mg/l of nitrate was found in site of PZ-10B Dec-2012 and minimum
Nitrate 8.0 was observed at site PZ-10A Sep-2011.
T-PHOSPHATE: - In Peizometer site phosphate range observed between 0.1 to 0.42mg/l.
Maximum T-phosphate 0.42mg/l was found at site PZ-03 in the month of Dec-2012and
minimum phosphate 0.1 was found at all the site during the year 2011-2012.
CHEMICAL OXYGEN DEMAND: COD is an important parameter for knowing the
quality of water, which analyzed by potassium dichromate open reflux method. High COD
value may be due to presence of long chain of hydro-carbon for e.g. organic matter like amino
acid, glucose.
In Peizometer site COD range observed between 0.0 to 42.0mg/l. Maximum COD 42.0mg/l
was observed at site PZ-9A during the month of Sep-2011 which has untreated raw sewage

50
and minimum COD 0.0 was observed at site Pz-01, Pz-02 Sep&Oct-2011and Pz-10A, Pz-
10B,Pz-12in the year of 2012.
AMMONIACAL NITROGEN: In a Peizometer range NH3-N range between 0.0 to 5.0
mg/l. Maximum NH3-N 5.0mg/l was observed at site Pz-10A during the month of Oct&Dec-
2012 and minimum NH3-N 0.0mg/l was observed at site Pz-02 Oct-2012, Pz-10A Oct-
2011and sep- 2011 at the site of Pz-12.
Fluoride: The fluoride value ranged between 0.0 to 0.7 mg/l. During the study period highest
value was observed 0.7mg/l at site Pz-12.
Hardness
Total Hardness: The Total Hardness value ranged between 64 to 488 mg/l. During the study
period the highest value of 488 mg/l was noted in Oct-2011 and lowest value of 64 mg/l was
noted in Sep-2011. The maximum value of total hardness 488 mg/l was recorded at Site Pz-02
and while as minimum value of 64 mg/l was recorded at Site Pz-4.
Major ion
Calcium Ion (Ca++
):- The Calcium ion value was ranging between 9.6 to 105.0mg/l. The
highest value of 105.0mg/l was noted in Dec-2012 and lowest value of 9.6mg/l was noted in
Sep-2011. The maximum value of 105.0mg/l was recorded at site PZ-09A and minimum
value of 9.6 mg/l was recorded at site PZ-09B.
Magnesium ion (Mg++
): The Magnesium ion value ranged between 6.8 to 61.2mg/l. The
highest value of 61.2mg/l was recorded in Nov-2011 and lowest value of 6.8mg/l was
recorded in Sep-2011. The Maximum value of 61.2 mg/l was recorded at Site Pz-02 and
Minimum value of 6.8 mg/l was recorded at Site Pz-04.
Sodium (Na+): The sodium value ranging between 20.0 to 107.0mg/l. The highest value of
107.0mg/l was recorded in Oct-2012 and lowest value of 20.0mg/l was recorded in Oct-2011.
The Maximum value of 107.0 mg/l was recorded at Site Pz-02 and Minimum value of 20.0
mg/l was recorded at Site Pz-10A.
Potassium (k+): The Potassium value ranging between 0.3 to7.6mg/l. The highest value of
7.6mg/l was recorded in Oct-2012 and lowest value of 0.3mg/l was recorded in Oct-2011 at
site Pz-10B.The Maximum value of 7.6mg/l was recorded at Site Pz-12.
Chloride: The chloride value ranged between 38.0 to 176.0 mg/l. The highest value of 176.0
mg/l was noted in Nov-2012 at site Pz-02 and lowest value of 38.0 mg/l was noted in Oct-
2011at site Pz-10A.
51
Sulphate : The sulphate value ranged between 1.0 to 69.0mg/l. The highest value of 69.0 mg/l
was noted in Oct-2012 at site Pz-02 and lowest value of 1.0 mg/l was noted in Oct-2012 at site
Pz-9B.
Carbonate(CO3-): The Carbonate value ranged between 0.0 to 12.0 mg/l. the highest value
of 12.0 mg/l noted in Nov-2011 and April&June-2012at site Pz-02&Pz-01B,and the minimum
value was recorded at all the site.
Bicarbonate (HCO3-):- Bicarbonate value ranged between 60.0to380mg/l. The highest value
of 380mg/l was noted in Oct -2011 and lowest value of 60.0mg/l was noted in Sep-2011.The
Maximum value of 380.0mg/l was recorded at Site Pz-02, and minimum value of 60.0mg/l
was recorded at Site Pz-04.

52
General water quality parameters in Peizometers around Shahpura lake, Bhopal (MP)
Fig 39: Graphical presentation of pH in Shahpura Lake
Fig 40: Graphical presentation of Conductivity in Shahpura lake
Fig 41: Graphical presentation of TDS in Shahpura Lake
7.0
7.2
7.4
7.6
7.8
8.0
8.2
8.4
8.6
PZ-1B PZ-02 PZ-03 PZ-04 PZ-09A PZ-09B PZ-10A PZ-10B PZ-12
pH
Sampling sites
2011 2012
0.0
200.0
400.0
600.0
800.0
1000.0
1200.0
1400.0
PZ-1B PZ-02 PZ-03 PZ-04 PZ-09A PZ-09B PZ-10A PZ-10B PZ-12
Co
nd
ucti
vit
y (
µs/c
m)
Sampling sites
2011 2012
0.0
100.0
200.0
300.0
400.0
500.0
600.0
700.0
800.0
900.0
PZ-1B PZ-02 PZ-03 PZ-04 PZ-09A PZ-09B PZ-10A PZ-10B PZ-12
TD
S (
mg
/l)
Sampling sites
2011 2012

53
Pollution indicating parameters in Peizometers around Shahpura lake, Bhopal
Fig 42: Graphical presentation of NH3-N in Shahpura Lake
Fig 43: Graphical presentation of NO2-NO3 in Shahpura Lake
Fig 44: Graphical presentation of Tot. Phosphate in Shahpura Lake
0.0
10.0
20.0
30.0
40.0
50.0
60.0
70.0
80.0
PZ-1B PZ-02 PZ-03 PZ-04 PZ-09A PZ-09B PZ-10A PZ-10B PZ-12
NO
2+
NO
3 (
(mg
/l)
Sampling sites
2011 2012
0.0 0.1 0.1 0.2 0.2 0.3 0.3 0.4 0.4 0.5 0.5
PZ-1B PZ-02 PZ-03 PZ-04 PZ-09A PZ-09B PZ-10A PZ-10B PZ-12
To
t. P
O4 (
mg
/l)
Sampling sites
2011 2012
0.0
0.5
1.0
1.5
2.0
2.5
PZ-1B PZ-02 PZ-03 PZ-04 PZ-09A PZ-09B PZ-10A PZ-10B PZ-12
NH
3-N
(m
g/l
)
Sampling sites
2011 2012

54
Fig 45: Graphical presentation of COD in Shahpura Lake
Fig 46: Graphical presentation of Tot. Hardness in Shahpura Lake
Fig 47: Graphical presentation of Ca Hardness in Shahpura Lake
0.0
5.0
10.0
15.0
20.0
25.0
30.0
35.0
PZ-1B PZ-02 PZ-03 PZ-04 PZ-09A PZ-09B PZ-10A PZ-10B PZ-12
CO
D (
mg
/l)
Sampling sites
2011 2012
0.0 50.0
100.0 150.0 200.0 250.0 300.0 350.0 400.0 450.0
PZ-1B PZ-02 PZ-03 PZ-04 PZ-09A PZ-09B PZ-10A PZ-10B PZ-12
To
t. H
ard
ne
ss (
mg
/l)
Sampling sites
2011 2012
0.0
50.0
100.0
150.0
200.0
250.0
PZ-1B PZ-02 PZ-03 PZ-04 PZ-09A PZ-09B PZ-10A PZ-10B PZ-12
Ca H
ard
ne
ss
(m
g/l
)
sampling sites
2011 2012

55
Fig 48: Graphical presentation of Mg ion in Shahpura Lake
Fig 49: Graphical presentation of Na ion in Shahpura Lake
Fig 50: Graphical presentation of K ion in Shahpura Lake
0.0
10.0
20.0
30.0
40.0
50.0
60.0
PZ-1B PZ-02 PZ-03 PZ-04 PZ-09A PZ-09B PZ-10A PZ-10B PZ-12
Mg
(m
g/l
)
Sampling sites
2011 2012
0.0 10.0 20.0 30.0 40.0 50.0 60.0 70.0 80.0 90.0
100.0
PZ-1B PZ-02 PZ-03 PZ-04 PZ-09A PZ-09B PZ-10A PZ-10B PZ-12
Na (
mg
/l)
Sampling sites
2011 2012
0.0
0.5
1.0
1.5
2.0
2.5
3.0
3.5
4.0
PZ-1B PZ-02 PZ-03 PZ-04 PZ-09A PZ-09B PZ-10A PZ-10B PZ-12
K (m
g/l
)
Sampling sites
2011 2012

56
Fig 51: Graphical presentation of Chloride ion in Shahpura Lake
Fig 52: Graphical presentation of Sulphate ion in Shahpura Lake
Fig 53: Graphical presentation of Fluoride in Shahpura Lake
0.0
20.0
40.0
60.0
80.0
100.0
120.0
140.0
160.0
PZ-1B PZ-02 PZ-03 PZ-04 PZ-09A PZ-09B PZ-10A PZ-10B PZ-12
Cl (m
g/l
)
Sampling sites
2011 2012
0.0
10.0
20.0
30.0
40.0
50.0
60.0
70.0
PZ-1B PZ-02 PZ-03 PZ-04 PZ-09A PZ-09B PZ-10A PZ-10B PZ-12
SO
4 (m
g/l
)
Sampling sites
2011 2012
0.0
0.1
0.2
0.3
0.4
0.5
0.6
PZ-1B PZ-02 PZ-03 PZ-04 PZ-09A PZ-09B PZ-10A PZ-10B PZ-12
F (
(mg
/l)
Sampling sites
2011 2012

57
Fig 54: Graphical presentation of Tot. Alkalinity in Shahpura Lake
0.0
50.0
100.0
150.0
200.0
250.0
300.0
350.0
PZ-1B PZ-02 PZ-03 PZ-04 PZ-09A PZ-09B PZ-10A PZ-10B PZ-12
To
t. A
lkali
nit
y (
mg
/l)
Sampling sites
2011 2012
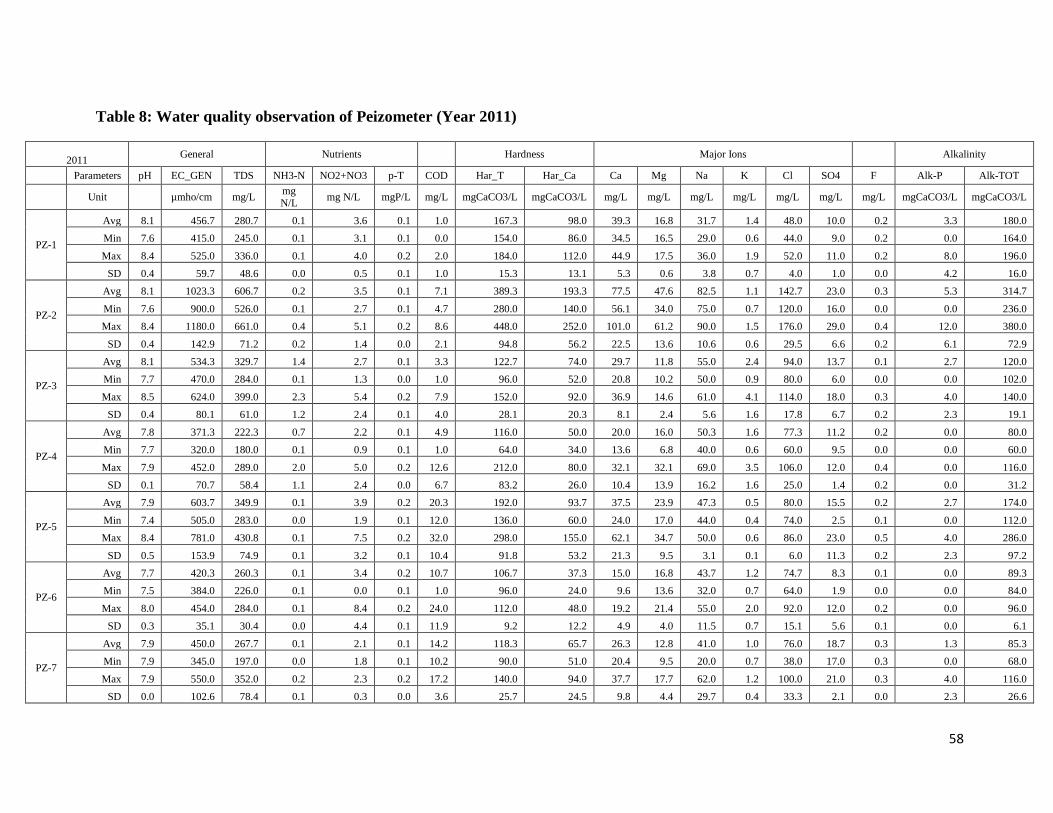
58
Table 8: Water quality observation of Peizometer (Year 2011)
2011
General Nutrients
Hardness Major Ions
Alkalinity
Parameters pH EC_GEN TDS NH3-N NO2+NO3 p-T COD Har_T Har_Ca Ca Mg Na K Cl SO4 F Alk-P Alk-TOT
Unit
µmho/cm mg/L
mg N/L
mg N/L mgP/L mg/L mgCaCO3/L mgCaCO3/L mg/L mg/L mg/L mg/L mg/L mg/L mg/L mgCaCO3/L mgCaCO3/L
PZ-1
Avg 8.1 456.7 280.7 0.1 3.6 0.1 1.0 167.3 98.0 39.3 16.8 31.7 1.4 48.0 10.0 0.2 3.3 180.0
Min 7.6 415.0 245.0 0.1 3.1 0.1 0.0 154.0 86.0 34.5 16.5 29.0 0.6 44.0 9.0 0.2 0.0 164.0
Max 8.4 525.0 336.0 0.1 4.0 0.2 2.0 184.0 112.0 44.9 17.5 36.0 1.9 52.0 11.0 0.2 8.0 196.0
SD 0.4 59.7 48.6 0.0 0.5 0.1 1.0 15.3 13.1 5.3 0.6 3.8 0.7 4.0 1.0 0.0 4.2 16.0
PZ-2
Avg 8.1 1023.3 606.7 0.2 3.5 0.1 7.1 389.3 193.3 77.5 47.6 82.5 1.1 142.7 23.0 0.3 5.3 314.7
Min 7.6 900.0 526.0 0.1 2.7 0.1 4.7 280.0 140.0 56.1 34.0 75.0 0.7 120.0 16.0 0.0 0.0 236.0
Max 8.4 1180.0 661.0 0.4 5.1 0.2 8.6 448.0 252.0 101.0 61.2 90.0 1.5 176.0 29.0 0.4 12.0 380.0
SD 0.4 142.9 71.2 0.2 1.4 0.0 2.1 94.8 56.2 22.5 13.6 10.6 0.6 29.5 6.6 0.2 6.1 72.9
PZ-3
Avg 8.1 534.3 329.7 1.4 2.7 0.1 3.3 122.7 74.0 29.7 11.8 55.0 2.4 94.0 13.7 0.1 2.7 120.0
Min 7.7 470.0 284.0 0.1 1.3 0.0 1.0 96.0 52.0 20.8 10.2 50.0 0.9 80.0 6.0 0.0 0.0 102.0
Max 8.5 624.0 399.0 2.3 5.4 0.2 7.9 152.0 92.0 36.9 14.6 61.0 4.1 114.0 18.0 0.3 4.0 140.0
SD 0.4 80.1 61.0 1.2 2.4 0.1 4.0 28.1 20.3 8.1 2.4 5.6 1.6 17.8 6.7 0.2 2.3 19.1
PZ-4
Avg 7.8 371.3 222.3 0.7 2.2 0.1 4.9 116.0 50.0 20.0 16.0 50.3 1.6 77.3 11.2 0.2 0.0 80.0
Min 7.7 320.0 180.0 0.1 0.9 0.1 1.0 64.0 34.0 13.6 6.8 40.0 0.6 60.0 9.5 0.0 0.0 60.0
Max 7.9 452.0 289.0 2.0 5.0 0.2 12.6 212.0 80.0 32.1 32.1 69.0 3.5 106.0 12.0 0.4 0.0 116.0
SD 0.1 70.7 58.4 1.1 2.4 0.0 6.7 83.2 26.0 10.4 13.9 16.2 1.6 25.0 1.4 0.2 0.0 31.2
PZ-5
Avg 7.9 603.7 349.9 0.1 3.9 0.2 20.3 192.0 93.7 37.5 23.9 47.3 0.5 80.0 15.5 0.2 2.7 174.0
Min 7.4 505.0 283.0 0.0 1.9 0.1 12.0 136.0 60.0 24.0 17.0 44.0 0.4 74.0 2.5 0.1 0.0 112.0
Max 8.4 781.0 430.8 0.1 7.5 0.2 32.0 298.0 155.0 62.1 34.7 50.0 0.6 86.0 23.0 0.5 4.0 286.0
SD 0.5 153.9 74.9 0.1 3.2 0.1 10.4 91.8 53.2 21.3 9.5 3.1 0.1 6.0 11.3 0.2 2.3 97.2
PZ-6
Avg 7.7 420.3 260.3 0.1 3.4 0.2 10.7 106.7 37.3 15.0 16.8 43.7 1.2 74.7 8.3 0.1 0.0 89.3
Min 7.5 384.0 226.0 0.1 0.0 0.1 1.0 96.0 24.0 9.6 13.6 32.0 0.7 64.0 1.9 0.0 0.0 84.0
Max 8.0 454.0 284.0 0.1 8.4 0.2 24.0 112.0 48.0 19.2 21.4 55.0 2.0 92.0 12.0 0.2 0.0 96.0
SD 0.3 35.1 30.4 0.0 4.4 0.1 11.9 9.2 12.2 4.9 4.0 11.5 0.7 15.1 5.6 0.1 0.0 6.1
PZ-7
Avg 7.9 450.0 267.7 0.1 2.1 0.1 14.2 118.3 65.7 26.3 12.8 41.0 1.0 76.0 18.7 0.3 1.3 85.3
Min 7.9 345.0 197.0 0.0 1.8 0.1 10.2 90.0 51.0 20.4 9.5 20.0 0.7 38.0 17.0 0.3 0.0 68.0
Max 7.9 550.0 352.0 0.2 2.3 0.2 17.2 140.0 94.0 37.7 17.7 62.0 1.2 100.0 21.0 0.3 4.0 116.0
SD 0.0 102.6 78.4 0.1 0.3 0.0 3.6 25.7 24.5 9.8 4.4 29.7 0.4 33.3 2.1 0.0 2.3 26.6

59
2011 General Nutrients
Hardness Major Ions
Alkalinity
Parameters pH EC_GEN TDS NH3-N NO2+NO3 p-T COD Har_T Har_Ca Ca Mg Na K Cl SO4 F Alk-P Alk-TOT
Unit
µmho/cm mg/L
mg
N/L mg N/L mgP/L mg/L mgCaCO3/L mgCaCO3/L mg/L mg/L mg/L mg/L mg/L mg/L mg/L mgCaCO3/L mgCaCO3/L
PZ-8
Avg 7.9 350.7 224.3 0.3 2.7 0.1 14.3 98.7 56.7 22.7 10.2 29.7 0.9 47.3 10.3 0.2 0.0 104.0
Min 7.9 300.0 192.0 0.1 2.7 0.1 10.2 88.0 50.0 20.0 9.2 28.0 0.3 42.0 8.0 0.2 0.0 98.0
Max 7.9 440.0 281.0 0.8 2.7 0.2 16.9 112.0 64.0 25.6 11.7 31.0 2.0 54.0 12.0 0.2 0.0 112.0
SD 0.0 77.6 49.2 0.4 0.0 0.0 3.6 12.2 7.0 2.8 1.3 1.5 1.0 6.1 2.1 0.0 0.0 7.2
PZ-9
Avg 8.2 534.7 314.7 0.5 3.7 0.1 14.1 157.3 76.7 30.7 19.6 51.5 0.8 85.0 11.7 0.2 4.0 146.0
Min 7.7 481.0 266.0 0.0 3.5 0.1 11.0 142.0 76.0 30.5 16.0 48.0 0.6 76.0 11.0 0.1 0.0 132.0
Max 8.5 570.0 364.0 1.0 4.0 0.1 17.2 170.0 78.0 31.3 22.4 55.0 0.9 95.0 12.0 0.2 8.0 154.0
SD 0.4 47.2 49.0 0.5 0.3 0.0 3.1 14.2 1.2 0.5 3.2 4.9 0.2 9.5 0.6 0.0 4.0 12.2

60
Table 9: Water quality observation of Peizometer (Year 2012)

61
4.4 Water quality observation of Baseline (Ground water)
General parameter
pH: The pH value ranged between 7.0 to 8.7. The highest value of 8.7 was recorded during
the month of Oct- 2011 and lowest value of 7.0 was recorded in June- 2012. The Maximum
value 8.7 was recorded at Site G-9 and the Minimum value 7.0 was recorded at similar Site G-
9 during the period of june-2012.
Electrical Conductivity: Since the ions are the carriers of electricity, the electrical
conductivity of the water rises according to the content of soluble salts in the water. Generally
E.C. is defined as mobility of the ions. The value ranged between 410 to 1520 µs/cm. The
Maximum value of 1520 µs/cm. was recorded in Oct- 2012 and Min value of 410 µs/cm.
was recorded April-2010 in the Baseline area. The Maximum value of 1520 µs/cm was
recorded at Site G-12B and Minimum value of 410µs/cm was recorded at Site G -7B.
Total dissolved solids (TDS): Total dissolved solids are mainly the inorganic minerals and
sometimes some organic matter. The TDS value ranged between 262 to 972 mg/l. the highest
value of 972 mg/l was recorded Oct-2012 at site G-12B and lowest value of 262 mg/l was
recorded at April-2010 at the site of G-7B.
POLLUTION INDICATING PARAMETER
NITRATE:- Nitrate (NO3) is a naturally occurring form of nitrogen found in soil. Nitrogen is
essential to all life. Most crop plants require large quantities to sustain high yields Nitrate can
be expressed as either NO3 (nitrate) or NO3-N (nitrate-nitrogen). Nitrate levels above the
EPA Maximum Contaminant Level of 10mg/l NO3- N or 45 mg/l NO3 may cause
methemoglobinemia in infants. Nitrate (NO3) is a naturally occurring form of nitrogen found
in soil. nitrate also can leach into groundwater. If people or animals drink water high in
nitrate, it may cause methemoglobinemia, an illness found especially in infant, but sometimes
rain or irrigation water can leach them into groundwater. Although nitrate occurs naturally in
some groundwater, in most cases higher levels are thought to result from human activities.
Common sources of nitrate include: fertilizers and manure, animal feedlots, municipal
wastewater and sludge.
In Ground water the nitrate content of the water was in the range between 0.4 to 109.2mg/l.
Maximum concentration 109.2mg/l of nitrate was found in site of G-11B oct-2012 and
minimum Nitrate 0.4 -was observed at site G-7A during the month of Oct, Nov and Dec -
2010 post-monsoon season.

62
PHOSPHATE: In Baseline area Phosphate range observed 0.0 to 1.0mg/l. Max:-T-
phosphate 1.0mg/l was found at site G-11A in the month of Nov-2011
HEMICAL OXYGEN DEMAND:-The chemical oxygen demand observed ranging between
0.0 to 64 mg/l. Max COD 64.0mg/l was observed at site G-11A during the month of June-
2010 and Min COD 0.0mg/l was observed at site G-5&G-12 june-2010.
Iron:-The Iron value observed ranging between 0.0 to 0.9mg/l. Max The Highest value
0.9mg/l was observed at site G-04&G-11A during the month of oct-2012. The Lowest value
0.0mg/l was observed at many site G-01-in this site of Feb&March-2011,similaraly it was
observed G-4 Nov-2011,G-10 Feb&Dec-2011,G-10 April-2012,G-11A Jan&Feb-2011,G-11C
Jan,Feb,March,Nov-2011 and G11C June-12.
Fluoride: The fluoride value ranged between 0.0 to 1.0 mg/l. During the study period highest
value was observed 1.0mg/l at site G-01Jan-2011,G-05June-2011,G-09 Oct-2010&April-
2011,G-10April,may,june-2010andJune-2011,G-11A April,may-2010,G-11C April,May,june-
2010,G-12C April,June-2010,and G-13May-2011.
Total Hardness: The Total Hardness value ranged between 104 to 700 mg/l. During the
study period the highest value of 700 mg/l was noted in June- 2012 and lowest value of 104
mg/l was noted in Oct-2012. The maximum value of total hardness 700 mg/l was recorded at
Site G-12B and while as minimum value of 104 mg/l was recorded at Site G-02 in the
Baseline area.
Calcium Ion (Ca++
):- The Calcium ion value was ranging between 32.0 to 165.6mg/l. The
highest value of 165.6mg/l was noted in Nov-2010 and lowest value of 32.0mg/l was noted in
Oct-2012. The maximum value of 165.6mg/l was recorded at site G-12B and minimum value
of 32.0 mg/l was recorded at site G-02.
Magnesium ion(Mg++
): The Magnesium ion value ranged between 5.8 to 62.3mg/l. The
highest value of 62.3mg/l was recorded in Oct-2012 and lowest value of 5.8mg/l was
recorded in Oct-2011. The Maximum value of 62.3 mg/l was recorded at Site G-10 and
Minimum value of 5.8 mg/l was recorded at Site G-02.
Sodium (Na+): The sodium value ranging between 12.0 to 132.0mg/l. The highest value of
132.0mg/l was recorded in Dec-2010 and lowest value of 12.0mg/l was recorded in Oct-2012.
The Maximum value of 132.0 mg/l was recorded at Site G-12B and Minimum value of 12.0
mg/l was recorded at Site G-2.
Potassium(k+): The Potassium value ranging between 0.1 to 18.0mg/l. The highest value of
18.0mg/l was recorded in June-2010 and lowest value of 0.1mg/l was recorded in May-2011in

63
G-03,April-2012in G-05,May&june-2011in G-7B,May-2011in G-12C, and May-2011 in G-
13. The Maximum value of 18.0 mg/l was recorded at Site G-13.
Chloride: The chloride value ranged between 32 to 248 mg/l. The highest value of 248 mg/l
was noted in June-2012 at site G- 12B and lowest value of 42 mg/l was noted in April-
2010,andApril,May-2011 at site G-7B.
Sulphate: The sulphate value ranged between 10.0 to144.0 mg/l. The highest value of 144.0
mg/l was noted in Oct-2012 at site G-05 and lowest value of 10.0 mg/l was noted in April-
2011 at site G-12 in the Baseline area.
Carbonate(CO3-): The Carbonate value ranged between 0.0 to 25.2 mg/l. the highest value
of 25.2 mg/l noted in Nov-2010 maximum value of carbonate 25.2 mg/l was recorded at Site
G-10.
Bicarbonate(HCO3-):- Bicarbonate value ranged between 84.0 to 536.8 mg/l. The highest
value of 536.8mg/l was noted in April -2010 and lowest value of 84mg/l was noted in Oct-
2012.The Maximum value of 536.8 mg/l was recorded at Site G-11A, and minimum value of
84.0 mg/l was recorded at Site G-02.

64
Fig 55: Graphical presentation of pH in ground water.
Fig 56: Graphical presentation of EC in ground water.
Fig 57: Graphical presentation of TDS in ground water.
6.8 7.0 7.2 7.4 7.6 7.8 8.0 8.2 8.4 8.6
G-1
G-2
G-3
G-4
G-5
G-7
A
G-7
B
G-9
G-1
0
G-1
1A
G-1
1B
G-1
1C
G-1
2A
G-1
2B
G-1
2C
G-1
3
pH
Sampling sites
2010 2011 2012
0.0
200.0
400.0
600.0
800.0
1000.0
1200.0
1400.0
G-1
G-2
G-3
G-4
G-5
G-7
A
G-7
B
G-9
G-1
0
G-1
1A
G-1
1B
G-1
1C
G-1
2A
G-1
2B
G-1
2C
G-1
3
co
nd
ucti
vit
y µ
mh
o/c
m
Samling sites
2010 2011 2012
0.0
100.0
200.0
300.0
400.0
500.0
600.0
700.0
800.0
G-1 G-2 G-3 G-4 G-5 G-7A G-7B G-9 G-10 G-11A G-11B G-11C G-12A G-12B G-12C G-13
TD
S m
g/l
Sampling sites
2010 2011 2012

65
Fig 58: Graphical presentation of NO3 in ground water
Fig 59: Graphical presentation of T.PO4 in ground water.
Fig 60: Graphical presentation of Iron in ground water .
0.0
5.0
10.0
15.0
20.0
25.0
30.0
35.0
40.0
45.0
50.0
G-1 G-2 G-3 G-4 G-5 G-7A G-7B G-9 G-10 G-11A G-11B G-11C G-12A G-12B G-12C G-13
NO
3 m
g/l
Sampling sites
2010 2011 2012
0.0
0.1
0.2
0.3
0.4
0.5
0.6
T.P
O4 m
g/l
Sampling sites
2010 2011 2012
0.0
0.1
0.2
0.3
0.4
0.5
0.6
0.7
0.8
0.9
1.0
Fe
mg
/l
Sampling sites
2010 2011 2012

66
Fig 61: Graphical presentation of fluoride in ground water.
Fig 62: Graphical presentation of COD in ground water.
Fig 63: Graphical presentation of Tot. Hardness in ground water.
0.0
0.1
0.2
0.3
0.4
0.5
0.6
0.7
0.8
Flu
ori
de
(m
g/l
)
Sampling sites
2010 2011 2012
0.0
10.0
20.0
30.0
40.0
50.0
60.0
CO
D m
g/l
Sampling sites
2010 2011 2012
0.0
100.0
200.0
300.0
400.0
500.0
600.0
To
t.H
mg
/l
Sampling sites
2010 2011 2012
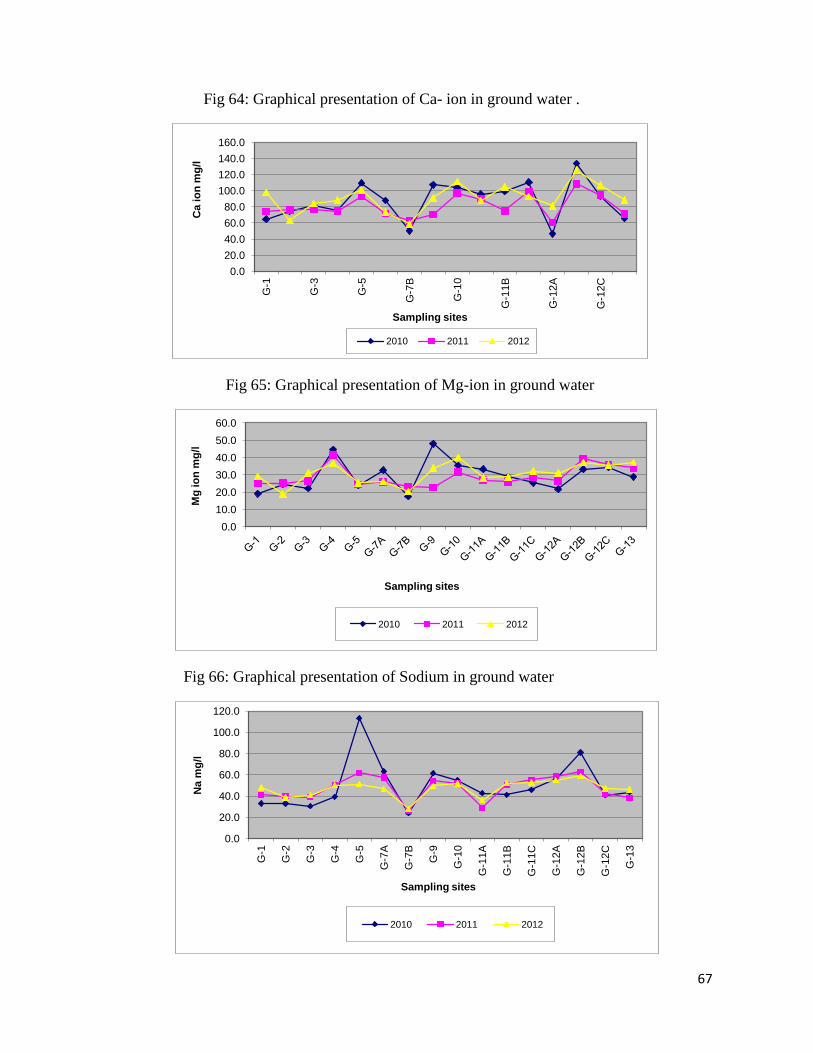
67
Fig 64: Graphical presentation of Ca- ion in ground water .
Fig 65: Graphical presentation of Mg-ion in ground water
Fig 66: Graphical presentation of Sodium in ground water
0.0
20.0
40.0
60.0
80.0
100.0
120.0
140.0
160.0
G-1
G-3
G-5
G-7
B
G-1
0
G-1
1B
G-1
2A
G-1
2C
Ca io
n m
g/l
Sampling sites
2010 2011 2012
0.0
10.0
20.0
30.0
40.0
50.0
60.0
Mg
io
n m
g/l
Sampling sites
2010 2011 2012
0.0
20.0
40.0
60.0
80.0
100.0
120.0
G-1
G-2
G-3
G-4
G-5
G-7
A
G-7
B
G-9
G-1
0
G-1
1A
G-1
1B
G-1
1C
G-1
2A
G-1
2B
G-1
2C
G-1
3
Na m
g/l
Sampling sites
2010 2011 2012

68
Fig 67: Graphical presentation of Chloride in ground water
Fig 68: Graphical presentation of Potassium in ground water
Fig 69: Graphical presentation of Sulphate in ground water
0.0
20.0
40.0
60.0
80.0
100.0
120.0
140.0
160.0
180.0
200.0
Cl m
g/l
Sampling sites
2010 2011 2012
0.0
1.0
2.0
3.0
4.0
5.0
6.0
7.0
8.0
K m
g/l
Sampling sites
2010 2011 2012
0.0
20.0
40.0
60.0
80.0
100.0
120.0
140.0
G-1
G-3
G-5
G-7
B
G-1
0
G-1
1B
G-1
2A
G-1
2C
SO
4 m
g/l
Sampling sites
2010 2011 2012

69
Fig 70: Graphical presentation of Carbonate in ground water
Fig 71: Graphical presentation of Bi-Carbonate in ground water
0.0
2.0
4.0
6.0
8.0
10.0
12.0
14.0
G-1
G-2
G-3
G-4
G-5
G-7
A
G-7
B
G-9
G-1
0
G-1
1A
G-1
1B
G-1
1C
G-1
2A
G-1
2B
G-1
2C
G-1
3
CO
3 m
g/l
Sampling sites
2010 2011 2012
0.0
100.0
200.0
300.0
400.0
500.0
600.0
G-1
G-2
G-3
G-4
G-5
G-7
A
G-7
B
G-9
G-1
0
G-1
1A
G-1
1B
G-1
1C
G-1
2A
G-1
2B
G-1
2C
G-1
3
HC
O3 m
g/l
Sampling sites
2010 2011 2012
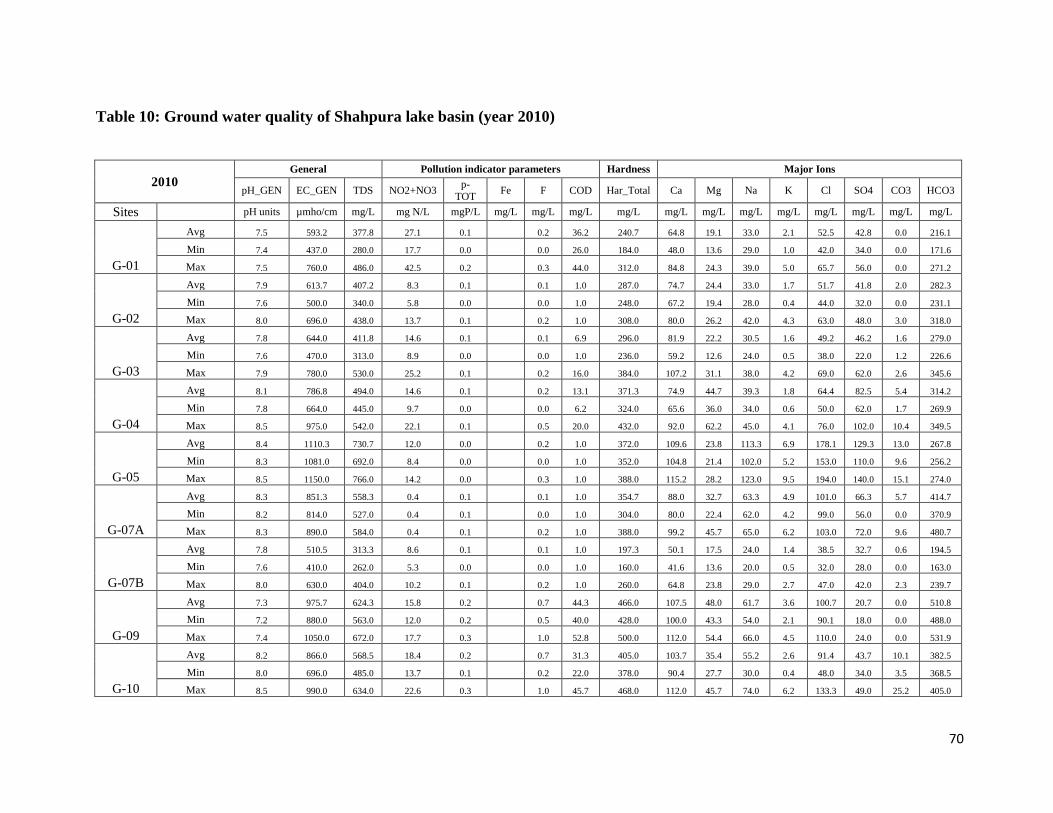
70
Table 10: Ground water quality of Shahpura lake basin (year 2010)
2010 General Pollution indicator parameters Hardness Major Ions
pH_GEN EC_GEN TDS NO2+NO3 p-
TOT Fe F COD Har_Total Ca Mg Na K Cl SO4 CO3 HCO3
Sites
pH units µmho/cm mg/L mg N/L mgP/L mg/L mg/L mg/L mg/L mg/L mg/L mg/L mg/L mg/L mg/L mg/L mg/L
G-01
Avg 7.5 593.2 377.8 27.1 0.1 0.2 36.2 240.7 64.8 19.1 33.0 2.1 52.5 42.8 0.0 216.1
Min 7.4 437.0 280.0 17.7 0.0 0.0 26.0 184.0 48.0 13.6 29.0 1.0 42.0 34.0 0.0 171.6
Max 7.5 760.0 486.0 42.5 0.2 0.3 44.0 312.0 84.8 24.3 39.0 5.0 65.7 56.0 0.0 271.2
G-02
Avg 7.9 613.7 407.2 8.3 0.1 0.1 1.0 287.0 74.7 24.4 33.0 1.7 51.7 41.8 2.0 282.3
Min 7.6 500.0 340.0 5.8 0.0 0.0 1.0 248.0 67.2 19.4 28.0 0.4 44.0 32.0 0.0 231.1
Max 8.0 696.0 438.0 13.7 0.1 0.2 1.0 308.0 80.0 26.2 42.0 4.3 63.0 48.0 3.0 318.0
G-03
Avg 7.8 644.0 411.8 14.6 0.1 0.1 6.9 296.0 81.9 22.2 30.5 1.6 49.2 46.2 1.6 279.0
Min 7.6 470.0 313.0 8.9 0.0 0.0 1.0 236.0 59.2 12.6 24.0 0.5 38.0 22.0 1.2 226.6
Max 7.9 780.0 530.0 25.2 0.1 0.2 16.0 384.0 107.2 31.1 38.0 4.2 69.0 62.0 2.6 345.6
G-04
Avg 8.1 786.8 494.0 14.6 0.1 0.2 13.1 371.3 74.9 44.7 39.3 1.8 64.4 82.5 5.4 314.2
Min 7.8 664.0 445.0 9.7 0.0 0.0 6.2 324.0 65.6 36.0 34.0 0.6 50.0 62.0 1.7 269.9
Max 8.5 975.0 542.0 22.1 0.1 0.5 20.0 432.0 92.0 62.2 45.0 4.1 76.0 102.0 10.4 349.5
G-05
Avg 8.4 1110.3 730.7 12.0 0.0 0.2 1.0 372.0 109.6 23.8 113.3 6.9 178.1 129.3 13.0 267.8
Min 8.3 1081.0 692.0 8.4 0.0 0.0 1.0 352.0 104.8 21.4 102.0 5.2 153.0 110.0 9.6 256.2
Max 8.5 1150.0 766.0 14.2 0.0 0.3 1.0 388.0 115.2 28.2 123.0 9.5 194.0 140.0 15.1 274.0
G-07A
Avg 8.3 851.3 558.3 0.4 0.1 0.1 1.0 354.7 88.0 32.7 63.3 4.9 101.0 66.3 5.7 414.7
Min 8.2 814.0 527.0 0.4 0.1 0.0 1.0 304.0 80.0 22.4 62.0 4.2 99.0 56.0 0.0 370.9
Max 8.3 890.0 584.0 0.4 0.1 0.2 1.0 388.0 99.2 45.7 65.0 6.2 103.0 72.0 9.6 480.7
G-07B
Avg 7.8 510.5 313.3 8.6 0.1 0.1 1.0 197.3 50.1 17.5 24.0 1.4 38.5 32.7 0.6 194.5
Min 7.6 410.0 262.0 5.3 0.0 0.0 1.0 160.0 41.6 13.6 20.0 0.5 32.0 28.0 0.0 163.0
Max 8.0 630.0 404.0 10.2 0.1 0.2 1.0 260.0 64.8 23.8 29.0 2.7 47.0 42.0 2.3 239.7
G-09
Avg 7.3 975.7 624.3 15.8 0.2 0.7 44.3 466.0 107.5 48.0 61.7 3.6 100.7 20.7 0.0 510.8
Min 7.2 880.0 563.0 12.0 0.2 0.5 40.0 428.0 100.0 43.3 54.0 2.1 90.1 18.0 0.0 488.0
Max 7.4 1050.0 672.0 17.7 0.3 1.0 52.8 500.0 112.0 54.4 66.0 4.5 110.0 24.0 0.0 531.9
G-10
Avg 8.2 866.0 568.5 18.4 0.2 0.7 31.3 405.0 103.7 35.4 55.2 2.6 91.4 43.7 10.1 382.5
Min 8.0 696.0 485.0 13.7 0.1 0.2 22.0 378.0 90.4 27.7 30.0 0.4 48.0 34.0 3.5 368.5
Max 8.5 990.0 634.0 22.6 0.3 1.0 45.7 468.0 112.0 45.7 74.0 6.2 133.3 49.0 25.2 405.0
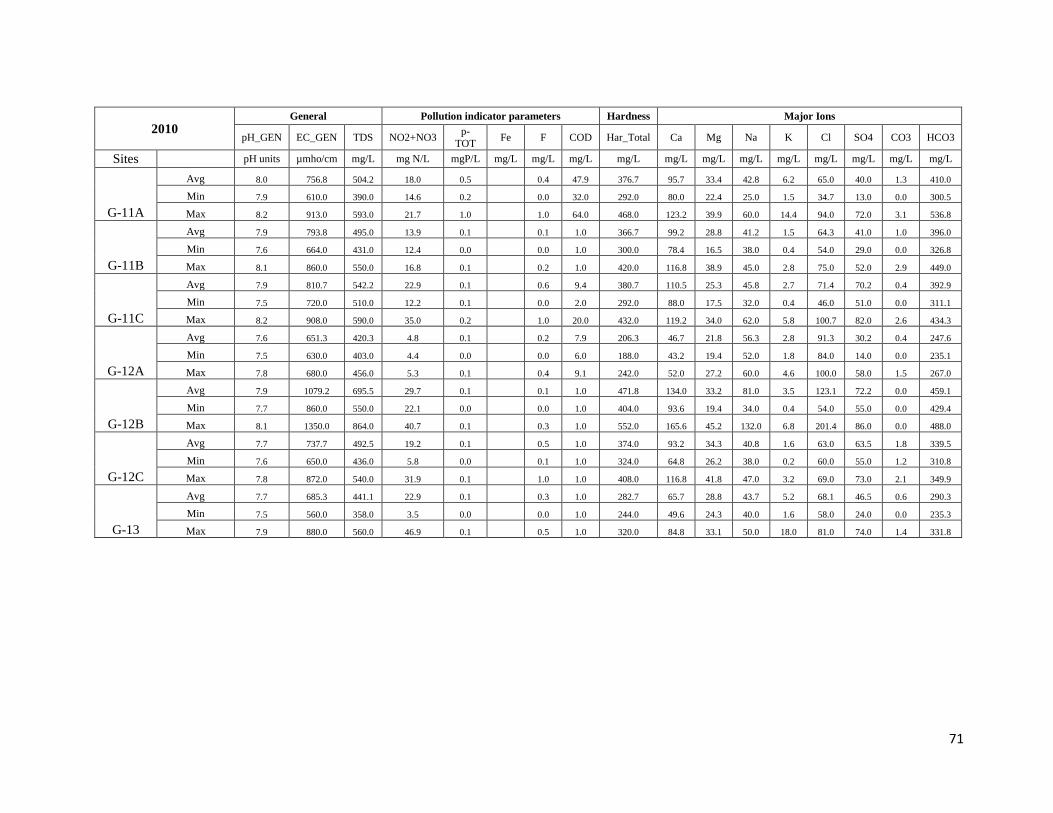
71
2010 General Pollution indicator parameters Hardness Major Ions
pH_GEN EC_GEN TDS NO2+NO3 p-
TOT Fe F COD Har_Total Ca Mg Na K Cl SO4 CO3 HCO3
Sites
pH units µmho/cm mg/L mg N/L mgP/L mg/L mg/L mg/L mg/L mg/L mg/L mg/L mg/L mg/L mg/L mg/L mg/L
G-11A
Avg 8.0 756.8 504.2 18.0 0.5 0.4 47.9 376.7 95.7 33.4 42.8 6.2 65.0 40.0 1.3 410.0
Min 7.9 610.0 390.0 14.6 0.2 0.0 32.0 292.0 80.0 22.4 25.0 1.5 34.7 13.0 0.0 300.5
Max 8.2 913.0 593.0 21.7 1.0 1.0 64.0 468.0 123.2 39.9 60.0 14.4 94.0 72.0 3.1 536.8
G-11B
Avg 7.9 793.8 495.0 13.9 0.1 0.1 1.0 366.7 99.2 28.8 41.2 1.5 64.3 41.0 1.0 396.0
Min 7.6 664.0 431.0 12.4 0.0 0.0 1.0 300.0 78.4 16.5 38.0 0.4 54.0 29.0 0.0 326.8
Max 8.1 860.0 550.0 16.8 0.1 0.2 1.0 420.0 116.8 38.9 45.0 2.8 75.0 52.0 2.9 449.0
G-11C
Avg 7.9 810.7 542.2 22.9 0.1 0.6 9.4 380.7 110.5 25.3 45.8 2.7 71.4 70.2 0.4 392.9
Min 7.5 720.0 510.0 12.2 0.1 0.0 2.0 292.0 88.0 17.5 32.0 0.4 46.0 51.0 0.0 311.1
Max 8.2 908.0 590.0 35.0 0.2 1.0 20.0 432.0 119.2 34.0 62.0 5.8 100.7 82.0 2.6 434.3
G-12A
Avg 7.6 651.3 420.3 4.8 0.1 0.2 7.9 206.3 46.7 21.8 56.3 2.8 91.3 30.2 0.4 247.6
Min 7.5 630.0 403.0 4.4 0.0 0.0 6.0 188.0 43.2 19.4 52.0 1.8 84.0 14.0 0.0 235.1
Max 7.8 680.0 456.0 5.3 0.1 0.4 9.1 242.0 52.0 27.2 60.0 4.6 100.0 58.0 1.5 267.0
G-12B
Avg 7.9 1079.2 695.5 29.7 0.1 0.1 1.0 471.8 134.0 33.2 81.0 3.5 123.1 72.2 0.0 459.1
Min 7.7 860.0 550.0 22.1 0.0 0.0 1.0 404.0 93.6 19.4 34.0 0.4 54.0 55.0 0.0 429.4
Max 8.1 1350.0 864.0 40.7 0.1 0.3 1.0 552.0 165.6 45.2 132.0 6.8 201.4 86.0 0.0 488.0
G-12C
Avg 7.7 737.7 492.5 19.2 0.1 0.5 1.0 374.0 93.2 34.3 40.8 1.6 63.0 63.5 1.8 339.5
Min 7.6 650.0 436.0 5.8 0.0 0.1 1.0 324.0 64.8 26.2 38.0 0.2 60.0 55.0 1.2 310.8
Max 7.8 872.0 540.0 31.9 0.1 1.0 1.0 408.0 116.8 41.8 47.0 3.2 69.0 73.0 2.1 349.9
G-13
Avg 7.7 685.3 441.1 22.9 0.1 0.3 1.0 282.7 65.7 28.8 43.7 5.2 68.1 46.5 0.6 290.3
Min 7.5 560.0 358.0 3.5 0.0 0.0 1.0 244.0 49.6 24.3 40.0 1.6 58.0 24.0 0.0 235.3
Max 7.9 880.0 560.0 46.9 0.1 0.5 1.0 320.0 84.8 33.1 50.0 18.0 81.0 74.0 1.4 331.8

72
Table 11: Ground water quality of Shahpura lake basin (year 2011)
2011 General Pollution indicator parameters Hardness Major Ions
pH_GEN EC_GEN TDS NO2+NO3 p-TOT Fe F COD Har_Total Ca Mg Na K Cl SO4 CO3 HCO3
Sites
pH units µmho/cm mg/L mg N/L mgP/L mg/L mg/L mg/L mg/L mg/L mg/L mg/L mg/L mg/L mg/L mg/L mg/L
G-01
Avg 8.0 682.6 436.8 26.0 0.1 0.2 0.4 30.3 289.3 74.2 25.3 41.1 1.7 68.5 38.7 6.0 248.5
Min 7.5 480.0 307.0 13.3 0.1 0.0 0.0 22.0 190.0 51.2 15.1 33.0 0.4 52.0 28.0 0.0 178.9
Max 8.4 840.0 538.0 41.2 0.2 0.4 1.0 33.0 390.0 105.6 34.0 55.0 4.0 89.1 48.0 20.2 318.4
G-02
Avg 8.1 691.4 425.9 11.4 0.1 0.3 0.2 1.1 294.4 76.4 25.1 40.1 1.5 64.9 47.1 3.8 284.9
Min 7.5 520.0 333.0 4.4 0.0 0.2 0.0 1.0 268.0 72.0 21.3 32.0 0.2 42.0 36.0 0.0 260.0
Max 8.4 804.0 461.0 18.6 0.2 0.4 0.3 1.3 312.0 80.8 26.7 48.0 3.4 78.0 58.0 8.0 300.0
G-03
Avg 8.0 733.9 456.9 16.1 0.2 0.3 0.5 10.7 295.8 76.9 26.6 39.2 1.8 64.2 50.4 2.5 293.4
Min 7.8 616.0 360.0 8.0 0.1 0.2 0.2 1.0 240.0 62.4 20.3 30.0 0.1 42.0 30.0 0.0 240.2
Max 8.5 820.0 524.0 26.6 0.2 0.4 0.9 22.7 362.0 98.0 39.4 52.0 5.1 80.0 66.0 10.1 346.5
G-04
Avg 8.3 754.6 478.9 10.2 0.1 0.1 0.6 20.7 352.1 74.7 41.3 50.6 2.1 85.7 61.3 8.1 286.6
Min 8.0 669.3 442.0 4.4 0.1 0.0 0.2 9.0 302.0 68.8 31.6 38.0 0.2 66.0 29.0 0.0 240.0
Max 8.5 870.0 512.0 15.5 0.2 0.2 0.9 26.0 400.0 83.6 49.6 56.1 3.7 100.0 96.0 14.4 319.9
G-05
Avg 8.3 1037.8 635.8 11.3 0.1 0.3 0.4 2.7 337.6 94.7 24.7 66.8 2.7 118.6 84.1 11.4 278.6
Min 7.9 710.0 426.0 5.8 0.0 0.2 0.1 1.0 204.0 48.0 17.5 41.1 0.4 74.6 44.0 0.0 171.4
Max 8.6 1250.0 768.0 17.7 0.2 0.3 1.0 5.3 400.0 113.6 33.5 105.0 6.7 200.0 132.0 24.0 339.7
G-07A
Avg 8.3 766.1 474.2 15.3 0.2 0.2 0.3 19.5 292.3 71.8 26.0 57.4 1.3 88.6 42.7 6.8 265.3
Min 7.6 619.0 396.0 7.8 0.1 0.1 0.2 2.0 256.0 64.0 19.3 42.0 0.3 71.0 17.0 0.0 233.8
Max 8.5 845.0 544.0 26.6 0.2 0.2 0.5 35.0 312.0 83.2 35.0 80.0 2.8 105.0 50.0 12.0 312.0
G-07B
Avg 8.0 577.4 363.0 9.1 0.1 0.1 0.2 9.6 256.6 62.7 23.0 26.6 1.2 45.2 42.4 3.7 234.1
Min 7.4 420.0 269.0 6.6 0.0 0.1 0.2 1.0 210.0 48.0 14.1 20.0 0.1 32.0 30.0 0.0 177.3
Max 8.5 680.0 435.0 11.1 0.2 0.2 0.3 17.5 304.0 74.4 31.1 35.0 2.9 62.0 55.0 10.0 268.0
G-09
Avg 8.1 747.4 455.1 10.7 0.1 0.1 0.4 11.2 268.9 70.5 22.7 54.3 2.0 90.6 44.5 2.9 248.8
Min 7.4 654.0 383.3 4.4 0.0 0.1 0.0 1.0 220.0 64.1 12.2 48.0 1.1 80.0 27.0 0.0 189.1
Max 8.7 880.0 564.0 17.3 0.3 0.2 1.0 24.0 328.0 76.1 37.9 65.0 4.1 105.1 58.6 5.2 281.7
G-10
Avg 8.1 942.4 583.7 18.9 0.1 0.1 0.5 24.9 372.2 97.0 31.5 52.2 2.0 91.3 51.7 5.0 370.3
Min 7.8 870.0 498.0 14.2 0.1 0.0 0.2 18.0 340.0 88.0 26.7 35.0 0.5 52.0 34.0 0.0 354.0
Max 8.4 1003.1 642.0 23.0 0.3 0.1 1.0 34.0 424.0 107.0 37.9 75.0 3.9 118.0 62.3 12.0 385.5
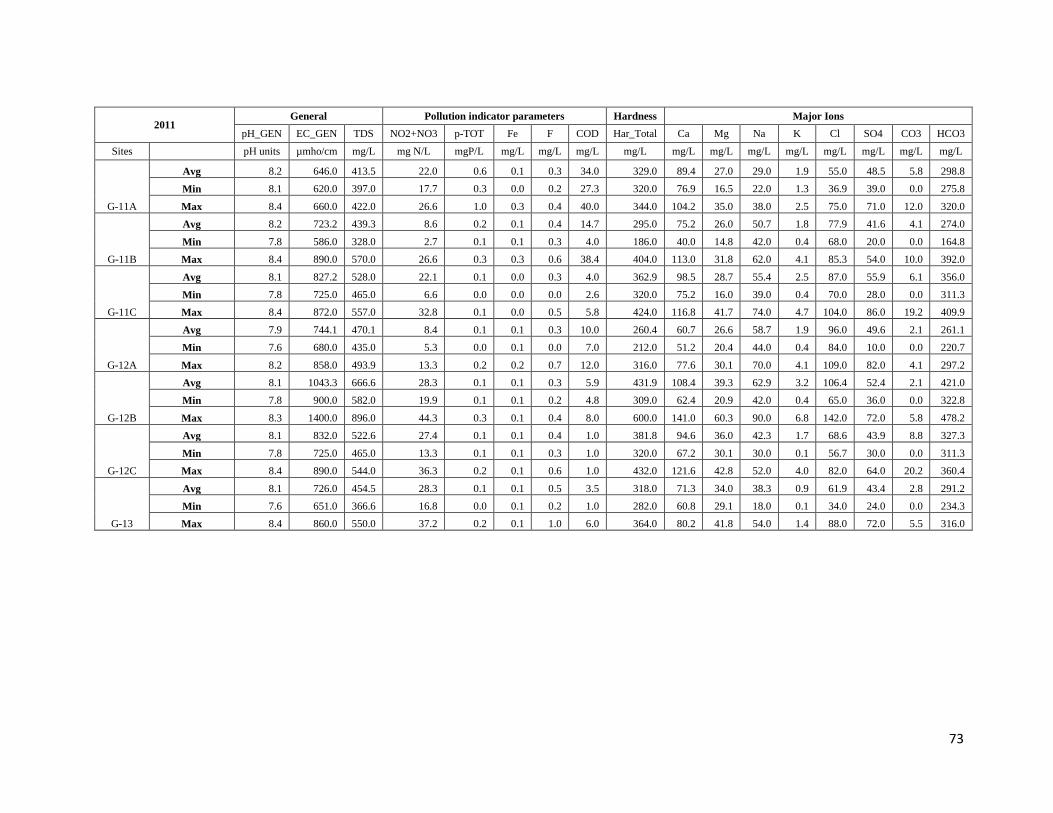
73
2011 General Pollution indicator parameters Hardness Major Ions
pH_GEN EC_GEN TDS NO2+NO3 p-TOT Fe F COD Har_Total Ca Mg Na K Cl SO4 CO3 HCO3
Sites pH units µmho/cm mg/L mg N/L mgP/L mg/L mg/L mg/L mg/L mg/L mg/L mg/L mg/L mg/L mg/L mg/L mg/L
G-11A
Avg 8.2 646.0 413.5 22.0 0.6 0.1 0.3 34.0 329.0 89.4 27.0 29.0 1.9 55.0 48.5 5.8 298.8
Min 8.1 620.0 397.0 17.7 0.3 0.0 0.2 27.3 320.0 76.9 16.5 22.0 1.3 36.9 39.0 0.0 275.8
Max 8.4 660.0 422.0 26.6 1.0 0.3 0.4 40.0 344.0 104.2 35.0 38.0 2.5 75.0 71.0 12.0 320.0
G-11B
Avg 8.2 723.2 439.3 8.6 0.2 0.1 0.4 14.7 295.0 75.2 26.0 50.7 1.8 77.9 41.6 4.1 274.0
Min 7.8 586.0 328.0 2.7 0.1 0.1 0.3 4.0 186.0 40.0 14.8 42.0 0.4 68.0 20.0 0.0 164.8
Max 8.4 890.0 570.0 26.6 0.3 0.3 0.6 38.4 404.0 113.0 31.8 62.0 4.1 85.3 54.0 10.0 392.0
G-11C
Avg 8.1 827.2 528.0 22.1 0.1 0.0 0.3 4.0 362.9 98.5 28.7 55.4 2.5 87.0 55.9 6.1 356.0
Min 7.8 725.0 465.0 6.6 0.0 0.0 0.0 2.6 320.0 75.2 16.0 39.0 0.4 70.0 28.0 0.0 311.3
Max 8.4 872.0 557.0 32.8 0.1 0.0 0.5 5.8 424.0 116.8 41.7 74.0 4.7 104.0 86.0 19.2 409.9
G-12A
Avg 7.9 744.1 470.1 8.4 0.1 0.1 0.3 10.0 260.4 60.7 26.6 58.7 1.9 96.0 49.6 2.1 261.1
Min 7.6 680.0 435.0 5.3 0.0 0.1 0.0 7.0 212.0 51.2 20.4 44.0 0.4 84.0 10.0 0.0 220.7
Max 8.2 858.0 493.9 13.3 0.2 0.2 0.7 12.0 316.0 77.6 30.1 70.0 4.1 109.0 82.0 4.1 297.2
G-12B
Avg 8.1 1043.3 666.6 28.3 0.1 0.1 0.3 5.9 431.9 108.4 39.3 62.9 3.2 106.4 52.4 2.1 421.0
Min 7.8 900.0 582.0 19.9 0.1 0.1 0.2 4.8 309.0 62.4 20.9 42.0 0.4 65.0 36.0 0.0 322.8
Max 8.3 1400.0 896.0 44.3 0.3 0.1 0.4 8.0 600.0 141.0 60.3 90.0 6.8 142.0 72.0 5.8 478.2
G-12C
Avg 8.1 832.0 522.6 27.4 0.1 0.1 0.4 1.0 381.8 94.6 36.0 42.3 1.7 68.6 43.9 8.8 327.3
Min 7.8 725.0 465.0 13.3 0.1 0.1 0.3 1.0 320.0 67.2 30.1 30.0 0.1 56.7 30.0 0.0 311.3
Max 8.4 890.0 544.0 36.3 0.2 0.1 0.6 1.0 432.0 121.6 42.8 52.0 4.0 82.0 64.0 20.2 360.4
G-13
Avg 8.1 726.0 454.5 28.3 0.1 0.1 0.5 3.5 318.0 71.3 34.0 38.3 0.9 61.9 43.4 2.8 291.2
Min 7.6 651.0 366.6 16.8 0.0 0.1 0.2 1.0 282.0 60.8 29.1 18.0 0.1 34.0 24.0 0.0 234.3
Max 8.4 860.0 550.0 37.2 0.2 0.1 1.0 6.0 364.0 80.2 41.8 54.0 1.4 88.0 72.0 5.5 316.0

74
Table 12: Ground water quality of Shahpura lake basin (year 2012)
2012 General Pollution indicator parameters Hardness Major Ions
pH_GEN EC_GEN TDS NO2+NO3 p-
TOT Fe F COD Har_Total Ca Mg Na K Cl SO4 CO3 HCO3
Sites
pH units µmho/cm mg/L mg N/L mgP/L mg/L mg/L mg/L mg/L mg/L mg/L mg/L mg/L mg/L mg/L mg/L mg/L
G-01
Avg 8.1 857.5 548.5 30.1 0.2 0.4 0.4 21.4 363.5 98.1 29.1 48.3 1.8 92.5 49.3 2.5 296.5
Min 7.8 600.0 384.0 11.1 0.0 0.3 0.3 8.4 264.0 72.0 20.4 36.0 1.3 74.0 36.0 0.0 212.0
Max 8.5 1410.0 902.0 51.8 0.3 0.6 0.5 34.0 540.0 160.0 35.4 65.0 2.9 120.0 77.0 10.0 344.0
G-02
Avg 8.0 657.4 413.0 10.9 0.2 0.4 0.2 1.0 241.6 63.1 18.8 38.8 1.7 72.5 43.7 0.8 229.9
Min 7.6 293.0 187.0 8.3 0.1 0.2 0.2 1.0 104.0 32.0 5.8 12.0 0.5 32.0 20.0 0.0 84.0
Max 8.2 900.0 576.0 12.8 0.2 0.8 0.3 1.1 292.3 76.1 24.9 52.0 3.2 112.0 54.0 3.3 280.0
G-03
Avg 8.0 740.5 464.3 13.6 0.2 0.4 0.4 12.1 320.9 82.9 30.6 40.8 1.5 78.6 45.6 3.0 297.7
Min 7.6 616.0 360.0 2.3 0.1 0.2 0.2 1.0 240.0 62.4 20.3 30.0 0.1 42.0 30.0 0.0 240.2
Max 8.5 820.0 524.0 26.6 0.2 0.7 0.9 22.7 364.0 99.3 39.4 52.0 5.1 130.0 66.0 10.1 346.5
G-04
Avg 8.2 845.9 542.6 14.7 0.1 0.4 0.4 20.1 367.9 88.3 36.7 50.4 2.3 96.6 60.3 6.6 312.8
Min 8.0 748.5 484.3 7.5 0.1 0.1 0.3 17.6 319.5 80.0 32.6 44.0 1.9 88.0 50.0 0.0 267.2
Max 8.4 1050.0 672.0 17.7 0.2 0.9 0.4 22.0 460.0 112.0 43.7 58.0 2.9 105.0 67.0 12.0 340.0
G-05
Avg 7.9 1130.2 668.3 9.7 0.2 0.6 0.4 4.1 387.5 101.2 25.5 51.4 1.1 105.8 85.9 6.8 248.1
Min 7.4 970.6 402.1 8.7 0.2 0.3 0.3 0.0 340.0 92.1 22.5 30.7 0.1 60.8 55.4 0.0 220.0
Max 8.1 1210.0 774.0 11.7 0.2 0.8 0.6 8.8 412.0 112.0 29.2 84.0 2.5 188.0 144.0 10.3 259.8
G-07A
Avg 7.9 852.7 535.7 8.9 0.3 0.3 0.3 20.8 301.4 73.4 26.1 47.0 1.4 90.0 46.1 2.7 299.0
Min 7.4 773.9 456.6 3.6 0.2 0.2 0.3 5.0 260.0 61.3 20.4 40.0 0.9 72.0 42.0 0.0 260.0
Max 8.1 1020.0 652.0 14.2 0.4 0.6 0.4 36.4 380.0 84.9 40.8 54.0 1.9 126.0 51.0 8.0 340.0
G-07B
Avg 8.1 638.3 408.2 11.2 0.2 0.4 0.3 15.9 244.5 59.0 20.4 28.0 1.5 56.8 48.8 6.5 231.5
Min 7.6 600.0 384.0 7.5 0.1 0.2 0.3 11.5 240.0 53.3 16.5 20.0 0.3 36.0 42.3 0.0 208.0
Max 8.4 720.0 460.0 17.7 0.2 0.7 0.3 20.0 254.0 68.9 24.3 32.0 2.4 78.0 59.0 16.0 254.0
G-09
Avg 7.7 862.8 561.3 21.8 0.1 0.4 0.3 18.6 368.1 91.1 33.9 49.8 1.5 88.1 49.1 4.2 290.5
Min 7.0 681.5 404.3 2.2 0.1 0.3 0.3 6.2 228.5 67.4 14.6 40.0 1.2 66.0 19.5 0.0 242.0
Max 8.3 1100.0 704.0 66.4 0.2 0.6 0.4 29.1 500.0 117.0 52.5 62.0 1.9 98.0 64.0 10.0 360.0
G-10
Avg 8.0 1076.7 664.2 18.3 0.2 0.3 0.4 16.9 443.0 111.3 40.1 51.8 2.0 106.6 52.4 4.2 367.3
Min 7.3 924.0 587.9 1.9 0.2 0.0 0.3 0.0 360.0 94.2 29.7 44.0 0.8 88.0 19.5 0.0 312.0
Max 8.3 1380.0 883.0 25.1 0.2 0.8 0.4 26.0 620.0 145.0 62.3 60.0 2.9 144.0 84.0 8.8 411.0

75
2012
General Pollution indicator parameters Hardness Major Ions
pH_GEN EC_GEN TDS NO2+NO3 p-
TOT Fe F COD Har_Total Ca Mg Na K Cl SO4 CO3 HCO3
pH units µmho/cm mg/L mg N/L mgP/L mg/L mg/L mg/L mg/L mg/L mg/L mg/L mg/L mg/L mg/L mg/L mg/L
G-11A
Avg 8.1 739.0 472.7 19.3 0.5 0.9 0.4 31.5 359.2 87.7 28.1 36.3 1.6 65.3 52.3 6.0 324.7
Min 7.7 680.0 435.0 6.2 0.4 0.9 0.4 28.0 341.6 82.4 24.0 33.0 1.2 56.0 41.8 0.0 320.0
Max 8.3 837.0 535.0 26.6 0.6 0.9 0.4 35.2 372.0 93.1 32.1 40.0 2.0 72.0 65.0 10.0 334.0
G-11B
Avg 8.0 862.5 549.2 44.4 0.2 0.4 0.4 17.3 369.5 105.0 28.8 52.2 2.1 86.0 59.4 2.8 289.6
Min 7.6 680.0 435.0 11.2 0.1 0.2 0.3 8.5 284.0 86.4 25.7 47.0 0.9 84.0 47.2 0.0 280.0
Max 8.3 1080.0 691.0 109.2 0.2 0.6 0.6 28.0 480.0 136.7 34.0 56.9 3.2 90.0 89.0 5.6 304.0
G-11C
Avg 8.1 882.6 562.3 25.6 0.1 0.2 0.4 7.3 362.0 93.1 32.2 52.8 1.7 95.5 60.5 0.0 350.5
Min 7.7 822.3 517.1 16.8 0.1 0.0 0.4 2.8 348.0 84.1 21.4 38.0 1.2 74.0 38.0 0.0 304.0
Max 8.4 940.0 601.0 36.9 0.2 0.6 0.5 17.6 372.0 104.1 37.4 65.0 2.1 120.0 70.0 0.0 392.0
G-12A
Avg 8.1 882.0 564.5 23.9 0.1 0.4 0.5 14.3 328.5 81.4 31.0 55.1 2.6 101.5 63.3 5.5 289.5
Min 7.8 740.0 473.6 10.2 0.1 0.2 0.3 12.6 244.0 54.8 25.8 52.0 1.8 94.0 58.0 0.0 264.0
Max 8.3 1230.0 787.0 62.8 0.1 0.6 0.7 17.6 520.0 136.3 38.8 58.0 3.2 110.0 70.0 12.0 328.0
G-12B
Avg 7.6 1165.0 745.3 41.3 0.2 0.4 0.4 9.4 541.5 125.6 37.2 59.0 2.8 138.3 69.4 1.6 378.5
Min 7.3 970.0 620.8 28.3 0.1 0.1 0.3 6.9 466.0 80.0 31.6 55.0 2.3 96.0 48.3 0.0 320.0
Max 7.7 1520.0 972.0 68.2 0.3 0.6 0.4 14.5 700.0 152.3 48.6 68.0 3.4 246.0 104.0 4.0 424.0
G-12C
Avg 7.5 932.4 583.0 30.2 0.2 0.4 0.3 1.0 414.4 107.1 35.7 47.3 1.8 80.5 55.1 4.3 313.5
Min 7.2 864.9 527.4 23.6 0.1 0.1 0.2 1.0 368.2 82.1 31.1 46.4 1.6 73.4 32.2 0.0 280.0
Max 7.9 1000.0 640.0 38.5 0.3 0.6 0.4 1.0 472.0 134.0 39.5 48.0 1.9 90.0 84.0 8.8 340.0
G-13
Avg 8.1 895.5 573.3 38.0 0.2 0.3 0.4 3.5 374.0 88.6 37.1 46.3 1.8 84.5 63.3 0.0 332.0
Min 7.8 710.0 455.0 16.2 0.1 0.1 0.3 0.0 320.0 67.3 34.9 39.0 1.1 75.0 45.0 0.0 302.0
Max 8.5 1160.0 742.0 69.5 0.2 0.7 0.5 8.5 440.0 113.8 38.9 52.0 2.5 105.0 106.0 0.0 376.0

76
4.5 Sediment quality in Shahpura Lake
Sediment Temperatures- The temperature plays a crucial role in physical-chemical and
biological behavior of aquatic system. The temperature of the sediment was recorded
maximum 36.40C in Site-2, and minimum 24.457
0C in Site-1. In seasonal case maximum
27.295oC sediment temperature recorded in summer and minimum 20.48
oC recorded in
winter (Fig 19).
Moisture content- In present study of shahpura lake moisture content of sediment recorded
maximum 81.956(%), in Site-10, and minimum 37.672(%) in Site-1. Moisture content
maximum 55.997% recorded in monsoon season and minimum 33.467% recorded in winter
season (Fig 20).
Specific gravity- In present study of shahpura lake specific gravity spatial recorded maximum
value 1.669 in Site-7 and minimum value 1.119 in Site-10. In seasonal case maximum value
1.423 recorded in summer season and minimum 1.336 in winter season (Fig 21)
Conductivity- Conductivity is considered to be a rapid and good measure of dissolved solids.
Conductivity is an important criterion in determining the suitability of water for irrigation. In
present study maximum 303.928mho/cm conductivity founded in Site-10, , and minimum 123
mho/cm in Site-2. Whereas in summer season maximum conductivity 333.916 recorded and
minimum 287.291mho/cm. in winter season (Fig 22).
TDS- TDS indicates the general nature of salinity of sediment. In shahpura lake sediment
TDS maximum 396.928mg/g recorded in Site-11 and minimum 211.84mg/g. in Site-1 . In
seasonal case maximum 269.62mg/g TDS recorded in monsoon season and minimum
185.893mg/g in winter season (Fig 23).
pH- pH are very most important parameters of water body and lake sediment. The present
study sediment of Shahpura Lake the pH shows variation of different sites. Its maximum
value 10.875 in Site-7. and minimum value 7.576 in Site-1 and in seasonal case maximum
pH recorded during monsoon 7.78 and minimum during winter 7.66 (Fig 24)
Alkalinity- Alkalinity is due to the presence of bicarbonates, carbonates or hydroxides. The
weathering of rocks is the potential source of alkalinity. In present study alkalinity of the
sediment recorded maximum value 174.4mg/g in Site-9 and minimum value 112.8 mg/g in
Site-12 In seasonal case maximum value 104.666mg/g recorded in winter season and
minimum 98.5mg/g in summer season (Fig 25).
Calcium hardness- The main source of calcium in natural water are various types of rocks,
industrial waters and sewage. In Shahpura lake chloride content in sediment recorded

77
maximum value 75.792mg/g in Site-11, and the minimum value 34.709mg/g in Site-1, In
seasonal case maximum value 61.161mg/g recorded in monsoon season and minimum
30.163mg/g in winter season (Fig 26).
Magnesium hardness- The source of Mg hardness in natural water are various types of rocks,
industrial wastes and sewage. In present study the Mg hardness of the sediment recorded
maximum value 1.357mg/g in Site-12, and the minimum value 0.229mg/g in Site-1. Whereas
in seasonal variation maximum value 0.554mg/g recorded in monsoon season and minimum
value 0.444mg/g in summer season (Fig 27).
Chloride- High chloride content in sediment samples may be due to the pollution from
chloride rich effluent of sewage and municipal waste. In Shahpura lake chloride content in
sediment recorded maximum value 75.792mg/g in Site-11, and the minimum value
34.709mg/g in Site-1, In seasonal case maximum value 61.161mg/g recorded in monsoon
season and minimum 30.163mg/g in winter season (Fig 28) .
Orthophosphate- Orthophosphate which are readily taken up by the phytoplankton (or lost to
the sediment) often deplete rapidly becoming the first limiting nutrient. In present study the
Orthophosphate of the sediment recorded maximum value 1.357mg/g in Site-12, and the
minimum value 0.229mg/g in Site-1. Whereas in seasonal variation maximum value
0.554mg/g recorded in monsoon season and minimum value 0.444mg/g in summer season
(Fig 29).
Organic matter- The organic matter is the very important to plants growth in sediment. In the
present study organic matter in maximum value 9.057%, recorded in Site-9 and the
minimum value 5.082(%). in Site-1, In seasonal case maximum value 5.816% recorded in
monsoon season and minimum 5.149% in winter season (Fig 30).

78
Fig 72: Graphical presentation of soil temperature at Shahpura lake.
Fig 73: Graphical presentation of moisture content at Shahpura lake.
Fig 74: Graphical presentation of specific gravity at Shahpura lake.
23.5
24
24.5
25
25.5
26
S-1 S-2 S-3 S-4 S-5 S-6 S-7 S-8 S-9 S-10 S-11 S-12
So
il T
emp
era
ture
(0C
)
Sampling sites
0
10
20
30
40
50
60
70
S-1 S-2 S-3 S-4 S-5 S-6 S-7 S-8 S-9 S-10 S-11 S-12
Mo
istu
re c
on
ten
t (%
)
Sampling sites
0
0.5
1
1.5
2
S-1 S-2 S-3 S-4 S-5 S-6 S-7 S-8 S-9 S-10 S-11 S-12
Sp
ecif
ic G
rav
ity
(g
m/c
m3
)
Sampling sites

79
Fig 75: Graphical presentation of conductivity at Shahpura lake.
Fig 76: Graphical presentation of total dissolved solids at Shahpura lake.
Fig 77: Graphical presentation of soil pH at Shahpura lake.
0
100
200
300
400
500
S-1 S-2 S-3 S-4 S-5 S-6 S-7 S-8 S-9 S-10 S-11 S-12
Co
nd
uct
ivit
y (µ
s/g)
Sampling sites
0
50
100
150
200
250
300
350
S-1 S-2 S-3 S-4 S-5 S-6 S-7 S-8 S-9 S-10 S-11 S-12
To
tal
Dis
solv
ed S
oli
ds
(pp
m/g
)
6.6
6.8
7
7.2
7.4
7.6
7.8
S-1 S-2 S-3 S-4 S-5 S-6 S-7 S-8 S-9 S-10 S-11 S-12
pH
Sampling sites

80
Fig 78: Graphical presentation of total alkalinity at Shahpura lake.
Fig 79: Graphical presentation of calcium hardness at Shahpura lake.
Fig 80: Graphical presentation of magnesium hardness at Shahpura lake.
0
20
40
60
80
100
120
140
S-1 S-2 S-3 S-4 S-5 S-6 S-7 S-8 S-9 S-10 S-11 S-12
To
tal
Alk
ali
nit
y (
mg
/g)
Sampling sites
0
0.5
1
1.5
2
2.5
S-1 S-2 S-3 S-4 S-5 S-6 S-7 S-8 S-9 S-10 S-11 S-12
Ca
lciu
m H
ard
nes
s (m
g./
g)
Sampling sites
0
0.1
0.2
0.3
0.4
0.5
0.6
0.7
0.8
0.9
S-1 S-2 S-3 S-4 S-5 S-6 S-7 S-8 S-9 S-10 S-11 S-12
Ma
gn
esiu
m H
ard
nes
s (m
g./
g)
Sampling sites

81
Fig 81: Graphical presentation of chloride at Shahpura lake.
Fig 82: Graphical presentation of ortho-phosphate at Shahpura lake.
Fig 83: Graphical presentation of organic matter at Shahpura lake.
0
10
20
30
40
50
60
70
80
S-1 S-2 S-3 S-4 S-5 S-6 S-7 S-8 S-9 S-10 S-11 S-12
Ch
lori
de
s (m
g/g)
Sampling sites
0
0.2
0.4
0.6
0.8
1
1.2
1.4
1.6
1.8
S-1 S-2 S-3 S-4 S-5 S-6 S-7 S-8 S-9 S-10 S-11 S-12
Ort
ho
Ph
osp
ha
te (
mg
/g)
Sampling sites
0
1
2
3
4
5
6
7
S-1 S-2 S-3 S-4 S-5 S-6 S-7 S-8 S-9 S-10 S-11 S-12
Org
anic
mat
ter
(%)
Sampling sites

82
Table 13: Sediment quality of Shahpura lake
S No Parameters S-1 S-2 S-3 S-4 S-5 S-6 S-7 S-8 S-9 S-10 S-11 S-12
1 Soil Temperature (0C)
24.26 25.71 25.34 24.69 24.89 24.97 25.12 25.39 25.38 24.98 25.23 24.78
2 Moisture content (%)
39.72 43.42 52.96 52.97 54.30 51.72 56.61 43.69 45.04 60.29 58.16 38.34
3 Specific Gravity
(gm/cm3) 1.61 1.40 1.30 1.21 1.17 1.21 1.49 1.36 1.36 1.09 1.08 1.53
4 Conductivity (µs/g)
361.18 267.10 337.17 353.17 427.74 375.03 422.71 354.11 410.84 470.87 399.97 294.26
5 Total Dissolved Solids
(ppm/g) 232.50 229.17 223.69 236.13 266.03 252.94 280.33 237.70 276.29 305.79 283.35 184.90
6 pH
7.51 7.44 7.53 7.61 7.43 7.50 7.65 7.45 7.46 7.35 7.05 7.25
7 Total Alkalinity (mg/g)
122.80 121.85 95.30 103.00 92.95 123.05 92.15 96.70 129.38 102.65 115.65 85.70
8 Calcium Hardness (mg./g)
2.38 2.00 2.27 2.20 2.14 1.88 2.00 1.89 2.10 2.19 2.31 2.47
9 Magnesium Hardness
(mg./g) 0.21 0.31 0.29 0.38 0.45 0.48 0.61 0.44 0.42 0.53 0.50 0.83
10 Chlorides (mg/g)
40.97 42.04 35.27 40.32 59.07 42.54 65.92 42.59 51.00 50.12 74.37 41.30
11 Ortho Phosphate (mg/g)
1.78 1.52 1.71 1.25 1.16 1.36 1.23 1.34 1.42 1.40 1.21 1.29
12 Organic matter (%)
4.16 3.19 6.14 6.20 5.65 5.04 5.92 4.59 5.34 6.43 4.93 5.07

83
B. Biological
A. Biological observation of Shahpura lake during Nov. 2011 to Oct. 2012.
a. Phytoplankton:
Total 150 phytoplankton species were reported belonging to 5 groups namely,
Chlorophyceae, Cyanophyceae, Bacillariophyceae, Euglenophyceae and Dinophyceae .Group
Chlorophyceae had the highest number of species (53 species) followed by Euglenophyceae
(34 species), Bacillariophyceae (32 species), Cyanophyceae (29 species), and 2 species of
Dinophyceae. The maximum number of 101 species were recorded in the month of January
where as minimum diversity of 13 species was recorded in the month of September. The
maximum diversity of 33 species of phytoplankton was recorded at site 1 in the month of
January and minimum diversity of 2 species of phytoplankton was recorded at site 2, site 7,
site 9 and site 10 in the month of September. The phytoplankton density of Shahpura lake
varied between 32 to 656 organisms/l. The maximum phytoplankton density 656 organisms/l
was recorded at site 1 in the month of May and minimum density 32 organisms/l was recorded
at site 10 in the month of September.
Group wise spatial and temporal variation of phytoplanktons:
Chlorophyceae:
A total 53 species of Chlorophyceae group were recorded during the study period.
Chlorophyceae group showed maximum phytoplankton diversity in the month of January with
44 species and minimum in month of September with 8 species. In spatial case this group
shows maximum diversity of 30 species at site 1 and minimum 17 species were recorded at
site 6, site 7 and site 11 during the entire study period. Maximum density of Chlorophyceae
group was found to be 170 organisms/l at site 8 in March and minimum density 2 organisms/l
was recorded at site 1 and site 4 in the month of July.
Cyanophyceae:
A total 29 species of Cynophyceae group were recorded during the study period.
Cyanophyceae group showed maximum phytoplankton diversity in month of May with 16
species at site 3 and minimum 8 species at Site 6 during the study period. The maximum
density of Cyanophyceae group was found 406 organisms/l at Site 1 in the month of June and
minimum was 24 organisms/l was recorded at Site-12 in the month of April.
Euglenophyceae:
A total 34 species of Euglenophyceae group were recorded during the study period. The
diversity of Euglenophyceae group varied between 8 to 18 species. Maximum 18 species was

84
recorded at site 1 and minimum 8 species were recorded at site 5. The maximum density of
Euglenophyceae group was found 362 organisms/l at site 1 in the month of January and
minimum density 8 organisms/l at site 12 in the month of April.
Bacillariophyceae:
A total 32 species of Bacillariophyce group were recorded during the study period.
Bacillariophyceae group shows maximum phytoplankton diversity 13 species at site 8 and
minimum with 4 species at site 10. The maximum density of Bacillariophyceae group was
found 64 organisms/l at site 12 in the month of September and minimum density 16
organisms/l was recorded at site 2, site 3 and site 6 in the month of March.
Dinophyceae:
Dinophyceae group were recorded in January, February and March with only 2 species.
Density of Dinophyceae group showed 80 organisms/l at site 1, site and 10 in the month of
January.
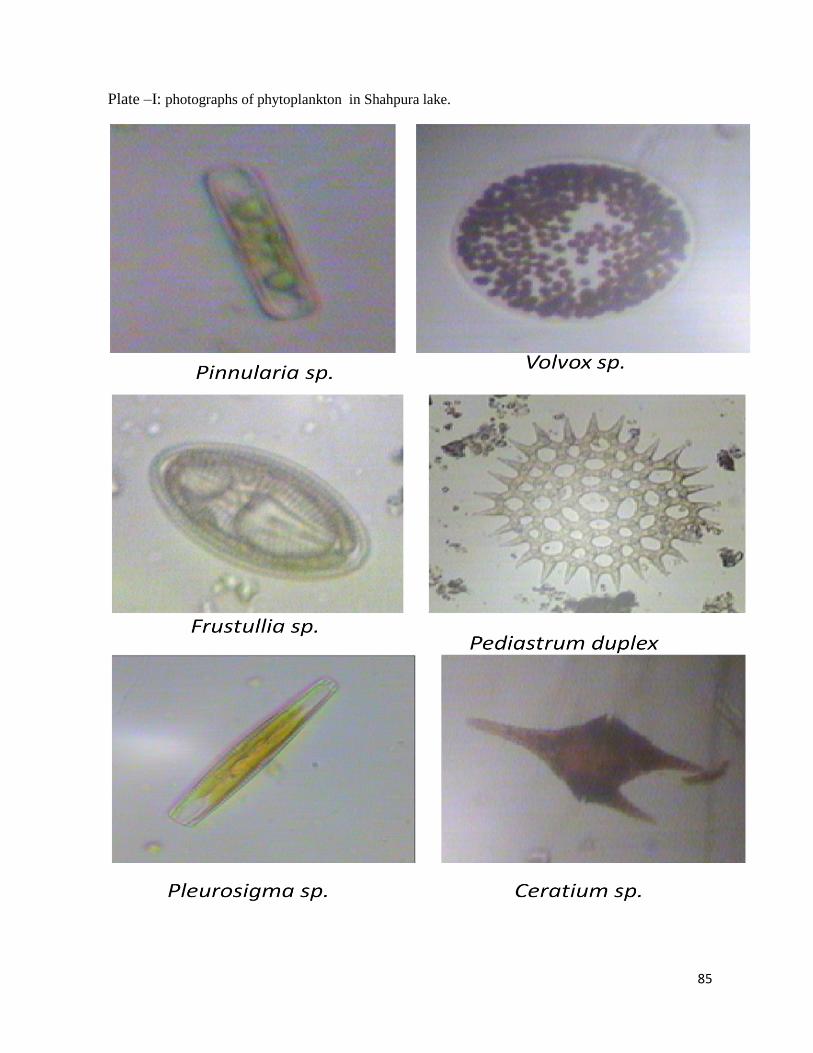
85
Plate –I: photographs of phytoplankton in Shahpura lake.

86
Chlorophyceae
35%
Euglenophyceae
23%
Bacillariophyceae 22%
Cyanophyceae 19%
Dinophyceae 1%
Fig 84: Percentage composition of phytoplanktons in Shahapura lake
Fig 85: Diversity of Phytoplankton during November 2011
Fig 86: Density of Phytoplankton during November 2011

87
Fig 87: Diversity of Phytoplankton during December 2011
Fig 88: Density of Phytoplankton during December 2011
Fig 89: Diversity of Phytoplankton during January 2012

88
Fig 90: Density of Phytoplankton during January 2012
Fig 91: Diversity of Phytoplankton during February 2012
Fig 92: Density of Phytoplankton during February 2012

89
0
5
10
15
20
25
30
S1 S2 S3 S4 S5 S6 S7 S8 S9 S10 S11 S12
Nu
mb
er
of
Spe
cie
s
Sampling Sites
Chlorophyceae Baccilariophyceae Cyanophyceae
Dinophyceae Euglenophyceae
Fig 93: Diversity of Phytoplankton during March 2012
Fig 94: Density of Phytoplankton during March 2012
Fig 95: Diversity of Phytoplankton during April 2012

90
0
50
100
150
200
S1 S2 S3 S4 S5 S6 S7 S8 S9 S10 S11 S12
Den
sity
org
/L
Sampling Sites
Chlorophyceae Baccilariophyceae Cyanophyceae
Dinophyceae Euglenophyceae
0
5
10
15
20
25
30
S1 S2 S3 S4 S5 S6 S7 S8 S9 S10 S11 S12
Nu
mb
er
of
Spe
cie
s
Sampling Sites
Chlorophyceae Baccilariophyceae Cyanophyceae
Euglenophyceae Dinophyceae
0
200
400
600
800
S1 S2 S3 S4 S5 S6 S7 S8 S9 S10 S11 S12
De
nsi
ty o
rg/L
Sampling Sites
Chlorophyceae Baccilariophyceae Cyanophyceae
Euglenophyceae Dinophyceae
Fig 96: Density of Phytoplankton during April 2012
Fig 97: Diversity of Phytoplankton during May2012
Fig 98: Density of Phytoplankton during May 2012

91
0
5
10
15
20
25
30
35
s1 s2 s3 s4 s5 s6 s7 s8 s9 s10 s11 s12
Chlorophyceae Baccilariophyceae Cyanophyceae
Euglenophyceae Dinophyceae
0
100
200
300
400
500
1 2 3 4 5 6 7 8 9 10 11 12
Chlorophyceae Baccilariophyceae Euglenophyceae
Dinophyceae Cyanophyceae
0
10
20
30
40
50
S1 S2 S3 S4 S5 S6 S7 S8 S9 S10 S11 S12
Chlorophyceae Baccilariophyceae Cyanophyceae
Euglenophyceae Dinophyceae
Fig 99: Diversity of Phytoplankton during June2012
Fig 100: Density of Phytoplankton in the month of June 2012
Fig 101: Diversity of Phytoplankton in July 2012.

92
0
50
100
150
200
250
S1 S2 S3 S4 S5 S6 S7 S8 S9 S10 S11 S12
Chlorophyceae Baccilariophyceae Euglenophyceae
Dinophyceae Cyanophyceae
Fig 102: Density of Phytoplankton in July 2012.
Fig 103: Diversity of phytoplankton in September 2012
Fig 104: Density of phytoplankton in September 2012
0
2
4
6
8
10
S-1 S-2 S-3 S-4 S-5 S-6 S-7 S-8 S-9 S-10 S-11 S-12
No
of
spe
cie
s
Sampling sites
Chlorophyceae Cyanophyceae Bacilariophyceae Euglenophyceae
0
5
10
15
20
25
30
S-1 S-2 S-3 S-4 S-5 S-6 S-7 S-8 S-9 S-10 S-11 S-12
De
nsi
ty (
Org
/l)
Sampling sites
Chlorophyceae Cyanophyceae Bacilariophyceae Euglenophyceae

93
Fig 105: Diversity of phytoplankton in October 2012
Fig 106: Density of phytoplankton in October 2012
0
2
4
6
8
10
12
S-1 S-2 S-3 S-4 S-5 S-6 S-7 S-8 S-9 S-10 S-11 S-12
No
of
Spe
cie
s
Sampling sites
Chlorophyceae Cyanophyceae Bacilariophyceae Euglenophyceae
0
5
10
15
20
25
30
35
S-1 S-2 S-3 S-4 S-5 S-6 S-7 S-8 S-9 S-10 S-11 S-12
De
nsi
ty (
Org
/l)
Sampling sites
Chlorophyceae Cyanophyceae Bacilariophyceae Euglenophyceae

94
Table 14: List of phytoplankton diversity in Shahpura lake from November 2011 to Oct. 2012.
SPECEIS S-1 S-2 S-3 S-4 S-5 S-6 S-7 S-8 S-9 S-10 S-11 S-12
GROUPS : CHLOROPHYCEAE
1 Actinastrum hatztchii + + + + + + + + + + + +
2 A. convatus + + + + - - - - - + - -
3 Ankistrodesmus falcatus + + + - + + + + - + + +
4 A.spiralis + + + + + + + + + + + -
5 Cheatophora + - - - + - - - - - - +
6 Cladophora + + + - - + + + - - + +
7 Closteriopsis sp, + + + + + + + + + + + +
8 C.longissilene + - - - - - - - - - - -
9 Closterium acerosum - - - - - - - - - - - +
10 C. microsporum - - - + - - - - - - - -
11 C. psephonema - - - + - - - - - - - -
12 C. purvulum + + + + + + + + + + + +
13 Closteridium siamensis + - - + - - - - + - - -
14 C.acutum - - - - - - - - + - - +
15 Coelestrum - + - - - - + - - - - -
16 Crusigenia - - - + - - - + + - - -
17 Echinospaerella limnetica + - - - + - + - + + + -
18 Elakothorix sp. - - - - + - - - + - - +
19 Euddorina sp. + - - - - - - - - - - -
20 Gonium sp. + - - - - - - - - - - -
21 Microspora sp. - + + + - + - - + - - +
22 Microsporum sp. + - - - - - - + - - + -
23 Mictactinium sp. + - - - - - - - - - - -
24 Nitrium sp. - - - - - - - - - + - +
25 Pediastrum sp. + + + - + + + + + + + +
26 P. biradiatum - + + - + - + + + - + +
27 P. duplex + + + + + + + - + + + +
28 P. ovatum - + - - + - - - + - - -
29 P. tetras - - - - - - + - - - + -
30 P. simplex + + + + - - - - - + + +
31 salenastrum bibraiano - - - - - - - + - - - -
32 S. minutes - - - - - - - + - - - +
33 Scendesmus acuminatus + - - + - + - + - - - +
34 S. armatus + + + + + + + + + + + +
35 S. bijugatus + + + + + + + + + + + +
36 S. carinatus + + - - + + - - - + - -

95
SPECEIS S-1 S-2 S-3 S-4 S-5 S-6 S-7 S-8 S-9 S-10 S-11 S-12
37 S. dimorphus + + + + + + + + + + + +
38 S. hermardi - - - + - - - + - - - -
39 S. longsvar - - - - + - - - - - - -
40 S. oblique + + + + + - - - + + - +
41 S. protuberans + - - + + + - - - - - -
42 S. quadricanda + - - + - - - + - - - +
43 Schroederia setigera + - - - - - - - - - - -
44 Spyrogyra sp. + - + - - + - - - - - -
45 Tetradron trigonum + + + + + + + + + + + +
46 T.prolieforme - - - + - - - - - - - -
47 T.quadratum - + + + - - - + - - - -
48 Tetrastrum sp. - - - + - - - - - - - -
49 Triptoceros sp. - + - - - - - - - - - -
50 Ulothrix sp. + - - - - - + + - - - +
51 uronema sp. - - + + - - - - - - - +
52 volvox sp. - - + - - - - - - - - +
53 Zygnema sp. - - - - - - - - - + - +
GROUP: CYNOPHYCEAE
54 Anabaena circinalis + + + + + + + + + + + +
55 A. utermohlii + + + + - + - + + + + -
56 Anamoesis sp. - - + - - - - - - - - -
57 A.navicoloid - - - + - - - - - - - -
58 Anabaenopsis arnoldii + + + + + + + - + - - +
59 A. syhaerophora - - - - - - - - - - + -
60 Arthrospira platensis + + + + + + + + + + + +
61 A. massartii + + + + + + + + - - - -
62 chroococus turgidis + - - - - - - - - - - +
63 Lygbea borgeri + + + + - - + + - - + +
64 L. limnatica - - + - + - + - + + - -
65 Microsystis sp. - - - - - - - - - - - -
66 Oscillatoria sp. + - + - - - - + + - + +
67 O. Amphibia + - - - + - - - - + - -
68 O. animalis - + - + - + + - - + + -
69 O. amphigranulata - - - - - - - - - - + -
70 O. chalybea + - - - - - - + - - - -
71 O. prolific - - - - + - - - - - - +
72 Osystis sp. - - - - - - - - - - + -
73 Ouroococus bicaudata + + + + + + - + + + + -
74 Phormidium teneu - - + - - - + - + - - +
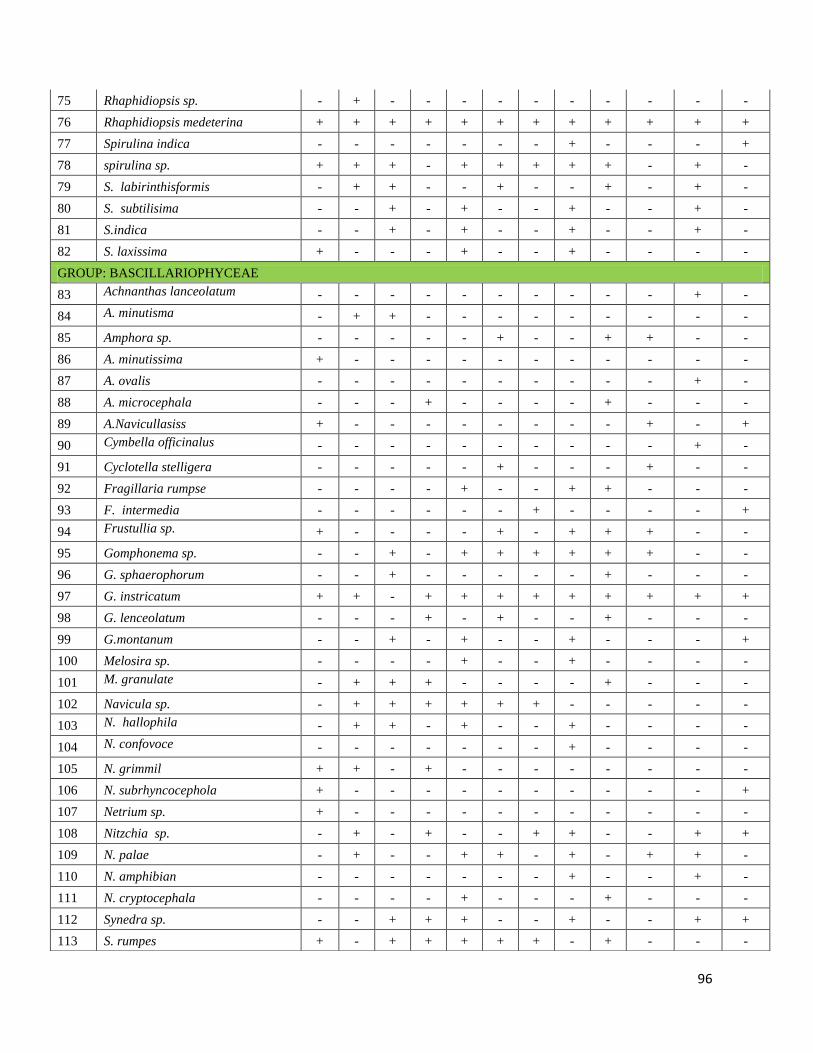
96
75 Rhaphidiopsis sp. - + - - - - - - - - - -
76 Rhaphidiopsis medeterina + + + + + + + + + + + +
77 Spirulina indica - - - - - - - + - - - +
78 spirulina sp. + + + - + + + + + - + -
79 S. labirinthisformis - + + - - + - - + - + -
80 S. subtilisima - - + - + - - + - - + -
81 S.indica - - + - + - - + - - + -
82 S. laxissima + - - - + - - + - - - -
GROUP: BASCILLARIOPHYCEAE
83 Achnanthas lanceolatum - - - - - - - - - - + -
84 A. minutisma - + + - - - - - - - - -
85 Amphora sp. - - - - - + - - + + - -
86 A. minutissima + - - - - - - - - - - -
87 A. ovalis - - - - - - - - - - + -
88 A. microcephala - - - + - - - - + - - -
89 A.Navicullasiss + - - - - - - - - + - +
90 Cymbella officinalus - - - - - - - - - - + -
91 Cyclotella stelligera - - - - - + - - - + - -
92 Fragillaria rumpse - - - - + - - + + - - -
93 F. intermedia - - - - - - + - - - - +
94 Frustullia sp. + - - - - + - + + + - -
95 Gomphonema sp. - - + - + + + + + + - -
96 G. sphaerophorum - - + - - - - - + - - -
97 G. instricatum + + - + + + + + + + + +
98 G. lenceolatum - - - + - + - - + - - -
99 G.montanum - - + - + - - + - - - +
100 Melosira sp. - - - - + - - + - - - -
101 M. granulate - + + + - - - - + - - -
102 Navicula sp. - + + + + + + - - - - -
103 N. hallophila - + + - + - - + - - - -
104 N. confovoce - - - - - - - + - - - -
105 N. grimmil + + - + - - - - - - - -
106 N. subrhyncocephola + - - - - - - - - - - +
107 Netrium sp. + - - - - - - - - - - -
108 Nitzchia sp. - + - + - - + + - - + +
109 N. palae - + - - + + - + - + + -
110 N. amphibian - - - - - - - + - - + -
111 N. cryptocephala - - - - + - - - + - - -
112 Synedra sp. - - + + + - - + - - + +
113 S. rumpes + - + + + + + - + - - -

97
SPECEIS S-1 S-2 S-3 S-4 S-5 S-6 S-7 S-8 S-9 S-10 S-11 S-12
GROUP:DINOPHYCEAE
115 Ceratium sp. + - - - - + + - - + + -
116 Dinobryon sp. + - - - - - - - - - - +
GROUP:EUGLENOPHYCEAE
117 Clamydomonas sp. - - + - - - - - - - - -
118 Euglena sp. + - + - + + + + - + + -
119 E. acus + + + + + + + + + + - +
120 E. allorgei defl + + + + + + + + + + + +
121 E. candata - - - - - - - - - + - -
122 E. elastic + - - - - - - - - - - +
123 E. gracillis klebs + + + + + + + + + + + +
124 E. ignobilis + - - - - - - - - - - +
125 E. limnophila + + + - - - + + + - + -
126 E. proxima danegeraede + - - - - - + - - - - -
127 E. salina - + - + - - - - - - - -
128 E. srinagari + - - - - - - - - + - +
129 E. vogans + + + + + + + + + + + +
130 Eugleno morpha + + + + + + + + + + + +
131 E.pisciformis - - + - - - - - - - - -
132 Lepocinalis sp. - - - - - - + - - - + -
133 L. fourmis - - - - - - - + - - - -
134 L. marssonii - - - + - - - - - - - -
135 L. salina - - + - - + - + - - - -
136 Phacus sp. + + + + + + + + + + + +
137 P. acuminatus + + + + + + + + + + + +
138 P. agilis - - - - - - - - - - - -
139 P. brachykentron - - - + - - + - - - - -
140 P. corviconda - + - - - - - - - - - -
141 P. candata - + + - - - - - - - - -
142 P. inflatus - - - - - - - + - - - -
143 P. platala + - - - - - - - - - - -
144 P. tortus + - + - - - - - - + - -
145 P. wettsteni + - - - - - - - - + - -
146 Schorderia planktonika + - - - - - - - - - - -
147 S. indica - - - + - - - - - - - -
148 Strombomonas gerardiana - - - - - + - - - - - -
149 S. ovalis + - - - - - - - + + - -
150 Trecheloman bulla - + - - - - - - - - - -

98
b. Zooplankton:
In Shahpura lake total 62 zooplankton species were recorded belonging to 6 groups (Protozoa,
Rotifera, Cladocera, Copepoda, Osracoda, and Cyclopida). Group Rotifera was the highest
number of species (43 species) followed by Protozoa (6 species), Cladocera (5 species),
Copepoda and Cyclopoida (3 species) and 1 species of Ostracoda. The zooplankton diversity
of Shahpural lake was varied between 14 species at site 10 to 27 species at site 8 during the
study period. The maximum number of species were recorded in January month which was
36 species where as minimum zooplankton diversity of 9 species were recorded in September.
The total zooplankton density of Shahpura lake varied between 6 to 234 organisms/l. The
highest density of zooplankton were recorded in the month of May 234 organisms/l at site-8
and lowest density of zooplankton was recorded 6 organisms/l at site-10 in the month of
January and September.
Group wise spatial and temporal variation of zooplanktons:
Rotifera:
A total 43 species of Rotifera group were recorded during the study period. Rotifera group
maximum zooplankton diversity showed in January with 34 species and minimum in
September with 7 species. The maximum diversity 10 was recorded at site 1 in the month of
January and minimum 1 species was recorded at site 12 in the month of September. Density of
Rotifera group was varied between minimum 8 organisms/l at site 1 in the month of January
to maximum 48 organisms/l at site 12 in the month of September.
Cladocera:
A total 5 species of Cladocera group were recorded during the study period. Cladocera group
showed maximum zooplankton diversity recorded in January with 5 species and 1 species was
recorded in February and October. Group Cladocera was not found in the month of March,
April, May June, July and September. In spatial case this group showed maximum diversity of
3 species at site 2 and minimum 1 species at site 6, site 7 and site11. Density of Cladocera
group was found 6 organisms/l at site 2 in February and site 6 shows lowest density 2
organisms/l in January during present study.
Protozoa:
A total 6 species of Protozoa group were recorded during the study period. Protozoa group
recorded maximum zooplankton diversity in January with 5 species and minimum was 1
species in the month of February, April and September. This group showed maximum
diversity of 2 species at site 8, site 11 and site 12 and minimum 1 species at site 1, site 5 and
site 7. The density of Protozoa group was varied between 2 to 10 organisms/l. The maximum
density of Protozoa 10 organisms/l was recorded at site 11 in the month of January.

99
Copepoda:
A total 3 species of Copepoda group were recorded during the study period. Copepod group
shows maximum zooplankton diversity with 3 species recorded at site 5 and minimum
diversity of 1 species was recorded at site 1, site 2, site 8 and site 11. This group was absent
during the entire study period at site 3, site 4 site 6, site 7, site 10 and site 12. This group
highest density showed 32 organisms/l at site 12 in the month of January and 6 organisms/l at
site 10 in the month of January and October.
Cyclopoida:
A total 3 species of Ccyclopoda group were recorded during the study period. The maximum
diversity of Cyclopoida group recorded 3 species ant site 8 and minimum 1 species recorded
at site 2, site 3, site 4, site 7, site 11 and site 12 during the study period. The highest density
of Cyclopoida group was found 58 organisms/l recorded at site 1 in February and lowest
density 8 organisms/l at site 2 were recorded during present study.
Ostracoda:
In Ostracoda group only one Cypris sp. was recorded at site 12 in December 2011 and January
2012 months. This group was not found after January month during the study period.

100
Plate-II : photographs of zooplankton in Shahpura lake

101
Protozoa 69%
Rotifera 10%
Cladocera 10%
Copepoda 5%
Osracoda 5%
Cyclopida 1%
0
2
4
6
8
10
12
S1 S2 S3 S4 S5 S6 S7 S8 S9 S10 S11 S12
Nu
mb
er
of
Spe
cie
s
Sampling Sites
Protozoa Rotifera Cladocera Cyclopoida Copepoda Ostracoda
Fig 107: Percentage composition of zooplanktons in Shahpura lake
Fig 108: Diversity of Zooplankton during November 2011
Fig 109: Density of Zooplankton during November 2011

102
0
2
4
6
8
10
12
14
16
S1 S2 S3 S4 S5 S6 S7 S8 S9 S10 S11 S12
Nu
mb
er
of
Spe
cie
s
Sampling Sites
Protozoa Rotifera Cladocera Cyclopoida Copepoda Ostracoda
Fig 110: Diversity of Zooplankton during December 2011
Fig 111: Density of Zooplankton during December 2011
Fig 112: Diversity of Zooplankton during January 2012

103
Fig 113: Density of Zooplankton during January 2012
Fig 114: Diversity of Zooplankton during February 2012
Fig 115: Density of Zooplankton during February 2012
0
2
4
6
8
10
12
14
S-1 S-2 S-3 S-4 S-5 S-6 S-7 S-8 S-9 S-10 S-11 S-12
Nu
mb
er o
f S
pec
ies
Sampling Sites
Rotifera Copepoda Cladocera Ostracoda Protozoa
0
20
40
60
80
100
120
140
160
S-1 S-2 S-3 S-4 S-5 S-6 S-7 S-8 S-9 S-10 S-11 S-12
Den
sity
(o
rg/L
)
Sampling Sites
Rotifera Copepoda Cladocera Ostracoda Protozoa

104
0
20
40
60
80
100
120
S1 S2 S3 S4 S5 S6 S7 S8 S9 S10 S11 S12
Den
sity
(o
rg/L
)
Sampling Sites
Rotifera Copepoda Protozoa
0
5
10
15
20
25
S1 S2 S3 S4 S5 S6 S7 S8 S9 S10 S11 S12
Nu
mb
er
of
Spe
cie
s
Sampling Sites
Rotifera Copepoda Protozoa
Fig 116: Diversity of Zooplankton during March 2012
Fig 117: Density of Zooplankton during March 2012
Fig 118: Diversity of Zooplankton during April 2012
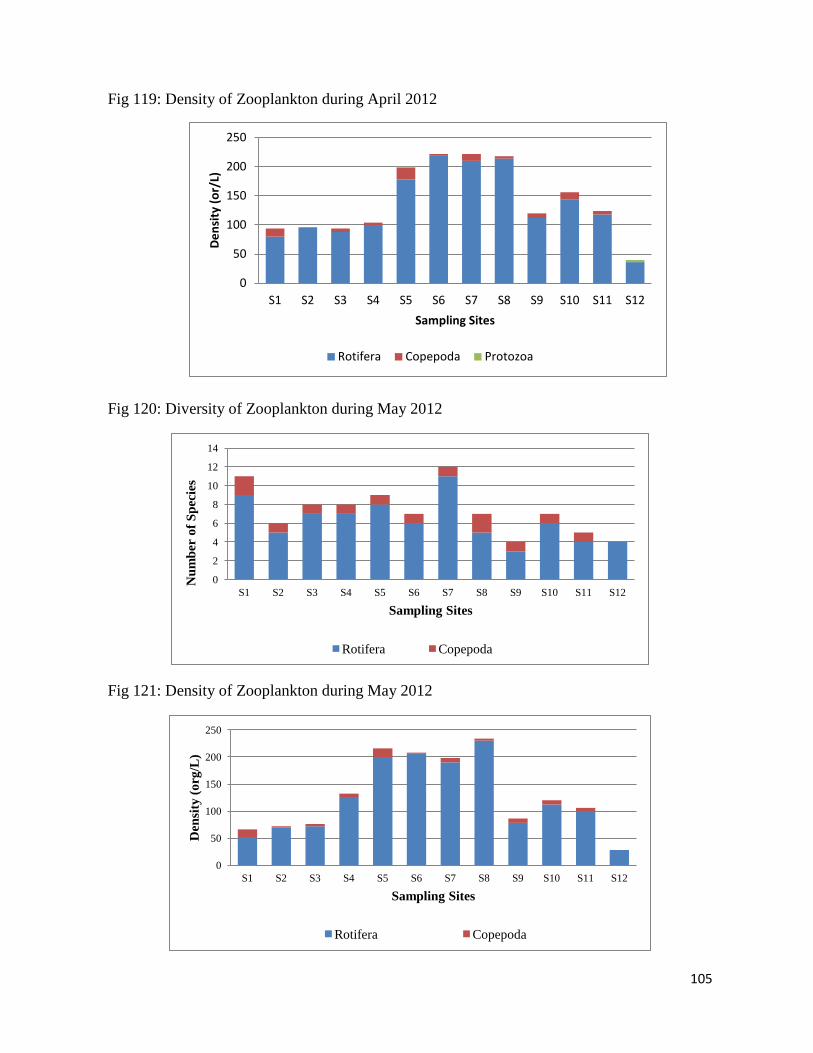
105
0
50
100
150
200
250
S1 S2 S3 S4 S5 S6 S7 S8 S9 S10 S11 S12
De
nsi
ty (
or/
L)
Sampling Sites
Rotifera Copepoda Protozoa
Fig 119: Density of Zooplankton during April 2012
Fig 120: Diversity of Zooplankton during May 2012
Fig 121: Density of Zooplankton during May 2012
0
2
4
6
8
10
12
14
S1 S2 S3 S4 S5 S6 S7 S8 S9 S10 S11 S12
Nu
mb
er o
f S
pec
ies
Sampling Sites
Rotifera Copepoda
0
50
100
150
200
250
S1 S2 S3 S4 S5 S6 S7 S8 S9 S10 S11 S12
Den
sity
(o
rg/L
)
Sampling Sites
Rotifera Copepoda
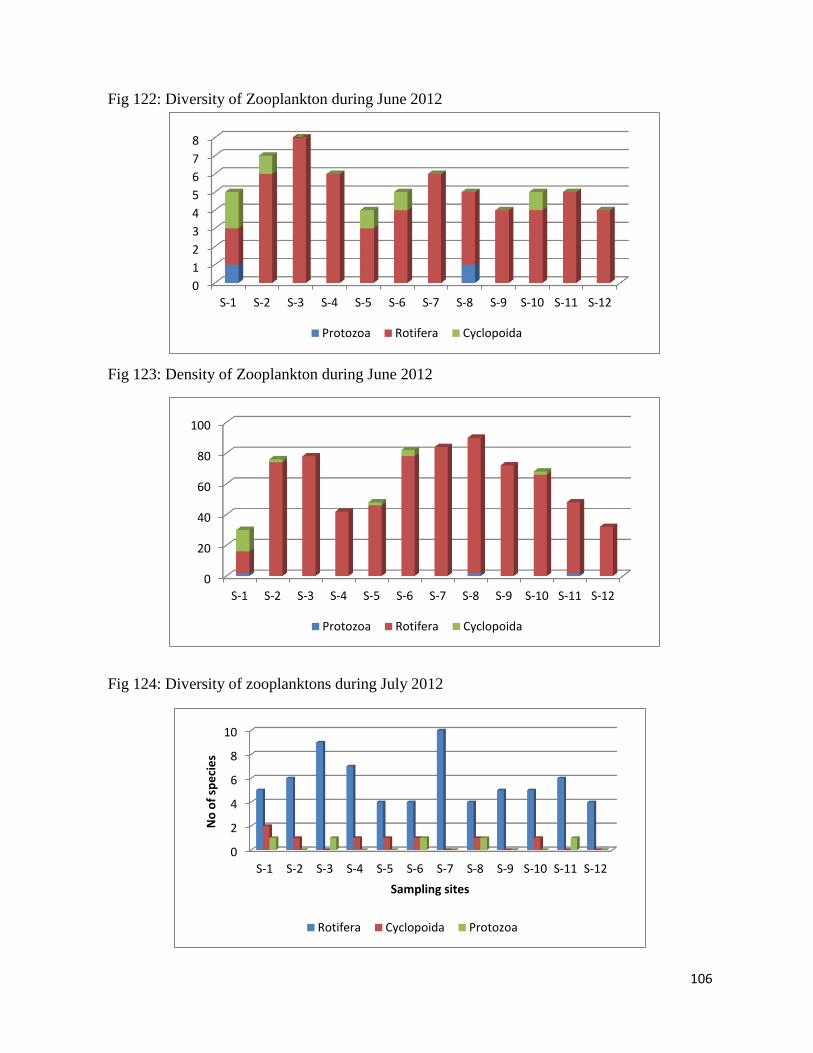
106
0
20
40
60
80
100
S-1 S-2 S-3 S-4 S-5 S-6 S-7 S-8 S-9 S-10 S-11 S-12
Protozoa Rotifera Cyclopoida
0
1
2
3
4
5
6
7
8
S-1 S-2 S-3 S-4 S-5 S-6 S-7 S-8 S-9 S-10 S-11 S-12
Protozoa Rotifera Cyclopoida
Fig 122: Diversity of Zooplankton during June 2012
Fig 123: Density of Zooplankton during June 2012
Fig 124: Diversity of zooplanktons during July 2012
0
2
4
6
8
10
S-1 S-2 S-3 S-4 S-5 S-6 S-7 S-8 S-9 S-10 S-11 S-12
No
of
spe
cie
s
Sampling sites
Rotifera Cyclopoida Protozoa

107
Fig 125: Density of zooplankton during July 2012
Fig 126: Diversity of zooplankton during September 2012
Fig 127: Density of zooplanktons during September 2012
0
20
40
60
80
100
120
S-1 S-2 S-3 S-4 S-5 S-6 S-7 S-8 S-9 S-10 S-11 S-12
De
nsi
ty (
Org
/l)
Sampling sites
Rotifera Cyclopoida Protozoa
0
1
2
3
4
S-1 S-2 S-3 S-4 S-5 S-6 S-7 S-8 S-9 S-10 S-11 S-12
No
of
spe
cie
s
Sampling sites
Rotifera Cyclopoida Protozoa
0
2
4
6
8
10
12
S-1 S-2 S-3 S-4 S-5 S-6 S-7 S-8 S-9 S-10 S-11 S-12
De
nsi
ty (
Org
/l)
Sampling sites
Rotifera Cyclopoida Protozoa

108
Fig 128: Diversity of zooplanktons during October 2012
Fig 129: Density of zooplankton during October 2012
0
1
2
3
4
5
6
S-1 S-2 S-3 S-4 S-5 S-6 S-7 S-8 S-9 S-10 S-11 S-12
No
of
spe
cie
s
Sampling sites
Rotifera Cyclopoida Protozoa
0
5
10
15
20
25
30
S-1 S-2 S-3 S-4 S-5 S-6 S-7 S-8 S-9 S-10 S-11 S-12
De
nsi
ty (
Org
/l)
Sampling sites
Rotifera Cyclopoida Protozoa

109
Table 15: Group wise species composition of Zooplankton community in Shahpura lake
S No Species S-1 S-2 S-3 S-4 S-5 S-6 S-7 S-8 S-9 S-10 S-11 S-12
Group Rotifera
1 Anurae opsisfissa - - - - - - - + - - - -
2 Ascomorphella volvocicola + + + + + + + + + + + +
3 Asplanchna brightwellii - - - - - - - + - - - -
4 A. multiceps - - + - + + + - + - - -
5 Brachionus calyciflorus + + + + + + + + + + + +
6 B. angularis + - + + - + - - - - - +
7 B .bidentatusdentatus + + - + - - + - + - - +
8 B. budapestinensis + + + - - + + + + - - +
9 B.calycifloruspallas + + + + + + + + + + + +
10 B.calycifloruswithout spines - - - - - + - - - - - -
11 B.caudatus + + + + + + + + + + + +
12 B.diversicornis + + + + + + + + + + + +
13 B.durgaedhanapathi - + - - + - - + - - + -
14 B.falcatus - - + + - - - - - - - -
15 B.quadridentatus + - - + + - - - - + - +
16 B.rubens + - + + - - - - + - - -
17 Beauchampiella eudactylota - - - - - + - - - - - -
18 Epiphanes brachionus + - - - - - - - - - - -
19 Euchla nidiltata - - + - - - - - - - - -
20 Filinia opoliensis - - - - - - - - - - + -
21 F.pejleri + - - + - + - + - - - +
22 Horaella brehmi - - - - + - - + + + - -
23 Keratella cochlearis - - + - - - - - - - - -
24 Keratella tropica + + + + + - - + + + + -
25 Lecanebula sp. - - - - - - + - - - - -
26 L. horenmanni - - - - - - - + - - - -
27 L. luna - - - - - - - + - - - -
28 L. lunaris - - - - - - - - - + + -
29 L.quadridentata - - - - - - - - - - + -
30 Monomatta sp. + - - - + - + + - - - -
31 Mytilina biscucata - - - - - + - - - - - -
32 M. ventralis + - - + - - + - - - - -
33 Notomatta sp. - - - + - - - + - - - -
34 Plationus patulus + + - - - - - - - - - -
35 Polyarthra sp. - - - - - - - + - - - -
36 Pompholy xsulcata + + + + + + + + + - - -
37 Proales sp. - - - - + - - - - - - -
38 Synchae torstylats - - - - - - + - + - - -

110
S No Species S-1 S-2 S-3 S-4 S-5 S-6 S-7 S-8 S-9 S-10 S-11 S-12
39 Taphrocampa sp. + - - - - - - - - - - -
40 Testudinella sp. - - - - - - - + + - - -
41 Testudinella patina - - + + + + - + + - + +
42 Trichocerca rattus + - - + + + + + - + + -
43 Tripleuchla nisplicata - + - - - - - - - - - -
Group Copepoda
44 Calanoid copepod - - - - + - - - - - - -
458 Cyclopoid copepod - + - - + - - + + - + -
46 Diaptomus + - - - + - - - + - - -
Group Cyclopoida
47 Cyclops sp. + + + + + + + + + + + +
48 Nauplius larvae + - - - + + - + + + - -
49 Nauplius stages - - - - - - - + - - - -
Group Cladocera
50 Alonella excisa - - - - - - - - - + - -
51 Ceriodaphnia dubia - + - - - - - - - - - -
52 Daphnia longiremis - + - - - - + - - - - -
53 Moinamicrura - - - - - - - - - - + -
54 Scapholebris mucronata - + - - - + - - - - - -
Group Ostracoda
55 Cypris sp. - - - - - - - - - - - +
Group Protozoa
56 Centropyxcis sp. - - - - - - - + + - - -
57 Childonella sp. - - - - - - - - - - - +
58 Difflugia sp. - - - - - - - + - - + -
59 Euglypha sp. + - - - - - + - - - + -
60 Paramecium sp. - - - - + - - - - - - -
61 Vorticella sp. - - - - - - - - - - - +

111
c. Benthos:
A total 43 species were recorded from Shahpura lake during the entire study period belonging
to three phylums namely Arthropoda, Mollusca and Annelida. Arthropoda was most dominant
phylum with 25 species followed by Mollusca with 13 species and Annelida with 5 species.
The dominance species of Arthropoda namely Chironomus, Ablabesmyia, Hydropsyche,
Limnephilus, Proclalius, Amphiagrion, Culicidae pupa, Hesperocorixa, Notonecta. Five
species of Annelida namely Branchiura, Lumbricullus, Glossiphornia complanata,
Glossiphornia leteroculata, Helobdella stagnalis and the most dominant benthic species of
Mollusca (group Gastropoda) namely Bellamya bengalensis, B. crassa, B. crassispiralis, B.
dissimilis, Indoplanorbis exustus, Physa sp, Thira tuberculata. The phylum Arthropoda
contribution of benthic diversity an over all of 58%, followed by Annelida 12% and
Mollusca. A total benthic density varied between 178 to 4800 ind. / m2 in Shahpura Lake. The
maximum density of benthos 4800 ind./m2
at site 12 in the month of January and minimum
density of 178 ind./m2 was recorded at site 1 and site 9 in the month of July and September.
Phylum Arthropoda:
A total benthos diversity of 25 species of phylum Arthropoda were recorded in Shahpura lake
during the study period. Phylum Arthropoda showed maximum benthos diversity of 19
species at site 12 and minimum diversity 3 species at site 1, site 2, site 4, site 10 and site 11
during the study period. The density of Arthropoda were recorded between 44 to 3111
ind./m2 during the study period. The maximum benthos density of 3111 ind./m
2 was recorded
at site 12 in the month of January and minimum density 44 ind./m2 recorded at site 3 site 4,
site 6, site 7 and site 11 in the months of November, April, June, July and September.
Phylum Mollusca:
A total benthos diversity of 13 species of phylum Mollusca were recorded in Shahpura lake
during the study period. Phylum Mollusca showed maximum benthos diversity of 10 species
at site 9 and minimum diversity 2 species at site 11 during the study period. The density of
Mollusca were recorded between 44 to 2711 ind./m2 during the study period. The maximum
benthos density of 2711 ind./m2 was recorded at site 12 in the month of January and minimum
density 44 ind./m2 recorded at site 4, site 5, site 9, site 10 and site 11 in the months of
November, February and May.
Phylum Annelida:
A total benthos diversity of 5 species of phylum Annelida were recorded in Shahpura lake
during the study period. Phylum Annelida showed maximum benthos diversity of 4 species at
site 12 and minimum diversity 1 species at site 8 during the study period. The density of
Annelida were recorded between 44 to 2267 ind./m2 during the study period. The maximum

112
benthos density of 2267 ind./m2 was recorded at site 9 in the month of January and minimum
density 44 ind./m2 recorded at site 9 month of November.

113
Arthropoda 58%
Mollusca 30%
Annelida 12%
Fig 130: Percentage composition of benthos in Shahpura lake
Fig 131: Diversity of Benthos during November 2011
Fig 132: Density of Benthos during November 2011
0
2
4
6
8
S1 S2 S3 S4 S5 S6 S7 S8 S9 S10 S11 S12
Nu
mb
er
of
Spe
cie
s
Sampling Sites
Insecta Oligochaeta Hirudinea Platyhelminthys Gastropoda

114
0
2
4
6
8
10
S1 S2 S3 S4 S5 S6 S7 S8 S9 S10 S11 S12
Nu
mb
er
of
Spe
cie
s
Sampling Sites
Insecta Crustacea Oligochaeta Hirudinia Gastropoda Bivalvia
Fig 133: Diversity of Benthos during December 2011
Fig 134: Density of Benthos during December 2011
Fig 135: Diversity of Benthos during January 2012
0
2
4
6
8
10
12
S-1 S-2 S-3 S-4 S-5 S-6 S-7 S-8 S-9 S-10 S-11 S-12
Nu
mb
er o
f S
pec
ies
Sampling Sites
Insecta Oligochaeta Hirudenia Gastropoda
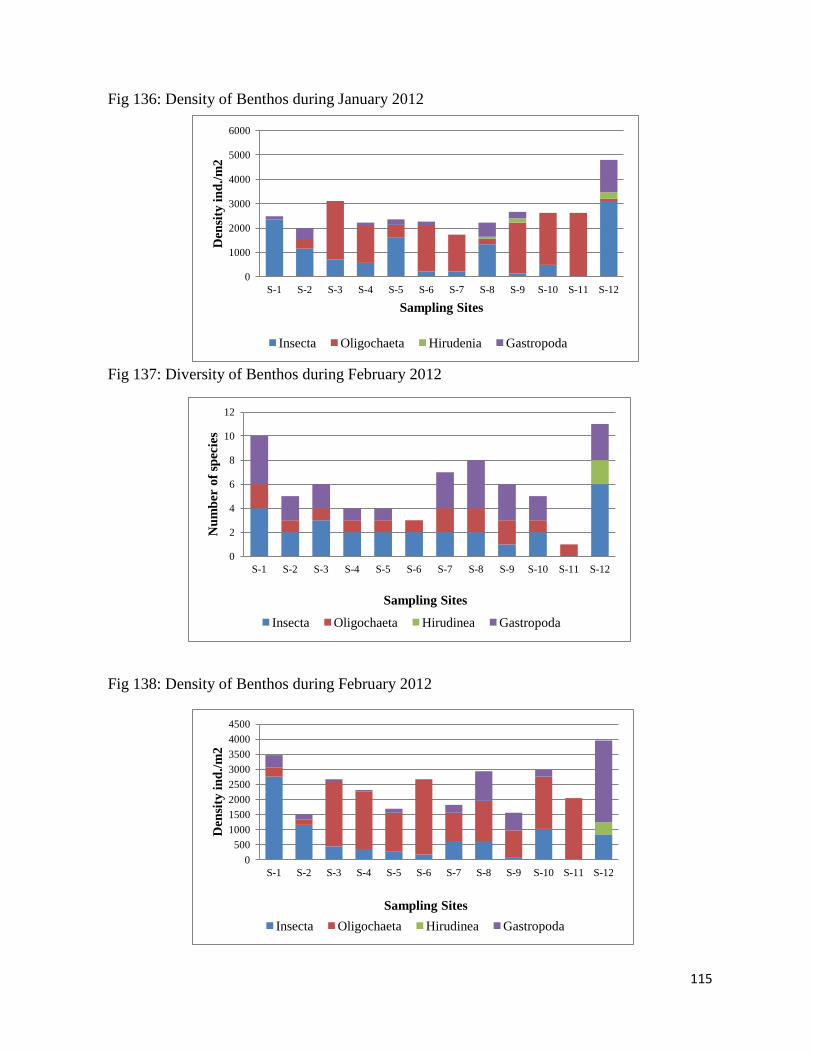
115
0
1000
2000
3000
4000
5000
6000
S-1 S-2 S-3 S-4 S-5 S-6 S-7 S-8 S-9 S-10 S-11 S-12
Den
sity
in
d./
m2
Sampling Sites
Insecta Oligochaeta Hirudenia Gastropoda
0
2
4
6
8
10
12
S-1 S-2 S-3 S-4 S-5 S-6 S-7 S-8 S-9 S-10 S-11 S-12
Nu
mb
er o
f sp
ecie
s
Sampling Sites
Insecta Oligochaeta Hirudinea Gastropoda
0
500
1000
1500
2000
2500
3000
3500
4000
4500
S-1 S-2 S-3 S-4 S-5 S-6 S-7 S-8 S-9 S-10 S-11 S-12
Den
sity
in
d./
m2
Sampling Sites
Insecta Oligochaeta Hirudinea Gastropoda
Fig 136: Density of Benthos during January 2012
Fig 137: Diversity of Benthos during February 2012
Fig 138: Density of Benthos during February 2012

116
0
2
4
6
8
10
12
14
S1 S2 S3 S4 S5 S6 S7 S8 S9 S10 S11 S12
Nu
mb
er o
f S
pec
ies
Sampling Sites
Insecta Oligochaeta Hirudinea Gastropoda
0
500
1000
1500
2000
2500
3000
S1 S2 S3 S4 S5 S6 S7 S8 S9 S10 S11 S12
Den
sity
in
d./
m2
Sampling Sites
Insecta Oligochaeta Hirudinea Gastropoda
0
2
4
6
8
10
12
14
16
18
20
S1 S2 S3 S4 S5 S6 S7 S8 S9 S10 S11 S12
Nu
mb
er o
f S
pec
ies
Sampling Sites
Insecta Oligochaeta Hirudinea Gatropoda Crustacea
Fig 139: Diversity of Benthos during March 2012
Fig 140: Density of Benthos during March 2012
Fig 141: Diversity of Benthos during May 2012

117
0
500
1000
1500
2000
2500
3000
3500
4000
4500
S1 S2 S3 S4 S5 S6 S7 S8 S9 S10 S11 S12
Den
sity
in
d./
m2
Sampling Sites
Insecta Oligochaeta Hirudinea Gatropoda Crustacea
Fig 142: Density of Benthos during May 2012
Fig 143: Diversity of benthos in the month of June 2012
Fig 144: Density of benthos in the month of June 2012
0
2
4
6
8
10
12
S-1 S-2 S-3 S-4 S-5 S-6 S-7 S-8 S-9 S-10 S-11 S-12
No
of
Spe
cie
s
Sampling sites
INSECTA OLIGOCHAETA HIRUDINEA GASTROPODA
0
500
1000
1500
2000
2500
S-1 S-2 S-3 S-4 S-5 S-6 S-7 S-8 S-9 S-10 S-11 S-12
De
nsi
ty i
nd
/m2
Sampling Sites
INSECTA OLIGOCHAETA HIRUDINEA GASTROPODA

118
0
2
4
6
8
S1 S2 S3 S4 S5 S6 S7 S8 S9 S10 S11 S12
Nu
mb
er
of
spe
cie
s
Sampling sites
INSECTA OLIGOCHAETA HIRUDINEA GASTROPODA
Fig 145: Diversity of benthos in the month of July 2-12
Fig 146: Density of benthos in the month of July 2012
Fig 147: Diversity of Benthos during September 2012
0
1000
2000
3000
4000
S-1 S-2 S-3 S-4 S-5 S-6 S-7 S-8 S-9 S-10 S-11 S-12
De
nsi
ty in
d/m
2
sampling sites
INSECTA OLIGOCHAETA HIRUDINEA GASTROPODA
0
2
4
6
8
10
12
14
S-1 S-2 S-3 S-4 S-5 S-6 S-7 S-8 S-9 S-10 S-11 S-12
No
of
spe
cie
s
Sampling sites Crustecea Annilida Gastropoda

119
Fig 148: Density of benthos in September 2012
Fig 149: Diversity of Benthos during October 2012
Fig 150: Density of benthos during October 2012
0
100
200
300
400
500
600
S-1 S-2 S-3 S-4 S-5 S-6 S-7 S-8 S-9 S-10 S-11 S-12
De
nsi
ty (
ind
/m2 )
Sampling sites Crustecea Annilida Gastropoda
0
1
2
3
4
5
6
S-1 S-2 S-3 S-4 S-5 S-6 S-7 S-8 S-9 S-10 S-11 S-12
No
of
spe
cie
s
Sampling sites Insecta Oligochaeta Gastropoda
0
200
400
600
800
S-1 S-2 S-3 S-4 S-5 S-6 S-7 S-8 S-9 S-10 S-11 S-12
De
nsi
ty (
ind
/m2 )
Sampling sites
Insecta Oligochaeta Gastropoda

120
Tab 16: List of benthos in Shahpura lake during November 2011 to October 2012.
S No Species S-1 S-2 S-3 S-4 S-5 S-6 S-7 S-8 S-9 S-10 S-11 S-12
INSECTA
1 Amphiagrion sp. + - - - - - - - - - - +
2 Plea sp. - - - - - - - - - - - +
3 Libellula sp. + - - - - - - - - - - +
4 Limnephilus sp - - - - - - - - - - - +
5 Haliplus futuvs - - - - - - - - - - - +
6 Hydroporus sp. - - - - - - - - - - - +
7 Ishnura ramburi + - - - - - - - - - - -
8 Pachidiplax longipennis - - - - - - - - - - - +
9 Proclalius sp. + - + - - - + + - - - -
10 Hesperocorixa sp. + - - - + - - - - - - +
11 Tabanidae sp. - - - - - - - - - - - +
12 Notonecta sp. + - - - + - - - - - - +
13 Tipula sp. + - - - - - - - - - - +
14 Platambus maculatus - - - - - - - - - - - +
15 Ranatra sp. + - - - - - - - - - - -
16 Rhaphidolabis sp. - - - - - - - - - - - +
17 Rhagovelia sp. - - - - - - - - - - - +
18 Psephenidae sp. - - - - - - - - - - - +
19 Culicidae pupa + - - - - + - - - - - -
20 Chironomus tentans + + + + + + + + + + + +
21 Ablabesmiya sp. + + + + + + + + + + + +
22 Limnephilidae larva - - - - - - - - - - - +
23 Chaoborus sp. - - - - + - - - - - - -
CRUSTACEA
24 Garranarus pulex - - - - - - - - - - - +
OLIGOCHAETA
25 Lumbriculus sp. + + + + + + + + + + + +
26 Branchiura sp. + - + - + + + + + - - -
HIRUDINEA
27 Glossiphornia complanata - - - - - - - + + - - +
28 Glossiphornia leteroculata - - - - - - - - + - - -
29 Glossiphonia sp. - - - - - - - - - - - +
PLATYHELMINTHES
30 Dugesia tigrina - - - - - - - - - - - +
GASTROPODA
31 Lymnaea luteola + - - - - - - - + - - -

121
S No Species S-1 S-2 S-3 S-4 S-5 S-6 S-7 S-8 S-9 S-10 S-11 S-12
32 Bellamya bengalensis + + + + + + + + + + + +
33 Bellamya crassispiralis + + - - + - - - + - - +
34 Bellamya crassa + + + - + - + + + - + +
35 Bellamya dissimilis - - - - - + + - + - - -
36 Physa sp. + + - - + - + - - - - +
37 Thiara tuberculata - + + + + + + + + - - +
38 Thira riqueti - - - - - - - - - - - +
39 Thira pyamis - - - - - - + - + - - -
40 Hydrobioides nassa - - - - - - - + + + - -
41 Indoplanorbis exustas + + - + - - + + + + - +
42 Brotia lineata - + - - - - - - - - - -
43 Botia costula - - - + - - - - + - - -

122
d. Macrophytes:
The term “aquatic macrophyte” refers to macroscopic vegetation, including macroalgae,
mosses, ferns and angiosperms that grow in aquatic and wetland habitats. The macrophytes
are sensitive indicators of water quality and conditions of their habitats. They are affected by a
wide variety of environmental factors including geology, landforms and pollution. The aquatic
macrophytes play an important role in the production process, nutrient dynamics and oxygen
budget of water bodies.
The macrophytes of Shahpura lake were collected from different sites and classified according
to their biological types, habitat and botanical classification (Table…….). The present
investigation of Shahpura lake, total 11 species of macrophytes were reported during
November 2011 to October 2012. There were 2 species of submerged Najas minor, Hydrilla
verticillata, 2 species of free floating Pistia stratiotes, Eichhornia crassipes and 7 emergent
species namely Polygonum glabrum, Cyperus articulatus, Sagittaria sagittifolia, Begrgia
cappensis, Nymphaea nouchali,Phragmites carka, Typha sp were recorded. Typha sp. was
most dominating species at site 2 and site 4 similarly Eichhornia crassipes were second most
dominating species at site 8 and site 12 and Hydrilla verticillata was recorded at Site-12 down
stream of lake .
The Phragmites sp. and Typha sp. are good examples of emergent species used in constructed
wetland treatment systems. These emergent plants play a vital role in the removal and
retention of nutrients in a natural or constructed wetland. Although emergent macrophytes are
less efficient at lowering Nitrogen and Phosphorus contents by direct uptake due to their
lower growth rates (compared to floating and submerged plants), their ability to uptake
Nitrogen and Phosphorus from sediment sources through rhizomes is higher than from the
water.

123
Reference: Wetlands International - Malaysia Office (2003): The use of constructed wetlands for
wastewater treatment
Floating and submerged plants are used in an aquatic plant treatment system. A range of
aquatic plants have shown their ability to assist in the breakdown of wastewater. The Water
Hyacinth (Eichhornia crassipes), and Duckweed (Lemna) are common floating aquatic plants
which have shown their ability to reduce concentrations of BOD, TSS and Total Phosphorus
and Total Nitrogen. However prolonged presence of Eichhornia crassipes and Lemna can lead
to deterioration of the water quality unless these plants are manually removed on a regular
basis. These floating plants will produce a massive mat that will obstruct light penetration to
the lower layer of the water column that will affect the survival of living water organisms.
This system is colonised rapidly with one or only a few initial individuals. The system needs
to be closely monitored to prevent attack from these nuisance species. Loss of plant cover will
impair the treatment effectiveness. Maintenance cost of a floating plant system is high. Plant
biomass should be regularly harvested to ensure significant nutrient removal. Plant growth
also needs to be maintained at an optimum rate to maintain treatment efficiency.
Table 17 : List of Macrophytes in Shahpura Lake
e. Fish Fauna:
In our two months study we observed 5 culturable species of fishes i.e., Catla catla, Labeo
rohita, Cirrhinus mrigala, silver carp, Common carp, and Tilapia mossambica which is
banned for culture. Silver carp, Common carp and Tilapia are exotic species. The first two are
grown in fish pond but Tilapia is considered to be harmful for natural pond ecosystem and
house in banned for culture in India.
S No Species Site Location
1 Najas minor S-8
2 Hydrilla verticillata S-12
3 Polygonum glabrum S-1, S-2, S-4, S-8 , S-9 and S-12
4 Cyperus articulates S-9
5 Sagittaria sagittifolia S-2, S-4, S-9 and S-12
6 Pistia stratiotes S-8
7 Eichhornia crassipes S-1, S-5 and S-8
8 Begrgia cappensis S-1, S-8, S-12
9 Nymphaea nouchali S-1
10 Phragmites carka S-2,
11 Typha S-2, S-4

124
The study is continuous and carried out in our further observation. In present condition we
were unable to collect the fish samples for
diversity study due to non cooperation of
fishermen groups. The present catch statistics of
fish in Shahpura Lake was 110 kg/day given
below as per the statement given by fishermen
group head Mr Raju Batham. Actual condition
showed that the production of tilapia is more
than the culturable species. But due to ban of
Fisheries Department for culture of tilapia the
actual production of tilapia was not recorded.
During the study of Shahpura lake observed that
the density of Tilapia is very high. According to Fishermen group head Tilapia having large
size in Shahpura lake which was more then half kg. During the local observation and market
survey this size of tilapia was not found in any other place of Madhya Pradesh.

125
5. Assessed of trophic status of lake using different index
5.1 Carlson Trophic State Index
The Trophic state index (TSI) of Carlson was determined. The TSI values calculated on the
basis of Secchi Disk (SD), Chlorophyll-a (chl-a) and Total phosphorous (TP). During the
study period the Carlson’s TSI were recorded in Shahpura Lake is between 77.89 to 84.91.
The highest TSI value was recorded in the month of May (84.91) at site-10 and the lowest
value was recorded in the month of Feb (77.89) at site-4.
The TSI (chl-a) was found in Shahpura Lake is between 37.06 to 59.10 µg/l. during the study
period the highest TSI (chl-a) value was recorded in the month of May (59.10 µg/l) at site-10
and the lowest value was recorded in the month of Feb (37.06 µg/l) at site-4
The TSI (SD) was recorded in Shahpura Lake is between 70.57 to 78.85 meters. The highest
TSI (SD) value was recorded in the month of Jan (78.85m) at site-11 and the lowest value was
recorded in the month of Feb and March (70.57m) at site- 4. Site-11 and site-3.
The TSI (TP) was recorded in Shahpura Lake is between 115.85 to 127.64 µg/l. the highest
TSI (TP) value was recorded in the month of Feb (127.65 µg/l) at site-1 and the lowest value
was recorded in the month of July (11.85 µg/l) at site-10.
Table: List of the Carlson Trophic State Index in Shahpura Lake.
SITES Maximum -TSI Jan Feb March April May June July Sept Oct
S-1
70 – 100+
82.51 81.71 83.20 82.98 83.68 80.86 82.39 80.29 81.63
S-2 81.74 82.46 81.38 81.62 82.01 81.38 82.04 80.92 81.71
S-3 82.17 80.72 82.18 80.62 82.04 80.77 81.66 80.75 81.22
S-4 80.68 77.89 81.05 80.72 81.41 82.53 82.57 80.21 80.55
S-5 81.31 80.60 81.02 82.97 83.15 82.18 82.80 79.39 80.49
S-6 80.99 79.34 80.54 83.68 83.73 82.12 83.02 80.73 82.57
S-7 81.38 79.06 81.30 80.72 82.23 80.56 81.68 79.81 81.12
S-8 82.01 80.02 82.27 83.14 83.32 82.02 82.96 81.02 82.49
S-9 82.25 80.62 81.92 83.99 84.65 81.23 83.16 80.92 82.20
S-10 82.59 80.50 81.83 84.36 84.91 80.75 83.10 80.62 81.92
S-11 82.24 81.53 80.82 80.87 84.43 80.37 82.59 80.95 81.48
S-12 83.13 83.91 81.65 81.74 84.03 84.24 84.40 78.07 84.32

126
5.2 Trophic status of Shahpura Lake by Nygard index:
Nygard’s indices – the Myxophycean Chlorophycean, Diatoms, Euglenoids & Compound
were used for evolution of Eutrophication. In present investigation all the stations of lakes
showed Eutrophic except index of diatoms of lakes.
In present study we define trophic status of Lake from Nygard Indices. In present
study of Shahpura lake Nygard indices shows Mixophycean value of Shahpura Lake varied
between 0.03 203.00. The highest value in the month of June (203.00) at site-1 and lowest
value was recorded in the month of Jan (0.03) at site-5. The Chlorophycean value of
Shahpura Lake varied between 0.83 to 66.00. The Chlorophycean shows highest value in
the month of Feb (66.00) at site-3 and lowest value show in the month of July (0.83) at site-
12.the Diatoms value ranged between 0.01 to 2.50. The highest value of Diatoms show in
the month of May (2.50) at site-10 and lowest value show in the month of Jan (0.01) at site-2.
The Euglenophycean value ranged between 0.03 to 202.05.The Euglenophycean highest
value shows in the month of May (202.05) at site-5 and lowest value show in the month of
March (0.03) at site—12, and the Compound value ranged between 16.5 to 528.67. The
Compound highest value show in the month of June (528.67) at site-5 and lowest value
show in the month of Jan (16.5) at site-10 (Fig 151). All index value comes under eutrophic
status.
Fig 151: Monthly Compound Nygard index values of Shahpura lake
0.00
100.00
200.00
300.00
400.00
500.00
600.00
S-1 S-2 S-3 S-4 S-5 S-6 S-7 S-8 S-9 S-10 S-11 S-12
Ind
ex
valo
e
Sampling sites
jan feb march april may june july

127
Table 18: Nygards algal index for estimation algal trophic status of lake due to presence of
high Nutrients in Shahpura lake.
Index Index range Jan Feb March April May June July
Mixophyceae 0.0 – 0.4 0.42 21.36 0.66 5.66 26.15 36.58 20.92
Chlorophycean 0.0 – 0.7 0.99 24.69 13.30 13.08 20.13 12.15 2.90
Diatom 0.0 – 0.3 0.00 0.00 0.03 0.02 0.29 0.18 0.00
Euglenophycean 0.0 – 0.2 4.16 43.40 0.30 0.49 214.49 0.20 0.00
Compound 0.0 – 0.1 42.71 94.11 107.20 67.63 402.31 187.39 53.42
5.3 Biomonitoring indices using macrozoobenthos:
Benthic macroinvertebrate will be used to evaluate the water quality of Shahpura lake. The
aquatic macroinvertebrates present in Shahpura lake were identified. Every group of
invertebrate have different sensitivity towards the pollution. In BMWP scoring they will give
certain score according to their sensitivity to pollution and finally the status of the water body
will be classified as Clean, Slightly polluted, Moderately polluted, Heavily polluted and
Severely polluted. In Shahpura lake highest BMWP scoring was reported as 64% heavily
polluted and 28% severely polluted.
Table 19: Biological monitoring working party (BMWP) scoring for estimation of Lake
water quality characteristics
Months S-1 S-2 S-3 S-4 S-5 S-6 S-7 S-8 S-9 S-10 S-11 S-12
Nov-11 4.2 3.8 1.3 4.5 2.5 3.5 3.0 4.0 4.4 3.0 4.0 3.4
Dec-11 1.9 5.3 2.7 2.4 2.0 1.2 1.0 1.8 4.8 3.0 1.0 4.9
Jan-12 3.5 3.3 1.5 2.0 2.4 3.0 2.0 3.9 3.0 1.5 1.0 5.5
Feb-12 2.7 3.4 3.67 2.75 2.75 1.67 3 3.375 3 3.2 5.36 5.45
Mar-12 4.4 4.25 4 2 3.375 3.2 4.2 3.43 4.33 2 3.4 3.46
Apr-12 2.8 4 6.4 3 3.25 3.4 4.4 3.43 4.71 2 3.67 3.54
May-12 4.45 5.4 3.75 5.25 4.2 1 6 3.4 3.71 2 1.5 4.11
Jun-12 3.33 3.58 3.4 3 3.6 1.33 1.5 3.17 4.4 1.5 1 3.45
Jul-12 4.25 3.6 3.75 3 2 1.33 1 4 3 3.5 1 3.28
Sep-12 3.6 6 2.5 4 2 2 4 2 5 4 1 4.4
Oct-12 2.83 6 3 4.33 1.67 1.25 1 1.67 4.8 2.25 1 4

128
6. Prediction of relationship between surface and ground water
6.1 Prati index:
This index is well-known method as well as one of the most effective tools to reduce the huge
data into a single value which predict the condition of the water body and we will not need to
go through the entire data. It offers a simple, stable, reproducible unit of measure and
communicate information of water quality to the concerned citizens and policy makers. It,
thus, becomes an important parameter for the assessment and management of surface water.
We will use water quality index to assess the water quality of Shahpura lake. As it provides a
single number that will express overall water quality at a certain location and time based on
pollution indicator water quality parameters. The objective of prati index is to turn water
quality data into information that is understandable and usable by the public. Following
results are observed:
The site S-1 comes under upstream North West. There is one site G-1 upstream North West
around S-1.According to prati index site S-1 has been assigned Class-4 indicating that the
water is bad or polluted. This may be due to the sewage water being discharged through this
Nala.
G-1 site has been assigned Class-3 which indicating moderate type of pollution. This site
located around S-1, the pollution at G-1 may be due to the sewage water from the Nala in to
the G.W.
Site S-2 there are three sites G-02,Pz-1B,Pz-02 around this site. All these sites come under
upstream North East. The site S-2 has been assigned Class-4 indicating that the water is bad
or polluted. This may be due to Nala flowing nearby.
Site G-2,Pz-1B,Pz-02 has been assigned Class-2 indicating that the water is good with slightly
pollution.
Site S-3 there are one site G-3 around this site. Both sites come under upstream North East.
The site S-3 has been assigned Class-3 indicating that the water is moderately polluted. High
algal growth found in this area & washing of clothes is being done here.
G-3 site has been assigned Class-2 indicating the water is good with slightly pollution.
Site S-4 there are three sites G-4, Pz-3, and Pz-4 around this site. All these sites come under
upstream North East. The site S-4 has been assigned Class-3 indicating that the water is
moderately polluted. Slum area is found in front of Administrative academy.

129
G-4 site has been assigned Class-3 indicating that the water is moderately polluted. This site
located near slum area of in front of Administrative academy. The slightly pollution at G-4
may be due slum area.
Pz-3 and Pz-4 have been assigned Class-3 indicating that the water is moderately polluted.
Site S-5 there are one site G-5 around this site. Both sites come under upstream South East.
The site S-5 has been assigned Class-3 indicating that the water is moderately polluted.
G-5 site has been assigned Class-2 indicating that the water is good with slight pollution.
Site S-6 comes under downstream south East. Site S-6 has been assigned Class-3 which is
indicating water is moderately polluted because this is the confluence point of Shahpura
sewage Nala.
Site S-7 there are Two sites G-7A,and G-7B around this site. All these sites come under
Downstream South East. The site S-7 has been assigned Class-3 indicating that the water is
moderately polluted. This may be due to the waste material thrown in this area.
G-7Aand G-7B Both these sites have been assigned Class-2 indicating that the water is
slightly polluted.
Site-8 comes under upstream center. Site has been assigned Class-3 which is indicating that
the water is moderately polluted. This may be due to the water from the Nala mix with lake
water, here pollution is comparatively less than the surrounding area and fishing activity is
undertaking here.
Site S-9 there are three sites G-9, Pz-9A, and Pz-9B around this site. All these sites come
under upstream North West. The site S-9 has been assigned Class-3 indicating that the water
is moderately polluted. This may be due to the waste material from the surrounding urban
area.
G-9 site has been assigned Class-2 indicating that the water is good with slightly pollution.
Pz-9A and Pz-9B have been assigned Class-3 indicating that the water is moderately polluted.
Site S-9 there are three sites G-10, Pz-10A, and Pz-10B around this site. All these sites come
under Downstream North West. The site S-10 has been assigned Class-3 indicating that the
water is moderately polluted. This may be due to mixing of Nala water in this area.
G-10 site has been assigned Class-3 indicating that the water is moderately polluted
Pz-10A and Pz-10B have been assigned Class-3 indicating that the water is moderately
polluted

130
Site S-11 there are three sites G-11A, Pz-11B, and G-11C around this site. All these sites
come under Downstream South West. The site S-11 has been assigned Class-3 indicating that
the water is moderately polluted.
G-11A site has been assigned Class-3 indicating that the water is moderately polluted
G-11B and G-11C both sites have been assigned Class-2 indicating that the water is good
slightly polluted.
Site S-12 there are four sites G-12A,G-12B,G-12C and Pz-12 around this site. All these sites
come under Downstream South West. The site S-12 has been assigned Class-3 indicating that
the water is moderately polluted.
G-12A, G-12B, G-12C andPz-12 sites have been assigned Class-2 indicating that the water is
good with slightly polluted.
Site S-13 there are one site G-13 around this site. Both sites come under downstream
Southwest. The site S-13 has been assigned Class-3 indicating that the water is moderately
polluted. It may be due sewage water from the Nala and through of waste material here.
G-13has been assigned Class-2 indicating that the water is good,slightly polluted.

131
Table 20: Prati index values of shoreline, peizometer and ground water in Shahpura lake basin.

132
6.2 Correlation of surface water quality with Ground water quality:
PCA was executed on 6 variables for Shahpura lake with 51 sampling sites in order to identify
variation in water quality. In this we evaluated the relationship between surface and ground
water. We used pollution indicative parameters to evaluate the ground water contamination.
The Principal Component Analysis or redundancy analysis is an ordination technique with an
implied Euclidian distance. It represents the first principal component and explains most of the
plots variability. The second component will be located perpendicularly to the first one and
accounts for the variability not explained by the first component. The PCA diagram shows the
slope of the parameters in relation to the principal component as parameters or points. Since the
environmental variables have a linear relationship to the components, they point to the direction
to determine their preferred intensity to the variable.
The analysis of principal component from surface water and ground water sites using
lomnological and ground water quality data of pH, conductivity, nitrate, phosphate, COD and
Total hardness revealed 4 axis (Fig.152). The PC1 axis was surface water sites S-2, S-3, S-4, S-5
and S-6, giving high positive correlation with G-5, G-12A and PZ-2 ground water sites. PC2
showed S-13 positive loading with G-7A, G-9, G-10, G-11A, G-11B, G11C, G-12B and G-13.
PC3 showed high negative loading with ground water sites namely G-01, G-02, G-03 and G-07B
and PC4 showed negative relation surface sites S-8, S-9 and S-10 with PZ-3, PZ-4, PZ-5, PZ-6,
PZ-7 and PZ-8 ground water sites (experimental tube wells).

133
Fig 152: Principal Component Analysis of Shahpura Lake on the basis of Limnological, Ground
and Peizometer data.
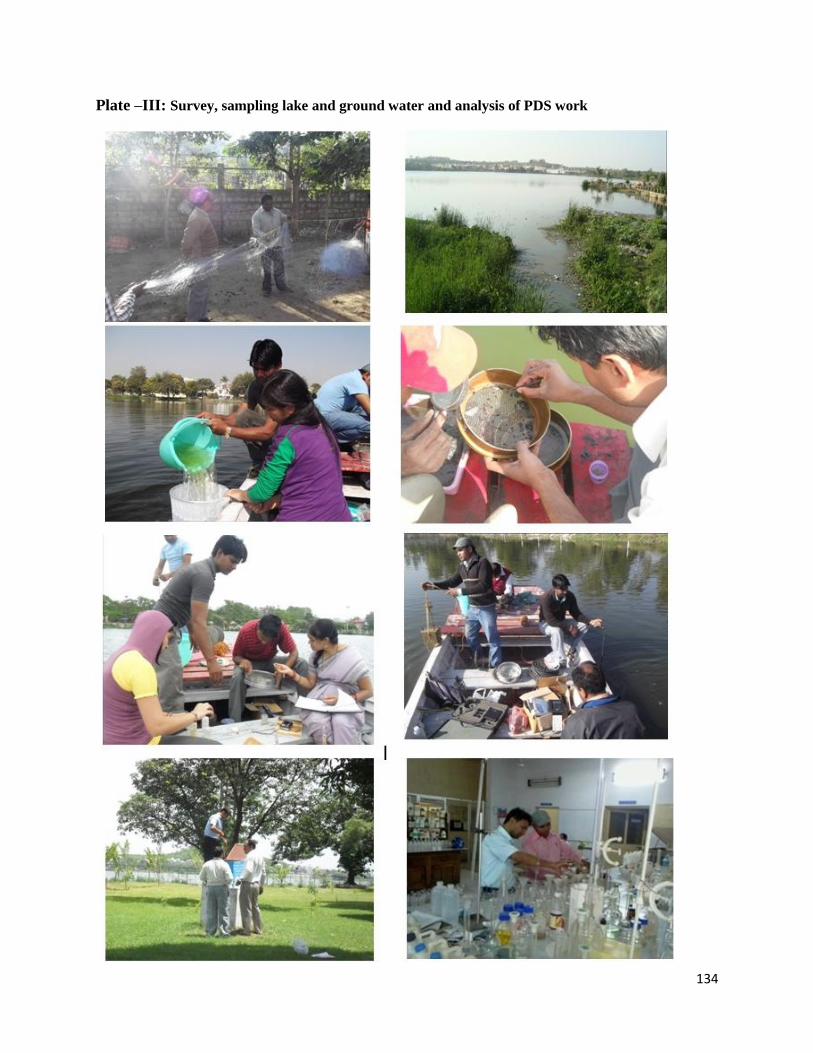
134
Plate –III: Survey, sampling lake and ground water and analysis of PDS work

135
7. Conclusion
Based on the objective for a long term monitoring mechanism to keep vigil on progression of
water pollution by studying systematic & periodically physic-chemical parameters, biological
and sediment of Shahpura lake basin the following conclusion is reported:.
Discharge of untreated sewage is spoiling the ecosystem of the water body.
Increasing concentration of nitrogen and phosphate nutrients has led to eutrophication of
the water body.
Presence of ammoniacal nitrogen has made the water body toxic.
Increased level of organic matter in ground water aquifer establishes intrusion of sewage
water.
A continuous degradation in biological character of the water body has been observed as
also evident in the results of Nygard Index, Carlson Trophic Status Index and BMWP
scoring using macroinvertebrates.
It has been found that the Indian major carps (Catla, Rohu and Mrigal) and other
economically benefitted fish productivity are low. Whereas Tilapia mossambica is
flourishing well because it grows well in the sewage polluted water.
Due to increase in nutrients level, sediment quality has also been enhanced. Therefore
production of algal biomass is found very high.
The correlation of chemical properties (presence of nutrients and organic matter) between
surface water and ground water shows the ingress of pollutants from sewage
contaminated lake.
The medium separating the lake water and ground water aquifer is contact of Vindhyan
Sand stone and Deccan Trap Basalt. Cracks and fractures of Basalt may be the possible
reason for intrusion of lake water contaminants in to ground water.
Though the socio economical and educational status of the urban population residing
around the study area belongs to high socio economical class and has knowledge about
the environment degradation and water quality, they are forced to use the contaminated
ground water.

136
8. Recommendation for further study and policy makers
Detailed study of area for finding aquiclude (non permeable) geological strata shall be
selected for construction of an embracement in any watershed proposed for the collection
of domestic sewerage. This will protect the aquifer from leaching of contaminants in its
catchment.
Treatment of sewage water before its joining in any water body shall be made mandatory.
Establishing treatment plant like gravel bed treatment or Root zone treatment for
improving quality of water resources within water body.
The washing area at upstream of lake should be shifted to downstream outside wastewier.
Aeration in the lake is needed to increase the fish productivity.
Tilapia fish is considered to be harmful for natural pond ecosystem and banned for
culture in India. Therefore tilapia shall be removed from the water body to improve the
productivity of cultivable species stock.

137