purpose remit survey autumn 2016downloads.bbc.co.uk/bbctrust/assets/files/pdf/review...icm research...
TRANSCRIPT

Creston House, 10 Great Pulteney Street, London W1F 9NB [email protected] | www.icmunlimited.com | +44 020 7845 8300 (UK) | +1 212 886 2234 (US)
ICM Research Ltd. Registered in England No. 2571387. Registered Address: Creston House, 10 Great Pulteney Street, London W1F 9NB A part of Creston Unlimited
Purpose Remit Survey Autumn 2016
UK Report
A report by ICM on behalf of the BBC Trust
BBC Trust Purpose Remit Survey 2016 – UK Report
2
Contents 1. Introduction .......................................................................................................................... 11
1.1 Background .................................................................................................................................. 11
1.2 Methodology ................................................................................................................................ 12
1.3 Presentation and interpretation of the data ................................................................................. 13
2. General measures ............................................................................................................... 15
2.1 Overall impression of the BBC ..................................................................................................... 15
2.2 Likelihood to miss the BBC and other broadcasters ................................................................... 18
2.3 The BBC’s provision .................................................................................................................... 21
3. Value for money ................................................................................................................... 23
3.1 Overall views on value for money ................................................................................................ 23
4. Creativity .............................................................................................................................. 25
4.1 Overall views on the Creativity purpose ...................................................................................... 25
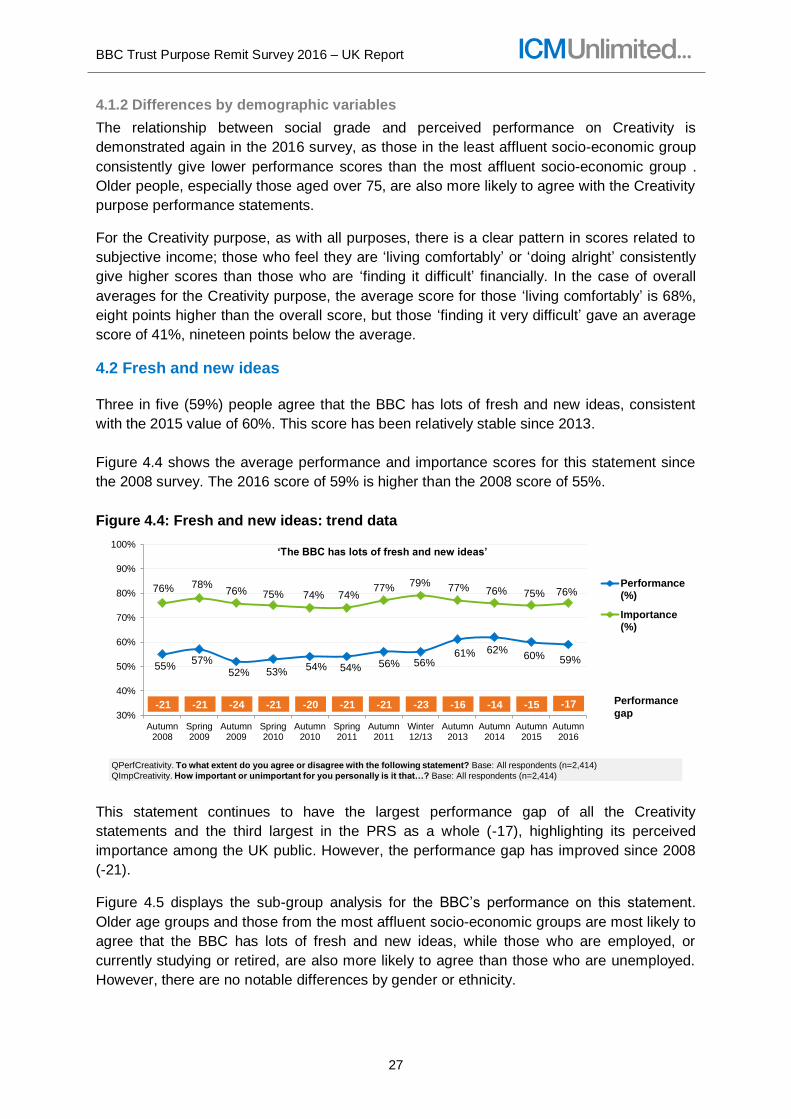
4.2 Fresh and new ideas.................................................................................................................... 27
4.3 Distinctive content ........................................................................................................................ 28
5. Citizenship............................................................................................................................ 31
5.1 Overall views on the Citizenship purpose .................................................................................... 31
5.2 Providing high quality independent journalism ............................................................................ 32
5.3 Understanding politics in the nations ........................................................................................... 33
6. Global ................................................................................................................................... 35
6.1 Overall views on the Global purpose ........................................................................................... 35
6.2 Performance on Global statements ............................................................................................. 36
7. Nations, regions & communities .......................................................................................... 38
7.1 Overall views on the Nations, regions & communities purpose .................................................. 38
7.2 Nations, regions and communities: differences by nation ........................................................... 39
7.3 Representing the English regions ................................................................................................ 40
7.4 Representing different communities, religions and minority ethnic groups ................................. 41
8. Education ............................................................................................................................. 45
8.1 Overall views on the education purpose………………………………………………………….....45
9. Digital ................................................................................................................................... 49
9.1 Overall views on the Digital purpose ........................................................................................... 49
Appendices .............................................................................................................................. 52
Appendix 1: Trend data for general measures and purposes ........................................................... 53
Appendix 2: Ranked performance and importance scores for all statements ................................... 68
Appendix 3: Performance in general measures, purposes and statements by key demographic
variables ............................................................................................................................................. 72

BBC Trust Purpose Remit Survey 2016 – UK Report
3
Appendix 4: Platform usage and BBC consumption ......................................................................... 84
Appendix 5: Guide to statistical reliability .......................................................................................... 85
Appendix 6: Purpose Remit Survey Face-to-Face questionnaire ..................................................... 87
Tables and figures
Figure 2.1: Overall impression of the BBC .............................................................................. 15
Figure 2.2: Overall impression of the BBC: trend data ........................................................... 15
Figure 2.3: Overall impression of the BBC: sub-group analysis ............................................. 16
Figure 2.4: Overall impression of the BBC: sub-group analysis ............................................. 17
Figure 2.5: Overall impression of the BBC: sub-group analysis by BBC consumption .......... 17
Figure 2.6: Overall impression of the BBC: sub-group analysis by subjective income .......... 18
Figure 2.7: Likelihood to miss the BBC and other broadcasters: trend data .......................... 18
Figure 2.8: Likelihood to miss the BBC: sub-group analysis by nation .................................. 19
Figure 2.9: Likelihood to miss the BBC: sub-group analysis by age ...................................... 19
Figure 2.10: Likelihood to miss the BBC: sub-group analysis by BBC consumption ............. 20
Figure 2.11: Likelihood to miss the BBC: sub-group analysis by ethnicity and subjective
income ...................................................................................................................................... 20
Figure 2.12: The BBC’s provision by nation ............................................................................ 21
Figure 2.13: The BBC’s provision: regional sub-group analysis ............................................. 21
Figure 3.1: Value for money .................................................................................................... 23
Figure 3.2: Value for money: demographic sub-group analysis ............................................. 24
Figure 3.3: Value for money: sub-group analysis by BBC consumption ................................ 24
Figure 4.1: Creativity: performance scores ............................................................................. 25
Figure 4.2: Creativity: trend data ............................................................................................. 26
Figure 4.3: Creativity: average performance scores by nation ............................................... 26
Figure 4.4: Fresh and new ideas: trend data .......................................................................... 27
Figure 4.5: Fresh and new ideas: sub-group analysis ............................................................ 28
Figure 4.6: Distinctive content: trend data ............................................................................... 29
Figure 4.7: Distinctive content: sub-group analysis ................................................................ 29
Figure 5.1: Citizenship: performance ...................................................................................... 31
Figure 5.2: Citizenship: trend data........................................................................................... 32
Figure 5.3: High quality independent journalism: trend data .................................................. 32
Figure 5.4: High quality independent journalism: performance scores by nation................... 33
Figure 5.5: Understanding politics in the nations: performance scores by nation .................. 33
Figure 5.6: Understanding politics in Scotland: trend data ..................................................... 33
Figure 6.1: Global: trend data .................................................................................................. 35

BBC Trust Purpose Remit Survey 2016 – UK Report
4
Figure 6.2: Global: average performance scores by nation .................................................... 36
Figure 6.3: Global: performance .............................................................................................. 36
Figure 6.4: Presenting a positive image of the UK: trend data ............................................... 37
Figure 6.5: Presenting a positive image of the UK: sub-group analysis ................................. 37
Figure 7.1: Nations, regions and communities: trend data ..................................................... 38
Figure 7.2: Nations, regions and communities: performance ................................................. 39
Figure 7.3: Nations, regions and communities: sub-group analysis by nation ....................... 39
Figure 7.4: Providing content for people like me: sub-group analysis by nation .................... 40
Figure 7.5: Representing the nations: sub-group analysis by nation...................................... 40
Figure 7.6: Nations, regions and communities: representing English regions ....................... 41
Figure 7.7: Nations, regions and communities: performance ................................................. 42
Figure 7.8: Representing different religions ............................................................................ 43
Figure 7.9: Representing different religions: Trend data ........................................................ 43
Figure 7.10: Representing different ethnic groups .................................................................. 44
Figure 8.1: Education: trend data ............................................................................................ 45
Figure 8.2: Education: performance ........................................................................................ 46
Figure 8.3: Education: sub-group analysis by children in household ..................................... 46
Figure 8.4: Education: sub-group analysis by age of children ................................................ 47
Figure 8.5: Education: sub-group analysis by nation .............................................................. 47
Figure 8.6: Education: ethnicity sub-groups ............................................................................ 48
Figure 9.1: Digital: trend data .................................................................................................. 49
Figure 9.2: Digital: performance .............................................................................................. 49
Table 9.1: Digital: Agreement by user subgroup ..................................................................... 50
Table 9.2: Digital: Agreement by age ...................................................................................... 50

BBC Trust Purpose Remit Survey 2016 – UK Report
5
Executive summary This report presents the findings from the 2016 Purpose Remit Survey conducted by ICM
Unlimited on behalf of the BBC Trust. The findings are based on a representative sample of
2,414 UK adults aged 16+, interviewed online or face-to-face.
The research was designed to explore public perceptions of the BBC’s performance,
particularly in relation to its public purposes and purpose priorities. The survey has been
running since 2008.
Fieldwork took place between 14 October and 14 November 2016.
Key findings
On the whole, the 2016 Purpose Remit Survey continues to present a positive picture of
public perceptions of the BBC. As in previous years, the majority of the UK public have a
favourable impression of the BBC overall.
Furthermore, the BBC’s role in public life is highlighted by the fact that a large majority of the
public say they would miss the BBC if it wasn’t there. Of all the UK public broadcasters, it
remains the one most likely to be missed. These positive findings are reflected in the fact
that a majority believe that the BBC represents good value for money for the licence fee – a
measure which has shown a high degree of consistency in performance over time.
Perceptions of the BBC’s performance in its public purposes are also generally positive.
Indeed, the average performance score stands at over 50% for each of the individual
purposes.
The BBC’s performance in the Global purpose – bringing the UK to the world and the world
to the UK – is particularly highly rated by the UK public, as is its performance in the
Education purpose in promoting education and learning.
In contrast, the BBC’s performance in the Nations, regions and communities purpose in
representing different areas and groups of the UK population remains the lowest-rated
across the PRS, and the notable performance gaps for this area highlight the perceived
importance of this purpose among the UK public.
Since 2015, there have also been some changes worth noting seen on key measures
for the Creativity, Citizenship and Digital purposes.
There have been declines on the Creativity measures since last year for the provision of
high quality programming / content and producing programmes no other broadcaster
would make, while performance ratings for the BBC’s digital offering – including its
internet and iPlayer provision – have also fallen, perhaps reflecting the increasing
competitiveness of the wider media and broadcasting landscape.
Performance on high quality independent journalism has also fallen since 2015, but in
contrast, performance on producing news and current affairs coverage which gets
people talking has increased. These changes are likely to reflect the high-profile

BBC Trust Purpose Remit Survey 2016 – UK Report
6
coverage of the EU referendum and its impact, as well as the polarised nature of the EU
debate.
Detail on key measures from each individual section of the 2016 PRS, and how they
compare to previous surveys, are outlined in the summary below.
General measures
• The proportion of the public holding a favourable impression of the BBC (58%) has
increased since 2015 (55%)1. On average, people give an overall impression score
of 7.4, which is a rise on the average score from the previous wave (7.3) and is
above the long-term average (7.0).
• Four in five (78%) would miss the BBC if it were no longer there, consistent with
the 2015 score (also 78%). Levels of agreement across different age groups and
across the UK nations have remained stable since 2014.
• Overall, the BBC remains more likely to be missed than other broadcasters
(ITV/STV/UTV: 70%, Channel 4: 60%, Channel 5: 42%, Sky: 46%). However, each of
the other broadcasters has seen an increase on this measure since 2015, which
suggests that the dip recorded last year is likely to have been an outlier.
• Just over half the population (56%) agree that the BBC offers ‘quite a bit’, ‘a lot’,
or ‘everything I need’. This is consistent with the proportion who said the same in
2015 (55%).
Value for money
• Almost three in five (58%) feel that their household gets ‘very good’ or ‘fairly
good’ value for money for the licence fee, which is consistent with previous waves
of research in 2015 (57%) and in 2008 (59%).
• The perceived value for money of the BBC varies across key demographic sub-
groups. Older people aged 55+ as well as those from the more affluent socio-
economic grades are more likely to believe that the licence fee is good value for
money.
• Perceived value for money also rises in line with consumption of BBC content, as
well as number of platforms used to consume BBC content, which is consistent
with the pattern seen in previous waves of the research.
1 Throughout this report, unless otherwise stated, any increase or decrease in scores indicates a difference that is statistically significant at the 95% confidence level. For a full guide to statistical reliability, please refer to Appendix 5.
BBC Trust Purpose Remit Survey 2016 – UK Report
7
Summary of key findings – General measures
Overall measures UK
Autumn 2016 Change since 2015
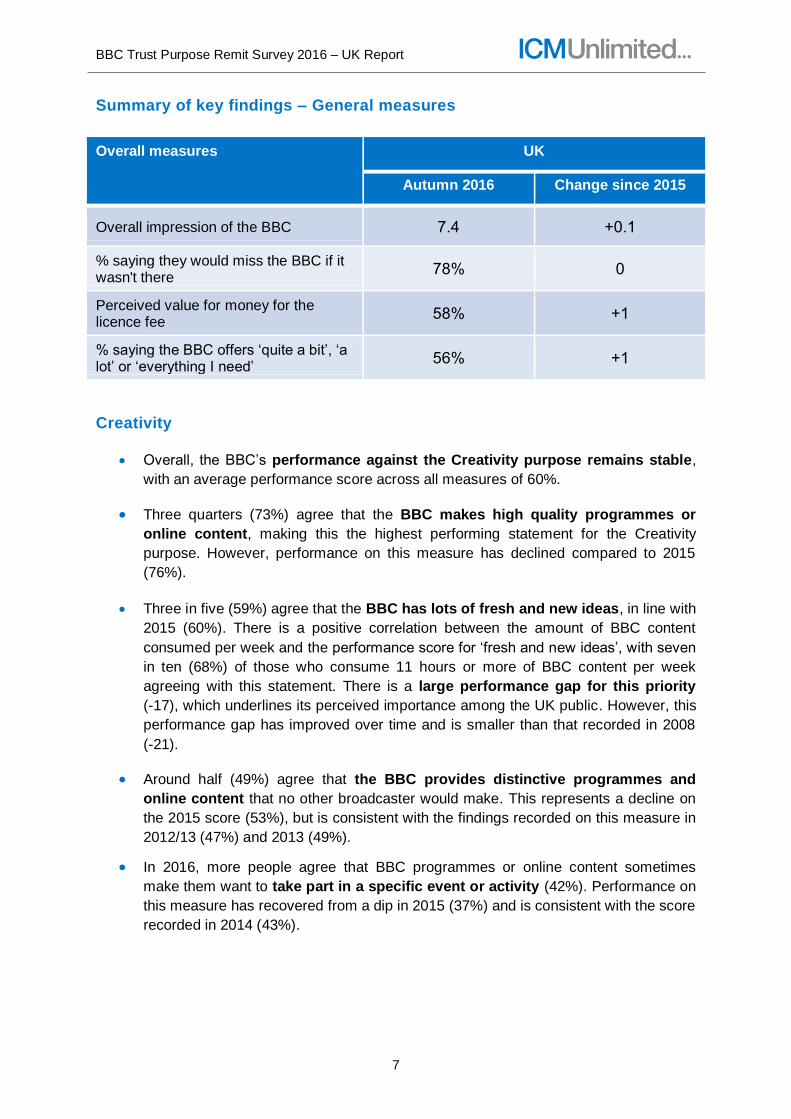
Overall impression of the BBC 7.4 +0.1
% saying they would miss the BBC if it wasn't there
78% 0
Perceived value for money for the licence fee
58% +1
% saying the BBC offers ‘quite a bit’, ‘a lot’ or ‘everything I need’
56% +1
Creativity
• Overall, the BBC’s performance against the Creativity purpose remains stable,
with an average performance score across all measures of 60%.
• Three quarters (73%) agree that the BBC makes high quality programmes or
online content, making this the highest performing statement for the Creativity
purpose. However, performance on this measure has declined compared to 2015
(76%).
• Three in five (59%) agree that the BBC has lots of fresh and new ideas, in line with
2015 (60%). There is a positive correlation between the amount of BBC content
consumed per week and the performance score for ‘fresh and new ideas’, with seven
in ten (68%) of those who consume 11 hours or more of BBC content per week
agreeing with this statement. There is a large performance gap for this priority
(-17), which underlines its perceived importance among the UK public. However, this
performance gap has improved over time and is smaller than that recorded in 2008
(-21).
• Around half (49%) agree that the BBC provides distinctive programmes and
online content that no other broadcaster would make. This represents a decline on
the 2015 score (53%), but is consistent with the findings recorded on this measure in
2012/13 (47%) and 2013 (49%).
• In 2016, more people agree that BBC programmes or online content sometimes
make them want to take part in a specific event or activity (42%). Performance on
this measure has recovered from a dip in 2015 (37%) and is consistent with the score
recorded in 2014 (43%).

BBC Trust Purpose Remit Survey 2016 – UK Report
8
Citizenship
• Overall, the BBC’s performance for the Citizenship purpose remains stable, with
an average performance score of 62%. However, there have been some changes on
key measures.
• The proportion of people who agree that ‘BBC coverage of the news and current
affairs has got me talking about them’ has increased by three percentage points,
likely reflecting the impact on news and current affairs coverage of the EU
referendum and Brexit.
• Just over three in five (62%) agree that the BBC ‘provides high quality
independent journalism’. This represents a decline since 2015 (65%) and is the
lowest score ever recorded on this measure.
• Around three in five people in Wales (61%), in England (58%) and in Scotland
(63%) feel that the BBC helps them understand politics in their nation or
region, while around half (52%) say the same in Northern Ireland. For Scotland,
this represents a return to the pre-referendum peak of 64% in 2012/13.
Global
• The average performance score for statements across the Global purpose is
72%. This compares to an average score of 71% last year. The Global purpose
continues to receive the highest performance rating of all the six purposes.
• The statement, ‘the BBC helps me understand what is going on in the wider
world’ scored the highest of all statements in the survey at 78%. It has
consistently been the highest scored statement in the PRS.
• Two thirds (66%) of the public believe that ‘the BBC is good at presenting a
positive image of the UK to the rest of the world’. This is in line with the 2015
score (65%).
Nations, regions & communities
• The Nations, regions & communities purpose achieves an average
performance score of 51% across all statements, which is consistent with 2015
(51%) and is higher than the ratings given in the early years of the PRS (2008: 44%).
• There have been increases of 2 percentage points on several measures for this
purpose, showing a recovery following the declines recorded last year. These
include the proportion of people who agree that ‘my regional BBC content provides
programmes and online content for people like me’ (61% vs 59% last year), ‘the BBC
is good at representing life in my nation/region in drama and entertainment’ (57% vs
55% last year) and ‘in news and current affairs programming’ (56% vs 54% last
year).
• However, there has been a decline in the proportion of people who believe that
the BBC supports the native languages of the UK other than English with
programming and other content. The score on this measure has remained

BBC Trust Purpose Remit Survey 2016 – UK Report
9
stable in all three of the devolved nations (Scotland, Wales and Northern
Ireland), and the decline is driven by a decrease in England.
• The average performance score for the Nations purpose in Scotland is at its
highest ever point (53%). This is underpinned by an increase in performance
across several measures, including BBC Scotland ‘providing programmes or
online content for people like me’ and ‘representing life in Scotland in drama /
entertainment’.
• After an increase in 2015, the number of non-White British people who feel the BBC
is good at representing their ethnic group remains consistent (45% compared to
48% in 2015). Agreement has fallen for Black respondents this wave (43% compared
to 59% in 2015).
Education
• As in 2015 and the majority of previous years, the Education purpose is the second
highest performing purpose with an average performance score of 67%. It is in line
with the performance score of 68% recorded last year.
• The educational focus of BBC programmes continues to be held in high regard.
Seven in ten people (72%) agree that they have ‘learned new things from
programmes or online content on the BBC’, while over three in five (62%) agree that
‘the BBC helps children/teenagers with what they learn at school/college’.
• Two thirds of parents with children in their household (66%) agree that the BBC
‘helps children or teens with what they learn at school or college’ compared to 63% of
adults with no children.
Digital
• The average performance score for the Digital purpose is 54%, which is consistent
with the 2015 score (56%). However, there have been declines on several
measures, including the proportion of people who agree that the BBC provides
‘quality content that I find useful or enjoyable on the internet’ (61%) and ‘quality
content that I find enjoyable or useful on BBC iPlayer’ (59%).
• The perceived importance of the BBC providing quality content on DAB digital
radio and mobile phones and tablets, as well as the perceived importance of the
BBC helping people to make the most of new technologies, has increased since
2015. As a result, the average performance gap for the Digital purpose has widened
slightly this year.

BBC Trust Purpose Remit Survey 2016 – UK Report
10
Summary of average BBC purpose scores – UK
BBC Purposes Performance Importance Performance gap - 2016
Performance gap - 2015
Creativity 60 66 -6 -5
Citizenship 62 70 -8 -6
Global 72 77 -5 -5
Nations, regions and communities
51 62 -11 -11
Education 67 75 -8 -4
Digital 54 59 -5 -1
Perceptions of performance by key demographic and geographic variables
• Overall, men and women continue to hold similar views of the BBC, with no
notable differences in their views of the BBC’s performance on general
measures.
• However, there are some differences in perception by age, with older age
groups (aged 55+) more positive in their overall views of the BBC, and more
likely to miss the BBC if it wasn’t there.
• As in 2015, people from the more affluent socio-economic grades (ABC1s)
are more positive about the BBC’s performance compared to their less
affluent counterparts (C2DEs).
• In terms of subjective income2, those who feel they are managing better
financially give higher performance scores than those who are finding it difficult.
• In 2016, people in England, Scotland and Wales tend to rate the BBC’s
performance in the overall measures more highly than people in Northern
Ireland. Since 2015, performance ratings in Scotland have generally increased
across a range of measures, while performance ratings in Wales and Northern
Ireland have generally declined.
2 This question was added to the questionnaire in Autumn 2014 to provide an additional measure on how well people were managing financially. More detail can be found in Appendix 3.6.

BBC Trust Purpose Remit Survey 2016 – UK Report
11
1. Introduction
1.1 Background
The BBC Trust is the governing body of the BBC. Independent of the BBC Executive Board,
its purpose is to get the best out of the BBC for licence fee payers. The Trust monitors the
BBC’s performance to ensure the BBC provides value for money while staying true to its
Public Purposes as set out in the Royal Charter.
1.1.1 The BBC’s Public Purposes
The Royal Charter defines the main objective of the BBC as the promotion of six public
purposes. These are:
• Creativity: Stimulating creativity and cultural excellence
• Citizenship: Sustaining citizenship and civil society
• Global: Bringing the UK to the world and the world to the UK
• Nations, regions and communities: Representing the UK, its nations, regions and
communities
• Education: Promoting education and learning
• Digital: Delivering to the public the benefit of emerging communications technologies
and services
The BBC Trust gives the BBC a purpose remit for each of these public services, and
monitors the BBC’s performance in delivering against the priorities included in each remit.
1.1.2 The BBC Purpose Remit Survey
To monitor the Executive’s performance against each of the six public purposes, the BBC
Trust carries out an annual tracking survey. The BBC Purpose Remit Survey (PRS) is a
quantitative survey which asks respondents to express their views both on the importance
they attach to the purpose priorities, and on the BBC’s current effectiveness in delivering
them. Based on the scores from each statement, this report examines the BBC’s perceived
performance for each purpose, focusing on any change over time and variance in scores
between different sections of the population.
As well as core information on the BBC’s performance against its public purposes, the
survey collects contextual information such as demographics and media consumption, and
measures general opinions of the BBC’s performance such as the perceived value for
money of the licence fee.
The PRS was first conducted in this form in 2008. ICM Unlimited was commissioned to
conduct the eleventh wave, which took place in Autumn 2016.

BBC Trust Purpose Remit Survey 2016 – UK Report
12
1.2 Methodology
The methodology and sampling method of the 2016 PRS were consistent with previous
years of the research. Full details of the sample, fieldwork and weighting are outlined below.
Sample and fieldwork
A total of 2,414 interviews were conducted among a nationally representative sample of UK
adults aged 16 or over. The research was carried out between 14 October and 14 November
2016.
In line with previous years, the survey was conducted using a mixed-mode approach, with
the questionnaire averaging c. 25 minutes in length. Fieldwork was conducted online and
face-to-face, with 1,813 interviews conducted online, and 601 interviews conducted face-to-
face (a 75%-25% split).
The face-to-face element was designed to give everyone in the UK the chance to be
selected to take part, irrespective of whether or not they use the internet. To mitigate any
potential mode effects, respondents interviewed in the face-to-face research self-completed
the ‘Purposes’ section of the questionnaire.
Online interviews were conducted using the BBC Trust Audience Panel3, topped-up by also
using sample from ICM’s Newvista panel4. During fieldwork, interlocking quotas were set
within the four UK nations and the BBC London region by age and gender. At the UK level,
quotas were set by socioeconomic grade.
For the face-to-face fieldwork, sample points were selected through stratified random
sampling, with quotas controlling for age, gender, ethnicity and working status within each
sample point. In order to balance the impact of a high proportion of online sample, face-to-
face respondents were over-sampled in areas with a lower proportion of Census online
returns (as a proxy for likelihood to take part in an online panel).
To ensure sufficient sample sizes for robust sub-group analysis, and to ensure consistency
with previous years, boost samples were included for key sub-groups. These included the
devolved nations, black and minority ethnic groups, and the BBC North East and Cumbria
region. This was achieved through higher quotas in the online sample, and extra sample
points in the relevant region or in areas with a relatively high population of the target ethnic
groups.
3 The BBC Trust Audience Panel consists of a nationally representative sample of the public who were recruited and maintained by ICM. 4 ICM’s Newvista panel is an online research community made up of members of the public who take part in a wide variety of research projects.

BBC Trust Purpose Remit Survey 2016 – UK Report
13
The achieved sample for each group is displayed in the table below:
Combined online and face-to-face boosted samples
Sub-group Number of completed interviews
Northern Ireland 356
Wales 359
Scotland 358
Black people 156
Asian people 252
BBC North East & Cumbria 143
Weighting
The data has been weighted to the demographic profile of UK adults by age, gender,
nation/region, socioeconomic grade, and ethnicity. Weighting targets are derived from the
2011 Census and ONS population updates.
1.3 Presentation and interpretation of the data
It should be remembered that while data has been weighted to represent the population of
the UK, a sample was interviewed and not the entire population. A consequence of this is
that all results are subject to sampling tolerances, meaning that not all differences are
statistically significant. Further information about sampling tolerances is appended to this
document.
Where percentages do not add up to 100, this may be due to computer rounding, the
exclusion of “don’t know” categories, or multiple answers. Throughout the report an asterisk
(*) denotes any value of less than half of one per cent but greater than zero. Within the
charts in this report, a green circle or arrow denotes a statistically significant increase in
scores, while a red circle or arrow denotes a statistically significant decrease.
In the report, reference is made to “net” figures. This represents the balance of opinion on
attitudinal questions, and provides a useful means of comparing the results for a number of
variables.

BBC Trust Purpose Remit Survey 2016 – UK Report
14
Definition of terms
Throughout this report we refer to the terms ‘performance scores’, ‘importance scores’ and
‘performance gaps’:
• Performance scores reflect the proportion of participants who agreed slightly, agreed
strongly, or completely agreed with each statement, thus indicating that the BBC
performed well on that priority.
• Importance scores reflect the proportion of participants who thought that a statement
is quite important, very important, or vital.
• Performance gaps show the difference between a statement’s performance score
and importance score. For example, if a statement received a performance score of
57% and an importance score of 65%, it would have a performance gap of -8. This
provides a measure of how well the BBC is performing against public expectations.
For instance, it indicates where people believe a statement is important but the BBC
is not performing well on that measure (the performance gap is negative), or if the
perception is that the BBC is performing well on a statement but it isn’t important (the
performance gap is positive).
Throughout this report, unless otherwise stated, any increase or decrease mentioned in the
analysis indicates a positive or negative change in scores that is statistically significant at the
95% confidence level. For a full guide to statistical reliability, please refer to Appendix 5.
Sub-group analysis by nation is included throughout the report, and any differences in
scores between nations are not necessarily statistically significant.
© ICM Unlimited / 214465 February 2017
Report prepared by:
Gregor Jackson ([email protected]) Jennifer Bottomley ([email protected])
Toni Cundy ([email protected])
Tel: 020 7845 8300
Twitter: http://twitter.com/ICMUnlimited
Address: ICM Unlimited, Creston House, 10 Great Pulteney Street, London, W1F 9NB
Web: www.icmunlimited.com
All work conducted in accordance with ISO 20252 and ISO 27001.

BBC Trust Purpose Remit Survey 2016 – UK Report
15
2. General measures
This section explores public perceptions of the BBC’s performance on a number of general
measures, including overall impression of the BBC, how much it offers, and how likely
people would be to miss the BBC and other broadcasters.
2.1 Overall impression of the BBC
Overall, the majority of the public have a positive impression of the BBC. When asked to rate
the BBC on a scale of 1-10, more than half (58%) are favourable towards the BBC. This
represents an increase on the proportion who said the same in 2015 (55%).
Over a third (36%) are neutral about the BBC, while just one in twenty (5%) are
unfavourable. Scores are shown in Figure 2.1.
Figure 2.1: Overall impression of the BBC
The average overall impression score is 7.4, which is a rise on the 2015 score (7.3). The
2016 score is also above the long-term average of 7.0 and the 2008 value of 6.7. Trend data
for this score is shown in Figure 2.2.
Figure 2.2: Overall impression of the BBC: trend data
8
Overall, the British public continues to hold a positive
impression of the BBC
3% 8% 9% 16% 26% 17% 14%
1 2 3 4 5 6 7 8 9 10
TOTAL:
Unfavourable (1-3)
5%
TOTAL:
Favourable (8-10)
58%
QOverall. Thinking about the BBC generally, what is your overall impression on a scale of 1 to 10, where 1 means extremely
unfavourable and 10 means extremely favourable? Base: All respondents (2,414)
TOTAL:
Neutral (4-7)
36%
Mean:
7.4
Extremely
unfavourable
Extremely
favourable
Confidential: For research purposes only
9
6.7 6.7 6.6 6.7 6.8 6.6 6.87.3 7.3 7.4 7.3 7.4
0
1
2
3
4
5
6
7
8
9
10
Autumn2008
Spring2009
Autumn2009
Spring2010
Autumn2010
Spring2011
Autumn2011
Winter12/13
Autumn2013
Autumn2014
Autumn2015
Autumn2016
Mean overall impression score
The overall impression score has increased significantly, but
is broadly consistent with the trend since 2012/13
QOverall. Thinking about the BBC generally, what is your overall impression on a scale of 1 to 10, where 1 means extremely
unfavourable and 10 means extremely favourable? Base: All respondents (2,414)
Extremely
favourable
Extremely
unfavourable
Long-term average: 7.0
Confidential: For research purposes only

BBC Trust Purpose Remit Survey 2016 – UK Report
16
However, as in previous years, average ratings vary across demographic groups. The mean
overall impression scores are highest among the older age groups, with those aged 75 and
over (7.9) or 65-74 (7.8) giving a higher rating on average compared to younger groups.
There is also a clear relationship between income and overall impression of the BBC. For
instance, those from the higher socioeconomic AB and C1 grades give a higher score on
average (7.6), while those from the lower C2 and DE grades give a lower score (7.2).
However, the sub-group analysis shows no notable difference in opinion by gender or
ethnicity. Sub-group analysis for overall impression is shown in Figure 2.3 and 2.4.
Figure 2.3: Overall impression of the BBC: sub-group analysis
Within the UK nations, those in England give the highest mean score (7.5), followed by
Wales (7.3), Scotland (7.3) and Northern Ireland (6.8). However, the mean overall
impression score for Northern Ireland has declined since 2015, while scores for England and
Scotland have increased.
As would be expected, there is a clear relationship between the perceived value for money
of the licence fee, and people’s overall impressions of the BBC. Those who believe the
licence fee to be very good value for money give a higher mean rating compared to all other
groups (8.9).
11
7.3
7.5
7.5
7.2
7.3
7.2
7.6
7.8
7.9
Male
Female
16-24
25-34
35-44
45-54
55-64
65-74
75+
Mean overall impression score
7.4
7.5
7.6
7.6
7.2
7.2
White
BME
AB
C1
C2
DE
QOverall. Thinking about the BBC generally, what is your overall impression on a scale of 1 to 10, where 1 means extremely
unfavourable and 10 means extremely favourable? Base: All respondents (2,414)
BBC Trust Purpose Remit Survey 2016 – UK Report
17
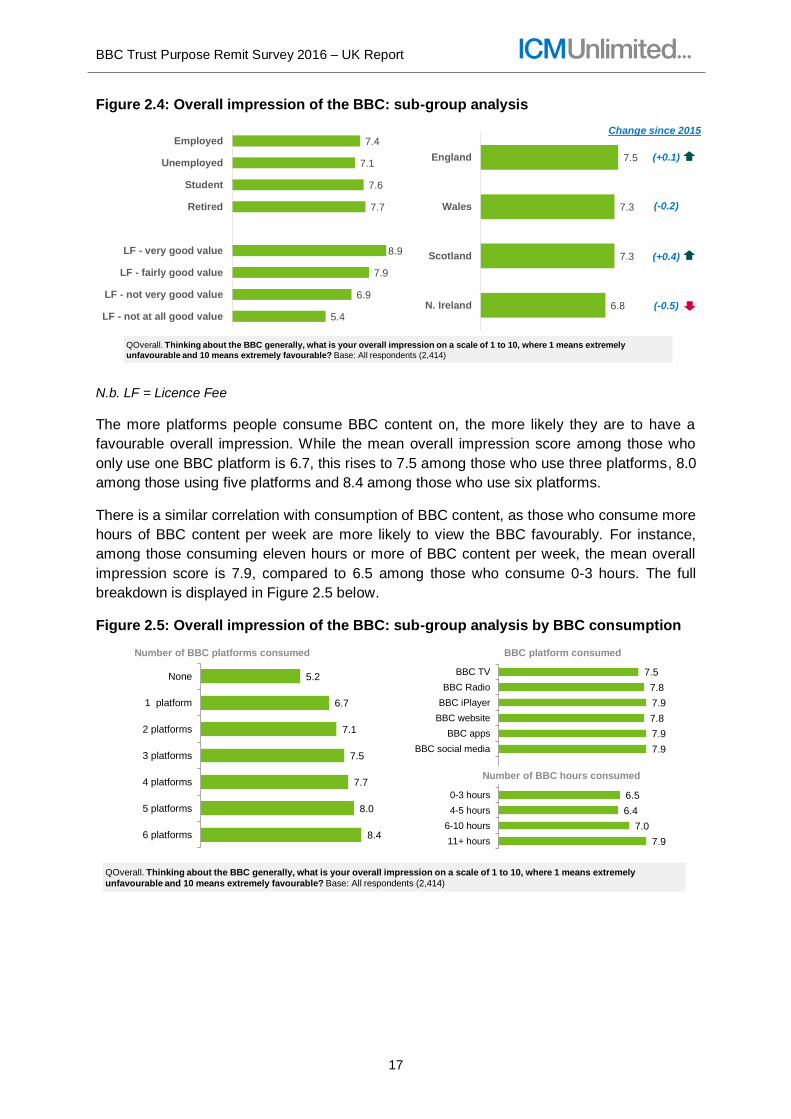
Figure 2.4: Overall impression of the BBC: sub-group analysis
N.b. LF = Licence Fee
The more platforms people consume BBC content on, the more likely they are to have a
favourable overall impression. While the mean overall impression score among those who
only use one BBC platform is 6.7, this rises to 7.5 among those who use three platforms, 8.0
among those using five platforms and 8.4 among those who use six platforms.
There is a similar correlation with consumption of BBC content, as those who consume more
hours of BBC content per week are more likely to view the BBC favourably. For instance,
among those consuming eleven hours or more of BBC content per week, the mean overall
impression score is 7.9, compared to 6.5 among those who consume 0-3 hours. The full
breakdown is displayed in Figure 2.5 below.
Figure 2.5: Overall impression of the BBC: sub-group analysis by BBC consumption
12
7.5
7.3
7.3
6.8
England
Wales
Scotland
N. Ireland
(+0.1)
(-0.2)
(+0.4)
(-0.5)
Change since 20157.4
7.1
7.6
7.7
8.9
7.9
6.9
5.4
Employed
Unemployed
Student
Retired
LF - very good value
LF - fairly good value
LF - not very good value
LF - not at all good value
QOverall. Thinking about the BBC generally, what is your overall impression on a scale of 1 to 10, where 1 means extremely
unfavourable and 10 means extremely favourable? Base: All respondents (2,414)
Confidential: For research purposes only 13
Overall impression by consumption
5.2
6.7
7.1
7.5
7.7
8.0
8.4
None
1 platform
2 platforms
3 platforms
4 platforms
5 platforms
6 platforms
Number of BBC platforms consumed
7.5
7.8
7.9
7.8
7.9
7.9
6.5
6.4
7.0
7.9
BBC TV
BBC Radio
BBC iPlayer
BBC website
BBC apps
BBC social media
0-3 hours
4-5 hours
6-10 hours
11+ hours
BBC platform consumed
Number of BBC hours consumed
QOverall. Thinking about the BBC generally, what is your overall impression on a scale of 1 to 10, where 1 means extremely
unfavourable and 10 means extremely favourable? Base: All respondents (2,414)

BBC Trust Purpose Remit Survey 2016 – UK Report
18
As in 2015, overall impressions of the BBC also vary by subjective income. People who felt
they were ‘living comfortably’ or ‘doing alright’ (7.6) gave higher ratings for their overall
impression of the BBC compared to those who said they were ‘finding it very/quite difficult’
(6.9). This is illustrated in Figure 2.6 below.
Figure 2.6: Overall impression of the BBC: sub-group analysis by subjective income
2.2 Likelihood to miss the BBC and other broadcasters
Around eight in ten people (78%) say they would miss the BBC if it wasn’t there. This score
is consistent with results for 2013, 2014 and 2015 (all 78%), but remains lower than the 2008
– 2012 average of 82%.
However, over the same period, several other broadcasters have seen increases on this
measure. The scores for ITV (70%), Channel 4 (60%), Sky (46%) and Channel 5 (42%) have
all increased since 2015, which suggests that last year’s dip on this measure is likely to have
been an outlier.
Overall, the BBC remains the broadcaster most likely to be missed by the public. Trend data
for all broadcasters in shown in Figure 2.7.
Figure 2.7: Likelihood to miss the BBC and other broadcasters: trend data
Confidential: For research purposes only 14
7.8
7.6
7.3
7.2
6.3
Living comfortably
Doing alright
Just about getting by
Finding it quite difficult
Finding it very difficult
7.6
6.9
QOverall. Thinking about the BBC generally, what is your overall impression on a scale of 1 to 10, where 1 means extremely
unfavourable and 10 means extremely favourable? Base: All respondents (2,414)
Confidential: For research purposes only 18
QMISS. To what extent do you agree or disagree with each statement? I would miss ... if it wasn’t there
Base: All respondents (n=2,414)
81%85%
81% 83% 81%79%
82% 80% 78% 78% 78% 78%
69% 68%71%
74% 74%69% 72% 70% 71%
69% 65%70%
57%62%
58%64%
61%64% 63% 64% 64%
61%57% 60%
36%40% 40% 42% 41%
37% 39%44% 45%
45%
38%42%
39%43% 44% 43% 44% 42%
47% 46%
43%
43%46%
0%
10%
20%
30%
40%
50%
60%
70%
80%
90%
100%
Autumn2008
Spring2009
Autumn2009
Spring2010
Autumn2010
Spring2011
Autumn2011
Winter12/13
Autumn2013
Autumn2014
Autumn2015
Autumn2016
% TOTAL: Agree
BBC
ITV/STV/UTV
Channel 4
Channel 5
Sky
The BBC remains the broadcaster people would most miss,
but likelihood to miss other broadcasters has increased

BBC Trust Purpose Remit Survey 2016 – UK Report
19
There have been no notable changes in likelihood to miss the BBC within any of the UK
nations. People in Wales (79%) remain most likely to say they would miss the BBC, followed
by England (78%) and Scotland (77%). This year, people in Northern Ireland (71%) are least
likely to say they would miss the BBC. Scores from the last four years are shown in Figure
2.8.
Figure 2.8: Likelihood to miss the BBC: sub-group analysis by nation
As in 2014, those aged 55 and over remain most likely to say they would miss the BBC.
However, likelihood to miss the BBC has increased among the 75+ age group (97%, a rise
of 13 percentage points). Results are shown in Figure 2.9.
Figure 2.9: Likelihood to miss the BBC: sub-group analysis by age
Unsurprisingly, those who consume the most BBC content are more likely to say they would
miss the BBC if it wasn’t there. Among those who consume least BBC content (0-3 hours per
week), half (50%) say they would miss the broadcaster if it wasn’t there. This rises to 68% of
those who consume 4-5 hours of BBC content, 74% of those who consume 6-10 hours and
86% of those who consume more than 11 hours of BBC content per week.
Similarly, those who consume BBC content via multiple platforms are more likely to say they
would miss the BBC compared to those who use only a single platform (82% compared to
65%). Analysis by number of hours and platforms consumed is shown in Figure 2.10.
Confidential: For research purposes only 15
71%77%79%78%78%
75%72%
83%78%78%
75%71%
85%79%78% 78%
74%
82%78%78%
Northern IrelandScotlandWalesEnglandUK
The proportion agreeing they’d miss the BBC remains stable
in the UK as a whole
% Agree: ‘I would miss the BBC if it wasn't there’
QMISS. To what extent do you agree or disagree with each statement? I would miss the BBC if it wasn’t there.
Base: All respondents (n=2,414)
Confidential: For research purposes only 16
97%
87%82%80%
72%69%
74%
84%84%84%
76%77%73%73%
75+65-7455-6445-5435-4425-3416-24
Likelihood to miss the BBC has significantly increased for
over 75s, but remains broadly consistent for other age groups
QMISS. To what extent do you agree or disagree with each statement? I would miss the BBC if it wasn’t there.
Base: All respondents (n=2,414)
% Agree: ‘I would miss the BBC if it wasn't there’
BBC Trust Purpose Remit Survey 2016 – UK Report
20
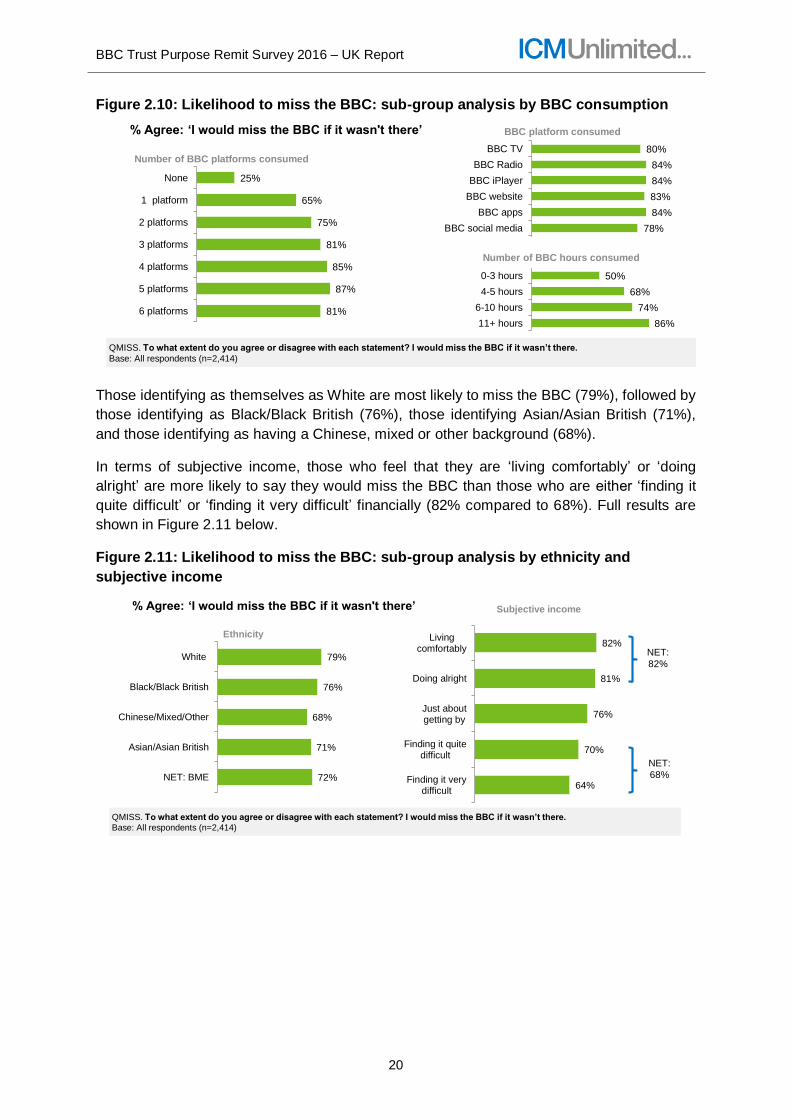
Figure 2.10: Likelihood to miss the BBC: sub-group analysis by BBC consumption
Those identifying as themselves as White are most likely to miss the BBC (79%), followed by
those identifying as Black/Black British (76%), those identifying Asian/Asian British (71%),
and those identifying as having a Chinese, mixed or other background (68%).
In terms of subjective income, those who feel that they are ‘living comfortably’ or ‘doing
alright’ are more likely to say they would miss the BBC than those who are either ‘finding it
quite difficult’ or ‘finding it very difficult’ financially (82% compared to 68%). Full results are
shown in Figure 2.11 below.
Figure 2.11: Likelihood to miss the BBC: sub-group analysis by ethnicity and
subjective income
Confidential: For research purposes only 21
Likelihood to miss the BBC increases both with BBC
consumption and with number of platforms used
QMISS. To what extent do you agree or disagree with each statement? I would miss the BBC if it wasn’t there.
Base: All respondents (n=2,414)
25%
65%
75%
81%
85%
87%
81%
None
1 platform
2 platforms
3 platforms
4 platforms
5 platforms
6 platforms
80%
84%
84%
83%
84%
78%
50%
68%
74%
86%
BBC TV
BBC Radio
BBC iPlayer
BBC website
BBC apps
BBC social media
0-3 hours
4-5 hours
6-10 hours
11+ hours
Number of BBC platforms consumed
BBC platform consumed
Number of BBC hours consumed
% Agree: ‘I would miss the BBC if it wasn't there’
Confidential: For research purposes only 22
Likelihood to miss the BBC
79%
76%
68%
71%
72%
White
Black/Black British
Chinese/Mixed/Other
Asian/Asian British
NET: BME
Ethnicity
% Agree: ‘I would miss the BBC if it wasn't there’
82%
81%
76%
70%
64%
Livingcomfortably
Doing alright
Just aboutgetting by
Finding it quitedifficult
Finding it verydifficult
Subjective income
NET:
82%
NET:
68%
QMISS. To what extent do you agree or disagree with each statement? I would miss the BBC if it wasn’t there.
Base: All respondents (n=2,414)

BBC Trust Purpose Remit Survey 2016 – UK Report
21
2.3 The BBC’s provision
In 2016, just over half the population (56%) agree that the BBC offers ‘quite a bit’, ‘a lot’, or
‘everything I need’, which is consistent with the 2015 score at the overall level.
However, in the devolved nations, people in Wales and in Northern Ireland are less likely to
feel that the BBC meets their needs compared to 2015 (51% and 38% respectively). By
contrast, ratings in England (56%) and Scotland (55%) have remained stable. Results for
each nation for the last four years are shown in Figure 2.12.
Figure 2.12: The BBC’s provision by nation
Within the BBC regions in England, people in the South West and West (69%) are most
likely to say that the BBC caters for their needs.
By contrast, those in the South East and South (52%), North East and Cumbria (54%), and
Yorkshire and Lincolnshire (54%) are least likely to feel that the BBC caters for their needs.
Results for each region are shown in Figure 2.13.
Figure 2.13: The BBC’s provision: regional sub-group analysis
Confidential: For research purposes only 18
38%
55%51%
56%56%50%50%
61%55%55%
51%49%
62%61%60%56%
50%
57%59%58%
Northern IrelandScotlandWalesEnglandUK
Ratings for the BBC’s provision have fallen significantly in
Wales and Northern Ireland
QProv. Thinking about what the BBC provides, which of these statements best applies?
Base: All UK respondents (n=2,414), England (1,341), Wales (359), Scotland (358), Northern Ireland (356).
% Agree: ‘the BBC offers a bit, a lot, or everything I need’
Confidential: For research purposes only 19
54%
69%
52%55%54%57%58%55%56%56%
Yorks &Lincolnshire
South West& West
South East& South
North WestNorth East& Cumbria
East &West
Midlands
LondonEastEnglandUK
Among BBC English regions, people living in the South West
and West are most likely to say the BBC caters for their needs
QProv. Thinking about what the BBC provides, which of these statements best applies?
Base: All respondents: UK (2,414), England (1,341), East (88), London (247), Midlands (242), NE & Cumbria (143), North West (154), SE & South
(227), SW & West (121), Yorks & Lincolnshire (119)
% Agree: ‘the BBC offers a bit, a lot, or everything I need’

BBC Trust Purpose Remit Survey 2016 – UK Report
22
Moreover, there remain clear differences in opinion by demographic background. Older
people aged 55-64 (67%) and 65 or over (77%) are more likely to feel that the BBC meets
their needs compared to their younger counterparts.
There is also a clear pattern by social grade, with those from the most affluent socio-
economic group (ABs) (63%) more likely to feel that the BBC offers at least ‘quite a bit’ of
what they need compared to those from the least affluent socio-economic group (DEs)
(47%).
As was the case with overall favourability, those who consume more hours of BBC content
are generally more likely to feel that the BBC provides what they need. Around a third or less
of those who consume 0-3 hours (32%) or 4-5 hours (25%) of BBC content per week agree
that the BBC provides at least ‘quite a bit’ of what they need, rising to half of those who
consume 6-10 hours (44%) and almost seven in ten of those who consume 11 hours or
more (67%).
The same general trend is seen when looking at the number of BBC platforms consumed.
Around a third of people who only use one BBC platform agree with this statement (36%)
compared to around half of those using two (51%) or three platforms (56%) and seven in ten
of those using four or more (67%).

BBC Trust Purpose Remit Survey 2016 – UK Report
23
3. Value for money
This section explores public perceptions of the licence fee, and the value for money it
provides.
3.1 Overall views on value for money
Almost three in five (58%) feel that their household gets ‘very good’ or ‘fairly good’ value for
money for the licence fee, which is consistent with previous years of research. Results and
trend data are shown in Figure 3.1.
Figure 3.1: Value for money
Two in five (38%) feel that they get ‘not very good value’ or ‘not at all good value’ for the
licence fee.
As seen in previous years, there is some variation by age, with older people aged 55+ being
more likely to believe that the licence fee is good value for money. While around half of
those aged under 55 (53%) believe the BBC offers good value for money, this compares to
69% of over 55s. The oldest age group aged 75+ are most likely to agree that the BBC
offers good value for money (75%), although this perception is likely to reflect the fact that
this group is exempt from paying the licence fee.
As in previous years, there is also a clear relationship between social grade and perceived
value for money provided by the licence fee. Two thirds (66%) of the most affluent socio-
economic group (ABs) believe that the BBC offers value for money, compared to just half
(51%) among the least affluent socio-economic group (DEs).
There is a similar pattern in terms of subjective income, as those who feel they are ‘living
comfortably’ or ‘doing alright’ are more likely to feel the BBC offers good value for money
than those who are ‘finding it quite difficult’ or ‘finding it very difficult’ to manage financially
(66% compared to 40%).
Across the devolved nations, perceived value for money provided by the BBC remains
broadly consistent with previous waves, with 60% of those in England, 51% in Scotland and
Confidential: For research purposes only 15
3%
18%
20%
39%
19%Very good
Fairly good
Not verygood
Not at allgood
Don't know
TOTAL:
Not
good
value
38%
TOTAL:
Good
value
58%
Almost three in five people believe the licence fee provides
value for money, in line with previous years
QValue. Thinking back over the last month and remembering the BBC programmes you and your household may have watched on TV or
heard on the radio, as well as any BBC internet sites you may have visited, to what extent do you feel your household gets value for the
licence fee you pay? Base: All respondents (n=2,414)
59%55% 58% 58% 55% 57% 56% 57% 58% 56% 57% 58%
38%42%
38% 39% 41% 39% 40% 38% 39% 40% 38% 38%
0%
10%
20%
30%
40%
50%
60%
70%
80%
90%
100% Good value for money
Poor value for money

BBC Trust Purpose Remit Survey 2016 – UK Report
24
56% in Wales saying that the BBC provides good value. However, perceived value for
money has fallen in Northern Ireland (36%).
However, there are no notable differences in opinion by gender or ethnicity. Some
demographic sub-group analysis of perceived value for money is shown in Figure 3.2.
Figure 3.2: Value for money: demographic sub-group analysis
Perceived value for money also rises in line with consumption of BBC content, which is
consistent with the pattern seen in previous years of the research. Results are shown in
Figure 3.3.
Figure 3.3: Value for money: sub-group analysis by BBC consumption
People who consume BBC content via 5 platforms (69%) or via 6 platforms (74%) are most
likely to feel it provides value for money. Similarly, those who consume more than 11 hours
of BBC content per week (67%) are also more likely to feel that the BBC offers good value
for money.
Confidential: For research purposes only 16
59%
58%
56%
53%
52%
52%
65%
72%
75%
59%
54%
Male
Female
16-24
25-34
35-44
45-54
55-64
65-74
75+
White
BME
Total: Good
value (%)
Perceived value for money increases with age and income,
but has declined significantly in Northern Ireland since 2015
QValue. Thinking back over the last month and remembering the BBC programmes you and your household may have watched on TV or
heard on the radio, as well as any BBC internet sites you may have visited, to what extent do you feel your household gets value for the
licence fee you pay? Base: All respondents (n=2,414)
66%
64%
51%
51%
57%
46%
51%
70%
60%
56%
51%
36%
AB
C1
C2
DE
Employed
Unemployed
Student
Retired
England
Wales
Scotland
N. Ireland
(+2)
(-6)
(+2)
(-10)
Change since 2015
Confidential: For research purposes only 17
31%
41%
53%
58%
68%
69%
74%
None
1 platform
2 platforms
3 platforms
4 platforms
5 platforms
6 platforms
Total: Good
value (%)
Perceived value for money of the licence fee also grows with
consumption of the BBC
QValue. Thinking back over the last month and remembering the BBC programmes you and your household may have watched on TV or
heard on the radio, as well as any BBC internet sites you may have visited, to what extent do you feel your household gets value for the
licence fee you pay? Base: All respondents (n=2,414)
60%
65%
67%
65%
67%
62%
39%
32%
53%
67%
BBC TV
BBC Radio
BBC iPlayer
BBC website
BBC apps
BBC social media
0-3 hours
4-5 hours
6-10 hours
11+ hours
Number of BBC platforms consumed BBC platform consumed
Number of BBC hours consumed

BBC Trust Purpose Remit Survey 2016 – UK Report
25
4. Creativity Stimulating creativity and cultural excellence
4.1 Overall views on the Creativity purpose
The BBC’s performance against the Creativity purpose overall has remained stable since the
previous survey in Autumn 2015. The average performance score across all statements is
60% (2015: 61%) and the average importance score is 66% (2015: 66%).
Three quarters (73%) agree that the BBC makes high quality programmes or online content.
While agreement on this measure has fallen since 2015, it remains the highest performing
statement for the Creativity purpose. There have also been declines on the measures ‘The
BBC provides programmes and online content which cover a wide range of cultural activities’
and ‘The BBC makes programmes or online content that no other broadcaster would make’.
Only two in five (42%) agree that BBC programmes or online content sometimes make them
want to take part in a specific event or activity. While this represents an increase on 2015, it
remains the lowest performing statement for this purpose.
The performance scores and performance gaps for statements in this section are
summarised below in Figure 4.1.
Figure 4.1: Creativity: performance scores
The average performance and importance scores for the Creativity purpose are in line with
the trend over the past 6 years, as shown in Figure 4.2. The 2015 score of 60% is higher
than the 2008 score of 55%.
26Confidential: For research purposes only
73%
72%
71%
59%
58%
55%
49%
42%
The BBC makes high quality programmes or online content
The BBC has a wide range of enjoyable and entertainingprogrammes and online content
The BBC provides programmes and online content which cover awide range of cultural activities
The BBC has lots of fresh and new ideas
The BBC introduces me to new presenters, actors, writers andmusical artists from the UK
The BBC helps me enjoy my interests, hobbies and passions
The BBC makes programmes or online content that no otherbroadcaster would make
Programmes or online content on the BBC sometimes make mewant to take part in a specific event or activity
Performance (i.e. Agree strongly + Agree slightly)
QPerfCreativity. To what extent do you agree or disagree with the following statements? Base: All respondents (n=2,414)
QImpCreativity. How important or unimportant for you personally is it that…? Base: All respondents (n=2,414)
There has been a significant decline in the BBC’s performance
on producing high quality and distinctive content
Change
since 2015
-3
0
-3
-1
-2
+1
-4
+5
Performance
Gap*
-7
-5
0
-17
+2
-7
-16
-2
* = Agreement minus Importance

BBC Trust Purpose Remit Survey 2016 – UK Report
26
Figure 4.2: Creativity: trend data
4.1.1 Differences by nation
There is also a notable difference in performance scores across the different nations. On
average, England (61%) and Scotland (59%) give the highest performance scores, both
close to the UK average (60%). By contrast, performance scores have fallen slightly in
Wales (56%) and Northern Ireland (50%) compared to 2015.The full breakdown of average
performance scores by nation is displayed in Figure 4.3 below.
Figure 4.3: Creativity: average performance scores by nation
The statement in which the Northern Ireland score differed the most from the UK average
was ‘the BBC has a wide range of enjoyable and entertaining content’ where the value of
58% was fourteen points below the UK average (72%).
27Confidential: For research purposes only
55%
60%
55%58% 57%
56%
60% 59%61%
62%61%
60%
64%67%
65% 66%64% 63%
66% 67% 67% 67% 66% 66%
40%
45%
50%
55%
60%
65%
70%
75%
80%
Autumn2008
Spring2009
Autumn2009
Spring2010
Autumn2010
Spring2011
Autumn2011
Winter12/13
Autumn2013
Autumn2014
Autumn2015
Autumn2016
Performance(%)
Importance(%)
However, the average performance score for the Creativity
purpose remains consistent year-on-year
-9 -8 -9 -7 -7 -6 -6 -9 -6 -4 -5 Performance
gap
QPerfCreativity. To what extent do you agree or disagree with the following statements? Base: All respondents (n=2,414)
QImpCreativity. How important or unimportant for you personally is it that…? Base: All respondents (n=2,414)
-6
23Confidential: For research purposes only
50%
59%56%
61%60%55%
58%63%61%61% 61%
56%
64%63%62%
Northern IrelandScotlandWalesEnglandUK
QPerfCreativity. To what extent do you agree or disagree with the following statements?
Base: All respondents: England (1,341), Wales (359), Scotland (358), Northern Ireland (356).
Average Creativity performance
The BBC’s average performance score for the Creativity
purpose has declined in Wales and Northern Ireland
BBC Trust Purpose Remit Survey 2016 – UK Report
27
4.1.2 Differences by demographic variables
The relationship between social grade and perceived performance on Creativity is
demonstrated again in the 2016 survey, as those in the least affluent socio-economic group
consistently give lower performance scores than the most affluent socio-economic group .
Older people, especially those aged over 75, are also more likely to agree with the Creativity
purpose performance statements.
For the Creativity purpose, as with all purposes, there is a clear pattern in scores related to
subjective income; those who feel they are ‘living comfortably’ or ‘doing alright’ consistently
give higher scores than those who are ‘finding it difficult’ financially. In the case of overall
averages for the Creativity purpose, the average score for those ‘living comfortably’ is 68%,
eight points higher than the overall score, but those ‘finding it very difficult’ gave an average
score of 41%, nineteen points below the average.
4.2 Fresh and new ideas
Three in five (59%) people agree that the BBC has lots of fresh and new ideas, consistent
with the 2015 value of 60%. This score has been relatively stable since 2013.
Figure 4.4 shows the average performance and importance scores for this statement since
the 2008 survey. The 2016 score of 59% is higher than the 2008 score of 55%.
Figure 4.4: Fresh and new ideas: trend data
This statement continues to have the largest performance gap of all the Creativity
statements and the third largest in the PRS as a whole (-17), highlighting its perceived
importance among the UK public. However, the performance gap has improved since 2008
(-21).
Figure 4.5 displays the sub-group analysis for the BBC’s performance on this statement.
Older age groups and those from the most affluent socio-economic groups are most likely to
agree that the BBC has lots of fresh and new ideas, while those who are employed, or
currently studying or retired, are also more likely to agree than those who are unemployed.
However, there are no notable differences by gender or ethnicity.
29Confidential: For research purposes only
55%57%
52% 53%54% 54% 56% 56%
61% 62%60% 59%
76% 78%76% 75% 74% 74%
77% 79% 77% 76% 75% 76%
30%
40%
50%
60%
70%
80%
90%
100%
Autumn2008
Spring2009
Autumn2009
Spring2010
Autumn2010
Spring2011
Autumn2011
Winter12/13
Autumn2013
Autumn2014
Autumn2015
Autumn2016
Performance(%)
Importance(%)
The average performance gap for BBC ‘has lots of fresh and
new ideas’ is stable
-21 -21 -24 -21 -20 -21 -21 -23 -16 -14 -15 Performance
gap
QPerfCreativity. To what extent do you agree or disagree with the following statement? Base: All respondents (n=2,414)
QImpCreativity. How important or unimportant for you personally is it that…? Base: All respondents (n=2,414)
‘The BBC has lots of fresh and new ideas’
-17

BBC Trust Purpose Remit Survey 2016 – UK Report
28
Agreement that the BBC has ‘lots of fresh and new ideas’ also correlates positively with the
number of BBC platforms used, and the number of hours of BBC content consumed per
week.
Figure 4.5: Fresh and new ideas: sub-group analysis
Those who access BBC content in a variety of ways are much more likely to agree that the
BBC has lots of fresh and new ideas. There is also a positive correlation between the
amount of BBC content consumed per week and the performance score for this statement,
as only two in five (39%) of those who consume fewer than 3 hours of BBC content per week
agree compared to seven in ten (68%) of those who consume 11 hours or more.
4.3 Distinctive content
Half of the UK public (49%) agree that the BBC provides distinctive programmes and online
content that no other broadcaster would make. As shown in Figure 4.6, this represents a
decline on 2015 (53%), but is in line with 2012/13 (47%) and 2013 (49%).
There has also been a 3 point decline in the proportion who agree that ‘the BBC makes high
quality programmes or online content’ (73%).
In both cases, the decline is driven by a decrease in England and Wales. Figure 4.6 displays
the trend data for the statements ‘the BBC makes content that no other broadcaster would
make’ and ‘the BBC makes high quality programmes or online content’.
25Confidential: For research purposes only
QPerfCreativity. To what extent do you agree or disagree with the following statement? Base: All respondents (n=2,414)
As in 2015, the belief that the BBC has lots of fresh and new
ideas correlates positively with the number of platforms used
57%
62%
62%
56%
56%
55%
64%
62%
70%
Men
Women
16-24
25-34
35-44
45-54
55-64
65-74
75+
% Agree: ‘The BBC has lots of fresh and new ideas’
60%
55%
67%
65%
52%
52%
White
BME
AB
C2
C2
DE
26Confidential: For research purposes only
QPerfCreativity. To what extent do you agree or disagree with the following statement? Base: All respondents (n=2,414)
As in 2015, the belief that the BBC has lots of fresh and new
ideas correlates positively with the number of platforms used
60%
49%
60%
64%
60%
55%
61%
47%
Employed
Unemployed
Student
Retired
England
Wales
Scotland
N. Ireland
% Agree: ‘The BBC has lots of fresh and new ideas’
17%
45%
54%
58%
64%
73%
78%
39%
40%
51%
68%
No platforms
1 BBC platform
2 BBC platforms
3 BBC platforms
4 BBC platforms
5 BBC platforms
6 BBC platforms
0-3 hours
4-5 hours
6-1 hours
11+ hours

BBC Trust Purpose Remit Survey 2016 – UK Report
29
Figure 4.6: Distinctive content: trend data
Figure 4.7 shows the subgroup analysis for the statement ‘the BBC makes content that no
other broadcaster would make’.
Figure 4.7: Distinctive content: sub-group analysis
27Confidential: For research purposes only
73%
49%
76%
53%
76%
52%
76%
49%
76%
47%
QPerfCreativity. To what extent do you agree or disagree with the following statement? Base: All respondents (n=2,414)
QImpCreativity. How important or unimportant for you personally is it that…? Base: All respondents (n=2,414)
-16Performance
gaps
‘Makes content no other
broadcaster would make’
‘High quality programmes
and content’
-11-12-11 -7-5-3-4
The proportion who believe the BBC is distinctive has fallen,
but is in line with the figures recorded in 2012/2013
-7-16
30Confidential: For research purposes only
QPerfCreativity. To what extent do you agree or disagree with the following statement? Base: All respondents (n=2,414)
Older people and those who access the BBC via multiple
platforms are most likely to say the BBC is ‘distinctive’
50%
48%
49%
45%
47%
49%
51%
53%
55%
Men
Women
16-24
25-34
35-44
45-54
55-64
65-74
75+
% Agree: ‘The BBC makes programmes/online content that no other broadcaster would make’
49%
52%
59%
53%
38%
44%
White
BME
AB
C2
C2
DE
31Confidential: For research purposes only
QPerfCreativity. To what extent do you agree or disagree with the following statement? Base: All respondents (n=2,414)
Older people and those who access the BBC via multiple
platforms are most likely to say the BBC is ‘distinctive’
50%
42%
51%
52%
50%
44%
46%
42%
Employed
Unemployed
Student
Retired
England
Wales
Scotland
N. Ireland
% Agree: ‘The BBC makes programmes/online content that no other broadcaster would make’
10%
34%
41%
48%
56%
62%
68%
25%
38%
39%
58%
No platforms
1 BBC platform
2 BBC platforms
3 BBC platforms
4 BBC platforms
5 BBC platforms
6 BBC platforms
0-3 hours (BBC content)
4-5 hours
6-10 hours
11+ hours

BBC Trust Purpose Remit Survey 2016 – UK Report
30
As in the case of ‘fresh and new ideas’, the more platforms people access the BBC on, the
more likely they are to agree that the BBC produces distinctive content. There is also some
variation by social grade, with those from the most affluent socio-economic group (ABs)
(59%) being more likely to agree than those from the least affluent socio-economic group
(DEs) (44%).
People in England are most likely to agree that the BBC make programmes and online
content that no other broadcaster would make, with 50% of people agreeing with this
statement compared to 46% of people in Scotland and 44% of people in Wales. As in 2015,
those in Northern Ireland remain least likely to agree with this statement (42%).
BBC Trust Purpose Remit Survey 2016 – UK Report
31
5. Citizenship Sustaining citizenship and civil society
5.1 Overall views on the Citizenship purpose
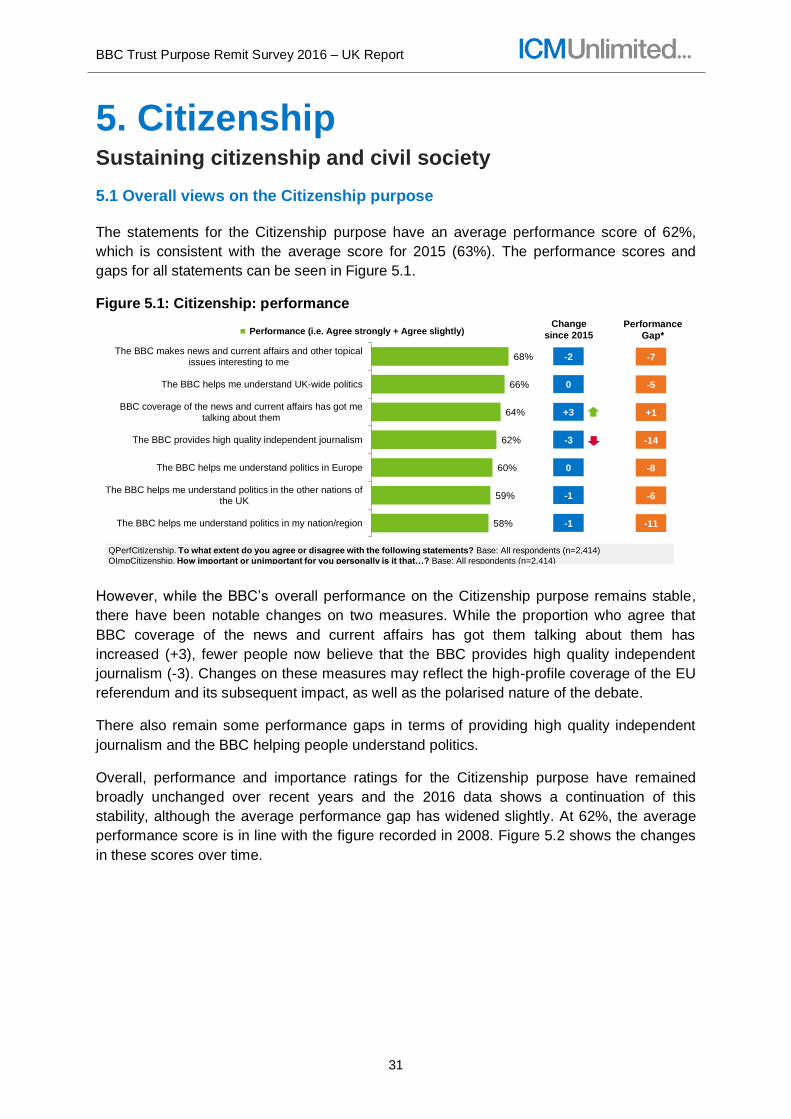
The statements for the Citizenship purpose have an average performance score of 62%,
which is consistent with the average score for 2015 (63%). The performance scores and
gaps for all statements can be seen in Figure 5.1.
Figure 5.1: Citizenship: performance
However, while the BBC’s overall performance on the Citizenship purpose remains stable,
there have been notable changes on two measures. While the proportion who agree that
BBC coverage of the news and current affairs has got them talking about them has
increased (+3), fewer people now believe that the BBC provides high quality independent
journalism (-3). Changes on these measures may reflect the high-profile coverage of the EU
referendum and its subsequent impact, as well as the polarised nature of the debate.
There also remain some performance gaps in terms of providing high quality independent
journalism and the BBC helping people understand politics.
Overall, performance and importance ratings for the Citizenship purpose have remained
broadly unchanged over recent years and the 2016 data shows a continuation of this
stability, although the average performance gap has widened slightly. At 62%, the average
performance score is in line with the figure recorded in 2008. Figure 5.2 shows the changes
in these scores over time.
40Confidential: For research purposes only
68%
66%
64%
62%
60%
59%
58%
The BBC makes news and current affairs and other topicalissues interesting to me
The BBC helps me understand UK-wide politics
BBC coverage of the news and current affairs has got metalking about them
The BBC provides high quality independent journalism
The BBC helps me understand politics in Europe
The BBC helps me understand politics in the other nations ofthe UK
The BBC helps me understand politics in my nation/region
Performance (i.e. Agree strongly + Agree slightly)
QPerfCitizenship. To what extent do you agree or disagree with the following statements? Base: All respondents (n=2,414)
QImpCitizenship. How important or unimportant for you personally is it that…? Base: All respondents (n=2,414)
Overall, the BBC’s contribution to news and current affairs
remains highly regarded
Change
since 2015
-2
0
+3
-3
0
-1
-1
Performance
Gap*
* = Agreement minus Importance
-7
-5
+1
-14
-8
-6
-11

BBC Trust Purpose Remit Survey 2016 – UK Report
32
Figure 5.2: Citizenship: trend data
5.2 Providing high quality independent journalism
Among the UK public, just over three in five (62%) agree that the BBC ‘provides high quality
independent journalism’. As shown in Figure 5.3., this is the lowest ever score recorded on
this measure, down 3 percentage points on last year and below the 2008-2011 average of
70%.
Figure 5.3: High quality independent journalism: trend data
There is some variation in agreement by age, as 59% of 16-34s agree that the BBC provides
high quality journalism, compared to 60% of 35-54s and 67% of those aged 55 and over.
While the scores in the individual nations do not differ greatly from the UK mean, the
performance score for this statement has declined in England since 2015, from 66% to 62%.
Figure 5.4 shows performance scores and gaps for this statement across all four nations,
and the UK overall for the last three years.
41Confidential: For research purposes only
63%
66%
62%
63%
62%60%
63% 62%64% 64%
63%62%
65%
70%
66%
62%
63% 62%
66%
69% 69%68% 69%
70%
40%
45%
50%
55%
60%
65%
70%
75%
80%
Autumn2008
Spring2009
Autumn2009
Spring2010
Autumn2010
Spring2011
Autumn2011
Winter12/13
Autumn2013
Autumn2014
Autumn2015
Autumn2016
Performance(%)
Importance(%)
The average performance gap for the Citizenship purpose
has widened slightly over the last two years
-2 -4 -4 +1 -1 -1 -3 -7 -4 -4 -6 Performance
gap
QPerfCitizenship. To what extent do you agree or disagree with the following statements? Base: All respondents (n=2,414)
QImpCitizenship. How important or unimportant for you personally is it that…? Base: All respondents (n=2,414)
-8
42Confidential: For research purposes only
70%73%
68%
72%
71%69% 70%
65% 66% 66% 65%62%
75%79%
75%
72%
74%72%
76%78%
76% 75%77% 76%
40%
50%
60%
70%
80%
90%
100%
Autumn2008
Spring2009
Autumn2009
Spring2010
Autumn2010
Spring2011
Autumn2011
Winter12/13
Autumn2013
Autumn2014
Autumn2015
Autumn2016
Performance(%)
Importance(%)
The performance score for ‘the BBC provides high quality
independent journalism’ is at its lowest ever point
-5 -6 -7 -1 -3 -3 -6 -13 -10 -9 -12 Performance
gap
QPerfCitizenship. To what extent do you agree or disagree with the following statements? Base: All respondents (n=2,414)
QImpCitizenship. How important or unimportant for you personally is it that…? Base: All respondents (n=2,414)
‘The BBC provides high quality independent journalism’
-14

BBC Trust Purpose Remit Survey 2016 – UK Report
33
Figure 5.4: High quality independent journalism: performance scores by nation
5.3 Understanding politics in the nations
As illustrated by Figure 5.5, overall, a majority of the UK public believe the BBC helps them
understand politics in their nation or region (58%). Around three in five feel that the BBC
helps them understand politics in their nation / region in Wales (61%), England (58%) and
Scotland (63%). In Northern Ireland, just over half (52%) say the same of their own nation.
Figure 5.5: Understanding politics in the nations: performance scores by nation
The Scottish performance score for ‘the BBC helps me understand politics in Scotland’ has
returned to its pre-referendum peak, and is in line with the rating of 64% recorded in Winter
2012/13, as shown in Figure 5.6.
36Confidential: For research purposes only
60%62%64%62%62% 62%62%65%66%65%
71%
56%
69%66%66%
Northern IrelandScotlandWalesEnglandUK
The BBC ‘provides high quality independent journalism’
score has declined significantly in England since 2015
QPerfCitizenship. To what extent do you agree or disagree with the following statement? Base: All respondents (n=2,414)
QImpCitizenship. How important or unimportant for you personally is it that…? Base: All respondents (n=2,414)
-14 -15 -9 -12 -9
2016
Performance
gap
38Confidential: For research purposes only
52%
63%61%58%58% 59%59%
66%
58%59%
69%
55%
64%59%59%
Northern IrelandScotlandWalesEnglandUK
The BBC ‘helps me understand politics’ score has fallen slightly
in Wales and Northern Ireland, but increased in Scotland
QPerfCitizenship. To what extent do you agree or disagree with the following statement? Base: All respondents (n=2,414)
QImpCitizenship. How important or unimportant for you personally is it that…? Base: All respondents (n=2,414)
-11 -11 -8 -12 -15
2016
Performance
gap

BBC Trust Purpose Remit Survey 2016 – UK Report
34
Figure 5.6: Understanding politics in Scotland: trend data
39Confidential: For research purposes only
57% 55%60%
56% 54%52%
60%64%
51%55%
59%63%
70%
65%63%
57%64%
67% 69%74%
71% 73% 74%75%
20%
30%
40%
50%
60%
70%
80%
90%
Autumn2008
Spring2009
Autumn2009
Spring2010
Autumn2010
Spring2011
Autumn2011
Winter12/13
Autumn2013
Autumn2014
Autumn2015
Autumn2016
Performance (%)
Importance (%)
But the ‘understanding politics in Scotland’ performance
metric has continued the improvement seen last year
-13 -10 -3 0 -11 -15 -9 -10 -20 -18 -15 Performance
gap
QPerfCitizenship. To what extent do you agree or disagree with the following statement? Base: All respondents in Scotland (n=358)
QImpCitizenship. How important or unimportant for you personally is it that…? Base: All respondents in Scotland (n=358)
Perception gap
England -11
Wales -8
Scotland -12
N. Ireland -15
‘The BBC helps me understand politics in Scotland’
-12
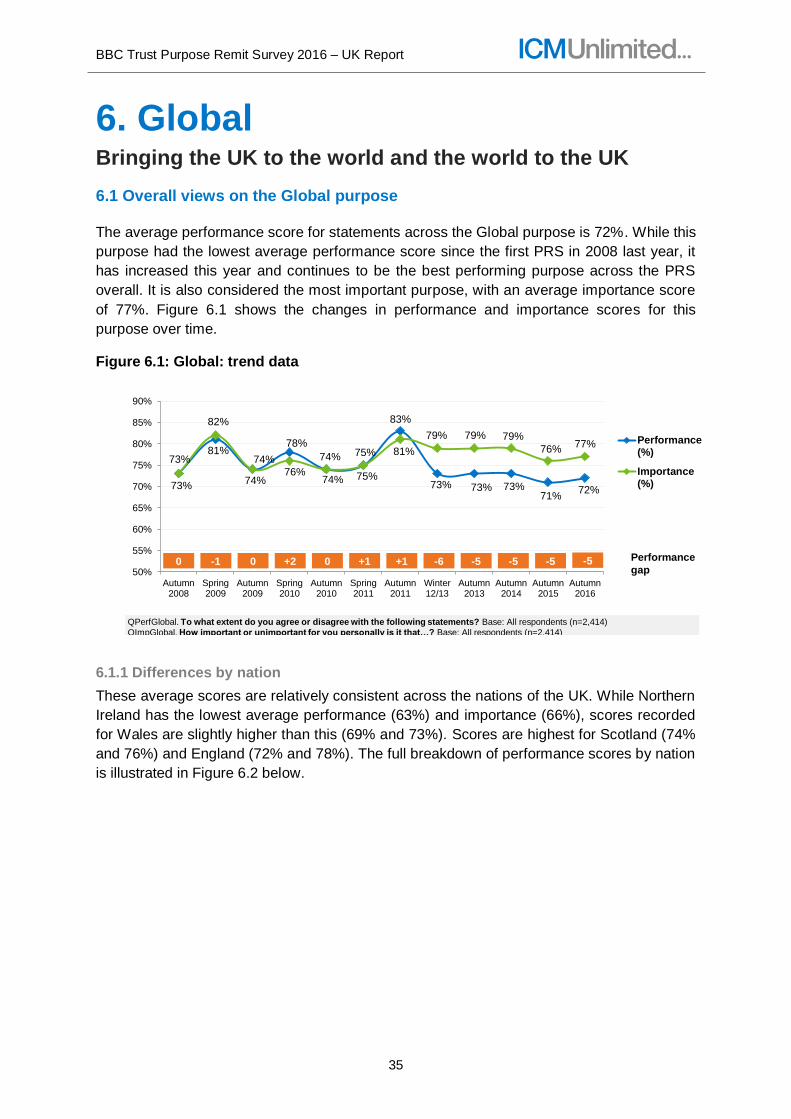
BBC Trust Purpose Remit Survey 2016 – UK Report
35
6. Global Bringing the UK to the world and the world to the UK
6.1 Overall views on the Global purpose
The average performance score for statements across the Global purpose is 72%. While this
purpose had the lowest average performance score since the first PRS in 2008 last year, it
has increased this year and continues to be the best performing purpose across the PRS
overall. It is also considered the most important purpose, with an average importance score
of 77%. Figure 6.1 shows the changes in performance and importance scores for this
purpose over time.
Figure 6.1: Global: trend data
6.1.1 Differences by nation
These average scores are relatively consistent across the nations of the UK. While Northern
Ireland has the lowest average performance (63%) and importance (66%), scores recorded
for Wales are slightly higher than this (69% and 73%). Scores are highest for Scotland (74%
and 76%) and England (72% and 78%). The full breakdown of performance scores by nation
is illustrated in Figure 6.2 below.
45Confidential: For research purposes only
73%
81%
74%
78%
74% 75%
83%
73% 73% 73%71%
72%
73%
82%
74%
76%
74% 75% 81%
79% 79% 79%
76%77%
50%
55%
60%
65%
70%
75%
80%
85%
90%
Autumn2008
Spring2009
Autumn2009
Spring2010
Autumn2010
Spring2011
Autumn2011
Winter12/13
Autumn2013
Autumn2014
Autumn2015
Autumn2016
Performance(%)
Importance(%)
The average Global purpose performance score is consistent
with the trend over the last 5 years
0 -1 0 +2 0 +1 +1 -6 -5 -5 -5 Performance
gap
QPerfGlobal. To what extent do you agree or disagree with the following statements? Base: All respondents (n=2,414)
QImpGlobal. How important or unimportant for you personally is it that…? Base: All respondents (n=2,414)
-5

BBC Trust Purpose Remit Survey 2016 – UK Report
36
Figure 6.2: Global: average performance scores by nation
Again, there is a general trend related to age as the average scores given by older people
across this purpose tend to be higher than those given by younger people. However, the
difference is not as marked as for other purposes.
6.2 Performance on Global statements
The statement, ‘the BBC helps me understand what is going on in the wider world’ scored
highest of all statements of the Global purpose, and highest of all statements in the Purpose
Remit Survey overall, at 78%. The performance score is in line with last year’s result (77%).
This has consistently been the case for most years of the Purpose Remit Survey.
Performance for all three statements is shown in Figure 6.3.
Figure 6.3: Global: performance
Despite a decrease last year, the performance score for ‘presenting a positive image’ has
increased by 1 percentage point this year and is in keeping with the longer-term trend, as
shown in Figure 6.4.
43Confidential: For research purposes only
63%
74%69%
72%72%68%69%
73%72%71% 73%
63%
71%74%73%
Northern IrelandScotlandWalesEnglandUK
QPerfGlobal. To what extent do you agree or disagree with the following statements?
Base: All respondents: England (1,341), Wales (359), Scotland (358), Northern Ireland (356).
Average Global performance
The BBC’s average performance for the Global purpose has
continued to improve in Scotland, but also continued to decline in NI
44Confidential: For research purposes only
78%
72%
66%
The BBC helps me understand what is going on inthe wider world, such as international news and
events
The BBC helps me understand the cultures andlifestyles of people from around the world
The BBC is good at presenting a positive image ofthe UK to the rest of the world
Performance (i.e. Agree strongly + Agree slightly)
QPerfGlobal. To what extent do you agree or disagree with the following statements? Base: All respondents (n=2,414)
QImpGlobal. How important or unimportant for you personally is it that…? Base: All respondents (n=2,414)
The BBC’s performance against the Global purpose has
remained stable since the previous survey
Change
since 2015
+1
0
+1
Performance
Gap*
* = Agreement minus Importance
-3
-2
-10

BBC Trust Purpose Remit Survey 2016 – UK Report
37
Figure 6.4: Presenting a positive image of the UK: trend data
In 2016, there is a notable difference in opinion by ethnicity, with two thirds of White British
people (65%) and seven in ten people from ethnic minority backgrounds (71%) agreeing that
the BBC presents a positive image of the UK, as shown in Figure 6.55.
The perception that the BBC ‘is good at presenting a positive image of the UK to the rest of
the world’ is consistent across most different types of BBC platforms used, but is lowest in
those who consume BBC TV and highest in those who consume BBC social media.
Figure 6.5: Presenting a positive image of the UK: sub-group analysis
5 Nb. Figures are displayed for Christianity, Islam and Hinduism as the base size for these faiths was large enough for analysis (Christianity: 866; Islam: 101; Hinduism: 57). Base sizes for Judaism (n=7) and Sikhism (n=19) are too small for analysis.
47Confidential: For research purposes only
66% 67% 69%65% 66%
79% 79% 77% 76% 76%
0%
20%
40%
60%
80%
100%
Autumn2008
Spring2009
Autumn2009
Spring2010
Autumn2010
Spring2011
Autumn2011
Winter12/13
Autumn2013
Autumn2014
Autumn2015
Autumn2016
Performance(%)
Importance(%)
-13 -12 -9 -11 Performance
gap
QPerfGlobal. To what extent do you agree or disagree with the following statement? Base: All respondents (n=2,414)
QImpGlobal. How important or unimportant for you personally is it that…? Base: All respondents (n=2,414)
‘The BBC is good at presenting a positive image of the UK to
the rest of the world’ performs in line with the long-term trend
‘The BBC is good at presenting a positive image of the UK to the rest of the world’
-10
48Confidential: For research purposes only
QPerfGlobal. To what extent do you agree or disagree with the following statement? Base: All respondents (n=2,414)
QImpGlobal. How important or unimportant for you personally is it that…? Base: All respondents (n=2,414)
The perception that the BBC ‘is good at presenting a positive
image of the UK’ is consistent across platforms
68%
72%
72%
71%
72%
74%
BBC TV
BBC Radio
BBC iPlayer
BBC website
BBC apps
BBC social media
BBC platform consumed65%
69%
71%
72%
71%
71%
62%
72%
68%
71%
63%
White
Mixed
Asian
Black
NET: BAME
Religious
Non-religious
Follow Christianity
Follow another religion
Follow Hinduism
Follow Islam
Ethnicity
Religion / faith
% Agree: ‘The BBC is good at presenting a positive image of the UK to the rest of the world’

BBC Trust Purpose Remit Survey 2016 – UK Report
38
7. Nations, regions &
communities Representing the UK, its nations, regions and communities
7.1 Overall views on the Nations, regions & communities purpose
The Nations, regions & communities purpose achieved an average performance score of
51% across all statements which is consistent with recent years. Although this continues to
be the lowest performing purpose in the PRS, this score is higher than the score achieved in
2008 (44%). Figure 7.1 shows the trend data for average performance and importance
scores over time.
Figure 7.1: Nations, regions and communities: trend data
There have been some increases in several measures for this purpose, showing a recovery
following the declines seen last year, as shown in Figure 7.2. These include the proportion
of people who agree that ‘my regional BBC content provides programmes and online content
for people like me’ (61% vs 59% last year), ‘the BBC is good at representing life in my
nation/region in drama and entertainment’ (57% vs 55% last year) and ‘in news and current
affairs programming’ (56% vs 54% last year).
52Confidential: For research purposes only
44% 45%48%
45%
51%47% 48% 48% 52% 52% 51% 51%
58%54% 57%
51%
60%
51%53%
63% 64% 64% 62% 62%
0%
10%
20%
30%
40%
50%
60%
70%
80%
90%
100%
Autumn2008
Spring2009
Autumn2009
Spring2010
Autumn2010
Spring2011
Autumn2011
Winter12/13
Autumn2013
Autumn2014
Autumn2015
Autumn2016
Performance(%)
Importance(%)
Average performance/importance and the performance gap
for the Nations purpose are unchanged since 2015
QPerfNations. To what extent do you agree or disagree with the following statements? Base: All respondents (n=2,414) unless stated
QImpNations. How important or unimportant for you personally is it that…? Base: All respondents (n=2,414) unless stated
-14 -9 -9 -5 -9 -4 -5 -15 -12 -12 -11 Performance
gap-11

BBC Trust Purpose Remit Survey 2016 – UK Report
39
Figure 7.2: Nations, regions and communities: performance (1 of 2)
Unlike last year, there is no notable variation by ethnicity when looking at the average scores
across all statements for this purpose. Those who identify as White give a score of 51%,
those who identify as Asian/Asian British give a score of 53%, and those who identify as
Black/Black British give a score of 52%.
7.2 Nations, regions and communities: differences by nation
In a pattern which is consistent across several of the purposes this year, there is variation by
nation for the Nations, regions and communities purpose. England and Scotland have the
highest scores for this purpose (52% and 53% respectively). In contrast, scores for Wales
and Northern Ireland have fallen this year, although not significantly. Agreement in Wales fell
from 52% in 2015 to 46% in 2016, while agreement in Northern Ireland continues a
downward trend from last year, falling from 47% to 44%.
Figure 7.3 shows the average scores by nation for this purpose for the last four years.
Figure 7.3: Nations, regions and communities: sub-group analysis by nation
7.2.1 Programmes and online content for people like me
50Confidential: For research purposes only
61%
59%
57%
56%
My regional BBC content provides programmes and onlinecontent that is for people like me
The BBC supports my language with programming and othercontent (BASE: 358)
The BBC is good at representing life in my nation/region to therest of the UK in its drama, documentaries, and other
entertainment programmes and online content
The BBC is good at representing life in my nation/region to therest of the UK in its main UK news and current affairs
programmes and online content
Performance (i.e. Agree strongly + Agree slightly)
QPerfNations. To what extent do you agree or disagree with the following statements? Base: All respondents (n=2,414) unless stated
QImpNations. How important or unimportant for you personally is it that…? Base: All respondents (n=2,414) unless stated
Performance scores for the Nations purpose have improved
slightly across a number of measures
Change
since 2015
+2
-2
+2
+2
Performance
Gap*
* = Agreement minus Importance
-9
-6
-11
-13
50Confidential: For research purposes only
44%
53%
46%52%
47%49%52%51%
54%
47%52%
55% 55%
46%47%53%
Northern IrelandScotlandWalesEngland
The average Nations performance in Scotland has continued
the upward trend from 2015
QPerfNations. To what extent do you agree or disagree with the following statements?
Base: All respondents: England (1,341), Wales (359), Scotland (358), Northern Ireland (356).
Average Nations performance

BBC Trust Purpose Remit Survey 2016 – UK Report
40
In the UK overall, the proportion of people who agree that their BBC region/nation ‘provides
programmes and online content that is for people like me’ remains consistent. However,
there has been an increase on this measure in Scotland (from 57% in 2015 to 66% in 2016).
Scores by nation over this period are shown in Figure 7.4.
Figure 7.4: Providing content for people like me: sub-group analysis by nation
7.2.2 Representing the UK nations in news/current affairs and drama/entertainment
In Scotland, agreement for representing my nation in drama/entertainment has increased to
59% in 2016. Agreement for representing my nation in news/current affairs also increased,
by 3 percentage points. Scores for each nation over this period are shown in Figure 7.5
below.
Figure 7.5: Representing the nations: sub-group analysis by nation
51Confidential: For research purposes only
56%
66%
58%61%61%
54%57%
61%60%59%62%
57%61%
65%64%69%
54%58%60%60%
Northern IrelandScotlandWalesEnglandUK
This is underpinned by a significant rise in the performance
score on ‘content for people like me’ in Scotland
‘My BBC region/nation provides programmes and online content that is for people like me’
QPerfNations. To what extent do you agree or disagree with the following statement?
Base: All respondents: England (1,341), Wales (359), Scotland (358), Northern Ireland (356).
52Confidential: For research purposes only
50%
59%
51%
57%
43%
53%48%
57%
50%51%55%55%
50%50%55%54%
62%
51%
59%60%61%
48%
55%
61%
NorthernIreland
ScotlandWalesEnglandNorthernIreland
ScotlandWalesEngland
Performance score for ‘representing my nation/ region in
drama’ has also increased significantly in Scotland
‘Representing my nation/region in
news/current affairs’
‘Representing my nation/region in
drama/entertainment’
QPerfNations. To what extent do you agree or disagree with the following statements?
Base: All respondents: England (1,341), Wales (359), Scotland (358), Northern Ireland (356).

BBC Trust Purpose Remit Survey 2016 – UK Report
41
7.3 Representing the English regions
There is variation in agreement across the English regions when asked if their BBC region
represents them. Figure 7.6 shows the scores for the English regions regarding
representation of the region in both news/current affairs and drama/entertainment, as well as
the provision of content for ‘people like me’.
Figure 7.6: Nations, regions and communities: representing English regions
The lowest average scores for representation of particular regions in news/current affairs or
drama/entertainment were given in:
• North East and Cumbria:
▪ 50% for news/current affairs
▪ 52% for drama/entertainment
• South East and South:
▪ 51% for news/current affairs
▪ 51% for drama/entertainment
By contrast, the highest scores were given in:
• London:
▪ 72% for representation in news/current affairs
▪ 69% for representation in drama/entertainment
• Yorks & Lincolnshire
▪ 58% for representation in news/current affairs
▪ 61% for representation in drama/entertainment
53Confidential: For research purposes only
67%
61%59%61%
54%57%
70%
50%
58%55%
51%
58%
50%55%
72%
57%61%60%
51%
60%
52%53%
69%
53%
Yorks &Lincolnshire
South West &West
South East &South
North WestNorth East &Cumbria
East & WestMidlands
LondonEast
People living in the South/SE, East and NE/Cumbria are less
likely to feel the BBC represents them
% Agree
QPerfNations. To what extent do you agree or disagree with the following statements? Base: All respondents: East (88), London (247),
Midlands (242), NE & Cumbria (143), North West (154), SE & South (227), SW & West (121), Yorks & Lincolnshire (119)

BBC Trust Purpose Remit Survey 2016 – UK Report
42
People in London are most likely to feel their BBC region produces content for people like
them (70%), followed by Yorks & Lincolnshire (67%). The lowest agreement for this
statement was given in the East (50%).
7.4 Representing different communities, religions and minority ethnic groups
Overall, the amount of people who agree that ‘The BBC supports the native languages of the
UK other than English with programming and other content’ has decreased (from 53% in
2015 to 48% in 2016). However, there were no notable differences in agreement between
different native language speakers. Similarly, the scores given on this measure in Wales,
Northern Ireland and Scotland have remained consistent year-on-year, while the score given
in England has fallen (from 58% in 2015 to 47% in 2016).
Overall, 46% of the UK public feel that the BBC improves their understanding of religions
and other beliefs. Last year a decline was observed in this score (from 48% in 2014 to 44%
in 2015)..
Figure 7.7: Nations, regions and communities: performance (2 of 2)
Overall, 47% of those who follow any faith or religion agree that the BBC is good at
representing their particular faith or religion. Around half (49%) of Christians feel that the
BBC is good at representing their faith or religion, but this drops to 38% for followers of non-
Christian faiths (as per Figure 7.8)6.
6 Nb. Figures are displayed for Christianity, Islam and Hinduism as the base size for these faiths was large enough for analysis (Christianity: 797; Islam: 78; Hinduism: 39). Base sizes for Judaism (n=12) and Sikhism (n=14) are too small for analysis.
51Confidential: For research purposes only
48%
47%
46%
44%
43%
The BBC supports the native languages of the UK other thanEnglish with programming and other content
The BBC is good at representing my religion (BASE: 1,085)
The BBC improves my understanding of religions and otherbeliefs
The BBC is good at representing my ethnic group (BASE: 597)
The BBC helps me feel more involved and interested in mylocal community
Performance (i.e. Agree strongly + Agree slightly)
QPerfNations. To what extent do you agree or disagree with the following statements? Base: All respondents (n=2,414) unless stated
QImpNations. How important or unimportant for you personally is it that…? Base: All respondents (n=2,414) unless stated
The BBC’s performance is largely stable, but there are still
notable performance gaps for representing community groups
Change
since 2015
-5
+1
+2
0
Performance
Gap*
* = Agreement minus Importance
0
-4
-19
-8
-17
-13

BBC Trust Purpose Remit Survey 2016 – UK Report
43
Figure 7.8: Representing different religions
Figure 7.9 shows performance scores over the last four waves. Agreement scores amongst
non-Christians decreased in 2015 to 38% and this remains the same for 2016.
Figure 7.9: Representing different religions: Trend data
Among people from minority ethnic backgrounds7, 45% agree that the BBC is good at
representing their own ethnic group. There is little variation on this statement this year,
however this has changed from last year. Compared to 2015, Black people are less likely to
agree (43% in 2016 compared to 59% in 2015). Conversely, Chinese/Mixed/Other people
are more likely to agree this year (45% in 2016 compared to 33% in 2015). Figure 7.10
shows the trend data for this measure by ethnic group.
7 Nb. This figure includes only those from non-White backgrounds.
57Confidential: For research purposes only
Just under half agree that the BBC is good at representing their
faith or their ethnic group
47%
49%
38%
38%
46%
Follow any faith/religion
Follow Christianity
Follow any non-Christian faith
Follow Hinduism
Follow Islam
% Agree: ‘The BBC is good at representing my
faith/religion’
QPerfNations. To what extent do you agree or disagree with the following statements?
Base: All with faith/religion (1,085). Base: All ethnic minorities (454).
45%
45%
45%
43%
All ethnic minorities
Chinese / mixed /other
Asian
Black
% Agree: ‘The BBC is good at representing my
ethnic group’

BBC Trust Purpose Remit Survey 2016 – UK Report
44
Figure 7.10: Representing different ethnic groups
Confidential: For research purposes only 2
47%52%
32%
47%41%
52%
32%36%
48%44%
59%
33%
45% 45% 43% 45%
All ethnic minorities Asian Black Chinese/ Mixed/ Other
Ethnicity trend slides
QPerfNations. To what extent do you agree or disagree with the following statements?
Base: All ethnic minorities (454); Asian (218), Black (156), Chinese/Mixed/Other (154). Nb. These groupings are consistent with those used in the
analysis in previous years.
“The BBC is good at representing my ethnic group” – Agreement
-21 -20 -6-27

BBC Trust Purpose Remit Survey 2016 – UK Report
45
8. Education Promoting education and learning
8.1 Overall views on the Education purpose
Overall, statements for the Education purpose receive an average score of 67%. As in 2015,
it is the second highest performing purpose across the PRS. Last year we saw a decrease in
importance attributed to the Education statements which resulted in a narrowing of the
performance gap, a continuation of a trend from Autumn 2013. However, this year
performance remains stable (67% in 2016 compared to 68% in 2015) while importance has
increased (from 72% to 75%). Therefore, the performance gap has now widened to -8.
Figure 8.1 shows the changes in these scores over time.
Figure 8.1: Education: trend data
Agreement with Education purpose statements remains generally high. More than seven in
ten (72%) agree that they have ‘learned new things from programmes or online content on
the BBC’. More than three in five (62%) agree that ‘the BBC helps children/teenagers with
what they learn at school/college’, showing a continued high regard for the educational focus
of BBC programmes. Details are shown in Figure 8.2.
60Confidential: For research purposes only
76%72%
75%
68%70%
66%71%
68% 70% 70% 68% 67%
79%76% 80%
76% 78%
69%
76% 77% 79%75%
72%75%
0%
10%
20%
30%
40%
50%
60%
70%
80%
90%
100%
Autumn2008
Spring2009
Autumn2009
Spring2010
Autumn2010
Spring2011
Autumn2011
Winter12/13
Autumn2013
Autumn2014
Autumn2015
Autumn2016
Performance(%)
Importance(%)
The average importance score for the Education purpose has
risen significantly compared to 2015
-4 -4 -5 -7 -8 -4 -5 -9 -8 -6 -4 Performance
gap
QPerfEducation. To what extent do you agree or disagree with the following statements? Base: All respondents (n=2,414)
QImpEducation. How important or unimportant for you personally is it that…? Base: All respondents (n=2,414)
-8

BBC Trust Purpose Remit Survey 2016 – UK Report
46
Figure 8.2: Education: performance
8.1.1 Analysis by children in household
As illustrated by Figure 8.3, 66% of parents with children in their household rate the BBC’s
educational role in helping children and teens with what they learn at school/college,
compared to 63% of those without children in the household. Sixty-nine percent of parents
with children in their household agree they have learned new things from the BBC,
compared to 74% of those without children in the household.
Figure 8.3: Education: sub-group analysis by children in household
Figure 8.4 shows the breakdown of performance scores for the statement ‘the BBC helps
children/teens with what they learn at school/college’ by the ages of children in the
household. There has been an increase in importance for this statement for those with
children in all age groups, while there has been a decline in performance for those with
children aged 0-4 and 16-18.
59Confidential: For research purposes only
72%
62%
I have learned new things from programmes oronline content on the BBC
The BBC helps children/teenagers with what theylearn at school/college
Performance (i.e. Agree strongly + Agree slightly)
QPerfEducation. To what extent do you agree or disagree with the following statements? Base: All respondents (n=2,414)
QImpEducation. How important or unimportant for you personally is it that…? Base: All respondents (n=2,414)
The BBC continues to be highly regarded in terms of the
educational focus of its programmes
Change
since 2015
+1
-2
Performance
Gap*
* = Agreement minus Importance
-3
-12
61Confidential: For research purposes only
69%74%
66%63%
Children aged 18 & under in householdNo children aged 18 & under in household
Have learned new things from BBC programmes or online content
The BBC helps children/teens with what they learn at school/college% Agree
QPerfEducation. To what extent do you agree or disagree with the following statements? Base: All with children (766), All without children in
household (1,210). QImpEducation. How important or unimportant for you personally is it that…?
-11 -12
2016
Performance
gap-2 -7
Parents with children in their household are slightly more likely
to rate the BBC’s educational role in helping children / teens
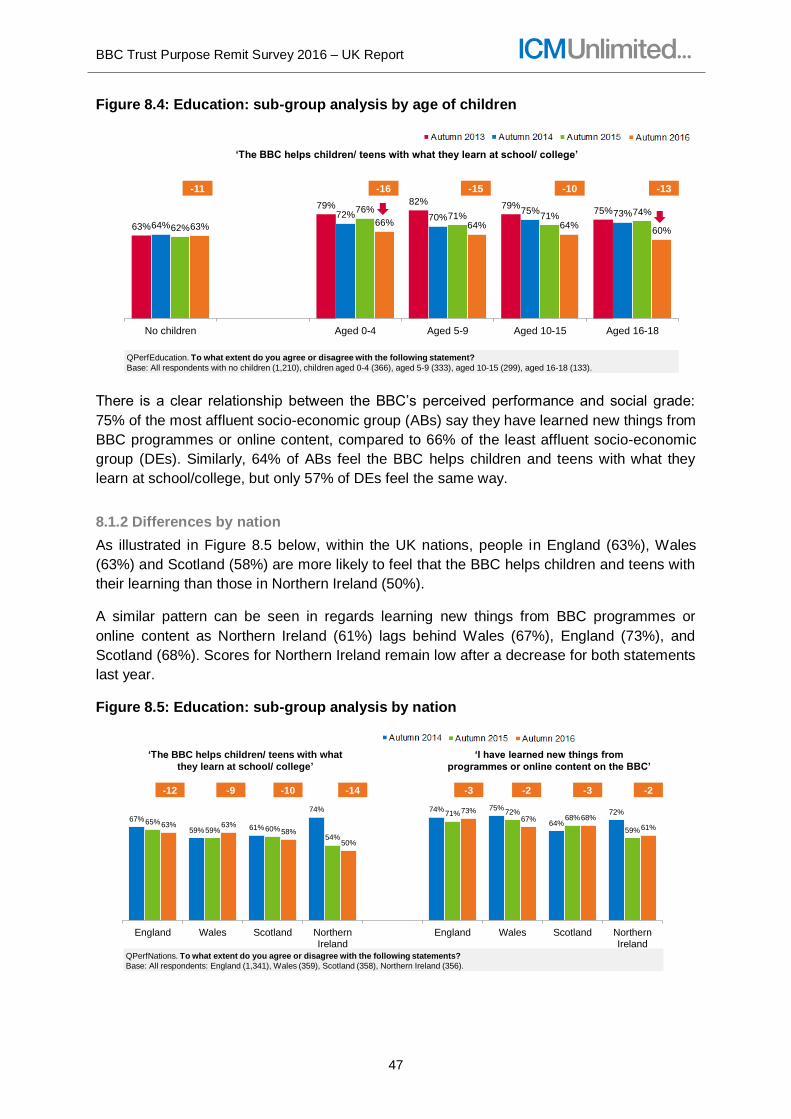
BBC Trust Purpose Remit Survey 2016 – UK Report
47
Figure 8.4: Education: sub-group analysis by age of children
There is a clear relationship between the BBC’s perceived performance and social grade:
75% of the most affluent socio-economic group (ABs) say they have learned new things from
BBC programmes or online content, compared to 66% of the least affluent socio-economic
group (DEs). Similarly, 64% of ABs feel the BBC helps children and teens with what they
learn at school/college, but only 57% of DEs feel the same way.
8.1.2 Differences by nation
As illustrated in Figure 8.5 below, within the UK nations, people in England (63%), Wales
(63%) and Scotland (58%) are more likely to feel that the BBC helps children and teens with
their learning than those in Northern Ireland (50%).
A similar pattern can be seen in regards learning new things from BBC programmes or
online content as Northern Ireland (61%) lags behind Wales (67%), England (73%), and
Scotland (68%). Scores for Northern Ireland remain low after a decrease for both statements
last year.
Figure 8.5: Education: sub-group analysis by nation
Confidential: For research purposes only 3
60%64%64%66%63%
74%71%71%76%
62%
73%75%70%72%
64%
75%79%82%79%
63%
Aged 16-18Aged 10-15Aged 5-9Aged 0-4No children
Education by age of children
‘The BBC helps children/ teens with what they learn at school/ college’
QPerfEducation. To what extent do you agree or disagree with the following statement?
Base: All respondents with no children (1,210), children aged 0-4 (366), aged 5-9 (333), aged 10-15 (299), aged 16-18 (133).
-11 -16 -15 -10 -13
Confidential: For research purposes only 4
61%
68%67%73%
50%
58%63%63%
59%
68%72%71%
54%60%59%
65%
72%
64%
75%74%74%
61%59%
67%
NorthernIreland
ScotlandWalesEnglandNorthernIreland
ScotlandWalesEngland
-10
Education nations’ scores
‘The BBC helps children/ teens with what
they learn at school/ college’
‘I have learned new things from
programmes or online content on the BBC’
QPerfNations. To what extent do you agree or disagree with the following statements?
Base: All respondents: England (1,341), Wales (359), Scotland (358), Northern Ireland (356).
-12 -9 -14 -3 -2 -2-3

BBC Trust Purpose Remit Survey 2016 – UK Report
48
8.1.3 Differences by ethnicity
There is some interesting variation by ethnicity. When it comes to their own learning, 72% of
people from white backgrounds say they have learned new things from the BBC, compared
to 68% of BMEs, although this difference is not statistically significant. Of the BME groups,
those of Black/Black British backgrounds are the most positive, with 70% saying they have
learned new things from BBC programmes or content.
Furthermore, those from BME backgrounds are just as likely to feel the BBC supports
children and teens in their learning as those from White backgrounds (both 62%). Those
from Black and Black British backgrounds are again most likely to agree, with two in three
(64%) saying this. Agreement scores by ethnicity are shown in Figure 8.6.
Figure 8.6: Education: ethnicity sub-groups
8.1.4 Differences by subjective income
In terms of subjective income, those who are ‘finding it difficult’ financially are less likely to
agree that that the BBC helps children with their learning (58%) and that they have
personally learned new things from BBC content (64%) than those who feel they are ‘living
comfortably’ or ‘doing alright’ (64% and 75% respectively). Both of these statements also
have larger performance gaps for those ‘finding it difficult’ financially (-15 for helping children
and teens with their learning, -5 for personal learning) than for those who are ‘living
comfortably’ or ‘doing alright’ (-12 and -3 respectively).
Confidential: For research purposes only 5
62%
62%
64%
60%
60%
White
NET: BME
Black/Black British
Asian/Asian British
Mixed
Education - Ethnicity
72%
68%
70%
66%
68%
White
NET: BME
Black/Black British
Asian/Asian British
Mixed
% Agree: ‘I have learned new things from
programmes or online content on the BBC’% Agree: ‘The BBC helps children/teens with
what they learn at school/college
QPerfEducation. To what extent do you agree or disagree with the following statements? QImpEducation. How important or unimportant for
you personally is it that…? Base: All respondents (n=2,414); All BME (454); White (1,960); Asian (252); Black (156); Chinese/Mixed/Other (154).
-4
-4
-1
-6
-2
-12
-10
-11
-11
-6

BBC Trust Purpose Remit Survey 2016 – UK Report
49
9. Digital Delivering to the public the benefits of emerging communications,
technologies and services
9.1 Overall views on the Digital purpose
The average performance score for the Digital purpose is 54%. Although this represents a
decrease since the 2014 score of 59%, the average score for this purpose remains high in
historical terms, as illustrated in Figure 9.1. The 2016 performance and importance scores
are also both higher than those recorded in 2008.
Figure 9.1: Digital: trend data
The decrease in average performance score has been driven by declines in the proportion of
people who agree that the BBC provides ‘quality content that I find useful or enjoyable on the
internet’ and ‘quality content that I find enjoyable or useful on BBC iPlayer’, as shown in
Figure 9.2. In addition, performance gaps have widened this year for all statements,
reflecting the increasing importance of the Digital purpose as a whole.
Figure 9.2: Digital: performance
64Confidential: For research purposes only
35%
32%
40%37% 37% 35%
41% 50%55%
59%56%
54%
34%
35%
33%31% 31% 30%
36%
54% 56%59%
57%59%
0%
10%
20%
30%
40%
50%
60%
70%
Autumn2008
Spring2009
Autumn2009
Spring2010
Autumn2010
Spring2011
Autumn2011
Winter12/13
Autumn2013
Autumn2014
Autumn2015
Autumn2016
Performance(%)
Importance(%)
+1 -3 +7 +6 +5 +5 +5 -4 -1 0 -1 Performance
gap
QPerfComms. To what extent do you agree or disagree with the following statements? Base: All respondents (n=2,414).
QImpComms. How important or unimportant for you personally is it that…? Base: All respondents (n=2,414).
-5
The performance gap for the Digital purpose has widened
slightly compared to 2015
63Confidential: For research purposes only
61%
59%
53%
52%
46%
The BBC provides quality content that I find enjoyable or usefulon the internet
The BBC provides quality content that I find enjoyable or usefulon BBC iPlayer
The BBC provides quality content that I find enjoyable or usefulon mobile phones and tablets
The BBC has helped me make the most of new technologiessuch as interactive TV and the internet
The BBC provides quality content that I find enjoyable or usefulon DAB digital radio
Performance (i.e. Agree strongly + Agree slightly)
QPerfComms. To what extent do you agree or disagree with the following statements? Base: All respondents (n=2,414).
QImpComms. How important or unimportant for you personally is it that…? Base: All respondents (n=2,414).
The BBC’s performance in terms of digital provision has fallen
significantly for its internet and iPlayer offering
Change
since 2015
-3
-3
+1
-1
Performance
Gap*
* = Agreement minus Importance
-1
-2
-5
-4
-6
-5
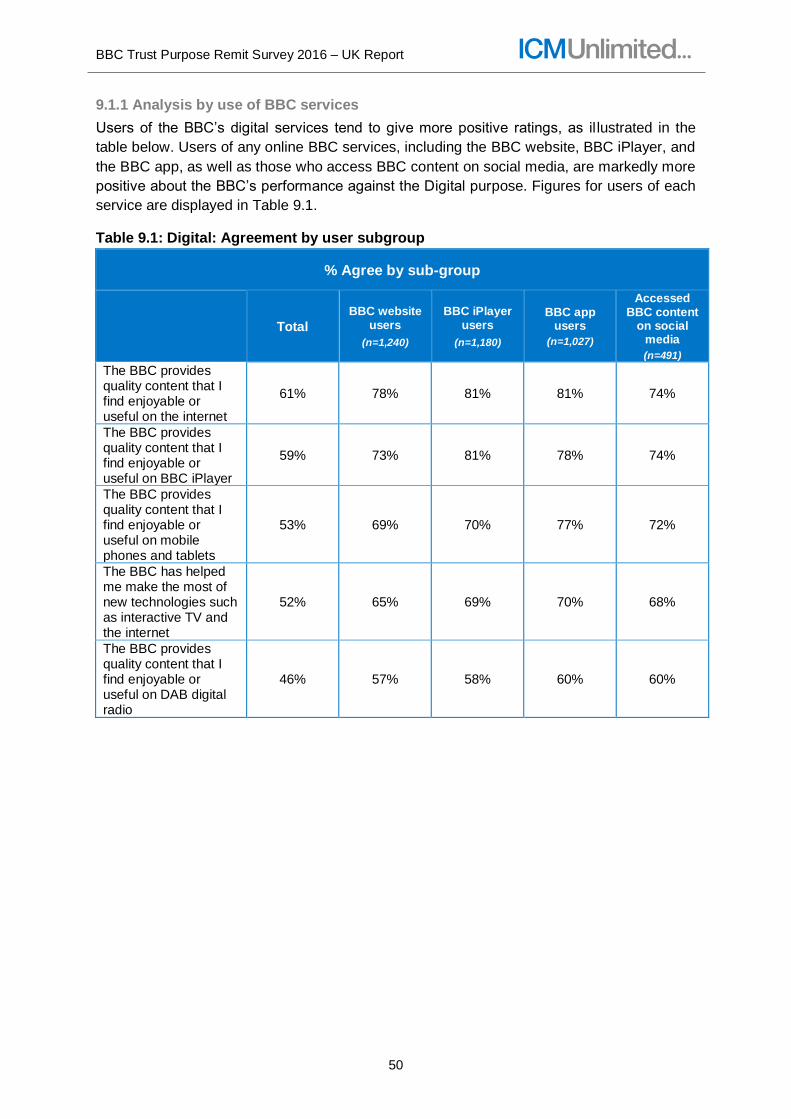
BBC Trust Purpose Remit Survey 2016 – UK Report
50
9.1.1 Analysis by use of BBC services
Users of the BBC’s digital services tend to give more positive ratings, as il lustrated in the
table below. Users of any online BBC services, including the BBC website, BBC iPlayer, and
the BBC app, as well as those who access BBC content on social media, are markedly more
positive about the BBC’s performance against the Digital purpose. Figures for users of each
service are displayed in Table 9.1.
Table 9.1: Digital: Agreement by user subgroup
% Agree by sub-group
Total
BBC website users
(n=1,240)
BBC iPlayer users
(n=1,180)
BBC app users
(n=1,027)
Accessed BBC content
on social media
(n=491)
The BBC provides quality content that I find enjoyable or useful on the internet
61% 78% 81% 81% 74%
The BBC provides quality content that I find enjoyable or useful on BBC iPlayer
59% 73% 81% 78% 74%
The BBC provides quality content that I find enjoyable or useful on mobile phones and tablets
53% 69% 70% 77% 72%
The BBC has helped me make the most of new technologies such as interactive TV and the internet
52% 65% 69% 70% 68%
The BBC provides quality content that I find enjoyable or useful on DAB digital radio
46% 57% 58% 60% 60%

BBC Trust Purpose Remit Survey 2016 – UK Report
51
9.1.2 Differences by demographic variables
Perceptions also vary by age. In particular, people aged between 25 and 34 are overall most
likely to agree with these statements, while those aged over 55 are the least likely to agree.
Levels of agreement among each age group are displayed in Table 9.2 below.
Table 9.2: Digital: Agreement by age
% Agree by sub-group
Total 15-24 year olds
25-34 year olds
35-44 year olds
45-54 year olds
55-64 year olds
65+ year olds
The BBC provides quality content that I find enjoyable or useful on the internet
61% 64% 65% 64% 64% 59% 49%
The BBC provides quality content that I find enjoyable or useful on BBC iPlayer
59% 60% 63% 62% 60% 60% 49%
The BBC provides quality content that I find enjoyable or useful on mobile phones and tablets
53% 59% 61% 61% 56% 44% 37%
The BBC has helped me make the most of new technologies such as interactive TV and the internet
52% 56% 60% 53% 54% 49% 40%
The BBC provides quality content that I find enjoyable or useful on DAB digital radio
46% 50% 50% 52% 47% 41% 38%
In terms of social grade, the most affluent socio-economic group (ABs) tend to give the
highest performance scores and the highest importance scores for each statement. As a
general rule, C1 socio-economic group scores will typically be slightly lower, those from the
C2 socio-economic group slightly lower still, and the least affluent socio-economic group
(DEs) give the lowest scores for both performance and importance. Both scores decrease at
similar rates however, meaning that the performance gaps for each measure are consistent
across social grades.
On average, across all the statements for this section, respondents in England (55%) and
Scotland (54%) give the highest agreement scores, followed by Wales (46%) and then
Northern Ireland (43%). Northern Ireland also has the largest average performance gap of
-6, although this is not too different from results from England and Wales (both -4) and
Scotland (-3).
There is more of a marked difference when it comes to subjective income. Those who feel
that they are ‘living comfortably’ or ‘doing alright’ give higher average performance scores
(60% and 58% respectively) than those who are ‘finding it difficult’ to manage financially

BBC Trust Purpose Remit Survey 2016 – UK Report
52
(45%). Scores for the latter group also result in larger performance gaps, ranging from -2 to
-12, whereas those ‘living comfortably/doing alright’ range from -1 to -5.

BBC Trust Purpose Remit Survey 2016 – UK Report
53
Appendices
Appendix 1: Trend data for general measures and purposes
Appendix Table 1.1 General measures of the BBC’s performance, 2008-2016
General measure Wave Score
Mean ‘overall impression’ score (1-10)
Autumn ‘08 6.7
Spring ‘09 6.7
Autumn ‘09 6.6
Spring ‘10 6.7
Autumn ‘10 6.8
Spring ‘11 6.6
Autumn ‘11 6.8
Winter 12/13 7.3
Autumn ‘13 7.3
Autumn ‘14 7.4
Autumn ‘15 7.3
Autumn ‘16 7.4
% agreeing the BBC offers a bit, a lot, or everything I need
Autumn ‘08 n/a
Spring ‘09 n/a
Autumn ‘09 n/a
Spring ‘10 n/a
Autumn ‘10 n/a
Spring ‘11 n/a
Autumn ‘11 n/a
Winter 12/13 57%
Autumn ‘13 58%
Autumn ‘14 60%
Autumn ‘15 55%
Autumn ‘16 56%
% likely to miss the BBC if it wasn’t there Autumn ‘08 81%
Spring ‘09 85%
Autumn ‘09 81%
Spring ‘10 83%
Autumn ‘10 81%
Spring ‘11 79%
Autumn ‘11 82%
Winter 12/13 80%
Autumn ‘13 78%

BBC Trust Purpose Remit Survey 2016 – UK Report
54
Appendix Table 1.1 General measures of the BBC’s performance, 2008-2016
Autumn ‘14 78%
Autumn ‘15 62%
Autumn ‘16 78%
% saying the BBC offers ‘fairly good’ or ‘good’ value for money
Autumn ‘08 59%
Spring ‘09 55%
Autumn ‘09 58%
Spring ‘10 58%
Autumn ‘10 55%
Spring ‘11 57%
Autumn ‘11 56%
Winter 12/13 57%
Autumn ‘13 58%
Autumn ‘14 56%
Autumn ‘15 57%
Autumn ‘16 58%
Appendix Table 1.2: Creativity purpose, 2008-2016
Statement Wave
Performance (%)
Importance (%)
Gap
Average for Creativity purpose Autumn ‘08 55 64 -9
Spring ‘09 60 67 -8
Autumn ‘09 55 65 -9
Spring ‘10 58 66 -7
Autumn ‘10 57 64 -7
Spring ‘11 56 63 -6
Autumn ‘11 60 66 -6
Winter 12/13 59 67 -9
Autumn ‘13 61 67 -6
Autumn ‘14 62 67 -4
Autumn ‘15 61 66 -5
Autumn ‘16 60 66 -6
The BBC has lots of fresh and new ideas Autumn ‘08 55 76 -21
Spring ‘09 57 78 -21
Autumn ‘09 52 76 -24
Spring ‘10 53 75 -21
Autumn ‘10 54 74 -20
Spring ‘11 54 74 -21
Autumn ‘11 56 77 -21
Winter 12/13 56 79 -23

BBC Trust Purpose Remit Survey 2016 – UK Report
55
Appendix Table 1.2: Creativity purpose, 2008-2016
Autumn ‘13 61 77 -16
Autumn ‘14 62 76 -14
Autumn ‘15 60 75 -15
Autumn ‘16 59 76 -17
The BBC makes programmes or online content that no other broadcaster would make
Autumn ‘08 n/a n/a n/a
Spring ‘09 n/a n/a n/a
Autumn ‘09 n/a n/a n/a
Spring ‘10 n/a n/a n/a
Autumn ‘10 n/a n/a n/a
Spring ‘11 n/a n/a n/a
Autumn ‘11 n/a n/a n/a
Winter 12/13 47 63 -16
Autumn ‘13 49 60 -11
Autumn ‘14 52 64 -12
Autumn ‘15 53 64 -11
Autumn ‘16 49 65 -16
The BBC makes high quality programmes or online content
Autumn ‘08 n/a n/a n/a
Spring ‘09 n/a n/a n/a
Autumn ‘09 n/a n/a n/a
Spring ‘10 n/a n/a n/a
Autumn ‘10 n/a n/a n/a
Spring ‘11 n/a n/a n/a
Autumn ‘11 n/a n/a n/a
Winter 12/13 76 83 -7
Autumn ‘13 76 79 -4
Autumn ‘14 76 79 -3
Autumn ‘15 76 81 -5
Autumn ‘16 73 80 -7
The BBC introduces me to new presenters, actors, writers, and musical artists from the UK [2009: The BBC introduces me to new UK talent (such as presenters, actors,, writers and musical artists)]
Autumn ‘08 54 59 -5
Spring ‘09 65 62 3
Autumn ‘09 55 60 -5
Spring ‘10 62 64 -2
Autumn ‘10 57 61 -4
Spring ‘11 60 59 0
Autumn ‘11 64 62 2
Winter 12/13 59 59 1
Autumn ‘13 62 61 1
Autumn ‘14 60 59 1
Autumn ‘15 60 56 4
Autumn ‘16 58 56 2
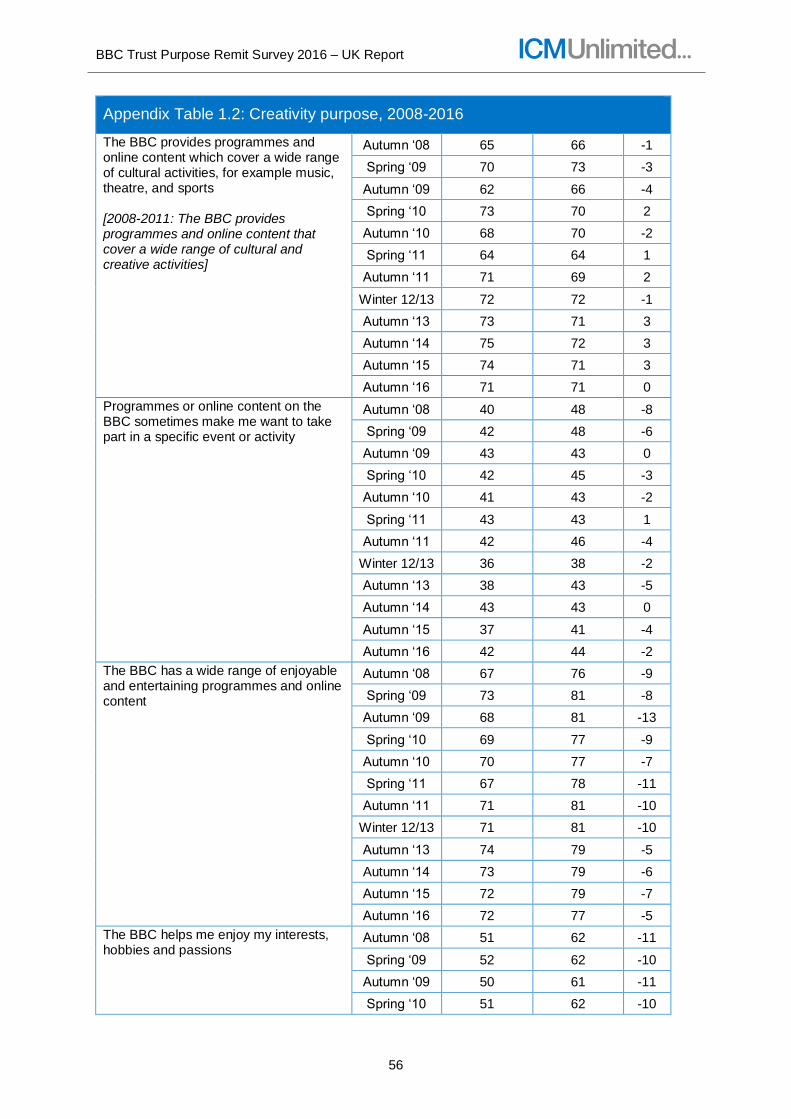
BBC Trust Purpose Remit Survey 2016 – UK Report
56
Appendix Table 1.2: Creativity purpose, 2008-2016
The BBC provides programmes and online content which cover a wide range of cultural activities, for example music, theatre, and sports [2008-2011: The BBC provides programmes and online content that cover a wide range of cultural and creative activities]
Autumn ‘08 65 66 -1
Spring ‘09 70 73 -3
Autumn ‘09 62 66 -4
Spring ‘10 73 70 2
Autumn ‘10 68 70 -2
Spring ‘11 64 64 1
Autumn ‘11 71 69 2
Winter 12/13 72 72 -1
Autumn ‘13 73 71 3
Autumn ‘14 75 72 3
Autumn ‘15 74 71 3
Autumn ‘16 71 71 0
Programmes or online content on the BBC sometimes make me want to take part in a specific event or activity
Autumn ‘08 40 48 -8
Spring ‘09 42 48 -6
Autumn ‘09 43 43 0
Spring ‘10 42 45 -3
Autumn ‘10 41 43 -2
Spring ‘11 43 43 1
Autumn ‘11 42 46 -4
Winter 12/13 36 38 -2
Autumn ‘13 38 43 -5
Autumn ‘14 43 43 0
Autumn ‘15 37 41 -4
Autumn ‘16 42 44 -2
The BBC has a wide range of enjoyable and entertaining programmes and online content
Autumn ‘08 67 76 -9
Spring ‘09 73 81 -8
Autumn ‘09 68 81 -13
Spring ‘10 69 77 -9
Autumn ‘10 70 77 -7
Spring ‘11 67 78 -11
Autumn ‘11 71 81 -10
Winter 12/13 71 81 -10
Autumn ‘13 74 79 -5
Autumn ‘14 73 79 -6
Autumn ‘15 72 79 -7
Autumn ‘16 72 77 -5
The BBC helps me enjoy my interests, hobbies and passions
Autumn ‘08 51 62 -11
Spring ‘09 52 62 -10
Autumn ‘09 50 61 -11
Spring ‘10 51 62 -10

BBC Trust Purpose Remit Survey 2016 – UK Report
57
Appendix Table 1.2: Creativity purpose, 2008-2016
Autumn ‘10 54 61 -7
Spring ‘11 50 58 -8
Autumn ‘11 56 63 -7
Winter 12/13 52 62 -10
Autumn ‘13 53 61 -8
Autumn ‘14 57 62 -5
Autumn ‘15 54 61 -7
Autumn ‘16 55 62 -7
Appendix Table 1.3: Citizenship purpose, 2008-2016
Statement Wave
Performance (%)
Importance (%)
Gap
Average for Citizenship purpose Autumn ‘08 63 65 -2
Spring ‘09 66 70 -4
Autumn ‘09 62 66 -4
Spring ‘10 63 62 1
Autumn ‘10 62 63 -1
Spring ‘11 60 62 -1
Autumn ‘11 63 66 -3
Winter 12/13 62 69 -7
Autumn ‘13 64 69 -4
Autumn ‘14 64 68 -4
Autumn ‘15 63 69 -6
Autumn ‘16 62 70 -8
The BBC provides high quality independent journalism
Autumn ‘08 70 75 -5
Spring ‘09 73 79 -6
Autumn ‘09 68 75 -7
Spring ‘10 72 72 -1
Autumn ‘10 71 74 -3
Spring ‘11 69 72 -3
Autumn ‘11 70 76 -6
Winter 12/13 65 78 -13
Autumn ‘13 66 76 -10
Autumn ‘14 66 75 -9
Autumn ‘15 65 77 -12
Autumn ‘16 62 76 -14
The BBC makes news and current affairs and other topical issues interesting to me
Autumn ‘08 68 73 -4
Spring ‘09 76 77 -1
Autumn ‘09 71 75 -4
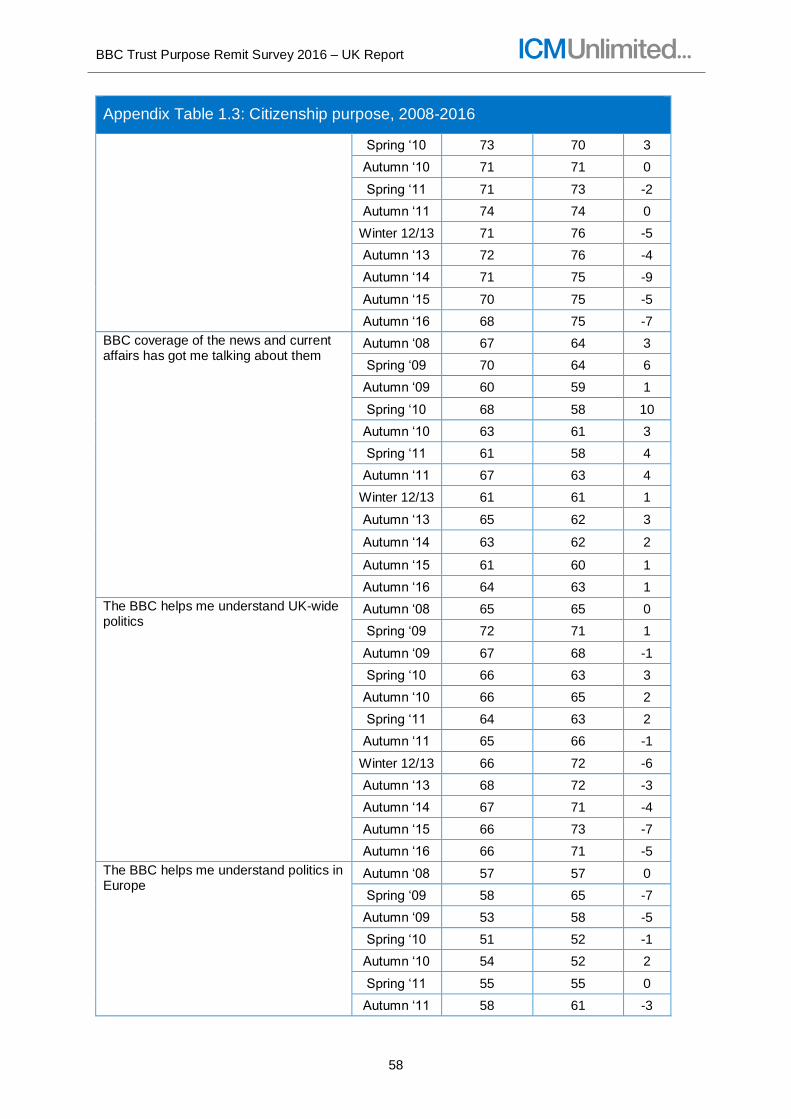
BBC Trust Purpose Remit Survey 2016 – UK Report
58
Appendix Table 1.3: Citizenship purpose, 2008-2016
Spring ‘10 73 70 3
Autumn ‘10 71 71 0
Spring ‘11 71 73 -2
Autumn ‘11 74 74 0
Winter 12/13 71 76 -5
Autumn ‘13 72 76 -4
Autumn ‘14 71 75 -9
Autumn ‘15 70 75 -5
Autumn ‘16 68 75 -7
BBC coverage of the news and current affairs has got me talking about them
Autumn ‘08 67 64 3
Spring ‘09 70 64 6
Autumn ‘09 60 59 1
Spring ‘10 68 58 10
Autumn ‘10 63 61 3
Spring ‘11 61 58 4
Autumn ‘11 67 63 4
Winter 12/13 61 61 1
Autumn ‘13 65 62 3
Autumn ‘14 63 62 2
Autumn ‘15 61 60 1
Autumn ‘16 64 63 1
The BBC helps me understand UK-wide politics
Autumn ‘08 65 65 0
Spring ‘09 72 71 1
Autumn ‘09 67 68 -1
Spring ‘10 66 63 3
Autumn ‘10 66 65 2
Spring ‘11 64 63 2
Autumn ‘11 65 66 -1
Winter 12/13 66 72 -6
Autumn ‘13 68 72 -3
Autumn ‘14 67 71 -4
Autumn ‘15 66 73 -7
Autumn ‘16 66 71 -5
The BBC helps me understand politics in Europe
Autumn ‘08 57 57 0
Spring ‘09 58 65 -7
Autumn ‘09 53 58 -5
Spring ‘10 51 52 -1
Autumn ‘10 54 52 2
Spring ‘11 55 55 0
Autumn ‘11 58 61 -3

BBC Trust Purpose Remit Survey 2016 – UK Report
59
Appendix Table 1.3: Citizenship purpose, 2008-2016
Winter 12/13 57 64 -7
Autumn ‘13 59 64 -5
Autumn ‘14 60 64 -4
Autumn ‘15 60 66 -6
Autumn ‘16 60 68 -8
The BBC helps me understand politics in my nation/region
Autumn ‘08 57 63 -6
Spring ‘09 59 69 -10
Autumn ‘09 59 67 -8
Spring ‘10 56 62 -6
Autumn ‘10 55 63 -8
Spring ‘11 53 61 -8
Autumn ‘11 54 64 -10
Winter 12/13 59 69 -11
Autumn ‘13 61 69 -8
Autumn ‘14 59 68 -9
Autumn ‘15 59 67 -8
Autumn ‘16 58 69 -11
The BBC helps me understand politics in the other nations of the UK
Autumn ‘08 57 56 0
Spring ‘09 54 62 -9
Autumn ‘09 56 58 -2
Spring ‘10 55 54 1
Autumn ‘10 56 56 0
Spring ‘11 48 51 -3
Autumn ‘11 53 55 -2
Winter 12/13 54 61 -7
Autumn ‘13 58 61 -3
Autumn ‘14 61 64 -3
Autumn ‘15 60 65 -5
Autumn ‘16 59 65 -6
Appendix Table 1.4: Global purpose, 2008-2016
Statement Wave
Performance (%)
Importance (%)
Gap
Average for Global Purpose Autumn ‘08 73 73 0
Spring ‘09 81 82 -1
Autumn ‘09 74 74 0
Spring ‘10 78 76 2
Autumn ‘10 74 74 0
Spring ‘11 75 75 1

BBC Trust Purpose Remit Survey 2016 – UK Report
60
Appendix Table 1.4: Global purpose, 2008-2016
Autumn ‘11 83 81 1
Winter 12/13 73 79 -6
Autumn ‘13 73 79 -5
Autumn ‘14 73 78 -5
Autumn ‘15 71 76 -5
Autumn ‘16 72 77 -5
The BBC helps me understand what is
going on in the wider world, such as
international news and events
Autumn ‘08 77 75 2
Spring ‘09 84 84 1
Autumn ‘09 77 76 0
Spring ‘10 80 78 2
Autumn ‘10 76 75 1
Spring ‘11 78 78 0
Autumn ‘11 83 81 1
Winter 12/13 80 82 -2
Autumn ‘13 80 82 -2
Autumn ‘14 78 80 -2
Autumn ‘15 77 80 -3
Autumn ‘16 78 81 -3
The BBC helps me understand the cultures and lifestyles of people from around the world [2008-2011: The BBC helps me understand and appreciate the cultures and lifestyles of people from around the world]
Autumn ‘08 70 71 -1
Spring ‘09 78 80 -2
Autumn ‘09 72 73 -1
Spring ‘10 76 74 2
Autumn ‘10 71 72 -2
Spring ‘11 73 71 2
Autumn ‘11 n/a n/a n/a
Winter 12/13 73 76 -4
Autumn ‘13 73 75 -1
Autumn ‘14 73 76 -3
Autumn ‘15 72 73 -1
Autumn ‘16 72 74 -2
The BBC is good at presenting a positive image of the UK to the rest of the world
Autumn ‘08 n/a n/a n/a
Spring ‘09 n/a n/a n/a
Autumn ‘09 n/a n/a n/a
Spring ‘10 n/a n/a n/a
Autumn ‘10 n/a n/a n/a
Spring ‘11 n/a n/a n/a
Autumn ‘11 n/a n/a n/a
Winter 12/13 66 79 -13
Autumn ‘13 67 79 -12
Autumn ‘14 69 77 -9

BBC Trust Purpose Remit Survey 2016 – UK Report
61
Appendix Table 1.4: Global purpose, 2008-2016
Autumn ‘15 65 76 -11
Autumn ‘16 66 76 -10
Appendix Table 1.5: Nations, regions and communities purpose, 2008-2016
Statement Wave
Performance (%)
Importance (%)
Gap
Average for Nations, regions, and communities purpose
Autumn ‘08 44 58 -14
Spring ‘09 45 54 -9
Autumn ‘09 48 57 -9
Spring ‘10 45 51 -5
Autumn ‘10 51 60 -9
Spring ‘11 47 51 -4
Autumn ‘11 48 53 -5
Winter 12/13 48 63 -15
Autumn ‘13 52 64 -12
Autumn ‘14 52 64 -12
Autumn ‘15 51 62 -11
Autumn ‘16 51 62 -11
The BBC is good at representing life in my nation/region to the rest of the UK in its main UK news and current affairs programmes and online content
Autumn ‘08 n/a n/a n/a
Spring ‘09 n/a n/a n/a
Autumn ‘09 n/a n/a n/a
Spring ‘10 n/a n/a n/a
Autumn ‘10 n/a n/a n/a
Spring ‘11 n/a n/a n/a
Autumn ‘11 n/a n/a n/a
Winter 12/13 57 71 -14
Autumn ‘13 59 70 -11
Autumn ‘14 59 69 -9
Autumn ‘15 54 67 -13
Autumn ‘16 56 69 -13
The BBC is good at representing life in my nation/region to the rest of the UK in its drama, documentaries, and other entertainment programmes and online content
Autumn ‘08 n/a n/a n/a
Spring ‘09 n/a n/a n/a
Autumn ‘09 n/a n/a n/a
Spring ‘10 n/a n/a n/a
Autumn ‘10 n/a n/a n/a
Spring ‘11 n/a n/a n/a
Autumn ‘11 n/a n/a n/a
Winter 12/13 55 70 -15
Autumn ‘13 60 70 -10

BBC Trust Purpose Remit Survey 2016 – UK Report
62
Appendix Table 1.5: Nations, regions and communities purpose, 2008-2016
Autumn ‘14 59 71 -12
Autumn ‘15 55 65 -10
Autumn ‘16 57 68 -11
My regional BBC content provides programmes and content that is for people like me
Autumn ‘08 n/a n/a n/a
Spring ‘09 n/a n/a n/a
Autumn ‘09 n/a n/a n/a
Spring ‘10 n/a n/a n/a
Autumn ‘10 n/a n/a n/a
Spring ‘11 n/a n/a n/a
Autumn ‘11 n/a n/a n/a
Winter 12/13 59 74 -15
Autumn ‘13 60 72 -13
Autumn ‘14 64 71 -7
Autumn ‘15 59 71 -12
Autumn ‘16 61 70 -9
The BBC helps me feel more involved and interested in my local community
Autumn ‘08 36 56 -20
Spring ‘09 41 55 -14
Autumn ‘09 39 54 -15
Spring ‘10 38 50 -12
Autumn ‘10 36 54 -18
Spring ‘11 37 48 -11
Autumn ‘11 37 51 -14
Winter 12/13 37 53 -16
Autumn ‘13 41 54 -13
Autumn ‘14 43 56 -12
Autumn ‘15 43 54 -11
Autumn ‘16 43 56 -13
The BBC improves my understanding of religions and other beliefs [2008-2011: The BBC raises my awareness and understanding of different religious and other beliefs]
Autumn ‘08 53 55 -2
Spring ‘09 51 51 0
Autumn ‘09 58 55 3
Spring ‘10 49 48 0
Autumn ‘10 58 57 1
Spring ‘11 45 42 3
Autumn ‘11 51 50 1
Winter 12/13 42 49 -7
Autumn ‘13 46 50 -4
Autumn ‘14 48 54 -6
Autumn ‘15 44 50 -6
Autumn ‘16 46 54 -8
The BBC is good at representing my Autumn ‘08 n/a n/a n/a

BBC Trust Purpose Remit Survey 2016 – UK Report
63
Appendix Table 1.5: Nations, regions and communities purpose, 2008-2016
religion* *Only asked of participants who said they followed a particular faith
Spring ‘09 n/a n/a n/a
Autumn ‘09 n/a n/a n/a
Spring ‘10 n/a n/a n/a
Autumn ‘10 n/a n/a n/a
Spring ‘11 n/a n/a n/a
Autumn ‘11 n/a n/a n/a
Winter 12/13 37 64 -27
Autumn ‘13 47 67 -20
Autumn ‘14 45 67 -23
Autumn ‘15 46 67 -21
Autumn ‘16 47 66 -19
The BBC is good at representing my ethnic group* *Only asked of participants from non-White British minority ethnic backgrounds
Autumn ‘08 n/a n/a n/a
Spring ‘09 n/a n/a n/a
Autumn ‘09 n/a n/a n/a
Spring ‘10 n/a n/a n/a
Autumn ‘10 n/a n/a n/a
Spring ‘11 n/a n/a n/a
Autumn ‘11 n/a n/a n/a
Winter 12/13 38 69 -31
Autumn ‘13 47 68 -21
Autumn ‘14 39 59 -19
Autumn ‘15 44 62 -18
Autumn ‘16 47 66 -19
The BBC supports the native languages of the UK other than English with programming and other content [2008-2011: The BBC supports the indigenous languages…]
Autumn ‘08 47 49 -2
Spring ‘09 46 46 0
Autumn ‘09 45 51 -6
Spring ‘10 42 42 0
Autumn ‘10 48 49 0
Spring ‘11 41 40 1
Autumn ‘11 49 43 7
Winter 12/13 47 49 -2
Autumn ‘13 50 51 -1
Autumn ‘14 53 53 0
Autumn ‘15 53 51 2
Autumn ‘16 48 52 -4
The BBC supports my native language with programming and other content* *Only including participants who speak a minority language
Autumn ‘08 39 71 -32
Spring ‘09 43 66 -22
Autumn ‘09 52 69 -18
Spring ‘10 53 63 -10
Autumn ‘10 60 79 -20
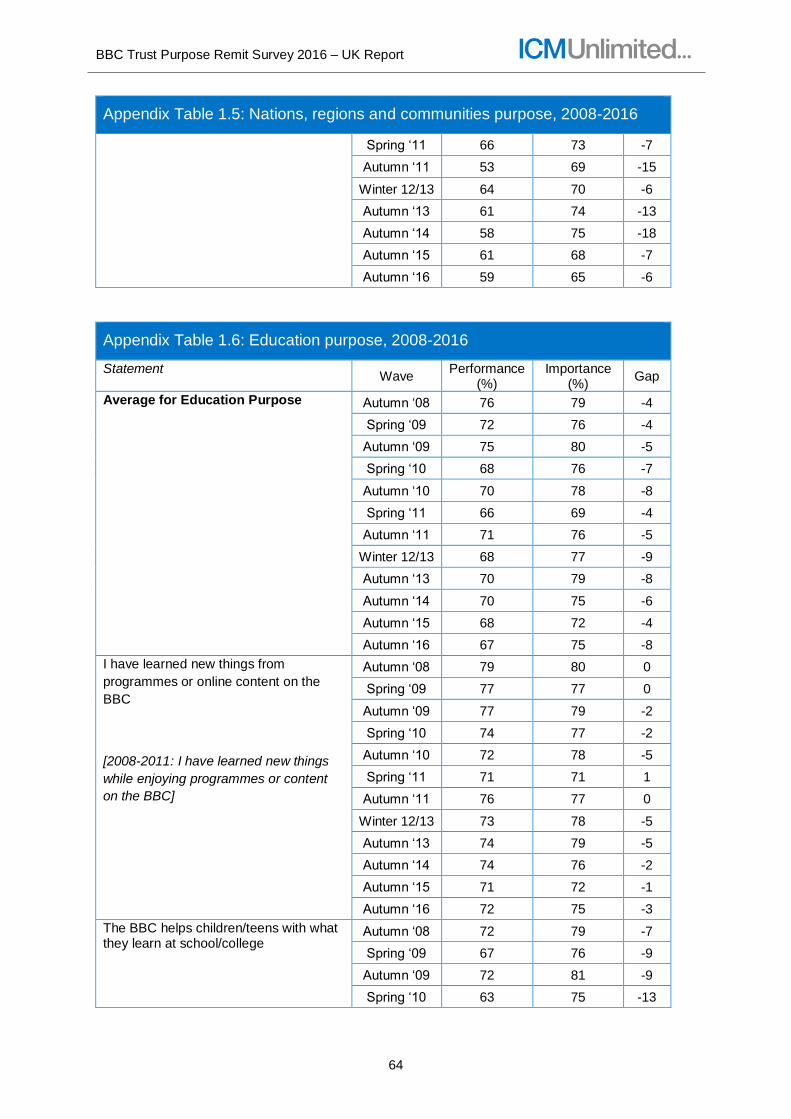
BBC Trust Purpose Remit Survey 2016 – UK Report
64
Appendix Table 1.5: Nations, regions and communities purpose, 2008-2016
Spring ‘11 66 73 -7
Autumn ‘11 53 69 -15
Winter 12/13 64 70 -6
Autumn ‘13 61 74 -13
Autumn ‘14 58 75 -18
Autumn ‘15 61 68 -7
Autumn ‘16 59 65 -6
Appendix Table 1.6: Education purpose, 2008-2016
Statement Wave
Performance (%)
Importance (%)
Gap
Average for Education Purpose Autumn ‘08 76 79 -4
Spring ‘09 72 76 -4
Autumn ‘09 75 80 -5
Spring ‘10 68 76 -7
Autumn ‘10 70 78 -8
Spring ‘11 66 69 -4
Autumn ‘11 71 76 -5
Winter 12/13 68 77 -9
Autumn ‘13 70 79 -8
Autumn ‘14 70 75 -6
Autumn ‘15 68 72 -4
Autumn ‘16 67 75 -8
I have learned new things from
programmes or online content on the
BBC
[2008-2011: I have learned new things
while enjoying programmes or content
on the BBC]
Autumn ‘08 79 80 0
Spring ‘09 77 77 0
Autumn ‘09 77 79 -2
Spring ‘10 74 77 -2
Autumn ‘10 72 78 -5
Spring ‘11 71 71 1
Autumn ‘11 76 77 0
Winter 12/13 73 78 -5
Autumn ‘13 74 79 -5
Autumn ‘14 74 76 -2
Autumn ‘15 71 72 -1
Autumn ‘16 72 75 -3
The BBC helps children/teens with what they learn at school/college
Autumn ‘08 72 79 -7
Spring ‘09 67 76 -9
Autumn ‘09 72 81 -9
Spring ‘10 63 75 -13

BBC Trust Purpose Remit Survey 2016 – UK Report
65
Appendix Table 1.6: Education purpose, 2008-2016
Autumn ‘10 68 79 -11
Spring ‘11 60 68 -8
Autumn ‘11 67 76 -10
Winter 12/13 62 76 -14
Autumn ‘13 67 79 -11
Autumn ‘14 66 75 -9
Autumn ‘15 64 71 -7
Autumn ‘16 62 74 -12
Appendix Table 1.7: Digital purpose, 2008-2016
Statement Wave
Performance (%)
Importance (%)
Gap
Average for Digital purpose Autumn ‘08 35 34 1
Spring ‘09 32 35 -3
Autumn ‘09 40 33 7
Spring ‘10 37 31 6
Autumn ‘10 37 31 5
Spring ‘11 35 30 5
Autumn ‘11 41 36 5
Winter 12/13 50 54 -4
Autumn ‘13 55 56 -1
Autumn ‘14 59 59 0
Autumn ‘15 56 57 -1
Autumn ‘16 54 59 -5
The BBC provides quality content that I find enjoyable or useful on the internet
Autumn ‘08 47 46 1
Spring ‘09 45 45 0
Autumn ‘09 51 22 29
Spring ‘10 48 23 25
Autumn ‘10 48 25 23
Spring ‘11 49 21 28
Autumn ‘11 55 31 25
Winter 12/13 61 63 -2
Autumn ‘13 66 64 1
Autumn ‘14 67 65 2
Autumn ‘15 64 64 0
Autumn ‘16 61 63 -2
The BBC provides quality content that I find enjoyable or useful on mobile phones and tablets*
Autumn ‘08 17 18 0
Spring ‘09 14 19 -4
Autumn ‘09 20 22 -2

BBC Trust Purpose Remit Survey 2016 – UK Report
66
Appendix Table 1.7: Digital purpose, 2008-2016
* ‘tablets’ was added to this question at the winter ‘12/’13 wave
Spring ‘10 22 23 -2
Autumn ‘10 24 25 -1
Spring ‘11 18 21 -3
Autumn ‘11 28 31 -3
Winter 12/13 45 51 -6
Autumn ‘13 50 53 -3
Autumn ‘14 57 57 0
Autumn ‘15 52 54 -2
Autumn ‘16 53 57 -4
The BBC provides quality content that I find enjoyable or useful on DAB digital radio
Autumn ‘08 35 33 1
Spring ‘09 30 34 -4
Autumn ‘09 41 41 -1
Spring ‘10 36 36 0
Autumn ‘10 36 33 3
Spring ‘11 34 36 -2
Autumn ‘11 37 37 0
Winter 12/13 42 45 -3
Autumn ‘13 46 48 -2
Autumn ‘14 52 51 1
Autumn ‘15 47 48 -1
Autumn ‘16 46 51 -5
The BBC has helped me make the most of new technologies such as interactive TV and the internet
Autumn ‘08 42 40 2
Spring ‘09 38 41 -3
Autumn ‘09 46 46 0
Spring ‘10 44 42 2
Autumn ‘10 40 43 -3
Spring ‘11 39 41 -2
Autumn ‘11 45 47 -1
Winter 12/13 51 57 -6
Autumn ‘13 57 58 -1
Autumn ‘14 57 60 -3
Autumn ‘15 53 54 -1
Autumn ‘16 52 58 -6
The BBC provides quality content that I find enjoyable or useful on BBC iPlayer
Autumn ‘08 n/a n/a n/a
Spring ‘09 n/a n/a n/a
Autumn ‘09 n/a n/a n/a
Spring ‘10 n/a n/a n/a
Autumn ‘10 n/a n/a n/a
Spring ‘11 n/a n/a n/a
Autumn ‘11 n/a n/a n/a

BBC Trust Purpose Remit Survey 2016 – UK Report
67
Appendix Table 1.7: Digital purpose, 2008-2016
Winter 12/13 n/a n/a n/a
Autumn ‘13 n/a n/a n/a
Autumn ‘14 63 65 -2
Autumn ‘15 62 64 -2
Autumn ‘16 59 64 -5

BBC Trust Purpose Remit Survey 2016 – UK Report
68
Appendix 2: Ranked performance and importance scores for all statements
Appendix Table 2.1: Ranked performance scores for all statements
78%
73%
72%
72%
72%
71%
68%
66%
66%
64%
62%
62%
61%
61%
60%
59%
59%
The BBC helps me understand what is going on in thewider world, such as international news and events
The BBC makes high quality programmes or onlinecontent
The BBC has a wide range of enjoyable andentertaining programmes and online content
The BBC helps me understand the cultures andlifestyles of people from around the world
I have learned new things from programmes or onlinecontent on the BBC
The BBC provides programmes and online contentwhich cover a wide range of cultural activities
The BBC makes news and current affairs and othertopical issues interesting to me
The BBC helps me understand UK-wide politics
The BBC is good at presenting a positive image of theUK to the rest of the world
BBC coverage of the news and current affairs has gotme talking about them
The BBC provides high quality independent journalism
The BBC helps children/teenagers with what they learnat school/college
The BBC provides quality content that I find enjoyable oruseful on the internet
My regional BBC content provides programmes andonline content that is for people like me
The BBC helps me understand politics in Europe
The BBC provides quality content that I find enjoyable oruseful on BBC iPlayer
The BBC supports my language with programming andother content (BASE: 338)

BBC Trust Purpose Remit Survey 2016 – UK Report
69
59%
59%
58%
58%
57%
56%
55%
53%
52%
49%
48%
47%
46%
46%
44%
43%
42%
The BBC has lots of fresh and new ideas
The BBC helps me understand politics in the othernations of the UK
The BBC introduces me to new presenters, actors,writers and musical artists from the UK
The BBC helps me understand politics in mynation/region
The BBC is good at representing life in my nation/regionto the rest of the UK in its drama, documentaries, andother entertainment programmes and online content
The BBC is good at representing life in my nation/regionto the rest of the UK in its main UK news and current
affairs programmes and online content
The BBC helps me enjoy my interests, hobbies andpassions
The BBC provides quality content that I find enjoyable oruseful on mobile phones and tablets
The BBC has helped me make the most of newtechnologies such as interactive TV and the internet
The BBC makes programmes or online content that noother broadcaster would make
The BBC supports the native languages of the UK otherthan English with programming and other content
The BBC is good at representing my faith (BASE: 1,163)
The BBC provides quality content that I find enjoyable oruseful on DAB digital radio
The BBC improves my understanding of religions andother beliefs
The BBC is good at representing my ethnic group(BASE: 586)
The BBC helps me feel more involved and interested inmy local community
Programmes or online content on the BBC sometimesmake me want to take part in a specific event or activity

BBC Trust Purpose Remit Survey 2016 – UK Report
70
Appendix Table 2.2: Ranked importance scores for all statements
81%
80%
77%
76%
76%
76%
75%
75%
74%
74%
71%
71%
70%
69%
69%
68%
68%
The BBC helps me understand what is going on in thewider world, such as international news and events
The BBC makes high quality programmes or onlinecontent
The BBC has a wide range of enjoyable andentertaining programmes and online content
The BBC provides high quality independent journalism
The BBC is good at presenting a positive image of theUK to the rest of the world
The BBC has lots of fresh and new ideas
The BBC makes news and current affairs and othertopical issues interesting to me
I have learned new things from programmes or onlinecontent on the BBC
The BBC helps me understand the cultures andlifestyles of people from around the world
The BBC helps children/teenagers with what they learnat school/college
The BBC helps me understand UK-wide politics
The BBC provides programmes and online contentwhich cover a wide range of cultural activities
My regional BBC content provides programmes andonline content that is for people like me
The BBC helps me understand politics in mynation/region
The BBC is good at representing life in my nation/regionto the rest of the UK in its main UK news and current
affairs programmes and online content
The BBC helps me understand politics in Europe
The BBC is good at representing life in my nation/regionto the rest of the UK in its drama, documentaries, andother entertainment programmes and online content

BBC Trust Purpose Remit Survey 2016 – UK Report
71
66%
65%
65%
65%
64%
63%
63%
62%
61%
58%
57%
56%
56%
54%
52%
51%
44%
The BBC is good at representing my faith (BASE: 1,163)
The BBC supports my language with programming andother content (BASE: 338)
The BBC helps me understand politics in the othernations of the UK
The BBC makes programmes or online content that noother broadcaster would make
The BBC provides quality content that I find enjoyable oruseful on BBC iPlayer
The BBC provides quality content that I find enjoyable oruseful on the internet
BBC coverage of the news and current affairs has gotme talking about them
The BBC helps me enjoy my interests, hobbies andpassions
The BBC is good at representing my ethnic group(BASE: 586)
The BBC has helped me make the most of newtechnologies such as interactive TV and the internet
The BBC provides quality content that I find enjoyable oruseful on mobile phones and tablets
The BBC introduces me to new presenters, actors,writers and musical artists from the UK
The BBC helps me feel more involved and interested inmy local community
The BBC improves my understanding of religions andother beliefs
The BBC supports the native languages of the UK otherthan English with programming and other content
The BBC provides quality content that I find enjoyable oruseful on DAB digital radio
Programmes or online content on the BBC sometimesmake me want to take part in a specific event or activity

BBC Trust Purpose Remit Survey 2016 – UK Report
72
Appendix 3: Performance in general measures, purposes and statements by
key demographic variables
Appendix Table 3.1: Performance in general measures by gender
General measure Gender
Male Female Total
Mean ‘overall impression’ score (1-10) 7.3 7.5 7.4
% agreeing the BBC offers a bit, a lot, or everything I need 56 56 56
% likely to miss the BBC if it wasn’t there 75 80 78
% saying the BBC offers ‘fairly good’ or ‘very good’ value for money
59 58 58
Unweighted base 1,154 1,260 2,414
Appendix Table 3.2: Performance in general measures by age
General measure Age
16-24 25-34 35-44 45-54 55-64 65-74 75+ Total
Mean ‘overall impression’ score (1-10) 7.5 7.2 7.3 7.2 7.6 7.8 7.9 7.4
% agreeing the BBC offers a bit, a lot, or everything I need
47 47 43 50 67 74 85 56
% likely to miss the BBC if it wasn’t there 74 69 72 80 82 87 97 78
% saying the BBC offers ‘fairly good’ or ‘very good’ value for money
56 53 52 52 65 72 75 58
Unweighted base 297 427 418 425 451 297 99 2,414
Appendix Table 3.3: Performance in general measures by social grade
General measure Social grade
AB C1 C2 DE Total
Mean ‘overall impression’ score (1-10) 7.6 7.6 7.2 7.2 7.4
% agreeing the BBC offers a bit, a lot, or everything I need
63 60 52 47 56
% likely to miss the BBC if it wasn’t there 81 80 77 73 78
% saying the BBC offers ‘fairly good’ or ‘very good’ value for money
66 64 51 51 58
Unweighted base 616 664 504 630 2,414

BBC Trust Purpose Remit Survey 2016 – UK Report
73
Appendix Table 3.4: Performance in general measures, by nation
General measure Nation
England Wales Scotland Northern Ireland
Total
Mean ‘overall impression’ score (1-10) 7.5 7.3 7.3 6.8 7.4
% agreeing the BBC offers a bit, a lot, or everything I need 56 51 55 38 56
% likely to miss the BBC if it wasn’t there 78 79 77 71 78
% saying the BBC offers ‘fairly good’ or ‘good’ value for money
37 42 45 60 58
Unweighted base 1,341 359 358 356 2,414
Appendix Table 3.5: Performance in general measures by ethnicity
General measure Ethnicity
White Mixed Asian Black Other NET: BME
Total
Mean ‘overall impression’ score (1-10) 7.4 7.3 7.5 7.5 6.5 7.5 7.4
% agreeing the BBC offers a bit, a lot, or everything I need
57 44 46 51 22 47 56
% likely to miss the BBC if it wasn’t there 79 69 71 76 45 72 78
% saying the BBC offers ‘fairly good’ or ‘very good’ value for money
38 44 43 39 78 42 58
Unweighted base 2,021 22 148 116 2,414 309 2,414
Appendix Table 3.6: Performance in general measures by subjective income
General measure Subjective income
Living comforta
bly
Doing alright
Just about getting
by
Finding it quite difficult
Finding it very difficult
Total
Mean ‘overall impression’ score (1-10) 7.8 7.6 7.3 7.2 6.3 7.4
% agreeing the BBC offers a bit, a lot, or everything I need
68 60 49 45 31 56
% likely to miss the BBC if it wasn’t there 82 81 76 70 64 78
% saying the BBC offers ‘fairly good’ or ‘very good’ value for money
27 35 43 47 65 58
Unweighted base 50 862 636 235 121 2,414

BBC Trust Purpose Remit Survey 2016 – UK Report
74
Appendix Table 3.7: Performance in purpose priorities by gender
Statement Gender
Male Female Total
% % %
Mean Creativity performance 58 61 60
The BBC has lots of fresh and new ideas 57 62 59
The BBC makes programmes or online content that no other broadcaster would make
50 48 49
The BBC makes high quality programmes or online content 71 74 73
The BBC introduces me to new presenters, actors, writers, and musical artists from the UK
54 62 58
The BBC provides programmes and online content which cover a wide range of cultural activities, for example music, theatre, and sports
69 72 71
Programmes or online content on the BBC sometimes make me want to take part in a specific event or activity
42 42 42
The BBC has a wide range of enjoyable and entertaining programmes and online content
69 75 72
The BBC helps me enjoy my interests, hobbies and passions
55 55 55
Mean Citizenship performance 63 62 62
The BBC provides high quality independent journalism 61 63 62
The BBC makes news and current affairs and other topical issues interesting to me
68 68 68
BBC coverage of the news and current affairs has got me talking about them
63 64 64
The BBC helps me understand UK-wide politics 68 65 66
The BBC helps me understand politics in Europe 62 59 60
The BBC helps me understand politics in my nation/region 58 59 58
The BBC helps me understand politics in the other nations of the UK
60 57 59
Mean Global performance 71 73 72
The BBC helps me understand what is going on in the wider world, such as international news and events
77 79 78
The BBC helps me understand the cultures and lifestyles of people from around the world
71 73 72
The BBC is good at presenting a positive image of the UK to the rest of the world
66 66 66
Mean Nations, regions and communities performance 49 53 51
The BBC is good at representing life in my nation/region to the rest of the UK in its main UK news and current affairs programmes and online content
55 57 56
The BBC is good at representing life in my nation/region to the rest of the UK in its drama, documentaries, and other entertainment programmes and online content
56 58 57
My regional BBC content provides programmes and content that is for people like me
57 64 61
The BBC helps me feel more involved and interested in my local community
42 43 43

BBC Trust Purpose Remit Survey 2016 – UK Report
75
Appendix Table 3.7: Performance in purpose priorities by gender
The BBC improves my understanding of religions and other beliefs
43 49 46
The BBC is good at representing my religion* 44 50 47
The BBC is good at representing my ethnic group* 42 46 44
The BBC supports the native languages of the UK other than English with programming and other content
46 50 48
The BBC supports my native language with programming and other content*
58 59 59
Mean Education performance 65 68 67
I have learned new things from programmes or online content on the BBC
70 73 72
The BBC helps children/teens with what they learn at school/college
60 64 62
Mean Digital performance 55 54 54
The BBC provides quality content that I find enjoyable or useful on the internet
61 61 61
The BBC provides quality content that I find enjoyable or useful on mobile phones and tablets
53 53 53
The BBC provides quality content that I find enjoyable or useful on DAB digital radio
50 43 46
The BBC has helped me make the most of new technologies such as interactive TV and the internet
53 51 52
The BBC provides quality content that I find enjoyable or useful on BBC iPlayer
58 60 59
Unweighted base – Most statements 1,154 1,260 2,414
*Unweighted base - The BBC is good at representing my religion
454 517 971
*Unweighted base - The BBC is good at representing my ethnic group
265 155 420
*Unweighted base - The BBC supports my native language with programming and other content
112 99 211
Appendix Table 3.8: Performance in purpose priorities by age
Statement Age
16-24 25-34 35-44 45-54 55-64 65-74 75+ Total
% % % % % % % %
Mean Creativity performance 63 57 56 58 62 63 69 60
The BBC has lots of fresh and new ideas 62 56 56 55 64 62 70 59
The BBC makes programmes or online content that no other broadcaster would make
49 45 47 49 51 53 55 49
The BBC makes high quality programmes or online content
72 68 66 72 77 80 84 73
The BBC introduces me to new presenters, actors, writers, and musical artists from the UK
57 58 51 55 63 63 75 58
The BBC provides programmes and online content which cover a wide range of cultural activities, for example music, theatre, and sports
72 65 65 70 75 78 77 71

BBC Trust Purpose Remit Survey 2016 – UK Report
76
Appendix Table 3.8: Performance in purpose priorities by age
Programmes or online content on the BBC sometimes make me want to take part in a specific event or activity
54 43 44 44 37 31 43 42%
The BBC has a wide range of enjoyable and entertaining programmes and online content
77 68 67 72 72 79 79 72%
The BBC helps me enjoy my interests, hobbies and passions
59 53 50 49 58 62 66 55%
Mean Citizenship performance 57 60 59 63 64 70 73 62%
The BBC provides high quality independent journalism 57 60 59 62 60 72 80 62
The BBC makes news and current affairs and other topical issues interesting to me
61 62 63 69 72 80 78 68
BBC coverage of the news and current affairs has got me talking about them
58 62 59 67 63 68 81 64
The BBC helps me understand UK-wide politics 62 64 63 66 69 74 73 66
The BBC helps me understand politics in Europe 54 59 57 59 65 67 67 60
The BBC helps me understand politics in my nation/region
53 56 55 59 60 64 66 58
The BBC helps me understand politics in the other nations of the UK
55 58 57 55 59 67 67 59
Mean Global performance 67 66 69 74 76 80 78 72
The BBC helps me understand what is going on in the wider world, such as international news and events
77 72 71 81 82 86 82 78
The BBC helps me understand the cultures and lifestyles of people from around the world
64 66 70 75 77 82 72 72
The BBC is good at presenting a positive image of the UK to the rest of the world
60 61 65 67 69 71 81 66
Mean Nations, regions and communities performance
49 50 51 50 53 53 60 51
The BBC is good at representing life in my nation/region to the rest of the UK in its main UK news and current affairs programmes and online content
56 51 54 59 56 57 77 56
The BBC is good at representing life in my nation/region to the rest of the UK in its drama, documentaries, and other entertainment programmes and online content
54 51 52 57 61 61 76 57
My regional BBC content provides programmes and content that is for people like me
57 58 55 62 62 69 73 61
The BBC helps me feel more involved and interested in my local community
40 40 44 42 39 51 55 43
The BBC improves my understanding of religions and other beliefs
46 43 45 49 44 48 56 46
The BBC is good at representing my religion* 49 50 46 44 50 44 53 47
The BBC is good at representing my ethnic group* 35 52 45 42 42 47 20 44
The BBC supports the native languages of the UK other than English with programming and other content
51 45 46 44 51 47 65 48
The BBC supports my native language with programming and other content*
55 60 68 48 68 48 64 59
Mean Education performance 73 63 66 67 66 70 60 67
I have learned new things from programmes or online content on the BBC
78 65 71 71 72 78 65 72
The BBC helps children/teens with what they learn at school/college
69 61 62 62 60 62 55 62

BBC Trust Purpose Remit Survey 2016 – UK Report
77
Appendix Table 3.8: Performance in purpose priorities by age
Mean Digital performance 58 60 58 56 51 48 33 54
The BBC provides quality content that I find enjoyable or useful on the internet
64 65 64 64 59 56 36 61
The BBC provides quality content that I find enjoyable or useful on mobile phones and tablets
59 61 61 56 44 42 26 53
The BBC provides quality content that I find enjoyable or useful on DAB digital radio
50 50 52 47 41 40 38 46
The BBC has helped me make the most of new technologies such as interactive TV and the internet
56 60 53 54 49 44 29 52
The BBC provides quality content that I find enjoyable or useful on BBC iPlayer
60 63 62 60 60 56 34 59
Unweighted base – Most statements 297 427 418 425 451 297 99 2,41
4
*Unweighted base - The BBC is good at representing my religion
82 125 184 168 174 175 63 971
*Unweighted base - The BBC is good at representing my ethnic group
47 72 140 95 44 18 5 420
*Unweighted base - The BBC supports my native language with programming and other content
45 41 41 34 29 15 6 211
Appendix Table 3.9: Performance in purpose priorities by social grade
Statement Social grade
AB C1 C2 DE Total
% % % % %
Mean Creativity performance 67 64 54 53 60
The BBC has lots of fresh and new ideas 67 65 52 52 59
The BBC makes programmes or online content that no other broadcaster would make
59 53 38 44 49
The BBC makes high quality programmes or online content 81 78 67 64 73
The BBC introduces me to new presenters, actors, writers, and musical artists from the UK
66 61 55 50 58
The BBC provides programmes and online content which cover a wide range of cultural activities, for example music, theatre, and sports
76 77 62 66 71
Programmes or online content on the BBC sometimes make me want to take part in a specific event or activity
52 42 38 36 42
The BBC has a wide range of enjoyable and entertaining programmes and online content
76 80 66 64 72
The BBC helps me enjoy my interests, hobbies and passions 62 60 50 47 55
Mean Citizenship performance 71 66 58 54 62
The BBC provides high quality independent journalism 68 62 59 57 62
The BBC makes news and current affairs and other topical issues interesting to me
74 72 64 60 68
BBC coverage of the news and current affairs has got me talking about them
72 69 60 53 64

BBC Trust Purpose Remit Survey 2016 – UK Report
78
Appendix Table 3.9: Performance in purpose priorities by social grade
The BBC helps me understand UK-wide politics 76 72 60 56 66
The BBC helps me understand politics in Europe 70 65 53 52 60
The BBC helps me understand politics in my nation/region 66 63 54 50 58
The BBC helps me understand politics in the other nations of the UK
68 62 54 49 59
Mean Global performance 76 74 71 67 72
The BBC helps me understand what is going on in the wider world, such as international news and events
81 81 77 72 78
The BBC helps me understand the cultures and lifestyles of people from around the world
75 76 73 66 72
The BBC is good at presenting a positive image of the UK to the rest of the world
72 66 63 63 66
Mean Nations, regions and communities performance 52 55 50 48 51
The BBC is good at representing life in my nation/region to the rest of the UK in its main UK news and current affairs programmes and online content
58 57 54 55 56
The BBC is good at representing life in my nation/region to the rest of the UK in its drama, documentaries, and other entertainment programmes and online content
57 60 55 55 57
My regional BBC content provides programmes and content that is for people like me
61 66 61 55 61
The BBC helps me feel more involved and interested in my local community
44 44 44 39 43
The BBC improves my understanding of religions and other beliefs
53 47 42 42 46
The BBC is good at representing my religion* 43 49 46 52 47
The BBC is good at representing my ethnic group* 41 49 43 41 44
The BBC supports the native languages of the UK other than English with programming and other content
50 51 44 46 48
The BBC supports my native language with programming and other content*
58% 69% 59% 51% 59
Mean Education performance 70 69 67 61 67
I have learned new things from programmes or online content on the BBC
75 75 69 66 72
The BBC helps children/teens with what they learn at school/college
64 63 64 57 62
Mean Digital performance 64 61 49 42 54
The BBC provides quality content that I find enjoyable or useful on the internet
71 70 55 47 61
The BBC provides quality content that I find enjoyable or useful on mobile phones and tablets
65 59 47 40 53
The BBC provides quality content that I find enjoyable or useful on DAB digital radio
57 50 40 37 46
The BBC has helped me make the most of new technologies such as interactive TV and the internet
62 59 48 39 52
The BBC provides quality content that I find enjoyable or useful on BBC iPlayer
68 68 53 46 59
Unweighted base – Most statements 616 664 504 630 2,414
*Unweighted base - The BBC is good at representing my religion
286 295 186 203 971
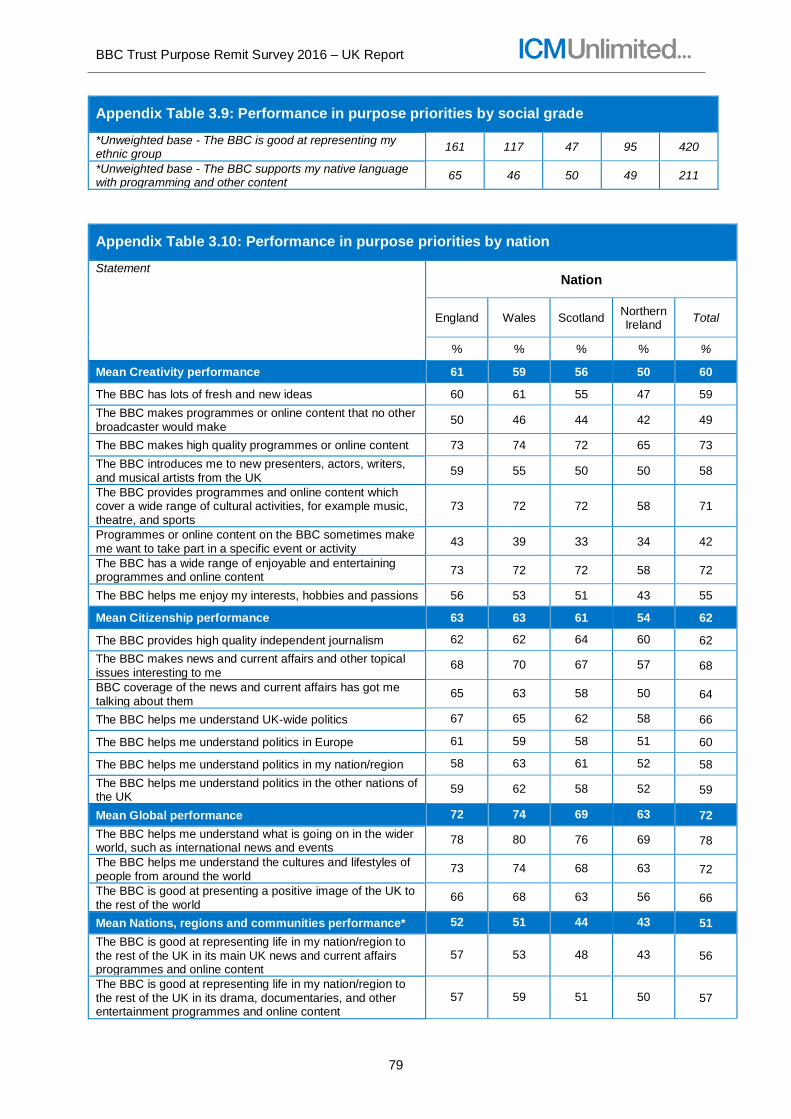
BBC Trust Purpose Remit Survey 2016 – UK Report
79
Appendix Table 3.9: Performance in purpose priorities by social grade
*Unweighted base - The BBC is good at representing my ethnic group
161 117 47 95 420
*Unweighted base - The BBC supports my native language with programming and other content
65 46 50 49 211
Appendix Table 3.10: Performance in purpose priorities by nation
Statement Nation
England Wales Scotland Northern Ireland
Total
% % % % %
Mean Creativity performance 61 59 56 50 60
The BBC has lots of fresh and new ideas 60 61 55 47 59
The BBC makes programmes or online content that no other broadcaster would make
50 46 44 42 49
The BBC makes high quality programmes or online content 73 74 72 65 73
The BBC introduces me to new presenters, actors, writers, and musical artists from the UK
59 55 50 50 58
The BBC provides programmes and online content which cover a wide range of cultural activities, for example music, theatre, and sports
73 72 72 58 71
Programmes or online content on the BBC sometimes make me want to take part in a specific event or activity
43 39 33 34 42
The BBC has a wide range of enjoyable and entertaining programmes and online content
73 72 72 58 72
The BBC helps me enjoy my interests, hobbies and passions 56 53 51 43 55
Mean Citizenship performance 63 63 61 54 62
The BBC provides high quality independent journalism 62 62 64 60 62
The BBC makes news and current affairs and other topical issues interesting to me
68 70 67 57 68
BBC coverage of the news and current affairs has got me talking about them
65 63 58 50 64
The BBC helps me understand UK-wide politics 67 65 62 58 66
The BBC helps me understand politics in Europe 61 59 58 51 60
The BBC helps me understand politics in my nation/region 58 63 61 52 58
The BBC helps me understand politics in the other nations of the UK
59 62 58 52 59
Mean Global performance 72 74 69 63 72
The BBC helps me understand what is going on in the wider world, such as international news and events
78 80 76 69 78
The BBC helps me understand the cultures and lifestyles of people from around the world
73 74 68 63 72
The BBC is good at presenting a positive image of the UK to the rest of the world
66 68 63 56 66
Mean Nations, regions and communities performance* 52 51 44 43 51
The BBC is good at representing life in my nation/region to the rest of the UK in its main UK news and current affairs programmes and online content
57 53 48 43 56
The BBC is good at representing life in my nation/region to the rest of the UK in its drama, documentaries, and other entertainment programmes and online content
57 59 51 50 57

BBC Trust Purpose Remit Survey 2016 – UK Report
80
Appendix Table 3.10: Performance in purpose priorities by nation
My regional BBC content provides programmes and content that is for people like me
61 66 58 56 61
The BBC helps me feel more involved and interested in my local community
44 35 31 36 43
The BBC improves my understanding of religions and other beliefs
47 44 36 37 46
The BBC is good at representing my religion* 48 40 47 37 47
The BBC is good at representing my ethnic group* 44 39 12 40 44
The BBC supports the native languages of the UK other than English with programming and other content
47 60 54 44 48
The BBC supports my native language with programming and other content*
59 61 60 42 59
Mean Education performance 68 63 65 56 67
I have learned new things from programmes or online content on the BBC
73 68 67 61 72
The BBC helps children/teens with what they learn at school/college
63 58 63 50 62
Mean Digital performance 55 54 46 43 54
The BBC provides quality content that I find enjoyable or useful on the internet
62 64 52 50 61
The BBC provides quality content that I find enjoyable or useful on mobile phones and tablets
53 54 46 47 53
The BBC provides quality content that I find enjoyable or useful on DAB digital radio
48 42 36 32 46
The BBC has helped me make the most of new technologies such as interactive TV and the internet
53 51 46 39 52
The BBC provides quality content that I find enjoyable or useful on BBC iPlayer
60 61 51 47 59
Unweighted base – Most statements 1,341 359 358 356 2,414
*Unweighted base - The BBC is good at representing my religion
635 117 128 205 1,085
*Unweighted base - The BBC is good at representing my ethnic group
447 15 49 86 597
*Unweighted base - The BBC supports my native language with programming and other content
87 119 99 53 358
*Nb. For the individual nations, the average performance scores for the Nations, regions and communities purpose exclude the three statements not asked of the full sample due to small base sizes.
Appendix Table 3.11: Performance in purpose priorities by ethnicity
Statement Ethnicity
White British/
Irish Asian Black
Chinese/Mixed/ Other
Total
% % % % %
Mean Creativity performance 60 57 57 58 60
The BBC has lots of fresh and new ideas 60 53 56 57 59
The BBC makes programmes or online content that no other broadcaster would make
48 53 44 57 49
The BBC makes high quality programmes or online content 74 65 68 64 73
The BBC introduces me to new presenters, actors, writers, and musical artists from the UK
59 53 50 58 58

BBC Trust Purpose Remit Survey 2016 – UK Report
81
Appendix Table 3.11: Performance in purpose priorities by ethnicity
The BBC provides programmes and online content which cover a wide range of cultural activities, for example music, theatre, and sports
72 62 75 61 71
Programmes or online content on the BBC sometimes make me want to take part in a specific event or activity
41 48 43 49 42
The BBC has a wide range of enjoyable and entertaining programmes and online content
73 67 68 66 72
The BBC helps me enjoy my interests, hobbies and passions 56 55 52 50 55
Mean Citizenship performance 63 64 63 59 62
The BBC provides high quality independent journalism 63 60 57 56 62
The BBC makes news and current affairs and other topical issues interesting to me
69 63 66 60 68
BBC coverage of the news and current affairs has got me talking about them
64 67 66 60 64
The BBC helps me understand UK-wide politics 66 68 70 65 66
The BBC helps me understand politics in Europe 60 64 62 56 60
The BBC helps me understand politics in my nation/region 58 61 62 57 58
The BBC helps me understand politics in the other nations of the UK
58 64 60 57 59
Mean Global performance 73 71 72 66 72
The BBC helps me understand what is going on in the wider world, such as international news and events
79 73 74 70 78
The BBC helps me understand the cultures and lifestyles of people from around the world
73 69 70 63 72
The BBC is good at presenting a positive image of the UK to the rest of the world
66 70 72 64 66
Mean Nations, regions and communities performance 50 52 52 45 51
The BBC is good at representing life in my nation/region to the rest of the UK in its main UK news and current affairs programmes and online content
57 54 55 53 56
The BBC is good at representing life in my nation/region to the rest of the UK in its drama, documentaries, and other entertainment programmes and online content
57 57 58 52 57
My regional BBC content provides programmes and content that is for people like me
63 55 52 45 61
The BBC helps me feel more involved and interested in my local community
43 46 44 38 43
The BBC improves my understanding of religions and other beliefs
45 54 49 47 46
The BBC is good at representing my religion* 47 39 58 50 47
The BBC is good at representing my ethnic group* 30 45 43 45 44
The BBC supports the native languages of the UK other than English with programming and other content*
48 50 56 47 48
The BBC supports my native language with programming and other content*
61 70 51 32 59
Mean Education performance 67 60 67 64 67
I have learned new things from programmes or online content on the BBC
73 63 70 68 72
The BBC helps children/teens with what they learn at school/college
62 57 64 60 62
Mean Digital performance 53 62 63 60 54
The BBC provides quality content that I find enjoyable or useful on the internet
60 67 71 65 61
The BBC provides quality content that I find enjoyable or useful on mobile phones and tablets
51 62 65 66 53

BBC Trust Purpose Remit Survey 2016 – UK Report
82
Appendix Table 3.11: Performance in purpose priorities by ethnicity
The BBC provides quality content that I find enjoyable or useful on DAB digital radio
45 56 55 47 46
The BBC has helped me make the most of new technologies such as interactive TV and the internet
51 59 61 62 52
The BBC provides quality content that I find enjoyable or useful on BBC iPlayer
58 65 66 62 59
Unweighted base – Most statements 2,021 148 116 130 2,414
*Unweighted base - The BBC is good at representing my religion
711 117 80 63 971
*Unweighted base - The BBC is good at representing my
ethnic group 27 148 116 130 420
*Unweighted base - The BBC supports my native language with programming and other content
178 11 5 17 211
Appendix Table 3.12: Performance in purpose priorities by subjective income Statement Subjective income
Living comforta
bly
Doing alright
Just about getting
by
Finding it quite difficult
Finding it very difficult
Total
% % % % % %
Mean Creativity performance 68 63 56 53 41 60
The BBC has lots of fresh and new ideas 67 63 55 55 38 59
The BBC makes programmes or online content that no other broadcaster would make
59 52 45 40 31 49
The BBC makes high quality programmes or online content
82 75 70 64 53 73
The BBC introduces me to new presenters, actors, writers, and musical artists from the UK
64 63 56 47 39 58
The BBC provides programmes and online content which cover a wide range of cultural activities, for example music, theatre, and sports
76 74 70 63 50 71
Programmes or online content on the BBC sometimes make me want to take part in a specific event or activity
51 44 37 41 26 42
The BBC has a wide range of enjoyable and entertaining programmes and online content
80 75 69 69 47 72
The BBC helps me enjoy my interests, hobbies and passions
64 60 49 44 43 55
Mean Citizenship performance 70 66 59 53 43 62
The BBC provides high quality independent journalism 67 68 57 52 42 62
The BBC makes news and current affairs and other topical issues interesting to me
75 71 66 57 48 68
BBC coverage of the news and current affairs has got me talking about them
76 65 59 55 50 64
The BBC helps me understand UK-wide politics 74 72 63 55 42 66
The BBC helps me understand politics in Europe 70 64 56 50 38 60
The BBC helps me understand politics in my nation/region
65 62 54 51 38 58
The BBC helps me understand politics in the other nations of the UK
66 61 55 50 41 59
Mean Global performance 78 75 71 64 54 72
The BBC helps me understand what is going on in the wider world, such as international news and events
83 80 77 70 58 78
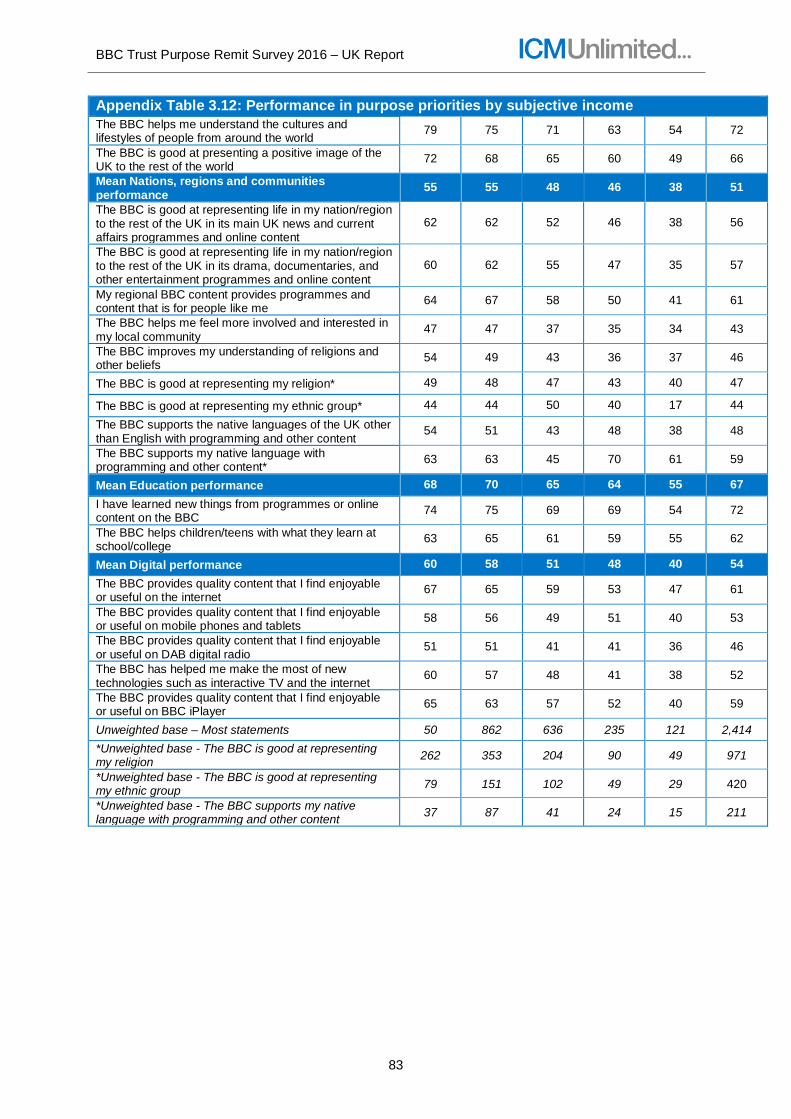
BBC Trust Purpose Remit Survey 2016 – UK Report
83
Appendix Table 3.12: Performance in purpose priorities by subjective income The BBC helps me understand the cultures and lifestyles of people from around the world
79 75 71 63 54 72
The BBC is good at presenting a positive image of the UK to the rest of the world
72 68 65 60 49 66
Mean Nations, regions and communities performance
55 55 48 46 38 51
The BBC is good at representing life in my nation/region to the rest of the UK in its main UK news and current affairs programmes and online content
62 62 52 46 38 56
The BBC is good at representing life in my nation/region to the rest of the UK in its drama, documentaries, and other entertainment programmes and online content
60 62 55 47 35 57
My regional BBC content provides programmes and content that is for people like me
64 67 58 50 41 61
The BBC helps me feel more involved and interested in my local community
47 47 37 35 34 43
The BBC improves my understanding of religions and other beliefs
54 49 43 36 37 46
The BBC is good at representing my religion* 49 48 47 43 40 47
The BBC is good at representing my ethnic group* 44 44 50 40 17 44
The BBC supports the native languages of the UK other than English with programming and other content
54 51 43 48 38 48
The BBC supports my native language with programming and other content*
63 63 45 70 61 59
Mean Education performance 68 70 65 64 55 67
I have learned new things from programmes or online content on the BBC
74 75 69 69 54 72
The BBC helps children/teens with what they learn at school/college
63 65 61 59 55 62
Mean Digital performance 60 58 51 48 40 54
The BBC provides quality content that I find enjoyable or useful on the internet
67 65 59 53 47 61
The BBC provides quality content that I find enjoyable or useful on mobile phones and tablets
58 56 49 51 40 53
The BBC provides quality content that I find enjoyable or useful on DAB digital radio
51 51 41 41 36 46
The BBC has helped me make the most of new technologies such as interactive TV and the internet
60 57 48 41 38 52
The BBC provides quality content that I find enjoyable or useful on BBC iPlayer
65 63 57 52 40 59
Unweighted base – Most statements 50 862 636 235 121 2,414
*Unweighted base - The BBC is good at representing my religion
262 353 204 90 49 971
*Unweighted base - The BBC is good at representing my ethnic group
79 151 102 49 29 420
*Unweighted base - The BBC supports my native language with programming and other content
37 87 41 24 15 211

BBC Trust Purpose Remit Survey 2016 – UK Report
84
Appendix 4: Platform usage and BBC consumption
Appendix Table 4.1: Platform usage and BBC consumption
Platforms used
Watched television in the last month 97
Listened to the radio in the last month 77
Used the internet in the last month 92
Use a smartphone or tablet computer 85
Unweighted base – all participants 2,414
Platforms used to access BBC content in the last month8
Watched BBC TV in the last month 96
Listened to BBC radio in the last month 62
Accessed the BBC website in the last month 50
Used BBC apps in the last month 42
Watched video content on BBC iPlayer in the last month 49
Accessed BBC content through Social Media in the last month 20
Unweighted base – all participants 2,414
Total no. of platforms used to access BBC content in the last month
0 2
1 16
2 20
3 18
4 19
5 16
6 8
Unweighted base – all participants 2,414
Mean no. of hours of BBC content consumed per week
Television 13.0
Unweighted base – all participants responding 2,239
Radio 10.1
Unweighted base – all participants responding 1,489
BBC website/BBC apps 3.9
Unweighted base – all participants responding 1,491
BBC iPlayer 4.1
Unweighted base – all participants responding 1,180
8 Where participants do not use the platform at all, it is assumed that they do not consume BBC content through that platform.

BBC Trust Purpose Remit Survey 2016 – UK Report
85
Appendix 5: Guide to statistical reliability
The respondents to the questionnaire are only a sample of the total UK population. We
cannot, therefore, be certain that the figures obtained are exactly those we would have if
everyone in the UK population had been interviewed (the ‘true’ values). We can, however,
predict the variation between the sample results and the ‘true’ values from knowledge of the
size of the samples on which the results are based and the number of times that a particular
answer is given.
The confidence with which we can make this prediction is usually chosen to be 95 - that is,
the chances are 95 in 100 that the “true” value will fall within a specified range. The table
below illustrates the predicted ranges for different sample sizes and percentage results at
the “95 confidence interval”9.
Size of sample on which survey result is based
Approximate sampling tolerances applicable to percentages at or near these levels
Statistical reliability
10/90 30/70 50/50
100 interviews 5.9 9.0 9.8
350 interviews (i.e. Wales,
Northern Ireland or Scotland) 3.1 4.8 5.2
500 interviews 2.6 4.0 4.4
1,000 interviews 1.9 2.8 3.1
1,341 interviews (i.e. England) 1.6 2.5 2.7
2,000 interviews 1.3 2.0 2.2
2,414 interviews (i.e. full sample) 1.2 1.8 2.0
* For example, with a sample of 350 respondents (such as Wales, Northern Ireland or
Scotland) where 30 give a particular answer, the chances are 19 in 20 that the “true” value
(which would have been obtained if the whole population had been interviewed) will fall
within the range of plus or minus 4.8 percentage points (+/-4.8) from the sample result.
Comparing percentages between sub-groups and the overall total
When results are compared between separate groups within a sample, different results may
be obtained. The difference may be “real”, or it may occur by chance (because not everyone
in the population has been interviewed). To test if the difference is a real one - i.e. if it is
“statistically significant”, we again have to know the size of the samples, the percentage
giving a certain answer and the degree of confidence chosen. If we assume the “95
confidence interval”, the differences between the two sample results must be greater than
the values given in the table below:
9 It should be noted that these figures assume a simple random possibility sample design with no design effects; in reality, with quota surveys these are likely to occur and widen the margin of error, so this should be treated as a guide.

BBC Trust Purpose Remit Survey 2016 – UK Report
86
Size of samples compared Differences required for percentage levels
significance at or near these
Statistical reliability
10/90 30/70 50/50
350 and 350 (i.e. N. Ireland and
Wales) 4.5 6.8 7.4
500 and 500 3.7 5.0 6.2
500 and 1,000 3.2 4.9 5.4
1,000 and 1,000 2.6 4.0 4.4
1,000 and 2,000 2.3 3.5 3.8
2,414 and 350 (i.e. UK and
Wales, N. Ireland or Scotland) 3.4 5.1 5.6
2,414 and 1,341 (i.e. UK and
England) 2.0 3.1 3.3
* For example, when comparing the results between the overall sample and those in Wales
(2,414 compared to 350), where 30 give a particular answer, a difference of 5.1 is required
for it to be considered statistically significant.

BBC Trust Purpose Remit Survey 2016 – UK Report
87
Appendix 6: Purpose Remit Survey Face-to-Face questionnaire
INTRODUCTION: Good morning / afternoon / evening. My name is … and I’m here on behalf of ICM
Unlimited, the independent research company. We’re carrying out an important survey for the BBC.
By taking part in this research, you will have the opportunity to have your say on the BBC. Your views
will influence what the BBC does in future.
IF ASKED: Your opinions are important to us regardless of how much or little you use BBC services.
I would like to assure you that all the information we collect will be kept in the strictest confidence, in
accordance with the Data Protection Act, and used for research purposes only. It will not be possible
to identify any particular individual or address in the results.
SECTION 1: SCREENER DEMOGRAPHICS
The first set of questions allows us to be sure that we speak to a representative spread of people
across the country.
S1
Are you male or female?
1. Male
2. Female
S2
What was your age last birthday?
TYPE IN __________
Derive age range
15-24; 25-34; 35-44; 45-54; 55-64; 65-74; 75-99
S3
Which of these best describes your employment at the moment?
1. Working in a paid job (30+ hours per week)
2. Working in a paid job (8 – 29 hours per week)
3. Working in a paid job (less than 8 hours)
4. Self-employed
5. Not in paid employment / looking after house or home
6. Full time student at school
7. Full time student at university / college
8. Unemployed
9. Retired from paid employment
10. Other - Employed
11. Other - Unemployed

BBC Trust Purpose Remit Survey 2016 – UK Report
88
Qpostc What is your postcode? TYPE IN __________
Derive Nation / BBC region / BBC Local Radio station
S4
Please select the appropriate BBC nation/ region for where you live:
1. London
2. Scotland
3. West Midlands
4. South East
5. Northern Ireland
6. North West
7. East
8. South West
9. East Midlands
10. Wales
11. South
12. North East and Cumbria
13. West
14. Yorkshire and Lincolnshire
S5
What is the occupation of the MAIN INCOME EARNER in your household?
Please select the answer which most applies. If you are now retired, please indicate the most
appropriate job title prior to your retirement.
1. Higher managerial / professional / administrative
e.g. Established Doctor, Solicitor, Board Director in a large organisation (200+
employees), top level Civil Servant / Public Service employee.
2. Intermediate managerial / professional / administrative
e.g. Newly qualified (under 3 years) Doctor, Solicitor, Board Director in a small
organisation, Middle Manager in a large organisation, Principal Officer in the
Civil Service / Local Government.
3. Supervisory or clerical / junior managerial / professional / administrative
e.g. Office Worker, Student Doctor, Foreman with 25+ employees, Salesperson.
4. Skilled manual worker
e.g. Skilled Bricklayer, Carpenter, Plumber, Painter, Bus / Ambulance driver,
HGV driver, AA Patrolman.
5. Semi or unskilled manual work
e.g. Manual workers, all apprentices in skilled trades, Caretaker, Park Keeper,
non-HGV driver, Shop Assistant, Pub / Bar Worker.
6. Full time education
7. Unemployed
8. Home maker
Derive social grade

BBC Trust Purpose Remit Survey 2016 – UK Report
89
QEthn Please indicate which best describes your ethnic background?
1. White – British/English/Welsh/Scottish/Northern Irish
2. White – Irish
3. White – Any other White background
4. Mixed – White and Black Caribbean
5. Mixed – White and Black African
6. Mixed – White and Asian
7. Mixed – any other Mixed background
8. Asian or Asian British – Indian
9. Asian or Asian British – Pakistani
10. Asian or Asian British – Bangladeshi
11. Asian or Asian British – Chinese
12. Asian or Asian British – any other Asian background
13. Black or Black British – Caribbean
14. Black or Black British – African
15. Black or Black British – any other Black background
16. Other ethnic group – Arab
17. Other ethnic group – other
-8 Don’t know
-9 Refused
IF QEthn = 3 OR 7 OR 12 OR 15 OR 17
THEN ASK QEthnOth
QEthnOth
What is your ethnic background?
TYPE IN __________
S7
Do you speak, or are you currently learning, any of the following languages?
Please select all that apply.
Randomise list – except ‘None of these’ which should always appear last
1. Welsh
2. Scottish Gaelic
3. Ulster Scots
4. Irish
5. Cornish
6. Manx
7. Scots
8. None of these [SINGLE CODE]
S8
Do you follow any particular religion or other belief?
1. Yes
2. No
-8 Don’t Know

BBC Trust Purpose Remit Survey 2016 – UK Report
90
IF S8 = Yes THEN ASK S9
S9
Which religion or other belief do you follow?
1. Buddhism
2. Christianity (e.g. Church of England, Roman Catholic, Protestant, any other Christian denomination)
. Hinduism
4. Humanism
5. Islam
6. Judaism
7. Sikhism
0. Other
-9 Refused
IF S9 = 0 THEN ASK S9Oth
S9Oth
What religion do you follow?
TYPE IN __________
SECTION 2: MEDIA CONSUMPTION
Thank you for answering those questions. Now, we’d like to start by asking you a bit about the kind of
media you use.
Qtv1
Have you personally watched television in the last month?
Please do not include television watched through ‘video on demand’ services such as BBC iPlayer or
Netflix.
1. Yes
2. No
-8 Don’t Know
IF Qtv1 = Yes THEN ASK Qtv2
Qtv2
Have you personally watched any of the BBC television channels in the last month?
(For example BBC One, BBC Two, BBC Three, BBC Four, BBC News Channel, CBeebies, CBBC,
BBC Parliament, BBC ALBA or any BBC HD channel.)
Please do not include television watched through BBC iPlayer
1. Yes
2. No
-8 Don’t Know

BBC Trust Purpose Remit Survey 2016 – UK Report
91
IF Qtv2 = Yes THEN ASK Qtv3 Qtv3
How many hours a week would you say you spend watching any of the BBC television channels?
(For example BBC One, BBC Two, BBC Three, BBC Four, BBC News Channel, CBeebies, CBBC,
BBC Parliament, BBC ALBA or any BBC HD channel)
Please do not include television watched through BBC iPlayer
TYPE IN __________
-8. Don’t know
IF Qtv1 = Yes THEN ASK Qtv4
Qtv4
Which ways do you receive TV, on any set in your household?
Please do not include television watched through ‘video on demand’ services such as BBC iPlayer or
Netflix.
Please select all that apply.
1. Freeview/Digital Terrestrial/Freesat
2. Sky
3. Other paid-for subscription service (e.g. Virgin Media, BT TV
or TalkTalk TV)
0. Other
-8 Don’t know [EXCLUSIVE]
ASK ALL
Qrad1
Have you personally listened to the radio in the last month?
Please include listening through any medium, including digital radios, the television, the internet,
podcasts, apps, or BBC iPlayer radio.
1. Yes
2. No
-8 Don’t Know
IF Qrad1 = Yes THEN ASK Qrad2
Qrad2
Have you personally listened to any BBC radio content in the last month, through any medium?
(For example, Radio 1, Radio 2, Radio 3, Radio 4, Radio 5 Live, Radio 1Xtra, Radio 6 Music, radio 4
Extra, Radio Asian Network, BBC Local Radio, or BBC World Service.)
1. Yes
2. No
-8 Don’t Know

BBC Trust Purpose Remit Survey 2016 – UK Report
92
IF Qrad2 = 1 THEN ASK Qrad3, Qrad4 and Qrad5
Qrad3
How many hours a week would you say you spend listening to any of the BBC radio stations?
(For example, Radio 1, Radio 2, Radio 3, Radio 4, Radio 5 Live, Radio 1Xtra, Radio 6 Music, Radio 4
Extra, Radio Asian Network, BBC Local Radio, or BBC World Service.)
TYPE IN __________
-8. Don’t know
Qrad4
Do you regularly listen to any BBC radio content through a DAB digital radio?
1. Yes
2. No
-8 Don’t Know
Qrad5
Do you regularly listen to the radio through BBC iPlayer radio?
Please include use through any device, including a computer, smartphone or tablet computer.
1. Yes
2. No
-8 Don’t Know
ASK ALL
Q2
Have you personally used the internet, from any location, in the last month?
1. Yes
2. No
-8 Don’t Know
IF Qintnet = Yes THEN ASK Qint2
Qint2
Have you used any part of the BBC website, bbc.co.uk, in the last month?
Please do not include accessing the BBC iPlayer or iPlayer radio website.
1. Yes
2. No
-8 Don’t Know

BBC Trust Purpose Remit Survey 2016 – UK Report
93
ASK ALL Qapp
Do you use a smartphone or tablet computer (e.g. iPhone, Samsung Galaxy phone, iPad or Kindle
Fire)?
1. Yes
2. No
-8 Don’t Know
IF Qapp1 = Yes THEN ASK Qapp2
Qapp2
Have you used any BBC apps in the last month on your smartphone or tablet computer (for example
the BBC News, BBC Sport or BBC Weather apps)?
Please do not include the BBC iPlayer or iPlayer radio apps.
1. Yes
2. No
-8 Don’t Know
IF Qint2 = Yes OR IF Qapp2 = Yes THEN ASK Qint3
Qint3
How many hours a week would you say you spend using the BBC website or any of the BBC apps
(excluding BBC iPlayer and iPlayer radio)?
TYPE IN __________
-8. Don’t know
ASK ALL
Qvod1
Have you watched video content through BBC iPlayer, the BBC’s video on demand service, in the last
month?
Please include use through any device, including a computer, smartphone, tablet computer, smart TV
or games console.
1. Yes
2. No
-8 Don’t Know
IF Qvod1 = Yes THEN ASK Qvod2
Qvod2
How many hours a week would you say you watch video content through BBC iPlayer?
TYPE IN __________
-8. Don’t know

BBC Trust Purpose Remit Survey 2016 – UK Report
94
ASK ALL
Qsm
In the past month, have you accessed any BBC content on social media sites, for example on Twitter
or BBC Facebook pages?
1. Yes
2. No
-8 Don’t Know
SECTION 3: GENERAL VIEWS OF THE BBC
We’d now like to get your general views on the BBC as well as some of the other broadcasters.
Qoveral
Thinking about the BBC generally, what is your overall impression on a scale of 1 to 10, where 1 means
extremely unfavourable and 10 means extremely favourable? LAYOUT: SLIDING SCALE
1. Extremely unfavourable
2.
3.
4.
5.
6.
7.
8.
9.
10. Extremely favourable
-8 Don’t Know
Qmiss
To what extent do you agree or disagree with each statement?
1. Definitely agree
2. Tend to agree
3. Neither agree nor disagree
4. Tend to disagree
5. Definitely disagree
-8 Don’t Know
Randomise list – display as grid
• I would miss the BBC if it wasn’t there
• I would miss ITV if it wasn’t there [STV in Scotland; UTV in NI]
• I would miss Channel 4 if it wasn’t there
• I would miss Channel 5 if it wasn’t there
• I would miss Sky if it wasn’t there
• I would miss S4C if it wasn’t there [ONLY ask in Wales]
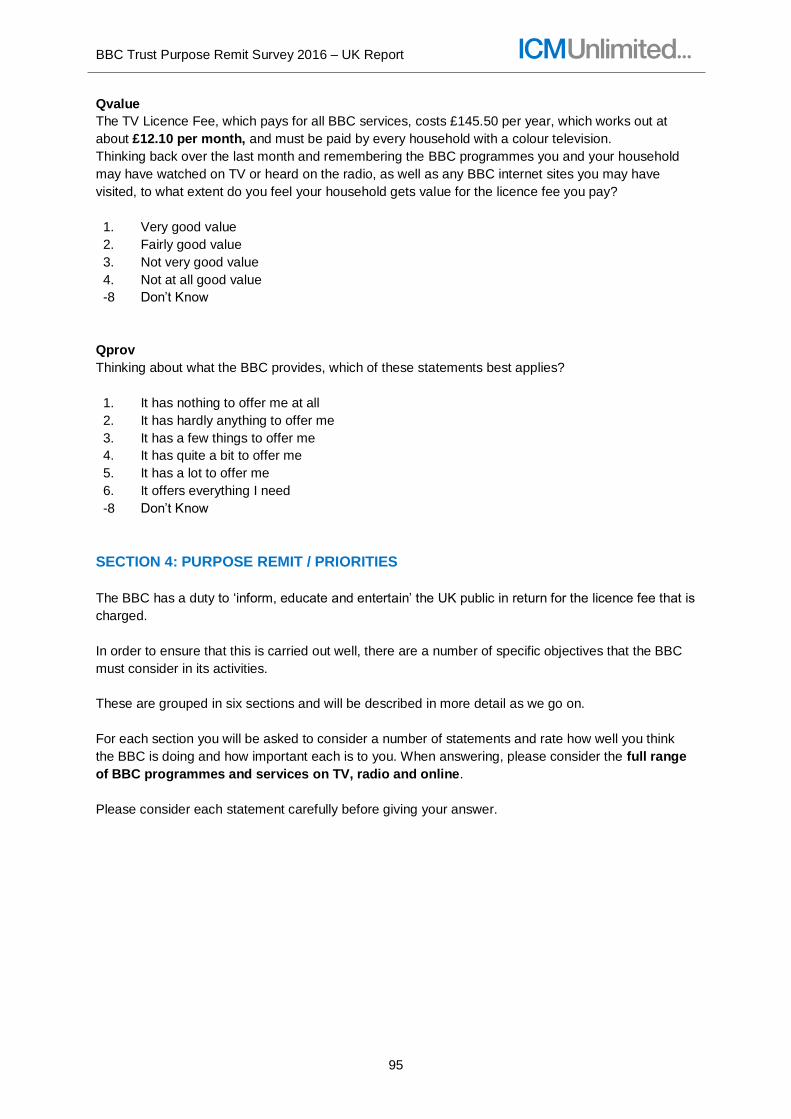
BBC Trust Purpose Remit Survey 2016 – UK Report
95
Qvalue
The TV Licence Fee, which pays for all BBC services, costs £145.50 per year, which works out at
about £12.10 per month, and must be paid by every household with a colour television.
Thinking back over the last month and remembering the BBC programmes you and your household
may have watched on TV or heard on the radio, as well as any BBC internet sites you may have
visited, to what extent do you feel your household gets value for the licence fee you pay?
1. Very good value
2. Fairly good value
3. Not very good value
4. Not at all good value
-8 Don’t Know
Qprov
Thinking about what the BBC provides, which of these statements best applies?
1. It has nothing to offer me at all
2. It has hardly anything to offer me
3. It has a few things to offer me
4. It has quite a bit to offer me
5. It has a lot to offer me
6. It offers everything I need
-8 Don’t Know
SECTION 4: PURPOSE REMIT / PRIORITIES
The BBC has a duty to ‘inform, educate and entertain’ the UK public in return for the licence fee that is
charged.
In order to ensure that this is carried out well, there are a number of specific objectives that the BBC
must consider in its activities.
These are grouped in six sections and will be described in more detail as we go on.
For each section you will be asked to consider a number of statements and rate how well you think
the BBC is doing and how important each is to you. When answering, please consider the full range
of BBC programmes and services on TV, radio and online.
Please consider each statement carefully before giving your answer.

BBC Trust Purpose Remit Survey 2016 – UK Report
96
[FOR EACH STATEMENT, THE FOLLOWING QUESTIONS AND ACCOMPANYING ANSWER
CATEGORIES ARE LOOPED]
Qperf
To what extent do you agree or disagree with the following statements?
1. Completely disagree
2. Disagree strongly
3. Disagree slightly
4. Neither agree nor disagree
5. Agree slightly
6. Agree strongly
7. Completely agree
Qimp
How important or unimportant for you personally is it that…
1. Extremely unimportant
2. Very unimportant
3. Quite unimportant
4. Neither important nor unimportant
5. Quite important
6. Very important
7. Vital
Creativity
The first set of questions is about the BBC’s responsibility to encourage interest in cultural, creative
and sporting activities, and to offer the best examples of creative work.
RANDOMISE LIST
• The BBC has lots of fresh and new ideas
• The BBC makes programmes or online content that no other broadcaster would make
• The BBC makes high quality programmes or online content
• The BBC introduces me to new presenters, actors, writers and musical artists from the UK
• The BBC provides programmes and online content which cover a wide range of cultural
activities, for example music, theatre and sports
• Programmes or online content on the BBC sometimes make me want to take part in a specific
event or activity
• The BBC has a wide range of enjoyable and entertaining programmes and online content
• The BBC helps me enjoy my interests, hobbies and passions

BBC Trust Purpose Remit Survey 2016 – UK Report
97
Citizenship
The next set of questions is about the BBC’s responsibility to provide high quality news, current affairs
and factual programming. When answering, please consider the full range of BBC services and
programmes on TV, radio and online.
RANDOMISE LIST
• The BBC provides high quality independent journalism
• The BBC makes news and current affairs and other topical issues interesting to me
• BBC coverage of news and current affairs has got me talking about them
• The BBC helps me understand UK-wide politics
• The BBC helps me understand politics in Europe
• The BBC helps me understand politics in [INSERT NATION/REGION]
• The BBC helps me understand politics in the other nations of the UK [INSERT 3 OTHER
NATIONS/REGIONS OF THE UK NOT LIVED IN]
Global
The next set of questions is about the BBC’s responsibility to ensure that people in the UK are aware
of international issues and of the different cultures and viewpoints of those living outside the UK.
RANDOMISE LIST
• The BBC helps me understand what’s going on in the wider world, such as international news
and events
• The BBC helps me understand the cultures and lifestyles of people from around the world
• The BBC is good at presenting a positive image of the UK to the rest of the world
Nations, regions and communities
The next set of questions is about the BBC’s responsibility to reflect the communities and cultures of
the UK. These may be based on geography, faith, language or a shared interest such as sport.
RANDOMISE LIST
• The BBC is good at representing life in [INSERT NATION/REGION] to the rest of the UK in
its main UK news and current affairs programmes and online content
• The BBC is good at representing life in [INSERT NATION/REGION] to the rest of the UK in
its drama, documentaries and other entertainment programmes and online content
• BBC [INSERT NATION/REGION] provides programmes and online content that is for people
like me
• The BBC helps me feel more involved and interested in my local community
• The BBC improves my understanding of religions and other beliefs
• IF Qfaith1=YES The BBC is good at representing [FILL FROM Qfaith2]
• IF Qethnic=2-14 The BBC is good at representing my ethnic group
• The BBC supports the native languages of the UK other than English (such as Irish, Welsh,
Ulster Scots, Scottish Gaelic and Scots) with programming and other content
• IF Qlang=1-7 The BBC supports the [FILL FROM Qlang] language with programming and
other content

BBC Trust Purpose Remit Survey 2016 – UK Report
98
Education
The next set of questions is about the BBC’s responsibility to support learning for people of all ages
through its programmes and online content.
RANDOMISE LIST
• I have learned new things from programmes or online content on the BBC
• The BBC helps children/ teens with what they learn at school/ college
Digital
The final set of questions in this section is about the BBC’s responsibility to ensure that the public
benefit from new communication technologies such as digital television, broadband and the wider use
of smartphones.
RANDOMISE FIRST FOUR STATEMENTS ONLY. STATEMENT 5 ABOUT BBC iPlayer SHOULD
ALWAYS APPEAR LAST
• The BBC provides quality content that I find enjoyable or useful on the internet, e.g.
bbc.co.uk, the iPlayer, BBC Bitesize
• The BBC provides quality content that I find enjoyable or useful on mobile phones and tablets,
e.g. bbc.co.uk/mobile, BBC News app, iPlayer app
• The BBC provides quality content that I find enjoyable or useful on DAB digital radio, e.g.
radio stations such as 1Xtra, 4 Extra, 5 Live Sports Extra, 6Music, Asian Network, World
Service
• The BBC has helped me make the most of new technologies such as interactive TV and the
internet
• The BBC provides quality content that I find enjoyable or useful on BBC iPlayer, its video on
demand service
SECTION 5: LIFESTYLE
The BBC has a duty to all licence fee payers and so has to consider a wide range of audiences in
what it does. The next few questions will help us gather information about a representative sample of
people. This is the last section of the interview.
Once again, please be assured that all answers you provide will be confidential.
Q27
How many people (adults and children) live in the household including yourself?
WRITE IN NUMBER: _______
-9. Refused
DERIVE NUMBER IN HOUSEHOLD
1, 2, 3, 4, 5, 6, 7+

BBC Trust Purpose Remit Survey 2016 – UK Report
99
IF HHSIZE = REFUSED OR > 1 THEN ASK Hhad
Q28
Do you have any children aged under 18 living in the household for whom you are responsible?
1. Yes
2. No
-8 Don’t Know
IF Q28 = 1 THEN ASK Q29
Q29
In which of the following age bands are your children?
Please select all that apply.
1. 0-1
2. 2-4
3. 5-9
4. 10-15
5. 16-18
-9 Refused [EXCLUSIVE]
Q30
At what age did you finish your full time education?
1. 14 or under
2. 15
3. 16
4. 17
5. 18
6. 19
7. 20
8. 21-23
9. 24 or more
0. Still studying
-9 Refused
Income2
How well would you say you are managing financially these days? Would you say you are…?
1. Living comfortably
2. Doing alright
3. Just about getting by
4. Finding it quite difficult
5. Finding it very difficult
-8 Don’t know
-9 Refused

BBC Trust Purpose Remit Survey 2016 – UK Report
100
Q32
Do you have any long-term illness, health problems or disability which limits your daily activities or the
work you do? This includes problems which are due to old age.
1. Yes
2. No
-8 Don’t Know
-9 Refused
Q34
So the BBC can ensure they are representing the UK population and providing relevant programmes
and topics, please indicate which of the following you consider yourself to be.
1. Heterosexual or straight
2. Gay or Lesbian
3. Bisexual
4. Prefer not to say
0. Other
Thank you very much for your time today and for answering our questions. As mentioned, your views
will influence what the BBC does in future.
This survey is being carried out for the BBC Trust which exists to get the best out of the BBC for
licence fee payers. If you’d like any more information on what the Trust does, you can visit their
website at www.bbc.co.uk/bbctrust.