push, pull, or both? a behavioral study of inventory risk ...emk120030/pushpull.pdf · push, pull,...
TRANSCRIPT

Push, Pull, or Both? A Behavioral Study of Inventory Risk on Channel Efficiency
Andrew M. Davis • Elena Katok • Natalia Santamaría
The Johnson School of Graduate Management, Cornell University, Ithaca, NY 14853, USA
The Jindal School of Management, University of Texas at Dallas, Richardson, TX 75080, USA The Johnson School of Graduate Management, Cornell University, Ithaca, NY 14853, USA
[email protected] • [email protected] • [email protected]
August 14, 2013
In this paper we experimentally investigate how the allocation of inventory risk in a two-stage supply chain affects channel efficiency. We first evaluate two common wholesale price contracts that differ in which party incurs the risk associated with unsold inventory; a push contract in which the retailer incurs the risk, and a pull contract in which the supplier incurs the risk. Our experimental results show that a pull contract achieves higher channel efficiency than that of a push contract, and that behavior systematically deviates from the standard theory. Therefore, we extend the existing theory to incorporate a number of behavioral regularities and structurally estimate its parameters. The estimates suggest that a combination of errors with loss aversion organizes our data remarkably well. Following this we explore a third contract, the advanced purchase discount (APD) contract, which combines certain features of push and pull by allowing both parties to share the inventory risk. We apply our behavioral model to the APD contract in a separate experiment as an out-of-sample test and find that it accurately predicts channel efficiency and qualitatively matches decisions. Lastly, from a managerial perspective, we observe that the APD contract weakly Pareto dominates the push contract; retailers are better off and suppliers are no worse off under the APD contract.
Davis, Katok, Santamaría: Push, Pull, or Both?
1
Introduction 1.Location and ownership of inventory is one of the key drivers of supply chain performance. Even in
a simple supply channel—single retailer, single supplier, and full information—researchers and
companies find that common wholesale price contracts with different inventory allocations affect
channel efficiency (e.g. Lariviere and Porteus 2001, Cachon 2003, Kaya and Özer 2012). Channel
design decisions are made at the highest managerial levels, as they involve a number of difficult
tradeoffs and have a direct effect on a firm’s survival. For instance, Randall, Netessine and Rudi
(2002) provide examples of companies in which the difference between success and bankruptcy
could be attributed to different inventory allocation strategies. Furthermore, Randall, Netessine and
Rudi (2006) identify, and empirically investigate, how factors such as revenue, product variety, and
profit margins, impact a firm’s decision to own the inventory.
Traditional channels use a “push” structure in which the retailer makes stocking decisions, owns
the inventory, and thus incurs the holding cost as well as the cost of any unsold product. However,
Internet-enabled technologies now permit other supply chains arrangements for allocating inventory
ownership and risk (the cost of unsold inventory), which may affect channel profitability (see
Netessine and Rudi 2006 and Cachon 2004).
Alternatively, under a “pull” inventory system, the supplier makes the stocking (production)
decision, and therefore incurs most of the holding costs and inventory risk. The retailer provides a
storefront (real or virtual), and products flow from the supplier to the end customer with minimal
exposure of the retailer to inventory risk. One extreme implementation of the pull inventory system
is a drop-shipping arrangement—the retailer is never exposed to the inventory at all—the suppliers
ship to customers directly. Such arrangements are quite prevalent in e-commerce; Randall et al. 2006
report that between 23% and 33% of Internet retailers use drop-shipping exclusively, and the U.S.
Census estimates that e-commerce sales by retailers totaled $194 billion in 2011, up 16.4% compared
to 2010 (U.S. Census Bureau 2013). Additionally, supply chains selling specialty products utilize
pull structures (Klein 2009). The popularity of these contracts has even created opportunities for
companies to specialize in providing drop-shipping services for businesses (Davis 2013 provides an
example of CommerceHub). Less extreme pull arrangements exist as well, including just-in-time
(JIT) delivery—the supplier delivers in small batches, thus becoming effectively responsible for
holding cost and inventory risk, and vendor-managed inventory (VMI), in which the supplier makes
stocking decisions, but the retailer holds the physical inventory.

Davis, Katok, Santamaría: Push, Pull, or Both? 2
Another inventory structure, the “advance purchase discount” (APD) contract, combines the
aspects of the push and the pull systems so that both parties share the inventory risk (Cachon 2004).
Cachon (2004) provides the example of O'Neill Inc., a manufacturer of water-sports apparel, which
successfully uses the APD contract. In another study, Tang and Girotra (2010) evaluate how an APD
structure impacts Costume Gallery, a privately-owned wholesaler of dance costumes, and estimate
that the company could increase it net profits by 17% if it adopted an APD contract.
The question of how to structure the channel to best allocate inventory risk, and the effect of
inventory risk on channel performance, has been extensively studied analytically (Netessine and Rudi
2006, Cachon 2004, Özer and Wei 2006, Özer, Unca and Wei 2007). In practice, however, top-level
managers make these decisions, since they are strategic, involve difficult tradeoffs, and, therefore,
are not automated. Consequently, it is critical to understand how differences in inventory risk
location affect profits, when decisions are made by human decision-makers. To gain insights into the
role human judgment plays in channel design decisions, we conduct a set of laboratory experiments
to explore human behavior in push and pull settings. We find that the standard model is qualitatively
consistent with some of the aspects of the data, but we also identify systematic deviations. Therefore,
we extend the standard model to account for behavioral regularities we observe. We characterize and
derive the equilibrium predictions for a number of behavioral models that have been identified in the
recent literature (Su 2008, Ho and Zhang 2008, Ho et al. 2010, Cui et al 2007), structurally estimate
their parameters, and find that a simple model of loss aversion with random errors fits the data
remarkably well.
We then find that this model makes accurate out-of-sample predictions about the performance of
the APD contract, which includes push and pull features. We consider this an important contribution
to the literature because identifying systematic deviations from standard theory, and incorporating
these behavioral regularities into analytical models, helps to understand their causes and provides
insights that result in designing contracting mechanisms that are behaviorally robust. Using our
model, managers can take into account behavioral regularities when they design channel structures.
Our experimental results highlight a number of managerial insights. First, we find that the pull
contract, contrary to theory, achieves the same supply chain efficiency as the APD contract. Second,
our results indicate that when supply chain partners have the ability to pick among the three
alternatives, the push contract should rarely be used as the APD contract Pareto dominates the
traditional push contract. This implies that regardless of who has the most bargaining power in the
channel, the APD contract should be favored over the push contract.

Davis, Katok, Santamaría: Push, Pull, or Both? 3
In the next section we detail our experimental design and provide a brief overview of the
standard theory regarding the push and pull contracts. In Section 3, we present our experimental
results for the push and pull contracts, starting with summary statistics and then proceed to develop
and structurally estimate our behavioral models. Using the results from Section 3, in Section 4, we
present and test a number of hypotheses for the APD contract. Lastly, in Section 5, we summarize
our main findings and discuss directions for future research.
Experimental Design and Standard Theory 2.
2.1. Experimental Design
We evaluated three supply chain contracts, each in a separate between-subjects experimental
treatment. In the push and pull contracts, one party offers the contract and the other party sets the
stocking quantity (or rejects the contract). To be consistent with this structure, in our push treatment,
the supplier offers the contract and the retailer decides on the order quantity. Conversely, in our pull
treatment, the retailer offers the contract, and the supplier decides on the production quantity. Thus,
our push and pull treatments differ in which party proposes the wholesale price and which party sets
the stocking quantity.
The APD contract differs from the push and pull contracts in that it includes two wholesale prices
(we call them the regular wholesale and discount wholesale prices), where both parties may share the
inventory risk. The retailer incurs the inventory risk for a quantity ordered in advance of realized
demand (called the prebook quantity), and the supplier incurs the inventory risk on the difference
between its production amount and the retailer's prebook quantity. Specifically, in the APD
treatment, the supplier begins the sequence by first proposing the two wholesale prices. After
observing these prices, the retailer commits to paying for the prebook quantity (or rejects the
contract). Next the supplier, after receiving the prebook order from the retailer, sets the production
quantity. Finally, demand and profits are realized for both players. We discuss more details of the
APD contract in Section 4.
Figure 1 depicts the decision sequence for the three treatments in our study.

Davis, Katok, Santamaría: Push, Pull, or Both? 4
Figure 1. Decision sequence for each contract in the experiment.
In all three treatments a rejection results in both parties earning 60. In theory this outside option
is not binding for the push and pull contracts given our parameters1, but it is binding under the APD
contract, because the supplier has the ability to extract the entire channel profit (which we will show
when we outline the APD theory). Our setting makes the APD prediction somewhat more realistic,
because the proposer should now extract a majority, but not 100%, of the channel profit.
We used the same demand distribution, per unit revenue, and cost parameters in all three
treatments. Specifically, customer demand is an integer uniformly distributed between 0 and 100,
U[0,100], the retailer receives revenue of r = 15 for each unit sold, and the supplier incurs a cost of c
= 3 for producing each unit.
In each treatment we provided both participants with a decision support tool. The player in the
proposer role could test wholesale prices between 3 and 15 (the unit cost and seller revenue per unit)
using a scroll bar. For each test wholesale price, the computer would show them the stocking
quantity that would maximize the other player’s expected profit. We made it clear that this amount is
best in terms of average profit for the other player for this test wholesale price, but that they were
playing with a human who may not necessarily stock this amount. Similarly, for the player setting a
stocking quantity, once a wholesale price was offered to them, they could test different stocking
quantities with a scroll bar (from 0 to 100). Each time they moved the scroll bar a line graph would
1 This value is slightly below the minimum of any party’s profits, in any contract, in equilibrium. The experimental profit predictions will be illustrated in the next section.
Retailer rejects or accepts and sets a
quantity q
Demand is realized
Supplier sets a wholesale price w
Push
Supplier rejects or accepts and sets a
quantity q
Demand is realized
Retailer sets a wholesale price w
Pull
Demand is realized
Supplier sets a wholesale price w and
discount wholesale price wd
APD
Retailer rejects or accepts and sets a
prebook qR
Supplier sets production qS

Davis, Katok, Santamaría: Push, Pull, or Both? 5
display their actual potential profit calculated for every realization of demand (from 0 to 100).2 We
provided this decision support tool to ensure that participants could comprehend the task and also
allow the standard theory a viable chance of being confirmed. We include screenshots for the
participants’ decisions in the sample instructions in the online Appendix.
In total 120 human subjects participated in the study, 40 in each treatment. We randomly
assigned subjects to a role (retailer or supplier) at the beginning of each treatment. To reduce the
complexity of the game, roles remained fixed for the duration of the session. Subjects made
decisions in 30 rounds. Retailers and suppliers were placed into a cohort of 6 to 8 participants, and a
single retailer was randomly re-matched with a single supplier within the cohort in each round,
replicating a one-shot game. To mitigate reputation effects, subjects were unaware that their cohort
size was 6 to 8 participants, and simply told that they would be randomly re-matched with someone
else in the session. Each experimental treatment had 6 cohorts. Because subjects were placed into a
fixed cohort for an entire session, we use the cohort as the main statistical unit of analysis.
We conducted the experiment at a public northeast U.S. university in 2010. Participants in all
treatments were students, mostly undergraduates, from a variety of majors. Before each session, we
allowed the subjects to read the instructions themselves for a few minutes. Following this, we read
the instructions verbally and answered any questions (to assure common knowledge about the rules
of the game). Each individual participated in a single session only. We recruited participants
through an online system, and offered them cash as the only incentive to induce them to participate.
Subjects earned a $5 show-up fee plus an additional amount that was proportional to their total
profits from the experiment. Average compensation for the participants, including the show-up fee,
was $25. Each session lasted approximately 1 to 1.5 hours and we programmed the software using
the zTree system (Fischbacher 2007).
2.2. Theoretical Benchmarks for Push and Pull Settings
In all treatments, a retailer R receives revenue r, for each unit sold, incurs no fixed ordering costs,
and loses sales if demand exceeds inventory. A supplier S produces inventory at a fixed per unit cost
of c. Customer demand D is a continuous random variable with cdf )(·F and pdf )(·f . There is
full information of all cost parameters, and we assume that retailers and suppliers are risk-neutral
expected-profit maximizers. Lastly, we measure efficiency by the percent ratio between the
decentralized supply chain expected profit and the centralized supply chain expected profit.
2 In the APD treatment this support was the same. Suppliers here had to set two wholesale prices, then retailers could test the prebook quantity with a graph, and finally suppliers could also test production amounts with a similar graph before entering their decision.

Davis, Katok, Santamaría: Push, Pull, or Both? 6
For the push contract, a supplier offers a per unit wholesale price w to a retailer. The retailer sets
a stocking quantity q, for a given w that maximizes its expected profit, ( ) ( )R q rS q wqπ = − . Let
[min(( ) , )]S q q D= E represent the expected sales for a stocking quantity q, and *pushq be the quantity
that maximizes the retailer's expected profit under the push contract. In this case, the best response
stocking quantity for the retailer is:
q*push = F−1 r −w
r"
#$
%
&'. (1)
The supplier's decision under a push contract is w, where *pushw maximizes the supplier's push
contract profit π S (w) = (w− c)q , and must satisfy:
F −1 r −wpush*
r
!
"##
$
%&&=
wpush* − c
r× f F −1 r −wpush*
r
!
"##
$
%&&
!
"
##
$
%
&&
. (2)
For demand following a U[0,100], *pushw simplifies to:
* .2pushr cw +
= (3)
Under the pull contract, the decisions of the retailer and supplier are reversed; the retailer offers a
per unit wholesale price w and the supplier then sets a stocking quantity q that maximizes its
expected profit, [ ( )] ( )S q wS q cqπ = −E . Let *pullq be the stocking quantity that maximizes the
supplier's expected profit. Then *pullq must satisfy:
1* .pullww
q F c− ⎛ − ⎞= ⎜ ⎟⎝ ⎠
(4)
The retailer's decision under the pull contract is w. Let w*pull be defined as the wholesale price that
maximizes the retailer’s expected profit in the pull contract, * arg max [ ( )]pull R ww π= E [, where
[ ( )] ( ) ( )R w r w S qπ = −E , ( )R wπ is unimodal in w if demand has the increasing generalized
failure rate property (Cachon 2004), so the optimal solution can be characterized using the first
order condition. For the case of demand following a U[0,100], w*pull must satisfy,
* 3 2 *) (2 )( pull pullc r ww = − which we compute numerically for our experimental parameters.

Davis, Katok, Santamaría: Push, Pull, or Both? 7
2.3. Experimental Predictions
Table 1 summarizes the theoretical predictions for retailer and supplier profits, and supply chain
efficiency given our experimental parameters ( 15,r = 3c = , demand U[0,100] and the outside
option of 60). Participants were allowed to enter their decisions up to two decimal places for the
wholesale prices and integers for stocking quantities.
Table 1. Predicted decisions and outcomes for the push and pull contracts.
Push Pull Wholesale Price 9.00 6.00
Quantity 40.00 50.00 Retailer Profit 120.00 337.50 Supplier Profit 240.00 75.00
Channel Efficiency 75.00% 85.94%
Results of the Push and Pull Treatments 3.We begin by presenting the results from the push and pull treatments. We first show expected profits
for the channel and both parties separately, and then proceed to examine wholesale prices, stocking
quantities, and rejections. Following this, we present a behavioral model that organizes our data and
structurally estimate its parameters. Ultimately, we can determine whether our behavioral model
generates predictions in line with observed decisions.
3.1. Channel Efficiency and Expected Profits
We calculate the expected profit for each decision and report it as the “observed profit.” Figure 2
displays the predicted and observed supply chain profits along with the corresponding channel
efficiency (located at the top of each column) for the push and pull contracts. There is no significant
difference between observed and predicted supply chain profits (p = 0.173 for push and p = 0.173 for
pull).3 In Figure 2 we also see that the observed supply chain profits increase as the channel switches
from the push contract to the pull contract (p = 0.025). These results suggest that the normative
prediction of improving channel efficiency by shifting the inventory risk from the retailer to the
supplier, for a simple wholesale price contract, is correct.
3All one-sample tests are Wilcoxon signed-rank test and all two-sample tests are the Mann-Whitney U-test.

Davis, Katok, Santamaría: Push, Pull, or Both? 8
Figure 2. Predicted and observed supply chain profits for the push and pull contracts.
Moving to each party’s profits, we see that retailers in the pull contract, in Figure 3(a), earn
significantly less than theory predicts (p = 0.028). However, retailers earn the same as theory
predicts in the push contract (p = 0.463). Directionally consistent with the standard theory, when
selecting between the two contracts, a retailer earns the most profit in the pull contract (p < 0.01).
The observed supplier profits shown in Figure 3(b), are below theory in the push contract (p =
0.075). For the pull contract, we observe suppliers earn significantly more than the theoretical
prediction (p = 0.028). Comparing the supplier profits between the two contracts, the profits under
the push contract are significantly higher than under the pull contract (p = 0.0104).
Push Pull Theory 360.00 412.50 Observed 336.85 402.37
0 50
100 150 200 250 300 350 400 450
Supp
ly C
hain
Pro
fit 70.18%
75.00%
85.94% 83.83%

Davis, Katok, Santamaría: Push, Pull, or Both? 9
(a) Retailer profit
(b) Supplier profit
Figure 3. Predicted and observed retailer and supplier profits for the push and pull contracts.
These initial results indicate that channel efficiency increases when moving from a push to a pull
contract, and retailers prefer pull contracts while suppliers prefer push contracts. Both of these
observations qualitatively agree with standard theory. However, actual levels of profits for both
parties systematically deviate from the predicted values in that the profit split is somewhat more
equitable. In this, our results for the push contract are similar to Keser and Paleologo (2004), the
only other paper that reports on lab experiments with uncertain demand (they only have a push
contract) in which both sides are human. They too find that wholesale prices are below optimal (see
next section) and the profit distribution is more equitable than the standard theory predicts.
3.2. Decisions
Table 2 summarizes the average wholesale prices and stocking quantities for the push and pull
contracts. For both contracts, proposers set wholesale prices that are significantly different from the
theoretical predictions (p = 0.028 for both push and pull). Specifically, for both contracts, the party
setting the wholesale price made offers that were more generous than theory predicts. In the push
contract, the average wholesale price is below the prediction, while in the pull contract, it is above
the prediction.
In order to interpret the observed stocking quantities correctly, we calculate the optimal stocking
quantities conditioned on the proposers' wholesale prices, and then average them for the predicted
values. The second row of values in Table 2 shows these results. There are significant differences
between observed and best reply values in the pull quantity (p = 0.046). In the push contract we find
that the observed quantity is lower than predicted, but not statistically different (p = 0.463).
120
338
130
258
0
100
200
300
400
Push Pull
Ret
aile
r Pr
ofit
Theory Observed
240
75
207
145
0
100
200
300
400
Push Pull
Supp
lier
Prof
it
Theory Observed
Davis, Katok, Santamaría: Push, Pull, or Both? 10
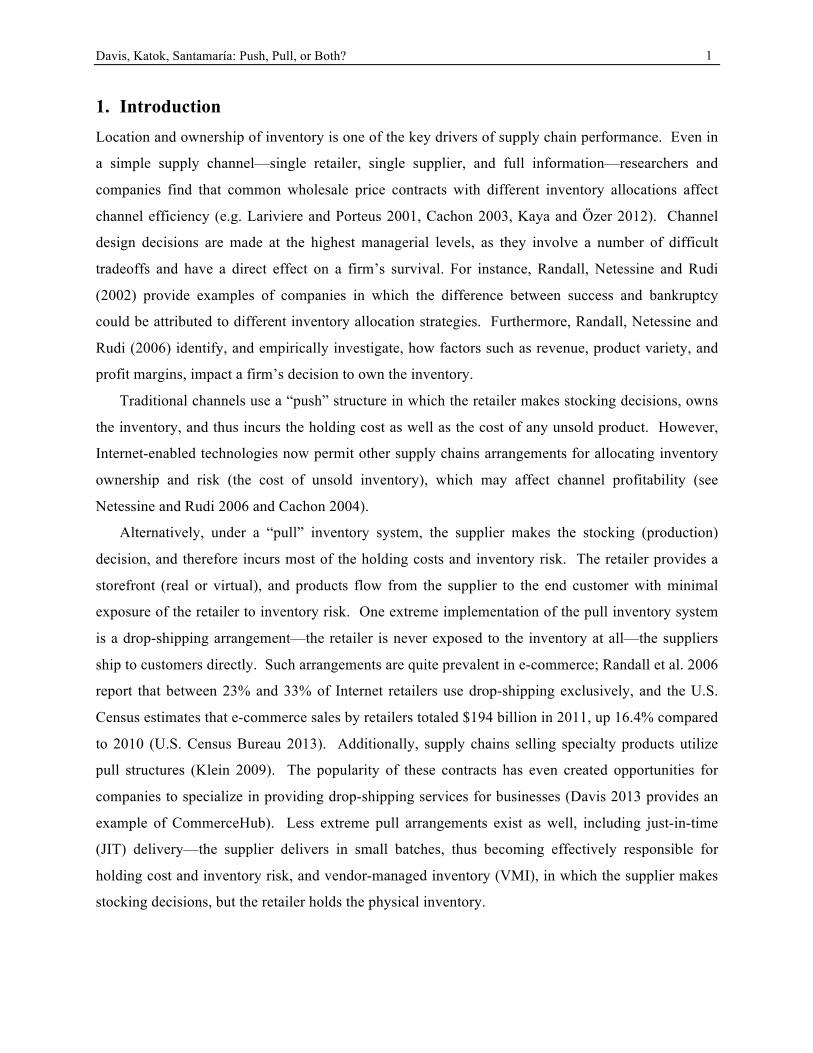
Table 2. Average wholesale prices and quantities for agreements, and overall rejection rates.
Push Pull Predicted Observed Predicted Observed
Wholesale Price 9.00**
8.26 [0.16]
6.00**
8.02 [0.28]
Quantity | w 44.93 [1.04]
42.60 [2.86]
61.26** [1.30]
55.34 [1.72]
Rejection Rate | w 2.04%** [1.05]
8.15% [2.00]
4.77% [1.89]
3.15% [0.92]
Note: Standard errors are reported in square brackets. Significance of Wilcoxon signed-rank test given by *** p-value<0.01, and ** p-value<0.05.
Recall that the party setting the stocking quantity, when receiving a wholesale price, had the
option to reject the contract, such that both parties earn an outside option of 60. In Table 2 we
provide the predicted rejection rates, conditioned on the observed wholesale prices, along with the
observed rejection rates. In the push contract, retailers rejected significantly more than predicted (p
= 0.028), whereas, in the pull contract, there are no significant differences in the predicted and
observed rejections rates. Despite these minor differences, when calculating the percentage of time
that the party stocking the inventory made the correct accept/reject decision, we observe that the
correct decision was made 92.8% of the time in the push contract, and 94.7% of the time in the pull
contract. Lastly, rejections do not appear to change over time in either contract (based on a logit
regression with random effects with the decision period as the independent variable, plus a constant).
We believe these results suggest that, with the provided decision support tools, subjects were
generally able to comprehend the task.
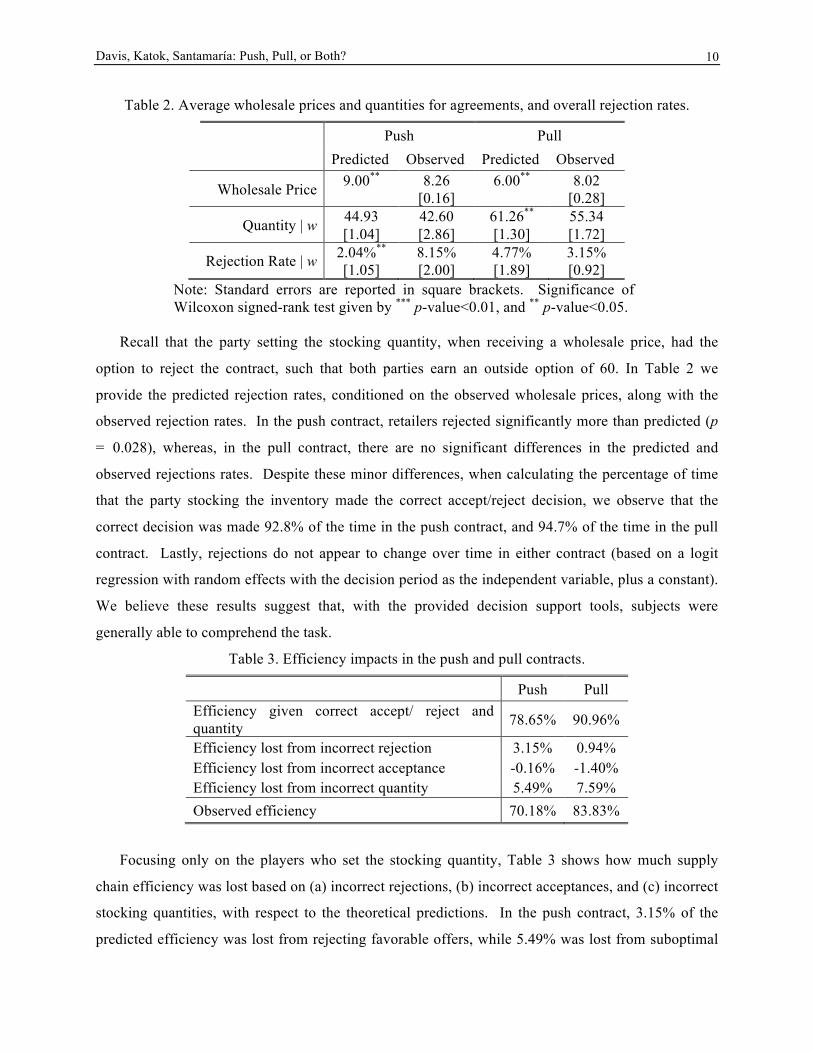
Table 3. Efficiency impacts in the push and pull contracts.
Push Pull Efficiency given correct accept/ reject and quantity 78.65% 90.96%
Efficiency lost from incorrect rejection 3.15% 0.94% Efficiency lost from incorrect acceptance -0.16% -1.40% Efficiency lost from incorrect quantity 5.49% 7.59% Observed efficiency 70.18% 83.83%
Focusing only on the players who set the stocking quantity, Table 3 shows how much supply
chain efficiency was lost based on (a) incorrect rejections, (b) incorrect acceptances, and (c) incorrect
stocking quantities, with respect to the theoretical predictions. In the push contract, 3.15% of the
predicted efficiency was lost from rejecting favorable offers, while 5.49% was lost from suboptimal

Davis, Katok, Santamaría: Push, Pull, or Both? 11
stocking quantities. In the pull contract, only 0.94% efficiency was lost due to rejecting favorable
offers, but 7.59% was lost due to low stocking quantities. Considering that both accept/reject
decisions and quantities drive efficiency losses, we will consider both of these effects in our
behavioral models that we develop in the next section.
3.3. Behavioral Models
Our goal in this section is to formulate a parsimonious behavioral model that can explain the
regularities we observe in our data. These regularities are: (1) wholesale prices that are below
predicted in the push contract and above predicted in the pull contract, (2) suboptimal order
quantities (primarily in the pull contract), and (3) incorrect responder rejections. We consider
behavioral models that have been proposed in recent literature: loss aversion from leftover inventory
(Becker-Peth, Katok and Thonemann 2013, Ho, Lim and Cui 2010), inequality aversion (Cui, Raju
and Zhang 2007), anchoring towards the mean (Schweitzer and Cachon 2000, Benzion, Cohen, Peled
and Shavit 2008), and random errors in accept/reject decisions (Su 2008).
Because of the nature of these behavioral regularities, it is natural to assume that the proposer
may have none of these deviations. In particular, losses and anchoring cannot happen since
proposers do not hold inventory, and inequality aversion is unlikely to play a major role because
proposers work under advantageous inequality (it has been shown that advantageous inequality
aversion is virtually non-existent in the laboratory, see DeBruyn and Bolton 2008, Katok and Pavlov
2013). Also, Katok and Wu (2009) find that when suppliers in a push wholesale contract are
matched with automated retailers programmed to place optimal orders, suppliers learn to set
wholesale prices optimally very quickly. Considering that the behavioral regularities we investigate
are unlikely to be present for proposers, we begin by making a simplifying assumption that proposers
are fully rational. Later, we can validate whether this assumption holds by comparing predicted
wholesale prices, given any behavioral biases in stocking quantities, to observed wholesale prices.
We introduce the following notation for our behavioral parameters:
• 1β ≥ : the degree of loss aversion that the party stocking the inventory experiences from
having leftover inventory. β > 1 implies loss aversion, and β = 1 corresponds to rational
behavior (see Becker-Peth et al. 2013, and Ho et al. 2010 for a related but slightly different
formulation).
• α ≥ 0 : the degree of disadvantageous inequality aversion (see Cui et al. 2007). We assume
that decision-makers do not have disutility from advantageous inequality.

Davis, Katok, Santamaría: Push, Pull, or Both? 12
• 0 1δ≤ ≤ : the degree of anchoring towards the mean (see Benzion et al. 2008 and Becker-
Peth et al. 2013 for a similar approach to the one we apply).
We consider each of the above behavioral issues separately, but will add random errors in rejections
when we discuss our parameter estimation.
3.3.1 Push Behavioral Models
In Table 4 we outline each of the behavioral models for the push setting, for demand uniformly
distributed between 0 and 100. We relegate the derivations of these equations and other details to the
Appendix.
Table 4. Expected utility functions for suppliers, along with their predicted stocking quantities, for the push contract.
Loss Aversion
( ) ( ) ( ( ))Ru r w S q w q S qβ= − − −
( )* 100
1wr wq
r β+
⎛ ⎞−= ⎜ ⎟
⎝ ⎠−
Inequality Aversion
(( ) ( ) ( ))R S Ru rS q wq w qπ πα += − − −
*
( 2 )100 ;(1 )
2( 2 )
,
,100 ;2
,100 .
r w r c w w wr
r c wq w w wr w
r ww wr
αα
⎧ ⎛ ⎞− + + −≥⎪ ⎜ ⎟+⎝ ⎠⎪
⎪ + −⎪ ⎛ ⎞= < <⎨ ⎜ ⎟−⎝ ⎠⎪⎪ −⎛ ⎞ ≤⎪ ⎜ ⎟
⎝ ⎠⎪⎩
Anchoring
( )Ru rS q wq= −
q* = (1−δ ) 100 r − w
r⎛⎝⎜
⎞⎠⎟
⎛⎝⎜
⎞⎠⎟+δµ
In the table, Ru denotes retailer’s utility, 2[min( , )] /( ) 200S q q D q q= −= E , ( ) ( )S w w c qπ = − ,
π R(q) = rS(q)− wq , µ = 50 (mean demand), w = 21+18α3+ 2α
, and w = 7 .
3.3.2 Pull Behavioral Models
As with the push contract, we outline each of the behavioral models for the pull setting, for demand
uniformly distributed between 0 and 100, in Table 5 (please see the Appendix for additional details).

Davis, Katok, Santamaría: Push, Pull, or Both? 13
Table 5. Expected utility functions for retailers, along with their predicted stocking quantities, for the pull contract.
Loss Aversion
( ) ( ) ( ( ))Su w c S q c q S qβ= − − −
( )* 100
1cw cq
w β+
⎛ ⎞−= ⎜ ⎟
⎝ ⎠−
Inequality Aversion
(( ) ( ) ( ))S R Su wS q cq w qπ πα += − − −
( )( )
*
,100 ;
2( 2 )100 ;2
210 .
,
02
,
w c w wwr c wq w w wr w
w c r c ww
w rw
wαα
⎧ −⎛ ⎞⎪ ≥⎜ ⎟⎪ ⎝ ⎠⎪ + −⎪ ⎛ ⎞= < <⎨ ⎜ ⎟−⎝ ⎠⎪⎪ ⎛ ⎞− − + −⎪ ≤⎜ ⎟
−⎪ ⎝ ⎠⎩ −
Anchoring
( )Su wS q cq= −
q* = (1−δ ) 100 w− c
w⎛⎝⎜
⎞⎠⎟
⎛⎝⎜
⎞⎠⎟+δµ
In the table, π R(w) = (r − w)S(q) , π S (q) = wS(q)− cq ,µ = 50 , 9.80w = , and
23(5 22 65 60 4 )4 8
w α α αα
+ + + +=
+.
Under both the push and pull contracts, the party offering a wholesale price takes into account the
responder’s behavior, and selects the wholesale price that maximizes her expected profit. We find
that the optimal wholesale price w* , when dealing with a loss-averse responder (β > 1), is lower
under push, and higher under pull, than the original predictions, w*
push and w*
pull , which correspond
to β = 1. The effect is somewhat similar when facing an inequality-averse responder—the profit
maximizing wholesale price is lower under push and higher under pull, than the optimal wholesale
price for a responder with no fairness concerns. We summarize these results in Table 6.
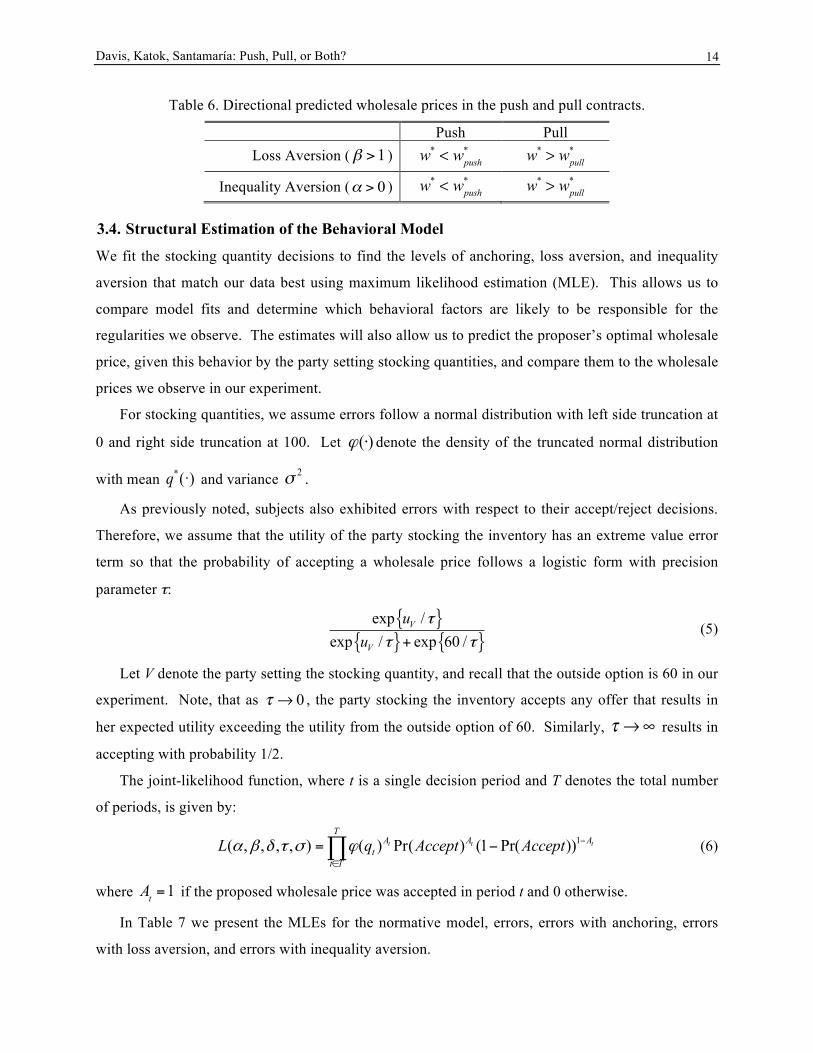
Davis, Katok, Santamaría: Push, Pull, or Both? 14
Table 6. Directional predicted wholesale prices in the push and pull contracts.
Push Pull Loss Aversion (β >1 )
w* < wpush
* w* > wpull
*
Inequality Aversion (α > 0 ) w* < wpush
* w* > wpull
*
3.4. Structural Estimation of the Behavioral Model
We fit the stocking quantity decisions to find the levels of anchoring, loss aversion, and inequality
aversion that match our data best using maximum likelihood estimation (MLE). This allows us to
compare model fits and determine which behavioral factors are likely to be responsible for the
regularities we observe. The estimates will also allow us to predict the proposer’s optimal wholesale
price, given this behavior by the party setting stocking quantities, and compare them to the wholesale
prices we observe in our experiment.
For stocking quantities, we assume errors follow a normal distribution with left side truncation at
0 and right side truncation at 100. Let ( )ϕ ⋅ denote the density of the truncated normal distribution
with mean q*(·) and variance σ 2 .
As previously noted, subjects also exhibited errors with respect to their accept/reject decisions.
Therefore, we assume that the utility of the party stocking the inventory has an extreme value error
term so that the probability of accepting a wholesale price follows a logistic form with precision
parameter τ:
{ }{ } { }exp /
exp / exp 60 /V
V
uu
ττ τ+
(5)
Let V denote the party setting the stocking quantity, and recall that the outside option is 60 in our
experiment. Note, that as τ → 0 , the party stocking the inventory accepts any offer that results in
her expected utility exceeding the utility from the outside option of 60. Similarly, τ →∞ results in
accepting with probability 1/2.
The joint-likelihood function, where t is a single decision period and T denotes the total number
of periods, is given by:
1, , , , ) ( ) Pr(( (1 Pr( )))t t t
T
A
t
A At
T
q AccepL Accet ptα β σ ϕδ τ −
∈
= −∏ (6)
where At =1 if the proposed wholesale price was accepted in period t and 0 otherwise.
In Table 7 we present the MLEs for the normative model, errors, errors with anchoring, errors
with loss aversion, and errors with inequality aversion.

Davis, Katok, Santamaría: Push, Pull, or Both? 15
Table 7. Results of the structural estimations for each of the outlined models.
Normative4 Errors Errors + Anchoring
Errors + Loss
Aversion
Errors + Inequality Aversion
LL -5434.85 -4974.82 -4958.38 -4951.83 -4973.27 BIC 10876.79 9963.82 9938.03 9924.93 9967.81
δ - - 0.276 [0.115]
- -
β - - - 1.154 [0.075]
-
α - - - - 0.018 [0.025]
τ - 21.88 [2.86]
21.72 [2.85]
19.12 [2.84]
21.42 [2.83]
σ 17.16 [1.14]
17.16 [1.14]
16.56 [0.92]
16.60 [1.07]
17.02 [1.13]
Note: Standard errors are reported in square brackets.
According to the Bayesian Information Criterion (BIC), errors in the accept/reject decision
improves the fit a great deal, as does loss aversion (and anchoring to a lesser extent). This is in line
with our experimental data in that subjects did not always make correct accept/reject decisions, and
parties set stocking quantities too low, as if the cost of unsold inventory was greater than its true
value.
To compare the three models with errors more rigorously, we conducted a Vuong test (Vuong
1989). The results show that both the loss aversion model and anchoring model are significantly
better for our setting than the inequality aversion model, (both p<0.001). Although inequality
aversion plays an important role in studies with simpler settings that resemble ultimatum games (see
Katok and Pavlov 2013), it can be “washed out” by factors such as competition (see Bolton and
Ockenfels, 2000). It may be that in our setting, the complexity of the contracting game, with
uncertain demand, makes inequality aversion less salient.
Comparing anchoring directly to loss aversion, we find that loss aversion is not significantly
better than anchoring, although it is close to being weakly significant (p=0.1139). Recall however,
that anchoring on the mean is not observed in the push contract (observed quantity of 42.60 versus
conditional prediction of 44.93), so it does not explain the data well across treatments. Therefore, we
focus on the loss aversion model in the out-of-sample test section (presented in Section 4), which
4 For the normative estimation, we set τ as low as possible such that it would yield real log-likelihood results, τ = 4.2, emulating a rational decision maker.

Davis, Katok, Santamaría: Push, Pull, or Both? 16
provides a more consistent fit across treatments. Also, loss aversion has provided a good fit in
similar, previous studies, such as Ho et al. (2010) and Becker-Peth et al. (2013).
We calculated the order quantities, given the maximum-likelihood estimates for the loss aversion
with errors model in Table 7, and find that they match our data quite well when compared to the
observed quantities in Table 2: q = 41.39 versus q = 42.60 for the push contract, and q = 57.63 versus
q = 55.34 for the pull contract.
We also evaluated whether the errors and loss aversion model fit the observed rejections rates.
Figure 4 plots the predicted rejection levels along with the data for the push and pull contracts.
While there are some deviations in both directions, it appears that the model provides a reasonable fit
on average.
(a) Push
(b) Pull
Figure 4. Predicted and observed probability of rejection given different wholesale prices for the push and pull contracts.
Lastly, recall that we assumed fully rational parties offering wholesale prices, who merely best
reply to the party stocking the inventory. We can test how close this assumption is to reality by
comparing the predicted best reply wholesale prices, given the estimates for the errors plus loss
aversion model, to the average observed wholesale prices in Table 2: w = 8.33 versus w = 8.26 for
push and w = 7.34 versus w = 8.02 for pull. The predicted wholesale prices are remarkably close to
our data, indicating that while the full rationality assumption may not be perfectly satisfied, this
simplification still results in a favorable way to organize the data.
Advance-Purchase Discount Contract 4.The push and pull wholesale price contracts cannot coordinate the channel due to double
marginalization. However, Cachon (2004) shows that the advance purchase discount (APD) contract
can coordinate the channel by distributing inventory risk between the supplier and the retailer. Next
0.00
0.20
0.40
0.60
0.80
1.00
3 5 7 9 11 13 15
Pr(R
ejec
t)
w Observed Predicted
0.00
0.20
0.40
0.60
0.80
1.00
3 5 7 9 11 13 15
Pr(R
ejec
t)
w Pr(Reject) Predicted

Davis, Katok, Santamaría: Push, Pull, or Both? 17
we will review the theory for the APD contract under our behavioral model, and develop a number of
experimental hypotheses, which we will proceed to test in a separate, out-of-sample, experiment.
4.1. APD Behavioral Model
Under the APD contract, a supplier begins by proposing two wholesale prices; a regular wholesale
price w, and a discount wholesale price dw . It is reasonable, although not necessary, to assume
dw w≥ (see Özer and Wei 2006 for a slightly different setting where this is relaxed). A retailer then
sets a prebook quantity Rq , where the retailer commits to purchasing the entire prebook quantity
regardless of demand, and pays dw for each unit of the prebook quantity. Following this, a supplier
sets a production amount Sq , where S Rq q≥ . We will outline the APD contract for our behavioral
model, where the standard theory is the special case of 1R Sβ β= = . Table 8 shows the expected
utility functions and the corresponding optimal order quantities (please see the Appendix for
corresponding derivations of the optimal quantities).
Table 8. Expected utility functions for suppliers and retailers, along with their optimal stocking quantities in the APD contract.
Supplier
) ) ( ) ( )( ) ( ( , , ( , ).s d R S R S S SS R R S Ru w q q cq w S q q q q SS qc q qβ= −+ −− −
( )( )
( )( )*
100 1100 ;
( 100
100 1.
100
,1)
,
R S
RS
R SR
R
S
c qw c ww c q
qc q
q wq
β
β
β
⎧ + −⎛ ⎞−≥⎪ ⎜ ⎟+ −⎪ ⎝ ⎠= ⎨
+
−
−
−⎪<⎪
⎩
Retailer uR(qR ) = (r − wd )S(qR )+ (r − w)(S(qS )− S(qR ))− βwd (qR − S(qR )).
qR
* = 100w− wd
w+ wd (βR −1)⎛
⎝⎜⎞
⎠⎟
In the table, S(qS ,qR ) corresponds to the expected number of units the supplier sells when the retailer
prebooks qR units and the supplier produces qS units, ( ) ( ), min max , ,S R R SS q q q D q⎡ ⎤= ⎡ ⎤⎣ ⎦⎣ ⎦E ,
( )( ) min ,R RS q q D= ⎡ ⎤⎣ ⎦E , and ( )( ) min ,S SS q q D= ⎡ ⎤⎣ ⎦E .
The first term in the expected utility for the supplier represents immediate revenue from the
retailer's prebook quantity, the second term represents the additional revenue from selling any units
above the prebook quantity, the third term is the supplier's production cost for units sold, and the last

Davis, Katok, Santamaría: Push, Pull, or Both? 18
term represents the cost and disutility from any potential leftover units. Similarly, the first term in
the expected utility for the retailer represents the profits from prebook sales, the second term the
additional profits from units sold beyond the prebook order, and the third term is the cost and
disutility of any leftover prebooked units.
Lastly, we allow errors to affect the APD contract the same way that they affect the push and pull
contracts. The retailer, faced with a proposed set of wholesale prices w and wd, accepts with
probability:
{ }{ } { }exp ( )] /
.exp ( )] / exp 60 /
R
R
R
R
u qu q
ττ τ+
(7)
A few comments are in order regarding the APD contract. Consider the special case of the
standard theory, such that 1R Sβ β= = and 0τ → . Under this setting, the supplier can achieve
100% channel efficiency by setting w r= (thus inducing herself to produce the first-best order).
Assuming the retailer plays the best response, then dw determines the division of channel profits
between the two parties. For example, if both parties set qR = qR* and qS = qS
* , then the supplier can
extract 100% of the channel profits by setting wd = w . On the other hand, if the supplier sets dw c= ,
the retailer would earn 100% of the channel profits because the retailer would be induced to set qR
to the first-best order quantity, which the supplier would produce.
For our experimental setting, the standard theory predicts w = 15.00, wd = 10.75, Sq = 80.00, and
Rq = 28.30. It also predicts 100% channel efficiency, where the split of profits is 419.79 for the
supplier and 60.21 for the retailer. Note that the standard theory results in dr w> for our
experiment, as the retailer will only accept if their expected profit is greater than 60, the value of the
outside option.
4.2. Out-of-Sample-Test
We now investigate how our behavioral model impacts the APD contract, and generate a number of
experimental hypotheses. Our goal here is not to identify the best fitting model for the APD contract,
rather, to evaluate how a favorable model in push and pull extends to alternative structures, such as
an APD. We begin with our first formal hypothesis for the APD contract:
HYPOTHESIS 1 (MODEL): The loss aversion plus errors model will fit the data better than the standard theory.

Davis, Katok, Santamaría: Push, Pull, or Both? 19
In some ways the APD contract can be considered a combination of the push and pull contracts;
the retailer’s prebook, and its associated cost of unsold inventory, is essentially a push contract.
Additionally, the difference between the supplier’s production amount and the prebook, and its cost
of unsold inventory, is similar to a pull contract. Therefore, in order to develop a hypothesis
regarding whether the loss aversion parameters for the two parties may differ in the APD contract,
we fit the errors plus loss aversion model to the push and pull data separately. These results are
displayed in Table 9.
Table 9. Results of the structural estimations of the errors plus loss aversion model for push and pull contracts separately.
Push Pull
LL -2428.19 -2515.04 BIC 4875.57 5049.28
β 1.083 [0.108]
1.194 [0.096]
τ 24.08 [5.22]
14.80 [1.98]
σ 16.14 [1.47]
16.71 [1.36]
Note: Standard errors are reported in square brackets.
We find that the loss aversion parameter is higher in the pull contract than push contract, and that
the loss aversion parameter in the push contract, while positive, is not significantly different from
one. This leads to our second formal hypothesis.
HYPOTHESIS 2 (QUANTITIES): βR = 1 and βS = 1.20, such that βR < βS, causing the retailer to set prebook quantities that match the standard theory, but causing the supplier to set production levels below the normative benchmark.
Given that we have predictions about prebook quantities and production amounts, we now
determine the optimal wholesale prices for the supplier. Cachon (2004) notes that in a fully rational
model, the supplier maximizes his expected utility by coordinating the channel. Therefore, in this
case he sets w = r, and then sets dw in a way that splits the channel profits in some way. However,
when the party setting the stocking quantity is loss averse and makes errors, w = r may not maximize
the supplier’s expected utility. Therefore, the supplier’s optimal wholesale prices w and dw can be
computed by replacing the optimal order quantities in his utility function, and using the first order
conditions to solve for the two wholesale prices simultaneously. The resulting expression is a third

Davis, Katok, Santamaría: Push, Pull, or Both? 20
degree polynomial, and therefore closed-form solutions are not readily obtainable. However, for any
specific set of parameters and demand distributions, one can compute the optimal wholesale prices.
(a) Optimal wholesale prices for a range of βR=βS and τ = 1 and τ = 20.
(b) Optimal wholesale prices for τ = 20, βR = 1.194 and a range of βS.
Figure 5. The effect of loss aversion and precision parameters on optimal wholesale prices in the APD contract.
Figure 5(a) plots the optimal (w, wd) pairs given our experimental parameters, when loss aversion
is equal for both parties and cases of τ = 1 and τ = 20. Figure 5(b) depicts a similar plot for τ =20, but
allows the two levels of loss aversion to vary; βR =1.194 and a range of βS. In Figure 5(a), the
optimal wholesale prices converge for small levels of loss aversion when the loss aversion is
restricted to be the same across both parties.5
Figure 5(a) also illustrates that for larger τ, the two wholesale prices may converge at slightly
higher levels of loss aversion. However, even for τ = 20 the level of loss aversion required for
convergence (approximately 1.04) is significantly below the level of loss aversion we observe in our
push and pull data (β = 1.154 overall and β = 1.194 for pull).
In Figure 5(b) we see that the wholesale price convergence also exists when the retailer’s level of
loss aversion exceeds that of the supplier’s. This is intuitive; if the retailer is sufficiently loss averse,
they will be reluctant to stock a large prebook amount. As a result, the supplier will operate much
like a pull contract with a single wholesale price. However, Figure 5(b) also shows that when the
supplier’s level of loss aversion becomes somewhat higher than the retailer’s, the wholesale prices
split in a way such that w = 15 again, but drives the discount wholesale price lower than standard
theory (recall standard theory predicts a discount wholesale price of 10.75). This is also expected, by
5 We find that this convergence exists for a number of different demand distributions, such as Normal and Beta.
6
8
10
12
14
16
1 1.01 1.02 1.03 1.04 1.05 1.06 1.07 1.08 1.09 1.1 Opt
imal
who
lesa
le p
rice
s
w (τ = 1) wd (τ = 1)
w (τ = 20) wd (τ = 20)
wd wd
Loss aversion βS = βR wd
wd
0
5
10
15
20
1 1.1 1.2 1.3 1.4 1.5 1.6 1.7 1.8 1.9 2 Opt
imal
who
lesa
le p
rice
s
w wd
Loss aversion βS
wd

Davis, Katok, Santamaría: Push, Pull, or Both? 21
setting a lower discount wholesale price, a loss averse supplier attempts to push more of the
inventory risk onto the retailer. This also leads to a more equitable split of channel profits.
In regards to predicting the wholesale prices and efficiency of the APD contract, we can take our
structural estimates from push and pull separately, and those observations mentioned above, and
articulate them into our final two hypotheses:
HYPOTHESIS 3 (WHOLESALE PRICES): βR = 1 and βS = 1.20, such that βR < βS, leading to the regular wholesale price and the discount wholesale price being equal to each other, approximately w=wd=12.60, resulting in a more equitable split of profits. HYPOTHESIS 4 (EFFICIENCY): The presence of loss aversion on the supplier’s side, βS > 1.00, will drive production amounts down, resulting in channel efficiency below 100%.
4.3. APD Results
We begin by first presenting summary statistics for supply chain efficiency and profits. Figure 6
presents the supply chain results from all three treatments. Unlike the earlier supply chain efficiency
results, the APD contract performs far below its theoretical prediction. In fact, the supply chain
efficiency is virtually identical between the APD contract and pull contract. This suggests, counter to
the standard theory, that moving from a pull contract to an APD contract does not improve overall
efficiency.
Figure 6. Predicted and observed supply chain profits for the push, pull, and APD contracts.
Figure 7(a) and (b) display the observed profits for all three treatments, separately for retailers
and suppliers. First, looking the APD results, we observe that profits are split in a more equitable
way than the standard theory predicts. Second, comparing APD to the push contract, we observe an
interesting phenomenon: the APD contract weakly Pareto dominates the push contract. Specifically,
Push Pull APD Theory 360.00 412.50 480.00 Observed 336.85 402.37 403.75
0 50
100 150 200 250 300 350 400 450 500
Supp
ly C
hain
Pro
fit 70.18%
75.00%
85.94% 83.83%
100%
84.11%

Davis, Katok, Santamaría: Push, Pull, or Both? 22
retailers are better off under the APD contract compared to the push contract, and suppliers are no
worse off.
(a) Retailer profit
(b) Supplier profit
Figure 7. Predicted and observed retailer and supplier profits for the push, pull, and APD contracts.
We now turn to evaluating our formal hypotheses. Table 10 presents the results of the structural
estimation for the APD treatment. We conduct three estimations. The first is the standard theory, the
second applies the structural estimates, from the push and pull experiment of our loss aversion plus
errors model to the APD data (from Table 8, where we apply 20τ = as the single value), and the
third is the loss aversion plus errors model where the parameters are allowed to vary. Immediately
one can observe the considerable improvement in fit over the normative benchmark, even when
restricting the parameters to the push and pull estimation (a log-likelihood of -5073.03 versus the
standard theory of -5325.19). If we allow the parameters to vary, we find an even stronger fit over
the normative model (likelihood ratio test yields χ2 = 661.96, p <0.001). This confirms our first
hypothesis, that the loss aversion better describes the data than the standard theory.
We can also get a preliminary sense of our other hypotheses from the estimates in Table 10. In
particular, each of the remaining three hypotheses are based on the separate push and pull
predictions, βR = 1 and βS = 1.20, and βR < βS. In short, we have partial confirmation for all three of
these hypotheses. Specifically, we do observe that the retailer’s estimate of loss aversion is close to
1, and that that supplier’s estimate of loss aversion is different and significantly higher than 1, βR <
βS. However, the magnitude of the supplier’s estimate is much larger than anticipated (1.845 versus
predicted of 1.20).
It is also worth mentioning that the estimate for the errors is considerably larger than in the push
and pull data. This is somewhat intuitive, as the APD contract has a higher degree of complexity
than the push and pull contracts.
120
338
60
130
258
188
0 50
100 150 200 250 300 350 400 450
Push Pull APD
Ret
aile
r Pr
ofit
Theory Observed
240
75
420
207
145
215
0 50
100 150 200 250 300 350 400 450
Push Pull APD
Supp
lier
Prof
it
Theory Observed
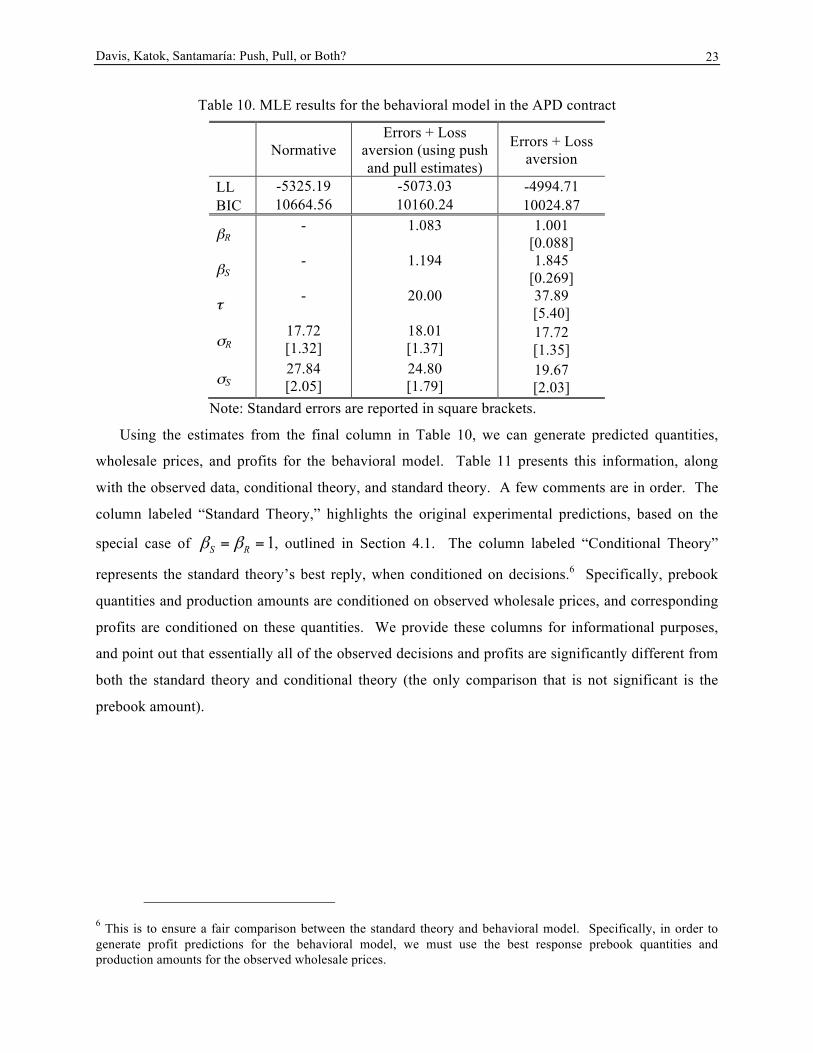
Davis, Katok, Santamaría: Push, Pull, or Both? 23
Table 10. MLE results for the behavioral model in the APD contract
Normative Errors + Loss
aversion (using push and pull estimates)
Errors + Loss aversion
LL -5325.19 -5073.03 -4994.71 BIC 10664.56 10160.24 10024.87
βR - 1.083 1.001
[0.088]
βS - 1.194 1.845
[0.269]
τ - 20.00 37.89 [5.40]
σR 17.72 [1.32]
18.01 [1.37]
17.72 [1.35]
σS 27.84 [2.05]
24.80 [1.79]
19.67 [2.03]
Note: Standard errors are reported in square brackets.
Using the estimates from the final column in Table 10, we can generate predicted quantities,
wholesale prices, and profits for the behavioral model. Table 11 presents this information, along
with the observed data, conditional theory, and standard theory. A few comments are in order. The
column labeled “Standard Theory,” highlights the original experimental predictions, based on the
special case of 1S Rβ β= = , outlined in Section 4.1. The column labeled “Conditional Theory”
represents the standard theory’s best reply, when conditioned on decisions.6 Specifically, prebook
quantities and production amounts are conditioned on observed wholesale prices, and corresponding
profits are conditioned on these quantities. We provide these columns for informational purposes,
and point out that essentially all of the observed decisions and profits are significantly different from
both the standard theory and conditional theory (the only comparison that is not significant is the
prebook amount).
6 This is to ensure a fair comparison between the standard theory and behavioral model. Specifically, in order to generate profit predictions for the behavioral model, we must use the best response prebook quantities and production amounts for the observed wholesale prices.

Davis, Katok, Santamaría: Push, Pull, or Both? 24
Table 11. Observed, behavioral theory, standard theory, and conditional theory, for the APD contract.
Observed Behavioral Theory
Standard Theory
Conditional Theory
Wholesale Price 11.76 [0.26]
15.00**
15.00**
15.00**
Discount Price 7.62 [0.24]
8.71**
10.75**
10.75**
Prebook | 36.75 [2.46]
34.73 [1.61]
28.30**
34.75 [1.61]
Production | 58.99
[3.99] 60.02
[0.94] 80.00**
73.16** [0.84]
Channel Efficiency 84.1% [1.23]
86.8%** [0.63]
100%**
94.0%**
[1.71]
Supplier Profit 215.41
[10.96] 208.29
[11.55] 420.00**
246.08** [13.74]
Retailer Profit 188.33 [10.24]
208.55**
[10.49] 60.00**
205.17**
[9.17] Note: Standard errors are reported in square brackets. Significance of Wilcoxon signed-rank test comparing the models to the observed values given by *** p-value<0.01 and ** p-value<0.05.
Let us return to our formal hypotheses. In regards to our second hypothesis that deals with
stocking quantities, we do in fact observe that prebook amounts match the standard theory, due to the
loss aversion parameter for retailers not being different from 1.00. Furthermore, production amounts
are significantly lower than the standard theory predicts, thus confirming this hypothesis.
While our second hypothesis is directionally correct, note that the production levels are lower
than originally predicted, due to the loss aversion parameter for the supplier being 1.845 (rather than
1.20). However, when calculating production levels based on the MLEs, the behavioral model is
very accurate compared to the data (60.02 versus 58.99).
Turning to our third hypothesis, which deals with wholesale prices, we find little supporting
evidence. As previously noted, depending on the magnitude of the difference between the loss
aversion parameters, one could expect the wholesale prices to converge, or split similar to the
standard theory. Even though the retailer’s loss aversion parameter was qualitatively predicted
correctly, the supplier’s loss aversion parameter was so large that the predicted wholesale prices split
back to w=15 and wd=8.71 (refer to Figure 5(b)). Therefore, we reject our third hypothesis, but will
return to these wholesale prices in the next subsection.
Lastly, we focus on our fourth hypothesis that deals with efficiency. The predicted presence of
loss aversion for the supplier should drive the expected supply chain efficiency below 100%, which
is what we observe, thus confirming our final hypothesis. More precisely, the observed supply chain
( , )dw w
( , )dw w

Davis, Katok, Santamaría: Push, Pull, or Both? 25
efficiency (as observed earlier in Figure 6 and Table 11) is 84.1%, whereas the loss aversion plus
errors model predicts efficiency of 86.8%.
In summary, we find qualitative support for three of our four hypotheses, but not hypothesis 3,
dealing with wholesale prices. In this case, even when considering the structural estimates, the
observed decisions are slightly different from behavioral predictions. The following section offers
some additional explanations about what may be driving overall wholesale prices.
4.4. Explaining Wholesale Prices in the APD Contract
We offer three informal explanations as to why wholesale prices are lower than the behavioral
predictions: (1) random errors, (2) the flatness of the supplier’s expected utility function, and (3)
learning.
First, because the optimal wholesale price is 15 (equal to r), if suppliers make random errors, we
would expect the average observed w to be below 15, simply due to truncation. Second, the
supplier’s expected utility function is relatively flat. Figure 8 displays the contour plot of the
supplier’s expected utility function, for the behavioral parameters we estimated and assuming correct
stocking quantities. The plot suggests that the supplier’s expected utility is quite flat for a range of
wholesale prices.
Figure 8. A contour plot of the supplier’s expected utility function in the APD contract for the MLEs (βR = 1.001, βS = 1.845, τ = 37.89). The arrows denote the average observed wholesale prices and behavioral predictions.
Third, in Figure 9 we plot average wholesale prices over time. It is apparent from the figure that
initially both wholesale prices increase rather quickly—suppliers learn to design more profitable
contracts. This is not surprising, as the APD contract is more complex than the push and pull

Davis, Katok, Santamaría: Push, Pull, or Both? 26
contracts. However, it appears that the discount wholesale price stabilizes over time, while the
regular wholesale price continues to increase for the duration of the session. We ran a set of linear
regressions with period as the independent variable, the two wholesale prices as dependent variables
(in separate regressions), and random effects for individuals. For the regular wholesale price the
coefficient on period is positive and significant for the entire session, as well as for various sub-
sessions (period > 10, p < 0.001; period > 20, p = 0.034). In contrast, for the discounted wholesale
price, while the period coefficient is positive and significant for the overall session (p < 0.001), it is
not significant for the sub-session in which period > 10 (p = 0.143) or period > 20 (p = 0.67). So the
discounted wholesale price quickly settles down around wd = 8, while the regular wholesale price
continues to increase.
Figure 9. Average wholesale prices over the duration of the APD treatment.
What effect does this learning have on the suppliers’ expected utility? If both players behaved
according to the behavioral model (in other words, if the retailer and supplier set quantities according
to their best response functions), then the supplier’s expected utility would have increased from 136
at the start of the session to 236 by the end of the session—an increase of about 74%. In fact, by the
end of the session the supplier’s expected utility of 236 would be relatively close to the predicted
expected utility of 269, only a 13% difference (utility given w = 15, wd = 8.71, and correct stocking
quantities).
4.5. Robustness Check
In comparing the push and pull contracts, the relative bargaining power of the two players is
somewhat constant (up to the “retailer” and “supplier” labels), as one player offers prices and the
other player sets a stocking quantity. In the APD contract, the relative bargaining power changes
compared to both push and pull, because now the supplier has the ability to extract all profit from the
6 7 8 9
10 11 12 13 14
0 2 4 6 8 10 12 14 16 18 20 22 24 26 28 30
Aver
age
who
lesa
le p
rice
Period
Regular Discount

Davis, Katok, Santamaría: Push, Pull, or Both? 27
channel by taking on some of the inventory risk. As a robustness check we also collected data on an
APD contract (called APD alternative) with the same ability to split inventory risk, but different
bargaining power structure. Under this APD alternative, the supplier proposes dw , then the retailer
offers w and Rq , and finally the supplier decides on Sq . This way, both parties set a wholesale
price and stock a quantity. The APD alternative cannot fully coordinate the channel, but given our
experimental parameters, it can achieve 94% efficiency, with the retailer earning about 78% of the
profits.
With this structure, suppliers set dw too high, and nearly at an identical level as the wholesale
price in the push contract. The retailers then respond with a w that is also too high, and nearly
identical to the pull contract. Retailers set Rq higher than expected, thus assuming more inventory
risk than they should. Suppliers still produce less than predicted, agreeing with our earlier loss
aversion estimates. In short, the overall the performance of this APD alternative contract is similar to
the pull and original APD contracts in terms of efficiency (about 80%), and to pull in terms of the
profit split (retailer earns 55% of the profit). A more complete analysis of the APD-alternative
contract is available upon request.
Conclusion 5.In this study we evaluate three wholesale price contracts, each differing in how inventory risk is
allocated across the supply chain. Managers, who rely on human judgment in making these strategic
decisions, design supply contracts. Therefore, understanding how people make decisions that
involve inventory risk is a key step to helping managers design behaviorally robust contracts. We
begin by testing the performance of the push and pull contracts in the laboratory and find that,
consistent with the standard theory, the pull contract results in higher channel efficiency. However,
standard theory fails to capture some important quantitative predictions, specifically, that orders are
lower than they should be, rejection rates are positive, and the wholesale prices are far from the
normative benchmark. We proceed to estimate and compare several behavioral models that have
been used in the literature: random errors alone and random errors combined with loss aversion,
anchoring, and inequality aversion. Ultimately a simple model with random errors and loss aversion
fits the data quite well.
We further test our model through an out-of-sample test with the APD contract. In this additional
experiment, we find that our behavioral model provides accurate predictions of the most critical
decision for channel efficiency, production amounts. It also makes the correct qualitative prediction

Davis, Katok, Santamaría: Push, Pull, or Both? 28
that average discount wholesale prices should be significantly lower than average regular wholesale
prices. However, it fails to correctly predict the levels of wholesale prices. There are three
suggestive explanations for this. First, errors for the regular wholesale price are one sided; the
standard theory predicts a regular wholesale price equal to the seller revenue per unit. Second, the
supplier’s expected utility function is quite flat in the region of the wholesale prices we observe.
Third, wholesale prices increase throughout the session, so that suppliers are able to increase their
expected utility by roughly 74% from the start to the end of the session. Ultimately, by the end of the
session, suppliers’ expected utility is within 13% of the utility achieved by the optimal wholesale
prices.
A limitation of our work is that our data does not allow us to separately estimate the effect of the
different behavioral irregularities. This is because many of these motivations have a similar effect on
order quantities and best-response wholesale prices. Separating the effect of these behavioral factors
is an important direction for future research. One possibility might be to create a competitive market
where there are an unequal number of multiple suppliers and retailers, and one side is therefore at a
disadvantage, similar to Leider and Lovejoy (2013).
A key managerial implication of our work pertains to which inventory structure performs best for
the supply chain and the parties involved. Our experimental results indicate that when supply chains
are choosing which inventory arrangement to use, retailers should prefer the pull contract, and
suppliers should prefer the push or APD contract. More importantly, when considering the push and
APD contracts, retailers are better off under the APD contract, and suppliers are no worse off,
making the APD contract an attractive option that also has an equitable split of profits.
At first glance implementing a pull or APD contract might not seem feasible for certain
companies. For example, consider a brick-and-mortar retailer. These retailers may have the need to
carry at least some product on shelf. Having product on shelf does not necessarily preclude a supply
chain from operating under a pull or APD contract. For the pull contract, the supply chain might
consider vendor-managed-inventory, where the product is physically on shelf, but the supplier
manages the inventory decisions and may retain ownership until point-of-sale. Furthermore, the
APD contract elegantly addresses this problem as well; the prebook quantity allows the retailer to
carry at least some product on shelf, where the retailer can order more if needed.
In conclusion, our study suggests that retailers and suppliers should carefully evaluate their
inventory risk arrangements, as the location of this risk in the supply chain can have serious
consequences on profits for both parties and the overall supply chain.

Davis, Katok, Santamaría: Push, Pull, or Both? 29
Acknowledgments The authors gratefully acknowledge the financial support of the Deutsche
Forschungsgemeinschaft through the DFG-Research Group ”Design & Behavior”, and its
members for useful comments. The authors also thank attendees at the 2010 Informs conference
in Austin, TX, the 2011 POMS conference in Reno, NV, and seminar participants at the UT-
Dallas. Katok also gratefully acknowledges the support of the National Science Foundation
award 1243160. We are grateful to Özalp Özer, Srinagesh Gavirneni, Ben Greiner, and Ulrich
Thonemann for providing us useful feedback on the paper. All remaining errors are our own.
References Becker-Peth, Michael, Elena Katok, and Ulrich Thonemann. 2013. “Designing Buyback Contracts
for Irrational but Predictable Newsvendors,” Management Science, 59(8), 1800-1816.
Benzion, Uri, Yuval Cohen, Ruth Peled, and Tal Shavit. 2008. “Decision-making and the
Newsvendor Problem: An Experimental Study.” Journal of the Operational Research
Society, 59 (9), 1281-1287.
Cachon, Gerard P. 2003. “Supply Chain Coordination with Contracts,” Steve Graves and Ton
de Kok editors. The Handbook of Operations Research and Management Science: Supply
Chain Management, Kluwer, Amsterdam, The Netherlands.
Cachon, Gerard P. 2004. “The Allocation of Inventory Risk in a Supply Chain: Push, Pull, and
Advance-Purchase Discount Contracts,” Management Science, 50(2), 222-238.
Cui, Tony H., Jagmohan S. Raju, and John Z. Zhang. 2007. “Fairness and Channel
Coordination,” Management Science, 53 (8), 1303-1314.
Davis, Andrew M. 2013. “An Experimental Investigation of Pull Contracts,” Working paper,
Cornell University.
DeBruyn, Arnaud and Gary E. Bolton. 2008. “Estimating the Influence of Fairness on
Bargaining Behavior,” Management Science, 54 (10), 1774-1791.
Fischbacher, Urs. 2007. “z-Tree: Zurich Toolbox for Ready-made Economic Experiments,”
Experimental Economics, 10 (2), 171-178.
Ho, Teck-Hua, Noah Lim, and Tony H. Cui. 2010. “Reference-Dependence in Multi-Location
Newsvendor Models: A Structural Analysis,” Management Science, 56 (11), 1891-1910.
Katok, Elena and Valery Pavlov. 2013. “Fairness in Supply Chain Contracts: A Laboratory
Study,” Journal of Operations Management, 31, p.129-137.

Davis, Katok, Santamaría: Push, Pull, or Both? 30
Katok, Elena and Diana Wu. 2009. “Contracting in Supply Chains: A Laboratory Investigation,”
Management Science 55(12), pp. 1953-1968.
Kaya, Murat and Özalp Özer. 2012. “Pricing in Business-to-Business Contracts: Sharing Risk,
Profit and Information,” Özalp Özer and Robert Phillips editors. The Oxford Handbook of
Pricing Management, Oxford University Press, USA.
Keser, C., G. Paleologo. 2004. Experimental investigation of retailer- supplier contracts: The
wholesale price contract. Working paper, IBM Research, New York.
Klein, Karen E. 2009. “How Drop-Shipping Works for Retailers and Manufacturers,”
Bloomberg Businessweek,
http://www.businessweek.com/smallbiz/content/sep2009/sb20090922_341780.htms.
Lariviere, Martin and Evan L. Porteus. 2001. “Selling to the Newsvendor: An Analysis of
Price-Only Contracts,” Management Science, 3 (4), 293-305.
Leider, Stephen and William Lovejoy. 2013. “Bargaining in Supply Chains,” Working paper,
University of Michigan.
Netessine, Seguei and Nils Rudi. 2006. “Supply Chain Choice on the Internet,” Management
Science, 52 (6), 844-864.
Özer, Özalp and Wei Wei. 2006. “Strategic Commitments for an Optimal Capacity Decision
Under Asymmetric Forecast Information,” Management Science 52(8), 1238-1257.
Özer, Özalp, Onur Unca and Wei Wei. 2007. “‘Selling to the ‘Newsvendor’ with Forecast Update:
Analysis of a Dual Purchase Contract,” European Journal of Operational Research 182,
1150-1176.
Randall, Taylor, Seguei Netessine and Nils Rudi. 2002. “Should You Take the Virtual Fulfillment
Path?” Supply Chain Management Review, November/December issue.
Randall, Taylor, Seguei Netessine and Nils Rudi. 2006. “An Empirical Examination of the Decision
to Invest in Fulfillment Capabilities: A Study of Internet Retailers,” Management
Science, 52 (4), 567-580.
Schweitzer, Maurice E. and Gerard P. Cachon. 2000. “Decision Bias in the Newsvendor
Problem with a Known Demand Distribution: Experimental Evidence,” Management
Science, 46 (3), 404-420.
Su, Xuanming. 2008. “Bounded Rationality in Newsvendor Models,” Manufacturing and
Service Operations Management, 10 (4), 566-589.
Tang, Wenjie and Karan Girotra. 2010. “Synchronizing Global Supply Chains: Advance
Purchase Discounts,” Working paper, INSEAD.

Davis, Katok, Santamaría: Push, Pull, or Both? 31
United States Census Bureau. 2013. “2011 E-Stats,”
http://www.census.gov/econ/estats/2011reportfinal.pdf
Vuong, Quang H. 1989. “Likelihood Ratio Tests for Model Selection and Non-Nested Hypotheses,”
Econometrica, 57 (2), 307-333.
Appendix: Behavioral Model Derivations Here we present the derivation of the optimal quantities for the push, pull, and APD contracts.
A.1 Push Contract
For the push contract under loss aversion, the problem the retailer must solve, to find the optimal
quantity, is as follows:
( )( )( )00m x .a )1 (
q
Rqr w qu F x wdx qβ β
≥= + − − −∫ (8)
The solution for this problem is given by:
q* = F −1 r − w
r + w β −1( )⎛
⎝⎜
⎞
⎠⎟ . (9)
When F is U[0,1] the problem, and the corresponding solution, yield:
( )( )2
01 ,
2maxq R
qr w qu wqβ β≥
⎛ ⎞= + − − −⎜ ⎟
⎝ ⎠ (10)
q* = r − w
r + w β −1( ) . (11)
In turn, the problem the retailer must solve in a push contract under inequality aversion is:
( )00max ( ( ) ( .( ) ))
q
R S RqF x dxu r q wq w qα π π +
≥= − − − −∫ (12)
In this setting we need to consider two cases to find the optimal quantities:
i. when q(2w− c − r)+ r F
0
q
∫ (x)dx ≥ 0 , ( )0( (( ) ( ) 2 ) ( ) ,)
q
S R ww q qc q r F x dxπ π + = −− −− ∫ and
ii. when 0
(2 ) ( ) 0q
q w c r r F x dx− − + ≤∫ , (π S (w)−π R(q))+ = 0 .
Note that in both cases, when q(2w− c − r)+ r F
0
q
∫ (x)dx = 0 , (π S (w)−π R(q))+ = 0.
Using conditions (i) and (ii) we can solve each separately to find the optimal quantities, and then
establish the range of wholesale prices for which they remain optimal. That way, we can define what
the optimal quantity should be, given a wholesale price. However, the solution for the optimal

Davis, Katok, Santamaría: Push, Pull, or Both? 32
quantity and the wholesale price thresholds, for a general distribution, cannot be found explicitly.
Therefore, when F is a U[0,1] the results are:
Condition (i) holds for w w≥ , and corresponds to q ≥ 2(r + c− 2w)r
. The problem in this case is:
2 2
02 ,
2 2
2( 2 )s.t. ,
max Rq
q qr q wq wq cq r q
r c w
u
qr
α≥
⎛ ⎞⎛ ⎞ ⎛ ⎞= − − − − − −⎜ ⎟⎜ ⎟ ⎜ ⎟
⎝ ⎠ ⎝ ⎠⎝ ⎠
+ −≥
(13)
* ( 2 ) ,(1 )
r w r c wqrα
α− + + −
=+
(14)
w = r(1+α )+ c(2+α )
3+ 2α. (15)
Condition (ii) holds for w w≤ , and corresponds to q ≤ 2(r + c− 2w)r
. The problem in this case is
follows:
2
0,
22( 2
m
,
ax
)s.t
Rq
qr q w
wq
q
rc
u
r
≥
⎛ ⎞= − −⎜ ⎟
⎝ ⎠+ −
≤
(16)
q* = r − w
r, (17)
w = r + 2c
3. (18)
When w < w < w :
q* = 2(r + c − 2w)
r. (19)
Note that if w ≥ r +α(r + c)1+ 2α
> w , then the optimal quantity is equal to zero, since it cannot be
negative.
Summarizing, we have the following results for the push contract under inequality aversion:

Davis, Katok, Santamaría: Push, Pull, or Both? 33
q* =
r − w+α (r + c − 2w)r(1+α )
,w ≥ w;
2(r + c − 2w)r
,w < w < w;
r − wr
,w ≤ w.
⎧
⎨
⎪⎪⎪
⎩
⎪⎪⎪
A.2 Pull Contract
For the pull contract under loss aversion, the problem the supplier must solve, to determine the
optimal quantity is:
( )( )( )00m x .a )1 (
q
Sqw c qu F x cdx qβ β
≥= + − − −∫ (20)
The solution for this problem yields:
q* = F −1 w− c
w+ c β −1( )⎛
⎝⎜
⎞
⎠⎟ . (21)
When F is U[0,1] the corresponding problem and solution are given by:
( )( )2
01 ,
2maxq S
qw c qu cqβ β≥
⎛ ⎞= + − − −⎜ ⎟
⎝ ⎠ (22)
q* = w− c
w+ c β −1( ) . (23)
In the case of a pull contract under inequality aversion, the problem the supplier needs to solve is
defined as follows:
( )00max ( )( ) ( .( ))
q
S R SqF x dxu w q cq w qα π π +
≥= − − − −∫ (24)
Similar to the push contract, in this setting we need to consider two cases to find the optimal
quantities:
i. when ( )0( 2 ) ( ) 0
qr w q F x dx cq− − + ≥∫ , ( )0
( ) ( )) ( 2( ( ))q
R Sw q r w q cqF x dxπ π +− −= − +∫ , and
ii. when ( )0( 2 ) ( ) 0
qr w q F x dx cq− − + ≤∫ , ( 0( ) ( ))R Sw qπ π +− = .
Note that in both cases when (r − 2w) q − F
0
q
∫ (x)dx⎛⎝
⎞⎠ + cq = 0 , (π R(w)−π S (q))+ = 0.
As in the push contract, using conditions (i) and (ii) we can solve each separately to find the optimal
quantities, and then establish the range of wholesale prices for which they remain optimal. However,
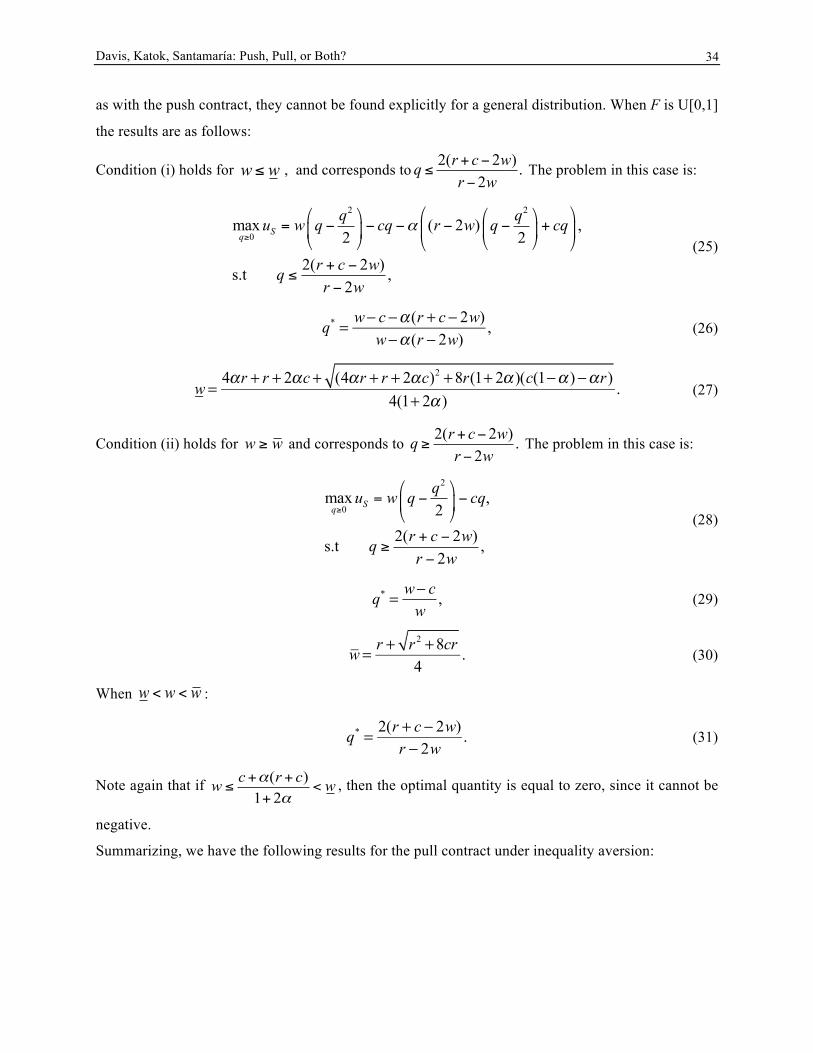
Davis, Katok, Santamaría: Push, Pull, or Both? 34
as with the push contract, they cannot be found explicitly for a general distribution. When F is U[0,1]
the results are as follows:
Condition (i) holds for w w≤ , and corresponds to q ≤ 2(r + c− 2w)r − 2w
. The problem in this case is:
2 2
0( 2 ) ,
2 2
2( 2 )s.
max
t ,2
q Sq qw q cq r w q cq
r c w
u
qr w
α≥
⎛ ⎞⎛ ⎞ ⎛ ⎞= − − − − − +⎜ ⎟⎜ ⎟ ⎜ ⎟
⎝ ⎠ ⎝ ⎠⎝ ⎠+ −−
≤
(25)
q* = w− c −α (r + c − 2w)
w−α (r − 2w), (26)
w =
4αr + r + 2αc + (4αr + r + 2αc)2 +8r(1+ 2α )(c(1−α )−αr)4(1+ 2α )
. (27)
Condition (ii) holds for w w≥ and corresponds to q ≥ 2(r + c− 2w)r − 2w
. The problem in this case is:
2
0m ,
22( 2
ax
2)s.t ,
Sq
qw q cu
qr w
q
r c w
≥
⎛ ⎞= − −⎜ ⎟
⎝ ⎠+−−
≥
(28)
q* = w− c
w, (29)
w = r + r 2 +8cr
4. (30)
When w < w < w :
q* = 2(r + c − 2w)
r − 2w. (31)
Note again that if w ≤ c+α(r + c)1+ 2α
< w , then the optimal quantity is equal to zero, since it cannot be
negative.
Summarizing, we have the following results for the pull contract under inequality aversion:
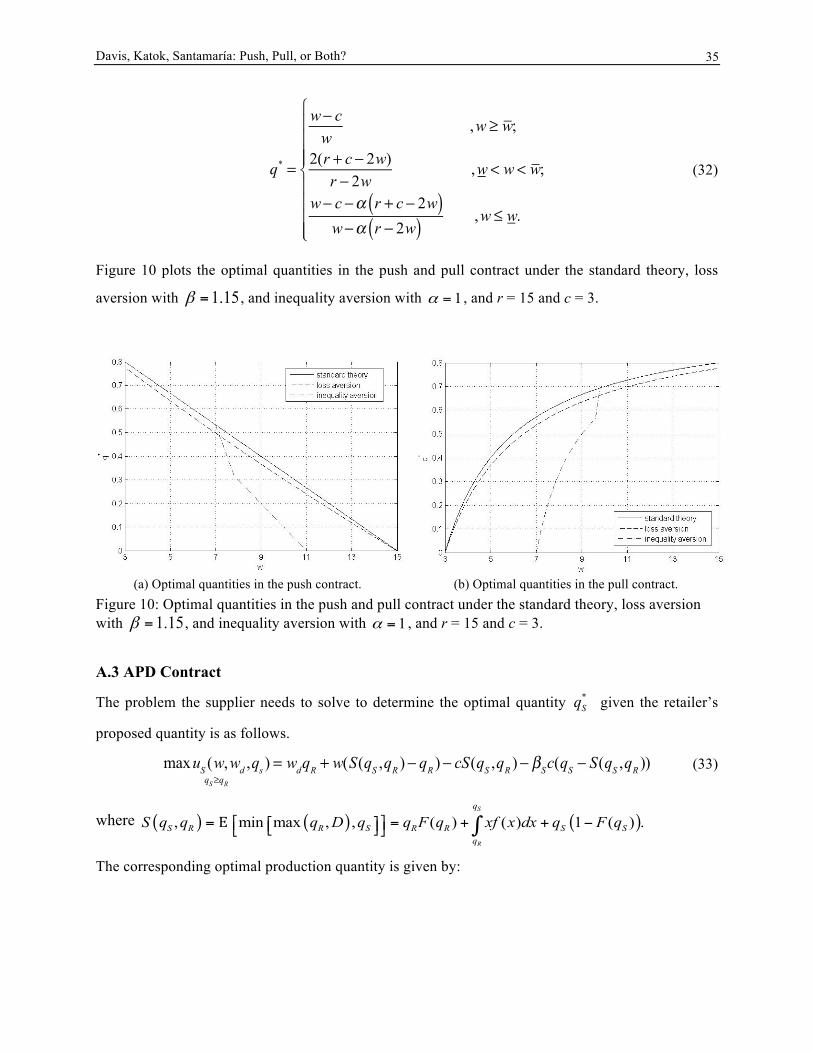
Davis, Katok, Santamaría: Push, Pull, or Both? 35
q* =
w− cw
,w ≥ w;
2(r + c − 2w)r − 2w
,w < w < w;
w− c −α r + c − 2w( )w−α r − 2w( ) ,w ≤ w.
⎧
⎨
⎪⎪⎪⎪
⎩
⎪⎪⎪⎪
(32)
Figure 10 plots the optimal quantities in the push and pull contract under the standard theory, loss
aversion with 1.15β = , and inequality aversion with 1α = , and r = 15 and c = 3.
(a) Optimal quantities in the push contract. (b) Optimal quantities in the pull contract.
Figure 10: Optimal quantities in the push and pull contract under the standard theory, loss aversion with 1.15β = , and inequality aversion with 1α = , and r = 15 and c = 3.
A.3 APD Contract
The problem the supplier needs to solve to determine the optimal quantity *Sq given the retailer’s
proposed quantity is as follows.
maxuS (w,wd ,qs )
qS≥qR
= wdqR + w(S(qS ,qR )− qR )− cS(qS ,qR )− βSc(qS − S(qS ,qR )) (33)
where ( ) ( ) ( ), min max , , ( ) ( ) 1 ( ) .S
R
q
S R R S R R S Sq
S q q q D q q F q xf x dx q F q⎡ ⎤= = + + −⎡ ⎤⎣ ⎦⎣ ⎦ ∫E
The corresponding optimal production quantity is given by:

Davis, Katok, Santamaría: Push, Pull, or Both? 36
qS* =
F −1 w− cw+ c(βS −1)
⎛
⎝⎜⎞
⎠⎟,w ≥
c 1+ F(qR ) βS −1( )( )1− F(qR )
;
qR ,w <c 1+ F(qR ) βS −1( )( )
1− F(qR ).
⎧
⎨
⎪⎪
⎩
⎪⎪
(34)
When F corresponds to a U[0,1], then:
( )( )
( )( )*
1 1;
( 11
,1 1
.1
,)
R S
RS
R SR
R
S
c qw c ww c q
qc q
q wq
β
β
β
⎧ + −−≥⎪
+ −⎪= ⎨
<
−
+ −⎪⎪ −⎩
(35)
We next consider the problem the retailer must solve to set the prebook quantity, given the proposed
wholesale prices by the supplier, which can be stated as follows:
maxqR≥0
uR(qR ) = (r − wd )S(qR )+ (r − w)(S(qS )− S(qR ))− βwd (qR − S(qR )), (36)
where S(qR ) = E min qR ,D( )⎡⎣ ⎤⎦ , and S(qS ) = E min qS ,D( )⎡⎣ ⎤⎦ .
The corresponding optimal prebook quantity is given by:
qR
* = F −1 w− wd
w+ wd (βR −1)⎛
⎝⎜⎞
⎠⎟. (37)
When F is a U[0,1] then:
* .( 1)R
d
d R
w wqw w β
−=
+ − (38)