putting schools on the map - cities and schoolscitiesandschools.berkeley.edu/reports/putting schools...
TRANSCRIPT
Putting Schools on the Map: Linking Transit-Oriented Development, Families, and Schools in the San Francisco Bay Area A Center for Cities & Schools and Great Communities Collaborative Framing Paper
Putting Schools on the Map: Linking Transit-Oriented Development, Families, and Schools in the San Francisco Bay Area A Center for Cities & Schools Framing Paper
http://citiesandschools.berkeley.edu/
Research Conducted by:
Ariel H. Bierbaum, Program Director, CC&S Jeffrey M. Vincent, Deputy Director, CC&S Deborah L. McKoy, Executive Director, CC&S
Acknowledgements
Stephanie Dock; Jon Stiles, California Census Research Data Center, UC Berkeley; Robert Hickey; Ian Carlton; Erick Guerra; Carrie McDade; and Nicole Kite.
The Center for Cities & Schools at the University of California, Berkeley
The Center for Cities & Schools is an action-oriented think tank, whose mission is to promote high quality education as an essential component of urban and metropolitan vitality to create equitable, healthy, and sustainable cities and schools for all.
This paper was funded by The San Francisco Foundation.
Center for Cities & Schools Institute of Urban and Regional Development University of California, Berkeley 316 Wurster Hall #1870 Berkeley, CA 94720-1870
http://citiesandschools.berkeley.edu/
June 2010

Putting Schools on the Map: Linking Transit-Oriented Development, Families, and Schools in the San Francisco Bay Area
Contents
Executive Summary ........................................................................................................ 2
I. Introduction: Aspirational “Complete Communities” in the Bay Area.................... 6
II. Families, Schools, and Transit-Oriented Development: Ten Core Connections . 10
III. The Educational Context of the San Francisco Bay Area ................................... 17
IV. Case Studies: TOD, Family, and School Linkages in the Bay Area .................... 21 Oakland Lake Merritt BART Station Area Plan ................................................... 23 Pittsburg Railroad Avenue Specific Plan ............................................................. 29 San Jose North 1st Street Corridor Plan ............................................................... 35 Santa Rosa Downtown Specific Plan ................................................................... 44 San Leandro Station Area Plan ............................................................................. 49
V. Findings: Opportunities for TOD to Support Families and Enhance Public Schools .......................................................................................................................... 55
VI. Conclusion ............................................................................................................... 59
Appendix 1: Case Study Fact Sheets ......................................................................... 60
Appendix 2: Median Income Calculation ................................................................... 61
Putting Schools on the Map 1

Executive Summary
In the nine-county San Francisco Bay Area region, municipal and regional leaders are grappling with how to plan for the expected growth of the coming decades. Because of the projected increases in residents under 18 years of age, access to high quality schools – defined by both the educational quality of school programs and a school’s role as a local, place-based community asset – will continue to play a strong part in where families choose to live in the region. Interest in Transit-Oriented Development (TOD) has grown across the country in the last decade and is increasingly employed as a strategy to achieve environmentally sustainable infill development and auto use reduction. The Great Communities Collaborative (GCC) in the San Francisco Bay Area has developed an aspirational vision for guiding new development that aims to increase equity, support families, and create mixed income communities.
Given the GCC’s “aspirational” TOD strategy, this paper looks at what must happen to realize these goals. In particular, we examine the connections between TOD and families, which, by extension, includes making the link among TOD, schools, and expanding educational opportunities for all children. This paper is the first of its kind; there is very little research on TOD and families and virtually no research on the relationship between TOD and schools. Therefore, we take an exploratory approach to understanding and framing these interconnections, and provide a rationale for the linkages at this nexus. The findings in this paper are the result of extensive case study research, interviews, and focus groups conducted throughout the Bay Area. Specifically, we ask:
• What issues, concerns, and/or questions about families and schools have emerged among stakeholders in current TOD planning processes throughout the Bay Area?
• How do these issues, concerns, and/or questions differ by the local context of the various TOD planning processes?
• What policy and planning opportunities exist to address these issues and both support and ensure successful TOD, complete communities, and high quality educational opportunities for families?
The report begins by describing “Ten Core Connections” among TOD, families, and schools relevant to creating complete communities and ensuring ensure high quality educational opportunities for all children. We then describe the unique demographic and policy context in which schools and school districts operate in California. From there, we present and analyze the experiences from five Bay Area TOD planning processes. These case studies illustrate a range of issues and represent different points in a planning and development time frame. Combined with our years of research in the region, these exploratory case studies guided our development of the
Putting Schools on the Map 2

“Ten Core Connections” between TOD and education, and informed the findings that conclude the paper.
Families, Schools, and Transit-Oriented Development: Ten Core Connections
1. School quality plays a major role in families’ housing choices.
2. A wide housing unit mix is needed to attract families.
3. Housing unit mix, school enrollment, and school funding are intricately related.
4. Children often use transit to get to and from school and afterschool activities.
5. Multi-modal transit alternatives support access to the increasing landscape of school options.
6. Mixed-income TOD provides opportunities for educational workforce housing.
7. TOD design principles support walkability and safety for children and families.
8. TOD brings amenities and services that can serve families closer to residential areas.
9. When schools are integrated with TOD planning, opportunities emerge for the shared use of public space.
10. TOD offers opportunities for renovating and building new schools in developments, which draws families.
The Educational Context of the San Francisco Bay Area
We describe five important dimensions necessary to understand the complex realities facing public education in California and the Bay Area today:
• Bay Area schools educate diverse student populations.
• Low income, African-American and Latino, and English Language Learner students face serious opportunity and achievement gaps.
• California education finance is state-controlled, silo-ed, and complex.
• Schools are community assets.
• School districts are separate from city/county governments and urban planning processes.
Case Studies: TOD, Family, and School Linkages in the Bay Area
Our five case studies of Bay Area TOD planning processes explore the linkages between TOD, families, and schools. All are funded by the Metropolitan
Putting Schools on the Map 3
Transportation Commission’s (MTC) Station Area Planning grants, these cases have been selected because they illustrate a range of issues, contexts, and opportunities for connecting TOD and public schools, and represent different phases of the development timeline. The cases include:
1. Oakland Lake Merritt BART Station Area Plan will increase housing and community amenities in an area of downtown Oakland that includes a range of pre-K through community college educational assets. The case study examines the pre-planning community engagement and visioning process.
2. Pittsburg Railroad Avenue Specific Plan proposes a new neighborhood as part of the BART extension to this outer suburban area of eastern Contra Costa County. The case examines the planning process, and highlights current and future opportunities for collaborations between the planning department and the local school district.
3. San Jose North 1st Street Corridor Plan proposes increased residential development in this important employment center in the Silicon Valley. The case focuses on the planning process, and the impacts on the four overlapping school districts in the area. We also highlight San Jose’s extensive city-school collaborative infrastructure.
4. Santa Rosa Downtown Specific Plan provides the framework for new development in anticipation of the forthcoming Sonoma-Marin Area Rail Transit. The case illustrates how long-standing personal relationships in medium-sized cities can facilitate positive city-school collaboration.
5. San Leandro Station Area Plan calls for significant increases in housing adjacent to the BART station in this increasingly urban community. The case looks at both the planning and phase one implementation of the TOD.
Findings: Opportunities for TOD to Support Families and Enhance Public Schools
Collaborative, cross-sector partnerships can leverage opportunities linking TOD, families, and schools. Aligning the opportunities and mitigating the potential impacts TOD may have on schools will require collaborative, cross-sector partnership
The “Story” of TOD can more explicitly include families and schools. TOD focused at least in part on accommodating families can both attract new populations to TOD living and help retain current residents in TOD areas.
Capacity-building is needed to support cross-sector partnerships. Stakeholders may be engaging in such partnerships for the first time and could benefit from capacity-building that prepares them to be more effective partners. We identify four key capacity-building areas, including: communications infrastructure, data- and
Putting Schools on the Map 4

information-sharing, incremental successes, and points of effective partnership/engagement.
Performance measures and outcome indicators are needed to assess successful TOD outcomes supporting families and schools. To effectively align and assess TOD outcomes that simultaneously support equitable development, families and schools, districts, cities, and developers need established performance measures and outcome indicators. Further research and case study development should be utilized to construct tangible performance measures and outcome indicators for successful TOD planning processes and outcomes that support families and local schools.
Putting Schools on the Map 5
I. Introduction: Aspirational “Complete Communities” in the Bay Area
In the nine-county San Francisco Bay Area region, municipal and regional leaders are grappling with how to plan for the expected growth of the coming decades. By 2035, an additional two million people are projected to live in the Bay Area.1 Where and how these new residents – who will be diverse in age, race, ethnicity, and income – will live, work, and play are important questions to answer for a sustainable tomorrow. Because of the projected increases in residents under 18 years of age, access to high quality schools – defined by both the educational quality of school programs and a school’s role as a local, place-based community asset – will continue to play a strong part in where families choose to live in the region.
Planners, policy makers, and community advocates across the region recognize the need for more sustainable, focused growth and patterns of development. To this end, four Bay Area nonprofit organizations, three foundations, and a national nonprofit have come together as the Great Communities Collaborative (GCC) to target new development in existing communities, promote better connections between land use and transportation, and protect the environment.2 Specifically, the GCC envisions:
All people in the Bay Area [living] in complete communities, affordable across all incomes, with nearby access to quality transit by 2030. These neighborhoods will have a mix of jobs, shops, community services, and homes affordable to families of all income levels. The members of the collaborative are committed to promoting this vision of sustainable and equitable development and to ensuring that residents are deeply engaged in planning for transit-oriented development (TOD) in their neighborhoods3 [emphasis added].
GCC partners see infill development, generally, and Transit-Oriented Development (TOD), specifically, as key strategies to realize the goal of creating complete communities. Infill development focuses on building in places with existing infrastructure (e.g., on vacant or underutilized land in cities and denser, inner suburbs that have good access to transit, jobs, and other community amenities). TOD is real estate development adjacent to transit hubs,4 most often with a mixed-use
1 According to the Association of Bay Area Governments forecasts. More information available at: http://www.abag.ca.gov/planning/currentfcst/ 2 GCC member organizations are: Greenbelt Alliance, the Nonprofit Housing Association of Northern California, TransForm, Urban Habitat, Reconnecting America, East Bay Community Foundation, The San Francisco Foundation, and the Silicon Valley Community Foundation. 3 Great Communities Collaborative website: http://greatcommunities.org/ 4 From Transit Cooperative Research Program. 2004. Report 102 Transit-Oriented Development in the United States: Experiences, Challenges, and Prospects, the Transportation Research Board (available at: http://onlinepubs.trb.org/Onlinepubs/tcrp/tcrp_rpt_102.pdf) California and the Bay Area Rapid Transit (BART) system are some of the few state and/or regional transit agencies across the country
Putting Schools on the Map 6

approach that combines housing and retail close together in relatively high densities. At a local level, these concepts are adapted to fit the local context of each TOD site.
Interest in TOD has grown across the country in the last decade and is increasingly employed as a strategy to achieve environmentally sustainable infill development and auto use reduction. Increasing transit use and decreasing private auto use are the primary objectives that have guided the TOD concept nationally. It is no surprise, then, that success metrics have centered on revenue for transit agencies and increased ridership rather than on other “quality of life” benefits that TOD advocates and developers are now increasingly recognizing.5
The GCC, however, aims to push the conventional model of TOD further. In particular, the GCC posits that complete communities should “provide a mix of jobs, shops, community services, and homes affordable to families across a mix of incomes [emphasis added].” In other words, the GCC’s aspirational goals for guiding new development in the Bay Area have explicit equity and family-oriented elements, and aim for a different TOD model than has typically been seen across the country. For instance, most TOD have produced higher-end housing that caters more to empty nesters and/or young professionals without children, rather than to families.6 Such housing tends to be smaller studio, one or two bedroom units, and not the larger two, three, or four bedroom housing units that many families desire.
Aspirational goals for guiding new development in the Bay Area have explicit equity and family-oriented elements.
GCC members and many regional leaders recognize that if TOD is an accepted strategy for realizing complete communities in the Bay Area, then not utilizing TOD to plan for families and lower-income residents undermines the overall goal, given that
that have clearly articulated definitions of TOD in policy. The California Transportation Department defines TOD as development with “higher than usual densities, mixed land uses, and pedestrian friendly designs [and is] noteworthy for making a point that TOD is not ‘anti-car’ emphasizing that TOD creates an attractive pedestrian environment ‘without excluding the auto.” Further, BART defines TOD as “[m]oderate- to higher-density development, located within easy walking distance of a major transit stop, generally with a mix of residential, employment, and shopping opportunities designed for pedestrians without excluding the automobile. TOD can be new construction or redevelopment of one or more buildings whose design and orientation facilitate transit use.” (p. 7); Fostering Equitable and Sustainable Transit-Oriented Development: Briefing Papers for a Convening on Transit-Oriented Development. Convening held by the Center for Transit Oriented Development, Living Cities, and Boston College’s Institute for Responsible Investment at the Ford Foundation. February 24-25, 2009. Available at: http://www.livingcities.org/leadership/trends/transit/ 5 Transit Cooperative Research Program. 2004. Report 102 Transit-Oriented Development in the United States: Experiences, Challenges, and Prospects, the Transportation Research Board, p. 11. Available at: http://onlinepubs.trb.org/Onlinepubs/tcrp/tcrp_rpt_102.pdf 6 Transit Cooperative Research Program. 2004. Report 102 Transit-Oriented Development in the United States: Experiences, Challenges, and Prospects, the Transportation Research Board, p. 7. Available at: http://onlinepubs.trb.org/Onlinepubs/tcrp/tcrp_rpt_102.pdf.
Putting Schools on the Map 7
families with children under 18 make up about 30% of the Bay Area’s population, and approximately one-quarter of Bay Area households with children under 18 are also at or below 80% of the area median income.7 The GCC thus realizes that mixed income housing and TOD have unique synergies in the Bay Area context.8
Report Overview
Given the GCC’s “aspirational” TOD strategy, this paper looks at what must happen to realize these goals. In particular, we examine the connections between TOD and families, which, by extension, includes making the link among TOD, schools, and expanding educational opportunities for all children. This paper is the first of its kind; there is very little research on TOD and families and virtually no research on the relationship between TOD and schools. Yet, regional planners and policy makers find that issues, concerns, and questions about families and schools repeatedly come up among stakeholders in the TOD planning processes throughout the Bay Area. Therefore, we take an exploratory approach to understanding and framing these interconnections, and provide a rationale for the linkages at this nexus.
The findings in this paper are the result of extensive case study research, interviews, and focus groups conducted throughout the Bay Area. Specifically, we ask:
• What issues, concerns, and/or questions about families and schools have emerged among stakeholders in current TOD planning processes throughout the Bay Area?
• How do these issues, concerns, and/or questions differ by the local context of the various TOD planning processes?
• What policy and planning opportunities exist to address these issues and both support and ensure successful TOD, complete communities, and high quality educational opportunities for families?
The report begins by describing “Ten Core Connections” among TOD, families, and schools relevant to creating complete communities and ensuring ensure high quality educational opportunities for all children.
To aid TOD planners’ understanding of public schools, we describe the unique demographic and policy context in which schools and school districts operate in California. These complex realities confront many commonly held opinions and illuminate little-understood challenges about schools and school quality. We use California and the Bay Area, specifically, as the example, although this story will vary somewhat from region to region within California and will certainly vary tremendously 7 Bay Area Census. MTC/ABAG. Available at: http://www.bayareacensus.ca.gov/bayarea.htm; percentage of households with children under 18, living at or below 80% Area Median Income calculated by the California Census Research Data Center at UC Berkeley, based on American Community Survey 2008 data. See Appendix 2 for spreadsheet calculations/crosstab. 8 Transit Oriented for All: The Case for Mixed-Income Transit-Oriented Development in the Bay Area. A Great Communities Collaborative Framing Paper. June 2007. Available at: http://communityinnovation.berkeley.edu/publications/GCCFramingPaper_FINAL.pdf
Putting Schools on the Map 8

in other states. But regardless of the location, these contextual details inform a better understanding of the possibilities and challenges inherent in planning for families and engaging schools in TOD planning and implementation processes.
From there, we present and analyze the experiences from five Bay Area TOD planning processes. These case studies illustrate a range of issues and represent different points in a planning and development time frame. Combined with our years of research in the region, these exploratory case studies guided our development of the “Ten Core Connections” among TOD and education, and informed the findings that conclude the paper.
Putting Schools on the Map 9
II. Families, Schools, and Transit-Oriented Development: Ten Core Connections
As many Bay Area leaders assert, improving cities and improving schools go hand in hand; one cannot be done without the other. Opinions on how to do so, however, are many, and proven strategies are few and far between. City improvements are rarely, if ever, connected to school improvements, and vice versa. Most fundamentally, these efforts happen in completely different worlds and leaders rarely engage in complimentary efforts to produce integrated and mutually beneficial outcomes.9 But because the lives of young people are shaped by their housing, health care, employment opportunities, and safety on the streets, schools cannot be the sole institution responsible for preparing future generations of active, engaged, and healthy citizens. Likewise, schools are community assets – physically and socially – and their role in supporting vibrant neighborhoods, cities, and regions is crucial.
Given these “common sense” connections, we start our inquiry here, asking how do the actions (or inactions) of cities and development impact schools? Similarly, how do the actions (or inactions) of schools and school districts affect cities and their development efforts? Answering these questions should not provoke more finger-pointing, but rather generate a discussion on how these issues are related and how to design complimentary efforts for realistic “win-wins.” TOD projects offer a specific scenario to explore and illustrate such strategies.
Schools are community assets – physically and socially – and their role in supporting vibrant neighborhoods, cities and regions is crucial.
As the GCC envisions, “We can build homes near public transit that provide enough choice so that all residents, at every income level, can find great communities to live in: communities with access to good schools, parks, transportation, shopping, and other necessities [emphasis added].”10 With the agreed upon goals of creating “great communities” and ensuring high quality educational opportunities for all children as a starting point, we next describe the Ten Core Connections between TOD and education.
9 For more documentation see Center for Cities & Schools PLUS Leadership Initiative, available at: http://citiesandschools.berkeley.edu/leadership.html 10 Great Communities Collaborative. 2007. Building Great Communities in the San Francisco Bay Area [Brochure].
Putting Schools on the Map 10

1. School quality plays a major role in families’ housing choices. Housing and schools are intricately related; as one prominent urban policy researcher has noted, housing policy is school policy.11 Generally, when parents choose where to live, they are also choosing their child’s school(s).12 Access to quality schools thus plays a strong role in housing choice, especially among middle- and upper-income families. In California, families rank schools in the top three issues shaping their housing and neighborhood choices.13 In a national survey, quality schools ranked first among the items suburban and smaller city residents claim would draw them to live in a more urban setting.14 Given this data, a TOD strategy aimed at attracting families with school-aged children must think about access to educational opportunities.
2. A wide housing unit mix is needed to attract families. Unit mixes that include three and four bedrooms, apartments, and townhomes offer family-friendly options. Often, because of the complexity of financing TOD, developers have primarily opted for studio, one and two bedroom apartments. While some of these units may attract empty nesters, singles, or couples without children, larger families with children require more bedroom space.
3. Housing unit mix, school enrollment, and school funding are intricately related. New housing will likely impact enrollments at nearby schools, which by extension impacts school operations and school district funding. Most often, new housing that includes larger family units will increase enrollment, requiring schools to accommodate this demand. For schools at or above capacity, this can be difficult; for schools that are under-enrolled, new students are welcome, bring additional financial resources, and enhance the use of existing school facilities. In other circumstances, infill and/or TOD may require removing existing housing to redevelop the land. In this case, local schools could see an abrupt (albeit perhaps temporary) decline in enrollment. Because school funding is tied to enrollment numbers, these “missing” students translate into reduced school funding, which can seriously harm an already struggling school. Enrollment and capacity situations will differ from school to school, but in general, unexpected changes in enrollment – increases or decreases – are difficult for districts to manage and can cause tension.
4. Children often use transit to get to and from school and afterschool activities. Students often use public transit to get to and from school and afterschool enrichment and work activities. Student use of transit appears most common in cities and older suburbs where higher densities make the trip more convenient by 11 Rusk, David.. 2003. Housing Policy Is School Policy: Remarks to the 44th Annual Meeting of Baltimor Neighborhoods, Inc. May 6. Available at: http://www.gamaliel.org/DavidRusk/DavidRuskLibrary.htm 12 McKoy, Deborah L. and Jeffrey M. Vincent. 2008. Housing and Education: The Inextricable Link. In Segregation: The Rising Costs for America. Edited by James H. Carr and Nandinee K. Kutty. New York: Routledge. 13 Baldassare, Mark. 2002. Public Policy Institute of California Statewide Survey: Special Survey on Land Use. San Francisco: PPIC. 14 American Planning Association & American Institute of Certified Planners. 2000. The Millennium Survey: A National Poll of American Voters’ View on Land Use. Washington, DC: APA/AICP.
Putting Schools on the Map 11
transit. Access to safe, reliable, and affordable transit facilitates students’ on time and consistent arrival at school, reducing problems of truancy and tardiness. In addition, students (especially middle and high school students) use transit to get to afterschool activities that enhance their educational experience, including internships, clubs, and recreational activities. For many students, transit means the difference between participating or not participating in these kinds of productive, engaging, and academically enriching opportunities. TOD and infill development, either near BART or at transit hubs, provide easy access to many options for students taking buses and/or BART.
5. Multi modal transit alternatives support access to the increasing landscape of school options. The educational landscape across the country is continually changing, and notably students and families now have an increasing number of school options. In other words, children do not always attend their closest neighborhood school. There are a host of reasons for these choices. Students may attend a charter15 or theme-based magnet school16 located outside of their home neighborhood. School districts may have an assignment policy to relieve overcrowding or counter segregation of schools that disperses students throughout the district. Students may attend a private school that draws from the entire region. Older students (especially high school students) are more likely to attend school that is not in their neighborhood to access specialized programs. Access to these educational options hinges on access to safe, reliable, and affordable transportation; transportation access thus ultimately determines which families have the opportunity to choose different and most appropriate schools for their children.
6. Mixed income TOD provides opportunities for educational workforce housing. School districts often struggle to recruit and retain new teachers. The combination of 15 A charter school is a public school, and it may provide instruction in any of grades K-12. A charter school is usually created or organized by a group of teachers, parents and community leaders or a community-based organization, and it is usually sponsored by an existing local public school board or county board of education. Specific goals and operating procedures for the charter school are detailed in an agreement (or "charter") between the sponsoring board and charter organizers. A charter school is generally exempt from most laws governing school districts, except where specifically noted in the law. California public charter schools are required to participate in the statewide assessment test, called the STAR (Standardized Testing and Reporting) program. The law also requires that a public charter school be nonsectarian in its programs, admission policies, employment practices, and all other operations and prohibits the conversion of a private school to a charter school. Public charter schools may not charge tuition and may not discriminate against any pupil on the basis of ethnicity, national origin, gender, or disability. Source: California Department of Education (http://www.cde.ca.gov/sp/cs/re/csabout.asp). 16 Magnets are programs in schools or in an entire school that students and their parents and guardians may choose instead of attending their local school. Many, but not all, magnet programs and schools reflect a district strategy to achieve racial and ethnic balance by offering special opportunities in curriculum and instruction, generally with the benefit of federal funding. Many types of magnets have been established, including but not only ones providing unique instruction in the arts, in various sciences, and in career education. Magnets are designed by local authorities to attract parents, guardians, and students who are free to choose, subject to local rules, the school in which they enroll. Often school districts publish a list explaining their magnet options. Source: California Department of Education (http://www.cde.ca.gov/sp/eo/mt/).
Putting Schools on the Map 12
modest teacher salaries and high housing costs forms a constant challenge for many California school districts. In fact, some California school districts have developed, or have plans to build, affordable housing aimed at their teachers.17 TOD models that focus on mixed income and family housing could be a real attraction for public school teachers and present an opportunity for the school district to partner in the TOD.
7. TOD design principles support walkability and safety for children and families. Across the country, researchers have seen drastic declines in the number of children walking and/or bicycling to school. Surveying parents, researchers have found that distances between home and school, traffic concerns, and “stranger danger” are the major barriers.18 TOD design principles inherently address these concerns, and may help increase walking and/or bicycling to school among children, especially elementary school children. First, TOD models emphasize pedestrian infrastructure, including sidewalks and crosswalks. Second, mixed-use TOD aims to create active, vibrant street life, which improves safety by having more “eyes on the street.” Finally, the TOD objective of increased ridership enhances safety and reliability, reinforcing and increasing the demand and desirability of transit for families.
8. TOD brings amenities and services that can serve families, closer to residential areas. The mixed-use nature of TOD provides opportunities for services and amenities that attract and support children and families. For example, childcare centers and preschools located within or adjacent to TOD place these daily parent destinations within walking distance of transit, which may increase the likelihood of working parents to use transit while balancing the logistics of getting to daycare and work each day.
9. When schools are integrated with TOD planning, opportunities emerge for the shared use of public space. As per local zoning requirements, TOD often must include open space. In many infill locations, however, open space is lacking. If an existing school is located adjacent to or near the TOD, there are opportunities to use the school site as open space. Often referred to as “joint use” of public school space, this can be done formally through a Memorandum of Understanding (MOU) or a Joint Use Agreement (JUA) with the school district.19 Most often joint uses occur with outdoor school space, but indoor spaces can also be used. TOD funds may be
17 For example, in 2009, San Francisco Unified School District put out an RFP to study the potential for developing teacher housing on the vacant/underutilized district sites. Currently, the school district in Mill Valley, California is exploring plans for teacher housing through an innovative financing structure and public-private partnership and the Pittsburg Unified School District (California) has an effort with the local Redevelopment Agency and a local community college to provide housing for teachers-in-training. 18 McDonald, Noreen C. 2007. Active Transportation to School Trends Among U.S. Schoolchildren, 1969–2001. American Journal of Preventive Medicine 32(6): 509-516. 19 For more detailed information on joint use, see: 21st Century School Fund and Center for Cities & Schools. 2010. Joint Use of Public Schools: A Framework for a New Social Contact. Washington, DC: 21st Century School Fund; Center for Cities & Schools. 2008. Joint Use School Partnerships in California: Strategies to Enhance Schools and Communities. Berkeley, CA: CC&S. Available at: http://citiesandschools.berkeley.edu/reports/CC&S_PHLP_2008_joint_use.pdf
Putting Schools on the Map 13
available for site improvements to schools looking to leverage joint use opportunities and improve the quality of the spaces for both public and student use. Access to school site spaces for public use is an attractive amenity to families who are considering buying homes in the TOD; a way to build broader public support among childless residents for schools as community assets; and a strategic tool for developers to meet open space requirements for their new developments.
10. TOD offers opportunities for renovating and building new schools in developments, which draws families. The mixed-use nature of TOD combined with the changing educational landscape briefly described above presents new opportunities to incorporate new schools in TOD and attract families. In particular, creating small, charter, magnet, or other specially focused schools are options. Partnering with school districts to create a new school can also leverage additional capital resources. Additionally, building a new school within the TOD presents joint use opportunities specially designed to support the new development. While most people tend to think of schools as stand-alone buildings, this does not necessarily have to be the case; in Portland, Oregon, for example, the public school district is leasing storefront space in a new, mixed-use, affordable housing building.20
20 Carinci, Justin. “School district tests a creative strategy.” Daily Journal of Commerce Oregon, December 1, 2009. Available at: http://djcoregon.com/news/2009/12/01/school-district-tests-a-creative-strategy/
Putting Schools on the Map 14
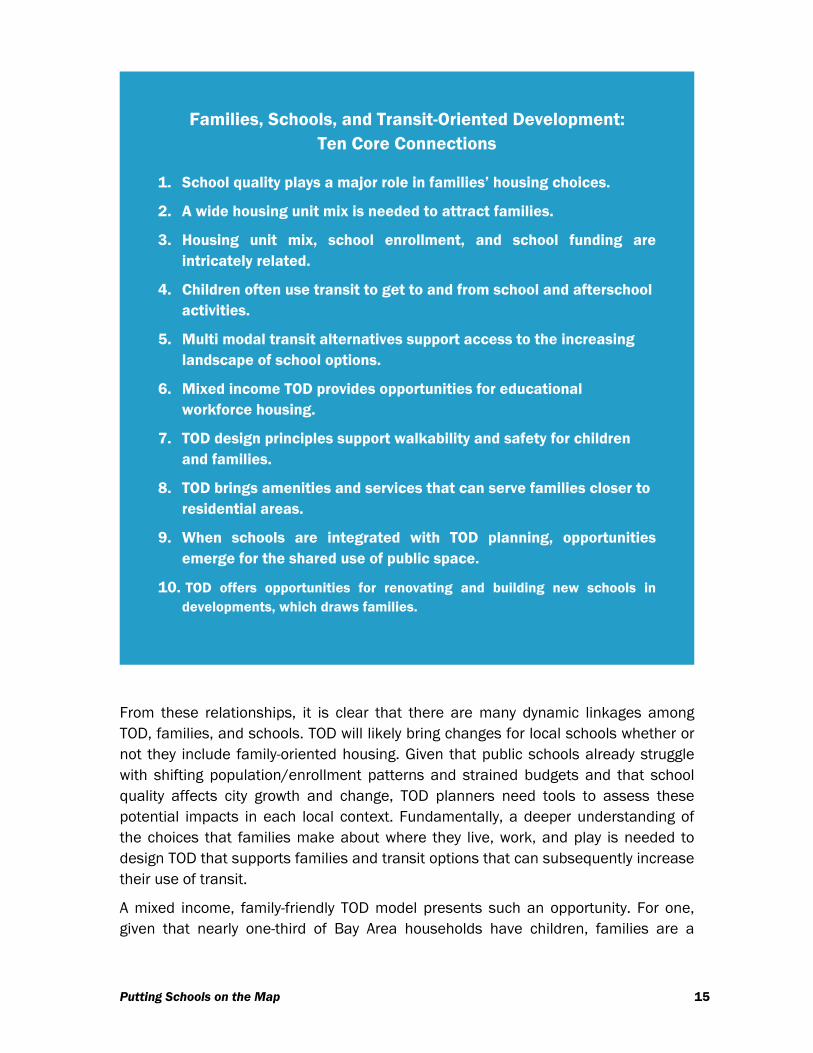
Families, Schools, and Transit-Oriented Development: Ten Core Connections
1. School quality plays a major role in families’ housing choices.
2. A wide housing unit mix is needed to attract families.
3. Housing unit mix, school enrollment, and school funding are intricately related.
4. Children often use transit to get to and from school and afterschool activities.
5. Multi modal transit alternatives support access to the increasing landscape of school options.
6. Mixed income TOD provides opportunities for educational workforce housing.
7. TOD design principles support walkability and safety for children and families.
8. TOD brings amenities and services that can serve families closer to residential areas.
9. When schools are integrated with TOD planning, opportunities emerge for the shared use of public space.
10. TOD offers opportunities for renovating and building new schools in developments, which draws families.
From these relationships, it is clear that there are many dynamic linkages among TOD, families, and schools. TOD will likely bring changes for local schools whether or not they include family-oriented housing. Given that public schools already struggle with shifting population/enrollment patterns and strained budgets and that school quality affects city growth and change, TOD planners need tools to assess these potential impacts in each local context. Fundamentally, a deeper understanding of the choices that families make about where they live, work, and play is needed to design TOD that supports families and transit options that can subsequently increase their use of transit.
A mixed income, family-friendly TOD model presents such an opportunity. For one, given that nearly one-third of Bay Area households have children, families are a
Putting Schools on the Map 15

significant sector of the population to help planners, policy makers, and advocates realize their fundamental goals via infill development and TOD. Additionally, low- and moderate-income households use transit at “more reliable rates than those with high incomes [and] they also stand to benefit the most from the cost savings of TOD.”21 In the Bay Area, approximately 25% of households with children under 18 are also at or below 80% of the area median income.22 Finally, roughly one-fifth of the Bay Area population make trips to and from a public school every single day; school-based trips account for 12% of all regional trips, which significantly contributes to traffic congestion and greenhouse gas emissions.23
Regional officials, local leaders, and smart growth advocates have asserted that family-oriented, mixed income housing is a priority for TOD in the Bay Area. The Ten Core Connections presented in this section uncover how achieving this goal is incumbent on connecting school stakeholders and issues of education. Given that, we turn next to the educational landscape of the Bay Area to illuminate the complex context of schools and school quality.
21 Fostering Equitable and Sustainable Transit-Oriented Development: Briefing Papers for a Convening on Transit-Oriented Development. Convening held by the Center for Transit Oriented Development, Living Cities, and Boston College’s Institute for Responsible Investment at the Ford Foundation. February 24-25, 2009, p. 8. Available at: http://www.livingcities.org/leadership/trends/transit/ 22 Bay Area Census. MTC/ABAG. Available at: http://www.bayareacensus.ca.gov/bayarea.htm; Percentage of households with children under 18, living at or below 80% Area Median Income calculated by the California Census Research Data Center at UC Berkeley, based on American Community Survey 2008 data. See Appendix 2 for spreadsheet calculations/crosstab. 23 San Francisco Bay Area Travel Survey 2000 Regional Travel Characteristics Report, Volume I. August 2004. Metropolitan Transportation Commission. Available at: http://www.mtc.ca.gov/maps_and_data/datamart/survey/
Putting Schools on the Map 16
III. The Educational Context of the San Francisco Bay Area
To appropriately understand the nature of how TOD impacts and/or are impacted by schools – and how to best leverage TOD to support families and schools – a more nuanced understanding of local and regional educational contexts is needed. Below we describe five important dimensions necessary to understand the complex realities facing public education in California and the Bay Area today.
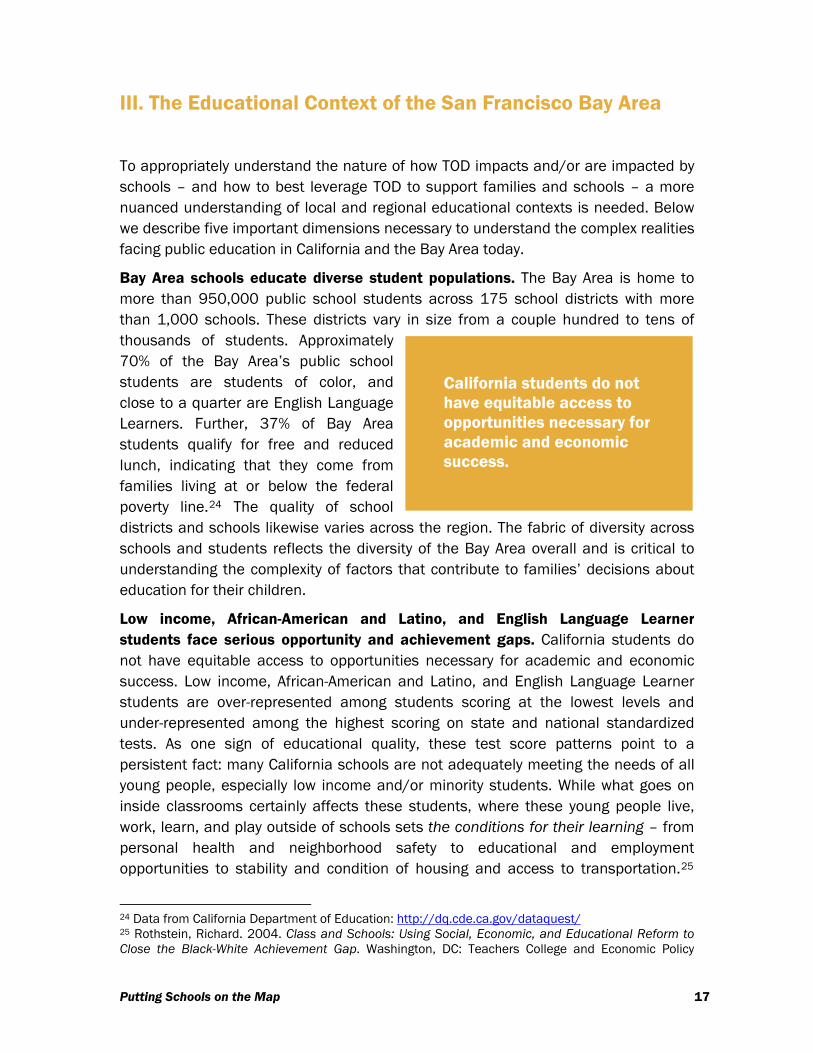
Bay Area schools educate diverse student populations. The Bay Area is home to more than 950,000 public school students across 175 school districts with more than 1,000 schools. These districts vary in size from a couple hundred to tens of thousands of students. Approximately 70% of the Bay Area’s public school students are students of color, and close to a quarter are English Language Learners. Further, 37% of Bay Area students qualify for free and reduced lunch, indicating that they come from families living at or below the federal poverty line.24 The quality of school districts and schools likewise varies across the region. The fabric of diversity across schools and students reflects the diversity of the Bay Area overall and is critical to understanding the complexity of factors that contribute to families’ decisions about education for their children.
California students do not have equitable access to opportunities necessary for academic and economic success.
Low income, African-American and Latino, and English Language Learner students face serious opportunity and achievement gaps. California students do not have equitable access to opportunities necessary for academic and economic success. Low income, African-American and Latino, and English Language Learner students are over-represented among students scoring at the lowest levels and under-represented among the highest scoring on state and national standardized tests. As one sign of educational quality, these test score patterns point to a persistent fact: many California schools are not adequately meeting the needs of all young people, especially low income and/or minority students. While what goes on inside classrooms certainly affects these students, where these young people live, work, learn, and play outside of schools sets the conditions for their learning – from personal health and neighborhood safety to educational and employment opportunities to stability and condition of housing and access to transportation.25
24 Data from California Department of Education: http://dq.cde.ca.gov/dataquest/ 25 Rothstein, Richard. 2004. Class and Schools: Using Social, Economic, and Educational Reform to Close the Black-White Achievement Gap. Washington, DC: Teachers College and Economic Policy
Putting Schools on the Map 17

These important “non-school” factors impact a child’s ability to succeed (or not) in school. Mixed income housing and increased transportation access for students have both been touted as useful strategies for countering obstacles to opportunity and advances in achievement.26
California education finance is state-controlled, silo-ed, and complex. Education funding in California involves a complex system of state-controlled financing generated from sales and income tax, a much less reliable funding source than local property taxes. As such, state education budget cuts are commonplace when the economy is down and districts nearly always operate in a more reactive, crisis management frame of mind rather than with proactive, long-term planning. Adequate funding is a persistent challenge for California’s public schools, both for programming and capital expenses. In general, education funding falls into two large, discrete, and rarely aligned categories:
1. The Program/Operating budget is called the General Education Fund and covers teachers, administration, books, general maintenance/janitorial, and any other educational programming. About 70% of a district’s Program/Operating budget is calculated by Average Daily Attendance (ADA), which is a school district’s aggregate attendance divided by the number of school days in session. Districts receive about 30% of their budget in categorical funds from the state and federal government for specific initiatives and programs, such as Title I, after-school programming, and small class size efforts.
2. Capital funding pays for new construction, modernization/renovation, and additions to school buildings and grounds. A district’s capital budget comes primarily from local sources, usually with significant contribution from state school construction and modernization funds. In general, state capital funds match local dollars; districts must raise the match locally in order to access state dollars. Both state and local moneys come primarily from general obligation (GO) bonds that are approved by voters. Local districts also collect developer fees for new development in their jurisdiction to help mitigate any increase in students that new development may generate.27 Since 1998, Californian’s have approved about $82 billion in school facilities GO bonds, $35 billion of which were statewide bonds.
Institute; Noguera, Pedro. 2003. City Schools and the American Dream: Reclaiming the Promise of Public Education. New York: Teachers College. 26 McKoy, Deborah L. and Jeffrey M. Vincent. 2008. Housing and Education: The Inextricable Link. In Segregation: The Rising Costs for America. Edited by James H. Carr and Nandinee K. Kutty. New York: Routledge. 27 California law permits three different levels of development fees to be assessed, based on the characteristics of the local school district. For information, see: Gorson, Maureen F., Kevin Wilkeson, G. Christian Roux, Thomas M. Cavanagh, and Dennis L. Dunston. 2006. California School Facilities Planning. Point Arena, CA: Solano Press Books.
Putting Schools on the Map 18

Schools are community assets. Schools are often centers of community activity, from parent involvement in schools to hosting sports leagues to voting on Election Day. Neighborhood residents often view even underperforming schools as community assets, considering schools one of the safest places for young people to play and meet. In California, public schools are one of the most prevalent, personal, locally governed, and highly funded public resources located in neighborhoods throughout the state. These public schools are public infrastructure: they are educational infrastructure (educating California’s 6 million students); social infrastructure (community event hosts); and physical infrastructure (California’s nearly 1,000 school districts operate more than 8,200 K-12 schools on an estimated 125,000 acres of land).28
School districts are separate from city/county governments and urban planning processes. California school districts are independent, autonomous local government entities that have their own set of state policies and regulations to follow. School district autonomy historically was intended to disentangle schools from the strains of local politics and to ensure that educational needs drive decision making. California school infrastructure planning is disconnected from other planning—governance, finance, and policymaking—in three important ways:29
1. School district geographic boundaries rarely match the boundaries of other local planning entities. A school district might lie within several cities, for example, or encompass both incorporated and unincorporated areas. Likewise, one city may have multiple school districts within its jurisdiction.
Years of parallel work have led to separate practices, language, and at worst, deep distrust between school districts and other local governments.
2. The constraints of school finance combined with exorbitant land costs in California often result in school location and design decisions that are aligned with neither educational needs nor urban development goals, but instead are driven by land costs or developer exactions. Schools ultimately must base many facility design and location decisions on funding availability, and in many areas, the district must look outside of developed areas to find affordable land. In other
28 Vincent, Jeffrey M. “School Construction Policies to Support Sustainable Communities: California's Golden Opportunity.” Testimony at the Joint Informational Hearing for the California Senate Committee on Housing and Transportation and the Senate Select Committee on State School Facilities: "Schools as Centers of Sustainable Communities: A Vision for Future School Facility Construction," December 15, 2009; Vincent, Jeffrey. 2006. Public Schools as Public Infrastructure: Roles for Planning Researchers. Journal of Planning and Education Research, 25 (4): 433-437. 29 McKoy, Deborah L., Jeffrey M. Vincent, and Carrie Makarewicz. 2008. Integrating Infrastructure Planning: The Role of Schools. ACCESS. 33(4): 18-26.
Putting Schools on the Map 19

cases, developers, not districts, choose new school sites. Developers’ donations of land, which may be required as part of the development approval process, save schools the cost of securing new sites themselves, but these parcels may not be the most optimal for the school, district, city or region, and may not support broader transportation, land use, environmental, or even educational goals.
3. No formal policy apparatus exists at the local, regional, or state levels that requires or incentivizes school districts and other local governments to work together to plan school infrastructure as part of larger urban development or redevelopment. In rare cases, local agencies have built relationships.
As a result of these conditions, most school infrastructure planning is still done largely in isolation, where opportunities for efficiencies and coordinated investments are missing. Some progress at the state level has been made in connecting school and local planning. For example, California’s School Facility Program (SFP) funds the construction of joint use school facilities through local agency partnerships. Likewise the SFP is working to align their policies and regulations with broader goals of sustainability on issues of school siting and design.30 Still, most municipalities and school districts develop their general or operating plans separately from one another. Even their time horizons are different: school districts usually create five- to ten-year capital plans, while cities’ general plans tend to cover at least twenty years into the future.
Years of parallel and independent work have led to separate practices, language, and, at worst, deep distrust between school districts and other local governments. While planners and elected officials recognize the importance of public education in the vitality of their cities, the budget and policy constraints that districts face, combined with the complexity of getting infill development and/or TOD off the ground often means that schools are left on the periphery in these planning processes.
30 Center for Cities & School. 2009. Re-Visioning School Facility Planning and Design for the 21st Century: Creating Optimal Learning Environments. Report from Roundtable hosted by the California Department of Education School Facilities Planning Division and facilitated by Center for Cities & Schools. Available at: http://www.cde.ca.gov/ls/fa/sf/documents/roundtablereport.pdf
Putting Schools on the Map 20

IV. Case Studies: TOD, Family, and School Linkages in the Bay Area
Next, we present five case studies of Bay Area TOD planning processes that explore the linkages between TOD, families, and schools. These TOD planning processes are funded by the Metropolitan Transportation Commission’s (MTC) Station Area Planning grants.31 These cases were selected because they illustrate a range of issues, contexts, and opportunities for connecting TOD and public schools, and represent different phases of the development timeline. These case studies come from Alameda, Contra Costa, Sonoma, and Santa Clara Counties in the Bay Area.
31 The Metropolitan Transportation Commission’s Transit-Oriented Development Policy outlines that “future transit extensions in the Bay Area must be matched by supportive local land use plans and policies. To assist cities in meeting these goals, MTC has launched a Station Area Planning grant program to fund city-sponsored planning efforts for the areas around future stations. These station-area plans are intended to address the range of transit-supportive features that are necessary to support high levels of transit ridership.” http://www.mtc.ca.gov/planning/smart_growth/
Putting Schools on the Map 21
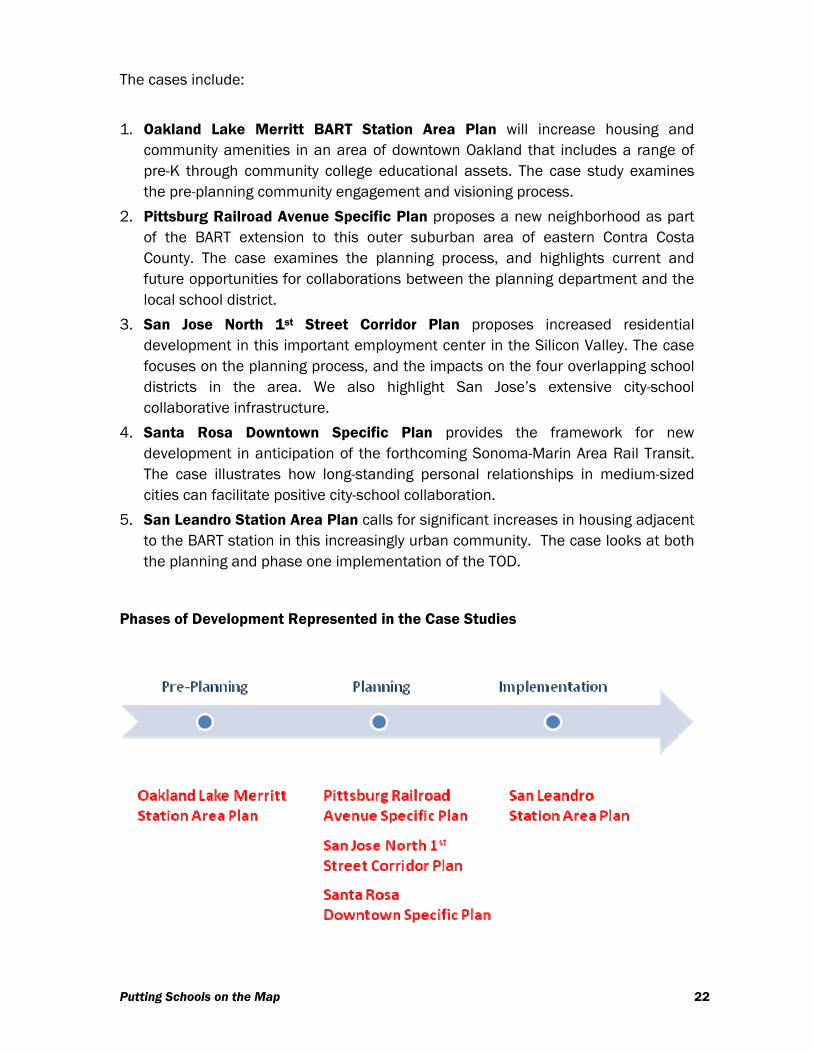
The cases include:
1. Oakland Lake Merritt BART Station Area Plan will increase housing and
community amenities in an area of downtown Oakland that includes a range of pre-K through community college educational assets. The case study examines the pre-planning community engagement and visioning process.
2. Pittsburg Railroad Avenue Specific Plan proposes a new neighborhood as part of the BART extension to this outer suburban area of eastern Contra Costa County. The case examines the planning process, and highlights current and future opportunities for collaborations between the planning department and the local school district.
3. San Jose North 1st Street Corridor Plan proposes increased residential development in this important employment center in the Silicon Valley. The case focuses on the planning process, and the impacts on the four overlapping school districts in the area. We also highlight San Jose’s extensive city-school collaborative infrastructure.
4. Santa Rosa Downtown Specific Plan provides the framework for new development in anticipation of the forthcoming Sonoma-Marin Area Rail Transit. The case illustrates how long-standing personal relationships in medium-sized cities can facilitate positive city-school collaboration.
5. San Leandro Station Area Plan calls for significant increases in housing adjacent to the BART station in this increasingly urban community. The case looks at both the planning and phase one implementation of the TOD.
Phases of Development Represented in the Case Studies
Putting Schools on the Map 22

Oakland Lake Merritt BART Station Area Plan
Overview of Local TOD
Oakland’s Lake Merritt BART Station is located adjacent to Chinatown and Laney College, just south of downtown. Because of the history of development encroachment in the area, Chinatown residents are well aware and concerned about the impacts of any proposals for future development.
As of writing, the Lake Merritt Station Area Plan is in the early stages or pre-planning phase of development; to support effective resident participation in the planning processes, in early 2009 the Association of Bay Area Governments, through its Development without Displacement grant program, funded a community engagement process in advance of the City of Oakland’s formal planning efforts. The area benefits from a robust network of public health providers, community service organizations, and a vibrant recreation center with programming for residents of all ages. These pre-planning efforts aimed to educate residents and community partners about TOD and train them to be empowered planning participants.
Completed by more than 1,100 residents, a Community Needs Assessment Survey revealed priorities. Diminishing open space resources over the past decades mean that parks and other open space are highly valued amenities for the community. Three key priorities will serve as guiding principles for the upcoming planning process:
1. Improved public safety (addressing street crime and traffic);
2. Creation of more jobs (specifically living wage jobs, ideally in "green" industry);
Putting Schools on the Map 23
3. More affordable housing (especially for seniors).32
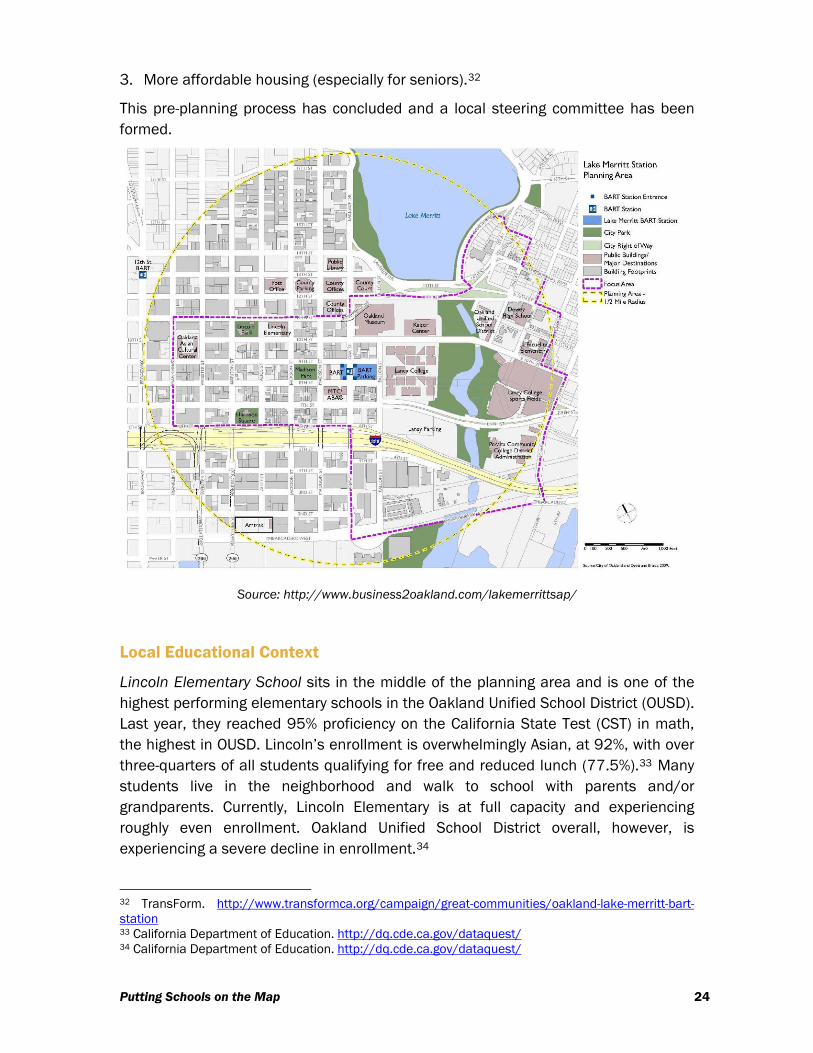
This pre-planning process has concluded and a local steering committee has been formed.
Source: http://www.business2oakland.com/lakemerrittsap/
Local Educational Context
Lincoln Elementary School sits in the middle of the planning area and is one of the highest performing elementary schools in the Oakland Unified School District (OUSD). Last year, they reached 95% proficiency on the California State Test (CST) in math, the highest in OUSD. Lincoln’s enrollment is overwhelmingly Asian, at 92%, with over three-quarters of all students qualifying for free and reduced lunch (77.5%).33 Many students live in the neighborhood and walk to school with parents and/or grandparents. Currently, Lincoln Elementary is at full capacity and experiencing roughly even enrollment. Oakland Unified School District overall, however, is experiencing a severe decline in enrollment.34
32 TransForm. http://www.transformca.org/campaign/great-communities/oakland-lake-merritt-bart-station 33 California Department of Education. http://dq.cde.ca.gov/dataquest/ 34 California Department of Education. http://dq.cde.ca.gov/dataquest/
Putting Schools on the Map 24
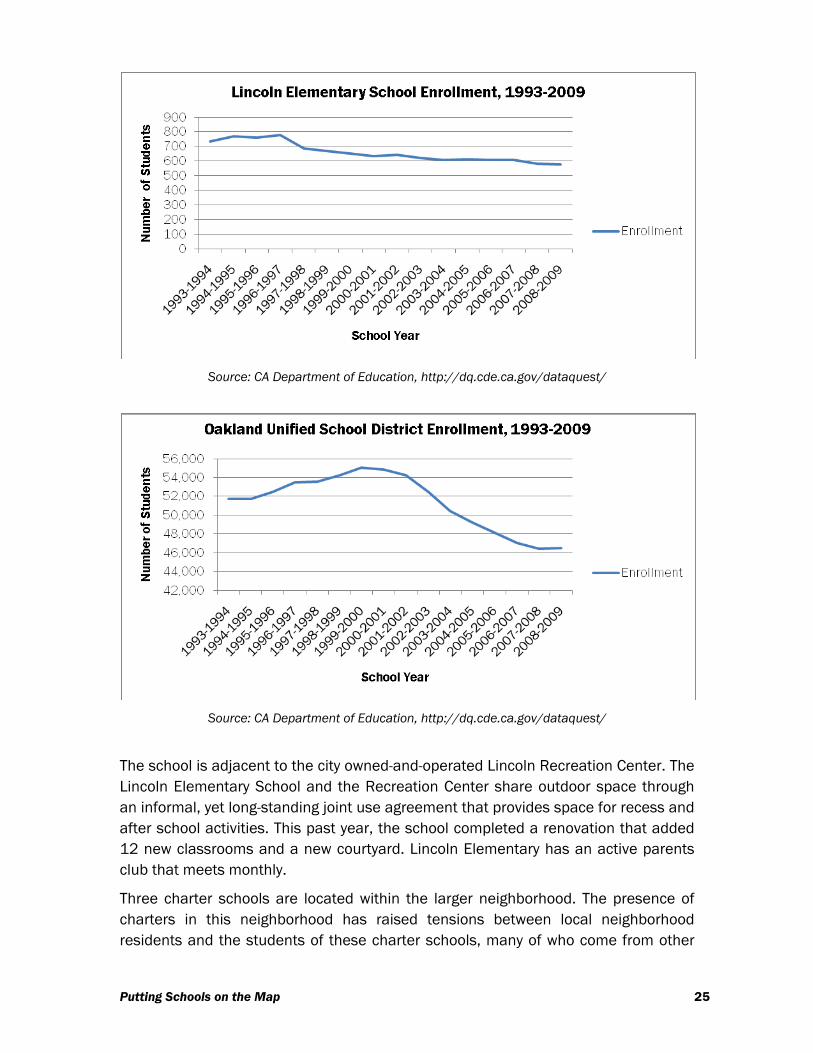
Source: CA Department of Education, http://dq.cde.ca.gov/dataquest/
Source: CA Department of Education, http://dq.cde.ca.gov/dataquest/
The school is adjacent to the city owned-and-operated Lincoln Recreation Center. The Lincoln Elementary School and the Recreation Center share outdoor space through an informal, yet long-standing joint use agreement that provides space for recess and after school activities. This past year, the school completed a renovation that added 12 new classrooms and a new courtyard. Lincoln Elementary has an active parents club that meets monthly.
Three charter schools are located within the larger neighborhood. The presence of charters in this neighborhood has raised tensions between local neighborhood residents and the students of these charter schools, many of who come from other
Putting Schools on the Map 25
neighborhoods. Some stakeholders feel that the charters located in the neighborhood, in part, to draw high-achieving students from Lincoln Elementary to their rolls.
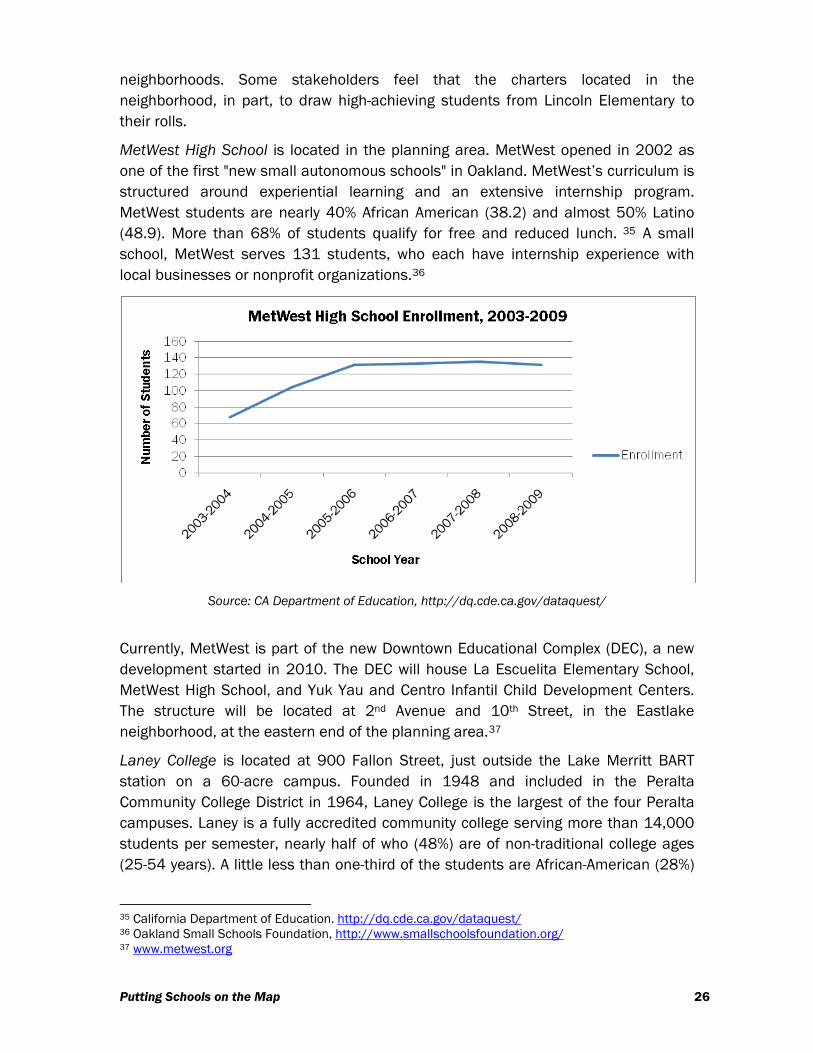
MetWest High School is located in the planning area. MetWest opened in 2002 as one of the first "new small autonomous schools" in Oakland. MetWest’s curriculum is structured around experiential learning and an extensive internship program. MetWest students are nearly 40% African American (38.2) and almost 50% Latino (48.9). More than 68% of students qualify for free and reduced lunch. 35 A small school, MetWest serves 131 students, who each have internship experience with local businesses or nonprofit organizations.36
Source: CA Department of Education, http://dq.cde.ca.gov/dataquest/
Currently, MetWest is part of the new Downtown Educational Complex (DEC), a new development started in 2010. The DEC will house La Escuelita Elementary School, MetWest High School, and Yuk Yau and Centro Infantil Child Development Centers. The structure will be located at 2nd Avenue and 10th Street, in the Eastlake neighborhood, at the eastern end of the planning area.37
Laney College is located at 900 Fallon Street, just outside the Lake Merritt BART station on a 60-acre campus. Founded in 1948 and included in the Peralta Community College District in 1964, Laney College is the largest of the four Peralta campuses. Laney is a fully accredited community college serving more than 14,000 students per semester, nearly half of who (48%) are of non-traditional college ages (25-54 years). A little less than one-third of the students are African-American (28%)
35 California Department of Education. http://dq.cde.ca.gov/dataquest/ 36 Oakland Small Schools Foundation, http://www.smallschoolsfoundation.org/ 37 www.metwest.org
Putting Schools on the Map 26
and just more than one-third (32%) are Asian/Pacific Islanders. Laney offers 44 Associate of Arts and Science Degrees and 35 Certificate Programs. Laney also partners with Oakland Unified School District on the Gateway to College program, where high school students can take community college classes as part of their course work.38
Key Issues
Demographic Shifts, Student Generation, and School Impacts
Lincoln Elementary School’s enrollment homogeneity is a concern among some local residents; one community representative and parent commented that the students at Lincoln may be at a disadvantage because when they move on to middle school they enter schools with a much more diverse – geographic, racial, ethnic, and socio economic – student body.39 Parents and community members appreciate that TOD may attract multiracial and ethnically diverse families to the community. At the same time, parents also raise concerns about increasing diversity and harming the school’s high performance. A primary concern raised by local stakeholders is increased school enrollment as a result of new development.
The development of the Lake Merritt BART Station Area and the educational resources in the neighborhood converge for tremendous benefit for the community. First, because of the density of educational resources, both current and expected with the new DEC, that serve all ages from pre-K through community college, this area should be attractive to a diverse set of families, if TOD plans consider those target markets. Second, the TOD could in turn benefit both pre-K–12 and the community college, assuming that they are involved in the development conversation and can plan for the changes in both numbers and demographics. Finally, new housing in the Lake Merritt BART station area would not only serve existing and new families, but also attract faculty, students, and staff from the local K-12 schools, the community college, and the OUSD offices, also located near the DEC.
Open Space and Joint Use Opportunities
Open space for all ages is another top concern for the community, especially considering the current constraints on the Lincoln Recreation Center and the prospect of population increases. The current joint use of the Recreation Center lays a strong foundation for future joint use opportunities of both the school space and any new open space or community spaces that the TOD may bring. The new multiuse DEC and the Laney College campus should be seen as resources and areas to leverage the density of physical public resources in the area.
38 Laney College. http://elaney.org/wp/president/files/2010/02/FactSheet2010final.pdf 39 Gilbert Gong, personal interview, April 15, 2009.
Putting Schools on the Map 27
Transportation Access
At Lincoln Elementary, parents and school leaders also noted that currently many students walk to school, often with grandparents. To continue this pattern, locals place high priority on maintaining and enhancing pedestrian infrastructure. Further, MetWest and the charter schools in the neighborhood serve students from across the city, requiring a reliable, affordable, and safe transit system. MetWest’s robust internship program relies on students’ ability to navigate transit during the school day. Finally, Laney College serves students from across the East Bay. With increased housing and population, managing traffic congestion and enhancing transit, bicycle, and pedestrian infrastructure are key priorities for TOD that supports the educational infrastructure of the neighborhood.
Community and Parent Engagement
The pre-planning process strengthened the capacity of community stakeholders. Now, the community is empowered and educated to participate in the formal planning process for the Lake Merritt BART station TOD. With so many institutional and community stakeholders, the city of Oakland has an enormous opportunity to leverage the support, knowledge, and insight of residents, students, parents, and teachers across the pre-K through community college spectrum as they launch their Lake Merritt BART Station Area planning process.
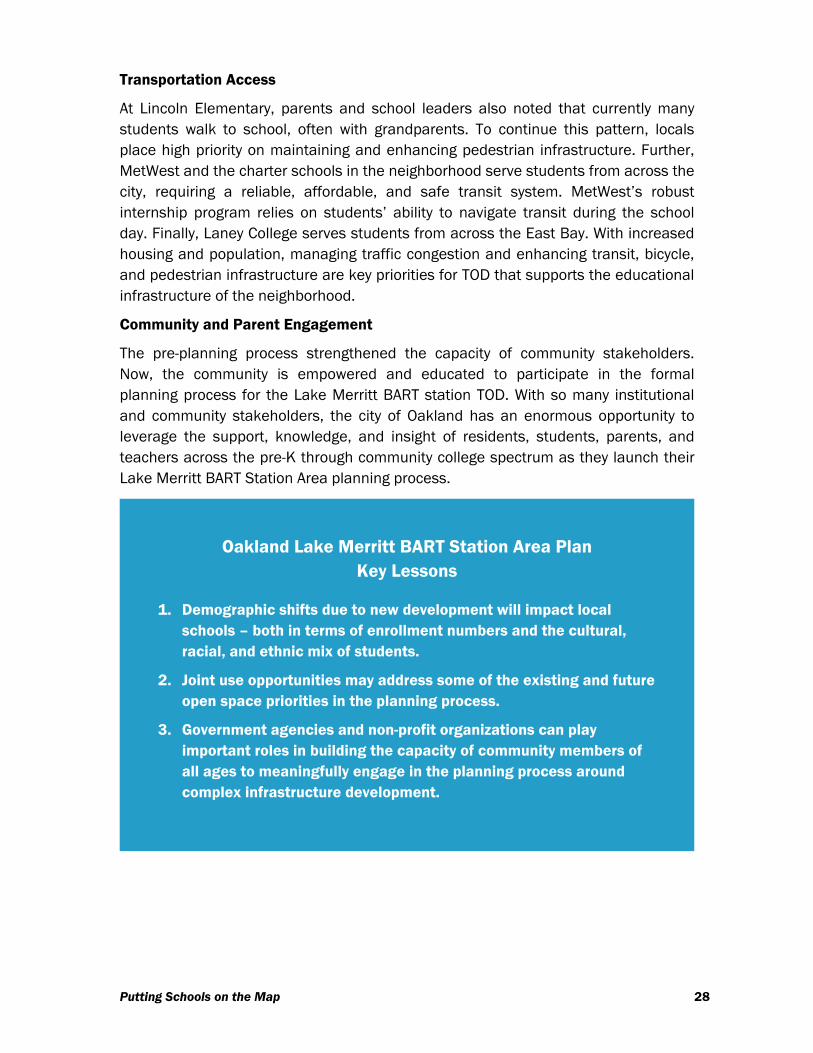
Oakland Lake Merritt BART Station Area Plan Key Lessons
1. Demographic shifts due to new development will impact local schools – both in terms of enrollment numbers and the cultural, racial, and ethnic mix of students.
2. Joint use opportunities may address some of the existing and future open space priorities in the planning process.
3. Government agencies and non-profit organizations can play important roles in building the capacity of community members of all ages to meaningfully engage in the planning process around complex infrastructure development.
Putting Schools on the Map 28
Pittsburg Railroad Avenue Specific Plan
Overview of Local TOD
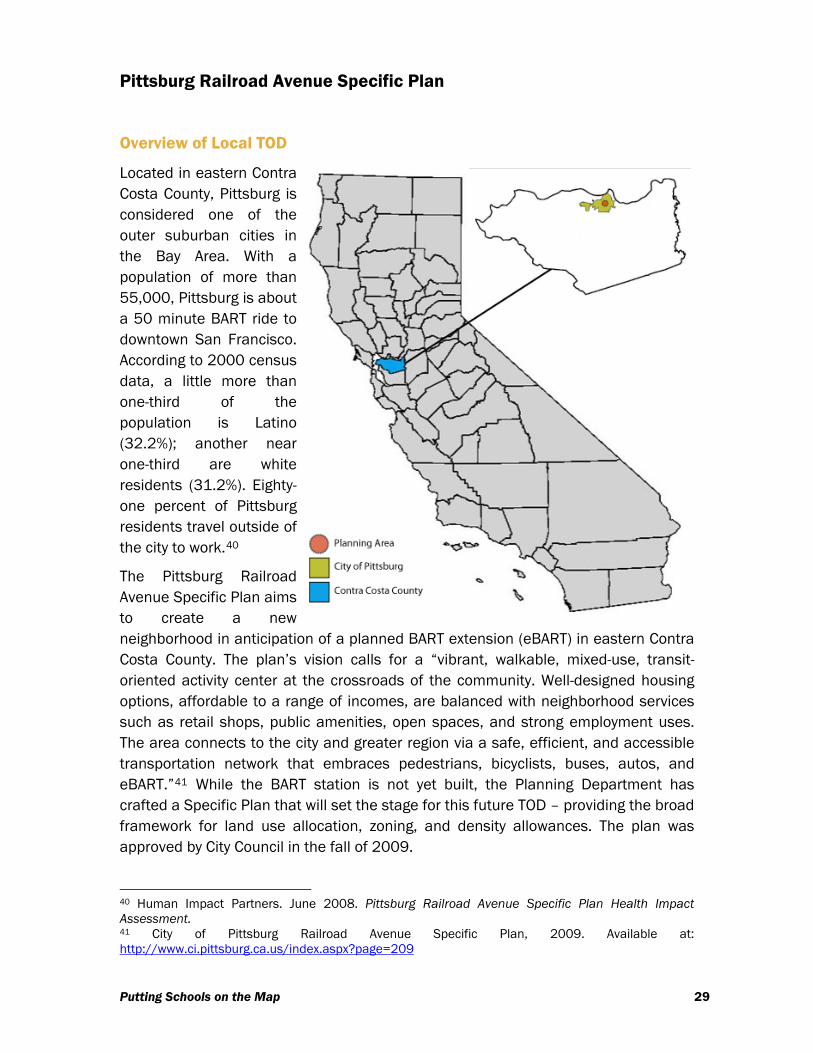
Located in eastern Contra Costa County, Pittsburg is considered one of the outer suburban cities in the Bay Area. With a population of more than 55,000, Pittsburg is about a 50 minute BART ride to downtown San Francisco. According to 2000 census data, a little more than one-third of the population is Latino (32.2%); another near one-third are white residents (31.2%). Eighty-one percent of Pittsburg residents travel outside of the city to work.40
The Pittsburg Railroad Avenue Specific Plan aims to create a new neighborhood in anticipation of a planned BART extension (eBART) in eastern Contra Costa County. The plan’s vision calls for a “vibrant, walkable, mixed-use, transit-oriented activity center at the crossroads of the community. Well-designed housing options, affordable to a range of incomes, are balanced with neighborhood services such as retail shops, public amenities, open spaces, and strong employment uses. The area connects to the city and greater region via a safe, efficient, and accessible transportation network that embraces pedestrians, bicyclists, buses, autos, and eBART.”41 While the BART station is not yet built, the Planning Department has crafted a Specific Plan that will set the stage for this future TOD – providing the broad framework for land use allocation, zoning, and density allowances. The plan was approved by City Council in the fall of 2009.
40 Human Impact Partners. June 2008. Pittsburg Railroad Avenue Specific Plan Health Impact Assessment. 41 City of Pittsburg Railroad Avenue Specific Plan, 2009. Available at: http://www.ci.pittsburg.ca.us/index.aspx?page=209
Putting Schools on the Map 29
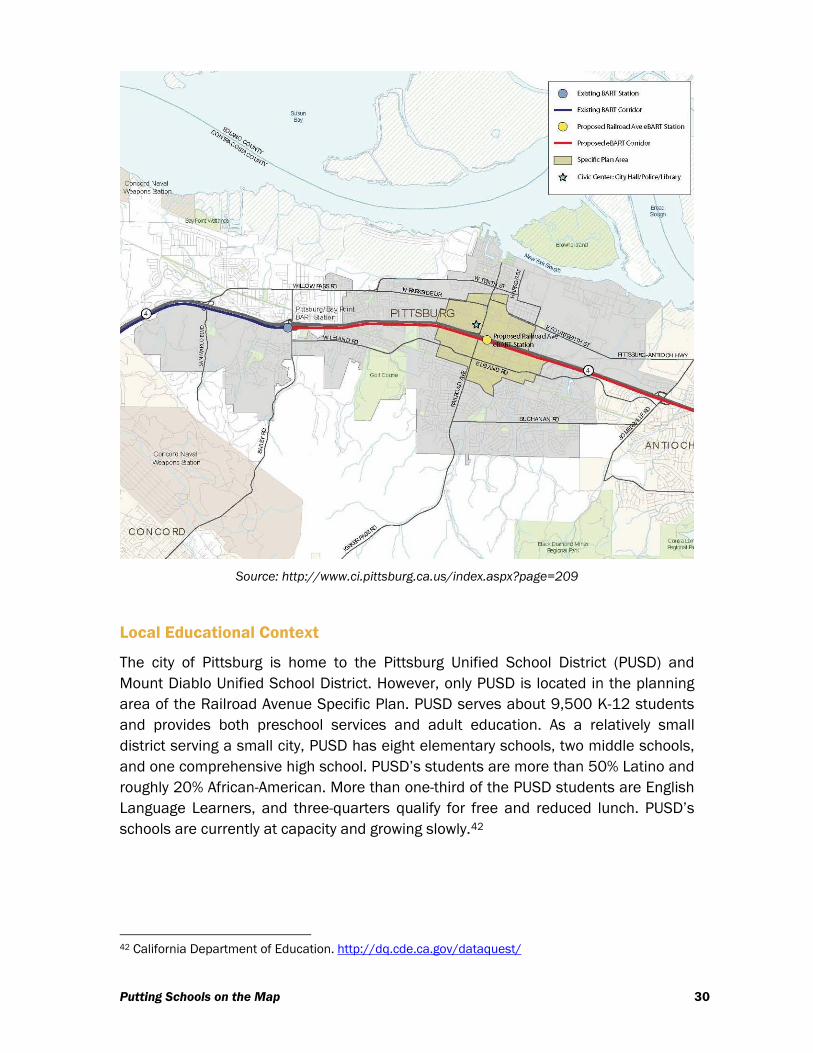
Source: http://www.ci.pittsburg.ca.us/index.aspx?page=209
Local Educational Context
The city of Pittsburg is home to the Pittsburg Unified School District (PUSD) and Mount Diablo Unified School District. However, only PUSD is located in the planning area of the Railroad Avenue Specific Plan. PUSD serves about 9,500 K-12 students and provides both preschool services and adult education. As a relatively small district serving a small city, PUSD has eight elementary schools, two middle schools, and one comprehensive high school. PUSD’s students are more than 50% Latino and roughly 20% African-American. More than one-third of the PUSD students are English Language Learners, and three-quarters qualify for free and reduced lunch. PUSD’s schools are currently at capacity and growing slowly.42
42 California Department of Education. http://dq.cde.ca.gov/dataquest/
Putting Schools on the Map 30

Source: CA Department of Education, http://dq.cde.ca.gov/dataquest/
Key Issues
Student Generation and School Impacts
Because of the current enrollment in Pittsburg schools, PUSD estimates that the new housing would necessitate the construction of new elementary and middle schools. In response to the Railroad Avenue Specific Plan, PUSD submitted a memorandum to the city outlining concerns about student generation and emphasizing the need for the project’s Environmental Impact Review (EIR) to consider the potential impact on schools. The district also suggested that the development provide an opportunity for a developer to build a new school.
Open Space, Joint Use, and Asset Management Opportunities
The city and district have a range of joint use agreements for park space and facilities. Most recently, in 2008, Marina Vista Elementary School opened in downtown Pittsburg, and is home to an underground garage and large playfields. These new facilities were made possible in part by a $5 million contribution from the city and the Redevelopment Agency; they are part of a joint use agreement for city access to the facilities on evenings and weekends. Because the local high school is located near the city's Civic Center, the site appears to have good opportunities for co-location of school buildings and civic spaces. This could mean leveraging school and city open space, facilitating internship opportunities in city government, or co-developing new multi-use buildings, as development rolls out. Currently, the school district is also considering how to handle its surplus land in areas outside of the Specific Plan area; certainly the city’s plans could have a significant impact on PUSD decision making.
The Specific Plan includes specific policies related to the joint use of school facilities
Putting Schools on the Map 31
and priorities of students and families. For example, the plan calls for future development that provides “services and amenities that meet the needs of transit riders, local residents, employees, students, and visitors such as childcare, education, and job skills services…in close proximity to the eBART station [emphasis added].”43 Further, the plan identifies key goals around community resources that emphasize the needs of youth: “Design and install facilities specifically oriented towards meeting the needs of area youth.”44 The plan’s community resource policies also focus on the needs of young people, families, and school stakeholders, including:
• SP5-P-1.1 Integrate high quality public facilities – such as public meeting places, a teen center, and an upgraded library – into the area that support the needs of visitors, workers, students, and residents.
• SP5-P-1.3 Encourage the development of day care and childcare centers as part of new development.
• SP5-P-2.1 Work with the Pittsburg Unified School District to identify opportunities for joint facility use and cooperative facility planning.
o Coordinate with Pittsburg Unified School District to use fields and other school facilities at Parkside Elementary School, Los Medanos Elementary School, and Pittsburg High School as amenities available to the entire community during school off-hours. 45
Existing City-School Collaboration
The City Planning department conducted an extensive community process, reaching out to businesses, residents, community institutions, and the school district. In addition to presentations, many meetings were educational outreach activities to build the knowledge and capacity of the community participants. District attendance was thin at most meetings, although a representative did attend the EIR scoping meeting, and his feedback was captured in the final document. Unfortunately, one of the early Specific Plan public meetings inadvertently was scheduled on the same evening as the school board meeting, preventing many school stakeholders from participating. Despite the city’s tremendous outreach efforts, some school stakeholders felt that this scheduling conflict implied that the city does not “really care what the district thinks” about this process.46
Staff level collaboration between the city and PUSD appears relatively strong, even though stakeholders noted a culture of distrust between the elected officials on the City Council and the Board of Education. The city manager and superintendent
43 City of Pittsburg Railroad Avenue Specific Plan. 2009. p.43. Available at: http://www.ci.pittsburg.ca.us/index.aspx?page=209 44 Ibid, p.104 45 Ibid, pp.106-108 46 Superintendent Barbara Wilson, telephone interview, August 25, 2009.
Putting Schools on the Map 32
regularly communicate on specific projects. Fortunately, each elected body has strong trust in its administrative leaders, giving the city manager and the superintendent the leeway to coordinate together as they see fit. The city and PUSD also collaborate through a liaison committee on major projects.
Early in her tenure, PUSD Superintendent Wilson negotiated a land swap with the city so that a new county courthouse could be built. Wilson recognized that the community needs were broader than the more narrow school needs and that the district could benefit from contributing to the community process. More recently, PUSD has been leading a collaborative effort with Los Medanos College, California State College East Bay, and the Redevelopment Agency to build a teacher living-learning community. This special housing community would be open to residents of Pittsburg and specifically target working class individuals who have not earned a post-secondary degree but who are interested in becoming public school teachers. The plan envisions family-oriented units striving for a ten-year resident tenure. The project would provide affordable housing and a residential support community for teachers-in-training. The vision for the project was born from knowing the culture of many local residents; for instance, city leaders learned that women in many of the local families are discouraged from leaving town to go to school. Developing the teacher living-learning community is a way to support young women who want to continue their education and meet a local economic need for more teachers while honoring their family structure and staying close to home.
Other recent successes, in addition to the new Marina Vista Elementary School, playfields, and underground garage mentioned above, include formalizing a Facilities Joint Use Agreement, securing hundreds of thousands of dollars from the city for a school park rehabilitation, and receiving $200,000 matching city funds for seat rehabilitation at the high school’s creative arts building.
Superintendent Wilson emphasized that in many ways, the local staff level collaboration has been key to these successes. She and the city manager are empowered to brainstorm and plan together in a “safe space” where politics do not interfere. Then, they can bring well-formed drafts of projects to their elected bodies and the public. Unfortunately, due to time constraints and demands of other projects, the Specific Plan planning process had not been a focus of collaboration between the superintendent and city manager, and many of the goals and policies featured in the final Specific Plan were included at the impetus of planning staff and community advocacy groups.
Over the course of the Specific Plan planning process in 2009, city staff identified a school district point person to participate in the process and address questions of student generation, impacts on the district, and other infrastructure concerns. Unfortunately, near the end of the school year in 2009, this PUSD staff person left the district and no alternative staff was identified to carry on the work with the city. Without transfer of information and a breakdown in communication, the City
Putting Schools on the Map 33

Council’s initial vote for plan approval was delayed at the request of PUSD stakeholders. Ultimately, the City Council adopted the Specific Plan in the fall of 2009.
The communication breakdown (and project delay) that occurred because of a staff change is symptomatic of the idiosyncratic nature of city-school collaboration in many localities. In Pittsburg, the superintendent recognized that no reliable venue for real information exchange and/or input on planning processes exists. She suggested establishing a staff subcommittee to look specifically at issues of education, impacts on the school, and opportunities to leverage city and district activities. This type of administrative infrastructure may prove increasingly important, as superintendent Wilson has announced her retirement at the end of this 2009-2010 school year.
Pittsburg Railroad Avenue Specific Plan Key Lessons
1. Strong staff relationships can promote and implement city-school collaborations, even in the absence of trust among elected leadership.
2. Formal lines of communication are critical for maintaining continuity amidst personnel changes and ongoing school district participation.
3. Despite successful and large-scale joint use agreements, school districts may still encounter barriers to proactive engagement in planning processes.
Putting Schools on the Map 34

San Jose North 1st Street Corridor Plan
Overview of Local TOD
The North 1st Street corridor of San Jose encompasses a 4,500-acre area, an important employment center and home to many of the city’s high technology companies. In June 2005, the San Jose City Council approved the North San Jose Area Development Policy, which guides ongoing growth and development in the North 1st Street area. The policy provides for 83,000 new jobs in this area and the conversion of industrial use zones to high-density residential ones. Some 32,000 new residential units are currently programmed for the area; they will be completed in four phases of 8,000 units each. The entire corridor presents an opportunity for TOD because of the 11 light rail stops along North 1st Street. The vision for North San Jose is comprehensive and includes:
• a world-class network of parks and trails that connect to the natural rivers and creeks,
• schools that nurture students and prepare them to lead in the future,
• vibrant, interesting, and creative places to gather, shop, and meet,
• opportunities to work outside the confines of an office or commute to the office next door on your bicycle,
• creative businesses that redefine our daily life with new products and services that we haven’t even dreamed of, and
• neighborhoods that residents are proud to call home.47
47 http://www.sjredevelopment.org/PublicationsPlans/NorthSanJoseNeighborhoodsPlan1109.pdf
Putting Schools on the Map 35
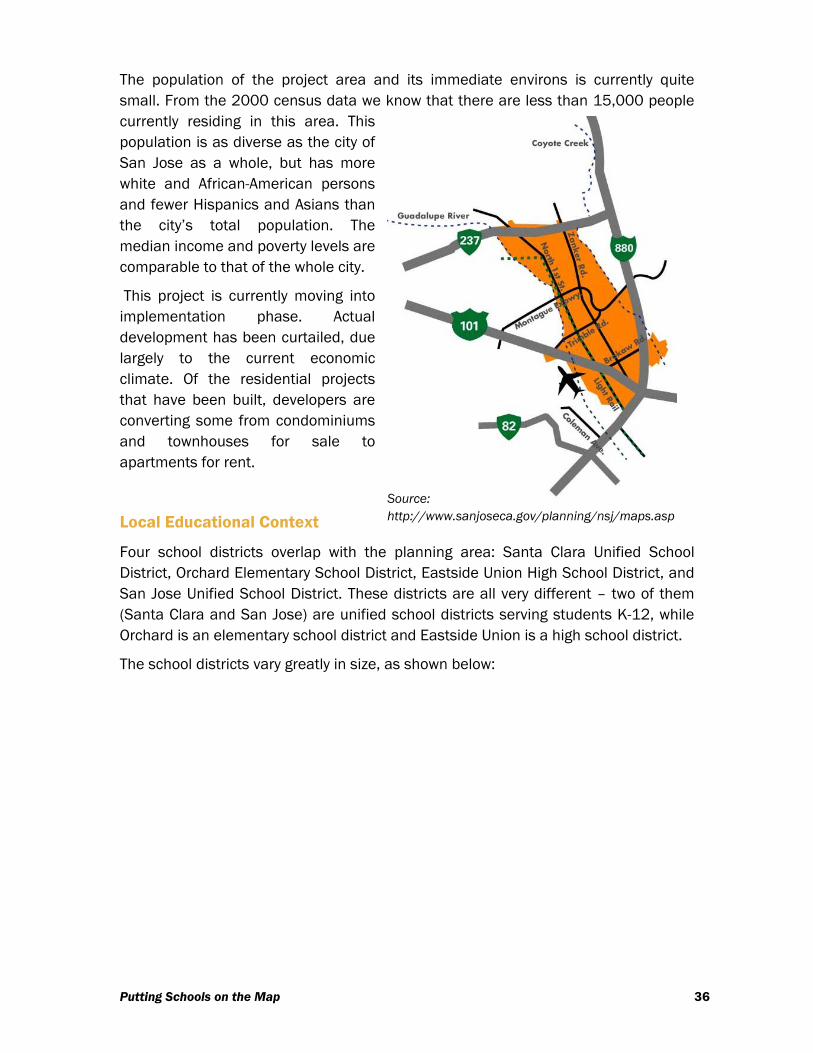
The population of the project area and its immediate environs is currently quite small. From the 2000 census data we know that there are less than 15,000 people currently residing in this area. This population is as diverse as the city of San Jose as a whole, but has more white and African-American persons and fewer Hispanics and Asians than the city’s total population. The median income and poverty levels are comparable to that of the whole city.
This project is currently moving into implementation phase. Actual development has been curtailed, due largely to the current economic climate. Of the residential projects that have been built, developers are converting some from condominiums and townhouses for sale to apartments for rent.
Source: http://www.sanjoseca.gov/planning/nsj/maps.asp
Local Educational Context
Four school districts overlap with the planning area: Santa Clara Unified School District, Orchard Elementary School District, Eastside Union High School District, and San Jose Unified School District. These districts are all very different – two of them (Santa Clara and San Jose) are unified school districts serving students K-12, while Orchard is an elementary school district and Eastside Union is a high school district.
The school districts vary greatly in size, as shown below:
Putting Schools on the Map 36

Source: CA Department of Education, http://dq.cde.ca.gov/dataquest/
Further the districts are feeling different pressures of increasing/stable enrollment.
Source: CA Department of Education, http://dq.cde.ca.gov/dataquest/
Putting Schools on the Map 37
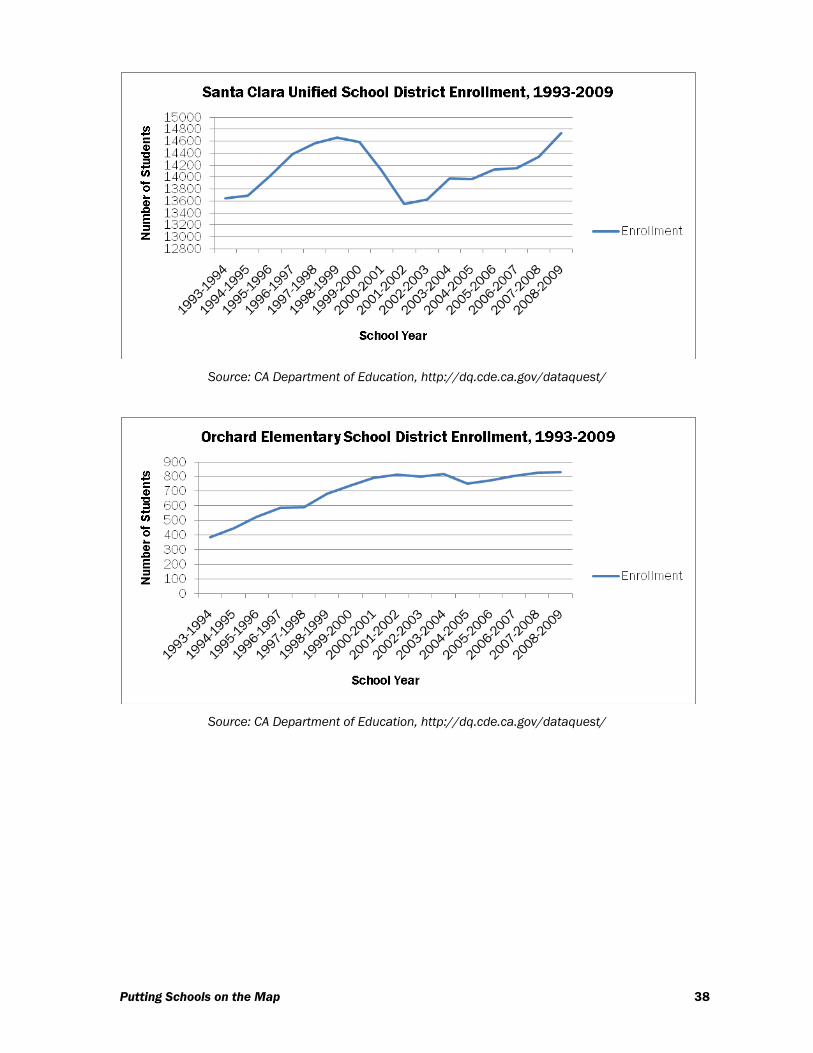
Source: CA Department of Education, http://dq.cde.ca.gov/dataquest/
Source: CA Department of Education, http://dq.cde.ca.gov/dataquest/
Putting Schools on the Map 38

Source: CA Department of Education, http://dq.cde.ca.gov/dataquest/
The Santa Clara Unified School District will arguably feel the greatest impact by the proposed, TOD, with four elementary schools near and/or serving the planning area. San Jose Unified also has an elementary school that serves the area, and students may be in the high school catchment area as well. The schools serving this area generally have a substantially different demographic makeup than the project area, most notably in their far lower percentages of white students (all student bodies are all less than 15% white). The poverty rate also appears to be higher in the district than the planning area, given that more than one-third of the students at area schools qualify for free and reduced lunch.48 The jurisdictional boundaries of the four districts overlap and do not seamlessly align with the plans for future housing development.
In fall 2009, the Santa Clara County Office of Education, the city of San Jose, and a coalition of business and community leaders launched SJ2020, an initiative to close the achievement gap in San Jose by 2020. Leaders of the initiative have created template resolutions for school districts to adopt and a community compact that encourages local businesses, foundations, community organizations, educators, and city leaders to sign on and commit to doing their part to support students in the city of San Jose and across its 19 school districts who experience a severe opportunity and achievement gap from their peers.49
Key Issues
Student Generation and School Impacts 48 See Data Fact Sheet in appendix. 49 Santa Clara County Office of Education. http://www.sccoe.k12.ca.us/sj2020/
Putting Schools on the Map 39
New development in the North 1st Street corridor raised questions of school capacity. This area has historically been an industrial/office corridor with relatively little residential development. As the area adds new residences, schools will need more capacity. Estimates of the total number of new students generated by the project range from 2,905 to 7,040 for the 32,000 new dwelling units, the majority of which will be in the Santa Clara Unified School District. This large range in expected new students stems from conflicting demographic data analysis – the former by the city and the latter by the school district. The student generation numbers remain unresolved – although one district representative commented that there are enough decision points in the implementation phase that they will get worked out accordingly.50
School Development and Design
In the North 1st Street planning process, community concerns around new students and school siting questions led to a working committee made up of the city, the Redevelopment Agency, community members, and the four school districts serving this area.51 Those bodies jointly issued a report in early 2008 that proposed new school sites and identified funding mechanisms for the new schools.52 The report identified six possible sites for new elementary schools and one for a new high school.
Given the student generation estimates, questions abound as to how to design and build new schools or renovate existing schools in a way that is consistent with the urban character of the proposed dense urban living along this corridor. Planners driving the process are interested in pursuing schools designed to match the surrounding infill environment – including denser, two-story schools. While push back from some residents has been reported, many others supported the idea. Despite the constraints of state-level school construction and design policy, the superintendent of the Santa Clara Unified School District sees the benefit of this type of design. Superintendent Stavis has a grand vision for the possibility of linking a high school campus with retail centers, creating learning and work-based opportunities for students. “The [North 1st Street area] community is ripe for this kind of development.”53
Models for future school development exist near the site. First is the Don Callejon School, built as part of new development to the west of the project area. The developer donated the land and part of the land is used as a joint school-public park facility. A second school model is Horace Mann School in downtown San Jose near
50 Ibid. 51 Santa Clara Unified School District, Orchard School District, Eastside Union High School District, and San Jose Unified School District 52 “North San Jose Vision Education Needs 2040: A Report on the Planning for New Schools,” March 2008. 53 Superintendent Steve Stavis, Santa Clara Unified School District, telephone interview, June 22, 2009.
Putting Schools on the Map 40
City Hall. It is a self-contained, multi-story urban school with a relatively small footprint.
Existing City-School Collaboration
The city of San Jose has an extensive city-schools collaborative infrastructure, which while not directly involved in this planning process, certainly informs the culture of city-school district relationships in the area.
While the schools subcommittee for the North 1st Street planning process worked well and produced a comprehensive report, yet not without tension. The process has been described as slow, and there have been a number of tense debates about financing, land swaps, and developer fees. Again, challenges abound in reconciling long-range planning for school district facility needs with immediate concerns about student achievement and short-term capacity questions.
Putting Schools on the Map 41
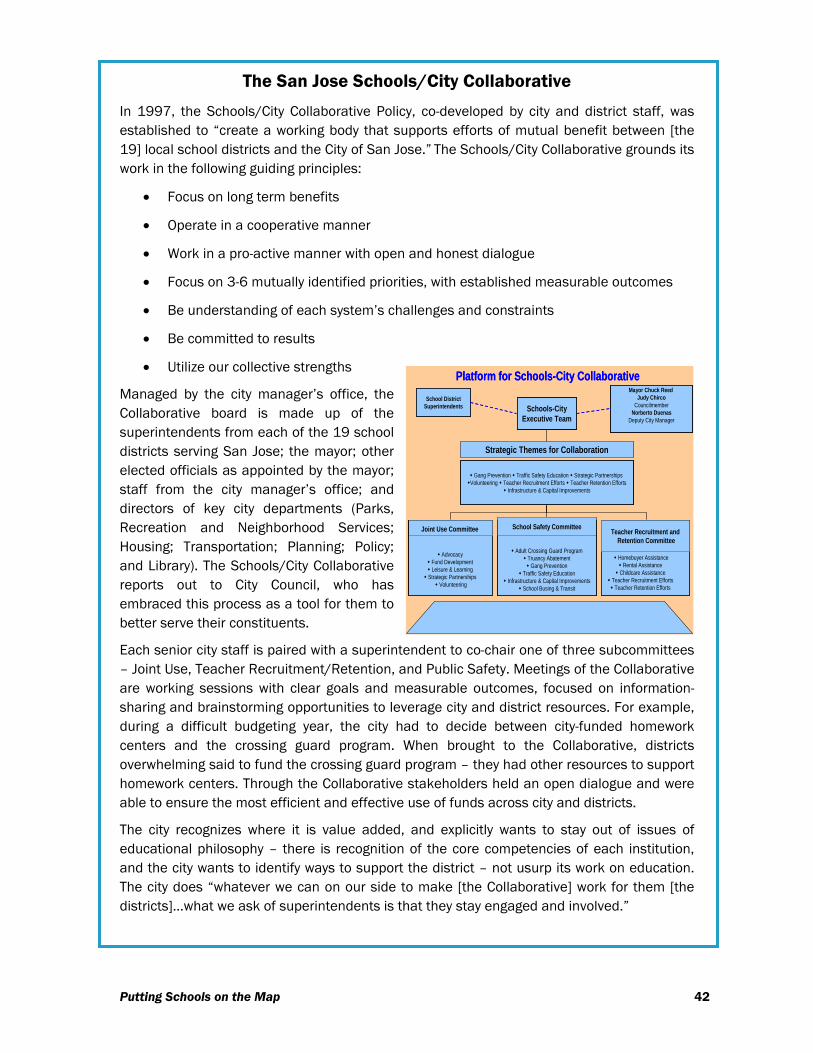
The San Jose Schools/City Collaborative In 1997, the Schools/City Collaborative Policy, co-developed by city and district staff, was established to “create a working body that supports efforts of mutual benefit between [the 19] local school districts and the City of San Jose.” The Schools/City Collaborative grounds its work in the following guiding principles:
• Focus on long term benefits
• Operate in a cooperative manner
• Work in a pro-active manner with open and honest dialogue
• Focus on 3-6 mutually identified priorities, with established measurable outcomes
• Be understanding of each system’s challenges and constraints
• Be committed to results
• Utilize our collective strengths
Managed by the city manager’s office, the Collaborative board is made up of the superintendents from each of the 19 school districts serving San Jose; the mayor; other elected officials as appointed by the mayor; staff from the city manager’s office; and directors of key city departments (Parks, Recreation and Neighborhood Services; Housing; Transportation; Planning; Policy; and Library). The Schools/City Collaborative reports out to City Council, who has embraced this process as a tool for them to better serve their constituents.
School DistrictSuperintendents
Adult Crossing Guard ProgramTruancy Abatement
Gang PreventionTraffic Safety Education
Infrastructure & Capital ImprovementsSchool Busing & Transit
Advocacy Fund Development Leisure & Learning
Strategic Partnerships Volunteering
Gang Prevention Traffic Safety Education Strategic Partnerships Volunteering Teacher Recruitment Efforts Teacher Retention Efforts
Infrastructure & Capital Improvements
Schools-CityExecutive Team
Mayor Chuck Reed Judy Chirco
CouncilmemberNorberto Duenas
Deputy City Manager
Joint Use Committee School Safety Committee
Strategic Themes for Collaboration
Platform for Schools-City Collaborative
Teacher Recruitment andRetention Committee
Homebuyer AssistanceRental Assistance
Childcare AssistanceTeacher Recruitment Efforts
Teacher Retention Efforts
Each senior city staff is paired with a superintendent to co-chair one of three subcommittees – Joint Use, Teacher Recruitment/Retention, and Public Safety. Meetings of the Collaborative are working sessions with clear goals and measurable outcomes, focused on information-sharing and brainstorming opportunities to leverage city and district resources. For example, during a difficult budgeting year, the city had to decide between city-funded homework centers and the crossing guard program. When brought to the Collaborative, districts overwhelming said to fund the crossing guard program – they had other resources to support homework centers. Through the Collaborative stakeholders held an open dialogue and were able to ensure the most efficient and effective use of funds across city and districts.
The city recognizes where it is value added, and explicitly wants to stay out of issues of educational philosophy – there is recognition of the core competencies of each institution, and the city wants to identify ways to support the district – not usurp its work on education. The city does “whatever we can on our side to make [the Collaborative] work for them [the districts]…what we ask of superintendents is that they stay engaged and involved.”
Putting Schools on the Map 42

San Jose North 1st Street Corridor Plan Key Lessons
1. A culture and administrative infrastructure that supports city-school district collaboration can set the stage for shared vision and joint planning projects.
2. Student generation and school capacity questions can be contentious in a planning process, but often issues can be resolved during a later implementation phase.
3. School facility design is an important element in planning new neighborhoods through TOD, and best practice examples are good inspiration.
Putting Schools on the Map 43
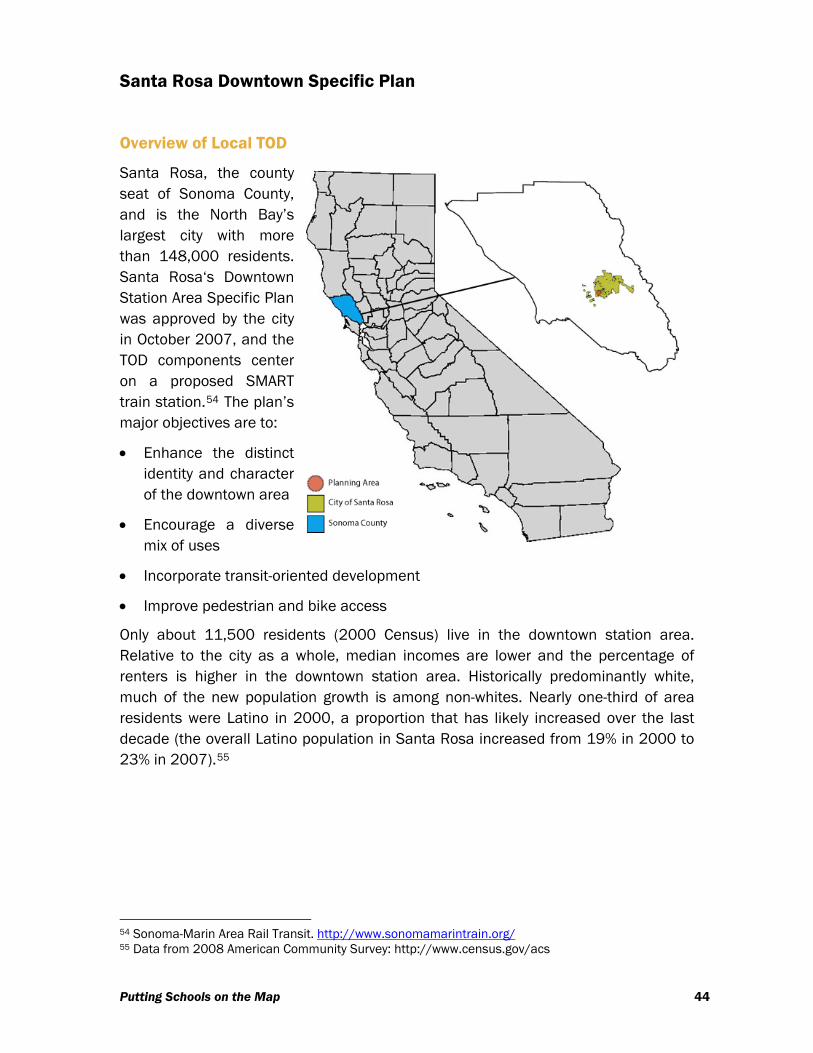
Santa Rosa Downtown Specific Plan
Overview of Local TOD
Santa Rosa, the county seat of Sonoma County, and is the North Bay’s largest city with more than 148,000 residents. Santa Rosa‘s Downtown Station Area Specific Plan was approved by the city in October 2007, and the TOD components center on a proposed SMART train station.54 The plan’s major objectives are to:
• Enhance the distinct identity and character of the downtown area
• Encourage a diverse mix of uses
• Incorporate transit-oriented development
• Improve pedestrian and bike access
Only about 11,500 residents (2000 Census) live in the downtown station area. Relative to the city as a whole, median incomes are lower and the percentage of renters is higher in the downtown station area. Historically predominantly white, much of the new population growth is among non-whites. Nearly one-third of area residents were Latino in 2000, a proportion that has likely increased over the last decade (the overall Latino population in Santa Rosa increased from 19% in 2000 to 23% in 2007).55
54 Sonoma-Marin Area Rail Transit. http://www.sonomamarintrain.org/ 55 Data from 2008 American Community Survey: http://www.census.gov/acs
Putting Schools on the Map 44

Source: http http://ci.santa-
rosa.ca.us/departments/communitydev/Pages/DowntownStationAreaSpecificPlan.aspx
Local Educational Context
Two school districts overlap the planning area: the Santa Rosa Elementary School District and the Santa Rosa High School District. Student enrollment in area schools reflects Santa Rosa’s changing demographics. The High School District is about one-third Latino, similar to the city’s total population; the Elementary School District, on the other hand, is half Latino. The numbers of English Language Learners is also considerably higher in the elementary district. Near the downtown station area, the school populations are even more mixed. Luther Burbank Elementary, the nearest public elementary school is 87% Latino (2007-08).56 At the same time, the student body of Santa Rosa Charter School for the Arts, serving grades K-8 and drawing students from across the city is more than 60% white. Santa Rosa High School has a similar makeup, while Santa Rosa Middle School is more diverse. The Elementary District is experiencing a recent increase in enrollment, while the High School District has been declining consistently for the past few years. The Santa Rosa Junior College is adjacent to the planning area, as well.
56 Data from California Department of Education: http://dq.cde.ca.gov/dataquest/
Putting Schools on the Map 45
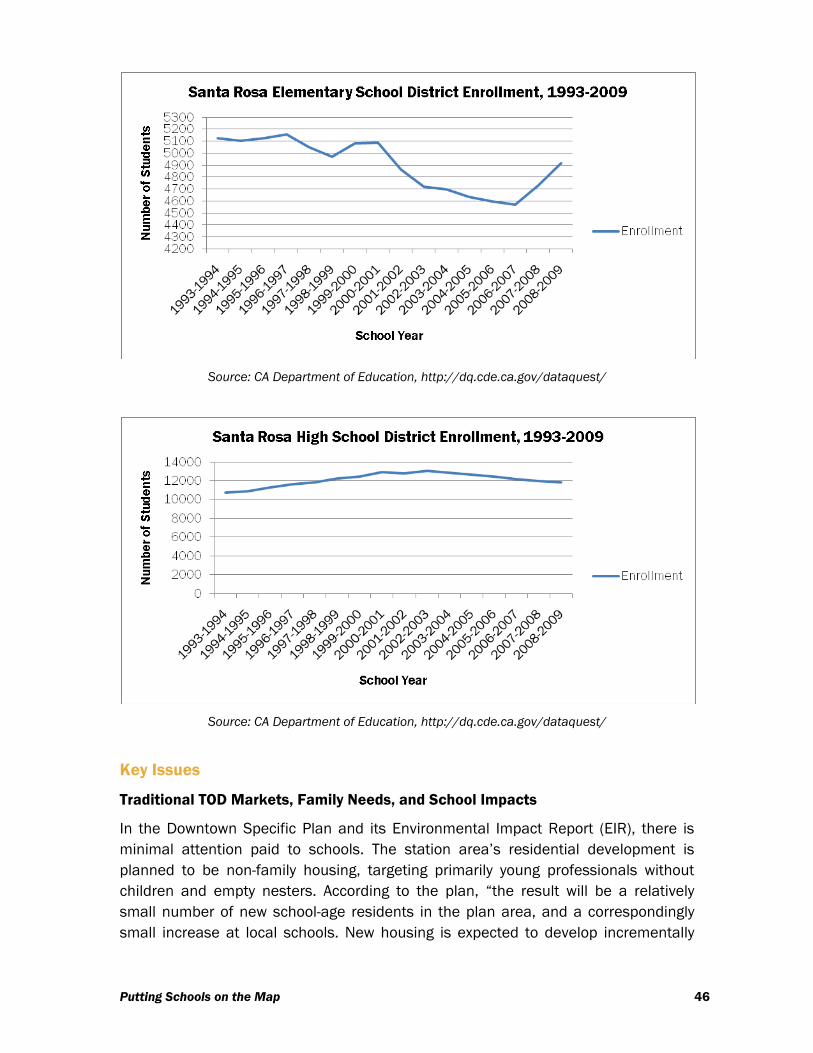
Source: CA Department of Education, http://dq.cde.ca.gov/dataquest/
Source: CA Department of Education, http://dq.cde.ca.gov/dataquest/
Key Issues
Traditional TOD Markets, Family Needs, and School Impacts
In the Downtown Specific Plan and its Environmental Impact Report (EIR), there is minimal attention paid to schools. The station area’s residential development is planned to be non-family housing, targeting primarily young professionals without children and empty nesters. According to the plan, “the result will be a relatively small number of new school-age residents in the plan area, and a correspondingly small increase at local schools. New housing is expected to develop incrementally
Putting Schools on the Map 46
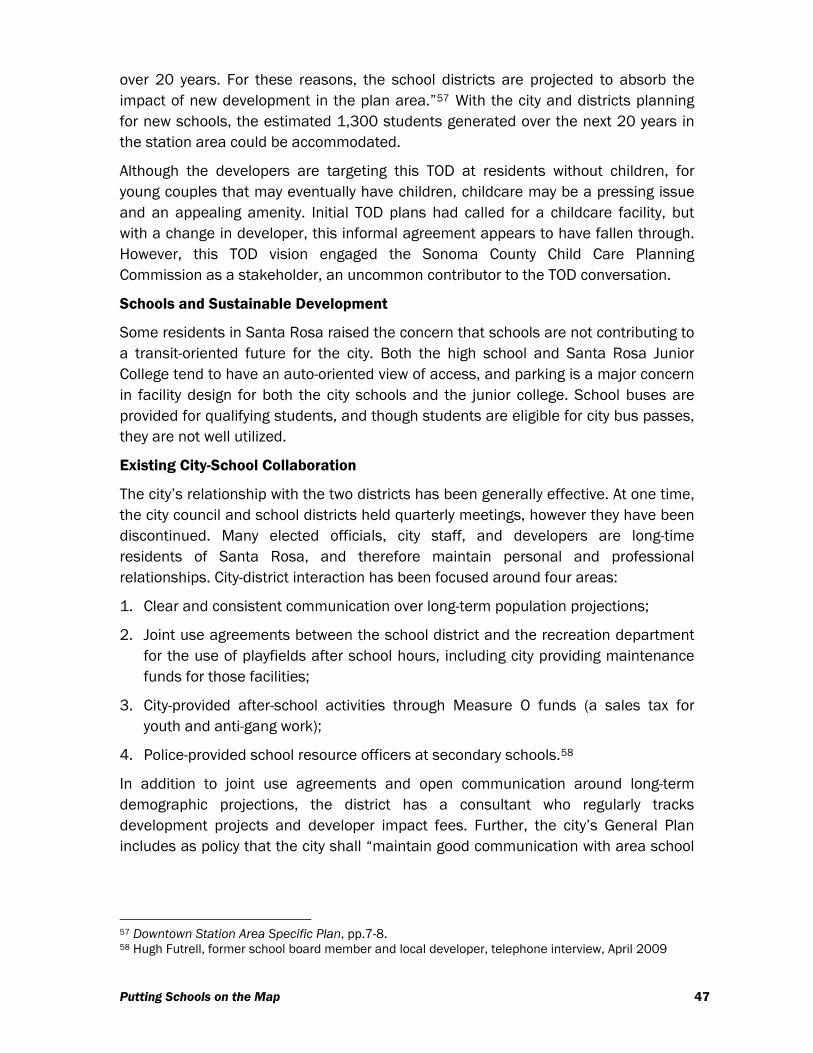
over 20 years. For these reasons, the school districts are projected to absorb the impact of new development in the plan area.”57 With the city and districts planning for new schools, the estimated 1,300 students generated over the next 20 years in the station area could be accommodated.
Although the developers are targeting this TOD at residents without children, for young couples that may eventually have children, childcare may be a pressing issue and an appealing amenity. Initial TOD plans had called for a childcare facility, but with a change in developer, this informal agreement appears to have fallen through. However, this TOD vision engaged the Sonoma County Child Care Planning Commission as a stakeholder, an uncommon contributor to the TOD conversation.
Schools and Sustainable Development
Some residents in Santa Rosa raised the concern that schools are not contributing to a transit-oriented future for the city. Both the high school and Santa Rosa Junior College tend to have an auto-oriented view of access, and parking is a major concern in facility design for both the city schools and the junior college. School buses are provided for qualifying students, and though students are eligible for city bus passes, they are not well utilized.
Existing City-School Collaboration
The city’s relationship with the two districts has been generally effective. At one time, the city council and school districts held quarterly meetings, however they have been discontinued. Many elected officials, city staff, and developers are long-time residents of Santa Rosa, and therefore maintain personal and professional relationships. City-district interaction has been focused around four areas:
1. Clear and consistent communication over long-term population projections;
2. Joint use agreements between the school district and the recreation department for the use of playfields after school hours, including city providing maintenance funds for those facilities;
3. City-provided after-school activities through Measure O funds (a sales tax for youth and anti-gang work);
4. Police-provided school resource officers at secondary schools.58
In addition to joint use agreements and open communication around long-term demographic projections, the district has a consultant who regularly tracks development projects and developer impact fees. Further, the city’s General Plan includes as policy that the city shall “maintain good communication with area school
57 Downtown Station Area Specific Plan, pp.7-8. 58 Hugh Futrell, former school board member and local developer, telephone interview, April 2009
Putting Schools on the Map 47
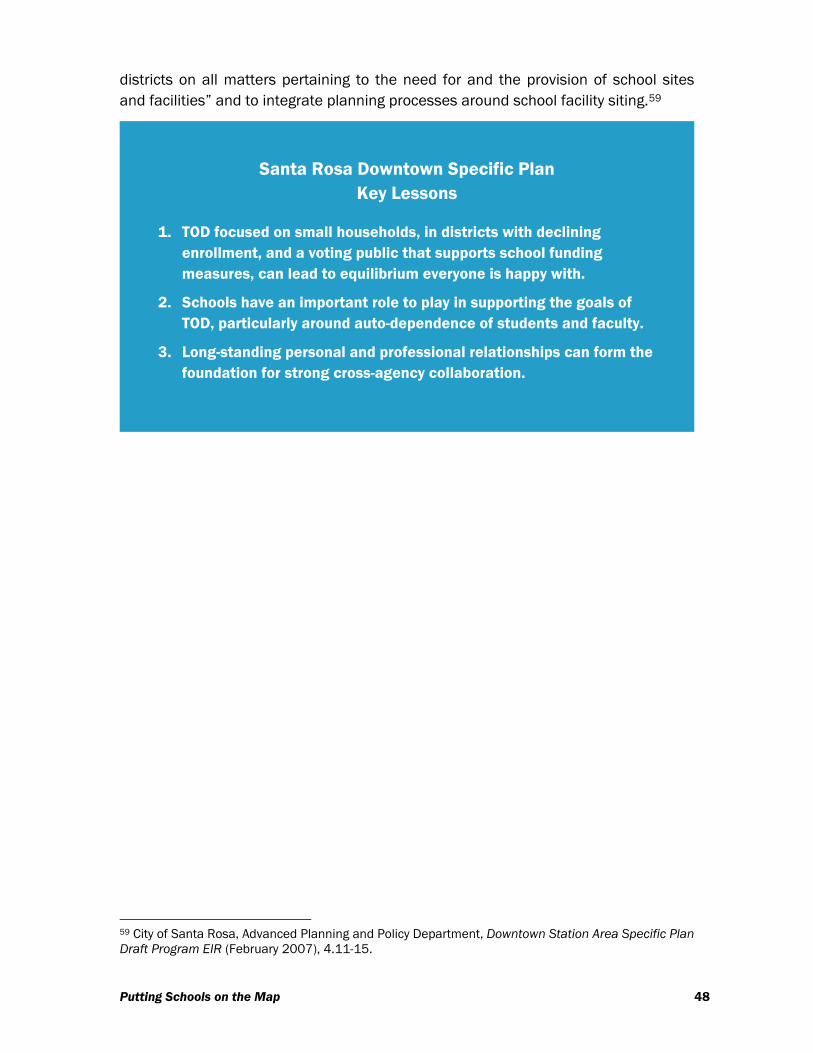
districts on all matters pertaining to the need for and the provision of school sites and facilities” and to integrate planning processes around school facility siting.59
Santa Rosa Downtown Specific Plan Key Lessons
1. TOD focused on small households, in districts with declining enrollment, and a voting public that supports school funding measures, can lead to equilibrium everyone is happy with.
2. Schools have an important role to play in supporting the goals of TOD, particularly around auto-dependence of students and faculty.
3. Long-standing personal and professional relationships can form the foundation for strong cross-agency collaboration.
59 City of Santa Rosa, Advanced Planning and Policy Department, Downtown Station Area Specific Plan Draft Program EIR (February 2007), 4.11-15.
Putting Schools on the Map 48
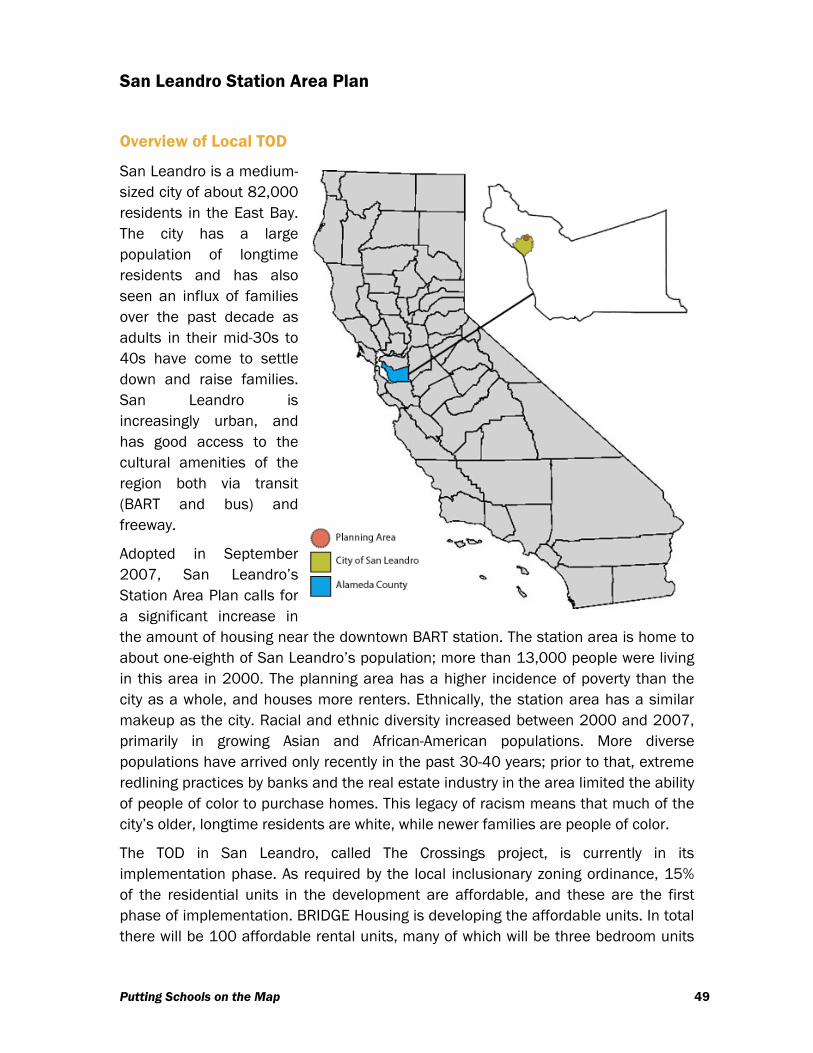
San Leandro Station Area Plan
Overview of Local TOD
San Leandro is a medium-sized city of about 82,000 residents in the East Bay. The city has a large population of longtime residents and has also seen an influx of families over the past decade as adults in their mid-30s to 40s have come to settle down and raise families. San Leandro is increasingly urban, and has good access to the cultural amenities of the region both via transit (BART and bus) and freeway.
Adopted in September 2007, San Leandro’s Station Area Plan calls for a significant increase in the amount of housing near the downtown BART station. The station area is home to about one-eighth of San Leandro’s population; more than 13,000 people were living in this area in 2000. The planning area has a higher incidence of poverty than the city as a whole, and houses more renters. Ethnically, the station area has a similar makeup as the city. Racial and ethnic diversity increased between 2000 and 2007, primarily in growing Asian and African-American populations. More diverse populations have arrived only recently in the past 30-40 years; prior to that, extreme redlining practices by banks and the real estate industry in the area limited the ability of people of color to purchase homes. This legacy of racism means that much of the city’s older, longtime residents are white, while newer families are people of color.
The TOD in San Leandro, called The Crossings project, is currently in its implementation phase. As required by the local inclusionary zoning ordinance, 15% of the residential units in the development are affordable, and these are the first phase of implementation. BRIDGE Housing is developing the affordable units. In total there will be 100 affordable rental units, many of which will be three bedroom units
Putting Schools on the Map 49
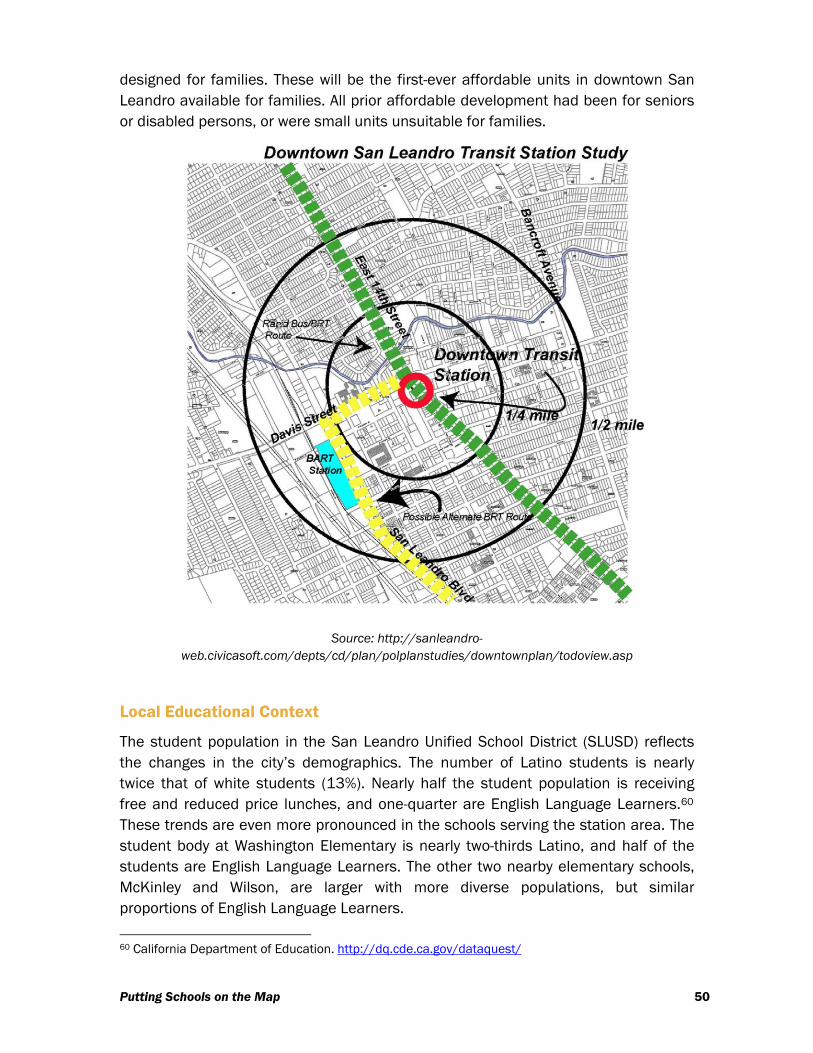
designed for families. These will be the first-ever affordable units in downtown San Leandro available for families. All prior affordable development had been for seniors or disabled persons, or were small units unsuitable for families.
Source: http://sanleandro-
web.civicasoft.com/depts/cd/plan/polplanstudies/downtownplan/todoview.asp
Local Educational Context
The student population in the San Leandro Unified School District (SLUSD) reflects the changes in the city’s demographics. The number of Latino students is nearly twice that of white students (13%). Nearly half the student population is receiving free and reduced price lunches, and one-quarter are English Language Learners.60 These trends are even more pronounced in the schools serving the station area. The student body at Washington Elementary is nearly two-thirds Latino, and half of the students are English Language Learners. The other two nearby elementary schools, McKinley and Wilson, are larger with more diverse populations, but similar proportions of English Language Learners.
60 California Department of Education. http://dq.cde.ca.gov/dataquest/
Putting Schools on the Map 50
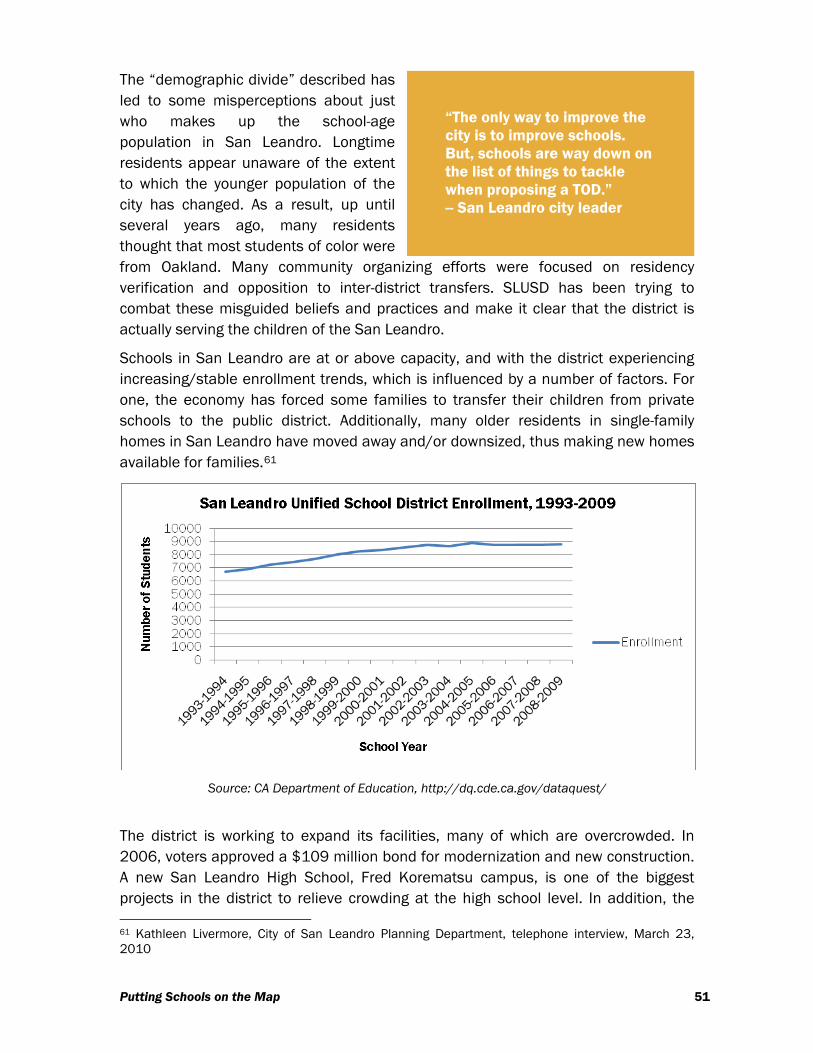
The “demographic divide” described has led to some misperceptions about just who makes up the school-age population in San Leandro. Longtime residents appear unaware of the extent to which the younger population of the city has changed. As a result, up until several years ago, many residents thought that most students of color were from Oakland. Many community organizing efforts were focused on residency verification and opposition to inter-district transfers. SLUSD has been trying to combat these misguided beliefs and practices and make it clear that the district is actually serving the children of the San Leandro.
“The only way to improve the city is to improve schools. But, schools are way down on the list of things to tackle when proposing a TOD.” -- San Leandro city leader
Schools in San Leandro are at or above capacity, and with the district experiencing increasing/stable enrollment trends, which is influenced by a number of factors. For one, the economy has forced some families to transfer their children from private schools to the public district. Additionally, many older residents in single-family homes in San Leandro have moved away and/or downsized, thus making new homes available for families.61
Source: CA Department of Education, http://dq.cde.ca.gov/dataquest/
The district is working to expand its facilities, many of which are overcrowded. In 2006, voters approved a $109 million bond for modernization and new construction. A new San Leandro High School, Fred Korematsu campus, is one of the biggest projects in the district to relieve crowding at the high school level. In addition, the 61 Kathleen Livermore, City of San Leandro Planning Department, telephone interview, March 23, 2010
Putting Schools on the Map 51

district is expanding the library and building a new arts education facility with a theater on the parking lot.
The district’s main educational reforms focus on equity issues. The district has been developing an equity team by training administrators and principals to talk about race and its role as a predictor of the achievement gap. They have been training a cadre of teachers in pedagogical practices that best support minority students and raising expectations for students of color. Parent involvement has been a key component of these efforts.
Key Issues
Student Generation and School Impacts
Issues of school capacity became the centerpiece for challenges to the development. Although the city’s General Plan and the TOD strategy call for cooperation and collaboration between the city and SLUSD to mitigate any school impacts from new residential development, the plan makes no provision for the siting of new schools. During the planning phase, the district questioned the draft Environmental Impact Review (EIR) statement, specifically on the number of new students generated by the development and the expected impact of these new students on district operations and facilities. The city’s original student generation estimates were fairly low, as planners expected the TOD to market to empty nesters and young professionals without children. In the near term, demographic projections indicated that the schools could accommodate the expected number of new students. In the long term, however, the cumulative impact was likely to be larger, though it was still so far off that the City felt any estimates of the impact were too speculative.
Demographic Shifts and Community Tensions
Opposition to the TOD mounted during the implementation phase, driven largely by older, white homeowners concerned about the loss of BART parking, property values, and crime. The group was a minority, but a loud one. As the debate evolved, the issue of schools was raised as a major point of contention. Residents articulated concern that neither the project nor the plan adequately addressed school impacts. Some of this opposition illuminated some racial tensions between the older, primarily white residents and newer families of color.
Existing City-School Collaboration
San Leandro’s elected officials on City Council and the Board of Education have a good working relationship, demonstrated by the decade long existence and action of a city-school district liaison committee made up of three members from each elected
Putting Schools on the Map 52
body.62 The full Board of Education and City Council meet annually as well. Despite limited contact between city and district staff, this project rested on some foundation of collaboration. First, the city and SLUSD have a number of joint use agreements, such as a new playfield for a middle school and the gym at the new ninth grade campus. Secondly, the city planning staff held meetings to educate the public and district stakeholders about the city’s obligations under state housing policy – especially the Regional Housing Needs Allocation (RHNA) process, which requires cities to plan and accommodate a certain level of growth through new housing. Finally, the city asked the district for a demographer to conduct student generation analysis.
Third-Party Intervention
In response to rising community concerns about student generation, BRIDGE Housing also hired the district’s demographer, Schoolhouse Services, Economists, and Planners. BRIDGE thus took the lead in clarifying the actual student generation data in the implementation phase and negotiating some of the tension between city and district staff. The demographer found that the full TOD build-out would ultimately produce a substantial increase in students, however not all of these students would be generated by the first phase of implementation. The demographer’s study also determined that not all of the students living in the new project would be new to the district. BRIDGE Housing played a key role in educating, facilitating, and moving the process forward by securing this data and clarifying the implementation timeline for the project.
Planning v. Implementation
Although the planning process eventually and successfully navigated public comment, the implementation phase, particularly the affordable housing component met staunch resistance. Once the demographer had completed his projections, however, the conversation among the city, district, and developer became much less strained. With actual numbers of students and the realistic development timeline clarified, a number of the concerns subsided. Now, the district is in a position to address these long-term concerns, which was a point the developer took pains to emphasize. City staff facilitated outreach during the planning phase, and BRIDGE communicated consistently and effectively during the implementation phase of development.
62 Michael Katz-Lacabe, San Leandro Unified School District, telephone interview, April 2009; and Michael Gregory, San Leandro City Council, telephone interview, April 2009.
Putting Schools on the Map 53
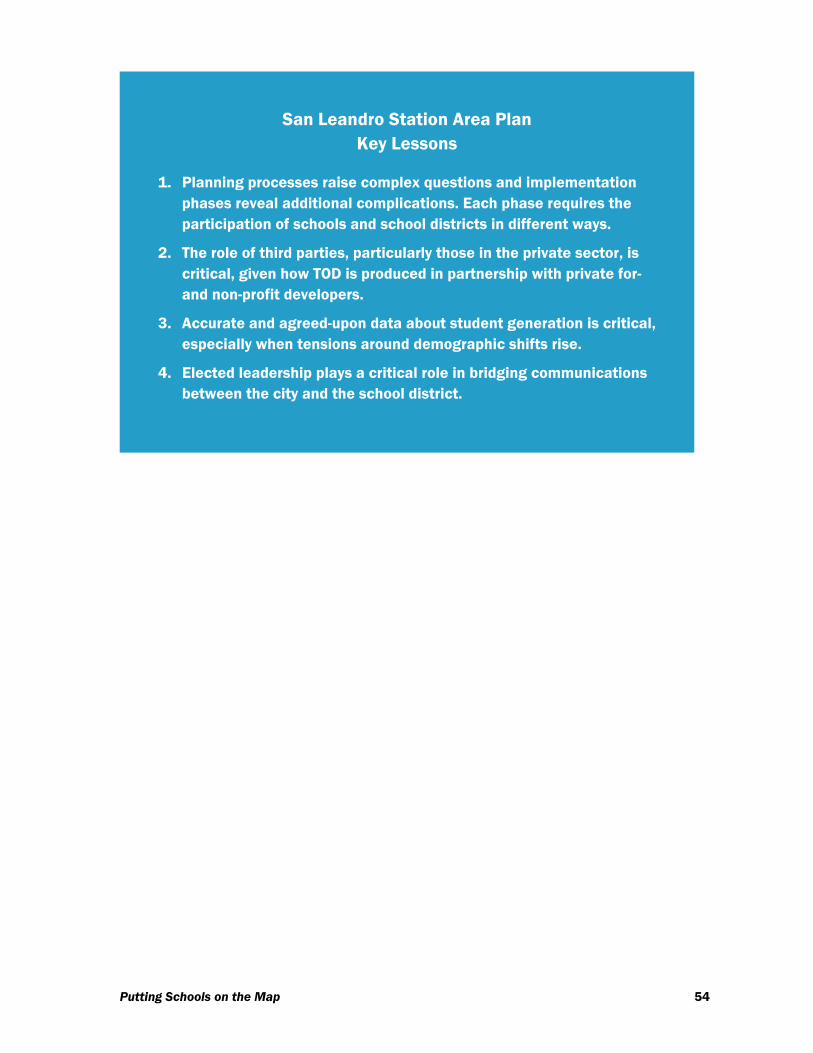
San Leandro Station Area Plan Key Lessons
1. Planning processes raise complex questions and implementation phases reveal additional complications. Each phase requires the participation of schools and school districts in different ways.
2. The role of third parties, particularly those in the private sector, is critical, given how TOD is produced in partnership with private for- and non-profit developers.
3. Accurate and agreed-upon data about student generation is critical, especially when tensions around demographic shifts rise.
4. Elected leadership plays a critical role in bridging communications between the city and the school district.
Putting Schools on the Map 54
V. Findings: Opportunities for TOD to Support Families and Enhance Public Schools
There are many dynamic and too-often ignored linkages among TOD, families, and schools as outlined in this paper. The transit connectedness obtained through TOD can be especially attractive to families with children who balance daily transportation logistics getting their children to and from school and extracurricular activities and getting themselves to and from work. The impacts of TOD can be both positive and negative on local schools, and the process of engaging school stakeholders in planning processes can be complex and challenging. TOD with mixed income family housing can be a boon for local schools looking to attract more students. Additionally, TOD presents opportunities to include new schools and/or childcare services within their mix of uses. Nearby existing schools and new on-site schools present unique opportunities to maximize and share the use of public space as an amenity for local residents and local schools. Child-related destinations are the reason for a greater percentage of family transportation trips, which for reasons of convenience and perceived of safety, are most often taken by car. Living in a family-friendly TOD, however, could potentially change that for many families throughout the Bay Area.
We now highlight four key findings that demonstrate how TOD supports families and enhances public schools in the Bay Area.
Finding 1: Collaborative, cross-sector partnerships can leverage opportunities linking TOD, families, and schools.
Leveraging the opportunities presented by TOD and mitigating the potential negative impacts of TOD on schools requires collaborative, cross-sector partnerships. In particular, local public school districts need to be active in TOD planning processes. The Ten Core Connections presented in this paper provide the rationale for including school districts as key stakeholders in TOD planning and illuminate the incentives for schools to participate. Planning for population and school enrollment changes linked to a TOD appears to be a natural converging point of interest; the potential for harnessing the joint use of public spaces or including small specialty schools in a TOD can only happen through partnerships across agencies.
Funding tends to be a huge constraint in these types of projects because of their complexity. Given this, can we find ways to make school-and family-focused TOD more viable than the alternative? How can we shift the historic contentious relationship between schools and new development and move away from a focus on “mitigation of school impacts” to one that highlights how collaborative planning results in a “win-win”?
Putting Schools on the Map 55
Finding 2: The “Story” of TOD can more explicitly include families and schools.
Family households are not typically targeted as potential residents in TOD throughout the United States. The standard TOD model focuses on young professionals without children and empty nesters. As a result, thinking about schools as related to TOD seems unnecessary. Even newer studies63 that categorize young professionals across two or three sub-categories only identify market demand at a single point in time. When couples without children living in TOD have children, they are more-or-less forced to relocate to accommodate their growing family, which often also means giving up their multi modal lifestyle. TOD focused at least in part on accommodating families can both attract new populations to TOD and help retain current residents in TOD areas. With or without residents with children, TOD has a number of potential impacts on – and opportunities to enhance – local schools. But given that nearly one-third of households in the Bay Area have children, many TOD projects are missing a large clientele who often are heavily reliant on public transportation.
The case for creating mixed income TOD only furthers the need to consider how TOD can be more attractive to families. While the inclusion of affordable housing units is increasingly an explicit priority of TOD in the Bay Area, often the complexity of financing such projects makes affordable development cost prohibitive. Further, affordable housing does not always indicate family housing, and ensuring age diversity is not an explicit goal of TOD success. Clearly, including affordable, family-oriented housing is no easy task; to do so developers and cities will need additional policy mechanisms and financial subsidy strategies. The first step in this is making explicit the goals of family-focused mixed income TOD.
Finding 3: Cross-sector partnerships require additional capacity building.
Effective cross-sector partnerships are built upon trust, communication, and procedural tools. Stakeholders repeatedly point to partnerships as treading new ground and would benefit from increased partnership capacity building. Our case studies revealed three important groups of stakeholders, who each need capacity building support to engage in collaborative TOD planning:
1. Elected local officials (city councils and school boards) are accountable to the same constituencies that are often able to form collaborations and set a vision for partnership.
2. City and district staff understand the daily constraints of working across agencies. In some cases, staff has less developed relationships across
63 Understanding the Choice to Reside in a Transit-Oriented Development. 2009. Prepared for the Metropolitan Transportation Commission by Cambridge Systematics.
Putting Schools on the Map 56
institutions; in other situations, they have a deeper level of trust than elected officials.
3. Private (for- and nonprofit) developers and planners are the prime movers in the world of TOD and have the ability to go between the city and the district and act as mediators. However, not all developers are attuned to the full scope of issues impacting school districts. Additionally, many localities do not write their own plans and instead rely on the services of private consultants. If cities want to integrate schools into the planning process, these third party consultants also need tools and strategies for working with school stakeholders.
In particular, we identify four areas to focus capacity building:
1. Communications infrastructure. Formal and informal avenues of communication are critical to sustained collaboration and trust building. While not every community will develop the complex structure we see in San Jose, cities and school districts often have “2x2” committees (where the district superintendent and school board chair meet with the mayor and city manager), quarterly joint city council-school board meetings, or other consistent modes of communication.
2. Data-sharing. Data is of critical importance in the conversations about schools and development. Most basically, there is no single easily accessible source of data on both cities and schools. The Data Fact Sheets presented with each case study are one simple way to align planning processes and school data. These factsheets are an initial example of how comparative data is necessary to start a conversation across agencies and build understanding and relationships. This speaks to a broader information gap that currently exists. The questions of student generation raised across all sites point to the need for a system and set of resources where planners and districts can agree on demographic projections.
3. Incremental successes. Trust and collaboration can be built on diverse projects and initiatives. Cities and districts do not need to start with a complicated joint use facility, but rather can build on the foundation of school resource officers and shared after-school programming, and then move on to bigger infrastructure and development questions. Leaders can begin to catalog and outline strategies that are already working – regardless of department or arena. While a crossing guard program may seem small compared to a large infrastructure development initiative, this incremental success provides a foundation for relationship building, and its success can be leveraged for future, bigger projects.
4. Points of effective partnership/engagement. To determine the best time, place, and reason for schools’ engagement, all stakeholders must understand TOD and school-related planning and implementation processes, what specific action occurs in those phases, and how any impacts are most directly relevant to the work of cities and school districts. For example, while planning processes set the stage for land allotment, it may not be until the implementation phase that unit
Putting Schools on the Map 57
mix of a TOD is set, thus determining actual student generation rates. Likewise, different phases of the process provide opportunities to leverage city and school constituencies. For example, students may participate in a planning process as part of a service-learning class, and subsequently share information with their parents. Furthermore, schools may use public meetings during an implementation phase to reach other city residents who have an interest in supporting schools and/or joint use of school facilities.
Finding 4: Performance measures and outcome indicators are needed to assess successful TOD outcomes supporting families and schools.
To effectively align and assess outcomes associated with TOD that support families and schools, districts, cities, and developers need established performance measures and outcome indicators. Conventional TOD success metrics tend to focus on revenue for transit agencies and increased transit ridership.64 While TOD advocates and developers often employ rhetoric related to increased “quality of life” benefits, associated benchmarks are insufficient. Recently, the idea of “TOD 3.0” has been touted, in which “Livability Benefits” become the driver of the technical processes of transit and land use planning for TOD.65 These include affordable housing, access to job opportunities, downtown and neighborhood revitalization, and general economic growth. Education-related components are narrowly defined around early childhood education, out of school time, charter schools, and magnet schools66 – not considering the bevy of other traditional public school district and school site initiatives and opportunities that compliment TOD efforts. However, even when benchmarks are set for these types of quality of life issues,67 there is limited focus on operationalizing what this means in practice for families – especially where schools and the inclusion of school site and district stakeholders are concerned. Further research and case study development should be utilized to construct tangible performance measures and outcome indicators for successful TOD planning processes and outcomes that support families and local schools.
64 Transit Cooperative Research Program. 2004. Report 102 Transit-Oriented Development in the United States: Experiences, Challenges, and Prospects, the Transportation Research Board, p.11. Available at: http://onlinepubs.trb.org/Onlinepubs/tcrp/tcrp_rpt_102.pdf 65 Fostering Equitable and Sustainable Transit-Oriented Development: Briefing Papers for a Convening on Transit-Oriented Development. Convening held by the Center for Transit Oriented Development, Living Cities, and Boston College’s Institute for Responsible Investment at the Ford Foundation. February 24-25, 2009. p.31. Available at: http://www.livingcities.org/leadership/trends/transit/ 66 Ibid. p.33. 67 The Center for Transit Oriented Development (CTOD), for example, includes a performance measure that TODs “create a sense of place” http://www.reconnectingamerica.org/public/tod
Putting Schools on the Map 58
VI. Conclusion
Opportunities exist to use Transit-Oriented Development to increase transit ridership, create great communities, support families, and provide high quality educational options for all children. However, conventional TOD strategies rarely focus on families and rarely include school districts as stakeholders in the planning processes. A history of distinct governance structures; different project and policy timeframes; and often competing regulations lay a tenuous foundation on which to build meaningful and sustainable collaborative policies and practices between city and school district efforts. Additionally, TOD faces its own set of challenges around coordinating land use and transportation planning; reconciling project-, local-, and regional-level priorities; managing a more complex funding and stakeholder landscape than traditional real estate development; and facing costly land assembly.68
This paper has framed the variety of linkages among TOD, families, and schools for the purposes of ensuring successful TOD and complete communities, while also supporting high quality educational opportunities for families. School quality, which includes both the educational quality of school programs and a school’s role as a physical community asset, broadly affects a number of regional and local demographic trends and development issues. Likewise, the decisions regional and local city planners make can have great repercussions for schools and districts. But they can also have positive impacts, opening up more opportunities for educational enrichment.
Because the lives of young people are shaped by their housing, health care, employment opportunities, and safety on the streets, schools cannot be the sole institution responsible for preparing future generations to be active, engaged, and healthy citizens. Cities can, and do, play an important role. TOD is one emerging city development trend that can bridge the priorities of regional planners, local policy makers, families, students, and schools.
68 Fostering Equitable and Sustainable Transit-Oriented Development: Briefing Papers for a Convening on Transit-Oriented Development. Convening held by the Center for Transit Oriented Development, Living Cities, and Boston College’s Institute for Responsible Investment at the Ford Foundation. February 24-25, 2009. pp.2-3. Available at: http://www.livingcities.org/leadership/trends/transit/
Putting Schools on the Map 59

Appendix 1: Case Study Fact Sheets
Putting Schools on the Map 60

Putting Schools on the Map 61
Appendix 2: Median Income Calculation