putting some numbers behind client retention · pricemetrix insights, december 2013 stayor stray...
TRANSCRIPT

®
PRICEMETRIX INSIGHTS, DECEMBER 2013
STRAYSTAYOR PUTTING SOME NUMBERS BEHIND CLIENT RETENTION

This Insights report is made possible by PriceMetrix
aggregated data representing 7 million retail investors,
500 million transactions, and over $3.5 trillion in investment
assets. PriceMetrix combines its patented process for
collecting and classifying data with proprietary measures of
revenue, assets, and households to create the most
insightful and granular retail wealth management database
available today.
2

3www.pricemetrix.com/Insights
IntroductIon
Client retention and attrition are metrics to which every financial advisor who wants to grow his or her business
needs to pay close attention. Whether planning for growth, succession or simply increased productivity, every
advisor needs to have a solid grasp of which client relationships are durable (and are likely to persist) and an
understanding of which relationships are at greater risk. This PriceMetrix Insights report helps advisors
distinguish between the two. Its central questions are:
• Whatarethecharacteristicsofclientswhoaremorelikelytostaywiththeiradvisor?
• Whatarethecharacteristicsofadvisorswhoareabletoretainahighproportionoftheirclients?
The reason for being attentive to client retention is clear: growing one’s business is more challenging if one is
continually trying to replace clients and assets that have moved elsewhere. As one might expect, higher client
retention is associated with higher asset growth and higher revenue growth (see Exhibit 1). At the same time,
not all client attrition is negative, since not all client relationships represent the same revenue opportunity
for advisors.
1 This plot depicts the relationships between client retention and asset growth, and client retention and revenue growth, controlling for assets under management, revenue, household mix and advisor experience (with controls held at their mean values). Client retention is measured as the annual retention rates averaged over the 2010-2013 time period.
Exhibit 1: Asset Growth, Revenue Growth and Client Retention, 2010-2013
15%
30%
25%
20%
10%
5%
0%80% 85% 90% 95% 100%
Asset andRevenue Growth,
2010-2013 (%)1
Client Retention, 2010-2013 (Annual Average) (%)
Asset Growth, 2010-2013 (%) Revenue Growth, 2010-2013 (%)

4 PriceMetrix Insights – Stay or Stray
Advisors or firms that are looking to acquire a book of business should similarly be concerned about the target
advisor’s client retention rate. “How do I know these clients will stay?” is a question that, while perhaps not
explicitly asked, underpins many book valuations, and deal or partnership structures.
In order to shed light on retention and attrition, we analyze data for clients (and advisors) from 2009 to 2013.
The answers we provide give advisors a clearer picture of the opportunities and risks inherent in their books of
business represented by client retention and attrition. Some of the key findings that emerge are:
• Themostcriticaltimeperiodforadvisorstofocusonclientretentionandattritionriskisfromtheone-yearmark
tothefour-yearmarkinaclientrelationship.
• Smallclientsarelesslikelytostaywiththeiradvisor.Further,havinganexcessnumberofsmallclientsinabook
cannegativelyaffecttheretentionofotherclients.
• Theclientrelationshipsleastlikelytoberetainedarelow-pricedfee-onlyrelationshipsandhigh-priced
transactional-onlyrelationships.
• Intermsofretainingclients,theindustry-wide“transition”tofeeismostadvantageouslyapproachedasthe
additionoffeetotransaction,whereclientsholdbothtypesofaccounts.
• Thereisnoonepricethatoptimizesclientretention,ratherarangeofprices.Still,advisorscanundermine
perceptionsofvaluebypricingtooloworpricethemselvesoutofclientbusinessbypricingtoohigh.Bothlower
theprospectofretainingaclient.
• Atthesametime,despiteadvisorperceptions,largeclientsdisplaylesspricesensitivitythansmallclients.
• Olderclientsaremorelikelytostay.Youngerclientsaremorelikelytoleave.

5www.pricemetrix.com/Insights
BenchmarkIng retentIon and attrItIon In retaIl Wealth management
To set the context, recent years have seen annual household retention rates of 90 percent or higher in the retail
wealth management industry – meaning that in any given year, 9 in 10 households (or more) remain with their
financial advisor (see Exhibit 2). The client retention rate of 90 percent in 2009 (the first full calendar year
following the financial crisis) was the lowest in recent years, as more clients than usual were seeking new
advisors. Retention in 2013 was again low at 90 percent.
At the same time, retention rates vary considerably across advisors. To illustrate, the median advisor in 2013
retained 94 percent of households. The advisor at the 10th percentile retained only 84 percent of
clients, while the advisor at the 90th percentile retained 98 percent (see Exhibit 3). Again, we see that 2009 was
a particularly challenging year for some advisors. While the top half and median rates of attrition were in line with
historical norms, many advisors had retention rates below historical norms. The bottom 10 percent of advisors lost
nearly one in five of their client relationships in 2009.
Exhibit 2: Annual Household Retention Rates, 2009–2013
60%
100%
80%
40%
20%
0%2009 2010 2011 2012 2013
Percent of Households
Stay Leave
90% 93% 91% 90%92%
10% 7% 9% 10%8%
Exhibit 3: Distributions of Annual Advisor (Book) Retention Rates, 2009–2013
95%
100%
90%
85%
80%
AdvisorRetention Rate
(Percent)
2009 2010 2011 2012 2013
Median 10th–90th percentile
6 PriceMetrix Insights – Stay or Stray
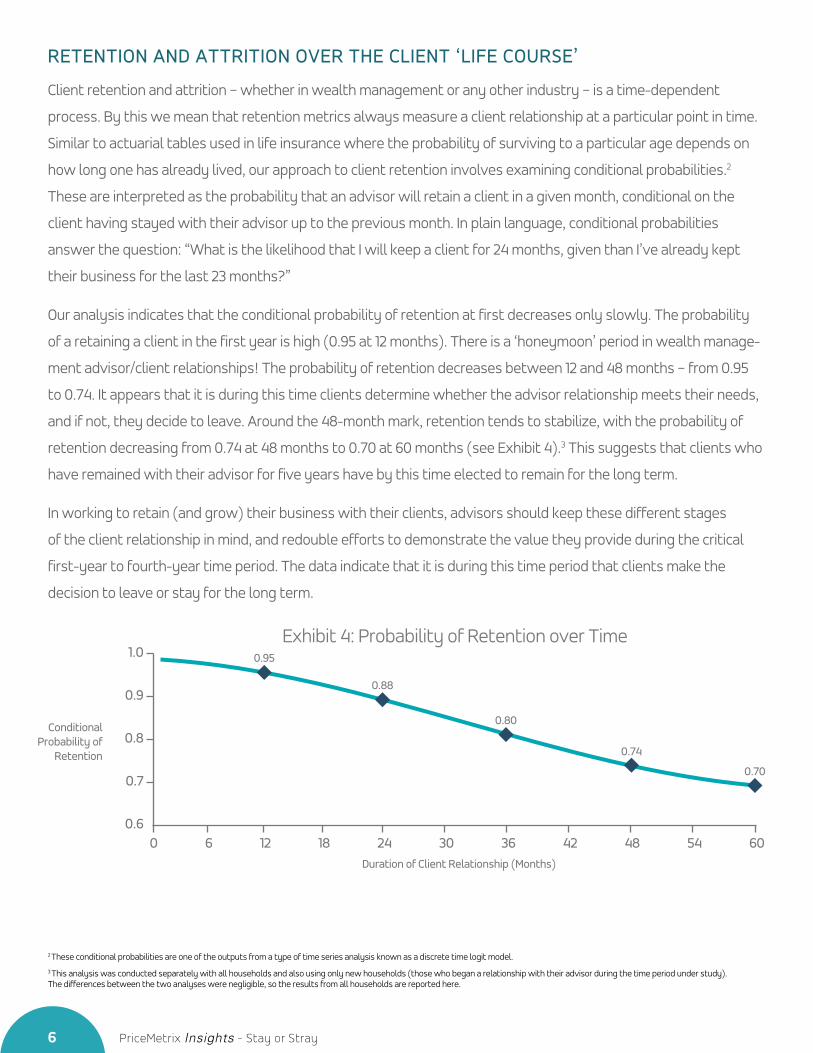
retentIon and attrItIon over the clIent ‘lIFe courSe’
Client retention and attrition – whether in wealth management or any other industry – is a time-dependent
process. By this we mean that retention metrics always measure a client relationship at a particular point in time.
Similar to actuarial tables used in life insurance where the probability of surviving to a particular age depends on
how long one has already lived, our approach to client retention involves examining conditional probabilities.2
These are interpreted as the probability that an advisor will retain a client in a given month, conditional on the
client having stayed with their advisor up to the previous month. In plain language, conditional probabilities
answer the question: “What is the likelihood that I will keep a client for 24 months, given than I’ve already kept
their business for the last 23 months?”
Our analysis indicates that the conditional probability of retention at first decreases only slowly. The probability
of a retaining a client in the first year is high (0.95 at 12 months). There is a ‘honeymoon’ period in wealth manage-
ment advisor/client relationships! The probability of retention decreases between 12 and 48 months – from 0.95
to 0.74. It appears that it is during this time clients determine whether the advisor relationship meets their needs,
and if not, they decide to leave. Around the 48-month mark, retention tends to stabilize, with the probability of
retention decreasing from 0.74 at 48 months to 0.70 at 60 months (see Exhibit 4).3 This suggests that clients who
have remained with their advisor for five years have by this time elected to remain for the long term.
In working to retain (and grow) their business with their clients, advisors should keep these different stages
of the client relationship in mind, and redouble efforts to demonstrate the value they provide during the critical
first-year to fourth-year time period. The data indicate that it is during this time period that clients make the
decision to leave or stay for the long term.
2 These conditional probabilities are one of the outputs from a type of time series analysis known as a discrete time logit model.
3 This analysis was conducted separately with all households and also using only new households (those who began a relationship with their advisor during the time period under study). The differences between the two analyses were negligible, so the results from all households are reported here.
Exhibit 4: Probability of Retention over Time
0.8
1.0
0.9
0.7
0.60
Conditional Probability of
Retention
Duration of Client Relationship (Months)
6 12 18 24 30 36 42 48 54 60
0.95
0.88
0.80
0.74
0.70

7www.pricemetrix.com/Insights
greater houSehold aSSetS mean hIgher lIkelIhood oF retentIon
PriceMetrix research has previously found that small households (those with less than $250,000 in assets) slow
an advisor’s growth rate, and impede their ability to attract high net worth households.4 We also find here that
small households are significantly less likely to stay with their advisor.
Since clients may be drawing down assets as a relationship nears its end, we use median assets over the time
period under study (2009-2013) in order to obtain a representative measure of client assets.
The data reveal that, as household assets increase, the probability of retention increases. Households with
less than $250,000 in assets are notably less likely to remain with their financial advisor than those with greater
assets. To illustrate, in any given year, a household with $100,000 in assets has a probability of retention of 0.87.
A household with $500,000 in assets has a probability of retention of 0.94, while the probability of retention of
a household with $1 million in assets is not substantially larger at 0.95 (see Exhibit 5). The implication, then,
is that business development aimed at larger households will yield better results over time, as they will require
less replenishment.
In addition to the client-level relationship between retention and assets, there is a further book-level dynamic
with lower retention for advisors with larger proportions of their client base comprised of small households.
For example, an advisor with 10 percent of his or her clients having less than $250,000 in investable assets is
expected to have an annual retention rate of 97 percent; an advisor with 90 percent of his or her clients having
less than $250,000 in investable assets is expected to have an annual retention rate of 91 percent.
Exhibit 5: Retention and Household Assets
0.90
1.00
0.95
0.85
0.80$0
Probability of Retention5
Household Assets ($000s)
$250 $500 $750 $1,000 $1,250 $1,500 $1,750 $2,000
4 “Moneyball for Advisors,” PriceMetrix Insights White Paper, October 2012; “Big Fish: The Behaviors and Characteristics of the High Net Worth Client,” PriceMetrix Insights White Paper, May 2013.
5 The time series analysis underpinning these results models retention and attrition in a specific month. To make interpretation easier, results are presented as the probability of retention in a given 12-month (one-year) time period.

8 PriceMetrix Insights – Stay or Stray
It is important to note that this book-level phenomenon is driven partly (but not entirely) by small households’
lower propensity to stay with their advisors. Retention among large clients (those with $250,000 in assets or
more) is lower in books with a substantial proportion of small clients. For example, an advisor with 20 percent
of his or her clients having less than $250,000 in investable assets is expected to have an annual large-client
retention rate of 97 percent; an advisor with 80 percent of his or her clients having less than $250,000
in investable assets is expected to have an annual retention rate of 94 percent (see Exhibit 6).
Advisors should therefore be mindful of the time and resources they devote to small clients given their reduced
likelihood of staying. More importantly, advisors should recognize the often imperceptible damage that small
clients can cause to relationships with larger clients.
Exhibit 6: Book-Level Retention and Client Mix
90%
100%
95%
85%20% 40% 60% 80%
Retention Rate,2012 (%)
Overall
96%97%
95%96%
93%
95%
92%
94%
< $250,000 Households (% of Book)
$250,00+ Households

9www.pricemetrix.com/Insights
maIntaIn hIgh clIent retentIon through optImal prIcIng
Taking the median for RoA over the time period analyzed, we see that households that are priced relatively low
(for example, below 0.5 percent for overall RoA) or relatively high (above 2 percent for overall RoA) are less likely
to be retained than those in the range of 1 to 1.5 percent. Retention is therefore highest in an optimal range
(neither too low nor too high) and lowest among low-priced and high-priced clients (see Exhibit 7).
These results suggest that advisors who price their services low may undercut client perceptions of value; those
who price high run the risk of creating an insurmountable service expectation. Both can make client retention
more challenging. At the same time, the middle “optimal” range we identify is quite broad, allowing for a number
of advisor business models and value propositions, and consequently different price levels.
Still, as those who are familiar with the wealth management industry know, household assets play a role in
determining RoA, and as shown above, assets also affect the probability of retention. To further understand
the interplay between client retention, pricing and assets, we examined the relationship between retention and
Exhibit 7: Retention and Revenue on Assets (RoA)
0.90
0.95
0.85
0.800.0%
Probability of Retention
RoA (%)
0.5% 1.0% 1.5% 2.0% 2.5%
pricing for different asset tiers. Parsing out the data in this way reveals that households with $250,000 or more
in assets are all quite similar in their retention behavior, and appear to be less price sensitive (the probability of
retention does not decrease steeply as RoA increases). Households with less than $250,000 are both less likely to
remain with the financial advisor and exhibit the most price sensitivity, with retention rates lower below 1 percent
and above 2 percent (see Exhibit 8).

10 PriceMetrix Insights – Stay or Stray
Exhibit 8: Retention and Revenue on Assets (RoA) by Assets (Median)
0.90
0.95
1.00
0.85
0.800.0%
Probability of Retention
0.5% 1.0% 1.5% 2.0% 2.5%
$550,000 to <$1M
<$250,000
$1M to <$5M
$250,000 to <$500,000
RoA (%)
What these results suggest is the concern advisors occasionally express about price sensitivity among their
clients, especially among their largest clients, may be overstated. For example, reducing one’s price for a client
with a $1 million or more in assets from 1 percent to 0.5 percent produces no discernible improvement in the
probability of retaining that client (it remains at 0.95). Reducing one’s price with the goal of holding on to client
business is therefore ineffective and costly.

11www.pricemetrix.com/Insights
hIgher retentIon among Fee-and-tranSactIonal clIentS
Our analysis also revealed important differences in the staying and leaving behaviors of clients who hold
transactional accounts only, fee accounts only, or who are hybrid clients (holding both transactional and fee
accounts). While transactional-only and fee-only households are similar in their probabilities of retention
(0.89 compared to 0.91), hybrid households exhibit the highest probability of retention at 0.95 (see Exhibit 9).
These results hold even when controlling for client assets.
Exhibit 9: Retention and Household Type
0.6
1.0
0.8
0.4
0.2
0.0Transactional Only Fee Only Hybrid
Probability of Retention
0.89 0.91 0.95
Exhibit 10: Retention and Revenue on Assets (RoA) by Household Type
0.9
1.0
0.8
0.70.0%
Probability of Retention
RoA (%)
0.5% 1.0% 1.5% 2.0% 2.5%
HybridFee onlyTransactional only
It is worth emphasizing that the client relationships least likely to be retained are low-priced fee-only
relationships. These are followed by high-priced transactional-only relationships. As suggested before, advisors
may be eroding perceptions of value through low pricing in the former case, while pricing themselves out of the
market in the latter. Irrespective of their price level, hybrid households remain more likely to stay with their
financial advisor (see Exhibit 10).
What these results indicate is that the industry-wide move toward fee and managed business should be
reassessed. In short, a strategy of moving to a hybrid model of transactional and fee-based business fares better
than a strictly fee-based model.

12 PriceMetrix Insights – Stay or Stray
deeper clIent relatIonShIpS, greater lIkelIhood oF retentIon
Our analysis also revealed – not surprisingly – that clients with deeper relationships with their advisor are more
likely to be retained; those with thinner relationships are less likely to be retained. Two primary measures of
relationship depth are the number of accounts held by a household with an advisor and the presence of
retirement accounts in the household. Our analysis finds that a single-account household has a probability of
retention of 0.86, a household with two accounts has probability of retention of 0.89. By contrast, a household
with five accounts has a probability of retention of 0.94.
Examining the presence or absence of retirement accounts in a household, we find little difference in the
probability of retention of households with no retirement account and those with a single retirement account
(0.85 vs. 0.86). Households with two or more retirement accounts, however, are significantly more likely to be
retained (0.94) (see Exhibit 12).
The counsel that flows from these results is both clear and simple: when advisors (often correctly) surmise that
they have only a share of a client’s investable assets, they should endeavor to increase their share, since doing so
improves the prospect of retaining that client.
Exhibit 11: Retention and Number of Retirement Accounts
0.6
1.0
0.8
0.4
0.2
0.0No Retirement
Account1 Retirement
Account2 or More
Retirement Accounts
Probability of Retention
0.85 0.860.94
13www.pricemetrix.com/Insights
Exhibit 12: Retention and Client Age
0.85
0.95
0.90
0.80
0.7520
Conditional Probability of
Retention
Age (Years)
30 40 50 60 70
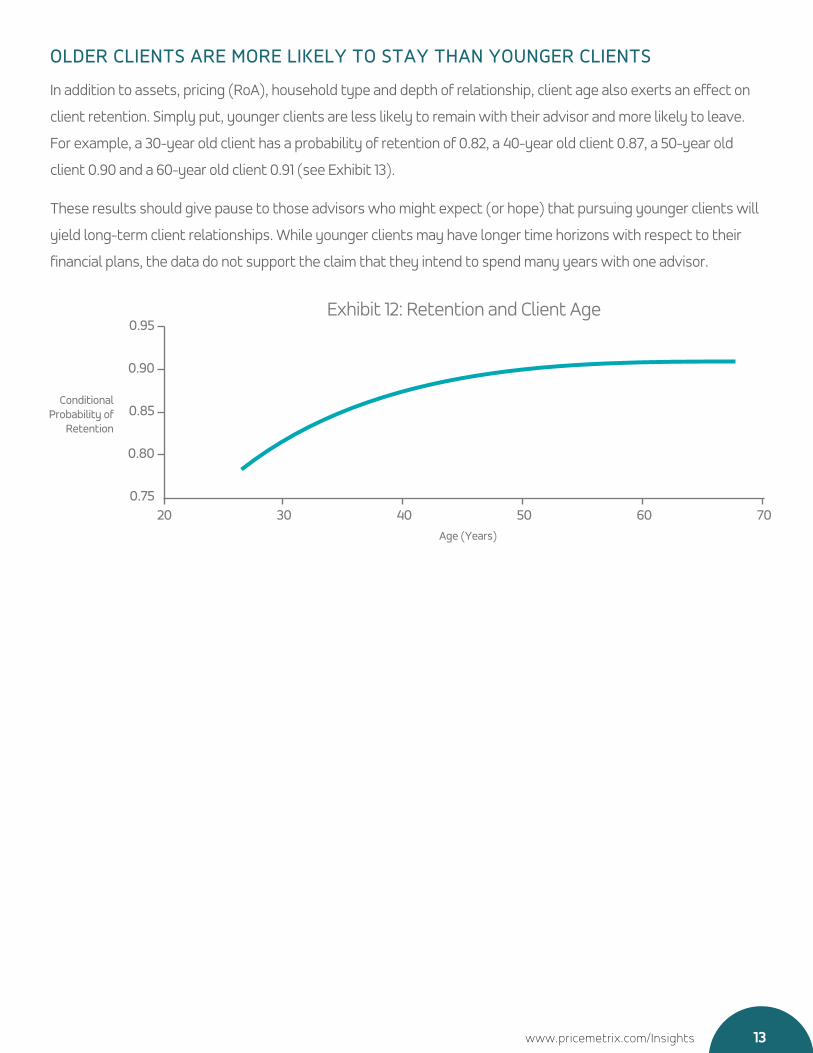
older clIentS are more lIkely to Stay than younger clIentS
In addition to assets, pricing (RoA), household type and depth of relationship, client age also exerts an effect on
client retention. Simply put, younger clients are less likely to remain with their advisor and more likely to leave.
For example, a 30-year old client has a probability of retention of 0.82, a 40-year old client 0.87, a 50-year old
client 0.90 and a 60-year old client 0.91 (see Exhibit 13).
These results should give pause to those advisors who might expect (or hope) that pursuing younger clients will
yield long-term client relationships. While younger clients may have longer time horizons with respect to their
financial plans, the data do not support the claim that they intend to spend many years with one advisor.

14
clIent retentIon and the SucceSSFul advISor
There are few characteristics of advisor books that are more important and less understood than client
retention. Our analysis began with the observation that advisors with higher client retention rates grow their
assets and revenue faster. These are compelling reasons for developing – and executing – a retention strategy.
Such a strategy should take into account the key findings from this study.
1. Thelikelihoodofretentionvariesacrosstime:differentstagesoftheclientrelationshiparemoreattrition-prone
thanothers.Thoughadvisorsmayhaveannualcheck-inswiththeirclients,ouranalysissuggeststhat
relationshipsinthesecond,thirdandfourthyearsshouldbecriticallylookedatandmanaged,asitisduringthis
periodthattheprobabilityofretentionexperiencesitssharpestdecline.
2. Bothsmallclientsandyoungerclientsaresignificantlylesslikelytostay.Advisorsshouldthereforerecognize
thereducedlikelihoodofholdingontothebusinessoftheseclients,criticallyevaluatetheimportanceofsuch
relationships,andmakeaconsciousdecisionaboutthetimeandresourcesthatoughttobedevotedtothem.
3. Notonlyaresmallclientslesslikelytostaywiththeiradvisors,butbookswithanexcessofsmallclientshave
lowerretentionamongtheirlargerhouseholds.Advisorsshouldthusalsorecognizethattimeandresourcesput
intosmallclientsmayhavenegativeconsequencesforwhattheyareabletodofortheirlargeclients(andmay
bearonone’slargeclients’decisionstostayorleave).
4. Whileretentionishigheramongclientswithfeeandmanagedaccountscomparedtotransactionalaccounts,
itisclientswithbothtypesofaccountswhohavethehighestlikelihoodofbeingretained.Thissomewhat
counterintuitivelysuggeststhatadvisorswhoaimtoholdontotheirclients’businessarebetterservedby
transitioningonlysome–andnotall–oftheirbusinesstoafee-basedmodel.

15
5. Wealsofindareducedlikelihoodofretainingverylow-pricedandveryhigh-pricedclients,butrelativelylittle
differenceintheprobabilityofretentionacrossabroadmiddlerange.Thissuggeststhatarangeofpricescan
existsimultaneouslyinthemarket,anditalsopointstotheneedtobuildandexecuteapricingstrategytoensure
thatone’spricingandvaluepropositionarealignedandconsistentlyadministered.Advisorsshouldknowtheir
businessmodel,howtheirpricingissupportedbytheirvalueproposition(andinformedbymarketdata),and
communicatethevaluetheyprovidetotheirclients.
6. Deeperclientrelationshipsimplyahigherlikelihoodofclientretention.Whereadvisorsknowtheyhaveonlypart
oftheshareofinvestableassetsinahousehold–forexample,onlyonespouse,oronlynon-retirementaccounts
–theyshouldworktodeepenthoserelationships.Thismayworkintandemwitheffortstotransition
transactionalbusinesstoafee-basedmodel(ortoaddfeeaccountstoexistingtransactionalbusiness).
Finally, it is worth noting that while this Insights report has focused on the client and advisor characteristics
that shape the likelihood of clients staying or leaving, it does not address the question of client behaviors and
circumstances i.e., ‘events’.
Key questions left outstanding are: what types of client behaviors or events are predictive of a client leaving and
can serve as early warning signs of client attrition? How can advisors identify clients at risk of leaving, allowing
them to attempt to retain those they want? We plan to address these questions in a future piece of research.

®
The analysis in this edition of Insights is made
possible by our aggregated market data and is the
resultofacollaborativeeffortbyPatrickKennedy,Vice
President, Product and Client Services, Tim Gravelle,
Principal Scientist and Director, Insights Lab, and
MathewDuffy,ClientManager.
This document and all of the components and content thereof (the “Research”) are
proprietary to PriceMetrix Inc. and subject to copyright and other intellectual property
protections. All external or commercial citations of the Research are prohibited without our
express written permission. Contact Amrita Mathur, Director, Marketing at PriceMetrix at
416-955-0514orsendanemail [email protected] forany
desiredcitations.PriceMetrixreservesanyandallrightstotheResearchincludingbutnotlimited
totherighttodenyanyandallusesoftheResearch.TheResearchisprovidedonlyasinformation
to readers. By making the Research available, PriceMetrix is not engaged in rendering any
commercial consulting advice or services to the reader. All information and content of the
ResearchisprovidedwithoutwarrantyofanykindandPriceMetrixassumesnoliabilityforany
relianceinmakingdecisionsthereon.