pv integration on australian distribution...
TRANSCRIPT

PV INTEGRATION ON AUSTRALIAN DISTRIBUTION NETWORKS Literature Review
By
The Australian PV Association
September 2013
Author: Ben Noone, Centre for Energy and Environmental Markets, University
of NSW

ACKNOWLEDGEMENTS
The Australian PV Association (APVA) and Centre for Energy and Environmental Markets (CEEM) at
University of New South Wales (UNSW) would like to acknowledge the financial support of the
Australian Renewable Energy Agency (ARENA), formerly the Australian Solar Institute (ASI), which
has provided the funding for Australia to participate in the International Energy Agency PV Power
Systems Programme Task 14 under which this review was undertaken. The overall project is entitled:
“Australian Participation in an International RD&D Collaboration on Photovoltaics – IEA PVPS Task
14: High Penetration of Photovoltaic Systems in Electricity Grids”.
The author also acknowledges the invaluable advice and input of the following individuals on
compiling this document:
Anna Bruce – SPREE, University of NSW
Iain MacGill – CEEM, University of NSW
Michelle Taylor – Ergon Energy
Muriel Watt – APVA
Simon Lewis – Endeavour Energy
Ted Spooner – School of Electrical Engineering, University of NSW
About the Australian PV Association
The APVA is an association of companies, agencies, individuals and academics with an interest in
photovoltaic solar electricity research, technology, manufacturing, systems, policies, programmes
and projects. Our aim is:
to support the increased development and use of PV through targeted research, analyses and
information sharing
Our work is intended to be apolitical and of use not only to our members but also to the general
community. We focus on data analyses, independent and balanced information and collaborative
research, both nationally and internationally.
Our reports, media releases and submissions can be found at: www.apva.org.au
COPYRIGHT This report is copyright of the Australian PV Association. The information contained
therein may freely be used but all such use should cite the source as “Noone, B., 2013, PV
Integration on Australian distribution networks: Literature review, Australian PV Association”.
1
Table of Contents
1 Introduction .................................................................................................................... 4
2 Overview of distribution network service providers ......................................................... 5
3 Installed capacity of PV in Australia ............................................................................... 8
3.1 Small-scale PV ....................................................................................................... 8
3.2 Large-scale PV ..................................................................................................... 12
4 Australian standards .................................................................................................... 13
4.1 Current AS4777 – 2005 ........................................................................................ 13
4.1.1 Inverter requirements ..................................................................................... 13
4.1.2 Grid protection requirements .......................................................................... 13
4.2 New AS4777 ......................................................................................................... 14
4.2.1 Inverter set points .......................................................................................... 14
4.2.2 Voltage drop .................................................................................................. 15
4.2.3 Limits for sustained operation ........................................................................ 15
4.2.4 Power factor .................................................................................................. 16
4.2.5 Inverter power quality response modes .......................................................... 16
4.2.6 Demand response ......................................................................................... 16
4.3 AS61000.3.100 – Steady-state voltages ............................................................... 17
4.4 AS3000 – Wiring rules .......................................................................................... 18
4.5 AS4577 – Demand response capabilities .............................................................. 19
5 State-based standards for power quality ...................................................................... 20
5.1 Voltage ................................................................................................................. 20
5.2 Frequency ............................................................................................................. 20
5.3 Additional Requirements ....................................................................................... 21
6 Utility guidelines for PV connection .............................................................................. 23
7 Utility submissions and presentations on PV impacts ................................................... 26
7.1 Impact on peak demand ....................................................................................... 26
7.2 Technical challenges ............................................................................................ 30
7.3 Management strategies ........................................................................................ 32
7.4 Metering ................................................................................................................ 33
8 References .................................................................................................................. 35

2
Figures
Figure 1 Electricity network areas in the National Electricity Market (AER, 2012) .................. 5
Figure 2 DNSP average customer density ............................................................................ 7
Figure 3 Percentage of PV customers for each Australian state and territory ........................ 9
Figure 4 Monthly applications for PV connections observed by Wester Power .................... 11
Figure 5 Voltage drop provisions specified in draft AS4777.1 of 2013 (Taylor, 2013) .......... 15
Figure 6 Voltage operating zone specified by AS 61000.3.100 ........................................... 18
Figure 7 Allowable supply voltage fluctuations on the Ausgrid network ............................... 20
Figure 8 Theoretical solar output compared to substation demand (Endeavour Energy, 2011)
........................................................................................................................................... 27
Figure 9 Plot of estimated solar impact on Western Power Canningvale substation in 2011 30
Figure 10 Ausgrid voltage study of 10 kW PV system connected to single phase, before and
after line upgrade ................................................................................................................ 31
Figure 11 Voltage heat map produced for Smart Grid Smart City (Ausgrid, 2012b) ............. 31
Figure 12 Visual representation of capacity credit incentive for PV (Horizon Power, 2012a) 32
Figure 13 Cross-subsidy as a result of PV net metering ...................................................... 34
3
Tables
Table 1 Key statistics for Australian distribution network service providers ........................... 6
Table 2 Small-scale PV generation (less than 100 kW) in Australia in June 2013 ................. 8
Table 3 Indicative maximum PV contribution for NEM regions and SWIS ........................... 10
Table 4 PV installed capacity by DNSP ............................................................................... 10
Table 5 Number of Victorian PV customers and installed capacity (DPI, 2013) ................... 11
Table 6 Large-scale PV capacity per DNSP ........................................................................ 12
Table 7 Inverter set-point requirements AS4777 ................................................................. 14
Table 8 Demand response modes for inverter performance ................................................ 16
Table 9 Voltage requirements under AS 60038 and AS 61000.3.100 .................................. 18
Table 10 Mainland frequency operating standards in the NEM ........................................... 21
Table 11 Voltage and frequency requirements for Australian states and territories ............. 22
Table 12 Summary of PV system connection guidelines ..................................................... 24
Table 13 Estimated solar impact on Ausgrid network summer peaks for summer 2010/11 . 27
Table 14 Projects of solar peak reduction impact on the Western Power network ............... 28
Table 15 Solar impact on summer peak 2011 at top five Ausgrid zone substations ............ 28
Table 16 Solar impact on summer peak 2011 at top five Ausgrid 11 kV feeders ................. 29
Table 17 Estimated solar impact on Western Power Canningvale substation in 2011 ......... 29

4
1 Introduction
In recent years there has been unprecedented growth in the Australian photovoltaic (PV)
market, particularly in the deployment of residential grid-connected systems. As a result,
situations of high-penetration PV, where additional efforts by Australian Network Service
Providers may be necessary to integrate PV generation in an appropriate manner, are
becoming increasingly common. This phenomenon presents both challenges and
opportunities for such network businesses, broader electricity industry stakeholders and
government policymakers.
The Australian Photovoltaic Association (APVA) was engaged by the Australian Solar
Institute, now the Australian Renewable Energy Agency (ARENA) to investigate the
associated impacts and contribute to Task 14 of the International Energy Agency’s
Photovoltaic Power Systems programme (IEA PVPS): High PV Penetration in Electricity
Grid. The University of NSW is leading this project for the APVA, with involvement from
CSIRO, other APVA Members and utilities.
The Centre for Energy and Environmental Markets (CEEM) and the School of Photovoltaics
and Renewable Energy Engineering (SPREE) (both of the University of NSW) conducted a
survey of electricity distribution network service providers (DNSPs) across Australia. The
survey focused on experiences with, and strategies for, dealing with high penetrations of
solar PV. It was part of an international survey being undertaken by other countries
participating in PVPS Task 14 and the findings will be published in a separate report.
This document served as the background document for the survey. A literature review was
conducted of the publically-available information concerning PV integration on Australian
distribution networks. Sections 2 and 3 provide an overview of electricity distribution in
Australia, and the amount of PV that is currently installed. Sections 4, 5 and 6 respectively
review the Australian standards, state-based regulations, and DNSP policies that apply to
the connection of PV systems. Section 7 reviews a range of submissions and presentations
that have been made by DNSPs to government enquiries and at industry conferences.

5
2 Overview of distribution network service providers
There are a total of sixteen distribution network service providers (DNSPs) in Australia.
Thirteen companies supply customers in the National Electricity Market (NEM) that covers
the eastern states, South Australia, and Tasmania. These are represented in Figure 1 (AER,
2012)
Figure 1 Electricity network areas in the National Electricity Market (AER, 2012)

6
The Victoria and South Australian DNSPs are privately owned and operated while all others
are still State government-owned corporations. The ACT utility is a public-private
partnership.
Table 1 provides some key statistics on the DNSPs.
Table 1 Key statistics for Australian distribution network service providers
State Company Ownership Number of customers
Km Line RAB (2011 $m)
Maximum demand (MW)
2010-11
ACT ActewAGL 50/50 168,937 4,922 635 701
NSW AusGrid Government 1,619,988 49,781 8,965 5,812
NSW Endeavour Government 877,340 34,172 3,925 4,069
NSW Essential Energy
Government 1,301,626 190,531 4,595 2,292
NT Power and Water Corporation
Government
85,000 7,959 2,200 353
QLD Energex Government 1,316,295 53,928 8,120 4,875
QLD Ergon Government 689,277 160,998 7,380 2,429
SA SA Power Networks
Private 825,218 87,226 2,860 1,798
TAS Aurora Government 275,536 25,844 1,410 1,760
VIC Citipower Private 311,590 7,406 1,315 1,453
VIC Jemena Private 314,734 6,043 770 1,008
VIC SPAusNet Private 637,810 48,841 2,120 1,798
VIC Powercor Private 723,094 84,791 2,260 2,351
VIC United Energy Private 641,130 12,875 1,410 1,962
WA Western Power Government 1,018,275 90,014 6,991 4,068
WA Horizon Power Government 109,000 7,299 1,200 -
Notes:
1. All NEM data from Australian Energy Regulator. State of the energy market 2012, http://www.aer.gov.au/node/18959
2. RAB = Regulated Asset Base, as defined at the beginning of the regulatory period as: New RAB = Previous RAB – depreciation + capital expenditure from previous regulatory period.
3. WA and NT data from Annual Reports of respective utilities. Power and Water asset base includes water, sewage and electricity infrastructure. NT demand data from Utilities Commission Power System Review 2010-11, aggregate of Darwin-Katherine, Alice Springs and Tennant Creek systems (not necessarily coincident).

7
As evidenced by the map in Figure 2, the service areas of the utilities vary dramatically. This
can also be represented by comparing the average customer density of these companies.
This is the number of customers divided by the total kilometres of distribution lines. Using
this metric, there is more than an order of magnitude variation between the highest and
lowest average customer density.
Figure 2 DNSP average customer density

8
3 Installed capacity of PV in Australia
3.1 Small-scale PV
AEMO publishes information about the current installed capacity of PV, and projections for
installed capacity and energy output (AEMO, 2012). In 2011 it was found that the number of
systems recorded by DSNPs was less than the number indicated by the Clean Energy
Regulator (CER). This was attributed to missing data, and variations in data collection
methodology (e.g. specifying inverter capacity instead of panel capacity).
The CER dataset is the most complete source of publically available data on PV
installations. The dataset covers systems that are eligible for the SRES, which are currently
those of less than 100kW. There can be up to a year of lag between PV systems being
installed and appearing on this list. This data is used in Table 2 below.
Table 2 Small-scale PV generation (less than 100 kW) in Australia in June 2013
State
Total installations (June 2013)
Rated capacity in
MW Customers
% of customers
with PV
ACT 12,326 31 168,937 7.3%
NSW 234,118 560 3,798,954 6.2%
NT 2,222 8 85,000 2.6%
QLD 322,497 864 2,005,572 16.1%
SA 143,863 357 825,218 17.4%
TAS 15,128 32 275,536 5.5%
VIC 184,880 419 2,628,358 7.0%
WA 139,122 309 1,127,275 12.3%
TOTAL 1,054,156 2,579 10,914,850 -
Data source:
1. Total PV installation and system size data from Clean Energy Regulator, current as of June 2013 2. Number of customers from Australian Energy Regulator. State of the energy market 2012, http://www.aer.gov.au/node/18959 3. The indicative MW of PV value is the value for that state or territory scaled for the number of customers of each utility

9
The percentage of customers that have a PV system is highest in Queensland and South
Australia.
Figure 3 Percentage of PV customers for each Australian state and territory
Table 3 compares the installed capacity of household PV to the average summer and winter
demand for each NEM region and the SWIS. The maximum PV percentages are indicative
estimates of the maximum PV contribution to demand based on current demand and PV
data. It is assumed that, collectively, output of the PV systems will be 80% of their rated
capacity in summer and 60% in winter.

10
Table 3 Indicative maximum PV contribution for NEM regions and SWIS
The following DNSPs have indicated the amount of PV that is connected to their network
(Ausgrid, 2012a; Endeavour Energy, 2011; Energex, 2012b; Ergon Energy, 2012; Western
Power, 2012a):
Table 4 PV installed capacity by DNSP
Utility PV installed (MW) Date
Ausgrid 124 June 2012
Energex 569 Dec 2012
Endeavour 105 Sept 2011
Ergon 188 Sept 2012
Western Power 206 (Approx.) Dec 2011
Owing to the rapid growth in the industry, it is highly likely that even very recent figures are
already out of date. The rate of new installations has fluctuating dramatically in response to
changes in the incentives offered by the state governments, most of which have now been
dramatically reduced. Figure 4 is an example from Western Power (Western Power, 2012a) :

11
Figure 4 Monthly applications for PV connections observed by Wester Power
The Victorian Department of Primary Industries (DPI) reports on the amount of PV capacity
that has been installed under the Premium feed-in tariff (NSW Government, 2012). This
accounts for 175 MW of the total 419 MW that is believed to be installed in the state as of
March 2013. Based on the amount of PV that was installed under this scheme, an estimate
can be made of the capacity of PV that is installed in each distribution area as of March 2013
(see Table 5).
Table 5 Number of Victorian PV customers and installed capacity (DPI, 2013)
DNSP
Number of
Premium FiT
customers
Premium FiT
installed
capacity (MW)
Percentage of
capacity
Indicative PV
installed in June
2013 (MW)
SP Ausnet 29,771 60 34.3% 144
Jemena 8,029 16 8.9% 37
Powercor 29,436 51 34.7% 145
Citipower 3,533 6 3.5% 15
United Energy 17,479 33 18.7% 78
TOTAL 88,248 175
It is notable that approximately 70 % of PV capacity in Victoria is connected in the SP
Ausnet and Powercor distribution areas.

12
3.2 Large-scale PV
Table 6 uses information from the CER list of LRET accredited power stations and the
SunWiz list of Large PV systems (Sunwiz, 2013). A DNSP has been assigned based on the
physical location of each system.
Table 6 Large-scale PV capacity per DNSP
These figures are much smaller than the amount of small-scale PV. Also the impact of these
generators of the network is expected to be less owing to the additional planning and formal
network connection process that would occur for a system of this size.

13
4 Australian standards
The relevant standards that are considered here are AS4777 for Grid connection of energy
systems via inverters, the AS61000.3.100 standard for Steady-state voltage limits in public
electricity systems, and AS3000, the Wiring Rules. AS4777 is being revised, with a draft
released for public comment on 28 June 2013.
4.1 Current AS4777 – 2005
The existing AS4777 standard is divided into three parts; parts two and three concerning
inverter requirements and grid protection requirements respectively are of most relevance for
this review. These standards apply to inverters with a rating of up to 10kVA per phase
(although they can be used as guidance for larger systems). The key requirements from the
2005 version of AS4777 are summarised in the following sections.
4.1.1 Inverter requirements
AC voltage and frequency ratings to be compatible with AS 60038 (now replaced
by AS 61000.3.100). This is a nominal voltage of 230 V at the point of supply in
single phase line-to-neutral and 400 V in three phase line-to-line with a tolerance
of +10% -6% and a frequency of 50 Hz.
Power factor to be in the range from 0.8 leading to 0.95 lagging for all output from
20% to 100% of rated output. However, the electricity distributor can allow power
factor outside this range for the purpose of providing voltage support.
Total harmonic distortion (THD) (to the 50th harmonic) shall be less than 5%.
The inverter shall conform to the voltage fluctuation and flicker limits as per
AS/NZS 61000.3.3 for equipment rated less than or equal to 16 A per phase and
AS/NZS 61000.3.5 for equipment rated greater than 16 A per phase.
The inverter shall withstand a standard lightning impulse of 0.5 J, 5 kV with a
1.2/50 waveform. Compliance shall be determined by type testing in accordance
with the impulse voltage withstand test of IEC 60255-5.
The DC output current of the inverter at the AC terminals shall not exceed 0.5%
of its rated output current or 5 mA, whichever is the greater.
Any electronic data logging or communications equipment incorporated in the
inverter should comply with the appropriate requirements of AS/NZS 60950.1.
4.1.2 Grid protection requirements
The grid protection device shall operate if supply from the grid is disrupted, when
grid voltage or frequency goes outside preset parameters, or to prevent islanding.
Under/over voltage and frequency requirements are passive anti-islanding
protection. The inverter set-points should be in the range of fmin = 45-50 Hz,
fmax = 50-55 Hz, Vmin = 200-230 V, and Vmax = 230-270 V for a single phase
system.
The grid protection device shall incorporate at least one method of active anti-
islanding protection. This is required to prevent islanding occurring in a situation
where multiple inverters provide a frequency and voltage reference for one
another, causing the passive anti-islanding protection to fail.

14
Reconnection is permitted when voltage and frequency are in the acceptable
range for at least 1 minute and the inverter energy system and the electricity
distribution network are synchronized and in-phase with each other.
4.2 New AS4777
For the new version of AS4777, parts two and three of the old standard have been
combined.
The key changes that have been made between the new and the old standard are:
The standard now applies for a system size of up to 54 kVA1 (75 A), with a limit of
5 kVA for a single phase unit, (whereas previously the standard applied to 3
phase systems up to 30 kVA, or 10 kVA per phase).
Systems > 5 kVA to have three phase connections
The voltage drop between the inverter and the main switch board is to be less
than 1%, and the voltage drop between the main switch board and the distributor
point of supply is to be less than 1%
Inclusion of balance requirement in multiple phase systems. In a three phase
system the imbalance between the phases must be no more than 20A or 2% of
voltage. If these limits are exceeded, the inverter must disconnect.
Revised inverter set points and limits to match electricity distributor requirements
Inclusion of demand response modes
New parameters for power factor and limits for sustained operation
4.2.1 Inverter set points
The following voltage and frequency set points are for passive anti-islanding protection.
Table 7 they are compared with the range that was used in the 2005 standard:
Table 7 Inverter set-point requirements AS4777
Set-point Old AS 4777 (range) Proposed AS4777 inverter
integrated protection
Proposed AS4777: in
addition to inverter
integrated protection for
systems >30 kVA
Vmin 200 – 230 V 180 V 180 V
Vmax 230 – 270 V 265 V 260 V
fmin 45 – 50 Hz 47 Hz 47.5 Hz
fmax 50 – 55 Hz 52 Hz 52 Hz
1 54kVA is the apparent power (S) supplied to a three phase inverter with voltage 415V and current
75A. S = √ x IV = 53.91 kVA

15
There is the potential that the disconnection time will be shorter than the original 2 seconds.
Comment is being sought.
It is also noted that additional protection and control approaches may be required by the
distributor in isolated electricity distribution networks.
4.2.2 Voltage drop
The voltage drop / rise between the inverter and the main switch board is to be less than 1%,
and the voltage drop / rise between the main switch board and the distributor point of supply
is to be less than 1%. This is depicted in Figure 5 (Taylor, 2013).
Figure 5 Voltage drop provisions specified in draft AS4777.1 of 2013 (Taylor, 2013)
It is noted in the draft that the voltage drop allowed under AS/NZS 3000 between the inverter
and the customer point of supply is currently 5%, but under such conditions, inverter tripping
on under/over voltage may be excessive for some installations. Within the 5% window, the
voltage at the inverter can move outside the AS4777 voltage set points, while the voltage at
the point of supply remains within distributor’s regulatory limits.
4.2.3 Limits for sustained operation
The inverter must disconnect within 3 seconds when the average voltage for a 10 minute
period exceeds the maximum nominal operating voltage. This voltage is to be in the range of
244 to 258 V. The default set-point is 255 V for Australia, and 246 V for New Zealand.
The inverter shall operate normally between 47 Hz and 50.2 Hz. If grid frequency exceeds
50.2 Hz, the inverter current shall reduce until 51.5Hz is reached at which point inverter
current must stop. The current can be increased when grid frequency has decreased to
50.05 or less.

16
4.2.4 Power factor
The displacement power factor of the inverter should be set to operate at unity power factor,
but should be adjustable and must be in the range of:
0.95 leading to 0.95 lagging for inverters with rated nominal output currents up to
20 A per phase or;
0.90 leading to 0.90 lagging for inverters with rated nominal currents greater than
20 A per phase.
This is applicable for current output from 20% to 100% of rated nominal output current.
Wider power factor operation may be required via demand response modes as described
below.
4.2.5 Inverter power quality response modes
Additionally, the inverter can play a role in maintaining the power quality at the point of
connection through:
Volt-Watt Response
Volt-VAr Response
Fixed power factor or reactive power
Power rate limit
In terms of power rate limit, the inverter should have the capability to limit the increase in
power export to 10% of nominal rated capacity per minute. If the inverter has storage
capabilities, it should also be able to limit the decrease in power export by 10% per minute.
4.2.6 Demand response
The inverter shall support the demand response modes DRM0 and DRM5 to be controllable
by the distributor, as described in Table 8. The other demand response modes should be
supported.
Table 8 Demand response modes for inverter performance
Mode Requirement
DRM0 Operate the disconnection device
DRM1 Do not consume energy from the grid
DRM2 Do not consume at more than 50% of rated
power
DRM3 Do not consume at more than 75% of rated
power AND Export reactive power if capable

17
DRM4 Increase power consumption
(subject to constraints from other active DRMs)
DRM5 Do not export energy to the grid
DRM6 Do not export at more than 50% of rated power
DRM7 Do not export at more than 75% of rated power
AND
Consume reactive power if capable
DRM8 Increase power export
(subject to constraints from other active DRMs)
There is in additional provision in the reconnection requirements that reconnection cannot
occur while the DRM0 mode is still active.
A new standard AS 4755.3.5 will provide more details about demand response
requirements.
4.3 AS61000.3.100 – Steady-state voltages
This standard defines the steady-state voltage limits in public electricity systems. It is a
method of measuring the compliance of the supplied voltage at the point of supply. The new
standard sets a nominal voltage of 230 V, whereas previously this was 240 V. It defines both
an allowable operating range, and a preferred operating range. The preferred operating
range is +6% to –2%, however the allowable voltage variation at the point of supply of +10%
and –6%. The preferred operating range represents the 50 percentile value of voltage while
the upper and lower limits are the 99 and 1 percentile values respectively. This is
represented both numerically and graphically below.
In Table 9, the voltage specifications from AS61000.3.100 are compared to those from
AS60038 – Standard Voltages. The latter are standards used by equipment manufacturers
to ensure that the products they produce are compatible with the local power system.

18
Table 9 Voltage requirements under AS 60038 and AS 61000.3.100
Voltage AS 60038 AS 61000.3.100
Max allowable 253 V (99%)
Max preferred 253 V 244 V (50%)
Nominal 230 V 230 V
Min preferred 216.2 V 225 V (50%)
Min allowable 216 V (1%)
Figure 6 Voltage operating zone specified by AS 61000.3.100
In Figure 6, the red bars are a voltage distribution for a site that complies with the preferred
and allowable voltage conditions (Table 9). It is notable that there is not much flexibility for
accommodating voltage rise from solar inverters because high voltage levels already exist. It
is plausible that this could also be the case for DNSPs.
4.4 AS3000 – Wiring rules
The AS4777 standard is a normative reference of AS3000. Of most relevance in AS3000 is
section 3.6.2 that specifies that a voltage drop of no more than 5% is allowed between the
point of supply and any point in the electrical installation (e.g. an inverter).
AS 3000 does not specify a limit on voltage rise, but there is the potential for this to be
included in the future.
19
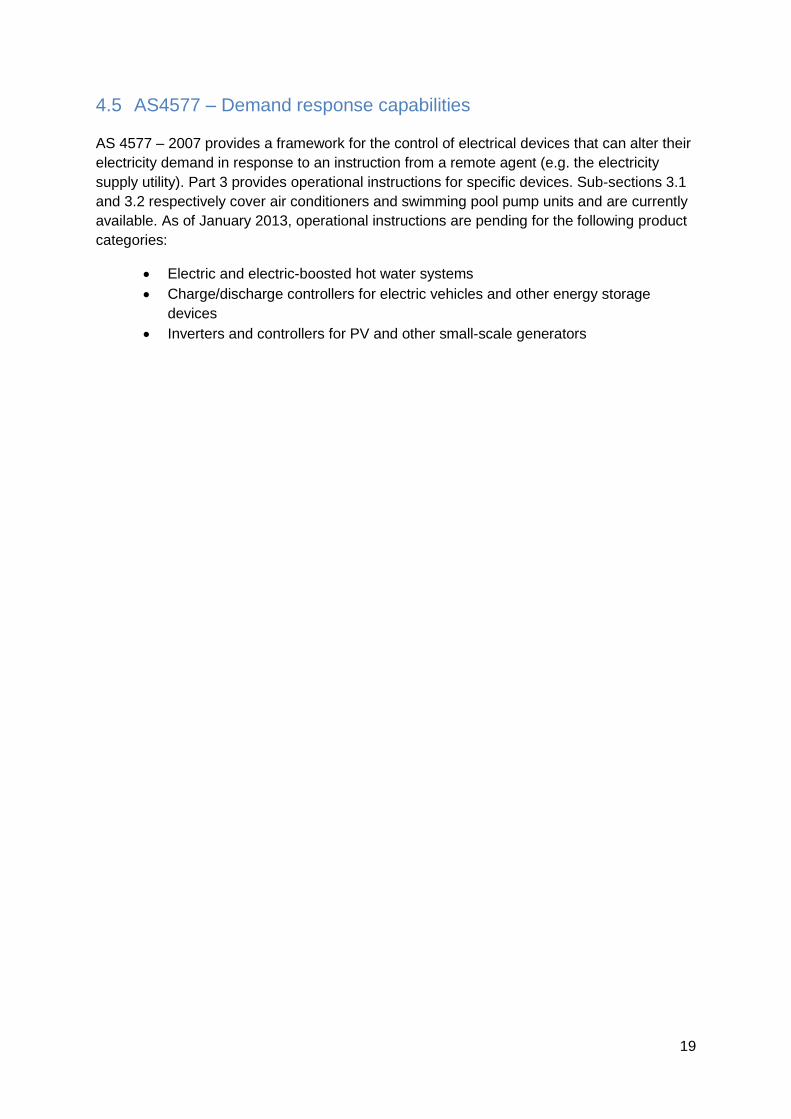
4.5 AS4577 – Demand response capabilities
AS 4577 – 2007 provides a framework for the control of electrical devices that can alter their
electricity demand in response to an instruction from a remote agent (e.g. the electricity
supply utility). Part 3 provides operational instructions for specific devices. Sub-sections 3.1
and 3.2 respectively cover air conditioners and swimming pool pump units and are currently
available. As of January 2013, operational instructions are pending for the following product
categories:
Electric and electric-boosted hot water systems
Charge/discharge controllers for electric vehicles and other energy storage
devices
Inverters and controllers for PV and other small-scale generators
20
5 State-based standards for power quality
5.1 Voltage
The standards for voltage that Australian distribution network service providers (DNSPs)
must comply with are determined individually by each state and territory. At the current time
there is a group of states that have adopted the new nominal voltage of 230 V +10% / -6%
(New South Wales, South Australia, Tasmania and Victoria) and a group that are yet to
change over and maintain a nominal voltage of 240 V +/-6% (ACT, NT, Queensland and
Western Australia). The Northern Territory has a nominal voltage of 230 V +10% / -2% and
is moving towards a standard voltage range of +/- 6% (Power and Water Corporation, 2008).
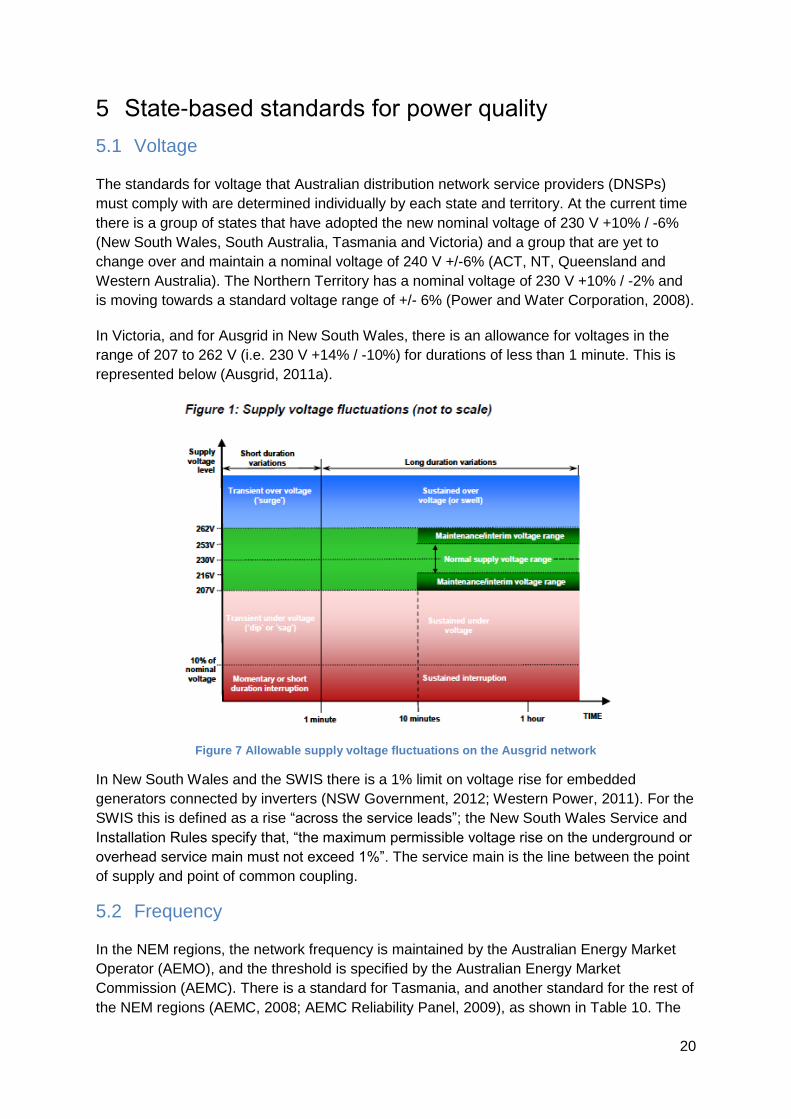
In Victoria, and for Ausgrid in New South Wales, there is an allowance for voltages in the
range of 207 to 262 V (i.e. 230 V +14% / -10%) for durations of less than 1 minute. This is
represented below (Ausgrid, 2011a).
Figure 7 Allowable supply voltage fluctuations on the Ausgrid network
In New South Wales and the SWIS there is a 1% limit on voltage rise for embedded
generators connected by inverters (NSW Government, 2012; Western Power, 2011). For the
SWIS this is defined as a rise “across the service leads”; the New South Wales Service and
Installation Rules specify that, “the maximum permissible voltage rise on the underground or
overhead service main must not exceed 1%”. The service main is the line between the point
of supply and point of common coupling.
5.2 Frequency
In the NEM regions, the network frequency is maintained by the Australian Energy Market
Operator (AEMO), and the threshold is specified by the Australian Energy Market
Commission (AEMC). There is a standard for Tasmania, and another standard for the rest of
the NEM regions (AEMC, 2008; AEMC Reliability Panel, 2009), as shown in Table 10. The
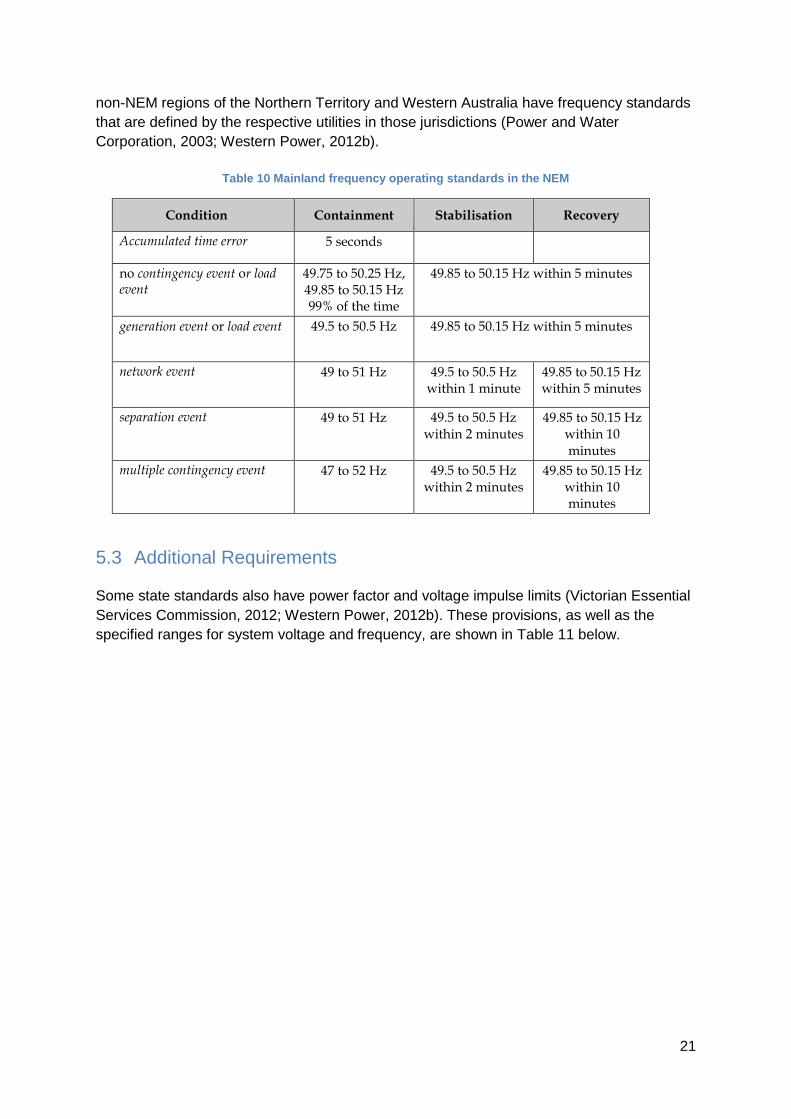
21
non-NEM regions of the Northern Territory and Western Australia have frequency standards
that are defined by the respective utilities in those jurisdictions (Power and Water
Corporation, 2003; Western Power, 2012b).
Table 10 Mainland frequency operating standards in the NEM
Condition
Containment
Stabilisation
Recovery
Accumulated time error 5 seconds
no contingency event or load event
49.75 to 50.25 Hz, 49.85 to 50.15 Hz 99% of the time
49.85 to 50.15 Hz within 5 minutes
generation event or load event 49.5 to 50.5 Hz 49.85 to 50.15 Hz within 5 minutes
network event 49 to 51 Hz 49.5 to 50.5 Hz within 1 minute
49.85 to 50.15 Hz within 5 minutes
separation event 49 to 51 Hz 49.5 to 50.5 Hz within 2 minutes
49.85 to 50.15 Hz within 10 minutes
multiple contingency event 47 to 52 Hz 49.5 to 50.5 Hz within 2 minutes
49.85 to 50.15 Hz within 10 minutes
5.3 Additional Requirements
Some state standards also have power factor and voltage impulse limits (Victorian Essential
Services Commission, 2012; Western Power, 2012b). These provisions, as well as the
specified ranges for system voltage and frequency, are shown in Table 11 below.

22
Table 11 Voltage and frequency requirements for Australian states and territories

23
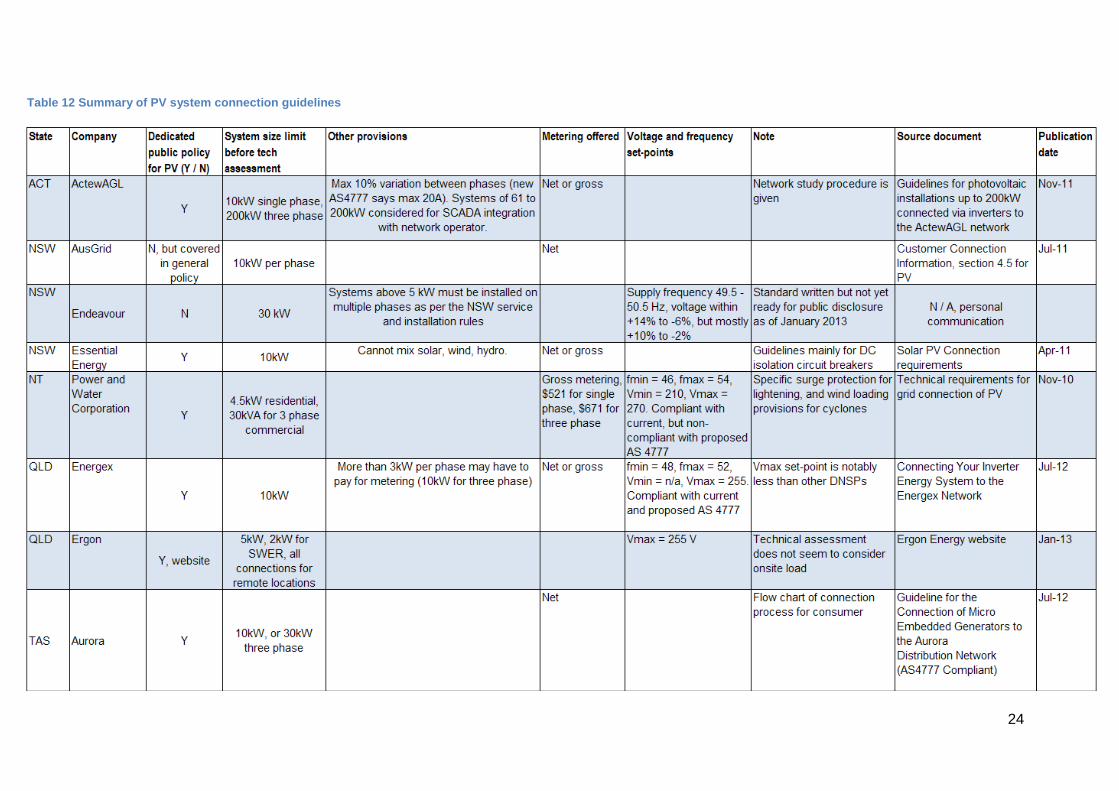
6 Utility guidelines for PV connection
Most DNSPs publish guidelines for customers (and in some cases installers) who intend to
connect solar PV systems to their network. The majority of the DNSPs have published a
dedicated document for small PV connections. A summary of these policies is given in Table
12.
The content of these policies varies significantly. One point of difference is the maximum
system size limit that is allowed. Power and Water, Ergon, SP AusNet and Western Power
specify limits in the vicinity of 3.5 to 5kW per phase for residential connections. Often it is
stated that for systems larger than this is a detailed “technical study” is required. ActewAGL
provides a table that outlines the scope of their network technical study; it involves checking
the loading level on the 11kV feeder, LV feeder, and distribution transformer; the fault level
and protection settings; and the nature of other distributed energy systems to assess risk of
unintentional islanding (ActewAGL, 2011).
Western Power states that loading limits apply on various levels of network infrastructure,
including a 30% limit on the LV feeder, and 20% on the zone substation transformer
(Western Power, 2012b). SA Power Networks states that such limits may be necessary in
the future to minimise the impact of “harmonic saturation” (SA Power Networks, 2012).
Five of the utilities specify voltage and frequency set-points for inverters that connect to their
networks. These set-points are mostly compliant with the current and proposed AS4777
standards. In some instances, PV systems over a specified size must install remote
monitoring capabilities (e.g. ActewAGL and SA Power Networks). This is to allow the DNSPs
to access real-time data for larger PV installations that could impact on the operation of the
network.
The Horizon Power guidelines contain provisions for PV output smoothing and “feed-in
management” that apply when the “hosting limit” of a particular location has been reached
(Horizon Power, 2012b). The utility also publishes a document (and has a search function on
their website) that indicates the current available hosting capacity in each location.
24
Table 12 Summary of PV system connection guidelines

25

26
7 Utility submissions and presentations on PV impacts
In order to better understand the efforts of DNSPs to manage growing PV penetrations,
relevant information has been collected from a range of submissions and presentations that
they have made to government enquiries and at industry conferences over recent years.
Most of the submissions reviewed are for the regulatory reviews of the state-based solar
feed-in tariffs that were conducted in NSW, Queensland, and Victoria in 2011 and 2012.
Owing to the differing scope and contexts for the various reviews, the submissions that the
DNSPs have made do not all focus on the same issues. Instead, for the purpose of this
literature review some observations are made under the following subheadings:
The impact of PV on peak demand
Technical challenges encountered
Management strategies
Metering options for PV
Some information included in DNSP presentations is used to supplement these issues
raised in the submissions. We report on some of the key findings below.
7.1 Impact on peak demand
In the DNSP sources reviewed it was generally acknowledged that PV can be beneficial to
the network if PV output can reduce summer peak demand, and defer capital expenditure.
Most DNSPs noted the lack of correlation between peak PV output and peak demand, some
on a theoretical basis (Endeavour Energy, 2011), others by using actual observed data
(Ausgrid, 2011b). Figure 8 is taken from the Endeavour Energy submission to the NSW
Independent Pricing and Regulatory Tribunal (IPART). It compares theoretical solar output
with the demand at a major zone substation.

27
Figure 8 Theoretical solar output compared to substation demand (Endeavour Energy, 2011)
Ausgrid and Western Power have conducted analysis on the peak reduction impact of PV at
a whole network business level, and for individual substations, using observed data
(Ausgrid, 2011b; Western Power, 2012a). The Ausgrid analysis focuses on the top five peak
days in the 2010-11 summer (see Table 13 below). The total rated PV generation capacity of
55.2 MW was found to achieve an average reduction of 0.38%, or 21.8 MW, across the five
summer peaks.
Table 13 Estimated solar impact on Ausgrid network summer peaks for summer 2010/11
It is notable that the PV capacity on the Ausgrid network was 124 MW in June 2012
(Ausgrid, 2012a), which is more than double the 55.2 MW figure that was current at the time
of the analysis.
The Western Power analysis does not include data for total PV output, and instead
estimates this through a range of methods based on the data that is available. The report
states that the peak reduction results from these methods are very similar. The average
system impact is projected out to 2017 (Table 14):

28
Table 14 Projects of solar peak reduction impact on the Western Power network
Both the Ausgrid and Western Power also calculate the peak reduction potential for the top
substations by PV penetration (and the top 5 11 kV feeders in the case of Ausgrid). The
Ausgrid study calculates the solar impact as a percentage of zone annual demand growth
(see Table 15 and Table 16). At the time of the analysis there was only one instance
(Lisarow 11 kV feeder) where there was enough PV to defer investment by one year (if
augmentation would otherwise be required), although it should be noted that assuming
uniform growth in PV capacity across the network, a number of the zone substations and
three of the five top 11 kV feeders would have solar impact greater than demand growth.
Table 15 Solar impact on summer peak 2011 at top five Ausgrid zone substations

29
Table 16 Solar impact on summer peak 2011 at top five Ausgrid 11 kV feeders
The highest instances of solar impact are when the peak occurs around 3:30PM and
4:00PM.
Western Power analysed the top 8 substations by PV penetration. The latest peak load from
these substations was 7:45PM and the earliest was 3:15PM. The latter was the Canningvale
substation that has a mix of commercial and residential customers. Due to good correlation
with the solar resource, the greatest peak load reduction of the top substations was
estimated for Canningvale, a reduction of between 1.65 and 1.95% in 2011.
Table 17 Estimated solar impact on Western Power Canningvale substation in 2011

30
Figure 9 Plot of estimated solar impact on Western Power Canningvale substation in 2011
A potential peak load reduction of up to 2.95% was projected for 2017. In the Western Power
report no comment is made of how these potential reductions compare to the peak load
growth, and the timing of any anticipated infrastructure augmentation.
7.2 Technical challenges
Inverter tripping due to over-voltage was noted as a common occurrence by Essential
Energy and Endeavour in submissions to the IPART solar feed-in tariff review. Essential said
that in 2011, 60 to 70% of the power quality issues on the network were related to voltage
rise caused by PV systems and inverter tripping (Essential Energy, 2011). In 2010-11,
Endeavour visited 95 households in response to inverters tripping. Most were systems larger
than 5kW connected by single phase in semi-rural areas (Endeavour Energy, 2011).
Ausgrid also provides an example of over voltage at a 10kW system connected to a single
phase (Ausgrid, 2012c). The voltage at the point of supply was regularly above 263V (see
Figure 10 below).

31
Figure 10 Ausgrid voltage study of 10 kW PV system connected to single phase, before and after line upgrade
Figure 11 is a voltage “heat map” that shows instances of over-voltage that may be due to a
cluster of PV installations (Ausgrid, 2012b). This graphic is for the Nelson Bay area of NSW
and was produced for the Smart Grid Smart City project.
Figure 11 Voltage heat map produced for Smart Grid Smart City (Ausgrid, 2012b)
32
Ergon Energy, in a submission to the Queensland Competition Authority, notes that the
limiting factors for PV hosting capacity in remote parts of their network are the response time
of the diesel generators for solar intermittency, and the minimum loading on the generators.
Other PV-related issues that are mentioned by Ergon are voltage imbalance, system stability
on isolated networks, and the potential for reverse flow into the high voltage network (Ergon
Energy, 2012).
7.3 Management strategies
Endeavour Energy lists four ways of increasing the amount of PV that can be installed on the
network. These are allowing inverter trip voltages to be higher, tapping down the distribution
transformer voltage, augmenting customer service mains to reduce impedance to solar
customers, and installing bi-directional voltage regulators (Endeavour Energy, 2011).
Essential Energy suggests the introduction of incentives to tilt panels so that PV output is
better correlated with peak demand (Essential Energy, 2011).
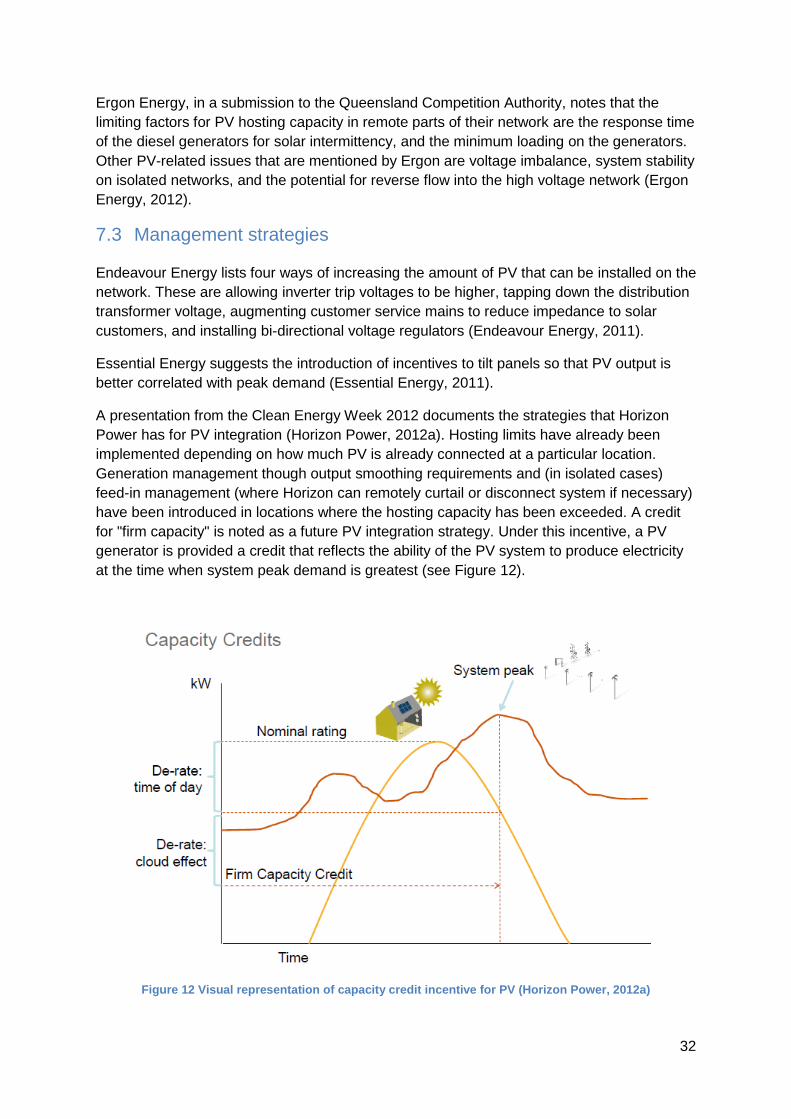
A presentation from the Clean Energy Week 2012 documents the strategies that Horizon
Power has for PV integration (Horizon Power, 2012a). Hosting limits have already been
implemented depending on how much PV is already connected at a particular location.
Generation management though output smoothing requirements and (in isolated cases)
feed-in management (where Horizon can remotely curtail or disconnect system if necessary)
have been introduced in locations where the hosting capacity has been exceeded. A credit
for "firm capacity" is noted as a future PV integration strategy. Under this incentive, a PV
generator is provided a credit that reflects the ability of the PV system to produce electricity
at the time when system peak demand is greatest (see Figure 12).
Figure 12 Visual representation of capacity credit incentive for PV (Horizon Power, 2012a)

33
7.4 Metering
The type of metering for PV systems that is more prevalent in each state and territory is a
reflection on the design of the solar feed-in tariff in each jurisdiction. A gross feed-in tariff
operates in the ACT, Northern Territory, and for NSW Solar Bonus Scheme participants. All
other states and territories, including NSW since the Solar Bonus Scheme has concluded,
use net metering as the default arrangement for PV connections (QCA, 2012).
In the various feed-in tariff submissions there are differing opinions regarding how PV should
be metered. Some DNSPs (particularly Essential Energy and Endeavour) observe a trend
towards net metering, especially now that the buy-back rate for exported energy is less than
the retail tariff in NSW. It is noted that more net metering will reduce the amount of energy
that is transported through the network, and hence reduce the network revenues that these
companies receive. Essential Energy says that gross metering should be mandatory.
Energex has indicated the reduction in Distribution Usage of Service (DUoS) charges
collected is as high as 15% on some feeders on sunny days (Energex, 2012a). Despite this,
both Energex and Ergon maintain that net metering, where the rate paid for the exported
energy is lower than the retail tariff, is preferable over gross metering. The rationale from
Ergon is that under net metering customers have a greater incentive to match their
household usage with the solar PV output, and that a transition from net to gross metering
would be a costly exercise. Similarly, Energex states that net metering should result in lower
administration and metering costs. In Victoria, Jemena states that gross metering would be
too costly because their IT systems are already configured for single element smart meters
(Jemena Energy Networks, 2012).
Citipower/Powercor raises concerns about reduced use of the network by PV customers,
which it calls a cross-subsidy, since DNSPs are not able to recover network usage charges
from PV customers. This is illustrated in Figure 13. The “indirect subsidy” represents the
energy generated from PV and used on site, avoiding the need to use the network
(CitiPower and Powercor Australia, 2012).

34
Figure 13 Cross-subsidy as a result of PV net metering
The DNSP will recover these predominantly sunk costs by charging slightly higher rates
across the whole customer base. Citipower/Powercor estimates this cross-subsidy to be
more than $8m in 2013 across their network of approximately 1 million customers. It is noted
that the additional cost of dual element meters (around $12 per meter than single element) is
small in comparison to this cross-subsidy, especially if gross metering is only mandated for
new installations.

35
8 References
ActewAGL. (2011). Guidelines for photovoltaic installations up to 200kW connected via inverters to the ActewAGL network.
AEMC. (2008). Tasmanian Frequency Operating Standard Review. Sydney. AEMC Reliability Panel. (2009). Application of Frequency Operating Standards During
Periods of Supply Scarcity. Sydney. AEMO. (2012). Rooftop PV Information Paper - National Electricity Forecasting, from
http://www.aemo.com.au/Reports-and-Documents/Information-Papers/Rooftop-PV-Information-Paper-National-Electricity-Forecasting
AER. (2012). State of the energy market 2012. Ausgrid. (2011a). Electricity Network Operation Standards. Ausgrid. (2011b). Research Paper: Effect of small solar Photovoltaic (PV) systems on
network peak demand. Ausgrid. (2012a). Ausgrid Network Info April - June 2012, from
https://www.ausgrid.com.au/Common/About-us/Sharing-information/Data-to-share.aspx
Ausgrid. (2012b). Smart Grid, Smart City Project. Monitoring and Measurement Report: Report 3.
Ausgrid. (2012c, 27 July 2012). Solar PV System Performance. Paper presented at the ATRAA Conference 2012.
CitiPower and Powercor Australia. (2012). Submission to the Victorian Competition and Efficiency Commission in response to the “Issues Paper Inquiry into Feed-in Tariff Arrangements and Barriers to Distributed Generation”.
Endeavour Energy. (2011). Response to IPART Issues Paper on Solar feed-in tariffs. Energex. (2012a). Grid-Embedded Renewables: Hero or Villain ? Paper presented at the
ATRAA Conference 2012. Energex. (2012b). Solar Installations & Installed Inverter Capacity by Postcode up to
December 2012, from http://www.energex.com.au/contractors-and-service-providers/solar-pv-installers
Ergon Energy. (2012). Ergon Energy response to QCA Issues Paper on Queensland Solar feed-in tariff.
Essential Energy. (2011). Response to IPART Issues Paper on Solar feed-in tariffs. Horizon Power. (2012a, 26 July 2012). Facilitating Renewable Energy: The role of energy
storage. Paper presented at the Clean Energy Week 2012. Horizon Power. (2012b). Technical requirements for renewable energy systems. Jemena Energy Networks. (2012). Jemena Electricity Networks (Vic) submission to the
Victorian Competition & Efficiency Commission on the Issues Paper, Inquiry into Feed-in Tariff Arrangements and Barriers to Distributed Generation.
NSW Government. (2012). Service and Installation Rules of New South Wales. Version August 2012.
Power and Water Corporation. (2003). Network Connection Technical Code. Power and Water Corporation. (2008). Service Rules. QCA. (2012). Estimating a Fair and Reasonable Solar feed-in Tariff for Queensland.
Queensland Competition Authority. SA Power Networks. (2012). Small Embedded Generation Network Connection. Sunwiz. (2013). List of Australia Large Scale Solar PV, Commercial Solar PV, Utility Scale
Solar PV Projects Retrieved 19 August 2013, from http://sunwiz.com.au/index.php/large-system-list.html
Taylor, M. (2013). Introducing AS4777 – 2013 (draft): Presentation at the Clean Energy Week 2013.
Victorian Essential Services Commission. (2012). Electricity Distribution Code.

36
Western Power. (2011). Technical Rules. Western Power. (2012a). Study on the impact of Photovoltaic (PV) generation on peak
demand. Western Power. (2012b). WA Distribution Connections Manual 2012.