pvaas overview: evaluating growth, projecting performance sy2014-2015
TRANSCRIPT

PVAAS Overview:Evaluating Growth,
Projecting Performance
SY2014-2015

F2F Overview SY14-15
Partners & Teams for Session Activities
• Some activities throughout the session will be completed in pairs or small groups, while others will be done independently.
• Take a few minutes now to divide yourselves into:– Partners (groups of 2), AND– Small groups (groups of 4-6).
2

F2F Overview SY14-15
Goal of SessionBy the end of the session, participants will be able to answer the
following questions:
• What is PVAAS?
• How does PVAAS measure growth?
• What does PVAAS tell us about growth in our district and school(s)?
• What does PVAAS tell us about how students are projected to perform on a future state assessment?
• Which reports are most meaningful for school level planning, course level planning, grade level planning, and student level planning?
3

F2F Overview SY14-15
WHAT IS PVAAS?
4

F2F Overview SY14-15 5
What is PVAAS?
• Longitudinal analysis of existing state assessment data
• Reliable estimates of academic growth & projections of future performance
• Effectiveness of the educational system
F2F Overview SY14-15 6
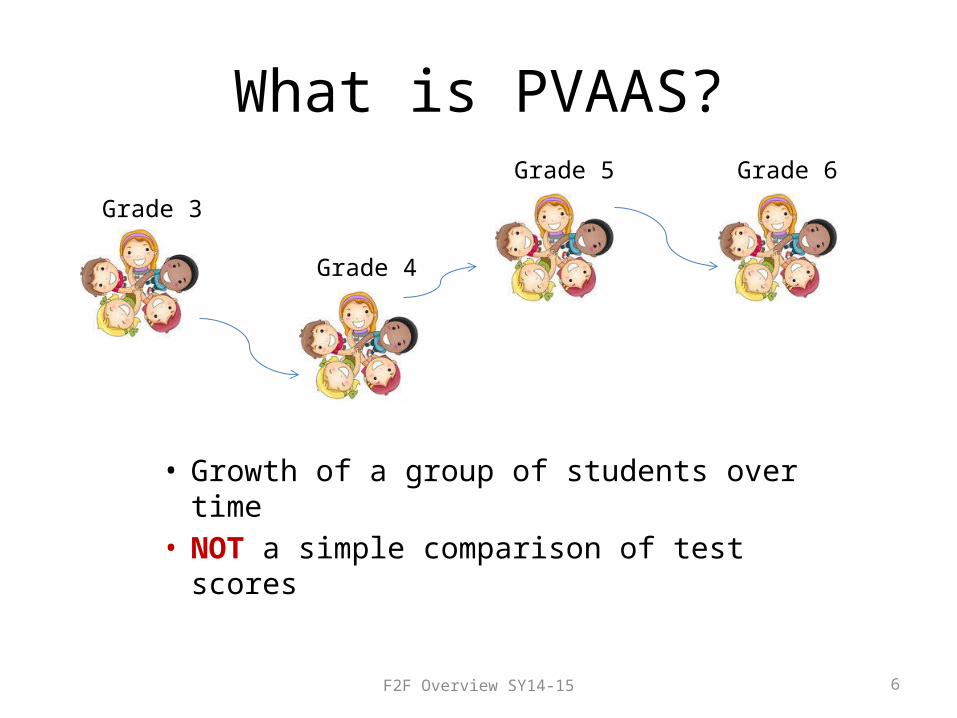
What is PVAAS?
• Growth of a group of students over time• NOT a simple comparison of test scores
Grade 3
Grade 4
Grade 5 Grade 6
F2F Overview SY14-15
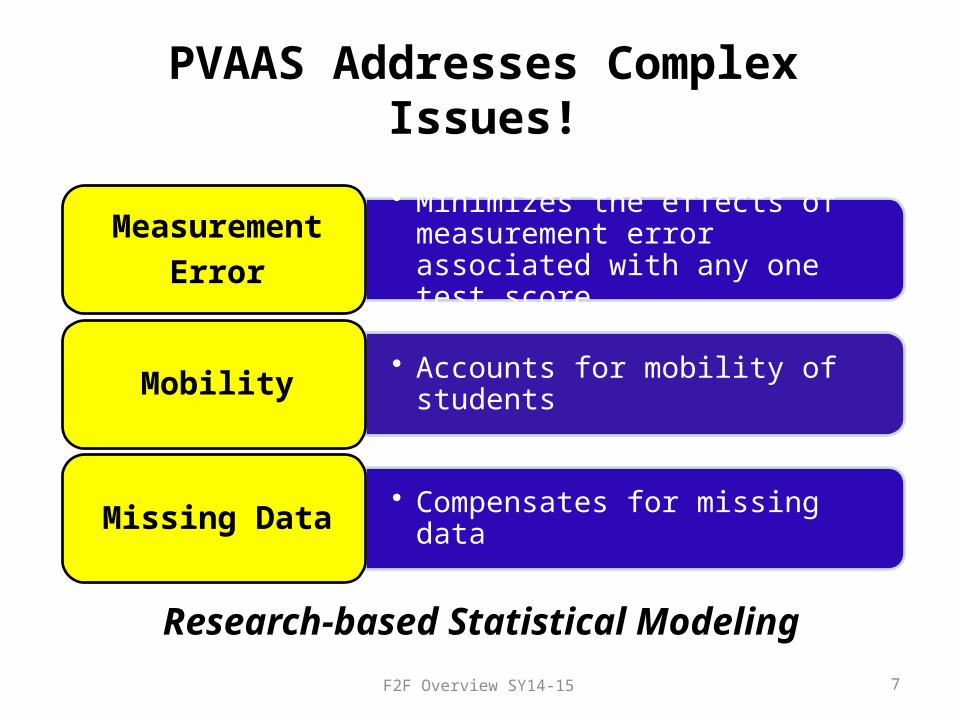
PVAAS Addresses Complex Issues!
Research-based Statistical Modeling
• Minimizes the effects of measurement error associated with any one test score
MeasurementError
• Accounts for mobility of studentsMobility
• Compensates for missing dataMissing Data
7

F2F Overview SY14-15
Demographics and Growth
As long as you can sufficiently account for the prior achievement of the student,…
8
…there is LITTLE TO NO significant relationship between demographics and student progress, or growth!

F2F Overview SY14-15
Prior Achievement
How can we adequately account for prior achievement?
• The SAS EVAAS team has found that the only way to adequately account for prior achievement is to use all available test data for each student to dampen the effects of measurement error.
• PVAAS does NOT need to adjust for the demographic status of students directly since it is accounting for students’ prior achievement.– In other words, demographics are inherently controlled for in
PVAAS by the use of all longitudinal data on all students.
9
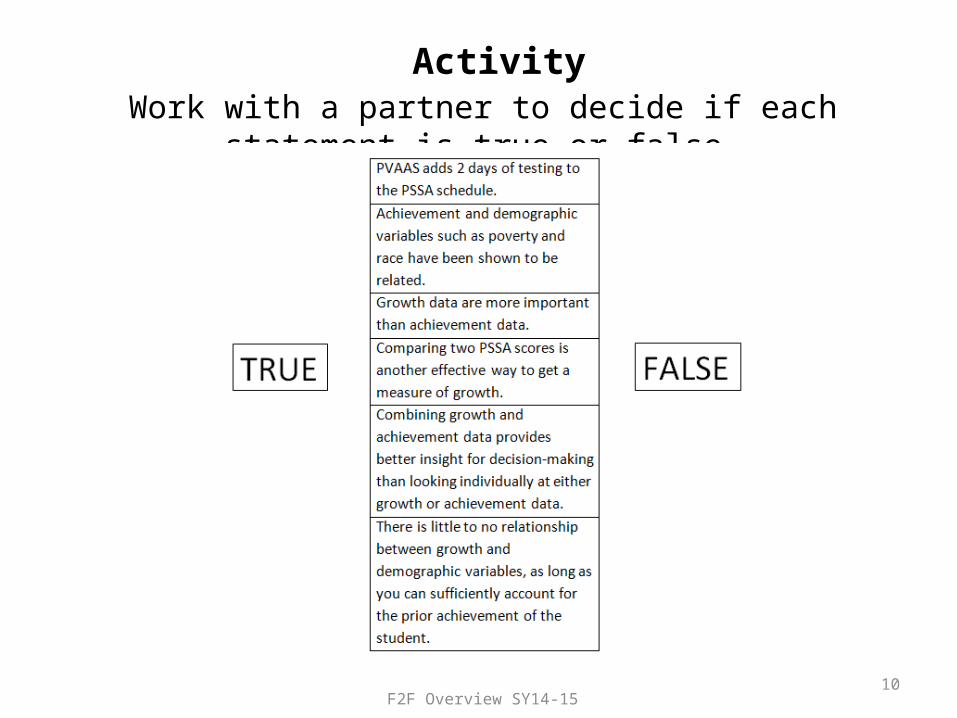
ActivityWork with a partner to decide if each statement is true or false.
10F2F Overview SY14-15

ActivityWork with a partner to decide if each statement is true or false.
11F2F Overview SY14-15

F2F Overview SY14-15 12
For More Information
Virtual Learning Module
PVAAS Misconceptions:Clarifying Questions and
Misunderstandings

F2F Overview SY14-15
TWO TYPES OF PVAAS INFORMATION
13

WHAT IS PVAAS?
PVAAS
Keystones
PSSA ScienceWriting
PSSAMath
Reading
LOOKING AHEAD
Planning for Students’ Needs:
Student Projections to Future Tests
LOOKING BACK
Measuring Academic Growth
of Groups of Students:
Value-Added & Diagnostic Reports
District
School
Teacher
Student
**Note: All Prior Data are Used T
LOOKING BACK
Measuring Academic Growth of Groups of
Students:Value-Added & Diagnostic
Reports
LOOKING AHEAD
Planning for Students’ Needs:
Student Projections to Future Tests
*Writing used only in District & School Reporting

F2F Overview SY14-15 15
LOOKING AHEAD
LOOKING BACK

F2F Overview SY14-15
PVAAS Value-Added ReportingHow is growth measured in PVAAS?
16

PVAASValue-Added Reporting
Testing Subjects – Grades Methodologies
Assessments in consecutive
years
Mathematics, 4-8Reading, 4-8
Growth Standard
Assessments not in consecutive
years
Writing – 5 & 8 Science – 4 & 8
Keystones – Algebra I, Biology, & Literature
Predictive
17F2F Overview SY14-15
*Writing only in District & School Reporting

F2F Overview SY14-15
Measuring Academic Growth
Students don’t all start the year at the same place academically
18

F2F Overview SY14-15
Measuring Academic Growth
• Standard for PA Academic Growth– Regardless of their entering achievement level, students
should not lose ground academically
• Is it not a reasonable goal to maintain the achievement level of a group of students?– Not necessarily increase their achievement level, but
maintain their achievement level.
19

F2F Overview SY14-15 20
PVAAS Value-Added Growth Indicators
Math and Reading Grades 4-8 Science, Writing, Keystones

Philosophy Behind PVAAS
• All students can learn.
• All students deserve to make appropriate academic progress each year.

F2F Overview SY14-15 22
Prior (or Entering) Achievement of the
Group of Students
Higher Achievement
Lower Achievement
Higher Achievement
Lower Achievement
Current Achievement of the Groupof Students
Concept of Measuring Growth

F2F Overview SY14-15
Regardless of the entering achievement level of the group…
• Students should not lose ground academically
• A reasonable goal would be to at least maintain the achievement level of the group
• All groups of students can make growth
23

F2F Overview SY14-15
Practice!• Turn to a partner• Explain the concept of growth
24
Previous School Year Current School Year
Higher Achievement
Lower Achievement
Higher Achievement
Lower Achievement
F2F Overview SY14-15 25
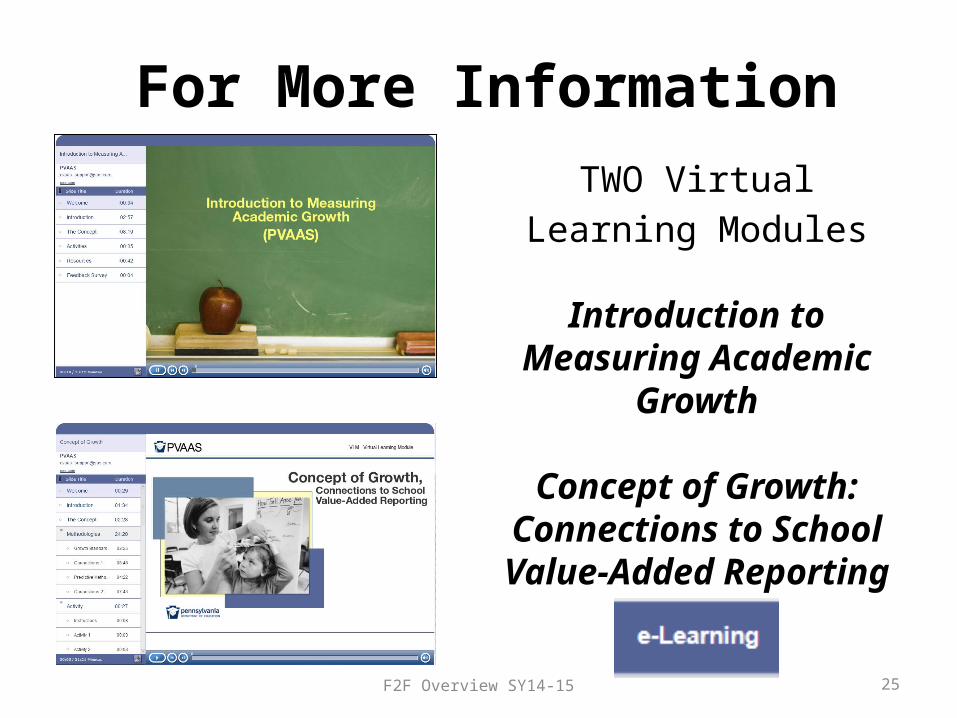
For More InformationTWO Virtual
Learning Modules
Introduction to Measuring Academic
Growth
Concept of Growth: Connections to School
Value-Added Reporting

F2F Overview SY14-15 26
Questions

F2F Overview SY14-15 27
PVAAS Value-Added Growth Indicators
Math and Reading Grades 4-8 Science, Writing, Keystones

F2F Overview SY14-15
Measuring Growth in PVAAS
• Remember, PVAAS does NOT compare the achievement of one group of students in a particular subject and grade with the previous year’s students in the same subject and grade.
• PVAAS does NOT use the percentages of students at various academic performance levels to measure growth.
• PVAAS uses students’ scale scores within those performance levels to better estimate growth.
28

F2F Overview SY14-15 29
PVAAS Value-Added Growth Indicators
District and School
Teacher

F2F Overview SY14-15 30
Growth Standard VAA Report(Reading and Math – grades 4 though 8)

F2F Overview SY14-15 31
Trends in Growth StandardValue-Added Report
(Reading and Math – grades 4 though 8)

F2F Overview SY14-15
PVAAS Value-AddedGrowth Measures
• For Reading and Math in grades 4-8, Growth is measured in Normal Curve Equivalent (NCE) units as scale scores cannot be compared from grade to grade and year to year.
• The Growth Measure is NOT reported in years and cannot be referenced in terms of number of year’s growth.
• The Growth Measure is NOT reported in percentages and cannot be referenced in terms of an increase or decrease in percentage points.
32

F2F Overview SY14-15
RescalingGrades 4-8: Math & Reading
1000 1100 1200 1300 1400 1500Scale Score Points
33
0 10 20 30 40 50 60 70 80 90 100NCE Units
State Average

F2F Overview SY14-15 34
Predictive Value-Added Report(Science, Writing and Keystone exams)

F2F Overview SY14-15 35
School Value-Added ReportsScience, Writing, & Keystone content areas
School A
School B

F2F Overview SY14-15
PVAAS Value-AddedGrowth Measures
• For Science, Writing and Keystone content areas, Growth is measured in scale score points.
• The Growth Measure is NOT reported in years and cannot be referenced in terms of number of year’s growth.
• The Growth Measure is NOT reported in percentages and cannot be referenced in terms of an increase or decrease in percentage points.
36

F2F Overview SY14-15
Activity:How would you interpret?
37

F2F Overview SY14-15
Activity:How would you interpret?
38

Teacher Value Added Summary
39

Key Differences Between District/School and Teacher Specific Reporting
• PVAAS School Reporting uses full academic year as a requirement for including students
• PVAAS Teacher Specific Reporting requires 10% Total Instructional Responsibility for including students
• PVAAS Teacher Specific Reporting uses % Student +Teacher Enrollment and % Full/Partial Instruction to determine the weighting of each student on each teacher’s PVAAS Teacher Value Added Report
40
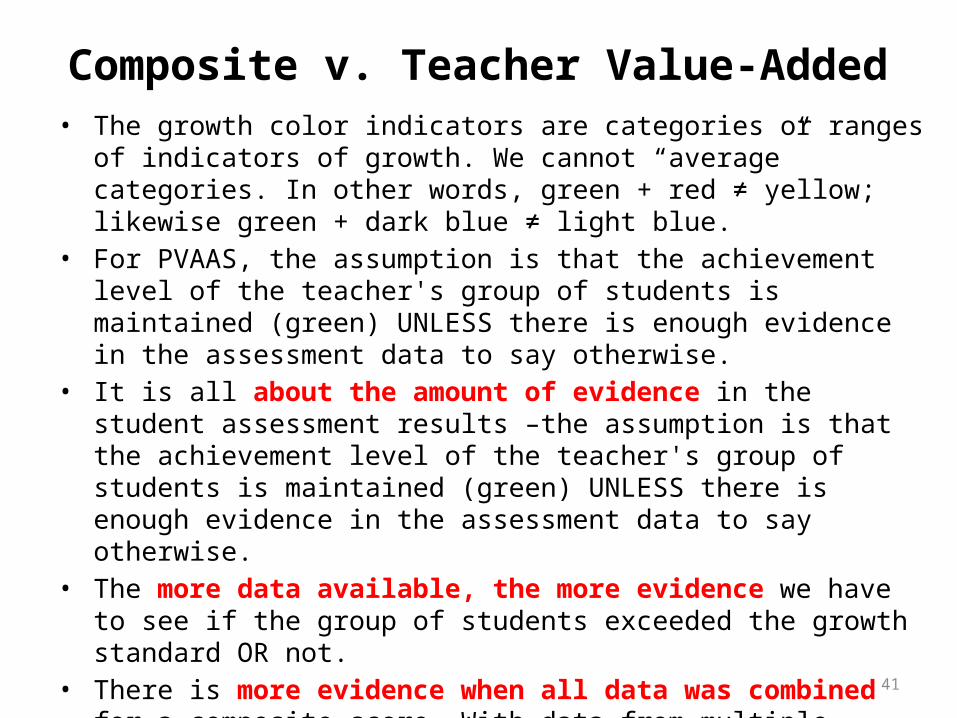
Composite v. Teacher Value-Added• The growth color indicators are categories or ranges of indicators of growth.
We cannot “average” categories. In other words, green + red ≠ yellow; likewise green + dark blue ≠ light blue.
• For PVAAS, the assumption is that the achievement level of the teacher's group of students is maintained (green) UNLESS there is enough evidence in the assessment data to say otherwise.
• It is all about the amount of evidence in the student assessment results –the assumption is that the achievement level of the teacher's group of students is maintained (green) UNLESS there is enough evidence in the assessment data to say otherwise.
• The more data available, the more evidence we have to see if the group of students exceeded the growth standard OR not.
• There is more evidence when all data was combined for a composite score. With data from multiple subjects (or multiple years when that’s available) included in the Composite, there’s more evidence/more data.
41

F2F Overview SY14-15 42
For More Information
TWO VirtualLearning Modules
Value-Added Report

F2F Overview SY14-15 43
For More Information
VirtualLearning Module
Teacher Specific Reporting
F2F Overview SY14-15
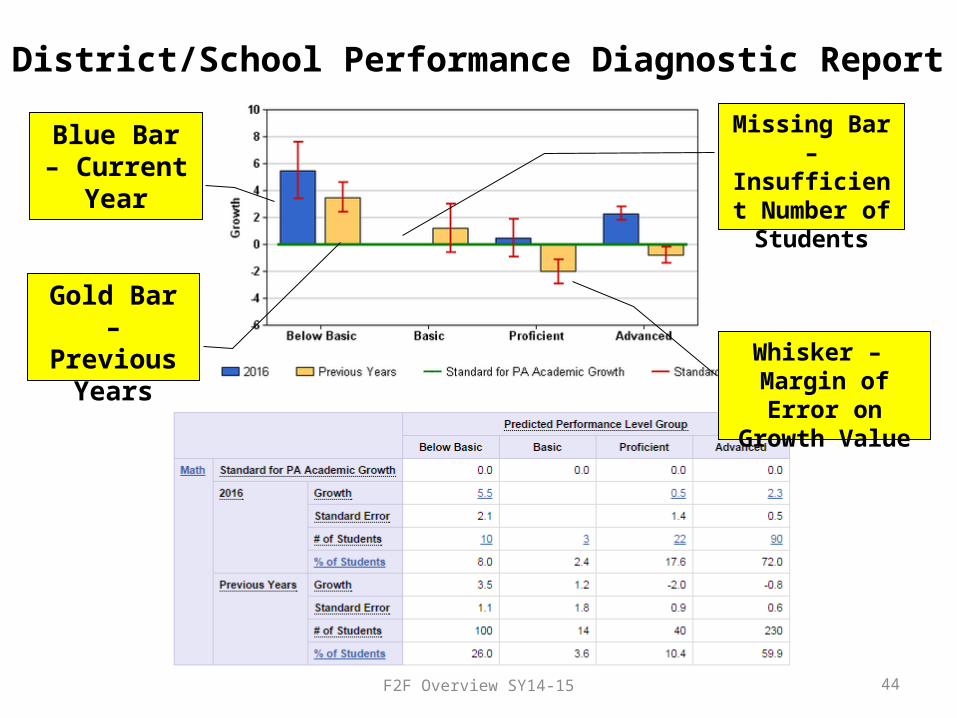
District/School Performance Diagnostic Report
Gold Bar – Previous
Years
Missing Bar – Insufficient Number of Students
Whisker – Margin of Error on
Growth Value
44
Blue Bar – Current
Year

F2F Overview SY14-15
PVAAS Performance Diagnostic Growth Descriptors - Interpretation
Zero (0) Line
Growth
Met the standard for PA Academic Growth
Did not meet the standard for PA Academic Growth
Exceeded the standard for PA Academic Growth
What the whiskers tell us…
45

F2F Overview SY14-15
Performance Diagnostic Patterns
46
System benefitslower-achieving students
System benefitshigher-achieving students
Shed Pattern Reverse Shed Pattern
F2F Overview SY14-15
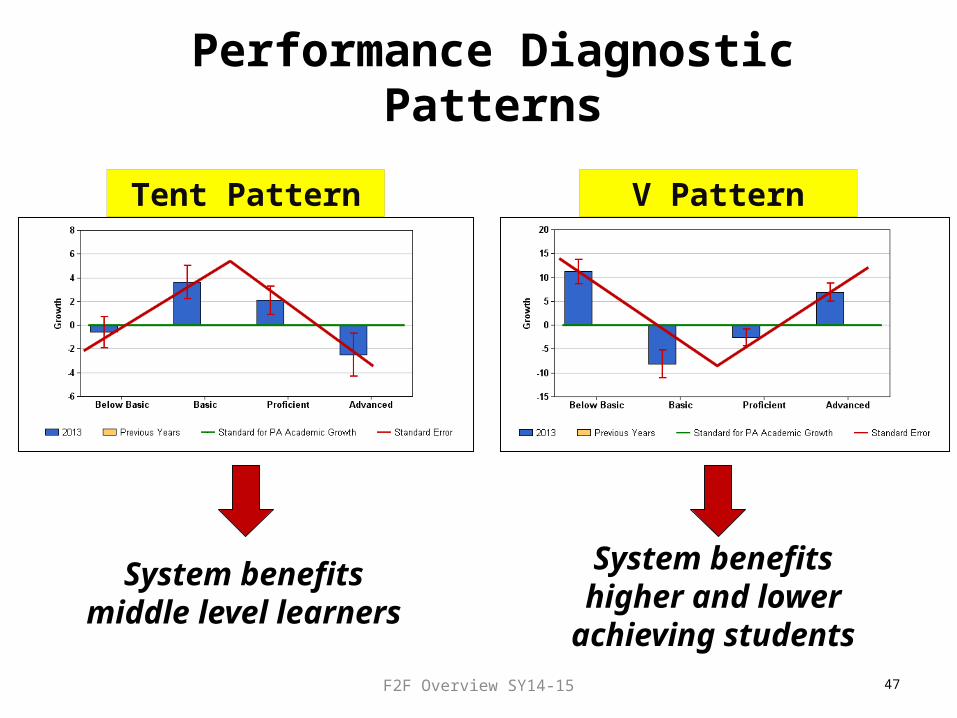
Performance Diagnostic Patterns
47
System benefitsmiddle level learners
System benefitshigher and lower achieving
students
Tent Pattern V Pattern

F2F Overview SY14-15
Performance Diagnostic Patterns
48
System supports growth ofall students similarly and
adequately
System is not supporting growth of any students
Uniform I Pattern Uniform 2 Pattern

F2F Overview SY14-15
Performance Diagnostic Patterns
49
System benefits all types of learners except those right below proficiency
Opportunity Gap Pattern
F2F Overview SY14-15
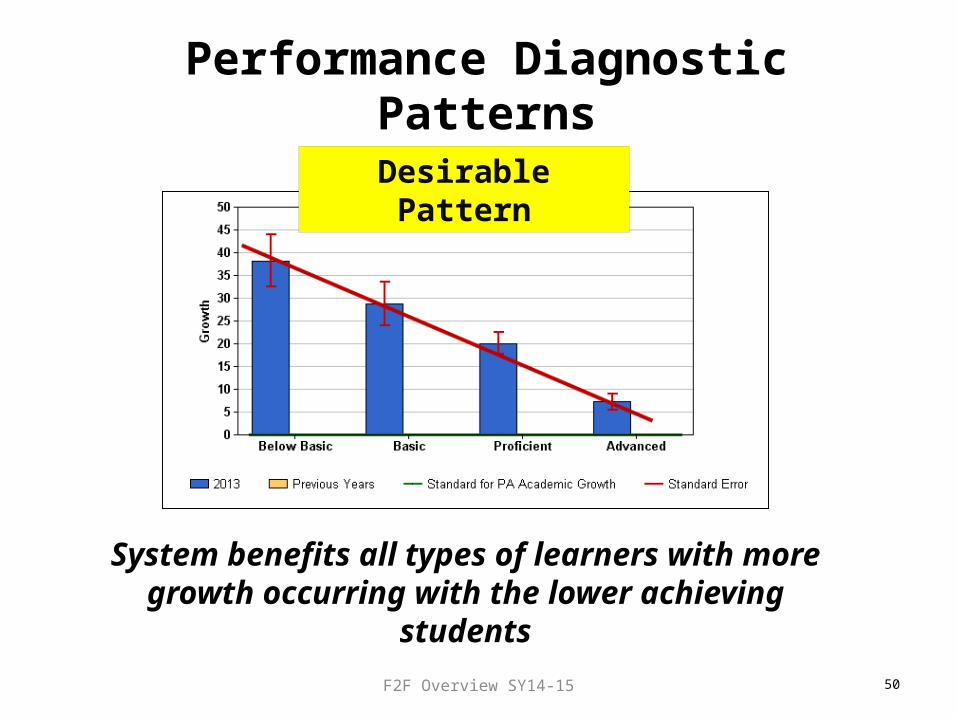
Performance Diagnostic Patterns
50
System benefits all types of learners with more growth occurring with the lower achieving students
Desirable Pattern

F2F Overview SY14-15
Activity: Check for Understanding
51
Sketch a sample performance diagnostic bar graph that fits each description.

F2F Overview SY14-15
District/School Quintile Diagnostic Report
52
There are 4 groups of students on a Performance Diagnostic Report.
• Students are placed into a predicted performance groups based on where they are predicted to perform on their next assessment.
There are 5 groups of students on a Quintile Diagnostic Report.
• Students are placed into an achievement group based on the rank of their achievement compared to other PA students.

Diagnostic Summary Reportat the Teacher Level
53

F2F Overview SY14-15
Performance Diagnostic Subgroup Reports
54

F2F Overview SY14-15
Performance Diagnostic Subgroup Report
55

F2F Overview SY14-15
Best to Compare Subgroup to Entire Grade or Course Level
Same District/School – Same Grade/Course
56
Entire grade or course Subgroup

F2F Overview SY14-15
Activity What conclusions can you make about the growth of different
groups of students in 6th grade Reading?
Entire Grade or Course
Economically Disadvantaged Special Education
57

F2F Overview SY14-15
Purpose of Value-Added & Performance Diagnostic Reports
Assessing curricular needs across grades, subjects, and Keystone content areas
Evaluating instructional needs of students at various achievement levels and in different subgroups
Ensuring instructional coherence/alignment• Curriculum Instruction Assessment• Supports, including scheduling and staffing needs
Monitoring implementation and effectiveness of grade-level or course-specific programs
58

F2F Overview SY14-15 59
For More Information
Two VirtualLearning Modules
Performance Diagnostic Report
Quintile Diagnostic Report

F2F Overview SY14-15 60
For More Information
VirtualLearning Module
Teacher Specific Reporting

F2F Overview SY14-15 61
Many Reports

F2F Overview SY14-15 62
PVAAS Launchpad
See multiple DISTRICT/SCHOOL reports in a consolidated format
Provides a user-friendly visual representation of district/school level data

F2F Overview SY14-15 63
PVAAS Launchpad
Provides the Big Picture
Across PSSA grades and Keystone content areas
Across subject areas

F2F Overview SY14-15 64
PVAAS Launchpad

F2F Overview SY14-15 65
PVAAS Launchpad
F2F Overview SY14-15 66
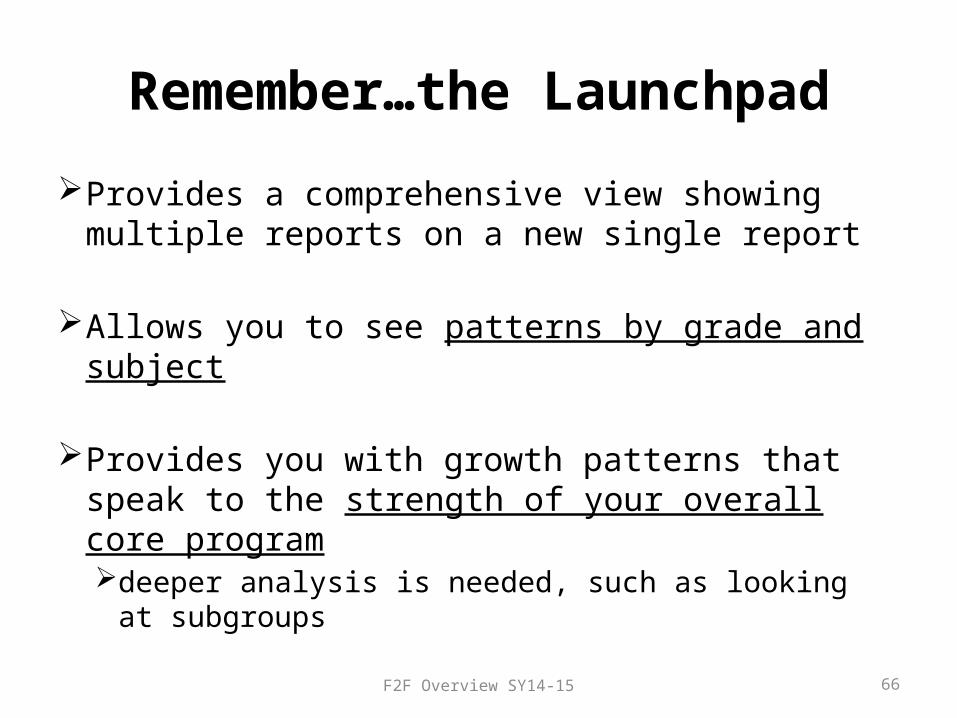
Remember…the Launchpad
Provides a comprehensive view showing multiple reports on a new single report
Allows you to see patterns by grade and subject
Provides you with growth patterns that speak to the strength of your overall core programdeeper analysis is needed, such as looking at
subgroups

F2F Overview SY14-15 67
For More Information
VirtualLearning Module
Launchpad
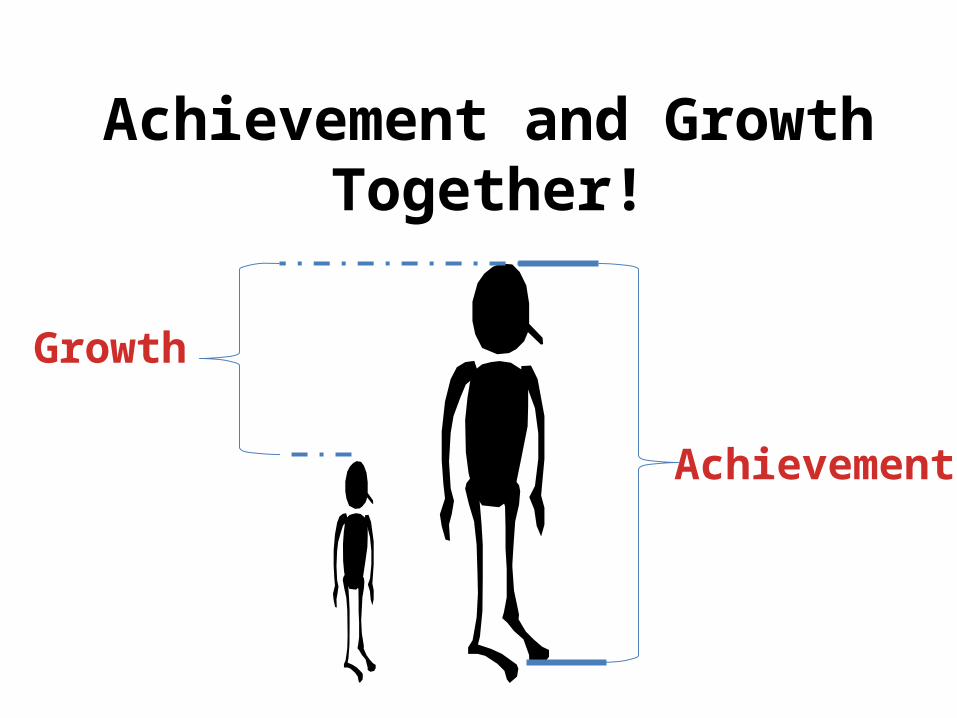
Achievement and Growth Together!
Growth
Achievement
F2F Overview SY14-15
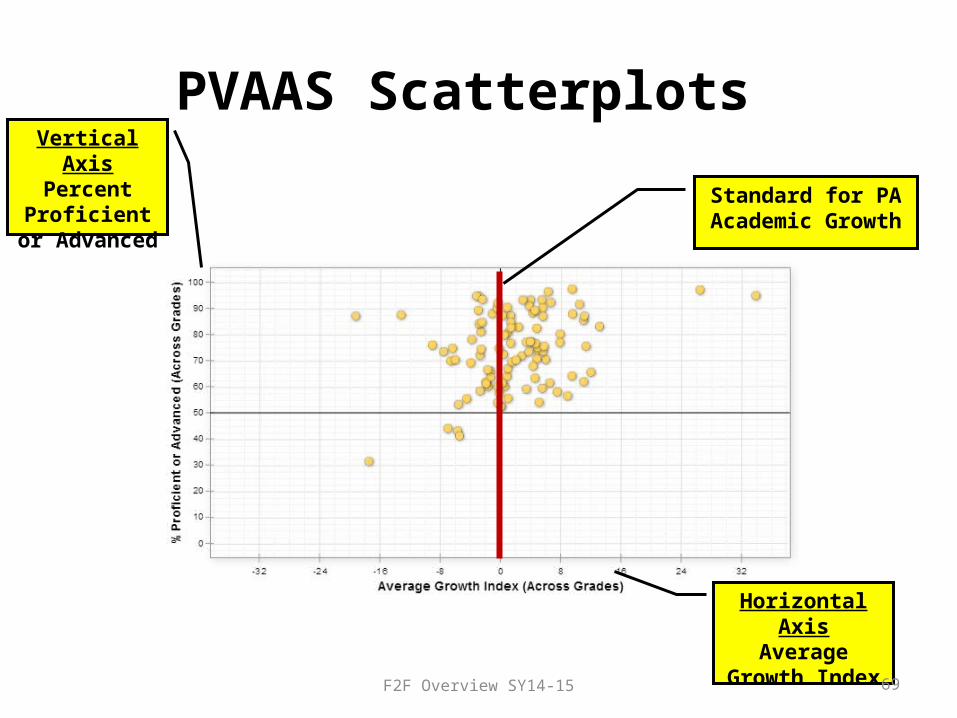
PVAAS Scatterplots Vertical Axis
Percent Proficient or
Advanced
Horizontal AxisAverage
Growth Index
Standard for PA Academic Growth
69

F2F Overview SY14-15
Scatterplot Quadrants and Their Meanings
Quad 1 - ExcellingAdequate
Achievement,Positive Growth
Quad 4 - Improving
Below Adequate Achievement,
Positive Growth
Quad 2 - SlippingAdequate
Achievement,Negative Growth
Quad 3 - UnderperformingBelow Adequate
Achievement,Negative Growth
70

F2F Overview SY14-15
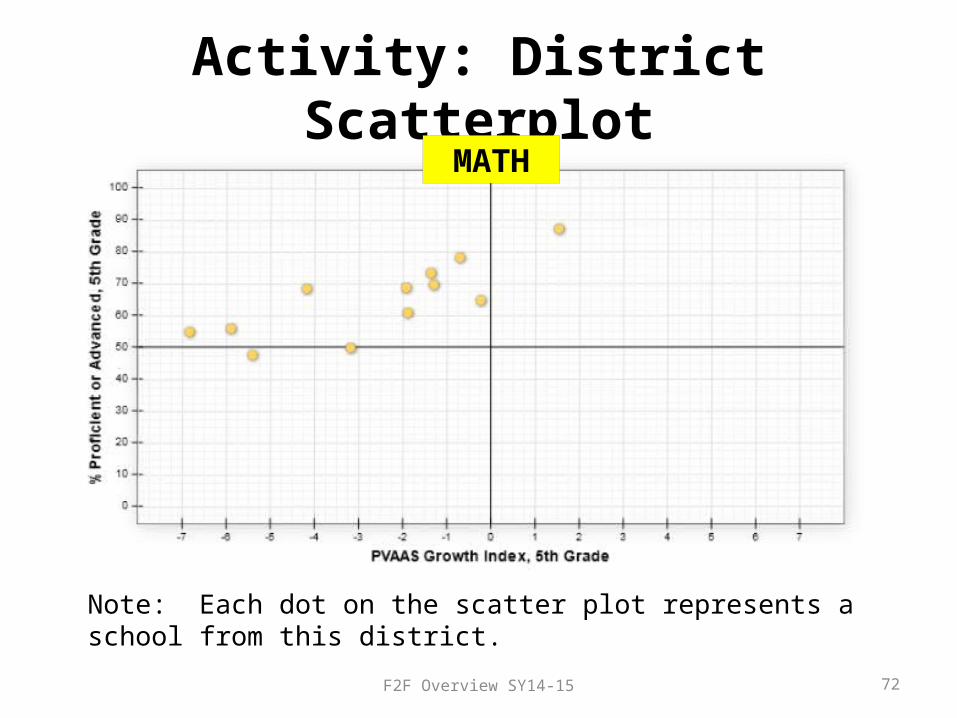
Interpreting Scatterplots
• Work with your small group to review BOTH scatterplots on the next 2 slides, one for Math and one for Reading.
• Discuss strengths and weaknesses of both scatterplots. Remember, each “dot” represents a school!
• We will discuss as a group…“What can you conclude by looking at both?”
71
F2F Overview SY14-15
Activity: District Scatterplot
Note: Each dot on the scatter plot represents a school from this district.
72
MATH

F2F Overview SY14-15
Activity: District ScatterplotSame Schools, Different Subject
Note: Each dot on the scatterplot represents a school from this district.
73
READING

F2F Overview SY14-15 74
For More Information
TWO VirtualLearning Modules
Public Scatterplots
Restricted-View Scatterplots

F2F Overview SY14-15 75
Questions

F2F Overview SY14-15 76
LOOKING AHEAD
LOOKING BACK

F2F Overview SY14-15
What Are Projections?
Given a specific set of circumstances…
…what’s the most likely outcome?
77
F2F Overview SY14-15
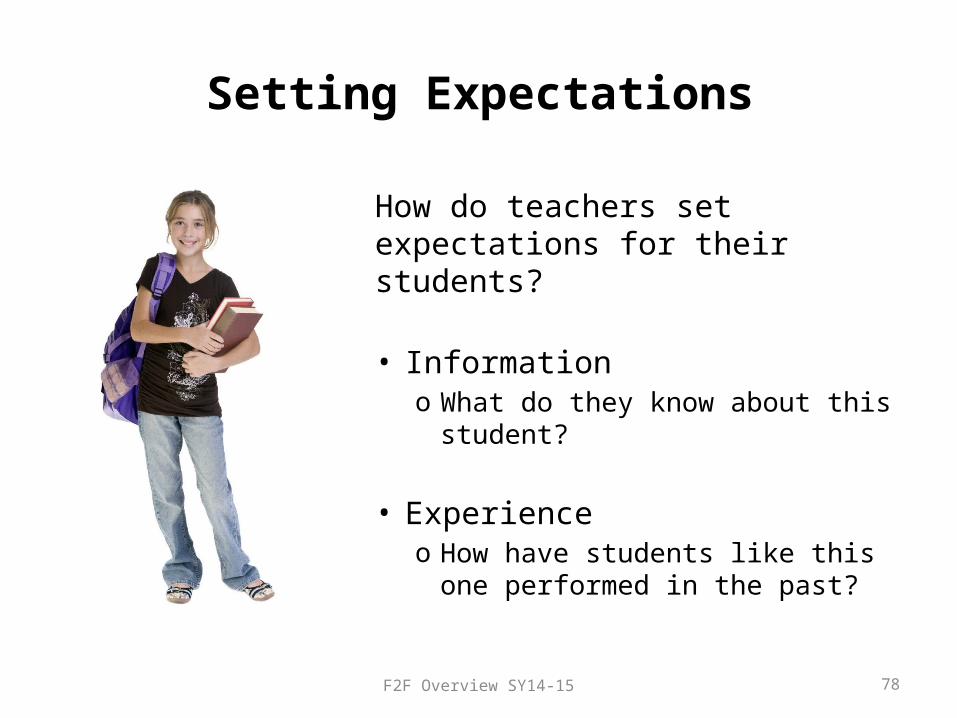
Setting Expectations
How do teachers set expectations for their students?
• Informationo What do they know about this
student?
• Experienceo How have students like this one
performed in the past?
78

F2F Overview SY14-15 79
PVAAS ProjectionsWhat are they based on?
Expectations based on what we know:
About this student:
»Prior test scores
»Across subjects

F2F Overview SY14-15 80
PVAAS ProjectionsWhat are they based on?
About other students:
» Prior test scores across subjects
» Scores on the test to which we are projecting

F2F Overview SY14-15 81
What Are PVAAS Projections?
Individual Student Projection

F2F Overview SY14-15
Student Projection Methodology
What data are used in calculating projections?
82
Projection TO…. Data Used to Calculate ProjectionPSSA Math PSSA Math and ReadingPSSA Reading PSSA Math and ReadingPSSA Science PSSA Math, Reading, and Science (in grades available)PSSA Writing PSSA Math, Reading, and Writing (in grades available)Keystone content areas (Algebra I, Literature, Biology)
PSSA Math, Reading, and Science (in grades available)

F2F Overview SY14-15
Student Projection Methodology
Which students have projections? In what subjects?
– Projections are available for all students who have a minimum of 3 data points. The exception to this are projections to grade 4 where only 2 data points from grade 3 are needed.
– The next two slides detail the grade levels, subjects, and Keystone content areas in which projections are reported.
83

PVAAS Projection Reporting: Projections to PSSA (Basic, Proficient, Advanced)
Grade PSSA
Last Taken
Math and Reading: 3 4 or 5 4 5 or 6 5 6 or 7 6 7, 8 7 8
Writing: 3 5 4 5 5 8 6 8 7 8
Science: 3 4 4 NA 5 8 6 8 7 8
Grade PSSA
Last Taken
Grade PSSA
Last Taken
84F2F Overview SY14-15
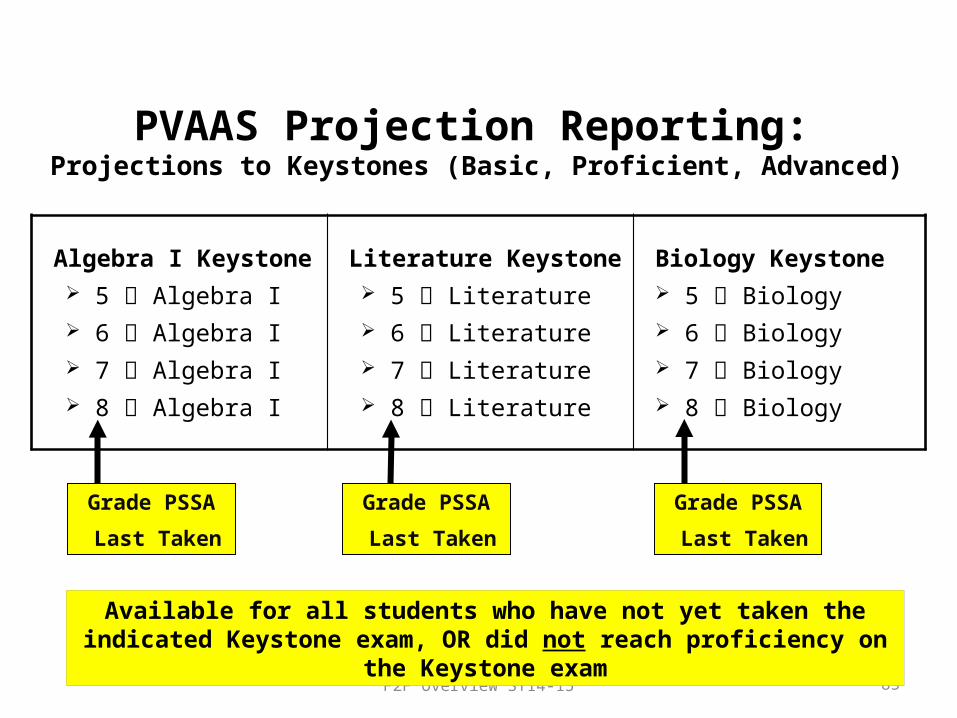
PVAAS Projection Reporting: Projections to Keystones (Basic, Proficient, Advanced)
Grade PSSA
Last Taken
Algebra I Keystone 5 Algebra I 6 Algebra I 7 Algebra I 8 Algebra I
Literature Keystone 5 Literature 6 Literature 7 Literature 8 Literature
Biology Keystone 5 Biology 6 Biology 7 Biology 8 Biology
Grade PSSA
Last Taken
Grade PSSA
Last Taken
F2F Overview SY14-15 85
Available for all students who have not yet taken the indicated Keystone exam, OR did not reach proficiency on the Keystone exam

F2F Overview SY14-15
PVAAS Student Projection Report
86

F2F Overview SY14-15
PVAAS Student Projection Report
87
F2F Overview SY14-15
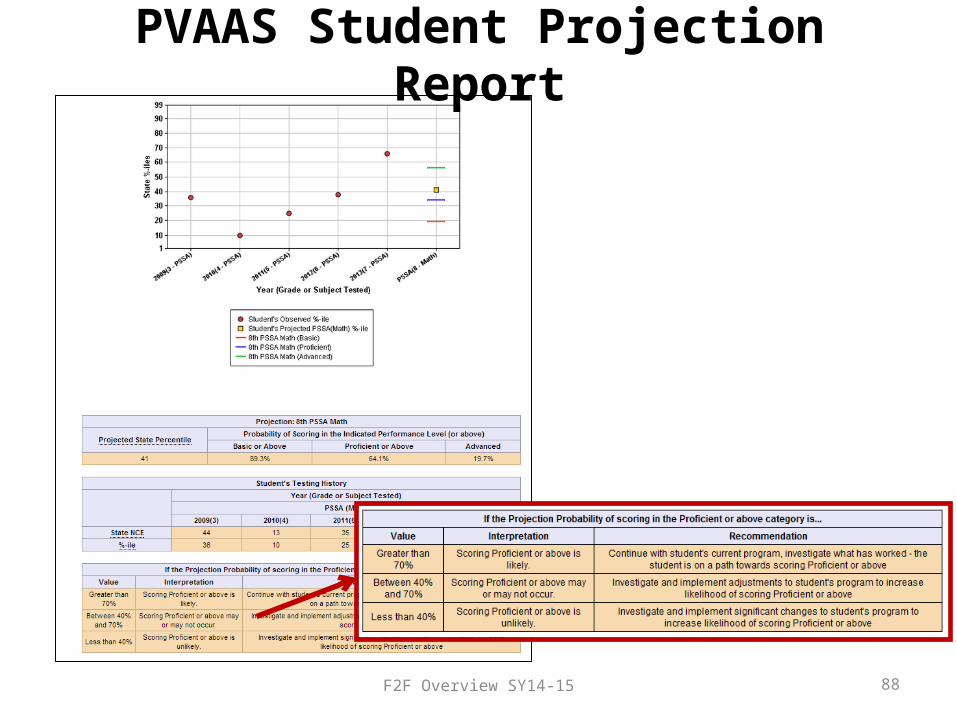
PVAAS Student Projection Report
88

F2F Overview SY14-15
Activity: How would you interpret?
89

F2F Overview SY14-15
Activity: How would you interpret?
90

F2F Overview SY14-15
Activity: How would you interpret?
91

F2F Overview SY14-15
PVAAS Projections for Groups of Students
Student Search
92

F2F Overview SY14-15
Identified Students Meeting Search Requirements
93

F2F Overview SY14-15
How often did students with PVAAS probabilities of 70% or higher score at proficient or advanced?
94
A document containing more
information can be found on the PVAAS
Login Page.

F2F Overview SY14-15
Projection Summary Reports
What are they?• Summarizes the numbers and
percentages of student probabilities to a selected performance level on a future state assessment
• Summary available for projections to a Proficient level or higher, or to an Advanced level
Cautions• ONE indicator • Additional data should be used
95

F2F Overview SY14-15
District/School Projection Summary Report
96

F2F Overview SY14-15
Activity: How would you interpret?
97

F2F Overview SY14-15
Activity: How would you interpret?
98

F2F Overview SY14-15 99
Projection Summary Student List
Data reported for all students in the selected probability range
• Student Name• PAsecureID• School
• Demographic classifications• Educational classifications• Achievement Probability

F2F Overview SY14-15
How Might Educators Use Projection Summary Reports?
Administrators can use for program planning:– Intervention Planning– Resource Allocation– Course Availability & Placement Decisions– Grade-level and Course-level Planning– School-level Planning– Comprehensive Planning
Teachers can use to facilitate instructional planning:– Proportion of students on a path to success (proficiency or higher)– Proportion of students at risk for reaching proficient or advanced
levels of performance– Plan for instructional strategies and classroom practices based on
students’ needs100

F2F Overview SY14-15 101
For More Information
VirtualLearning Modules
Student Projection Report
Projection Summary Report
F2F Overview SY14-15 102
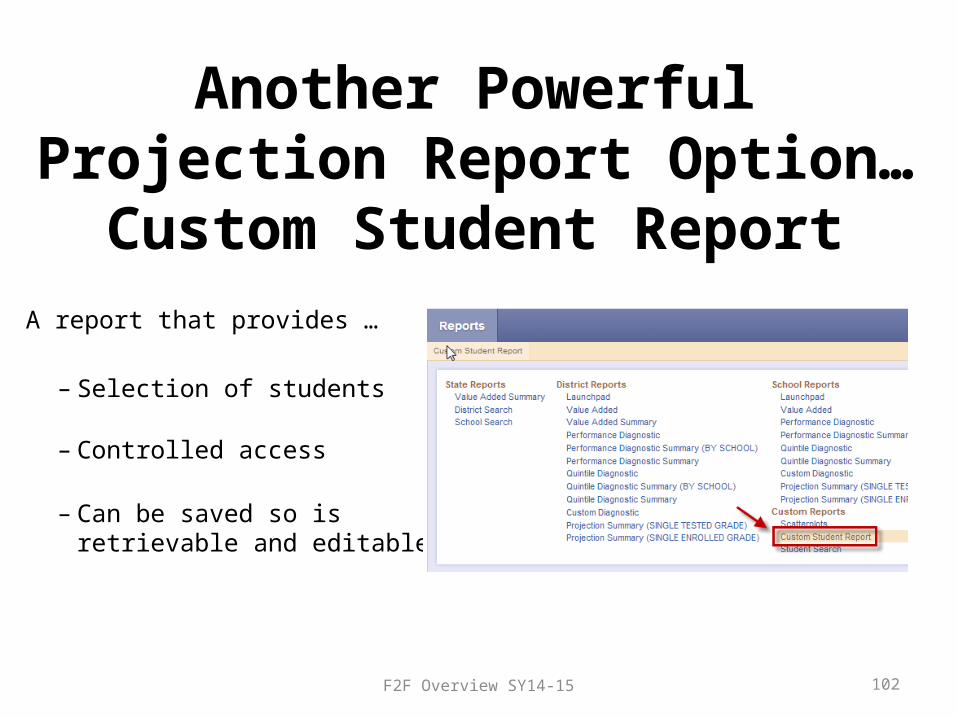
Another Powerful Projection Report Option…Custom Student Report
A report that provides …
– Selection of students
– Controlled access
– Can be saved so is retrievable and editable

F2F Overview SY14-15 103
Custom Student Report
• Create a new report and name it
• Search for and select students of interest
• Save the report in PVAAS
• Add students, remove students, print, and delete options

F2F Overview SY14-15 104
Custom Student Report:Student Projections

F2F Overview SY14-15 105
For More Information
VirtualLearning Module
Student Search and Custom Student
Report

F2F Overview SY14-15 106
Questions

PVAAS Resources

F2F Overview SY14-15
PVAAS Virtual Learning Modules
108
• Various types of VLMs• Concept & foundations of measuring growth• Understanding and using reports• Integrating reports for decision-making
• Online, interactive resources
• Provides real-time professional development
• Designed in sections – pick & choose based on your needs

F2F Overview SY14-15
PVAAS Help Menus
109
F2F Overview SY14-15
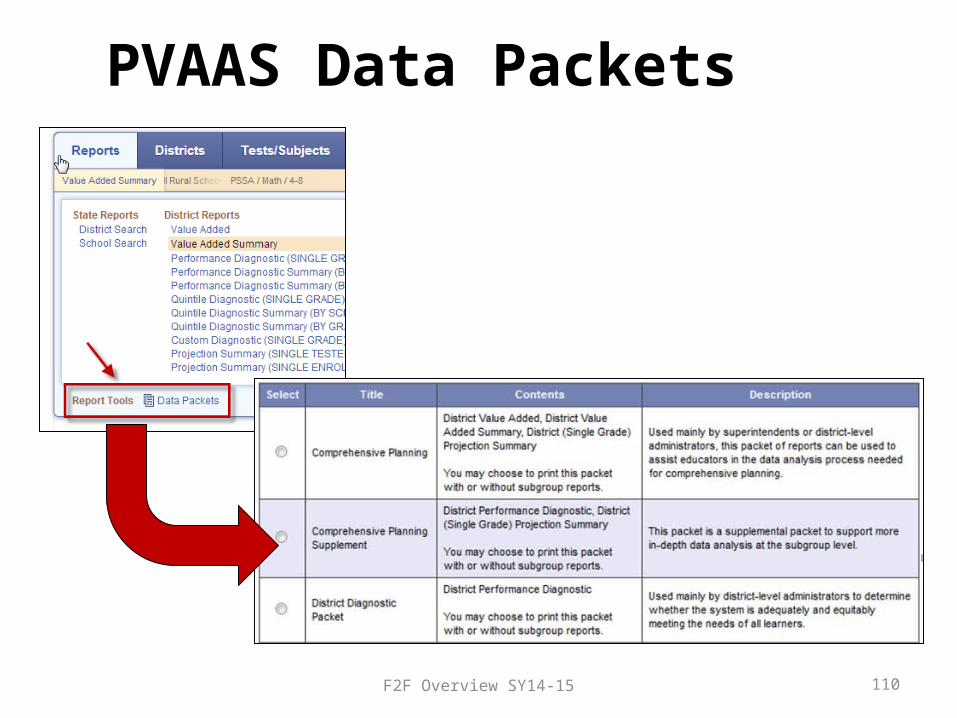
PVAAS Data Packets
110

F2F Overview SY14-15
PVAAS Data Packets
111
Packet choices include:• comprehensive planning• school level planning• grade and course level
planning• district diagnostic• school projection summaries• student projections


F2F Overview SY14-15 113http://www.education.state.pa.us/pvaas
Additional PVAAS Supports
F2F Overview SY14-15
Questions?PVAAS Materials or
Statewide Implementation
717-606-1911
PVAAS Report Web Site
https://pvaas.sas.com
114

www.pde.state.pa.us
PENNSYLVANIAValue Added Assessment System
______________________________________________________________________
PVAAS
333 Market Street Harrisburg, PA 17126