pw lca final report nov 232010 corr - american forest … life cycle assessment ... partial lca...
TRANSCRIPT

ncasi
N A T I O N A L C O U N C I L F O R A I R A N D S T R E A M I M P R O V E M E N T
LIFE CYCLE ASSESSMENT OF NORTH AMERICAN PRINTING AND WRITING PAPER
PRODUCTS
FINAL REPORT
prepared for
American Forest and Paper Association (AF&PA)
Forest Products Association of Canada (FPAC)
by
National Council for Air and Stream Improvement, Inc. (NCASI)
Research Triangle Park, NC
June 18, 2010
For more information about this research, contact:
Reid Miner Vice President, Sustainable Manufacturing NCASI P.O. Box 13318 Research Triangle Park, NC 27709-3318 (919) 941-6407 [email protected]
Kirsten Vice Vice President, Canadian Operations NCASI P.O. Box 1036, Station B Montreal, QC H3B 3K5 (514) 286-9111 [email protected]
Caroline Gaudreault Senior Research Scientist NCASI P.O. Box 1036, Station B Montreal, QC H3B 3K5 (514) 286-1182 [email protected]
Jay Unwin NCASI Fellow 10907 93rd Ave. SW Lakewood, WA 98498 (253) 507-8998 [email protected]
National Council for Air and Stream Improvement, Inc. (NCASI). 2010. Life cycle assessment of
North American printing and writing paper products. Unpublished Report. Research Triangle Park, NC: National Council for Air and Stream Improvement, Inc.
© 2010 by the National Council for Air and Stream Improvement, Inc.
List of Acronyms and Abbreviations
xii
LIST OF ACRONYMS AND ABBREVIATIONS
# pound, measure of basis weight
adst Air-dried short ton (10% water)
AF&PA American Forest and Paper Association
bbl Barrel
bdst Bone-dry short ton (@ 0% water)
BKMP Bleached kraft market pulp
BOD Biochemical oxygen demand
CORRIM Consortium for Research on Renewable Industrial Materials
COD Chemical oxygen demand
DFO Distillate fuel oil
DIP Deinked pulp
DQI Data quality indicator
FPAC Forest Products Association of Canada
GCC Ground calcium carbonate
gsm Gram per square meter (g/m2)
HWD Hardwood
ISO International Organization for Standardization
IUR Inventory Update Reporting
LCA Life cycle assessment
LCED Life cycle energy demand
LCI Life cycle inventory
LCIA Life cycle impact assessment

List of Acronyms and Abbreviations
xiii
LDPE Low density polyethylene
LPG Liquefied petroleum gas
MCF Methane correction factor
MDIP Market deinked pulp
mdst machine-dry short ton (@ 5% water)
MJ Megajoule
NPRI National Pollutant Release Inventory (Canada)
OCC Old corrugated containers
ONP Old newspapers
OMG Old magazines
PVA Polyvinyl acetate (adhesive)
PCC Precipitated calcium carbonate
PCS Permit Compliance System
PM Particulate matter
RFO Residual fuel oil
st Short ton
SWD Softwood
TRACI Tool for the Reduction and Assessment of Chemical and Other Environmental Impacts
TRI U.S. EPA Toxics Release Inventory
UCF Uncoated freesheet
U.S. EPA United States Environmental Protection Agency
VOC Volatile organic compounds

List of Acronyms and Abbreviations
xiv
Impact indicators
AC Acidification
CAR Carcinogenics
ECO Ecotoxicity
EU Eutrophication
FF Fossil fuel depletion
GW Global warming
NCAR Non-carcinogenics
OD Ozone depletion
RES Respiratory effects
SM Smog
AB Abiotic depletion
PO Photochemical oxidation
Glossary
xv
GLOSSARY
The main source for the definitions in this glossary is the ISO 14044 standard (ISO 2006b). Other references are specified at the end of the specific definitions.
Allocation: Partitioning the input or output flows of a process or a product system between the product system under study and one or more other product systems (ISO 2006b).
Background processes:
Modeled processes influenced by measures taken in the foreground system (Tillman 2000); system or process for which secondary data are used (Guinee, Goree et al. 2002). Processes that are incidental to the production of the evaluated product and not included in those used to determine foreground (primary operations/processes) attributes. In this study this includes, for instance, the production of electricity, fuels and chemicals used in the production of the pulp and paper. Forest and printing operations are also included in the background processes.
Basis weight: In the United States, the weight in pounds of 500 sheets of paper cut to a specified basic size. The basic size for writing paper is 17 in. x 22 in. - 500, which is approximately 1300 square feet. In most countries, the basis weight is expressed in grams per square meter (Kouris 2003).
Chemical pulp: Pulp obtained by using both chemical and heat energy to dissolve the lignin bond between fibers in wood. The primary chemical processes are the sulfate (kraft), sulfite, and soda (Kouris 2003).
Chemi-thermomechanical pulp:
Pulp produced from chemically impregnated wood chips, by means of pressurized refining at high consistencies (Kouris 2003).
CML method: A European method for impact assessment from the Institute of Environmental Science of Leiden University (Netherlands).
Coated: A term applied to paper and paperboard, the surface of which has been treated with clay or some other pigment and adhesive mixture, or other suitable material, to improve the finish with respect to printing quality, color, smoothness, opacity, or other surface properties. The term is also applied to lacquered and varnished papers (Kouris 2003).
Co-product: Any of two or more products coming from the same unit process or product system (ISO 2006b).
Glossary
xvi
CPM database: Life cycle inventory database by the Center for Environmental Assessment of Product and Material Systems (Chalmers University, Sweden).
Cradle-to-gate: Partial LCA model which includes the upstream part of a product life cycle, i.e., from raw material acquisition to the factory gate. Use and end-of-life stages are usually excluded from cradle-to-gate assessment. In this study, the gate is defined as end of the pulp and paper mill operations.
Cradle-to-grave: Complete LCA model which includes the full product life cycle, i.e., from raw material acquisition through production, use, end-of-life treatment, recycling and final disposal.
Data quality indicator:
Indicator that addresses the different characteristics of data that relate to their ability to satisfy stated requirements.
EDIP: Environmental design of industrial products, a Danish impact assessment method.
Equivalent: A measure used to compare different substances based on their relative contributions to a given impact category.
European Platform on LCA:
Established by the European Commission to support the availability and exchange of consistent and quality-assured life cycle data.
Feedstock energy: Heat of combustion of a raw material input that is not used as an energy source to a product system, expressed in terms of higher heating value or lower heating value (ISO 2006b).
Foreground system/process:
Process or the collection of processes on which measures may be taken concerning their selection or mode of operation as a result of decisions based on the study (Tillman 2000); a system or process for which site-specific data are collected (Guinee et al. 2002).In this study, the foreground processes are those required for pulp and papermaking production processes.
Freesheet: Paper free of mechanical wood pulp (Kouris 2003).
ecoinvent/ecoinvent database:
A product of the Swiss Center for Life Cycle Inventories, the ecoinvent life cycle inventory database is a world-leading source of LCI data.
Function: ISO does not provide a formal definition for function. However, it states that “the scope of an LCA shall clearly specify the functions
(performance characteristics) of the system being studied.” (ISO 2006b)

Glossary
xvii
Functional unit: Quantified performance of a product system for use as a reference unit (ISO 2006b).
Gate-to-gate: Partial LCA model which considers only one unit process of the product life cycle.
Life cycle energy demand:
Energy used throughout the life cycle of a good or service. In this study, the cumulative life cycle energy demand method was employed.
Mechanical paper: Paper made in major part from mechanical wood pulp (Kouris 2003).
Mechanical pulp: A high-yield pulp produced from wood by a variety of mechanical pulping processes. It is characterized as a wood pulp with high lignin content. It is primarily suitable for printing grade papers, but can be used in other paper grades, like tissue, board, and fluffed pulps (Kouris 2003).
Methane correction factor:
The fraction of wastes that will decompose under aerobic conditions (prior to the conditions becoming anaerobic in the landfill (IPCC 2007).
North America: U.S. and Canada (unless otherwise specified).
Number of subsequent uses allocation procedure:
This method essentially allocates the environmental impacts of virgin paper production based on the number of subsequent uses of the recovered paper. It requires data estimating recovery rates and process yields for the entire cascade.
Open-loop recycling: For the purpose of this study is considered to be recycling of material generated in one product system into a different product system.
Primary data: Data specific to the processes studied.
Product system: Collection of unit processes with elementary and product flows, performing one or more defined functions, and which models the life cycle of a product (ISO 2006b).
Ream of office paper: A sealed or banded package containing the required number of sheets. In this study, a dream of office paper is 500 pages with a sheet size of 21.59 cm x 27.94 cm (8.5 in. x 11 in.).
ReCiPE: European method for impact assessment.
Reference flow: Measure of the outputs from processes in a given product system required to fulfill the function expressed by the functional unit.

Glossary
xviii
Renewable life cycle energy demand:
In this study, life cycle energy demand was characterized using ecoinvent’s cumulative life energy demand method (Hischier and Weidema 2009). Under renewable energy, this method includes biomass, wind, solar, geothermal and water energy.
Renewable resources:
Natural resources that are capable of regeneration. Renewable resources can essentially never be exhausted, usually because they are continuously produced (e.g., tree biomass, fresh water, and fish). Renewable resources are those natural resources that are naturally replenished, but whose continued supply depends, in many cases, on proper management (e.g., tree biomass, fresh water, fish) (http://www.ec.gc.ca/cppic/en/glossary.cfm?view=details&id=192).
Secondary data: Data from databases or literature or estimated data.
SimaPro™ LCA software:
SimaPro™ is one of the most widely used LCA software. It is used in managing and editing the data required in an LCA, to structure the modeled scenario and calculate the environmental indicator results.
Thermomechanical pulp:
A mechanical pulp produced from wood chips, where the wood particles are softened by pre-heating in a pressurized vessel at temperatures not exceeding the glass transition point of the lignin, before a pressurized primary refining stage (Kouris 2003).
TRACI: Tool for the Reduction and Assessment of Chemical and Other Environmental Impacts, a U.S. impact assessment (LCIA) method.
Uncoated freesheet: An uncoated paper used for printing, writing, and related applications, and made almost wholly from chemical wood pulps (Kouris 2003).
Uncoated mechanical paper:
Mechanical paper that has not been pigment coated (Smook 2001).
Unit process: Smallest element considered in the life cycle inventory analysis for which input and output data are quantified (ISO 2006b).
USEtox: The UNEP-SETAC toxicity model, with recommended characterization factors for human toxicity and freshwater ecotoxicity in life cycle impact assessment.

Executive Summary
xix
EXECUTIVE SUMMARY
ES.1 BACKGROUND AND OBJECTIVES
The American Forest and Paper Association (AF&PA) and the Forest Products Association of Canada (FPAC) have commissioned a study of the life cycle for four North American grades of printing and writing (P&W) papers. The specific products that have been examined are 1) a ream of office paper made of uncoated freesheet, 2) a telephone directory made of primarily of uncoated mechanical paper, 3) a catalog made primarily of coated freesheet, and 4) a magazine made primarily of coated mechanical paper. Although this study comprises entire LCAs, cradle-to-gate inventory results for the four grades of paper have also been prepared to facilitate studies of other products made from these grades.
The goal of this study is to characterize the potential environmental life cycle impacts associated with these four industry average P&W paper products manufactured in U.S. and Canada in 2006/20071. While the results of this study are valid for the average product investigated, the results may not be representative of specific products made of paper from specific mills because of mill-to-mill differences in performance. The results of LCA studies on paper from specific companies are unlikely to be the same as those for the industry average.
This study complies with the ISO 14044 requirements. Note that the study does not compare products but in order to facilitate the use of the information in any future comparative studies, the study also complies with, to the appropriate extent, the ISO 14044 requirements regarding comparative assertions disclosed to the public2. If LCA results are used for comparative assertions, the systems compared must be functionally equivalent, with any differences between analyzed systems being identified and reported. If the comparison is intended to be disclosed to the public, ISO 14044 requires that interested parties conduct an additional peer review.
The study and report have been reviewed by an external peer review panel. The panelists’ comments and the responses to those comments have been included in this report, in accordance with ISO standards. The panel consisted of the following individuals.
• Martha Stevenson, Chairperson – Private Consultant to the public interest with ten years of
experience in sustainability, environmental management, packaging and materials recovery.
Led the development of the Design Guidelines for Sustainable Packaging and the COMPASS
software used to compare the environmental impacts of package designs.
• Pascal Lesage – Life cycle assessment consultant (formerly with Sylvatica), Associate
Professor at École Polytechnique de Montréal [at the Inter-University Research Centre for
the Life Cycle of Products, Processes and Services (CIRAIG) in Montreal].
1 Using 2006 U.S. data and 2007 Canadian data, per currently available data from AF&PA and FPAC, respectively.
2 Since no products are actually compared, some requirements cannot be met.

Executive Summary
xx
• Dale Phenicie, Environmental Affairs Consulting – Consultant with 35 years of experience in
environmental protection and process consulting for the forest products industry. Has
served on several U.S. EPA Task Forces dealing with water quality issues and authored
several AF&PA Environmental, Health and Safety/Sustainability reports.
The critical review in no way implies that the panel members endorse the results of the LCA study, nor that they endorse the assessed products. It ensures that the study, among other requirements, was carried on according to the provisions of the ISO standards.
ES.2 NORTH AMERICAN P&W PAPER PRODUCTS SYSTEMS
The four products investigated in this study are described in Table ES-1. The products were selected to be representative of major end uses for four different grades of paper: uncoated freesheet, coated freesheet, uncoated mechanical paper and coated mechanical paper. More detail regarding the four grades of paper and the associated product systems is provided in subsequent sections.
Table ES-1. Description of P&W Paper Products
Characteristics
Paper Product
Ream of office paper
Catalog Telephone directory Magazine
Paper Uncoated freesheet
Coated freesheet (CF)
Uncoated mechanical paper
Coated mechanical paper
Basis weight 20# (75 gsm3) 45# (68 gsm) 22# (36 gsm) 38# (57 gsm)
Number of pages 500 sheets 72 pages
(36 sheets, CF) 1200 pages (600 sheets)
120 pages
(60 sheets)
Format 8 ½’’ x 11’’ 8’’ x 10.5’’ 8 ½’’ x 10 ½’’ x 2’’ 8’’ x 10.5’’
Cover pages/ Packaging
Paper wrap 2 covers (CF), 60#
(90 gsm) 2 covers (bleached board),
123# (200 gsm) 2 covers (CF), 60#
(90 gsm)
Printing N/A 64% offset, 36%
rotogravure Offset printing
64% offset, 36% rotogravure
ES.2.1 OFFICE PAPER (MADE FROM UNCOATED FREESHEET)
Almost all office paper included in this study is produced by U.S. mills using a variety of pulp sources. About 4% of the fiber needed to produce the office paper comes from recovered fiber4, primarily market deinked pulp (MDIP), with the balance being supplied by bleached kraft pulp. Most of the bleached kraft pulp used in uncoated freesheet is produced on site although bleached kraft market pulp (produced primarily in Canada and U.S.) is also used. No separate converting operations are included in the office paper system because the operations required
3 Basis weight is expressed as “as is” (5% water) weights in grams per square meter (gsm).
4 The scope of the study addressed the average paper produced in North America, so the paper modeled in the LCA contains the
average amounts of recovered fiber. The results would change if the average recovered fiber content changed.

Executive Summary
xxi
to convert paper rolls to finished product (i.e., cutting and packaging) are included in the operations performed at the paper mill. Based on U.S. EPA data for “office-type papers”, it has been assumed that, after use, 71.8% of used office paper is recovered for recycling, 5.2% is burned for energy and 23.0% is sent to landfills. By recovering 71.8% of used office paper, this product system supplies recovered fiber to other systems (subsequent uses of the fiber). In this study, it was assumed that paper is used and disposed of in the U.S.
ES.2.2 CATALOG (MADE FROM COATED FREESHEET)
All coated freesheet included in this study is produced by U.S. mills using a variety of pulp sources. About 5% of the fiber needed to produce the catalog comes from recovered fiber5, primarily market deinked pulp (MDIP) and old newspapers (ONP), with the balance being supplied by bleached kraft pulp. Most of the bleached kraft pulp is produced on-site but market pulp (produced primarily in Canada and U.S.) is also used. Life cycle environmental impacts pertaining to converting operations required to convert the coated freesheet into a catalog (primarily printing) are included in this study. These were modeled based on data from a European study (see body of report for complete citation) adapted for the U.S. electricity grid (i.e., the printing is assumed to occur in the U.S.). Based on U.S. EPA data for “other commercial printing”, it has been assumed that, after use, 32.7% of used catalogs is recovered for recycling, 12.5% is burned for energy and 54.8% is sent to landfills. By recovering 32.7% of used catalogs, this product system supplies recovered fiber to other systems (subsequent uses of the fiber). In this study, it was assumed that paper is used and disposed of in U.S.
ES.2.3 TELEPHONE DIRECTORY (MADE FROM UNCOATED MECHANICAL PAPER)
About 20% of North American uncoated mechanical paper is produced by U.S. mills while 80% is produced in Canada. About 20% of the fiber needed to produce directory paper comes from recovered fiber6 (a mix of MDIP, ONP, old magazines and mixed papers), with the balance being supplied by bleached mechanical pulp (produced and purchased) and some chemical pulp (produced on site and/or purchased). Life cycle environmental impacts pertaining to converting operations required to convert the uncoated mechanical paper into a catalog (primarily printing) are included in this study. These were modeled based on data from a European study (see body of report for complete citation) adapted for the U.S. electricity grid (i.e., the printing is assumed to occur in the U.S.). According to U.S. EPA, 19.1% of used directories is recovered for recycling, 15.0% is burned for energy and 65.9% is sent to landfills. By recovering 19.1% of used directories, this product system supplies recovered fiber to other systems (subsequent uses of the fiber). In this study, it was assumed that paper is used and disposed of in the U.S.
5 The scope of the study addressed the average paper produced in North America, so the paper modeled in the LCA contains the
average amounts of recovered fiber. The results would change if the average recovered fiber content changed. 6 Ibid.

Executive Summary
xxii
ES.2.4 MAGAZINES (MADE FROM COATED MECHANICAL PAPER)
About 80% of North American coated mechanical paper is produced by U.S. mills while 20% is produced in Canada. About 2% of the fiber needed to produce uncoated mechanical paper comes from recovered fiber7, primarily ONP used to produce deinked pulp on site, with the balance being supplied by bleached mechanical pulp and some kraft pulp (produced on site and/or purchased). Life cycle environmental impacts pertaining to converting operations required to convert the coated mechanical paper into a magazine (primarily printing) are included in this study. These were modeled based on data from a European study (see body of report for complete citation) adapted for the U.S. electricity grid (i.e., the printing is assumed to occur in the U.S.). According to U.S. EPA, 38.6% of used magazines is recovered for recycling, 11.4% is burned for energy and 50.0% is sent to landfills. By recovering 38.6% of used magazines, this product system supplies recovered fiber to other systems (subsequent uses of the fiber). In this study, it was assumed that paper is used and disposed of in the U.S.
ES.3 LIFE CYCLE STUDY DESIGN AND METHODS EMPLOYED
The functional units8 defined for this study are presented in Table ES-2.
Table ES-2. Function, Functional Unit and Reference Flows
Paper Product
Function*
Functional unit* Reference flow
Office paper Production, delivery and end-of-life management of office paper
The production in the U.S. and Canada, delivery to an average U.S. customer, use and final disposal of 1 standard ream of office paper
The different process outputs for the production of 1 ream of office paper (containing 2.15 kg/4.73 lb of uncoated freesheet, dry weight)
Catalog Production, delivery, use and end-of-life management of catalogs
The production in the U.S. and Canada, delivery to an average U.S. customer, use and final disposal of standard catalog
The different process outputs for the production of 1 catalog (containing 0.135 kg/0.297 lb of coated freesheet, dry weight))
Telephone directory
Production, delivery, use and end-of-life management of telephone directory
The production in the U.S. and Canada, delivery to an average U.S. customer, use and final disposal of a standard telephone directory
The different process outputs for the production of 1 telephone directory (containing 1.18 kg/2.60 dry lb of uncoated mechanical paper and 0.0244 kg/0.0538 dry lb of bleached board, dry weight)
Magazine Production, delivery, use and end-of-life management of catalogs
The production in the U.S. and Canada, delivery to an average U.S. customer, use and final disposal of a standard magazine
The different process outputs for the production of 1 magazine (containing 0.176 kg/0.388 lb of coated mechanical paper, and 0.0093 kg/0.0204 dry lb of coated freesheet, dry weight)
*Function and functional unit assessed in this study are not necessarily suitable for comparative analyses.
The system boundaries in the study include the entire life cycle of the paper product, starting in the forest and extending through manufacturing, use, recovery, and end-of-life (cradle-to-
7 The scope of the study addressed the average paper produced in North America, so the paper modeled in the LCA contains the
average amounts of recovered fiber. The results would change if the average recovered fiber content changed. 8 ISO defines the functional unit as the quantified performance of the product system but not specify what “performance” is. Other
authors define the functional unit as the quantification of a service provided by a product system.
Executive Summary
xxiii
grave). Transport is also included. The data are from 2006-20079, or a date as close as possible to those years.
Instead of applying cut-off criteria for data completeness, attempts have been made to be as comprehensive as possible. The data10 for the study were obtained from the following sources.
• Most of the mill-level environmental and energy data for pulp and paper manufacturing were obtained from biennial surveys conducted by AF&PA and FPAC. Environmental data for some parameters were obtained from government databases.
• Data on the types and amounts of material inputs and outputs at pulp and paper mills producing P&W paper were obtained from the database of Fisher International.
• Printing data were obtained from a European study (see body of report for complete citation).
• Data and models for other aspects of the life cycle (e.g., for landfills) were obtained from a number of government sources, public life cycle databases (U.S. LCI and ecoinvent), and published studies.
Where allocation was needed to address co-products, shared processes and open-loop recycling of recovered fiber, the allocation was done using what was considered to be the most suitable available method, with alternative methods being used in sensitivity analyses, as appropriate. For open-loop recycling of recovered fiber, the “number of subsequent uses” allocation approach, illustrated in ISO 14049, was used.
The life cycle modeling and calculations were done in the SimaPro™ LCA software. Potential environmental impacts were characterized using the TRACI impact assessment method developed by U.S. EPA, with the CML (2001) method used in a sensitivity analysis. Impact indicator results were developed for global warming11, acidification, respiratory effects, eutrophication, stratospheric ozone depletion, smog and fossil fuel depletion12 13. TRACI also includes impact categories related to emission of toxic substances (carcinogenics, non-carcinogenics, and ecotoxicity). Results were also developed for these categories. However, because of the uncertainty associated with those, the results are not presented in the executive summary. More details can be found in the body of the report. In addition, inventory results were developed for life cycle energy demand, water use, and solid waste generation.
Note: The fossil fuel depletion indicator accounts for the fact that continued extraction and production of fossil fuels tend to consume the most economically recoverable reserves first so that continued extraction will become more energy intensive in the future. The fossil fuel
9 U.S. data from AF&PA are from 2006, while Canadian data from FPAC are from 2007.
10 All mills making the grades under study and for which sufficient data were available, were included.
11 In accordance with accepted greenhouse gas accounting practices, biomass carbon and biomass-derived CO2 were tracked
separately from fossil fuel-derived CO2 and other greenhouse gases in the LCI. The effects of biomass carbon on the atmosphere were characterized by calculating the changes in the stocks of stored carbon through the life cycle of the product (globally, the net change in total stocks of stored biomass carbon is mathematically equal to the net flow of biomass carbon to/from the atmosphere). 12
Name of all impact categories as defined in the TRACI method. 13
Results were also obtained for several toxicity-related indicators but the results proved to be highly imprecise and of uncertain significance, so they are not discussed in the executive summary.

Executive Summary
xxiv
depletion indicator is an attempt to estimate the incremental energy requirements per unit of consumption of fuel in the future compared to today’s conditions.
Impact assessment results are relative expressions and do not predict impacts, the exceeding of thresholds, safety margins, or risks and the following limitations should be considered when interpreting the results.
• The results have low spatial and temporal resolution, which means that LCA is not well suited to addressing impacts for which the severity is significantly affected by local conditions or the timing of releases (such as toxicity-related indicators), rather, they indicate the potential for such impacts to occur;
• The study does not examine every potentially relevant impact category. For instance, land use results are not presented in this report because impact assessment methodologies are still under development and inventory numbers are difficult to interpret without generally accepted impact assessment methodologies and could easily be misused; and
• There is uncertainty in modeling assumptions, data, and impact assessment.
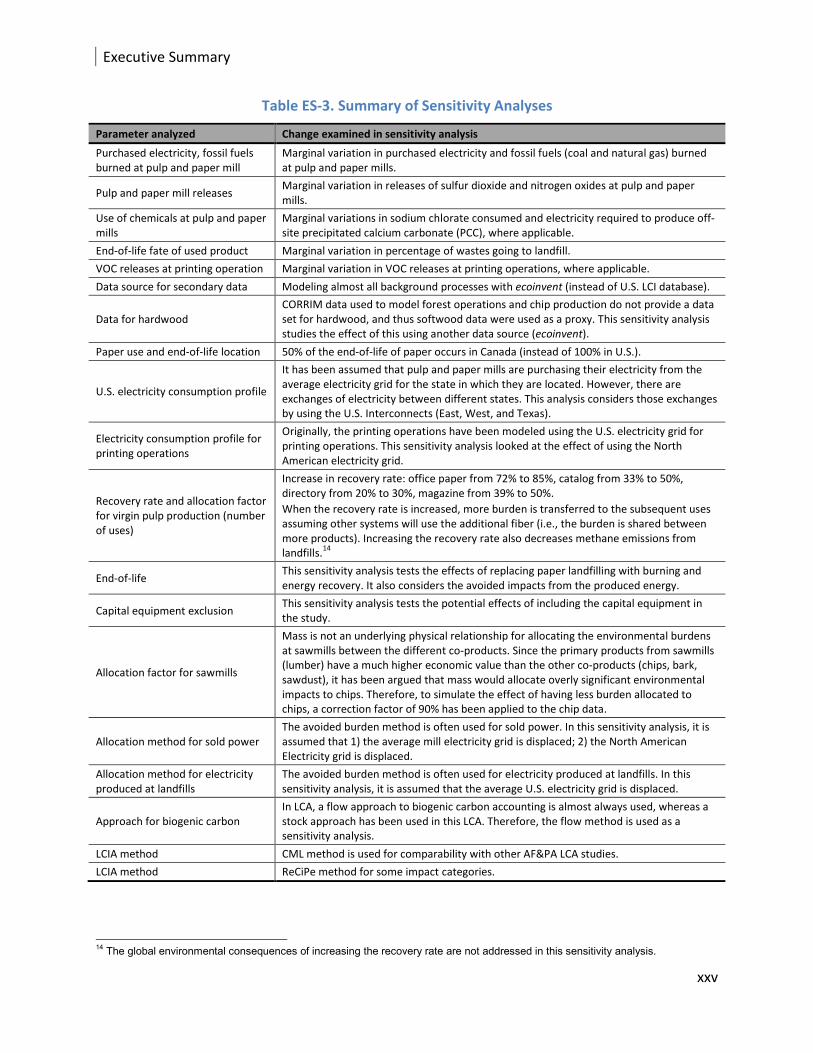
In addition, a series of sensitivity analyses (summarized in Table ES-3) was also performed to better understand the results.
Executive Summary
xxv
Table ES-3. Summary of Sensitivity Analyses
Parameter analyzed Change examined in sensitivity analysis
Purchased electricity, fossil fuels burned at pulp and paper mill
Marginal variation in purchased electricity and fossil fuels (coal and natural gas) burned at pulp and paper mills.
Pulp and paper mill releases Marginal variation in releases of sulfur dioxide and nitrogen oxides at pulp and paper mills.
Use of chemicals at pulp and paper mills
Marginal variations in sodium chlorate consumed and electricity required to produce off-site precipitated calcium carbonate (PCC), where applicable.
End-of-life fate of used product Marginal variation in percentage of wastes going to landfill.
VOC releases at printing operation Marginal variation in VOC releases at printing operations, where applicable.
Data source for secondary data Modeling almost all background processes with ecoinvent (instead of U.S. LCI database).
Data for hardwood CORRIM data used to model forest operations and chip production do not provide a data set for hardwood, and thus softwood data were used as a proxy. This sensitivity analysis studies the effect of this using another data source (ecoinvent).
Paper use and end-of-life location 50% of the end-of-life of paper occurs in Canada (instead of 100% in U.S.).
U.S. electricity consumption profile
It has been assumed that pulp and paper mills are purchasing their electricity from the average electricity grid for the state in which they are located. However, there are exchanges of electricity between different states. This analysis considers those exchanges by using the U.S. Interconnects (East, West, and Texas).
Electricity consumption profile for printing operations
Originally, the printing operations have been modeled using the U.S. electricity grid for printing operations. This sensitivity analysis looked at the effect of using the North American electricity grid.
Recovery rate and allocation factor for virgin pulp production (number of uses)
Increase in recovery rate: office paper from 72% to 85%, catalog from 33% to 50%, directory from 20% to 30%, magazine from 39% to 50%.
When the recovery rate is increased, more burden is transferred to the subsequent uses assuming other systems will use the additional fiber (i.e., the burden is shared between more products). Increasing the recovery rate also decreases methane emissions from landfills.
14
End-of-life This sensitivity analysis tests the effects of replacing paper landfilling with burning and energy recovery. It also considers the avoided impacts from the produced energy.
Capital equipment exclusion This sensitivity analysis tests the potential effects of including the capital equipment in the study.
Allocation factor for sawmills
Mass is not an underlying physical relationship for allocating the environmental burdens at sawmills between the different co-products. Since the primary products from sawmills (lumber) have a much higher economic value than the other co-products (chips, bark, sawdust), it has been argued that mass would allocate overly significant environmental impacts to chips. Therefore, to simulate the effect of having less burden allocated to chips, a correction factor of 90% has been applied to the chip data.
Allocation method for sold power The avoided burden method is often used for sold power. In this sensitivity analysis, it is assumed that 1) the average mill electricity grid is displaced; 2) the North American Electricity grid is displaced.
Allocation method for electricity produced at landfills
The avoided burden method is often used for electricity produced at landfills. In this sensitivity analysis, it is assumed that the average U.S. electricity grid is displaced.
Approach for biogenic carbon In LCA, a flow approach to biogenic carbon accounting is almost always used, whereas a stock approach has been used in this LCA. Therefore, the flow method is used as a sensitivity analysis.
LCIA method CML method is used for comparability with other AF&PA LCA studies.
LCIA method ReCiPe method for some impact categories.
14
The global environmental consequences of increasing the recovery rate are not addressed in this sensitivity analysis.
Executive Summary
xxvi
ES.4 RESULTS – OFFICE PAPER (UNCOATED FREESHEET)
The following sections present a summary of results and sensitivity analyses for office paper (uncoated freesheet).
ES.4.1 LIFE CYCLE IMPACT ASSESSMENT RESULTS
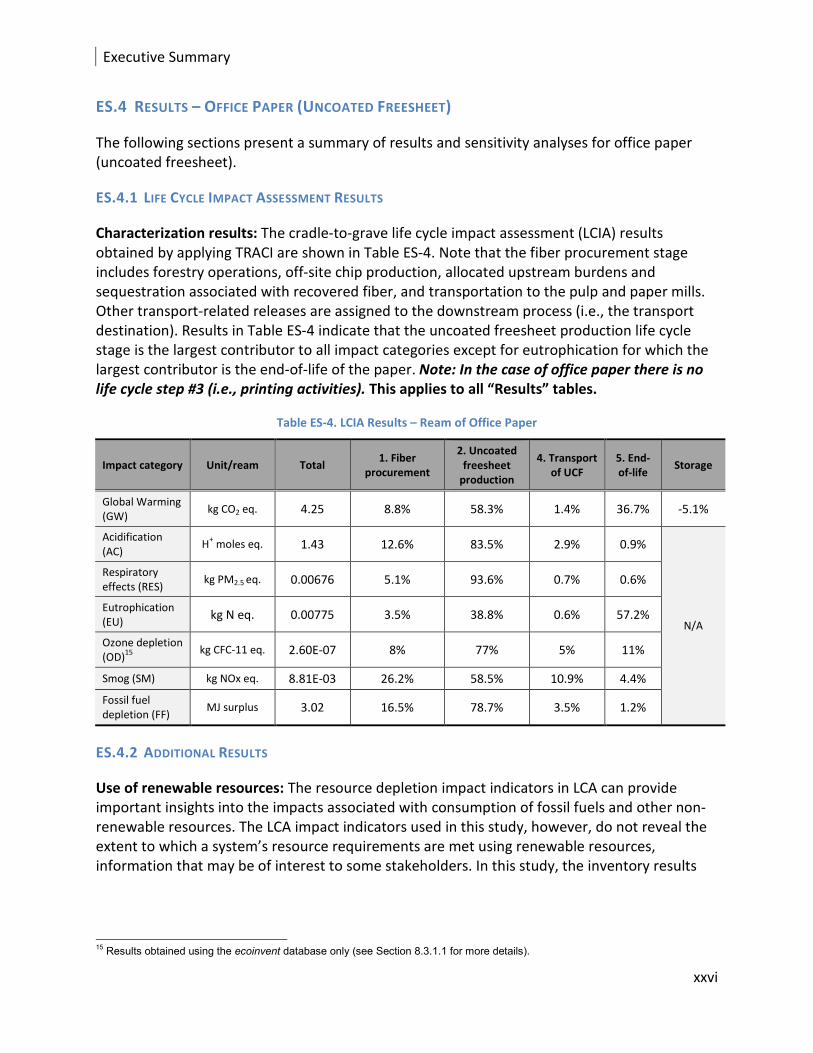
Characterization results: The cradle-to-grave life cycle impact assessment (LCIA) results obtained by applying TRACI are shown in Table ES-4. Note that the fiber procurement stage includes forestry operations, off-site chip production, allocated upstream burdens and sequestration associated with recovered fiber, and transportation to the pulp and paper mills. Other transport-related releases are assigned to the downstream process (i.e., the transport destination). Results in Table ES-4 indicate that the uncoated freesheet production life cycle stage is the largest contributor to all impact categories except for eutrophication for which the largest contributor is the end-of-life of the paper. Note: In the case of office paper there is no
life cycle step #3 (i.e., printing activities). This applies to all “Results” tables.
Table ES-4. LCIA Results – Ream of Office Paper
Impact category Unit/ream Total 1. Fiber
procurement
2. Uncoated freesheet
production
4. Transport of UCF
5. End-of-life
Storage
Global Warming (GW)
kg CO2 eq. 4.25 8.8% 58.3% 1.4% 36.7% -5.1%
Acidification (AC)
H+ moles eq. 1.43 12.6% 83.5% 2.9% 0.9%
N/A
Respiratory effects (RES)
kg PM2.5 eq. 0.00676 5.1% 93.6% 0.7% 0.6%
Eutrophication (EU)
kg N eq. 0.00775 3.5% 38.8% 0.6% 57.2%
Ozone depletion (OD)
15
kg CFC-11 eq. 2.60E-07 8% 77% 5% 11%
Smog (SM) kg NOx eq. 8.81E-03 26.2% 58.5% 10.9% 4.4%
Fossil fuel depletion (FF)
MJ surplus 3.02 16.5% 78.7% 3.5% 1.2%
ES.4.2 ADDITIONAL RESULTS
Use of renewable resources: The resource depletion impact indicators in LCA can provide important insights into the impacts associated with consumption of fossil fuels and other non-renewable resources. The LCA impact indicators used in this study, however, do not reveal the extent to which a system’s resource requirements are met using renewable resources, information that may be of interest to some stakeholders. In this study, the inventory results
15
Results obtained using the ecoinvent database only (see Section 8.3.1.1 for more details).

Executive Summary
xxvii
document that 62% (mass basis) of the total life cycle resource requirements (excluding water)16 for a ream of office paper is renewable (i.e., wood fiber).
Life cycle energy demand (LCED) by type: Table ES-5 shows the life cycle energy demand by type for one ream of office paper. The results in this table are not measures of potential impact associated with this demand. In the impact assessment for this study, only fossil fuel extraction is considered in the calculation of resource depletion (using the fossil fuel depletion impact indicator which, by definition, does not include renewable energy).
The results show that almost 100% of the renewable energy and 84% of the non-renewable energy is used in paper production life cycle stage.
Table ES-5. Life Cycle Energy Demand by Type per Functional Unit (Ream of Office Paper)
Type of energy demand
Total
(MJ/ream)
1- Fiber procurement
2- Uncoated freesheet production
4- Transport and use
5- End-of-Life
Fossil 36.6 12.7% 84.2% 2.2% 0.9%
Nuclear17
1.2 8.3% 89.1% 0.0% 2.5%
Total non-renewable 37.8 12.5% 84.4% 2.1% 0.9%
Biomass 29.9 1.0% 99.0% 0.0% 0.0%
Wind, solar, geothermal
0.03 14.9% 84.0% 0.2% 0.9%
Water (hydroelectric) 1.0 7.8% 91.5% 0.1% 0.6%
Total renewable 31.0 1.2% 98.8% 0.0% 0.0%
Total 68.8 7.4% 90.9% 1.2% 0.5%
Water use: Water use impact assessment methodologies are still under development. Nonetheless, water use is often a metric of interest in sustainability programs. In this study, life cycle water use was calculated, with water use being broadly defined to include all water that is used, even if it is returned to the environment after use, but not including water used to produce hydropower. Of the 160 kg (353 pounds) of water associated with the ream of office paper life cycle, 133 kg (293 pounds) are used at the mill to manufacture the paper. Over 90% of this water is returned to the environment in liquid form.
ES.4.3 INTERPRETATION
Uncertainty The uncertainty in the results was evaluated using a semi-quantitative procedure that examines the relative uncertainty associated with the different impact indicators (fully quantitative uncertainty assessment is not practical for most life cycle studies). The assessment addressed the effects of uncertainty in the inventory data only. The uncertainty associated with impact
16
The data do not allow for characterizing water consumption, only water use numbers are available. Hence, water consumption was not included in the total resource consumption indicator. 17
From purchased power, mostly from background processes.
Executive Summary
xxviii
modeling can be considerable but is difficult to quantify. The assessment suggests that the global warming, acidification, respiratory effects, ozone depletion, smog and fossil fuel depletion indicators present relatively low data uncertainty compared to the others.
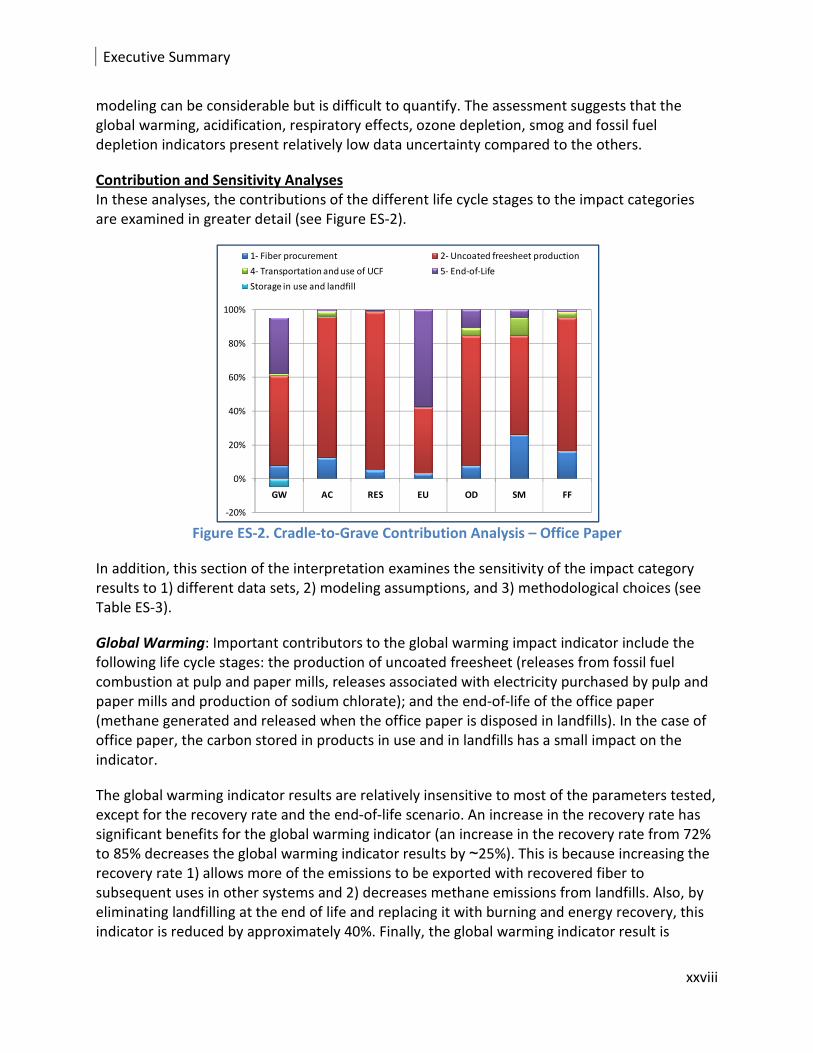
Contribution and Sensitivity Analyses In these analyses, the contributions of the different life cycle stages to the impact categories are examined in greater detail (see Figure ES-2).
Figure ES-2. Cradle-to-Grave Contribution Analysis – Office Paper
In addition, this section of the interpretation examines the sensitivity of the impact category results to 1) different data sets, 2) modeling assumptions, and 3) methodological choices (see Table ES-3).
Global Warming: Important contributors to the global warming impact indicator include the following life cycle stages: the production of uncoated freesheet (releases from fossil fuel combustion at pulp and paper mills, releases associated with electricity purchased by pulp and paper mills and production of sodium chlorate); and the end-of-life of the office paper (methane generated and released when the office paper is disposed in landfills). In the case of office paper, the carbon stored in products in use and in landfills has a small impact on the indicator.
The global warming indicator results are relatively insensitive to most of the parameters tested, except for the recovery rate and the end-of-life scenario. An increase in the recovery rate has significant benefits for the global warming indicator (an increase in the recovery rate from 72% to 85% decreases the global warming indicator results by ~25%). This is because increasing the recovery rate 1) allows more of the emissions to be exported with recovered fiber to subsequent uses in other systems and 2) decreases methane emissions from landfills. Also, by eliminating landfilling at the end of life and replacing it with burning and energy recovery, this indicator is reduced by approximately 40%. Finally, the global warming indicator result is
-20%
0%
20%
40%
60%
80%
100%
GW AC RES EU OD SM FF
1- Fiber procurement 2- Uncoated freesheet production
4- Transportation and use of UCF 5- End-of-Life
Storage in use and landfill

Executive Summary
xxix
relatively insensitive to the approach for carbon accounting. Uncertainty in the global warming indicator results is relatively low.
Acidification: The main contributor to the acidification indicator is the uncoated freesheet life cycle stage. Specifically, releases of sulfur dioxide and nitrogen oxides from the process and the combustion of fuels, purchased electricity, and the production of sodium chlorate are the largely responsible for acidification. Truck transportation of the fiber (fiber procurement life cycle stage) is also a non-negligible contributor.
The acidification indicator results are sensitive to
• the data set employed (U.S. LCI and ecoinvent versus ecoinvent only);
• the recovery rate (an increase in the recovery rate from 72% to 85% decreases the acidification indicator results by 15%, mainly because more burden is transferred to subsequent uses); and
• the end-of-life scenario (substituting landfill with energy recovery leads to a 15% benefit mainly because of the avoided electricity production).
They are not very sensitive to other parameters. Uncertainty in the acidification indicator results is relatively low.
Respiratory Effects: The most important contributor to the respiratory effects is the uncoated freesheet life cycle stage (on-site releases, natural gas consumption, purchased electricity, and manufacturing of some chemicals). Less important contributors include use of natural gas and electricity in the fiber procurement life cycle stage.
This indicator is generally not sensitive to the parameters tested during the sensitivity analyses, except for the increase in recovery rate (an increase in the recovery rate from 72% to 85% decreases the respiratory effects indicator by 15%; see Table ES-3 for more explanation). The uncertainty associated with the respiratory effects indicator is estimated to be relatively low.
Eutrophication: The end of life of paper (as indicated through COD from the leachate of municipal paper landfill) is the life cycle stage that contributes the most to eutrophication. It is important to note that the TRACI method characterizes both COD and BOD as having an effect on eutrophication, which is probably double-counting if both COD and BOD are reported for the same unit process (as is the case for waste paper in landfills), given that they are interrelated18.
This indicator is not sensitive to any of the parameters tested except the recovery rate of the paper (an increase in the recovery rate from 72% to 85% reduces the eutrophication indicator results by 34%) and the end-of-life scenario (assuming that all landfilled product is burned for energy recovery and creding the system with an avoided electricity production reduce the
18
Landfill releases to water and soil were modeled using the ecoinvent database which considers an infinite time horizon and integrates over time releases arising after 100 years by assuming the collection system will fail after 100 years and that everything is emitted to groundwater. The degradability of wastes is used to model short-term releases (< 100 years). Releases beyond the 100-year horizon could have been excluded since these are specifically tagged as “long-term” emissions in the database. However, in order to be consistent with the carbon degradability approach taken, the database was not modified.

Executive Summary
xxx
results by 52%). Its relative uncertainty is moderate, meaning that the uncertainty is higher than for the indicators for global warming potential, acidification, respiratory effects, ozone depletion, smog and fossil fuel depletion.
Stratospheric Ozone Depletion19: The main contributing life cycle stage is the production of the
uncoated freesheet [wood and black liquor combustion, production of residual fuel oil (RFO)]. The ozone depletion indicator is highly sensitive to the data set employed (U.S. LCI and ecoinvent versus ecoinvent only). Uncertainty in the ozone depletion indicator results is relatively low.
Photochemical Oxidants (Smog): Important contributors to smog include the following life cycle stages: uncoated freesheet production (on-site releases, purchased electricity); fiber procurement (transportation and fuel usage); and transportation of the office paper to its use phase. Smog is relatively insensitive to most parameters tested except for end-of-life scenarios: increasing the recovery rate from 72% to 85% leads to a 15% of the indicator results (see Table ES-3 for more explanation); substituting landfill by burning with energy recovery also leads to a 15% of the indicator results. The uncertainty in the results for this indicator is also estimated to be relatively low.
Fossil Fuel Depletion: Uncoated freesheet production is the life cycle stage contributing the most to the fossil fuel depletion life cycle stage. More specifically, on-site usage of natural gas and oil, purchased electricity and production of sodium chlorate are significant contributors.
The fossil fuel depletion indicator results are generally insensitive to the parameters tested except for the increase in the recovery rate which leads to a 15% improvement of the indicator results (see Table ES-3 for more explanation). The uncertainty in the results for this indicator is also estimated to be relatively low.
ES.5 RESULTS – CATALOG (COATED FREESHEET)
ES.5.1 LIFE CYCLE IMPACT ASSESSMENT RESULTS
Characterization results: The cradle-to-grave life cycle impact assessment (LCIA) results from TRACI are shown in Table ES-6. Note that the fiber procurement stage includes forestry operations, off-site chip production, allocated upstream burdens and sequestration associated with recovered fiber, and transportation to the pulp and paper mills. Other transport-related releases are assigned to the downstream process (i.e., the transport destination). Results in Table ES-6 indicate that the coated freesheet production life cycle stage is the largest contributor to all impact categories except for the eutrophication indicator, for which the largest contributor is the end-of-life of the paper.
19
Results obtained using the ecoinvent database only. For more details, see the sensitivity analysis section.

Executive Summary
xxxi
Table ES-6. LCIA Results – Catalog
Impact category
Unit
Total
(unit/ catalog)
1- Fiber procurement
2- Coated freesheet
production
3- Production of catalogs
4- Transport and use
5- End-
of-life
Storage in use and
landfill
Global Warming (GW)
kg CO2 eq.
4.89E-01 5.4% 43.6% 15.7% 1.2% 37.7% -3.4%
Acidification (AC)
H+ moles
eq. 1.67E-01 7.6% 67.4% 21.1% 1.1% 2.9%
N/A
Respiratory effects (RES)
kg PM2.5
eq. 6.52E-04 3.5% 77.9% 15.6% 0.3% 2.6%
Eutrophication (EU)
kg N eq. 8.85E-04 1.9% 19.0% 6.2% 0.2% 72.8%
Ozone depletion (OD)20
kg CFC-11 eq.
2.63E-08
6% 53% 31% 4% 7%
Smog (SM) kg NOx
eq. 2.10E-03 7.7% 36.4% 48.7% 1.8% 5.3%
Fossil fuel depletion (FF)
MJ surplus
3.94E-01 9.3% 52.4% 29.8% 2.6% 5.9%
ES.5.2 ADDITIONAL RESULTS
Use of renewable resources: The resource depletion impact indicators in LCA can provide important insights into the impacts associated with consumption of fossil fuels and other non-renewable resources. The LCA impact indicators used in this study, however, do not reveal the extent to which a system’s resource requirements are met using renewable resources, information that may be of interest to some stakeholders. In this study, the inventory results document that 45% (mass basis) of the total life cycle resource requirements (excluding water)21 for a catalog is renewable (i.e., wood fiber). This value may seem lower than one would expect. This is because the conversion of the coated freesheet into catalogs involves the usage of a significant amount of non-renewable resources, mainly due to electricity consumption.
Life cycle energy demand (LCED) by type: Table ES-7 shows the life cycle energy demand by type for one catalog22. The results in this table are not measures of potential impact associated with this demand. In the impact assessment for this study, only fossil fuel extraction is considered in the calculation of resource depletion (using the fossil fuel depletion impact indicator which, by definition, does not include renewable energy).
20
Results obtained using the ecoinvent database only (see Section 9.3.1.2 for more details) 21
The data do not allow for characterizing water consumption; only water use numbers are available. Hence, water consumption was not included in the total resource consumption indicator. 22
The energy content of petroleum-based feedstocks is included in life cycle energy demand because petroleum is a resource that is used almost entirely as a source of energy.
Executive Summary
xxxii
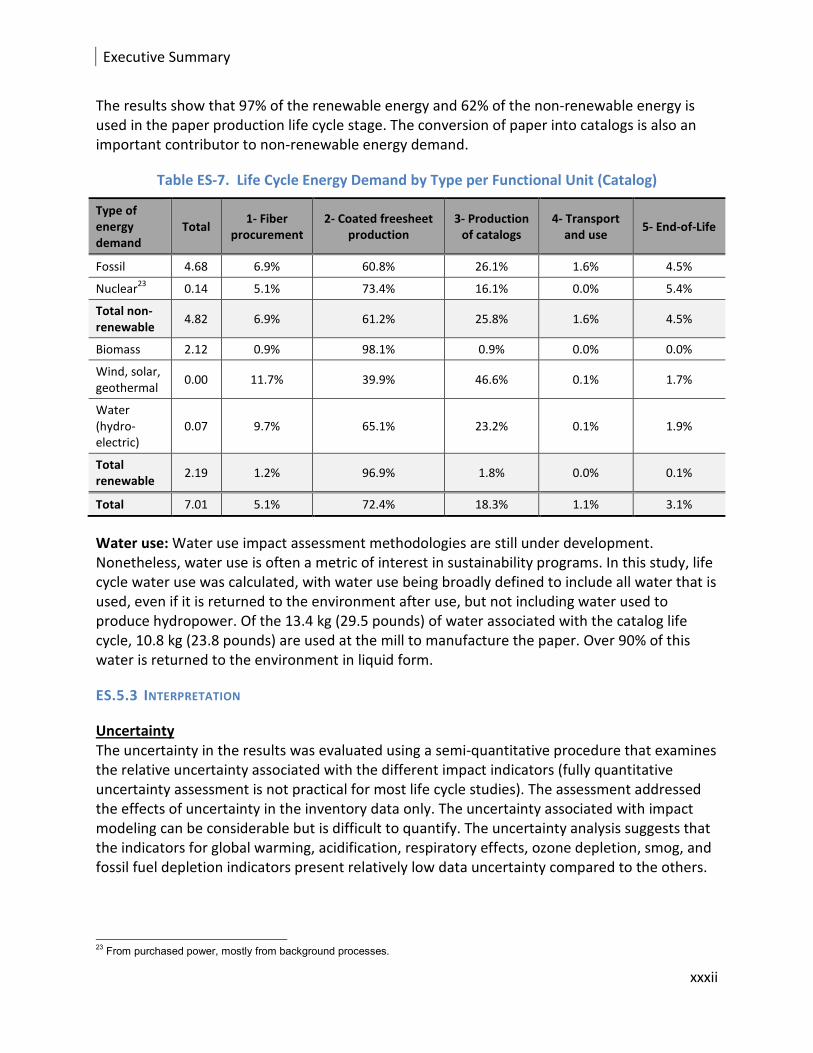
The results show that 97% of the renewable energy and 62% of the non-renewable energy is used in the paper production life cycle stage. The conversion of paper into catalogs is also an important contributor to non-renewable energy demand.
Table ES-7. Life Cycle Energy Demand by Type per Functional Unit (Catalog)
Type of energy demand
Total 1- Fiber
procurement 2- Coated freesheet
production 3- Production
of catalogs 4- Transport
and use 5- End-of-Life
Fossil 4.68 6.9% 60.8% 26.1% 1.6% 4.5%
Nuclear23
0.14 5.1% 73.4% 16.1% 0.0% 5.4%
Total non-renewable
4.82 6.9% 61.2% 25.8% 1.6% 4.5%
Biomass 2.12 0.9% 98.1% 0.9% 0.0% 0.0%
Wind, solar, geothermal
0.00 11.7% 39.9% 46.6% 0.1% 1.7%
Water (hydro-electric)
0.07 9.7% 65.1% 23.2% 0.1% 1.9%
Total renewable
2.19 1.2% 96.9% 1.8% 0.0% 0.1%
Total 7.01 5.1% 72.4% 18.3% 1.1% 3.1%
Water use: Water use impact assessment methodologies are still under development. Nonetheless, water use is often a metric of interest in sustainability programs. In this study, life cycle water use was calculated, with water use being broadly defined to include all water that is used, even if it is returned to the environment after use, but not including water used to produce hydropower. Of the 13.4 kg (29.5 pounds) of water associated with the catalog life cycle, 10.8 kg (23.8 pounds) are used at the mill to manufacture the paper. Over 90% of this water is returned to the environment in liquid form.
ES.5.3 INTERPRETATION
Uncertainty The uncertainty in the results was evaluated using a semi-quantitative procedure that examines the relative uncertainty associated with the different impact indicators (fully quantitative uncertainty assessment is not practical for most life cycle studies). The assessment addressed the effects of uncertainty in the inventory data only. The uncertainty associated with impact modeling can be considerable but is difficult to quantify. The uncertainty analysis suggests that the indicators for global warming, acidification, respiratory effects, ozone depletion, smog, and fossil fuel depletion indicators present relatively low data uncertainty compared to the others.
23
From purchased power, mostly from background processes.

Executive Summary
xxxiii
Contribution and Sensitivity Analyses In this section, the contributions of the different life cycle stages to the impact categories are examined in greater detail (see Figure ES-4). In addition, this section examines the sensitivity of the impact category results to sensitivity analysis presented in Table ES-3.
Figure ES-4. Cradle-to-Grave Contribution Analysis – Catalogs
Global Warming: Important contributors to the global warming indicator include the following life cycle stages: the production of the coated freesheet (fossil fuels burned at pulp and paper mills and purchased electricity); the end of life of catalogs (methane generated and released when the catalogs are disposed in landfills); and the catalog production (purchased electricity24). In the case of catalogs made of coated freesheet, the impacts of carbon stored in products and landfills are not very significant because most of the carbon degrades.
The global warming indicator results are relatively insensitive to most of the parameters tested, except for the recovery rate and the end-of-life scenario. An increase in the recovery from 33% to 50% decreases the global warming indicator results by ~15%. This is because increasing the recovery rate 1) allows more of the emissions to be exported with recovered fiber to subsequent uses in other systems, and 2) decreases methane emissions from landfills. On the other hand, a 40% reduction is observed when landfilling is replaced by burning and energy recovery. Uncertainty in the global warming indicator is relatively low.
Acidification: Important contributors to the acidification indicator include the following life cycle stages: the coated freesheet production (on-site releases at pulp and paper mills and purchased electricity); and the production of the catalogs (purchased electricity).
The acidification indicator is relatively sensitive to the data set employed (U.S. LCI and ecoinvent versus ecoinvent only), the rate (an increase in the recovery rate from 33% to 50% decreases the acidification potential by ~15%; see Table ES-3 for more explanation) and the
24
Note that electricity production for printing operations was based on a European study.
-20%
0%
20%
40%
60%
80%
100%
GW AC RES EU OD SM FF
1- Fiber procurement 2- Coated freesheet production
3- Production of catalogs 4- Transport and use of catalogs
5- End-of-life Storage in use and landfill

Executive Summary
xxxiv
end-of-life scenario (~40% reduction) when benefits from the generated energy are acknowledged for the same reasons as for office paper. The uncertainty of the acidification indicator is relatively low.
Respiratory Effects: The paper production life cycle stage is the most important contributor to the respiratory effects indicator. More specifically, on-site combustion releases and releases associated with purchased electricity are significant contributors to the indicator results. The production of electricity for the catalog production life cycle stage is another important contributor. This indicator is generally not sensitive to the parameters tested during the sensitivity analysis, except for the increase in recovery rate (an increase in the recovery rate from 33% to 50% decreases the indicator results by 23%; see Table ES-3 for more explanation) and the end-of-life scenario (80% reduction). The uncertainty associated with the respiratory effects indicator is estimated to be relatively low.
Eutrophication: The end of life of catalogs (as indicated through COD from the leachate of municipal paper landfill) is the life cycle stage that contributes the most to eutrophication. It is important to note that the TRACI method characterizes both COD and BOD as having an effect on eutrophication, which is probably double-counting if both COD and BOD are reported for the same unit process (as is the case for waste paper in landfills), given that they are interrelated25.
This indicator is not very sensitive except to the end-of-life scenario (12% reduction). Its relative uncertainty is moderate, meaning that the uncertainty is higher than for the indicators for global warming potential, acidification, respiratory effects, ozone depletion, smog, and fossil fuel depletion.
Stratospheric ozone depletion26: The main contributing life cycle stages are the production of
coated freesheet (RFO production, wood and black liquor combustion at pulp and paper mills, off-site production of precipitated PCC), and the production of catalogs (production of RFO, electricity production). The ozone depletion indicator is highly sensitive to the data set employed (U.S. LCI and ecoinvent versus ecoinvent only).
Photochemical oxidants (smog): Important contributors to the smog indicator include the following life cycle stages: catalog production (VOCs emitted during the printing activities and nitrogen oxides from electricity production); coated freesheet production (on-site releases, purchased electricity); and fiber procurement (fiber transportation).
The results for the smog indicator are relatively sensitive to the choice of the database (U.S. LCI versus ecoinvent). The uncertainty associated with the smog indicator is estimated to be relatively low.
25
Landfill releases to water and soil were modeled using the ecoinvent database, which considers an infinite time horizon and integrates over time releases arising after 100 years by assuming the collection system will fail after 100 years and that everything is emitted to groundwater. The degradability of wastes is used to model short-term releases (< 100 years). Releases beyond the 100-year horizon could have been excluded since these are specifically tagged as “long-term” emissions in the database. However, in order to be consistent with the carbon degradability approach taken, the database was not modified. 26
Results obtained using the ecoinvent database only. For more details see the sensitivity analysis section.

Executive Summary
xxxv
Fossil Fuel Depletion: Coated freesheet production is the life cycle stage contributing the most to the fossil fuel depletion life cycle stage. More specifically, on-site usage of natural gas and oil, purchased electricity and production of sodium chlorate are significant contributors.
The fossil fuel depletion indicator results are generally insensitive to the parameters tested. The uncertainty in the results for this indicator is also estimated to be relatively low.
ES.6 RESULTS – TELEPHONE DIRECTORY (UNCOATED MECHANICAL)
ES.6.1 LIFE CYCLE IMPACT ASSESSMENT RESULTS
Characterization results: The cradle-to-grave life cycle impact assessment (LCIA) results from TRACI are shown in Table ES-8. Results in Table ES-8 indicate that the production of the directories is the main contributor to all impact categories except eutrophication. The paper production life cycle stage is also an important contributor.
Table ES-8. LCIA Results – Telephone Directory
Impact category
Unit Total
(unit/FU)
1- Fiber procurement
2- Paper production
3- Production
of the directory
4- Transport and use
5- End-of-life
Storage in use and landfill
Global Warming (GW)
kg CO2 eq.
2.24 18.6% 64.7% 43.1% 2.1% 26.9% -55.4%
Acidification (AC)
moles H+ eq.
1.21 15.7% 42.2% 37.0% 1.3% 3.7%
N/A
Respiratory effects (RES)
kg PM2.5
eq. 0.00427 13.0% 55.2% 27.5% 0.4% 3.8%
Eutrophication (EU)
kg N eq. 0.00937 2.8% 14.2% 9.3% 0.2% 73.6%
Ozone depletion (OD)
kg CFC-11 eq.
2.40E-07 8.1% 28.9% 52.8% 3.5% 6.7%
Smog (SM) kg NOx
eq. 0.00427 13.0% 55.2% 27.5% 0.4% 3.8%
Fossil fuel depletion (FF)
MJ surplus
3.85 12.5% 34.2% 45.7% 2.2% 5.4%
ES.6.2 ADDITIONAL RESULTS
Use of renewable resources: The resource depletion impact indicators in LCA can provide important insights into the impacts associated with consumption of fossil fuels and other non-renewable resources. The LCA impact indicators used in this study, however, do not reveal the extent to which a system’s resource requirements are met using renewable resources, information that may be of interest to some stakeholders. In this study, the inventory results document that 52% (mass basis) of the total life cycle resource requirements (excluding

Executive Summary
xxxvi
water)27 for a telephone directory is renewable (i.e., wood fiber). This value may seem lower than one would expect. This is because the conversion of the uncoated mechanical paper into directories involves the usage of a significant amount of non-renewable resources, mainly due to electricity consumption.
Life cycle energy demand (LCED) by type: Table ES-9 shows the life cycle energy demand by type for one telephone directory28. The results in this table are not measures of potential impact associated with this demand. In the impact assessment for this study, only fossil fuel extraction is considered in the calculation of resource depletion (using the fossil fuel depletion impact indicator which, by definition, does not include renewable energy).
Of the 55.3 MJ of energy demand associated with the directory’s complete life cycle, about 25% is from renewable sources, primarily biomass, and 75% is from non-renewable sources. 85% of the renewable energy and 53% of the non-renewable energy is used in the pulp and paper production life cycle stage. The conversion of the paper into directories is also an important contributor to non-renewable energy consumption.
27
The data do not allow for characterizing water consumption, as only water use numbers are available. Hence, water consumption was not included in the total resource consumption indicator. 28
The energy content of petroleum-based feedstocks is included in life cycle energy demand because petroleum is a resource that is used almost entirely as a source of energy.

Executive Summary
xxxvii
Table ES-9. Life Cycle Energy Demand per Functional Unit (Telephone Directory)
Energy type Total
(MJ/FU)
1- Fiber procurement
2- Uncoated mechanical production
3- Production of directory
4- Transport and use
5- End-of-life
Fossil 39.8 12.73% 42.15% 39.37% 1.64% 4.11%
Nuclear29
1.56 40.92% 34.02% 21.60% 0.02% 3.44%
Total non-renewable
41.4 13.79% 41.84% 38.70% 1.58% 4.09%
Biomass 7.95 17.40% 78.47% 4.09% 0.00% 0.03%
Wind, solar, geothermal
0.05 22.50% 47.28% 29.10% 0.09% 1.04%
Water (hydro-electric)
5.97 3.05% 94.35% 2.43% 0.01% 0.16%
Total renewable
13.97 11.29% 85.14% 3.47% 0.01% 0.09%
Total 55.33 13.16% 52.77% 29.81% 1.18% 3.08%
Water use: Water use impact assessment methodologies are still under development. Nonetheless, water use is often a metric of interest in sustainability programs. In this study, life cycle water use was calculated, with water use being broadly defined to include all water that is used, even if it is returned to the environment after use, but not including water used to produce hydropower. Of the 151 kg (333 pounds) of water associated with the directory life cycle, 109 kg (240 pounds) are used at the mill to manufacture the paper. Over 90% of this water is returned to the environment in liquid form.
ES.6.3 INTERPRETATION
Uncertainty The uncertainty in the results was evaluated using a semi-quantitative procedure that examines the relative uncertainty associated with the different impact indicators (fully quantitative uncertainty assessment is not practical for most life cycle studies). The assessment addressed the effects of uncertainty in the inventory data only. The uncertainty associated with impact modeling can be considerable but is difficult to quantify. The uncertainty analysis suggests that the indicators for global warming, acidification, respiratory effects, ozone depletion, smog and fossil fuel depletion are associated with relatively low data uncertainty compared to the others.
Contribution and Sensitivity Analyses In this section, the contributions of the different life cycle stages to the impact categories are examined in greater detail (see Figure ES-6). In addition, this section examines the sensitivity of the impact category results to sensitivity analysis presented in Table ES-3.
29
From purchased power, mostly from background processes.

Executive Summary
xxxviii
Figure ES-6. Cradle-to-Grave Contribution Analysis – Telephone Directory
Global Warming: Important contributors to the global warming indicator include the following life cycle stages: paper production (usage of fossil fuels and purchased electricity) and telephone directory manufacturing (purchased electricity). In the case of uncoated mechanical paper, the carbon stored in product in use and in landfills more than compensates for the methane from landfills at end of life (-32% for storage versus 16% for landfills).
The global warming indicator results are relatively insensitive to most of the parameters tested. Increasing recovery rate has almost no effect on the global warming indicator because the benefits from exporting more burden to subsequent uses and from the avoided impact from the energy generated and the end of life when the directories are burned instead of landfilled are largely compensated for by less carbon stored within the system boundary. The uncertainty associated with this indicator is relatively low.
Acidification: Important contributors to the acidification indicator include the following life cycle stages: telephone directory production (purchased electricity) and paper production (on-site releases and purchased electricity).
The acidification indicator is sensitive to the data set employed and the end-of-life scenario (18% reduction) for the same reasons as for office paper. It is not very sensitive to other parameters. The uncertainty of this indicator is relatively low.
Respiratory Effects: Important contributors to the respiratory effects indicator include the following life cycle stages: telephone directory production (purchased electricity) and the paper production life cycle stages (on-site releases, purchased electricity).
This indicator is generally not sensitive to the parameters tested during the sensitivity analysis, except for the end-of-life scenario (20% reduction). The uncertainty associated with the respiratory effects indicator is estimated to be relatively low.
-40%
-20%
0%
20%
40%
60%
80%
100%
GW AC RES EU OD SM FF
1- Fiber procurement 2- Paper production
3- Production of the directory 4- Transportation and use
5- End-of-life Storage in use and landfill
Executive Summary
xxxix
Eutrophication: The end of life of the telephone directory directories (as indicated through COD from the leachate of municipal paper landfill) is the life cycle stage that contributes the most to the eutrophication indicator. It is important to note that the TRACI method characterizes both COD and BOD as having an effect on eutrophication, which is probably double-counting if both COD and BOD are reported for the same unit process (as is the case for waste paper in landfills), given that they are interrelated30.
This indicator is not very sensitive except for the end-of-life scenario (65% reduction). Its relative uncertainty is moderate, meaning that the uncertainty is higher than for global warming potential, acidification, respiratory effects, ozone depletion, smog, and fossil fuel depletion.
Stratospheric ozone depletion31: The life cycle stages contributing the most to ozone depletion
include the following: telephone directory production (releases associated with fuel combustion, electricity generation, and production of cleaning agents); and paper production (purchased electricity and fuel manufacturing).
The ozone depletion indicator is highly sensitive to the data set employed (U.S. LCI and ecoinvent versus ecoinvent only). The uncertainty associated with the ozone depletion indicator is estimated to be relatively low.
Photochemical oxidants (smog): The most important contributors to the smog indicator include the following life cycle stages: telephone directory production (VOCs emitted during the printing activities and nitrogen oxides from electricity production32) and paper production (on-site releases).
The smog indicator is relatively sensitive to the choice of the database (i.e., U.S. LCI versus ecoinvent). The uncertainty associated with the smog indicator is estimated to be relatively low.
Fossil Fuel Depletion: The life cycle stages contributing the most to the fossil fuel depletion indicator results are the production of the directory and the production of the uncoated mechanical paper (purchased electricity and on-site usage of fuels). The fossil fuel depletion indicator results are generally insensitive to the parameters tested. The uncertainty in the results for this indicator is also estimated to be relatively low.
30
Landfill releases to water and soil were modeled using the ecoinvent database, which considers an infinite time horizon and integrates over time releases arising after 100 years by assuming the collection system will fail after 100 years and that everything is emitted to groundwater. The degradability of wastes is used to model short-term releases (< 100 years). Releases beyond the 100-year horizon could have been excluded since these are specifically tagged as “long-term” emissions in the database. However, in order to be consistent with the carbon degradability approach taken, the database was not modified. 31
Results obtained using the ecoinvent database only. For more details see the sensitivity analysis section. 32
VOCs and electricity production were modeled using a European study.

Executive Summary
xl
ES.7 RESULTS – MAGAZINES (COATED MECHANICAL)
ES.7.1 LIFE CYCLE IMPACT ASSESSMENT RESULTS
Characterization results: The cradle-to-grave life cycle impact assessment (LCIA) results from TRACI are shown in Table ES-10. Results in Table ES-10 indicate that the production of paper is the life cycle stage contributing the most to all impact categories except eutrophication and smog. The production of magazines is also an important contributor.
Table ES-10. LCIA Results – Magazines
Impact category
Unit Total
(unit/FU) 1- Fiber
procurement 2- Paper
production
3- Production
of the magazine
4- Transport and use of magazine
5- End-of-life
Storage in use and landfill
Global Warming (GW)
kg CO2 eq.
0.459 5.8% 66.3% 27.3% 0.5% 19.0% -18.8%
Acidification (AC)
H+
moles eq.
0.184 6.9% 58.1% 31.2% 0.4% 3.5%
N/A
Respiratory effects (RES)
kg PM2.5
eq. 7.11E-04 3.1% 70.2% 23.3% 0.1% 3.2%
Eutrophication (EU)
kg N eq. 1.11E-03 1.4% 17.4% 8.0% 0.1% 73.1%
Ozone depletion (OD)
kg CFC-11 eq.
3.85E-08
4.0% 55.0% 31.8% 2.8% 6.3%
Smog (SM) kg NOx
eq. 2.84E-03 6.0% 30.2% 58.7% 0.5% 4.6%
Fossil fuel depletion
MJ surplus
0.590 6.2% 55.3% 32.5% 0.6% 5.3%
ES.7.2 ADDITIONAL RESULTS
Use of renewable resources: The resource depletion impact indicators in LCA can provide important insights into the impacts associated with consumption of fossil fuels and other non-renewable resources. The LCA impact indicators used in this study, however, do not reveal the extent to which a system’s resource requirements are met using renewable resources, information that may be of interest to some stakeholders. In this study, the inventory results document that about 39% (mass basis) of the total life cycle resource requirements (excluding water)33 for a magazine made of coated mechanical paper is renewable (i.e., wood fiber). This value may seem lower than one would expect. This is because the conversion of the coated mechanical paper into magazines involves the usage of a significant amount of non-renewable resources, mainly due to electricity consumption.
Life cycle energy demand (LCED) by type: Table ES-11 shows the life cycle energy demand by type for one magazine made of coated mechanical paper34. The results in this table are not
33
The data do not allow for characterizing water consumption, as only water use numbers are available. Hence, water consumption was not included in the total resource consumption indicator. 34
The energy content of petroleum-based feedstocks is included in life cycle energy demand because petroleum is a resource that is used almost entirely as a source of energy.
Executive Summary
xli
measures of potential impact associated with this demand. In the impact assessment for this study, only fossil fuel extraction is considered in the calculation of resource depletion (using the fossil fuel depletion impact indicator which, by definition, does not include renewable energy).
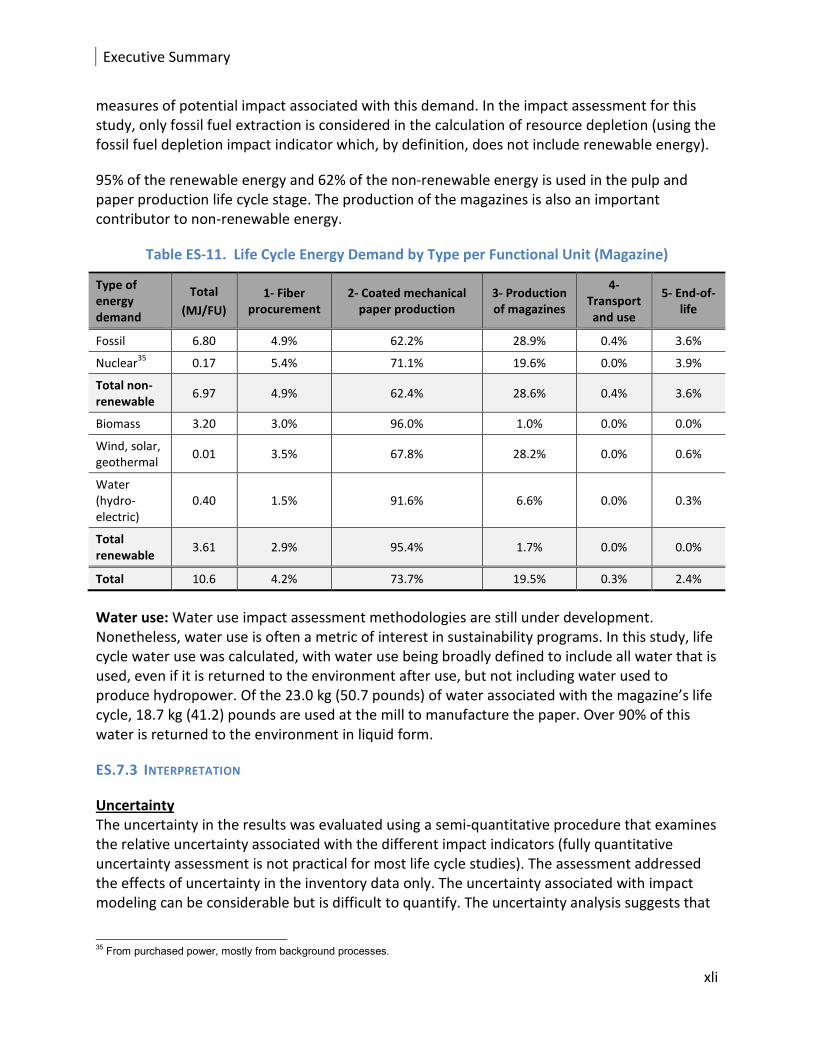
95% of the renewable energy and 62% of the non-renewable energy is used in the pulp and paper production life cycle stage. The production of the magazines is also an important contributor to non-renewable energy.
Table ES-11. Life Cycle Energy Demand by Type per Functional Unit (Magazine)
Type of energy demand
Total
(MJ/FU)
1- Fiber procurement
2- Coated mechanical paper production
3- Production of magazines
4- Transport and use
5- End-of-life
Fossil 6.80 4.9% 62.2% 28.9% 0.4% 3.6%
Nuclear35
0.17 5.4% 71.1% 19.6% 0.0% 3.9%
Total non-renewable
6.97 4.9% 62.4% 28.6% 0.4% 3.6%
Biomass 3.20 3.0% 96.0% 1.0% 0.0% 0.0%
Wind, solar, geothermal
0.01 3.5% 67.8% 28.2% 0.0% 0.6%
Water (hydro-electric)
0.40 1.5% 91.6% 6.6% 0.0% 0.3%
Total renewable
3.61 2.9% 95.4% 1.7% 0.0% 0.0%
Total 10.6 4.2% 73.7% 19.5% 0.3% 2.4%
Water use: Water use impact assessment methodologies are still under development. Nonetheless, water use is often a metric of interest in sustainability programs. In this study, life cycle water use was calculated, with water use being broadly defined to include all water that is used, even if it is returned to the environment after use, but not including water used to produce hydropower. Of the 23.0 kg (50.7 pounds) of water associated with the magazine’s life cycle, 18.7 kg (41.2) pounds are used at the mill to manufacture the paper. Over 90% of this water is returned to the environment in liquid form.
ES.7.3 INTERPRETATION
Uncertainty The uncertainty in the results was evaluated using a semi-quantitative procedure that examines the relative uncertainty associated with the different impact indicators (fully quantitative uncertainty assessment is not practical for most life cycle studies). The assessment addressed the effects of uncertainty in the inventory data only. The uncertainty associated with impact modeling can be considerable but is difficult to quantify. The uncertainty analysis suggests that
35
From purchased power, mostly from background processes.

Executive Summary
xlii
the data uncertainty in the results for the global warming, acidification, ozone depletion, smog, and fossil fuel depletion indicators is relatively low compared to the others.
Contribution and Sensitivity Analyses In this section, the contributions of the different life cycle stages to the impact categories are examined in greater detail (see Figure ES-8). In addition, this section examines the sensitivity of the impact category results to sensitivity analysis presented in Table ES-3.
Figure ES-8. Cradle-to-Grave Contribution Analysis – Magazines
Global Warming: The primary contributors to the global warming indicator include the following life cycle stages: paper production and magazine manufacturing (releases associated with purchased electricity and fuels burned during those stages). In the case of coated mechanical paper, the carbon stored in product in use and in landfill compensates for global warming due to methane from end-of-life landfills (-19% for storage versus 19% for end-of-life).
The global warming indicator results are relatively insensitive to most of the parameters tested. Increasing recovery rate has almost no effect on the global warming indicator because the benefits from exporting more burden to subsequent uses are largely compensated by less carbon stored within the system boundary. Substituting landfilling by burning with energy recovery improves the global warming indicator result by 12%. The uncertainty associated with this indicator is relatively low.
Acidification: The life cycle stages contributing the most to the acidification indicator include paper production (on-site releases from the process and fuel combustion, as well as releases associated with purchased electricity), and production of the magazines (releases associated with purchased electricity).
-20%
0%
20%
40%
60%
80%
100%
GW AC RES EU OD SM FF
1- Fiber procurement 2- Paper production
3- Production of the magazine 4- Transport and use
5- End-of-Life Storage in use and landfill

Executive Summary
xliii
The acidification indicator is not very sensitive except for the end-of-life scenario (14% reduction when substituting landfilling by burning with energy recovery) for the same reasons as for office paper. Relatively low uncertainty is associated with this indicator.
Respiratory Effects: The life cycle stages contributing the most to the respiratory effects indicator include the following: paper production and production of the magazines (production of the electricity for these stages).
This indicator is generally not sensitive to the parameters tested during the sensitivity analysis, except for the end-of-life scenario (14% reduction when substituting landfilling by burning with energy recovery). The uncertainty associated with the respiratory effects indicator is estimated to be relatively low.
Eutrophication: The end-of-life of magazines (as indicated through COD from the leachate of municipal paper landfill) is the life cycle stage that contributes the most to eutrophication. It is important to note that the TRACI method characterizes both COD and BOD as having an effect on eutrophication, which is probably double-counting if both COD and BOD are reported for the same unit process (as is the case for waste paper in landfills), given that they are interrelated36.
This indicator is not very sensitive to the parameters tested except for end-of-life scenarios: an increase of the recovery rate from 39% to 50% and substituting landfill with burning with energy recovery would lead to 15% (see Table ES-3 for more explanation) and 65% reductions in the indicator results, respectively. Its relative uncertainty is moderate – meaning that the uncertainty is higher than for the indicators for global warming potential, acidification, respiratory effects, ozone depletion, smog and fossil fuel depletion.
Stratospheric ozone depletion37: The primary contributing life cycle stages are the production
of coated mechanical paper (RFO production, wood combustion at pulp and paper mills) and the production of magazines (production of RFO, electricity production). The ozone depletion indicator is highly sensitive to the data set employed (U.S. LCI and ecoinvent versus ecoinvent only). The uncertainty associated with ozone depletion indicator is estimated to be relatively low.
Photochemical oxidants (smog): The magazine production life cycle stage (more specifically, VOCs emitted during the printing activities and nitrogen oxides from electricity production38) is the most important contributor to the results for the smog indicator. However, it is important to note that the releases of all organic substances from printing operations, as presented in the European study (see body of report for complete citation), were modeled as unspecified VOCs. Purchased electricity for the production of coated mechanical paper is a less significant contributor. The results for the smog indicator are relatively sensitive to the choice of the 36
Landfill releases to water and soil were modeled using the ecoinvent database, which considers an infinite time horizon and integrates over time releases arising after 100 years by assuming the collection system will fail after 100 years and that everything is emitted to groundwater. The degradability of wastes is used to model short-term releases (< 100 years). Releases beyond the 100-year horizon could have been excluded since these are specifically tagged as “long-term” emissions in the database. However, in order to be consistent with the carbon degradability approach taken, the database was not modified. 37
Results obtained using the ecoinvent database only. For more details see the sensitivity analysis section. 38
Modeled based on Larsen, Hauschild et al. (2006).

Executive Summary
xliv
database (U.S. LCI and ecoinvent versus ecoinvent only). The uncertainty associated with the smog indicator is estimated to be relatively low.
Fossil fuel depletion: The paper production and magazine production life cycle stages are the main contributors to the fossil fuel depletion indicator results (natural gas and oil used on-site and for purchased electricity production). The fossil fuel depletion indicator results are generally not very sensitive to the parameters tested during the sensitivity analysis. The uncertainty associated with fossil fuel depletion indicator is estimated to be relatively low.
ES.8 OPPORTUNITIES FOR IMPROVEMENT
In this study, the printing activities were modeled using a European study (see body of report for complete citation). It has been shown that electricity consumption and VOC releases associated with printing have important impacts on the results for several indicators. Electricity consumption was refined to use the information from one large representative U.S. printer. There is an opportunity to improve the quality of the study by collecting specific information for VOCs and industry-average information for both parameters. Other processes that were modeled using generic information and for which there is an opportunity to improve the results by collecting specific information include the production of sodium chlorate.
It is important to understand that, while the results of this study are valid for the average product investigated, the mill-to-mill differences can be very important, in some cases important enough to result in mill-specific conclusions based on specific mills that are opposite from the conclusions obtained in this study.
ES.9 CONCLUSIONS
Life cycle inventory and impact assessment data have been developed for four weighted average North American printing and writing paper products. The results are robust for the following impact categories: global warming, acidification, respiratory effects, ozone depletion, smog, and fossil fuel depletion. The results for the eutrophication impact category are more uncertain still but usable. In addition, robust inventory results have been generated for the various components of life cycle energy demand, solid waste, water use, and for the use of renewable resources.
• Office paper – uncoated freesheet: The life cycle stages responsible for the largest potential impacts in the life cycle are paper manufacturing and the disposal of used paper at end of life.
• Catalogs – coated freesheet: The life cycle stages responsible for the largest potential impacts in the life cycle are paper manufacturing, the printing activities and the disposal of used paper at end of life.
• Telephone directory – uncoated mechanical: The life cycle stages responsible for the largest potential impacts in the life cycle are paper manufacturing and the printing activities. For the global warming impact indicator, the GHG releases from landfills are more

Executive Summary
xlv
than compensated for by carbon storage in the landfill (carbon storage offsets about 55% of the total GHG releases in the life cycle).
• Magazines – coated mechanical: The life cycle stages responsible for the largest potential impacts in the life cycle are the paper manufacturing and the printing activities. For the global warming impact indicator, the GHG releases from landfills are more than compensated for by carbon storage in the landfill (carbon storage offsets about 20% of the total GHG releases in the life cycle).
• Recovery rate increase: It was demonstrated that increasing the recovery rate will have a positive effect on the global warming indicator for products with low carbon storage in landfills (e.g., products made of freesheet). Increasing the recovery rate of office paper from 72% to 85% decreases the global warming indicator results by 25% while increasing the recovery rate for catalogs from 33% to 50% decreases the global warming indicator results by about 15%. The improvements are due to increased exports of emissions with recovered fiber to other systems and reduced landfill methane emissions in the system.39
• Avoiding landfills: Burning and energy recovery at end of life instead of landfilling have a large beneficial impact on the global warming indicator results for products with low carbon storage in landfills (e.g., products made of freesheet) when you account for the environmental benefits of the generated energy. For office paper and catalogs made of freesheet, the indicator results are reduced by about 40% when landfilling is replaced by burning and energy recovery at end of life.
Approach for biogenic carbon accounting: It was demonstrated that the approach selected for biogenic carbon accounting can impact the results although the highest difference obtained using different approaches was only 17%.
39
Note: In this study, an LCA approach that assigns elementary flows and potential environmental impacts to a specific product system typically as an account of the history of the product was applied. Thus, these sensitivity analyses only assessed the effect of the recovery rate on how these elementary flows were assigned to the systems under study. The actual environmental consequences of increasing the recovery were not estimated.

Appendix F List of References
F-1
APPENDIX F LIST OF REFERENCES
[1] Althaus, H.-J., G. Doka, R. Dones, T. Heck, S. Hellweg, R. Hischier, T. Nemecek, G. Rebitzer, M. Spielmann, and G. Wernet. 2007. Overview and Methodology. Dübendorf: Swiss Center for Life Cycle Inventories.
[2] American Forest & Paper Association. 2009. 2009 Annual Statistical Summary of
Recovered Paper Utilization. Washington D.C.: AF&PA. [3] American Forest & Paper Association. 2007. Fiber Consumption 47th Survey. Washington:
AF&PA. [4] American Petroleum Institute. 2004. Compendium of Greenhouse Gas Emissions
Methodologies for the Oil and Gas Industry. Z00104. Washington DC: API. [5] Bare, J. C., G. A. Norris, D. W. Pennington, and T. McKone. 2003. TRACI: The tool for the
reduction and assessment of chemical and other environmental impacts. Journal of
Industrial Ecology 6(3-4): 49-78. [6] BSI British Standards. 2008. Specification for the assessment of the life cycle greenhouse
gas emissions of goods and services. PAS 2050: 2008. London, UK: BSI. [7] Clark, E. D., F. R. Hamilton, and J. R. Kleineau. 1987. Economics of Secondary Fibers. In
Secondary Fibers and Non-Wood Pulping, ed. Hamilton Frank, B. Leopold, and M. J. Kokurek, 156. Atlanta: The Joint Textbook Committee of the Paper Industry TAPPI CPPA.
[8] Ekvall, T. 1999. System Expansion and Allocation in Life Cycle Assessment - With
Implications for Wastepaper Management. Chalmers University of Technology. Göteborg. [9] Ekvall, T., and G. Finnveden. 2001. Allocation in ISO 14041--a critical review. Journal of
Cleaner Production 9(3): 197-208. [10] Environment Canada. 2007. National Inventory Report 1990-2006: Greenhouse Gass
Sources and Sinks in Canada. Environment Canada. [11] Frischknecht, R., H.-J. Althaus, C. Bauer, G. Doka, T. Heck, N. Jungbluth, D. Kellenburger,
and T. Nemecek. 2007. The Environmental Relevance of Capital Goods in Life Cycle Assessments of Products and Services. International Journal of Life Cycle Assessment 12(1): 7-17.
[12] Gèottsching, L., H. Pakarinen, Suomen Paperi-insinèoèorien Yhdistys., and Technical Association of the Pulp and Paper Industry. 2000. Recycled fiber and deinking. Helsinki, Finland
[13] Atlanta, Ga.: Fapet Oy ; [14] TAPPI, 649. [15] Göttsching, L., and H. Pakarinen. 2000. Recycled fiber and deinking. Helsinki, Finland and
Atlanta, Ga: Fapet Oy ; TAPPI], 649 p. [16] Guinee, J. B., M. Goree, R. Heijungs, G. Huppes, and R. Kleijn. 2002. Handbook on Life
Cycle Assessment - Operational Guide to the ISO Standards. Leiden: Centre of Environmental Science, Leiden University, 708.
[17] Hischier, R., and B. P. Weidema. 2009. Implementation of Life Cycle Impact Assessment
Methods. Dubendorf:

Appendix F List of References
F-2
[18] International Organization for Standardization. 2006. Environmental management - Life
cycle assessment - Requirements and guidelines. ISO 14044. Geneva: International Organization for Standardization.
[19] International Organization for Standardization. 2003. Environmental management — Life
cycle impact assessment — Examples of application of ISO 14042. ISO/TR 14047. Geneva: ISO.
[20] IPCC. 1997. 1996 Revised 1996 IPCC Guidelines for National Greenhouse Gas Inventories. Intergovernmental Panel on Climate Change, Organization for Economic Co-Operation and Development,. Hayama, Japan. http://www.ipcc-nggip.iges.or.jp/public/gl/invs6.html
[21] IPCC. 2007. 2006 IPCC Guidelines for National Greenhouse Gas Inventories Institute for Global Environmental Strategies. Hayama, Japan. http://www.ipcc-nggip.iges.or.jp/public/2006gl/vol5.html
[22] IPCC. 2006. 2006 IPCC Guidelines for National Greenhouse Gas Inventories Institute for Global Environmental Strategies. Hayama, Japan. http://www.ipcc-nggip.iges.or.jp/public/2006gl/pdf/2_Volume2/V2_0_Cover.pdf
[23] ISO. 1998. Environmental management - Life cycle assessment - Goal and scope definition
and inventory analysis. ISO 14041: 1998. Geneva: ISO. [24] ISO. 2006a. Environmental management - Life cycle assessment - Principles and
framework. ISO 14040. Geneva: International Organization for Standardization. [25] ISO. 2006b. Environmental management - Life cycle assessment - Requirements and
guidelines. ISO 14044. Geneva: International Organization for Standardization. [26] ISO. 2000. Environmental management — Life cycle assessment — Examples of
application of ISO 14041 to goal and scope definition and inventory analysis. ISO/TR 14049. Geneva: ISO.
[27] Johnson, L. R., B. Lippke, J. D. Marshall, and J. Comnick. 2004. Module A: Forest Resources Pacific Northwest and Southeast. In CORRIM: Phase I FInal Report, ed. 72.
[28] Jolliet, O., M. Saadâe, and P. Crettaz. 2005. Analyse du cycle de vie : comprendre et
réaliser un écobilan. Lausanne, Suisse: Presses Polytechniques et Universitaires Romandes, 242 p.
[29] Kouris, M. 2003. Dictionary of Paper. Tappi Press. Atlanta. [30] Larsen, H. F., M. S. Hansen, and M. Hauschild. 2009. Life cycle assessment of offset
printed matter with EDIP97: how important are emissions of chemicals? Journal of
Cleaner Production 17(2): 115-128. [31] Larsen, H. F., M. Hauschild, and M. S. Hansen. 2006. Ecolabelling of printed matter - part II
- Life cycle assessment of model sheet fed offset printed matter. Working Report No. 24. Danish Ministry of Environment - Environmental Protection Agency.
[32] Magazine Publishers of America. 2008. 2008 Environment Handbook. Washington: Magazine Publishers of America.
[33] Milota, M. R. 2004. Module B: Softwood Lumber Pacific Northwest Region. In CORRIM:
Phase I FInal Report, ed. 94. [34] Milota, M. R., C. D. West, and I. D. Hartley. 2004. Module C: Softwood Lumber Pacific
Southeast Region. In CORRIM: Phase I FInal Report, ed. 94.

Appendix F List of References
F-3
[35] Miner, R. 2006. The 100-Year Method for Forecasting Carbon Sequestration in Forest Products in Use. Mitigation and Adaptation Strategies for Global Change Published online(
[36] Miner, R., and B. Upton. 2002. Methods for Estimating Greenhouse Gas Emissions from Lime Kilns at Kraft Pulp Mills. Energy 27(8): 729-738.
[37] NCASI. 2007. The Greenhouse Gas and Carbon Profile of the Canadian Forest Products
Industry. Special Report No. 07-09. Research Traingle Park, NC: National Council for Air and Steam Improvement, Inc.,.
[38] NCASI. 2008. The Greenhouse Gas and Carbon Profile of the U.S. Forest Products Sector. NCASI Special Report No. 08-05. Research Traingle Park, NC: National Council for Air and Steam Improvement, Inc.,.
[39] NCASI. 2001. NCASI of Chemical-Specific Information for Sara Section 313 Form R
Reporting. Research Triangle Park, NC: National Council for Air and Steam Improvement, Inc.,.
[40] NCASI. 2009. Water Profile of the United States Forest Products Industry. Technical Bulletin no. 960. Research Triangle Park, NC: National Council for Air and Steam Improvement, Inc.,.
[41] Owens, J. W. 1999. Why Life Cycle Assessment is Now Described as an Indicator System. International Journal of Life Cycle Assessment 4(2): 81-86.
[42] Skog, K., L. Heath, J. Smith, R. Miner, B. Upton, and V. Maltby. 2008. The Greenhouse Gas
and Carbon Profile of the U.S. Forest Products Sector. NCASI Special Report No. 08-05. Research Traingle Park: National Council for Air and Stream Improvement.
[43] Smook, G. A. 2001. Handbook of pulp and paper terminology. Vancouver: Angus Wilde Publications, 447.
[44] Statistics Canada. 2009a. Electric Power Generation, Transmission and Distribution 2007. Ottawa: Statistics Canada.
[45] Statistics Canada. 2009b. Report on Energy Supply and Demand in Canada 2007. 57-003-X. Ottawa: Statistics Canada.
[46] Tillman, A.-M. 2000. Significance of decision-making for LCA methodology. Environmental
Impact Assessment Review 20(1): 113-123. [47] U.S. Department of Transportation, and U.S. Department of Commerce. 1999. 1997
Economic Census - Transportation - 1997Commodity Flow Survey. EC97TCF-US. [48] U.S. Department of Transportation, and U.S. Department of Commerce. 2004. 2002
Economic Census - Transportation - Commodity Flow Survey. EC02TCF-US. [49] U.S. Environmental Protection Agency. 2006. Solid Waste Management and Greenhouse
Gases – A Life Cycle Assessment of Emissions and Sinks. U.S. EPA. [50] U.S. EPA. 1997. Air Emissions from Scrap Tire Combustion. -600/R-97-115. Springfield, VA:
EPA. [51] U.S. EPA. 1995. Compilation of Air Pollutant Emission Factors - Volume I: Stationary Point
and Area Sources, Fifth Editition. Research Triangle PArk: [52] United States Environmental Protection Agency. 2008. Municipal Solid Waste in United
States - 2007. EPA530-R-08-010. Washington: EPA Office of Solid Wastes.

Appendix F List of References
F-4
[53] Weidema, B. P., and M. Suhr Wesnæ. 1996. Data quality management for life cycle inventories—an example of using data quality indicators. Journal of Cleaner Production 4(3-4): 167-174.
[54] Werner, F., H.-J. Althaus, T. Künniger, and K. Richter. 2007. Life Cycle Inventories of Wood
as Fuel and Construction Material. ecoinvent report No. 9. Dübendorf: Swiss Center for Life Cycle Inventories.
[55] Weström, P., and C. Löfgren. 2005. Life Cycle Inventory for kraft sack paper. CEPI Eurokraft and Eurosac.
[56] World Business Council for Sustainable Development, and World Resources Institute. 2004. A Corporate Accounting and Reporting Standard - Revised Edition. Geneva:
[57] World Resources Institute, and World Business Council for Sustainable Development. 2006. Allocation of Emissions from a Combined Heat and Power (CHP) Plant. WRI/WBCSD. Washington, D.C. http://www.ghgprotocol.org/calculation-tools/all-tools (11 Sept. 2009).