py 2013 wiasrd data book - employment and training ...€¦ · s o cia l p o l icy r esea r c h ......
TRANSCRIPT

1333 Broadway, Suite 310 Oakland, CA 94612
Tel: (510) 763-1499
Fax: (510) 763-1599 www.spra.com
• • • • • • • • • • • • • • • • • • • • • • • • • • • • • • • • • • • • • • • • • • • • • • • • • • • • • • • • • • • • • • • • • • • • • • • • • •
S O C I A L P O L I C Y R E S E A R C H A S S O C I A T E S
Prepared for:
Office of Performance and Technology Employment and Training Administration US Department of Labor 200 Constitution Ave. NW Washington DC 20210
DOL Contract Number: DOL-ETA-14-F-00006 Project No. 1252
PY 2013 WIASRD Data Book Revised March 23, 2015
Prepared by:
Social Policy Research Associates


Social Policy Research Associates i
CONTENTS
Guide To The Reader .................................................................................................... 1 Part I: Summary Comparisons Across Programs ..................................................... 6 Table I-1: Trends in the Number of Exiters, by Program of Participation ............................................ 7
Table I-2: Number of Exiters from April 2013 to March 2014, by State and Program of Participation ...................................................................................................................... 8
Table I-3: Number of Exiters from April 2013 to March 2014, by Selected Characteristics .............. 10
Table I-4 Trends Over Time in the Number of Adult Exiters, by State ............................................. 11
Table I-5 Trends Over Time in the Number of Dislocated Worker Exiters from Local and Statewide Programs, by State.............................................................................................. 13
Table I-6 Trends Over Time in the Number of Exiters from NEG Projects, by State ........................ 15
Table I-7 Trends Over Time in the Number of Youth Exiters, by State ............................................ 17
Part II: Adult Exiters ................................................................................................... 19 Table II-1: Characteristics of Adult Exiters, Trends Over Time ........................................................... 20
Table II-2: Number of Adult Exiters, by Characteristics, Trends Over Time ....................................... 23
Table II-3: Characteristics of Adult Exiters from April 2013 to March 2014, by Age ................................................................................................................................. 25
Table II-4: Characteristics of Adult Exiters from April 2013 to March 2014, by Ethnicity and Race ......................................................................................................... 27
Table II-5: Characteristics of Adult Exiters from April 2013 to March 2014, by Employment at Participation, Gender, and Disability .............................................................................. 29
Table II-6: Characteristics of Adult Exiters from April 2013 to March 2014, by Veteran Status ................................................................................................................................... 31
Table II-7: Characteristics of Adult Exiters from April 2013 to March 2014, by UI Status ................. 33
Table II-8: Characteristics of Adult Exiters from April 2013 to March 2014 who Received Intensive or Training Services, by Highest Grade Completed ............................................ 35
Table II-9: Characteristics of Adult Exiters from April 2013 to March 2014 who Received Intensive or Training Services, by Low Income and Receipt of Public Assistance ............ 37
Table II-10 Characteristics of Adult Exiters from April 2013 to March 2014 who Received Intensive or Training Services, by Selected Characteristics ............................................... 39
Table II-11: Characteristics of Adult Exiters from April 2013 to March 2014, by Major Service Categories .............................................................................................................. 41

Contents
Social Policy Research Associates ii
Table II-12: Number of Adult Exiters from April 2013 to March 2014, with Specific Characteristics by Major Service Categories ...................................................................... 44
Table II-13: Characteristics of Adult Exiters from April 2013 to March 2014, by Type of Training ............................................................................................................ 47
Table II-14: Services Received by Adult Exiters, Trends Over Time .................................................... 50
Table II-15: Number of Adult Exiters, by Services Received, Trends Over Time ................................. 53
Table II-16: Services Received by Adult Exiters from April 2013 to March 2014, by Age ................... 56
Table II-17: Services Received by Adult Exiters from April 2013 to March 2014, by Ethnicity and Race ......................................................................................................... 59
Table II-18: Services Received by Adult Exiters from April 2013 to March 2014, by Employment at Participation, Gender and Disability Status ............................................... 62
Table II-19: Services Received by Adult Exiters from April 2013 to March 2014, by Veteran Status ................................................................................................................ 65
Table II-20: Services Received by Adult Exiters from April 2013 to March 2014, by UI Status .......... 68
Table II-21: Services Received by Adult Exiters from April 2013 to March 2014 who Received Intensive or Training Services, by Highest Grade Completed ............................ 71
Table II-22: Services Received by Adult Exiters from April 2013 to March 2014 who Received Intensive or Training Services, by Low Income and Receipt of Public Assistance ........................................................................................................................... 74
Table II-23: Services Received by Adult Exiters from April 2013 to March 2014 who Received Intensive or Training Services, by Selcted Characteristics ................................. 77
Table II-24: Number of Adult Exiters from April 2013 to March 2014, by Occupation of Training ............................................................................................................................... 80
Table II-25: Services Received by Adult Exiters from April 2013 to March 2014, by State ................. 82
Table II-26: Number of Adult Exiters from April 2013 to March 2014Who Received Training, by State ................................................................................................................ 84
Table II-27: Outcomes of Adult Exiters, Trends Over Time .................................................................. 86
Table II-28: Number of Adult Exiters Attaining Outcomes, Trends Over Time ................................... 89
Table II-29: Outcomes of Adult Exiters, by Age .................................................................................... 91
Table II-30: Outcomes of Adult Exiters, by Ethnicity and Race ............................................................ 93
Table II-31: Outcomes of Adult Exiters, by Employment at Participation, Gender and Disability Status .................................................................................................................. 95
Table II-32: Outcomes of Adult Exiters, by Veteran Status ................................................................... 96
Table II-33: Outcomes of Adult Exiters, by UI Status ............................................................................ 99
Table II-34: Outcomes of Adult Exiters who Received Intensive or Training Services, by Highest Grade Completed ............................................................................................ 101
Table II-35: Outcomes of Adult Exiters from who Received Intensive or Training Services, by Low Income and Receipt of Public Assistance ............................................................ 103

Contents
Social Policy Research Associates iii
Table II-36: Outcomes of Adult Exiters who Received Intensive or Training Services, by Selected Characteristics ............................................................................................... 105
Table II-37: Outcomes of Adult Exiters, by Major Service Categories ................................................ 107
Table II-38: Outcomes of Adult Exiters, by Type of Training ............................................................. 109
Table II-39: Performance Outcomes of Adult Exiters, by Characteristics ............................................ 111
Table II-40: Performance Outcomes of Adult Exiters, by Services Received ...................................... 114
Table II-41: Performance Outcomes of Adult Exiters, by Occupation of Training .............................. 117
Table II-42: Performance Outcomes of Adult Exiters, by State ........................................................... 119
Part III: Dislocated Worker Exiters .......................................................................... 121 Table III-1: Characteristics of Dislocated Worker Exiters, by Characteristics, Trends Over
Time .................................................................................................................................. 122
Table III-2: Number of Dislocated Worker Exiters, Trends Over Time .............................................. 125
Table III-3: Characteristics of Dislocated Worker Exiters from April 2013 to March 2014, by Funding Source ............................................................................................................ 127
Table III-4: Characteristics of Dislocated Workers Exiters from April 2013 to March 2014 by Type of NEG Project ................................................................................................... 130
Table III-5: Characteristics of Dislocated Worker Exiters from April 2013 to March 2014, by Age ............................................................................................................................... 132
Table III-6: Characteristics of Dislocated Worker Exiters from April 2013 to March 2014, by Ethnicity and Race ....................................................................................................... 134
Table III-7: Characteristics of Dislocated Worker Exiters from April 2013 to March 2014, by Employment at Participation, Gender and Disability .................................................. 136
Table III-8: Characteristics of Dislocated Worker Exiters from April 2013 to March 2014, by Veteran Status ................................................................................................................... 138
Table III-9: Characteristics of Dislocated Worker Exiters from April 2013 to March 2014, by UI Status ........................................................................................................................... 140
Table III-10: Characteristics of Dislocated Worker Exiters from April 2013 to March 2014 who Received Intensive or Training Services, by Highest Grade Completed .................. 142
Table III-11: Characteristics of Dislocated Worker Exiters from April 2013 to March 2014 who Received Intensive or Training Services, by Selected Characteristics ..................... 144
Table III-12: Characteristics of Dislocated Worker Exiters from April 2013 to March 2014, by Major Service Categories ............................................................................................. 146
Table III-13: Number of Dislocated Worker Exiters from April 2013 to March 2014, with Specific Characteristics, by Major Service Categories ..................................................... 148
Table III-14: Characteristics of Dislocated Worker Exiters from April 2013 to March 2014, by Type of Training .......................................................................................................... 150
Table III-15: Services Received by Dislocated Worker Exiters, Trends Over Time ............................. 152
Table III-16: Number of Dislocated Worker Exiters, by Services Received, Trends Over Time ............................................................................................................. 155

Contents
Social Policy Research Associates iv
Table III-17: Services Received by Dislocated Worker Exiters from April 2013 to March 2014 by Funding Source ............................................................................................................ 158
Table III-18: Services Received by Dislocated Worker Exiters from April 2013 to March 2014, by Type of NEG Project ................................................................................................... 161
Table III-19: Services Received by Dislocated Worker Exiters from April 2013 to March 2014, by Age ............................................................................................................................... 164
Table III-20: Services Received by Dislocated Worker Exiters from April 2013 to March 2014, by Ethnicity and Race ....................................................................................................... 167
Table III-21: Services Received by Dislocated Worker Exiters from AApril 2013 to March 2014, by Employment at Participation, Gender and Disability ........................................ 170
Table III-22: Services Received by Dislocated Worker Exiters from April 2013 to March 2014, by Veteran Status .............................................................................................................. 173
Table III-23: Services Received by Dislocated Worker Exiters from April 2013 to March 2014, by UI Status....................................................................................................................... 176
Table III-24: Services Received by Dislocated Worker Exiters from April 2013 to March 2014 who Received Intensive or Training Services, by Highest Grade Completed ................. 179
Table III-25: Services Received by Dislocated Worker Exiters from April 2013 to March 2014 who Received Intensive or Training Services, by Selected Characteristics ..................... 182
Table III-26: Number of Dislocated Workers Exiters Who Received Training from April 2013 to March 2014, by Occupation of Training ....................................................................... 185
Table III-27: Services Received by Dislocated Worker Exiters from April 2013 to March 2014, by State ............................................................................................................................. 187
Table III-28: Number of Dislocated Workers Exiters from April 2013 to March 2014 Who Received Training, by State .............................................................................................. 189
Table III-29: Outcomes of Dislocated Worker Exiters, Trends Over time ............................................ 191
Table III-30: Number of Dislocated Worker Exiters Attaining Outcomes, Trends Over Time ............ 194
Table III-31: Outcomes of Dislocated Worker Exiter, by Funding Source ............................................ 196
Table III-32: Outcomes of Dislocated Worker Exiters, by Type of NEG Project ................................. 198
Table III-33: Outcomes of Dislocated Worker Exiters, by Age ............................................................. 200
Table III-34: Outcomes of Dislocated Worker Exiters, by Ethnicity and Race ..................................... 202
Table III-35: Outcomes of Dislocated Worker Exiters, by Gender and Disability ................................ 204
Table III-36: Outcomes of Dislocated Worker Exiters, by Veteran Status ............................................ 206
Table III-37: Outcomes of Dislocated Worker Exiters, by UI Status ..................................................... 208
Table III-38: Outcomes of Dislocated Worker Exiters who Received Intensive or Training Services, by Highest Grade Completed ............................................................................ 210
Table III-39: Outcomes of Dislocated Worker Exiters who Received Intensive or Training Services, by Selected Characteristics ................................................................................ 212
Table III-40: Outcomes of Dislocated Worker Exiters, by Major Service Categories ........................... 214
Table III-41: Outcomes of Dislocated Worker Exiters, by Type of Training ........................................ 216

Contents
Social Policy Research Associates v
Table III-42: Performance Outcomes of Dislocated Worker Exiters, by Characteristics ....................... 218
Table III-43: Performance Outcomes of Dislocated Worker Exiters, by Services Received ................. 221
Table III-44: Performance Outcomes of Dislocated Worker Exiters, by Occupation of Training ............................................................................................................................ 224
Table III-45: Performance Outcomes of Dislocated Worker Exiters, by State Excludes Individuals Served Only by NEG Programs ..................................................................... 226
Part IV: Youth Exiters ............................................................................................... 229 Table IV-1: Characteristics of Youth Exiters, Trends Over Time ........................................................ 230
Table IV-2: Number of Youth Exiters, by Characteristics, Trends Over Time .................................... 232
Table IV-3: Characteristics of Youth Exiters from April 2013 to March 2014, by Age ...................... 234
Table IV-4: Characteristics of Youth Exiters from April 2013 to March 2014, by Ethnicity and Race ....................................................................................................... 236
Table IV-5: Characteristics of Youth Exiters from April 2013 to March 2014, by Gender and Disability .................................................................................................. 238
Table IV-6: Characteristics of Youth Exiters from April 2013 to March 2014, by Employment at Participation and Basic Skills Deficiency .......................................... 240
Table IV-7: Characteristics of Youth Exiters from April 2013 to March 2014, by School Status at Participation ...................................................................................... 242
Table IV-8 Characteristics of Youth Exiters from April 2013 to March 2014, Out-of-School and In-School Youth at Participation ................................................................................ 244
Table IV-9: Characteristics of Youth Exiters from April 2013 to March 2014, by Barriers to Employment ............................................................................................... 246
Table IV-10: Characteristics of Youth Exiters from April 2013 to March 2014, by Low Income and Receipt of Public Assistance ............................................................ 248
Table IV-11: Characteristics of Youth Exiters from April 2013 to March 2014, by Selected Characteristics ............................................................................................... 250
Table IV-12: Characteristics of Youth Exiters from April 2013 to March 2014, by Youth Activities ........................................................................................................... 252
Table IV-13: Services Received by Youth Exiters, Trends Over Time.................................................. 254
Table IV-14: Number of Youth Exiters, by Services Received, Trends Over Time .............................. 256
Table IV-15: Services Received by Youth Exiters from April 2013 to March 2014, by Age ................ 258
Table IV-16: Services Received by Youth Exiters from April 2013 to March 2014, by Ethnicity and Race ...................................................................................................... 259
Table IV-17: Services Received by Youth Exiters from April 2013 to March 2014, by Gender and Disability .................................................................................................. 260
Table IV-18: Services Received by Youth Exiters from April 2013 to March 2014, by Employment at Participation and Basic Skills Deficiency .......................................... 261
Table IV-19: Services Received by Youth Exiters from April 2013 to March 2014, by School Status at Participation ...................................................................................... 262

Contents
Social Policy Research Associates vi
Table IV-20 Services Received by Youth Exiters from April 2013 to March 2014, Out-of-School and In-School Youth at Participation .................................................................... 263
Table IV-21: Services Received by Youth Exiters from April 2013 to March 2014, by Barriers to Employment ............................................................................................... 264
Table IV-22: Services Received by Youth Exiters from April 2013 to March 2014, by Low Income and Receipt of Public Assistance ............................................................ 265
Table IV-23: Services Received by Youth Exiters from April 2013 to March 2014, by Selected Characteristics ............................................................................................... 266
Table IV-24: Services Received by Youth Exiters from April 2013 to March 2014, by State ............................................................................................................................. 267
Table IV-25: Outcomes of Youth Exiters, Trends Over Time ............................................................... 269
Table IV-26: Number of Youth Exiters Attaining Outcomes, Trends Over Time ................................ 271
Table IV-27: Outcomes of Youth Exiters, by Age ................................................................................ 273
Table IV-28: Outcomes of Youth Exiters, by Ethnicity and Race ........................................................ 275
Table IV-29: Outcomes of Youth Exiters, by Gender and Disability .................................................... 277
Table IV-30: Outcomes of Youth Exiters, by Employment at Participation and Basic Skills Deficiency ..................................................................................................... 279
Table IV-31: Outcomes of Youth Exiters, by School Status at Participation ........................................ 281
Table IV-32: Outcomes of Youth Exiters, Out-of-School and In-School Youth at Participation ......... 283
Table IV-33: Outcomes of Youth Exiters, by Barriers to Employment ................................................ 285
Table IV-34: Outcomes of Youth Exiters, by Low Income and Receipt of Public Assistance .............................................................................................................. 287
Table IV-35: Outcomes of Youth Exiters, by Selected Characteristics ................................................. 289
Table IV-36: Outcomes of Youth Exiters, by Youth Activities ............................................................ 291
Table IV-37: Youth Common Measures, by Characteristics .................................................................. 293
Table IV-38: Youth Common Measures, by Services Received ............................................................ 295
Table IV-39: Youth Common Measures, by State.................................................................................. 297
Table IV-40: Performance Outcomes of Younger Youth Exiters, by Characteristics ............................ 299
Table IV-41: Performance Outcomes of Younger Youth Exiters, by Services Received ...................... 302
Table IV-42: Performance Outcomes of Younger Youth Exiters, by State ............................................ 303
Table IV-43: Performance Outcomes of Older Youth Exiters, by Characteristics ................................. 305
Table IV-44: Performance Outcomes of Older Youth, by Services Received ....................................... 307
Table IV-45: Performance Outcomes of Older Youth Exiters, by State ................................................ 308
Appendix A: Notes to Tables .................................................................................. 311 Appendix B: Definitions ........................................................................................... 327 Definitions of Characteristics.................................................................................................................... 329
Definitions of Services .............................................................................................................................. 335

Contents
Social Policy Research Associates vii
Definitions of Outcomes ........................................................................................................................... 341


Social Policy Research Associates 1
GUIDE TO THE READER
The Data Book provides detailed information on the Workforce Investment Act (WIA) programs, including information about who is served, what services are provided, and the outcomes attained by participants. The Data Book is based on the Workforce Investment Standard Record Data (WIASRD), which is an individual-level data set containing information reported by states to the Employment and Training Administration.1 This version of the Data Book uses data provided by states in their Program Year (PY) 2013, Quarter 4 submissions, which contain information about individuals who participated in WIA at any time from January 1, 2012 to June 30, 2014. It thus includes individuals who finished participation (“exited”) from January 1, 2012 to March 31, 2014 and individuals who had started participation before July 1, 2014, but had not finished participation by March 31, 2014. All tables in the Data Book have been computed using the final version of the PY 2013, Quarter 4 WIASRD data, which includes a variety of data corrections and adjustments. Tables that show trends over time also use data from previous submissions.
General notes that apply to most or all of the tables in the Data Book appear in this section. More detailed Notes to Tables are provided in Appendix A, which follows the last table. These Notes to Tables present important information that is critical to the proper interpretation of the data in the tables. Appendix B provides definitions of the data items presented.
Overview of Tables Most tables in the Data Book provide information on exiters. The most recent one-year period with complete data on exiters is the period from April 2013 to March 2014.
The Data Book contains four primary groups of tables:
• Section I contains tables for WIA Title 1B as a whole, including the programs for adults, dislocated workers, and youth. It also includes National Emergency Grant (NEG) projects. This section also includes tables showing trends over time in the number of exiters by state.
1 Detailed information about this data set, including the specifications that states were to follow when reporting, can be found in Training and Employment Guidance Letter 14-00, Change 1. Employment and Training Administration, November 19, 2002. http://www.doleta.gov/usworkforce/documents/tegl/#14-00ch1.

Guide to the Reader
Social Policy Research Associates 2
• Section II contains tables for the adult program, which serves individuals aged 18 and higher. All adults are eligible for services under the adult program. However, states are to give priority to low-income adults in the event that funds are limited.
• Section III contains tables for the dislocated worker program and for NEGs. Dislocated workers are generally experienced workers who have been laid off (or received notice of termination) due to a permanent closure or substantial layoff.
• Section IV contains tables for the youth program, which serves individuals aged 14 to 21. With some exceptions, eligibility for youth program services is limited to low-income youth.
Sections II, III and IV all follow a similar structure. First, there are tables that show the characteristics of WIA exiters. These are followed by tables that show the services received by exiters. The final group of tables shows the outcomes received by exiters.
For adults and dislocated workers, two primary groups of characteristics are shown: characteristics available for all exiters and characteristics available only for exiters who received intensive or training services. When interpreting the information in the tables it is important to remember that these latter characteristics were not collected for individuals who received only core services to limit the data collection burden on individuals who received only limited WIA services. Thus, percentages for these characteristics are based only on individuals who received intensive or training services.
The adult and dislocated worker tables do not include individuals who received only self- and informational services. Although reporting for these individuals was added to the WIASRD for PY 2009, they are not included to preserve continuity with earlier data and because these data are not available for all states.
For dislocated workers, the tables combine information on individuals served by the formula-funded Title IB dislocated worker program and by National Emergency Grants to provide a picture of all services provided to dislocated workers by WIA Title 1.
Tables show characteristics, services received, or outcomes for WIA participants for the most recent year for which data on the particular characteristic, service, or outcome is available. The only exception to this is for the outcomes trends over time tables, for which the more recent time periods do not contain data for an entire year’s worth of exiters for some outcomes. The exceptions are described in the notes at the bottom of these tables, as well as in Appendix A.
None of the tables includes information on some other WIA Title 1 programs, including the Indian and Native American Program, the National Farmworker Jobs Program, veterans' workforce investment programs, and Job Corps. These other programs are not reported in the WIASRD data used for this Data Book, but in their own separate reporting systems.
Guide to the Reader
Social Policy Research Associates 3
Summary of Table Notation In interpreting the data in the tables, the reader should note that:
• Data that is not available is shown as blank. For example, in Table II-10 the percentages for the characteristics of exiters who received intensive or training services are not shown in the column titled “Core Services Only.”
• “0.0” is used to denote percentages that are less than 0.05%.
Units of Measurement The numbers appearing in the table are either raw counts (e.g., the number of exiters), percentages (e.g., the percentage who are female), or averages (e.g., average quarterly earnings in the quarter after exit).
• Raw counts represent the number of exiters identified by the combination of the row and column headings. Individuals with missing data on a row or column heading are not included in the count.
• Percentages generally represent the percentage identified by the row heading among all of those identified by the column heading—that is they are column percentages. Some tables, however, present row percentages, the percentage identified by the column heading among those identified by the row heading. These are specified in Notes to Tables—one example is Table II-25 that shows the percentage receiving different levels of service by state. Tables that show column percentages always show the number of exiters in the first row so that the reader can see the size of the universe on which the percentage is based. Tables that show row percentages always show the number of exiters in the first column.
• Individuals with missing data on either the row or column heading are excluded when calculating percentages. In addition, all outcome data exclude individuals who were institutionalized (e.g., in a hospital or prison) or deceased at exit or had a medical or health condition that precluded them from continuing WIA services or entering employment. However, these individuals are included in the number of exiters shown in the outcome tables.
• Averages are calculated for selected items that are measured on a continuous scale (e.g., quarterly earnings in the quarter after exit) and are computed after excluding missing data.
Quality of the Underlying Data The WIASRD reporting system was first effective for PY 2000. Thus, the PY 2013 data used for this Data Book represents data from the fourteenth year of reporting. As with any new data system, states varied in how long it took to implement fully the different elements of the reporting system. Thus, the quality and completeness of the data varies among states. For example, the WIA performance measures can be calculated from the WIASRD data and compared to data separately reported by states to ETA. This comparison showed that

Guide to the Reader
Social Policy Research Associates 4
calculations of the entered employment rate and retention rate from the WIASRD generally were close to the data reported by most states. Thus, there is substantial consistency in the data on postprogram employment. However, there were larger discrepancies for earnings change, younger youth retention, and younger youth diploma attainment. These discrepancies have been reduced over time. When there are discrepancies, the states generally reported higher outcomes than we calculated from the WIASRD. It is not known whether the WIASRD data or the state’s calculations are correct when there are discrepancies.
The data set used to prepare the Data Book underwent an extensive data review. As a result of this data review, some data for a few states were recoded or set to missing when the data were clearly incorrect. Data that was set to missing are excluded from the calculations of percentages and averages in this Data Book, as discussed above. Consequently, state results reported in the Data Book may differ from states’ own computations from their data.
Changes Over Time Some new and revised reporting requirements were introduced with the PY 2005 WIASRD. Thus, this Data Book includes some data reported for the ninth time. These data may be incomplete. New characteristics data items included offender for adults, other eligible person as a category of veteran status, and ever in foster care for youth. In addition, Food Stamps was added to other public assistance. New services data include core self-service and informational activities, workforce information services and prevocational services for adults and dislocated workers, disaster relief for dislocated workers, and enrolled in education for youth. In addition, new categories for the type of training were reported for adults and dislocated workers. These new fields may be underreported, more so in the earlier time periods covered by the data. Please see the notes to tables for more details on some of the changes.
This Data Book incorporates some significant changes from the PY 2008 version. First, in several adult and dislocated worker tables showing performance outcomes, the column for the employment and credential rate has been replaced by a column for the credential attainment rate. The latter shows the percentage of adult or dislocated worker trainees who attain a credential, but is not one of the official WIA performance measures. Second, the PY 2013 Data Book includes some additional tables focusing on detailed occupations of training.
Additional changes were implemented beginning with the PY 2009, Quarter 3, WIASRD. In particular, that was the first time that data for adult and dislocated worker participants who have not finished the program were reported.
Some new and revised reporting requirements were also introduced with the PY 2013 WIASRD. Most new data items were incompletely reported and are, therefore, not shown in this report. Below we describe some new or changed data items that are used for this report.
Guide to the Reader
Social Policy Research Associates 5
Reporting for unemployment compensation was expanded to include adults and dislocated workers that received only staff-assisted core services; previously unemployment compensation was reported only for those who received intensive or training services. Thus, this report shows unemployment compensation for all adults and dislocated workers. For comparison to previous years’ data books, this report also shows unemployment compensation for those who received intensive or training services. The same expansion was made for several other data items. However, reporting for those who received only staff-assisted core services was very incomplete. Hence, this report continues to show only data for those items for those who received intensive or training services.
For services, the codes for Disaster National Emergency Grant changed in a manner that might lead to over reporting in some states and under reporting in others. These data are less reliable than in previous years. There are also additional categories for the type of training received, including Remedial Training (ABE/ESL – TAA only), Prerequisite Training, Apprenticeship Training, and Other basic skills training (WIA Youth). These new categories are shown in the report but may be under reported. For youth, the categories for youth activities were revised and expanded and, instead of reporting whether a youth received the activity, the most recent date received is reported. In addition, training is now captured by the training fields also used for adults and dislocated workers rather than separately. In tables showing trends over time, the youth activity data are presented both in the new and revised categories. However, the extent of these changes, especially the shift to reporting the most recent date received has led to substantial underreporting.

Social Policy Research Associates 6
Part I Summary Comparisons Across Programs

All Programs
Social Policy Research Associates 7
Table I-1 Trends in the Number of Exiters, by Program of Participation
(Derived from PY 2013Q4 WIASRD Records)
WIA
PY 2009 WIA
PY 2010 WIA
PY 2011 WIA
PY 2012 WIA
4/1/13-3/31/14
Total exiters, all programs 1,730,082 1,809,291 1,734,957 1,694,924 1,555,221 Local programs 1,571,202 1,636,882 1,648,042 1,670,198 1,537,520 Statewide programs 57,893 94,964 62,721 33,339 21,699 NEG programs 23,768 24,987 31,274 27,302 22,281
Total adults 1,187,450 1,252,411 1,218,275 1,200,782 1,076,347 Local programs 1,167,070 1,216,901 1,203,039 1,193,273 1,071,905 Statewide programs 26,754 50,490 28,093 10,927 6,090
Total dislocated workers 581,985 760,853 754,108 705,589 669,117 Local programs 561,923 745,155 732,560 686,766 654,050 Statewide programs 20,462 28,730 28,337 17,541 12,685 NEG programs 23,768 24,987 31,274 27,302 22,281
Disaster Relief 3,020 2,665 3,082 1,363 838 Other 20,748 22,322 28,192 25,939 21,443
Total Youth 133,564 139,323 122,642 109,695 102,971 Local programs 5,785 7,150 65,250 108,074 102,515 Statewide programs 11,142 16,351 6,915 5,047 3,030
Total younger youth 91,878 95,401 81,581 70,207 66,348 Local programs 4,538 5,725 42,518 68,731 65,947 Statewide programs 8,847 13,204 5,077 3,891 2,130
Total older youth 41,686 43,922 41,061 39,488 36,623 Local programs 1,247 1,425 22,732 39,343 36,568 Statewide programs 2,295 3,147 1,838 1,156 900

All Programs
Social Policy Research Associates
8
Table I-2 Number of Exiters from April 2013 to March 2014, by State and Program of Participation
(Derived from PY 2013Q4 WIASRD Records)
Total, All Programs
Adult
Dislocated Worker
Younger Youth
Older Youth
Nation 1,555,221 1,076,347 669,117 66,348 36,623 Alabama 5,869 2,517 1,391 1,038 985 Alaska 438 198 101 88 60 Arizona 5,715 2,884 1,427 869 557 Arkansas 1,735 618 407 578 138 California 66,118 29,956 23,287 8,534 5,906 Colorado 4,386 1,957 1,067 767 611 Connecticut 3,025 973 1,576 264 226 Delaware 811 290 304 168 52 District of Columbia 586 362 71 85 86 Florida 27,561 14,566 8,098 3,038 2,287 Georgia 10,634 4,567 3,027 2,165 1,031 Hawaii 627 224 261 125 38 Idaho 1,727 404 719 413 218 Illinois 12,270 3,659 5,411 1,819 1,419 Indiana 41,367 38,733 6,358 2,006 890 Iowa 30,335 29,227 9,932 304 236 Kansas 6,135 4,904 995 407 315 Kentucky 6,970 2,642 2,464 1,323 601 Louisiana 62,175 59,643 3,096 422 438 Maine 1,420 562 503 211 169 Maryland 4,335 1,741 2,156 697 319 Massachusetts 6,255 1,441 3,478 1,016 446 Michigan 15,518 7,524 3,797 3,319 880 Minnesota 5,112 1,042 2,568 1,123 394 Mississippi 11,187 4,929 4,292 1,368 644 Missouri 232,182 230,997 136,738 1,261 821 Montana 966 367 464 157 57 Nebraska 882 382 210 115 188 Nevada 6,553 2,659 1,501 1,844 593 New Hampshire 1,210 346 693 141 30 New Jersey 10,070 3,437 4,639 1,801 510 New Mexico 2,081 1,109 355 456 178 New York 533,596 264,713 276,808 2,684 1,898 North Carolina 23,476 17,760 3,167 1,555 1,059 North Dakota 437 233 54 98 63 Ohio 13,976 7,626 4,149 1,889 814

All Programs
Social Policy Research Associates 9
Total, All Programs
Adult
Dislocated Worker
Younger Youth
Older Youth
Oklahoma 46,675 44,736 2,152 482 382 Oregon 143,813 142,587 114,935 933 375 Pennsylvania 20,480 8,218 8,017 3,355 1,741 Puerto Rico 14,976 5,644 1,586 5,932 1,944 Rhode Island 1,500 452 625 315 119 South Carolina 9,541 5,566 2,037 1,030 1,020 South Dakota 1,096 607 228 114 153 Tennessee 11,484 4,561 4,045 2,167 1,038 Texas 33,945 23,519 6,473 2,997 2,353 Utah 86,342 85,791 1,042 762 410 Vermont 660 269 112 240 42 Virgin Islands 930 202 629 52 53 Virginia 6,611 2,698 2,420 1,038 514 Washington 9,531 3,332 3,984 1,491 791 West Virginia 1,764 470 909 287 135 Wisconsin 7,476 2,224 4,287 759 324 Wyoming 657 279 72 246 72
All Programs
Social Policy Research Associates
10
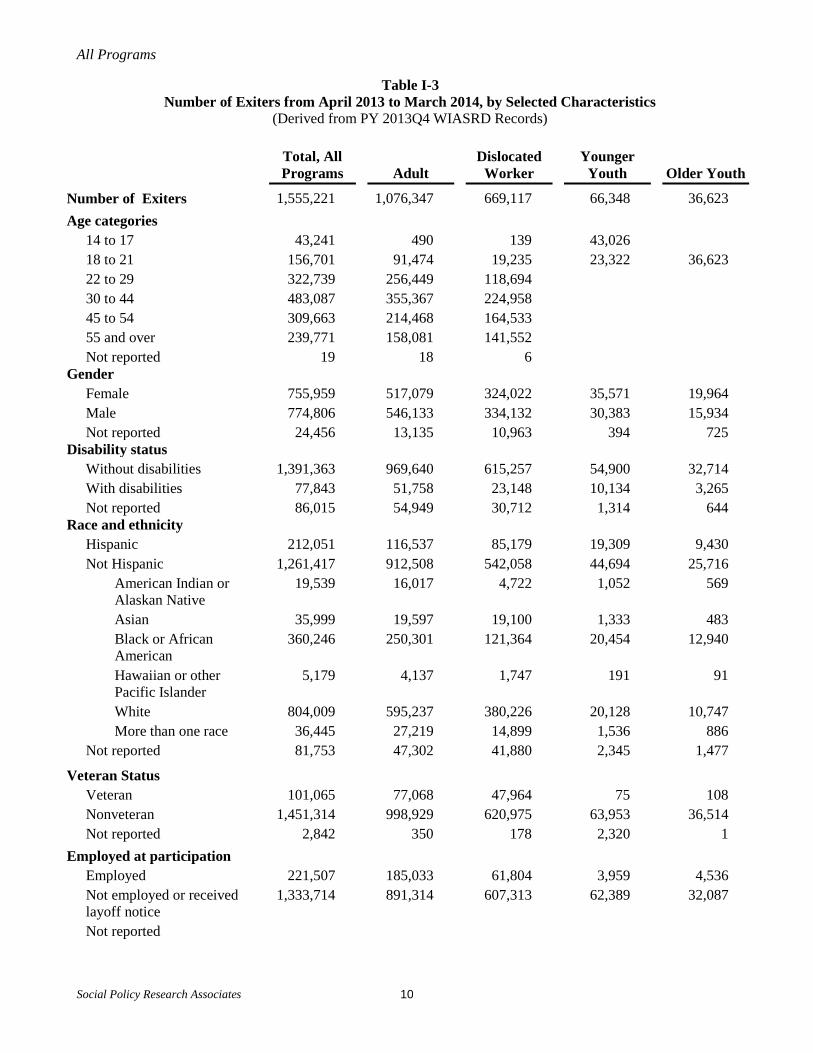
Table I-3 Number of Exiters from April 2013 to March 2014, by Selected Characteristics
(Derived from PY 2013Q4 WIASRD Records)
Total, All Programs
Adult
Dislocated Worker
Younger Youth
Older Youth
Number of Exiters 1,555,221 1,076,347 669,117 66,348 36,623 Age categories
14 to 17 43,241 490 139 43,026 18 to 21 156,701 91,474 19,235 23,322 36,623 22 to 29 322,739 256,449 118,694 30 to 44 483,087 355,367 224,958 45 to 54 309,663 214,468 164,533 55 and over 239,771 158,081 141,552 Not reported 19 18 6
Gender Female 755,959 517,079 324,022 35,571 19,964 Male 774,806 546,133 334,132 30,383 15,934 Not reported 24,456 13,135 10,963 394 725
Disability status Without disabilities 1,391,363 969,640 615,257 54,900 32,714 With disabilities 77,843 51,758 23,148 10,134 3,265 Not reported 86,015 54,949 30,712 1,314 644
Race and ethnicity Hispanic 212,051 116,537 85,179 19,309 9,430 Not Hispanic 1,261,417 912,508 542,058 44,694 25,716 American Indian or Alaskan Native
19,539 16,017 4,722 1,052 569
Asian 35,999 19,597 19,100 1,333 483 Black or African American
360,246 250,301 121,364 20,454 12,940
Hawaiian or other Pacific Islander
5,179 4,137 1,747 191 91
White 804,009 595,237 380,226 20,128 10,747 More than one race 36,445 27,219 14,899 1,536 886 Not reported 81,753 47,302 41,880 2,345 1,477
Veteran Status Veteran 101,065 77,068 47,964 75 108 Nonveteran 1,451,314 998,929 620,975 63,953 36,514 Not reported 2,842 350 178 2,320 1
Employed at participation Employed 221,507 185,033 61,804 3,959 4,536 Not employed or received layoff notice
1,333,714 891,314 607,313 62,389 32,087
Not reported

Social Policy Research Associates 11
Table I-4 Trends Over Time in the Number of Adult Exiters, by State
(Derived from PY 2013Q4 WIASRD Records)
WIA
PY 2009 WIA
PY 2010 WIA
PY 2011 WIA
PY 2012 WIA
4/1/13-3/31/14
Nation 1,187,450 1,252,411 1,218,275 1,200,782 1,076,347 Alabama 3,245 2,759 3,045 2,964 2,517 Alaska 476 343 267 193 198 Arizona 3,198 2,953 3,161 3,436 2,884 Arkansas 1,416 1,124 749 668 618 California 82,706 69,714 45,883 38,421 29,956 Colorado 2,245 2,215 2,034 1,960 1,957 Connecticut 793 1,346 1,122 863 973 Delaware 520 505 271 296 290 District of Columbia 867 1,179 994 680 362 Florida 18,692 19,333 14,230 14,591 14,566 Georgia 3,453 4,409 4,210 4,847 4,567 Hawaii 375 452 264 231 224 Idaho 643 519 566 610 404 Illinois 7,606 5,927 5,776 5,203 3,659 Indiana 132,813 114,618 43,045 34,751 38,733 Iowa 6,300 12,913 23,436 28,496 29,227 Kansas 11,371 7,236 5,399 5,756 4,904 Kentucky 4,114 3,862 2,650 2,901 2,642 Louisiana 121,194 85,551 63,370 61,821 59,643 Maine 399 477 437 622 562 Maryland 1,800 2,018 2,293 1,936 1,741 Massachusetts 2,468 4,001 1,878 1,787 1,441 Michigan 13,790 15,649 8,956 7,683 7,524 Minnesota 1,915 1,855 1,150 1,228 1,042 Mississippi 30,091 16,812 15,470 6,237 4,929 Missouri 4,031 197,029 265,214 258,192 230,997 Montana 378 14,663 23,563 352 367 Nebraska 553 484 442 395 382 Nevada 1,856 3,120 2,040 2,448 2,659 New Hampshire 540 457 269 302 346 New Jersey 3,327 4,427 4,164 4,180 3,437 New Mexico 2,564 1,428 1,832 1,183 1,109 New York 334,721 274,068 259,645 265,851 264,713 North Carolina 5,285 4,576 3,244 3,142 17,760 North Dakota 717 539 255 191 233 Ohio 12,983 10,103 10,636 8,651 7,626 Oklahoma 57,431 54,181 54,306 60,340 44,736

Social Policy Research Associates
12
WIA
PY 2009 WIA
PY 2010 WIA
PY 2011 WIA
PY 2012 WIA
4/1/13-3/31/14 Oregon 149,275 192,304 204,878 164,101 142,587 Pennsylvania 4,659 7,199 7,258 6,610 8,218 Puerto Rico 7,543 8,609 8,312 5,773 5,644 Rhode Island 891 1,167 644 436 452 South Carolina 12,355 9,207 5,984 5,736 5,566 South Dakota 642 648 665 736 607 Tennessee 8,931 8,811 4,455 4,578 4,561 Texas 21,413 20,535 11,366 25,894 23,519 Utah 94,902 49,777 89,638 144,072 85,791 Vermont 483 315 113 263 269 Virgin Islands 515 501 54 121 202 Virginia 2,106 3,095 2,698 2,882 2,698 Washington 3,155 3,295 2,585 2,792 3,332 West Virginia 1,073 1,135 832 579 470 Wisconsin 2,219 2,561 2,220 2,522 2,224 Wyoming 412 407 307 279 279

Social Policy Research Associates 13
Table I-5 Trends Over Time in the Number of Dislocated Worker Exiters from Local and Statewide Programs,
by State (Derived from PY 2013Q4 WIASRD Records)
WIA
PY 2009 WIA
PY 2010 WIA
PY 2011 WIA
PY 2012 WIA
4/1/13-3/31/14
Nation 570,144 752,705 741,623 693,634 658,970 Alabama 1,999 2,070 2,357 1,652 1,338 Alaska 383 226 166 108 101 Arizona 2,697 2,787 2,422 1,960 1,419 Arkansas 582 683 467 265 271 California 42,980 45,940 26,591 25,274 22,545 Colorado 725 1,223 1,050 1,062 1,067 Connecticut 923 2,332 1,914 1,400 1,576 Delaware 535 653 329 305 271 District of Columbia 211 392 339 214 71 Florida 4,517 8,818 8,724 7,884 6,628 Georgia 3,126 5,554 4,099 4,203 2,942 Hawaii 419 358 331 324 260 Idaho 716 823 758 721 583 Illinois 8,349 9,208 10,073 7,356 5,357 Indiana 26,532 24,894 11,556 8,206 6,352 Iowa 1,955 1,411 5,916 9,163 9,920 Kansas 2,052 1,877 1,384 1,402 983 Kentucky 2,532 4,090 3,383 2,382 1,868 Louisiana 7,091 3,570 1,779 2,495 2,614 Maine 707 684 641 572 459 Maryland 1,730 1,875 2,100 2,308 2,156 Massachusetts 4,694 4,911 3,961 3,487 2,855 Michigan 8,482 9,910 7,223 5,046 3,532 Minnesota 4,709 5,120 3,841 2,628 2,539 Mississippi 25,957 18,411 12,688 4,214 3,909 Missouri 4,219 104,854 144,564 143,934 136,625 Montana 543 922 850 537 464 Nebraska 508 491 454 284 206 Nevada 1,465 2,646 1,645 1,371 1,501 New Hampshire 920 856 674 662 689 New Jersey 5,005 6,962 5,679 4,749 3,865 New Mexico 288 421 501 481 349 New York 213,532 219,038 242,030 266,298 276,470 North Carolina 5,749 6,684 4,095 3,060 3,161 North Dakota 238 236 116 92 54

Social Policy Research Associates
14
WIA
PY 2009 WIA
PY 2010 WIA
PY 2011 WIA
PY 2012 WIA
4/1/13-3/31/14 Ohio 9,962 10,301 8,217 5,272 4,082 Oklahoma 20,335 15,631 4,412 894 645 Oregon 101,626 169,889 167,645 132,089 114,930 Pennsylvania 8,966 11,567 11,155 8,465 7,812 Puerto Rico 4,099 4,165 4,202 2,029 1,540 Rhode Island 1,774 1,650 1,131 753 552 South Carolina 8,034 6,036 3,408 2,585 2,036 South Dakota 533 532 448 385 228 Tennessee 4,215 4,989 3,880 4,250 3,727 Texas 9,820 9,957 7,280 7,126 6,303 Utah 961 889 798 1,413 1,042 Vermont 393 209 65 135 100 Virgin Islands 223 232 72 81 187 Virginia 3,153 4,486 4,412 3,665 2,419 Washington 3,333 3,937 3,492 3,144 3,476 West Virginia 1,615 1,709 1,472 977 888 Wisconsin 3,984 5,507 4,754 4,201 3,931 Wyoming 48 89 80 71 72

Social Policy Research Associates 15
Table I-6 Trends Over Time in the Number of Exiters from NEG Projects, by State
(Derived from PY 2013Q4 WIASRD Records)
WIA
PY 2009 WIA
PY 2010 WIA
PY 2011 WIA
PY 2012 WIA
4/1/13-3/31/14
Nation 23,768 24,987 31,274 27,302 22,281 Alabama 2,212 83 382 218 117 Alaska 4 1 51 53 29 Arizona 49 127 79 31 Arkansas 202 126 379 30 136 California 772 1,209 2,166 4,213 2,893 Colorado 2 60 52 61 Connecticut 152 335 169 115 102 Delaware 74 359 138 98 56 District of Columbia 72 46 58 88 27 Florida 444 542 1,088 1,509 1,789 Georgia 148 75 497 212 99 Hawaii 425 135 52 36 9 Idaho 435 603 386 260 184 Illinois 845 890 519 294 134 Indiana 389 298 310 73 123 Iowa 1,424 739 1,206 603 310 Kansas 148 383 381 366 217 Kentucky 176 136 530 337 740 Louisiana 1,623 642 1,061 1,044 769 Maine 615 676 722 197 59 Maryland 1 130 600 674 Massachusetts 783 938 1,309 1,482 1,189 Michigan 1,066 2,677 2,408 1,618 912 Minnesota 385 1,031 804 238 388 Mississippi 2,916 883 1,012 519 427 Missouri 1,108 1,766 2,466 1,538 1,096 Montana 61 73 56 45 52 Nebraska 53 21 4 Nevada 5 New Hampshire 77 70 134 102 92 New Jersey 123 67 783 624 858 New Mexico 7 18 5 8 New York 426 622 570 1,139 929 North Carolina 1,248 317 426 86 14 North Dakota Ohio 845 1,485 1,246 539 274

Social Policy Research Associates
16
WIA
PY 2009 WIA
PY 2010 WIA
PY 2011 WIA
PY 2012 WIA
4/1/13-3/31/14 Oklahoma 6 10 109 357 1,527 Oregon 1,379 1,855 1,380 490 301 Pennsylvania 724 1,015 807 853 522 Puerto Rico 799 935 908 67 Rhode Island 7 68 84 South Carolina 3 8 89 140 42 South Dakota 8 80 70 32 Tennessee 8 714 1,116 1,621 1,378 Texas 1,526 1,340 2,559 1,005 611 Utah 3 26 28 Vermont 4 46 111 13 Virgin Islands 1 92 456 Virginia 150 371 288 339 92 Washington 118 53 337 1,079 935 West Virginia 50 32 22 127 168 Wisconsin 595 1,487 1,780 1,609 1,246 Wyoming

Social Policy Research Associates 17
Table I-7 Trends Over Time in the Number of Youth Exiters, by State
(Derived from PY 2013Q4 WIASRD Records)
WIA
PY 2009 WIA
PY 2010 WIA
PY 2011 WIA
PY 2012 WIA
4/1/13-3/31/14
Nation 133,564 139,323 122,642 109,695 102,971 Alabama 888 1,019 1,109 1,481 2,023 Alaska 639 562 351 220 148 Arizona 1,576 2,090 1,646 1,890 1,426 Arkansas 1,066 1,213 834 760 716 California 14,817 19,240 15,562 16,608 14,440 Colorado 1,423 1,460 1,348 1,404 1,378 Connecticut 583 715 731 451 490 Delaware 148 359 214 277 220 District of Columbia 153 168 252 232 171 Florida 5,715 7,286 5,757 5,851 5,325 Georgia 2,459 3,214 3,327 3,333 3,196 Hawaii 274 202 239 162 163 Idaho 475 494 458 572 631 Illinois 6,163 3,885 4,817 4,678 3,238 Indiana 3,590 4,373 3,011 3,037 2,896 Iowa 565 628 654 501 540 Kansas 694 653 581 661 722 Kentucky 1,690 2,631 2,087 2,215 1,924 Louisiana 1,330 1,065 1,312 1,022 860 Maine 348 416 467 408 380 Maryland 789 844 1,154 1,022 1,016 Massachusetts 2,020 1,966 1,653 1,578 1,462 Michigan 6,792 7,123 5,749 4,495 4,199 Minnesota 1,919 2,040 2,034 1,649 1,517 Mississippi 4,088 3,656 2,709 2,070 2,012 Missouri 1,877 2,300 2,387 2,679 2,082 Montana 200 327 224 166 214 Nebraska 401 439 332 279 303 Nevada 232 610 570 1,264 2,437 New Hampshire 425 334 214 216 171 New Jersey 1,816 2,144 2,794 2,606 2,311 New Mexico 900 885 898 746 634 New York 8,273 9,826 5,249 5,335 4,582 North Carolina 1,828 2,232 2,339 2,163 2,614 North Dakota 420 411 184 217 161 Ohio 6,057 5,507 5,896 3,255 2,703 Oklahoma 743 793 717 826 864
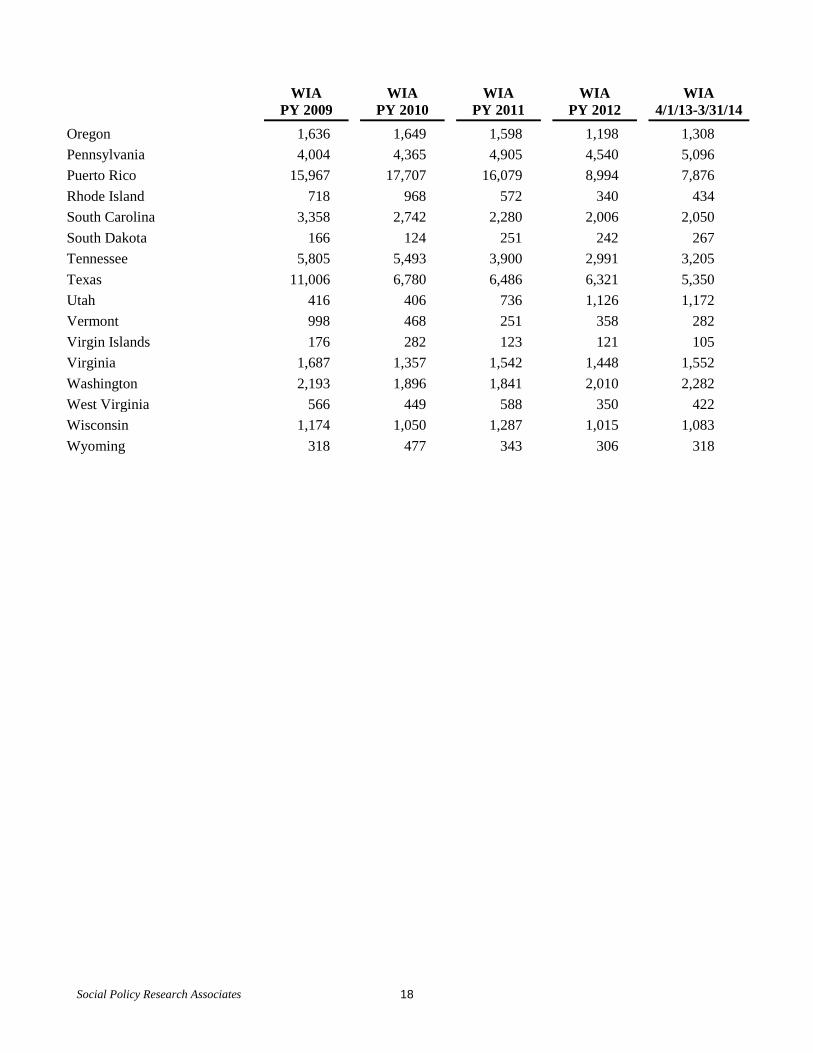
Social Policy Research Associates
18
WIA
PY 2009 WIA
PY 2010 WIA
PY 2011 WIA
PY 2012 WIA
4/1/13-3/31/14 Oregon 1,636 1,649 1,598 1,198 1,308 Pennsylvania 4,004 4,365 4,905 4,540 5,096 Puerto Rico 15,967 17,707 16,079 8,994 7,876 Rhode Island 718 968 572 340 434 South Carolina 3,358 2,742 2,280 2,006 2,050 South Dakota 166 124 251 242 267 Tennessee 5,805 5,493 3,900 2,991 3,205 Texas 11,006 6,780 6,486 6,321 5,350 Utah 416 406 736 1,126 1,172 Vermont 998 468 251 358 282 Virgin Islands 176 282 123 121 105 Virginia 1,687 1,357 1,542 1,448 1,552 Washington 2,193 1,896 1,841 2,010 2,282 West Virginia 566 449 588 350 422 Wisconsin 1,174 1,050 1,287 1,015 1,083 Wyoming 318 477 343 306 318

Social Policy Research Associates 19
Part II Adult Exiters
Adults
Social Policy Research Associates 20
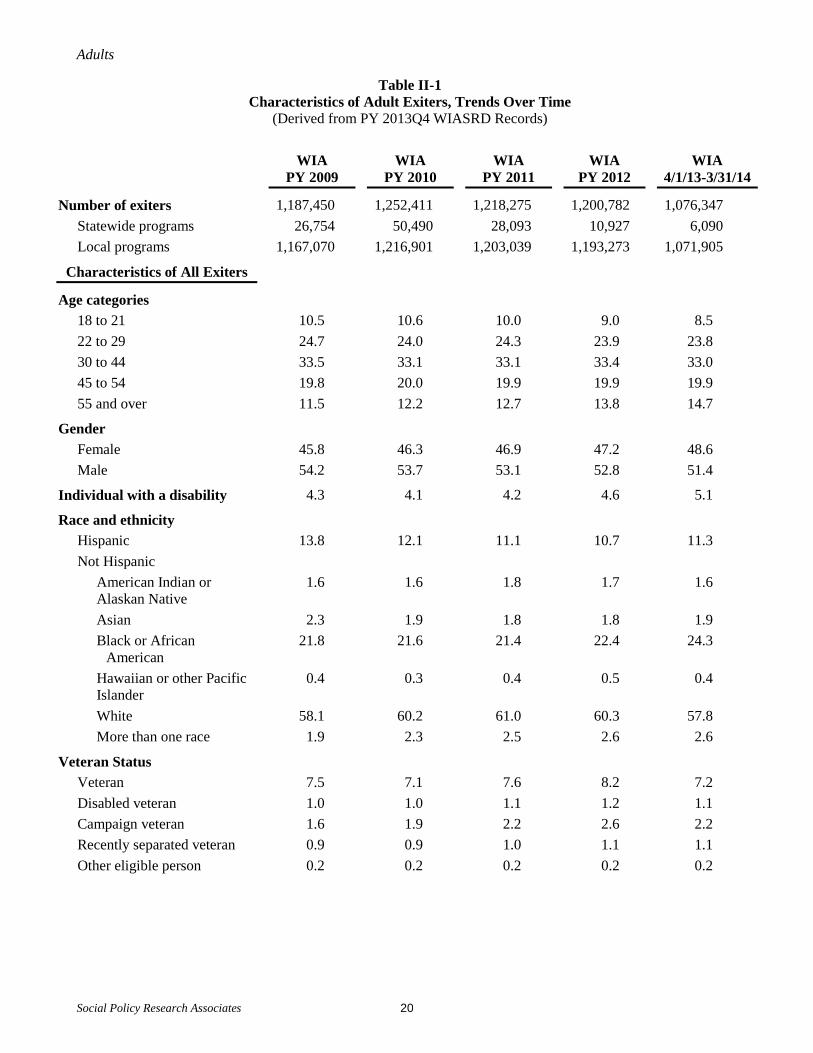
Table II-1 Characteristics of Adult Exiters, Trends Over Time
(Derived from PY 2013Q4 WIASRD Records)
WIA
PY 2009 WIA
PY 2010 WIA
PY 2011 WIA
PY 2012 WIA
4/1/13-3/31/14
Number of exiters 1,187,450 1,252,411 1,218,275 1,200,782 1,076,347 Statewide programs 26,754 50,490 28,093 10,927 6,090 Local programs 1,167,070 1,216,901 1,203,039 1,193,273 1,071,905
Characteristics of All Exiters
Age categories
18 to 21 10.5 10.6 10.0 9.0 8.5 22 to 29 24.7 24.0 24.3 23.9 23.8 30 to 44 33.5 33.1 33.1 33.4 33.0 45 to 54 19.8 20.0 19.9 19.9 19.9 55 and over 11.5 12.2 12.7 13.8 14.7
Gender
Female 45.8 46.3 46.9 47.2 48.6 Male 54.2 53.7 53.1 52.8 51.4
Individual with a disability 4.3 4.1 4.2 4.6 5.1
Race and ethnicity
Hispanic 13.8 12.1 11.1 10.7 11.3 Not Hispanic
American Indian or Alaskan Native
1.6 1.6 1.8 1.7 1.6
Asian 2.3 1.9 1.8 1.8 1.9 Black or African American
21.8 21.6 21.4 22.4 24.3
Hawaiian or other Pacific Islander
0.4 0.3 0.4 0.5 0.4
White 58.1 60.2 61.0 60.3 57.8 More than one race 1.9 2.3 2.5 2.6 2.6
Veteran Status Veteran 7.5 7.1 7.6 8.2 7.2 Disabled veteran 1.0 1.0 1.1 1.2 1.1 Campaign veteran 1.6 1.9 2.2 2.6 2.2 Recently separated veteran 0.9 0.9 1.0 1.1 1.1 Other eligible person 0.2 0.2 0.2 0.2 0.2

Adults
Social Policy Research Associates 21
WIA
PY 2009 WIA
PY 2010 WIA
PY 2011 WIA
PY 2012 WIA
4/1/13-3/31/14
Number of exiters 1,187,450 1,252,411 1,218,275 1,200,782 1,076,347
Employed at participation
Employed 16.3 16.9 16.5 16.0 16.5 Not employed or received layoff notice
83.7 83.1 83.5 84.0 83.5
Average preprogram quarterly earnings
$6,571 $5,866 $5,939 $6,176 $6,234
None 27.2 32.9 29.9 26.7 24.8 $1 to $2,499 18.7 19.2 19.1 18.7 18.5 $2,500 to $4,999 18.5 18.1 19.4 20.0 20.7 $5,000 to $7,499 13.6 12.3 13.2 14.2 14.8 $7,500 to $9,999 8.5 7.2 7.7 8.4 8.8 $10,000 or more 13.5 10.3 10.7 12.1 12.4
UI Claimant (all exiters)1 40.1 44.0 45.0 UI Claimant referred by WPRS 8.4 10.7 10.2 UI Exhaustee 2.1 1.8 1.7
Characteristics of Exiters who Received Intensive or Training Services
UI Claimant 33.8 34.0 37.5 38.1 37.6 UI Claimant referred by WPRS 9.6 8.2 8.3 9.0 8.1 UI Exhaustee 2.5 3.3 2.7 2.7 2.5
Limited English-language (excludes Puerto Rico)
1.8 1.6 1.4 1.5 1.5
Single parent 12.1 12.2 11.5 14.2 14.2
Low income 48.3 52.7 49.7 51.0 48.7
Public assistance recipient 22.3 25.9 26.7 28.1 27.5 TANF recipient 3.4 3.7 3.4 4.0 3.8 Other public assistance, including SNAP and SSI
21.7 25.2 26.2 27.5 26.9
Homeless 1.9 2.3 2.2 2.3 2.2
Offender 7.1 7.9 7.9 8.9 8.6
1 UI claimant percentages for all exiters in WIA
PY 2011 are based on only 6 months of exiters.

Adults
Social Policy Research Associates 22
WIA
PY 2009 WIA
PY 2010 WIA
PY 2011 WIA
PY 2012 WIA
4/1/13-3/31/14
Number of exiters 1,187,450 1,252,411 1,218,275 1,200,782 1,076,347
Highest grade completed (avg.) 12.6 12.6 12.8 12.8 12.8 8th or less 2.5 2.6 2.1 1.6 1.5 Some high school 11.1 11.1 10.8 10.3 9.5 High school graduate 38.9 38.0 35.7 37.4 37.7 High school equivalency 9.0 9.0 8.2 7.7 7.7 Some postsecondary 26.2 26.7 29.0 30.4 30.8 College graduate (4-year) 12.2 12.5 14.2 12.5 12.8

Adults
Social Policy Research Associates 23
Table II-2 Number of Adult Exiters, by Characteristics, Trends Over Time
(Derived from PY 2013Q4 WIASRD Records)
WIA
PY 2009 WIA
PY 2010 WIA
PY 2011 WIA
PY 2012 WIA
4/1/13-3/31/14
Number of exiters 1,187,450 1,252,411 1,218,275 1,200,782 1,076,347 Statewide programs 26,754 50,490 28,093 10,927 6,090 Local programs 1,167,070 1,216,901 1,203,039 1,193,273 1,071,905
Characteristics of All Exiters
Age categories
18 to 21 124,955 132,952 121,801 108,259 91,966 22 to 29 293,668 300,684 296,034 286,506 256,449 30 to 44 397,690 415,037 403,629 401,471 355,367 45 to 54 234,753 250,964 241,914 238,905 214,468 55 and over 136,380 152,771 154,888 165,629 158,081
Gender
Female 542,435 577,765 565,350 557,288 517,079 Male 642,202 670,719 639,516 622,558 546,133
Individual with a disability 50,062 50,366 49,088 53,821 51,758
Race and ethnicity
Hispanic 159,172 147,358 129,537 122,795 116,537 Not Hispanic
American Indian or Alaskan Native
18,541 19,340 20,496 19,457 16,017
Asian 26,164 23,440 21,544 20,702 19,597 Black or African American
251,160 261,540 249,546 256,201 250,301
Hawaiian or other Pacific Islander
4,538 4,132 4,545 5,164 4,137
White 668,392 730,209 712,345 690,255 595,237 More than one race 21,681 27,421 29,286 30,052 27,219
Veteran Status Veteran 88,990 89,518 93,057 98,050 77,068 Disabled veteran 11,975 13,126 13,105 14,526 11,588 Campaign veteran 19,551 24,263 27,277 30,645 23,395 Recently separated veteran 10,578 11,014 11,766 13,074 11,785 Other eligible person 2,124 2,178 2,103 2,687 1,834

Adults
Social Policy Research Associates 24
WIA
PY 2009 WIA
PY 2010 WIA
PY 2011 WIA
PY 2012 WIA
4/1/13-3/31/14
Number of exiters 1,187,450 1,252,411 1,218,275 1,200,782 1,076,347
Employed at participation
Employed 193,190 212,001 201,492 192,717 177,560 Not employed or received layoff notice
994,255 1,040,408 1,016,781 1,008,065 898,787
Average preprogram quarterly earnings
None 322,148 411,820 363,589 320,663 249,190 $1 to $2,499 221,148 239,983 232,774 224,294 185,572 $2,500 to $4,999 219,176 226,883 236,183 240,090 208,196 $5,000 to $7,499 161,112 153,367 161,236 169,991 148,838 $7,500 to $9,999 100,921 89,807 93,721 100,907 87,985 $10,000 or more 160,438 129,359 130,180 144,837 124,046
UI Claimant (all exiters) 433,951 388,200 UI Claimant referred by WPRS 105,870 88,410 UI Exhaustee 18,085 14,675
Characteristics of Exiters who Received Intensive or Training
Services
UI Claimant 170,595 169,612 139,895 112,409 103,493 UI Claimant referred by WPRS 48,608 41,025 30,955 26,608 22,407 UI Exhaustee 12,501 16,614 10,121 7,976 6,926
Limited English-language (excludes Puerto Rico)
8,856 7,940 5,059 4,289 3,958
Single parent 59,404 59,467 42,034 40,420 37,478
Low income 242,098 260,160 183,789 149,454 132,405
Public assistance recipient 111,948 128,529 99,515 83,032 75,754 TANF recipient 17,043 18,235 12,459 11,624 10,490 Other public assistance, including SNAP and SSI
109,084 124,934 97,517 81,183 74,002
Homeless 9,680 11,088 7,964 6,668 6,183
Offender 35,291 38,136 29,309 26,420 23,717
Highest grade completed 8th or less 12,363 12,907 7,971 4,675 4,160 Some high school 55,250 55,010 40,259 30,513 25,970 High school graduate 194,052 187,965 132,381 110,331 103,360 High school equivalency 44,881 44,460 30,311 22,854 21,112 Some postsecondary 130,745 132,118 107,696 89,859 84,348 College graduate (4-year) 61,002 61,772 52,632 36,972 34,978
Adults
Social Policy Research Associates 25
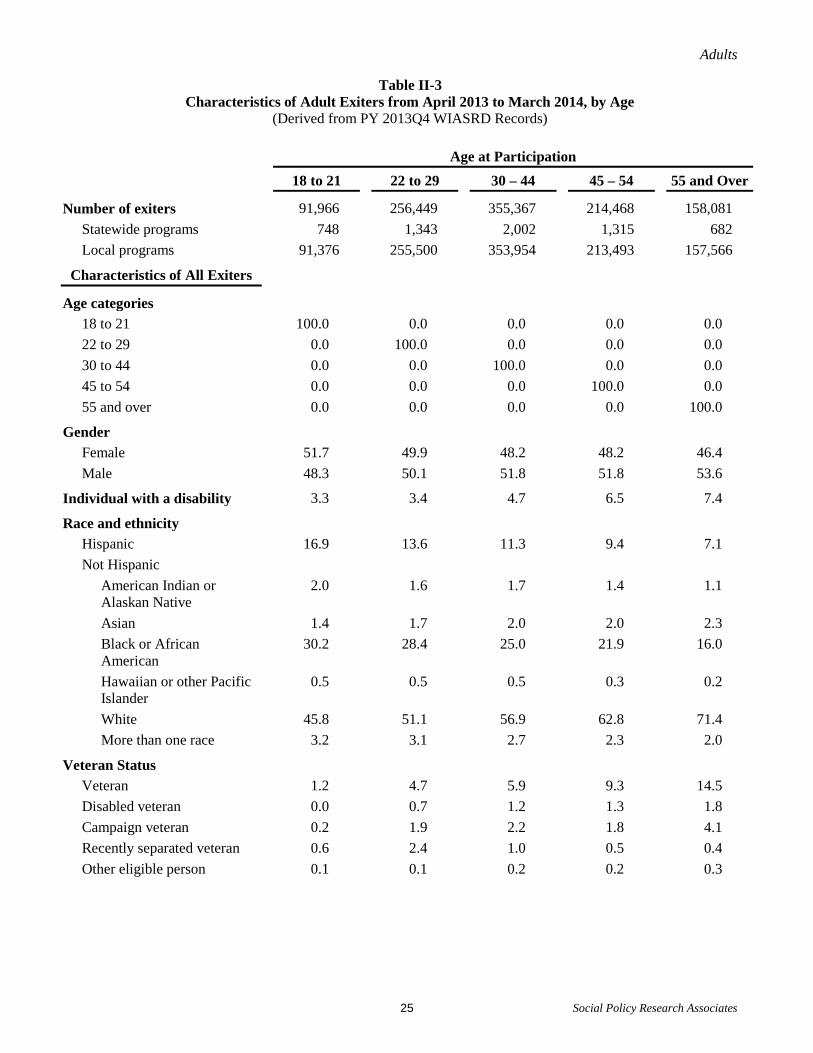
Table II-3 Characteristics of Adult Exiters from April 2013 to March 2014, by Age
(Derived from PY 2013Q4 WIASRD Records)
Age at Participation
18 to 21 22 to 29 30 – 44 45 – 54 55 and Over
Number of exiters 91,966 256,449 355,367 214,468 158,081 Statewide programs 748 1,343 2,002 1,315 682 Local programs 91,376 255,500 353,954 213,493 157,566
Characteristics of All Exiters
Age categories
18 to 21 100.0 0.0 0.0 0.0 0.0 22 to 29 0.0 100.0 0.0 0.0 0.0 30 to 44 0.0 0.0 100.0 0.0 0.0 45 to 54 0.0 0.0 0.0 100.0 0.0 55 and over 0.0 0.0 0.0 0.0 100.0
Gender
Female 51.7 49.9 48.2 48.2 46.4 Male 48.3 50.1 51.8 51.8 53.6
Individual with a disability 3.3 3.4 4.7 6.5 7.4
Race and ethnicity
Hispanic 16.9 13.6 11.3 9.4 7.1 Not Hispanic
American Indian or Alaskan Native
2.0 1.6 1.7 1.4 1.1
Asian 1.4 1.7 2.0 2.0 2.3 Black or African American
30.2 28.4 25.0 21.9 16.0
Hawaiian or other Pacific Islander
0.5 0.5 0.5 0.3 0.2
White 45.8 51.1 56.9 62.8 71.4 More than one race 3.2 3.1 2.7 2.3 2.0
Veteran Status Veteran 1.2 4.7 5.9 9.3 14.5 Disabled veteran 0.0 0.7 1.2 1.3 1.8 Campaign veteran 0.2 1.9 2.2 1.8 4.1 Recently separated veteran 0.6 2.4 1.0 0.5 0.4 Other eligible person 0.1 0.1 0.2 0.2 0.3

Adults
Social Policy Research Associates 26
Age at Participation
18 to 21 22 to 29 30 – 44 45 – 54 55 and Over
Number of exiters 91,966 256,449 355,367 214,468 158,081
Employed at participation
Employed 19.5 18.7 16.6 15.2 12.8 Not employed or received layoff notice
80.5 81.3 83.4 84.8 87.2
Average preprogram quarterly earnings
$2,660 $4,558 $6,486 $7,559 $8,089
None 36.6 24.9 24.5 23.0 21.2 $1 to $2,499 35.9 23.6 15.9 13.5 13.0 $2,500 to $4,999 20.1 25.1 20.1 18.6 18.6 $5,000 to $7,499 5.3 14.6 16.1 16.2 15.7 $7,500 to $9,999 1.3 6.4 10.1 10.9 11.0 $10,000 or more 0.8 5.4 13.3 17.7 20.5
UI Claimant (all exiters) 18.8 37.6 45.9 52.0 59.1 UI Claimant referred by WPRS 3.0 7.6 10.5 12.6 14.6 UI Exhaustee 0.5 1.2 1.8 2.2 2.1
Characteristics of Exiters who Received Intensive or Training
Services
UI Claimant 16.8 31.7 38.4 45.1 51.7 UI Claimant referred by WPRS 2.5 5.9 8.4 10.9 11.8 UI Exhaustee 0.8 1.8 2.8 3.4 3.0
Limited English-language (excludes Puerto Rico)
1.3 1.3 1.6 1.6 1.4
Single parent 11.5 18.5 18.9 8.7 2.8
Low income 60.4 54.2 51.9 41.7 30.7
Public assistance recipient 27.9 31.5 31.8 22.6 14.3 TANF recipient 4.6 5.5 4.7 1.7 0.7 Other public assistance, including SNAP and SSI
27.1 30.8 31.0 22.2 14.1
Homeless 2.7 1.8 2.2 2.9 1.8
Offender 5.4 8.3 11.0 8.9 4.2
Highest grade completed (avg.) 12.0 12.7 12.9 13.0 13.3 8th or less 1.2 1.1 1.5 1.7 2.2 Some high school 17.9 10.5 8.8 7.6 5.9 High school graduate 53.7 39.2 34.6 36.4 33.7 High school equivalency 6.5 8.4 9.2 6.9 4.1 Some postsecondary 20.2 31.0 32.7 31.5 31.6 College graduate (4-year) 0.5 9.8 13.0 15.9 22.5

Adults
Social Policy Research Associates 27
Table II-4 Characteristics of Adult Exiters from April 2013 to March 2014, by Ethnicity and Race
((Derived from PY 2013Q4 WIASRD Records)
Hispanic Not Hispanic
All Black White Other
Number of exiters 116,537 912,508 250,301 595,237 66,970 Statewide programs 688 4,357 1,431 2,686 240 Local programs 116,080 909,341 249,260 593,281 66,800
Characteristics of All Exiters
Age categories
18 to 21 12.8 8.0 10.6 6.8 9.3 22 to 29 28.6 23.3 27.9 21.1 25.4 30 to 44 33.1 33.0 33.9 32.5 34.6 45 to 54 16.5 20.3 17.9 21.6 18.1 55 and over 9.1 15.3 9.6 18.0 12.7
Gender
Female 51.1 48.3 52.8 46.4 49.2 Male 48.9 51.7 47.2 53.6 50.8
Individual with a disability 4.4 5.1 4.2 5.4 5.5
Race and ethnicity
Hispanic 100.0 0.0 0.0 0.0 0.0 Not Hispanic
American Indian or Alaskan Native
0.0 1.8 0.0 0.0 23.9
Asian 0.0 2.1 0.0 0.0 29.3 Black or African American
0.0 27.4 100.0 0.0 0.0
Hawaiian or other Pacific Islander
0.0 0.5 0.0 0.0 6.2
White 0.0 65.2 0.0 100.0 0.0 More than one race 0.0 3.0 0.0 0.0 40.6
Veteran Status Veteran 4.6 7.5 5.3 8.6 6.0 Disabled veteran 0.7 1.1 0.7 1.3 0.9 Campaign veteran 1.3 2.3 1.3 2.7 2.0 Recently separated veteran 0.8 1.1 0.7 1.3 1.1 Other eligible person 0.1 0.2 0.1 0.2 0.2

Adults
Social Policy Research Associates 28
Hispanic Not Hispanic
All Black White Other
Number of exiters 116,537 912,508 250,301 595,237 66,970
Employed at participation
Employed 15.7 16.6 17.1 16.4 15.7 Not employed or received layoff notice
84.3 83.4 82.9 83.6 84.3
Average preprogram quarterly earnings
$5,364 $6,317 $4,594 $7,021 $6,031
None 32.0 23.6 30.7 19.7 28.7 $1 to $2,499 20.1 18.3 23.7 15.8 18.8 $2,500 to $4,999 19.7 21.0 21.7 20.9 19.9 $5,000 to $7,499 13.1 15.2 12.4 16.6 13.8 $7,500 to $9,999 6.9 9.1 5.8 10.7 7.7 $10,000 or more 8.2 12.9 5.7 16.3 11.0
UI Claimant (all exiters) 35.1 46.3 40.0 49.2 41.6 UI Claimant referred by WPRS 6.8 10.8 13.7 9.9 9.5 UI Exhaustee 2.2 1.6 1.6 1.6 1.8
Characteristics of Exiters who Received Intensive or Training
Services
UI Claimant 30.5 39.4 30.2 44.5 31.9 UI Claimant referred by WPRS 5.7 8.8 7.8 9.6 5.4 UI Exhaustee 2.6 2.4 3.3 1.9 2.5
Limited English-language (excludes Puerto Rico)
4.0 1.1 1.3 0.5 5.2
Single parent 16.0 14.1 22.6 10.3 13.4
Low income 56.2 47.6 59.6 41.2 53.7
Public assistance recipient 29.4 27.4 36.4 22.8 30.7 TANF recipient 5.1 3.5 4.5 2.8 5.6 Other public assistance, including SNAP and SSI
28.6 26.8 35.4 22.4 29.9
Homeless 2.3 2.2 2.8 1.8 2.9
Offender 9.6 8.5 13.1 6.4 7.3
Highest grade completed (avg.) 12.3 12.9 12.7 12.9 12.9 8th or less 3.6 1.2 1.1 1.0 2.9 Some high school 14.6 8.8 9.8 8.2 9.7 High school graduate 41.6 37.1 40.5 35.8 33.9 High school equivalency 6.9 8.0 7.7 8.3 6.3 Some postsecondary 24.8 31.8 32.1 32.1 28.5 College graduate (4-year) 8.5 13.1 8.8 14.5 18.8

Adults
Social Policy Research Associates 29
Table II-5 Characteristics of Adult Exiters from April 2013 to March 2014,
by Employment at Participation, Gender, and Disability (Derived from PY 2013Q4 WIASRD Records)
Employed at Participation Gender With a
Disability Yes No Male Female
Number of exiters 177,560 898,787 546,133 517,079 51,758 Statewide programs 2,402 3,688 3,484 2,002 474 Local programs 175,535 896,370 543,429 515,701 51,450
Characteristics of All Exiters
Age categories
18 to 21 10.1 8.2 8.0 9.0 5.2 22 to 29 27.0 23.2 23.3 24.4 16.0 30 to 44 33.2 33.0 33.3 32.8 31.3 45 to 54 18.3 20.2 20.1 19.7 25.9 55 and over 11.4 15.3 15.3 14.0 21.6
Gender
Female 52.1 47.9 0.0 100.0 44.5 Male 47.9 52.1 100.0 0.0 55.5
Individual with a disability 3.8 5.3 5.4 4.6 100.0
Race and ethnicity
Hispanic 10.8 11.4 10.5 11.6 9.5 Not Hispanic
American Indian or Alaskan Native
1.3 1.6 1.6 1.6 1.7
Asian 2.0 1.9 1.8 2.0 1.2 Black or African American 25.3 24.1 22.4 26.4 20.0 Hawaiian or other Pacific Islander 0.4 0.4 0.4 0.4 0.4 White 57.7 57.9 60.6 55.4 63.5 More than one race 2.6 2.7 2.6 2.7 3.8
Veteran Status Veteran 6.5 7.3 12.2 1.8 16.7 Disabled veteran 1.0 1.1 1.8 0.3 9.5 Campaign veteran 2.1 2.2 3.9 0.4 6.5 Recently separated veteran 1.0 1.1 1.9 0.3 2.7 Other eligible person 0.1 0.2 0.1 0.3 0.3

Adults
Social Policy Research Associates 30
Employed at Participation Gender With a Disability Yes No Male Female
Number of exiters 177,560 898,787 546,133 517,079 51,758
Employed at participation
Employed 100.0 0.0 15.4 17.7 12.4 Not employed or received layoff notice
0.0 100.0 84.6 82.3 87.6
Average preprogram quarterly earnings
$5,608 $6,373 $7,068 $5,383 $5,356
None 16.6 26.4 24.5 24.6 41.5 $1 to $2,499 21.3 17.9 16.0 21.0 19.9 $2,500 to $4,999 25.4 19.8 18.7 23.1 15.8 $5,000 to $7,499 16.5 14.5 15.0 14.9 9.7 $7,500 to $9,999 9.3 8.7 9.9 7.7 5.5 $10,000 or more 10.9 12.6 16.0 8.7 7.6
UI Claimant (all exiters) 22.7 49.6 45.5 45.1 32.1 UI Claimant referred by WPRS 3.0 11.7 9.7 11.1 6.2 UI Exhaustee 1.0 1.8 1.6 1.7 2.6
Characteristics of Exiters who Received Intensive or Training
Services
UI Claimant 14.1 43.5 40.8 35.5 29.4 UI Claimant referred by WPRS 3.3 9.4 8.1 8.5 4.6 UI Exhaustee 1.6 2.7 2.3 2.5 2.5
Limited English-language (excludes Puerto Rico)
1.3 1.5 1.3 1.5 1.0
Single parent 18.7 13.1 4.9 22.8 8.7
Low income 43.9 50.0 41.4 54.9 57.5
Public assistance recipient 22.7 28.7 19.8 34.5 35.1 TANF recipient 2.4 4.2 1.3 6.0 3.9 Other public assistance, including SNAP and SSI
22.1 28.1 19.5 33.5 34.5
Homeless 1.3 2.5 2.7 1.6 4.2
Offender 7.1 9.0 12.2 5.0 11.0
Highest grade completed (avg.) 13.0 12.8 12.7 12.9 12.8 8th or less 0.8 1.7 1.6 1.4 2.1 Some high school 6.0 10.4 10.0 9.0 11.6 High school graduate 40.2 37.1 39.6 35.5 33.4 High school equivalency 6.8 7.9 8.7 6.9 7.2 Some postsecondary 33.6 30.1 27.8 33.9 32.4 College graduate (4-year) 12.6 12.8 12.2 13.3 13.3

Adults
Social Policy Research Associates 31
Table II-6 Characteristics of Adult Exiters from April 2013 to March 2014,
by Veteran Status (Derived from PY 2013Q4 WIASRD Records)
All Exiters Veteran Campaign Veteran
Recently Separated Veteran
Disabled Veteran
Number of exiters 1,076,347 77,068 23,395 11,785 11,588 Statewide programs 6,090 1,077 542 121 175 Local programs 1,071,905 76,400 23,070 11,703 11,478
Characteristics of All Exiters
Age categories
18 to 21 8.5 1.4 0.7 5.1 0.4 22 to 29 23.8 15.6 21.2 51.9 15.9 30 to 44 33.0 27.4 33.8 28.9 35.9 45 to 54 19.9 25.9 16.8 8.6 23.5 55 and over 14.7 29.8 27.6 5.5 24.2
Gender
Female 48.6 12.5 7.9 12.6 12.9 Male 51.4 87.5 92.1 87.4 87.1
Individual with a disability 5.1 11.6 14.7 12.5 45.1
Race and ethnicity Hispanic 11.3 7.3 7.0 8.7 7.0 Not Hispanic
American Indian or Alaskan Native
1.6 1.4 1.6 1.4 1.5
Asian 1.9 0.7 0.8 1.3 0.7 Black or African American 24.3 18.0 14.9 14.4 16.9 Hawaiian or other Pacific Islander 0.4 0.3 0.5 0.5 0.4 White 57.8 69.3 72.1 70.1 70.4 More than one race 2.6 2.9 3.2 3.6 3.2
Veteran Status Veteran 7.2 100.0 100.0 100.0 100.0 Disabled veteran 1.1 15.0 22.8 19.6 100.0 Campaign veteran 2.2 30.4 100.0 49.4 46.1 Recently separated veteran 1.1 15.3 24.9 100.0 20.0 Other eligible person 0.2 0.0 0.0 0.0 0.0

Adults
Social Policy Research Associates 32
All Exiters Veteran Campaign Veteran
Recently Separated Veteran
Disabled Veteran
Number of exiters 1,076,347 77,068 23,395 11,785 11,588
Employed at participation
Employed 16.5 14.9 16.0 15.1 15.2 Not employed or received layoff notice
83.5 85.1 84.0 84.9 84.8
Average preprogram quarterly earnings
$6,234 $8,139 $8,844 $9,081 $8,594
None 24.8 25.8 25.4 25.2 30.1 $1 to $2,499 18.5 12.6 11.1 11.8 11.3 $2,500 to $4,999 20.7 15.8 14.3 13.7 13.7 $5,000 to $7,499 14.8 14.4 14.1 12.6 12.8 $7,500 to $9,999 8.8 10.3 10.3 8.2 9.9 $10,000 or more 12.4 21.1 24.8 28.6 22.2
UI Claimant (all exiters) 45.0 45.7 45.0 42.7 43.5 UI Claimant referred by WPRS 10.2 9.9 10.5 10.1 10.6 UI Exhaustee 1.7 2.2 2.5 1.6 2.0
Characteristics of Exiters who Received Intensive or Training Services
UI Claimant 37.6 42.7 35.3 38.5 40.0 UI Claimant referred by WPRS 8.1 10.1 9.4 10.3 9.2 UI Exhaustee 2.5 3.2 5.0 2.7 2.8
Limited English-language (excludes Puerto Rico)
1.5 0.4 0.4 0.3 0.3
Single parent 14.2 6.2 7.5 7.7 6.1
Low income 48.7 38.6 40.8 34.0 33.3
Public assistance recipient 27.5 18.8 16.1 10.6 12.6 TANF recipient 3.8 2.0 1.0 0.8 0.8 Other public assistance, including SNAP and SSI
26.9 18.5 16.0 10.5 12.3
Homeless 2.2 4.7 6.2 2.9 3.4
Offender 8.6 8.4 7.3 3.4 4.7
Highest grade completed (avg.) 12.8 13.1 13.4 13.0 13.5 8th or less 1.5 0.5 0.2 0.5 0.4 Some high school 9.5 3.2 1.4 1.8 1.4 High school graduate 37.7 37.0 35.0 45.1 29.5 High school equivalency 7.7 5.4 4.1 6.0 3.4 Some postsecondary 30.8 40.0 43.0 35.7 45.5 College graduate (4-year) 12.8 13.9 16.3 10.8 19.7

Adults
Social Policy Research Associates 33
Table II-7 Characteristics of Adult Exiters from April 2013 to March 2014, by UI Status
(Derived from PY 2013Q4 WIASRD Records)
All Exiters
UI Claimant
All Referred by
WPRS Not Referred
by WPRS UI
Exhaustee
Number of exiters 1,076,347 388,200 88,410 299,790 14,675 Statewide programs 6,090 829 180 649 221 Local programs 1,071,905 387,705 88,323 299,382 14,529
Characteristics of All Exiters
Age categories
18 to 21 8.5 3.3 2.4 3.6 2.4 22 to 29 23.8 19.3 17.1 20.0 16.3 30 to 44 33.0 34.7 34.7 34.7 36.6 45 to 54 19.9 23.6 25.2 23.1 26.9 55 and over 14.7 19.0 20.6 18.6 17.8
Gender
Female 48.6 47.4 51.1 46.3 48.9 Male 51.4 52.6 48.9 53.7 51.1
Individual with a disability 5.1 3.4 2.9 3.6 7.2
Race and ethnicity
Hispanic 11.3 7.3 6.1 7.6 12.4 Not Hispanic
American Indian or Alaskan Native
1.6 1.6 2.8 1.3 1.9
Asian 1.9 1.4 0.9 1.5 1.8 Black or African American 24.3 20.1 29.9 17.2 21.8 Hawaiian or other Pacific Islander
0.4 0.3 0.1 0.4 0.5
White 57.8 66.7 58.1 69.3 58.7 More than one race 2.6 2.6 2.1 2.7 2.9
Veteran Status Veteran 7.2 7.8 7.4 7.9 10.0 Disabled veteran 1.1 1.1 1.2 1.1 1.4 Campaign veteran 2.2 2.6 2.6 2.5 3.8 Recently separated veteran 1.1 1.2 1.2 1.1 1.2 Other eligible person 0.2 0.2 0.2 0.2 0.3

Adults
Social Policy Research Associates 34
All Exiters
UI Claimant
All Referred by
WPRS Not Referred
by WPRS UI
Exhaustee
Number of exiters 1,076,347 388,200 88,410 299,790 14,675
Employed at participation
Employed 16.5 8.6 4.9 9.7 10.4 Not employed or received layoff notice
83.5 91.4 95.1 90.3 89.6
Average preprogram quarterly earnings
$6,234 $7,272 $7,466 $7,213 $4,219
None 24.8 6.4 5.9 6.5 50.3 $1 to $2,499 18.5 13.6 11.3 14.2 21.6 $2,500 to $4,999 20.7 26.0 25.0 26.3 13.4 $5,000 to $7,499 14.8 21.5 22.7 21.1 6.9 $7,500 to $9,999 8.8 13.2 14.5 12.8 3.8 $10,000 or more 12.4 19.3 20.6 18.9 3.9
UI Claimant (all exiters) 45.0 100.0 100.0 100.0 0.0 UI Claimant referred by WPRS 10.2 22.8 100.0 0.0 0.0 UI Exhaustee 1.7 0.0 0.0 0.0 100.0
Characteristics of Exiters who Received Intensive or Training Services
UI Claimant 37.6 100.0 100.0 100.0 0.0 UI Claimant referred by WPRS 8.1 21.7 100.0 0.0 0.0 UI Exhaustee 2.5 0.0 0.0 0.0 100.0
Limited English-language (excludes Puerto Rico)
1.5 0.8 0.9 0.8 1.4
Single parent 14.2 9.2 14.4 7.9 21.3
Low income 48.7 31.0 37.0 29.3 71.0
Public assistance recipient 27.5 16.3 19.5 15.4 38.3 TANF recipient 3.8 1.4 1.5 1.3 4.8 Other public assistance, including SNAP and SSI
26.9 15.9 19.1 15.0 36.6
Homeless 2.2 0.7 0.7 0.7 3.5
Offender 8.6 4.4 4.7 4.3 10.3
Highest grade completed (avg.) 12.8 12.9 12.9 12.9 13.0 8th or less 1.5 1.8 1.1 2.0 0.7 Some high school 9.5 8.7 6.7 9.2 7.4 High school graduate 37.7 34.6 37.6 33.8 36.8 High school equivalency 7.7 5.5 6.8 5.1 8.5 Some postsecondary 30.8 34.1 34.9 33.9 34.0 College graduate (4-year) 12.8 15.3 13.0 15.9 12.7

Adults
Social Policy Research Associates 35
Table II-8 Characteristics of Adult Exiters from April 2013 to March 2014
who Received Intensive or Training Services, by Highest Grade Completed (Derived from PY 2013Q4 WIASRD Records)
With Intensive or Training
Services
Less than
High School
High School
Graduate
Some Post-secondary
College
Graduate
Number of exiters 275,446 30,130 124,472 84,348 34,978 Statewide programs 5,897 535 3,000 1,577 785 Local programs 271,161 29,666 122,262 83,340 34,375
Characteristics of All Exiters
Age categories
18 to 21 9.0 15.6 11.9 5.9 0.4 22 to 29 25.6 27.0 26.8 25.7 19.7 30 to 44 34.0 32.1 32.8 36.1 34.7 45 to 54 19.5 16.6 18.6 20.0 24.2 55 and over 11.9 8.7 9.9 12.2 20.9
Gender
Female 51.0 48.3 47.6 56.0 53.0 Male 49.0 51.7 52.4 44.0 47.0
Individual with a disability 5.6 7.0 5.0 5.9 5.9
Race and ethnicity
Hispanic 14.3 23.4 15.2 11.6 9.8 Not Hispanic
American Indian or Alaskan Native
1.0 1.5 1.2 0.9 0.5
Asian 2.2 2.3 1.5 1.6 5.8 Black or African American
25.8 25.2 27.2 26.8 18.2
Hawaiian or other Pacific Islander
0.3 0.4 0.3 0.2 0.3
White 54.2 45.0 52.5 56.4 63.4 More than one race 2.2 2.3 2.0 2.4 2.0
Veteran Status Veteran 8.2 2.8 7.7 10.7 8.9 Disabled veteran 1.2 0.2 0.8 1.7 1.8 Campaign veteran 2.1 0.3 1.8 2.9 2.7 Recently separated veteran 1.0 0.2 1.1 1.2 0.8 Other eligible person 0.1 0.0 0.1 0.2 0.1

Adults
Social Policy Research Associates 36
With Intensive or Training
Services
Less than
High School
High School
Graduate
Some Post-secondary
College
Graduate
Number of exiters 275,446 30,130 124,472 84,348 34,978
Employed at participation
Employed 20.1 12.5 20.9 22.1 19.9 Not employed or received layoff notice
79.9 87.5 79.1 77.9 80.1
Average preprogram quarterly earnings
$5,949 $4,424 $5,171 $5,947 $9,572
None 30.6 37.1 32.3 27.0 27.3 $1 to $2,499 18.8 22.2 20.2 18.4 12.1 $2,500 to $4,999 19.0 19.9 19.7 20.2 13.3 $5,000 to $7,499 13.0 11.0 12.9 14.4 11.8 $7,500 to $9,999 7.8 5.1 7.3 8.7 9.9 $10,000 or more 10.8 4.7 7.7 11.3 25.5
UI Claimant (all exiters) 37.6 36.0 33.3 41.8 45.2 UI Claimant referred by WPRS 8.1 5.8 7.9 9.2 8.2 UI Exhaustee 2.5 1.9 2.5 2.8 2.5
Characteristics of Exiters who Received Intensive or Training Services
UI Claimant 37.6 36.0 33.3 41.8 45.2 UI Claimant referred by WPRS 8.1 5.8 7.9 9.2 8.2 UI Exhaustee 2.5 1.9 2.5 2.8 2.5
Limited English-language (excludes Puerto Rico)
1.5 3.7 1.4 0.7 1.5
Single parent 14.2 13.9 15.8 15.5 6.3
Low income 48.7 59.9 53.3 45.3 30.7
Public assistance recipient 27.5 38.7 30.0 25.5 12.8 TANF recipient 3.8 6.9 4.2 3.1 1.2 Other public assistance, including SNAP and SSI
26.9 37.6 29.3 24.9 12.6
Homeless 2.2 3.7 2.5 1.8 1.0
Offender 8.6 13.0 10.6 6.6 2.7
Highest grade completed (avg.) 12.8 9.9 12.0 13.6 16.2 8th or less 1.5 13.8 0.0 0.0 0.0 Some high school 9.5 86.2 0.0 0.0 0.0 High school graduate 37.7 0.0 83.0 0.0 0.0 High school equivalency 7.7 0.0 17.0 0.0 0.0 Some postsecondary 30.8 0.0 0.0 100.0 0.0 College graduate (4-year) 12.8 0.0 0.0 0.0 100.0

Adults
Social Policy Research Associates 37
Table II-9 Characteristics of Adult Exiters from April 2013 to March 2014
who Received Intensive or Training Services, by Low Income and Receipt of Public Assistance (Derived from PY 2013Q4 WIASRD Records)
With Intensive
or Training Services
Public Assistance
Low Income Any TANF Other
Number of exiters 275,446 132,405 75,754 10,490 74,002 Statewide programs 5,897 2,408 991 115 964 Local programs 271,161 130,832 75,145 10,428 73,409
Characteristics of All Exiters
Age categories
18 to 21 9.0 11.2 9.1 10.7 9.1 22 to 29 25.6 28.4 29.3 36.7 29.3 30 to 44 34.0 36.2 39.4 41.6 39.2 45 to 54 19.5 16.7 16.0 9.0 16.1 55 and over 11.9 7.5 6.2 2.1 6.2
Gender
Female 51.0 58.0 64.4 82.8 64.0 Male 49.0 42.0 35.6 17.2 36.0
Individual with a disability 5.6 6.5 7.0 5.6 7.1
Race and ethnicity
Hispanic 14.3 16.5 15.2 19.6 15.1 Not Hispanic
American Indian or Alaskan Native
1.0 1.4 1.7 2.8 1.7
Asian 2.2 2.1 1.6 1.5 1.6 Black or African American 25.8 31.8 33.9 31.3 33.7 Hawaiian or other Pacific Islander
0.3 0.4 0.4 0.7 0.4
White 54.2 45.5 44.6 40.7 44.8 More than one race 2.2 2.3 2.6 3.4 2.5
Veteran Status Veteran 8.2 6.5 5.6 4.4 5.7 Disabled veteran 1.2 0.8 0.5 0.2 0.5 Campaign veteran 2.1 1.7 1.2 0.6 1.2 Recently separated veteran 1.0 0.7 0.4 0.2 0.4 Other eligible person 0.1 0.1 0.1 0.1 0.1

Adults
Social Policy Research Associates 38
With Intensive or Training
Services
Public Assistance
Low Income Any TANF Other
Number of exiters 275,446 132,405 75,754 10,490 74,002
Employed at participation
Employed 20.1 18.2 16.6 12.5 16.5 Not employed or received layoff notice
79.9 81.8 83.4 87.5 83.5
Average preprogram quarterly earnings
$5,949 $3,924 $3,578 $3,033 $3,582
None 30.6 41.7 42.9 50.2 42.9 $1 to $2,499 18.8 24.1 25.0 26.3 24.9 $2,500 to $4,999 19.0 18.6 18.5 14.7 18.6 $5,000 to $7,499 13.0 8.8 8.3 5.4 8.3 $7,500 to $9,999 7.8 3.6 3.0 1.9 3.0 $10,000 or more 10.8 3.2 2.3 1.5 2.3
UI Claimant (all exiters) 37.6 23.9 22.3 13.4 22.3 UI Claimant referred by WPRS 8.1 6.3 5.8 3.1 5.8 UI Exhaustee 2.5 3.7 3.5 3.2 3.4
Characteristics of Exiters who Received Intensive or Training Services
UI Claimant 37.6 23.9 22.3 13.4 22.3 UI Claimant referred by WPRS 8.1 6.3 5.8 3.1 5.8 UI Exhaustee 2.5 3.7 3.5 3.2 3.4
Limited English-language (excludes Puerto Rico)
1.5 2.2 2.0 2.2 2.0
Single parent 14.2 23.7 30.2 47.2 29.8
Low income 48.7 100.0 100.0 100.0 100.0
Public assistance recipient 27.5 57.2 100.0 100.0 100.0 TANF recipient 3.8 7.9 13.8 100.0 11.8 Other public assistance, including SNAP and SSI
26.9 55.9 97.7 83.3 100.0
Homeless 2.2 4.5 4.6 3.1 4.6
Offender 8.6 12.8 14.8 14.4 15.0
Highest grade completed (avg.) 12.8 12.5 12.4 12.2 12.4 8th or less 1.5 1.6 1.8 2.4 1.7 Some high school 9.5 11.9 13.8 17.7 13.7 High school graduate 37.7 39.5 38.6 39.9 38.5 High school equivalency 7.7 10.3 11.3 10.9 11.3 Some postsecondary 30.8 28.7 28.6 25.3 28.7 College graduate (4-year) 12.8 8.0 6.0 3.9 6.0

Adults
Social Policy Research Associates 39
Table II-10 Characteristics of Adult Exiters from April 2013 to March 2014
who Received Intensive or Training Services, by Selected Characteristics (Derived from PY 2013Q4 WIASRD Records)
With Intensive or Training
Services
Limited English-
Language1 Single Parent
Pell Grant Recipient (among
trainees)1 Offender
Number of exiters 275,446 3,958 37,478 10,559 23,717 Statewide programs 5,897 55 487 191 437 Local programs 271,161 3,921 37,208 10,452 23,432
Characteristics of All Exiters
Age categories
18 to 21 9.0 7.8 7.3 11.9 5.6 22 to 29 25.6 21.9 33.2 35.8 24.7 30 to 44 34.0 37.9 45.1 39.4 43.6 45 to 54 19.5 21.3 12.0 10.9 20.2 55 and over 11.9 11.1 2.4 2.0 5.8
Gender
Female 51.0 54.2 83.1 74.2 30.1 Male 49.0 45.8 16.9 25.8 69.9
Individual with a disability 5.6 3.9 3.4 2.7 7.0
Race and ethnicity Hispanic 14.3 36.5 16.0 7.4 15.9 Not Hispanic
American Indian or Alaskan Native
1.0 0.8 1.6 0.9 1.4
Asian 2.2 18.1 1.2 1.2 0.5 Black or African American 25.8 23.3 39.0 27.6 39.1 Hawaiian or other Pacific Islander
0.3 0.5 0.2 0.2 0.2
White 54.2 19.7 39.7 61.1 40.2 More than one race 2.2 1.1 2.4 1.7 2.7
Veteran Status Veteran 8.2 2.0 3.6 4.4 8.0 Disabled veteran 1.2 0.2 0.5 0.6 0.6 Campaign veteran 2.1 0.5 1.1 1.4 1.8 Recently separated veteran 1.0 0.2 0.5 0.4 0.4 Other eligible person 0.1 0.0 0.1 0.2 0.1
1 Excludes Puerto Rico.

Adults
Social Policy Research Associates 40
With Intensive or Training
Services
Limited English-
Language1 Single Parent
Pell Grant Recipient (among
trainees)1 Offender
Number of exiters 275,446 3,958 37,478 10,559 23,717
Employed at participation
Employed 20.1 17.9 25.5 32.4 16.7 Not employed or received layoff notice
79.9 82.1 74.5 67.6 83.3
Average preprogram quarterly earnings
$5,949 $4,680 $4,241 $3,833 $3,811
None 30.6 47.8 35.4 39.8 50.2 $1 to $2,499 18.8 16.6 24.1 24.2 22.0 $2,500 to $4,999 19.0 17.0 20.3 19.3 14.8 $5,000 to $7,499 13.0 10.1 11.2 10.4 7.1 $7,500 to $9,999 7.8 4.0 4.8 3.7 3.3 $10,000 or more 10.8 4.5 4.2 2.6 2.7
UI Claimant (all exiters) 37.6 21.1 24.9 24.4 19.1 UI Claimant referred by WPRS 8.1 5.0 8.2 8.0 4.4 UI Exhaustee 2.5 2.4 3.7 3.6 3.0
Characteristics of Exiters who Received Intensive or Training Services
UI Claimant 37.6 21.1 24.9 24.4 19.1 UI Claimant referred by WPRS 8.1 5.0 8.2 8.0 4.4 UI Exhaustee 2.5 2.4 3.7 3.6 3.0
Limited English-language (excludes Puerto Rico)
1.5 100.0 1.6 0.6 0.9
Single parent 14.2 15.1 100.0 34.9 17.9
Low income 48.7 70.9 81.3 73.3 72.5
Public assistance recipient 27.5 37.1 59.5 45.4 47.4 TANF recipient 3.8 5.7 13.0 3.3 6.4 Other public assistance, including SNAP and SSI
26.9 36.4 57.5 45.0 46.7
Homeless 2.2 2.5 2.0 1.0 8.6
Offender 8.6 5.3 10.2 5.7 100.0
Highest grade completed (avg.) 12.8 11.9 12.6 12.9 12.2 8th or less 1.5 10.2 1.0 0.1 1.3 Some high school 9.5 16.7 9.7 1.6 15.3 High school graduate 37.7 39.6 40.0 37.5 39.7 High school equivalency 7.7 4.6 10.0 10.9 16.3 Some postsecondary 30.8 15.5 33.5 48.0 23.5 College graduate (4-year) 12.8 13.5 5.8 1.8 4.0

Adults
Social Policy Research Associates 41
Table II-11 Characteristics of Adult Exiters from April 2013 to March 2014, by Major Service Categories
(Derived from PY 2013Q4 WIASRD Records)
All Exiters
Core Services
Only
Core and Intensive
Services Only
Training
ITA
Established (among trainees)
Number of exiters 1,076,347 800,901 173,948 101,498 65,521 Statewide programs 6,090 193 1,305 4,592 1,566 Local programs 1,071,905 800,744 172,883 98,278 64,689
Characteristics of All Exiters
Age categories
18 to 21 8.5 8.4 7.8 11.0 10.3 22 to 29 23.8 23.2 23.5 29.2 30.9 30 to 44 33.0 32.7 33.2 35.4 36.1 45 to 54 19.9 20.1 21.1 16.9 16.1 55 and over 14.7 15.6 14.4 7.6 6.6
Gender
Female 48.6 47.8 48.8 54.8 58.6 Male 51.4 52.2 51.2 45.2 41.4
Individual with a disability 5.1 4.9 6.9 3.4 3.6
Race and ethnicity
Hispanic 11.3 10.3 14.2 14.5 14.4 Not Hispanic
American Indian or Alaskan Native
1.6 1.7 1.0 1.2 1.3
Asian 1.9 1.8 2.1 2.3 2.1 Black or African American 24.3 23.8 24.7 27.6 31.7 Hawaiian or other Pacific Islander
0.4 0.4 0.3 0.3 0.3
White 57.8 59.1 55.3 52.3 48.2 More than one race 2.6 2.8 2.4 1.8 2.0
Veteran Status Veteran 7.2 6.8 9.1 6.8 6.3 Disabled veteran 1.1 1.0 1.3 0.9 0.8 Campaign veteran 2.2 2.2 2.0 2.2 1.9 Recently separated veteran 1.1 1.1 1.1 0.8 0.5 Other eligible person 0.2 0.2 0.1 0.1 0.1

Adults
Social Policy Research Associates 42
All Exiters
Core Services
Only
Core and Intensive
Services Only
Training
ITA
Established (among trainees)
Number of exiters 1,076,347 800,901 173,948 101,498 65,521
Employed at participation
Employed 16.5 15.2 14.3 30.1 25.6 Not employed or received layoff notice
83.5 84.8 85.7 69.9 74.4
Average preprogram quarterly earnings
$6,234 $6,322 $6,118 $5,654 $4,855
None 24.8 22.8 28.0 34.6 36.2 $1 to $2,499 18.5 18.4 18.6 19.0 21.0 $2,500 to $4,999 20.7 21.3 19.8 17.8 19.5 $5,000 to $7,499 14.8 15.4 13.8 11.8 11.4 $7,500 to $9,999 8.8 9.1 8.1 7.3 5.8 $10,000 or more 12.4 12.9 11.7 9.4 6.1
UI Claimant (all exiters) 45.0 48.4 45.1 24.8 27.8 UI Claimant referred by WPRS 10.2 11.2 8.2 8.0 8.5 UI Exhaustee 1.7 1.3 2.0 3.4 3.5 Characteristics of Exiters who Received
Intensive or Training Services
UI Claimant 37.6 45.1 24.8 27.8 UI Claimant referred by WPRS 8.1 8.2 8.0 8.5 UI Exhaustee 2.5 2.0 3.4 3.5
Limited English-language (excludes Puerto Rico)
1.5 1.5 1.5 1.5
Single parent 14.2 10.9 19.7 22.1
Low income 48.7 42.6 59.1 65.0
Public assistance recipient 27.5 25.2 31.5 36.8 TANF recipient 3.8 3.9 3.7 3.6 Other public assistance, including SNAP and SSI
26.9 24.5 31.0 36.2
Homeless 2.2 2.6 1.6 1.5
Offender 8.6 9.4 7.3 8.1
Highest grade completed (avg.) 12.8 12.8 12.9 12.9 8th or less 1.5 2.0 0.8 0.6 Some high school 9.5 11.6 5.9 4.7 High school graduate 37.7 36.1 40.5 39.4 High school equivalency 7.7 7.0 8.9 9.4 Some postsecondary 30.8 29.5 32.9 35.7

Adults
Social Policy Research Associates 43
All Exiters
Core Services
Only
Core and Intensive
Services Only
Training
ITA
Established (among trainees)
College graduate (4-year) 12.8 13.8 11.0 10.2

Adults
Social Policy Research Associates 44
Table II-12 Number of Adult Exiters from April 2013 to March 2014 with Specific Characteristics,
by Major Service Categories (Derived from PY 2013Q4 WIASRD Records)
All Exiters
Core Services
Only
Core and Intensive
Services Only
Training
ITA Established
(among trainees)
Number of exiters 1,076,347 800,901 173,948 101,498 65,521 Statewide programs 6,090 193 1,305 4,592 1,566
Local programs 1,071,905 800,744 172,883 98,278 64,689
Characteristics of All Exiters
Age categories
18 to 21 91,966 67,183 13,607 11,176 6,755 22 to 29 256,449 185,987 40,834 29,628 20,236 30 to 44 355,367 261,709 57,778 35,880 23,634 45 to 54 214,468 160,705 36,616 17,147 10,557 55 and over 158,081 125,304 25,110 7,667 4,339
Gender
Female 517,079 380,676 82,651 53,752 37,237 Male 546,133 414,935 86,865 44,333 26,324
Individual with a disability 51,758 36,822 11,544 3,392 2,270
Race and ethnicity
Hispanic 116,537 79,248 23,429 13,860 8,965 Not Hispanic
American Indian or Alaskan Native
16,017 13,309 1,606 1,102 817
Asian 19,597 13,944 3,435 2,218 1,335 Black or African American
250,301 183,215 40,684 26,402 19,734
Hawaiian or other Pacific Islander
4,137 3,381 509 247 158
White 595,237 454,232 91,013 49,992 30,045 More than one race 27,219 21,574 3,938 1,707 1,259
Veteran Status Veteran 77,068 54,440 15,758 6,870 4,096 Disabled veteran 11,588 8,380 2,329 879 497 Campaign veteran 23,395 17,635 3,495 2,265 1,255 Recently separated veteran 11,785 9,053 1,950 782 349 Other eligible person 1,834 1,509 207 118 85

Adults
Social Policy Research Associates 45
All Exiters
Core Services
Only
Core and Intensive
Services Only
Training
ITA Established
(among trainees)
Number of exiters 1,076,347 800,901 173,948 101,498 65,521
Employed at participation
Employed 177,560 122,137 24,880 30,543 16,757 Not employed or received layoff notice
898,787 678,764 149,068 70,955 48,764
Average preprogram quarterly earnings
None 249,190 170,695 44,045 34,450 23,537 $1 to $2,499 185,572 137,337 29,297 18,938 13,681 $2,500 to $4,999 208,196 159,394 31,067 17,735 12,683 $5,000 to $7,499 148,838 115,393 21,665 11,780 7,420 $7,500 to $9,999 87,985 67,937 12,751 7,297 3,799 $10,000 or more 124,046 96,368 18,307 9,371 3,963
UI Claimant (all exiters) 388,200 284,721 78,434 25,045 18,240 UI Claimant referred by WPRS
88,410 66,004 14,294 8,112 5,583
UI Exhaustee 14,675 7,749 3,458 3,468 2,281 Characteristics of Exiters who Received
Intensive or Training Services
UI Claimant 103,493 78,434 25,045 18,240 UI Claimant referred by WPRS
22,407 14,294 8,112 5,583
UI Exhaustee 6,926 3,458 3,468 2,281
Limited English-language (excludes Puerto Rico)
3,958 2,525 1,433 962
Single parent 37,478 18,019 19,459 14,025
Low income 132,405 72,512 59,893 42,570
Public assistance recipient 75,754 43,756 31,998 24,109 TANF recipient 10,490 6,781 3,709 2,361 Other public assistance, including SNAP and SSI
74,002 42,585 31,417 23,736
Homeless 6,183 4,517 1,666 1,009
Offender 23,717 16,313 7,404 5,332

Adults
Social Policy Research Associates 46
All Exiters
Core Services
Only
Core and Intensive
Services Only
Training
ITA Established
(among trainees)
Number of exiters 1,076,347 800,901 173,948 101,498 65,521
Highest grade completed
8th or less 4,160 3,380 780 400 Some high school 25,970 19,972 5,998 3,103 High school graduate 103,360 62,258 41,102 25,783 High school equivalency 21,112 12,106 9,006 6,122 Some postsecondary 84,348 50,956 33,392 23,355 College graduate (4-year) 34,978 23,858 11,120 6,699
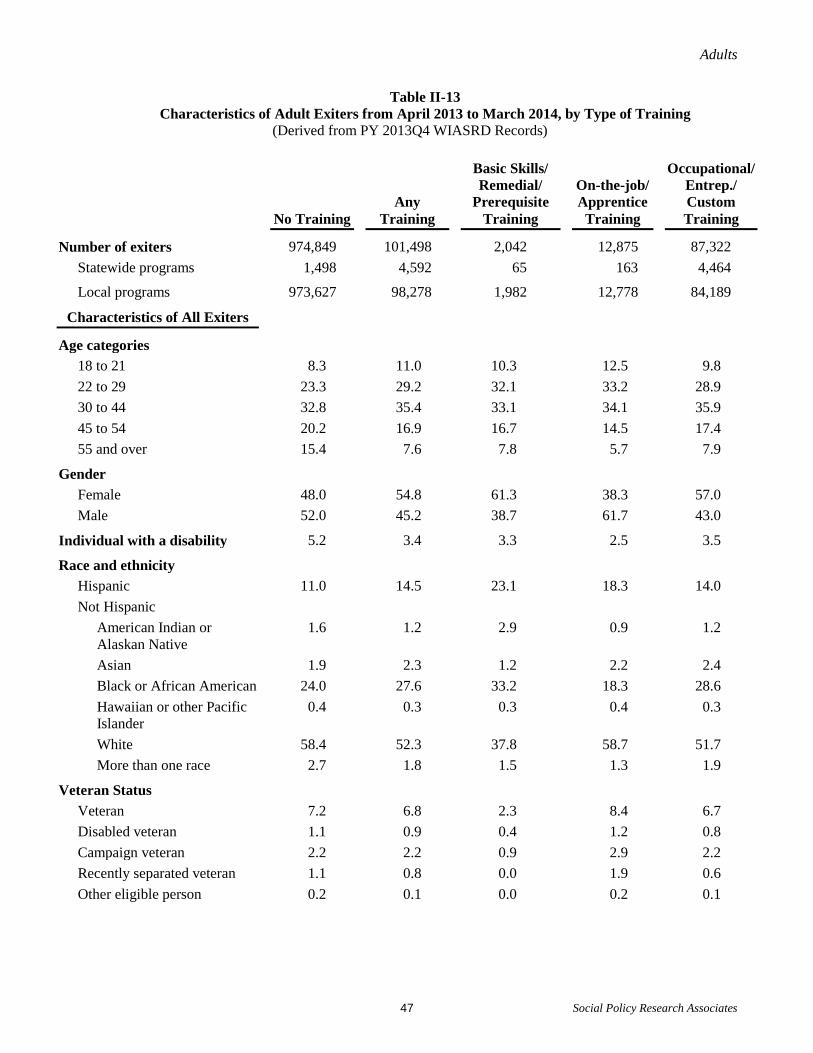
Adults
Social Policy Research Associates 47
Table II-13 Characteristics of Adult Exiters from April 2013 to March 2014, by Type of Training
(Derived from PY 2013Q4 WIASRD Records)
No Training Any
Training
Basic Skills/ Remedial/
Prerequisite Training
On-the-job/ Apprentice
Training
Occupational/ Entrep./ Custom Training
Number of exiters 974,849 101,498 2,042 12,875 87,322 Statewide programs 1,498 4,592 65 163 4,464
Local programs 973,627 98,278 1,982 12,778 84,189
Characteristics of All Exiters
Age categories 18 to 21 8.3 11.0 10.3 12.5 9.8 22 to 29 23.3 29.2 32.1 33.2 28.9 30 to 44 32.8 35.4 33.1 34.1 35.9 45 to 54 20.2 16.9 16.7 14.5 17.4 55 and over 15.4 7.6 7.8 5.7 7.9
Gender Female 48.0 54.8 61.3 38.3 57.0 Male 52.0 45.2 38.7 61.7 43.0
Individual with a disability 5.2 3.4 3.3 2.5 3.5
Race and ethnicity Hispanic 11.0 14.5 23.1 18.3 14.0 Not Hispanic
American Indian or Alaskan Native
1.6 1.2 2.9 0.9 1.2
Asian 1.9 2.3 1.2 2.2 2.4 Black or African American 24.0 27.6 33.2 18.3 28.6 Hawaiian or other Pacific Islander
0.4 0.3 0.3 0.4 0.3
White 58.4 52.3 37.8 58.7 51.7 More than one race 2.7 1.8 1.5 1.3 1.9
Veteran Status Veteran 7.2 6.8 2.3 8.4 6.7 Disabled veteran 1.1 0.9 0.4 1.2 0.8 Campaign veteran 2.2 2.2 0.9 2.9 2.2 Recently separated veteran 1.1 0.8 0.0 1.9 0.6 Other eligible person 0.2 0.1 0.0 0.2 0.1

Adults
Social Policy Research Associates 48
No Training Any
Training
Basic Skills/ Remedial/
Prerequisite Training
On-the-job/ Apprentice
Training
Occupational/ Entrep./ Custom Training
Number of exiters 974,849 101,498 2,042 12,875 87,322
Employed at participation Employed 15.1 30.1 12.4 23.1 31.4 Not employed or received layoff notice
84.9 69.9 87.6 76.9 68.6
Average preprogram quarterly earnings
$6,289 $5,654 $4,992 $5,167 $5,757
None 23.7 34.6 44.2 35.9 34.1 $1 to $2,499 18.4 19.0 18.9 18.4 19.0 $2,500 to $4,999 21.1 17.8 14.2 19.4 17.7 $5,000 to $7,499 15.2 11.8 11.0 12.6 11.8 $7,500 to $9,999 8.9 7.3 5.8 7.1 7.5 $10,000 or more 12.7 9.4 6.0 6.7 9.9
UI Claimant (all exiters) 47.7 24.8 34.9 18.2 25.8 UI Claimant referred by WPRS 10.5 8.0 13.4 7.2 8.1 UI Exhaustee 1.5 3.4 1.7 2.9 3.6 Characteristics of Exiters who Received Intensive or Training
Services
Intensive Services, No
Training
UI Claimant 45.0 24.8 34.9 18.2 25.8 UI Claimant referred by WPRS 8.2 8.0 13.4 7.2 8.1 UI Exhaustee 2.0 3.4 1.7 2.9 3.6
Limited English-language (excludes Puerto Rico)
1.5 1.5 3.6 1.4 1.4
Single parent 10.9 19.7 23.4 14.2 20.5
Low income 42.6 59.1 75.7 52.9 59.4
Public assistance recipient 25.2 31.5 43.5 23.3 32.4 TANF recipient 3.9 3.7 5.3 5.5 3.7 Other public assistance, including SNAP and SSI
24.5 31.0 42.3 23.0 31.9
Homeless 2.6 1.6 3.3 1.7 1.6
Offender 9.4 7.3 14.9 7.5 7.2
Highest grade completed (avg.) 12.8 12.9 11.0 12.9 12.9 8th or less 2.0 0.8 9.4 0.9 0.6 Some high school 11.6 5.9 54.5 5.6 4.6 High school graduate 36.1 40.5 14.6 44.3 40.5 High school equivalency 7.0 8.9 4.4 9.2 9.0 Some postsecondary 29.5 32.9 12.5 27.6 34.3

Adults
Social Policy Research Associates 49
No Training Any
Training
Basic Skills/ Remedial/
Prerequisite Training
On-the-job/ Apprentice
Training
Occupational/ Entrep./ Custom Training
College graduate (4-year) 13.8 11.0 4.7 12.5 11.0

Adults
Social Policy Research Associates 50
Table II-14 Services Received by Adult Exiters, Trends Over Time
(Derived from PY 2013Q4 WIASRD Records)
WIA PY 2009
WIA PY 2010
WIA PY 2011
WIA PY 2012
WIA 4/1/13-3/31/14
Number of exiters 1,187,450 1,252,411 1,218,275 1,200,782 1,076,347
Coenrollment
WIA dislocated worker 14.1 26.8 29.1 26.4 26.9 WIA youth 0.5 0.6 0.4 0.4 0.4 Partner program 87.4 89.7 91.5 90.7 87.8
Wagner-Peyser 86.6 89.1 90.9 90.1 87.2 TAA 0.8 0.8 0.5 0.3 0.3 National Farmworker Jobs 0.0 0.0 0.0 0.0 0.0 Veterans programs 2.5 2.1 1.9 2.9 2.2 Vocational Education 0.1 0.1 0.1 0.0 0.0 Adult Education 0.1 0.1 0.1 0.1 0.1 Title V Older Worker 0.0 0.0 0.0 0.0 0.0 Other partner programs 2.2 2.2 2.0 2.0 2.0
Services Received Core self-service and informational activities
63.1 71.0 68.9 63.2 61.2
Staff-assisted core services 100.0 100.0 100.0 100.0 100.0 Intensive Services 42.3 39.6 30.5 24.6 25.6
Prevocational activities 5.6 5.0 4.2 3.6 3.8 Training services 13.2 13.3 10.1 9.6 9.4 Type of Training (among trainees)
On-the-job training 7.4 8.9 11.2 13.1 12.4 Skill upgrading 14.5 13.1 13.0 11.4 9.9 Entrepreneurial training 0.1 0.3 0.3 0.2 0.2 ABE or ESL in combination with training (non-TAA)
2.9 4.3 3.3 1.8 1.6
Customized training 7.5 6.8 5.9 5.8 6.7 Apprenticeship training 0.2 0.3 Other occupational skills training
70.7 71.0 70.4 69.4 70.6
Remedial training (ABE/ESL TAA only)
0.5 0.5
Prerequisite training 0.0 0.0 Completed any training (among trainees)
70.5 70.0

Adults
Social Policy Research Associates 51
WIA PY 2009
WIA PY 2010
WIA PY 2011
WIA PY 2012
WIA 4/1/13-3/31/14
Number of exiters 1,187,450 1,252,411 1,218,275 1,200,782 1,076,347
ITA established (among trainees) 64.0 62.1 63.1 63.2 64.6
Pell Grant recipient (among trainees, excludes Puerto Rico)
7.9 8.7 10.3 10.3 10.4
Needs-related payments 0.3 0.6 0.5 0.1 0.1 Other supportive services 7.7 7.5 5.2 5.9 5.9
Service category
Core services, including staff assisted, only
57.7 60.4 69.5 75.4 74.4
Intensive & core services only 29.1 26.2 20.5 15.0 16.2 Training services 13.2 13.3 10.1 9.6 9.4
Weeks participated (average) 19.3 22.2 24.1 23.7 20.8 4 or fewer weeks 36.9 38.0 38.6 38.2 41.7 5 to 13 weeks 21.1 19.8 18.7 18.1 18.9 14 to 26 weeks 17.6 15.4 14.4 15.3 15.2 27 to 39 weeks 9.3 7.7 7.2 8.6 8.1 40 to 52 weeks 5.7 4.9 5.0 5.7 4.9 53 to 104 weeks 7.4 11.1 11.5 9.8 7.6 More than 104 weeks 2.0 3.1 4.5 4.3 3.6
Weeks of training (average among trainees)
26.8 31.6 37.7 34.2 33.1
4 or fewer weeks 18.6 15.1 13.8 15.4 16.3 5 to 13 weeks 28.7 24.6 24.2 27.3 26.5 14 to 26 weeks 20.0 19.3 17.9 19.4 19.0 27 to 39 weeks 10.6 11.0 9.6 9.7 10.3 40 to 52 weeks 7.3 9.6 8.4 7.3 8.1 53 to 104 weeks 11.0 16.4 18.4 13.7 13.6 More than 104 weeks 3.7 4.0 7.8 7.3 6.2
Occupation of training (among trainees)
Managerial, prof., technical 37.1 39.3 38.5 36.8 37.4 Healthcare practitioners and technical occupations
18.6 19.2 19.2 18.5 19.8
Service occupations 22.8 22.9 22.6 22.4 22.2 Healthcare support occupations
17.6 17.5 17.4 16.8 16.3
Sales and clerical 11.0 10.6 11.6 10.5 10.4 Farming, fishing, forestry, construction, and extraction
3.9 4.7 3.7 3.8 3.3
Installation, repair, production, transportation, material moving
25.2 22.4 23.5 26.5 26.7

Adults
Social Policy Research Associates 52
WIA PY 2009
WIA PY 2010
WIA PY 2011
WIA PY 2012
WIA 4/1/13-3/31/14
Number of exiters 1,187,450 1,252,411 1,218,275 1,200,782 1,076,347
Reason for exit Institutionalized 0.1 0.1 0.1 0.1 0.1 Health/medical 0.2 0.2 0.2 0.2 0.2 Deceased 0.0 0.0 0.0 0.0 0.0 Family care 0.1 0.1 0.1 0.1 0.1 Reserve called to active duty 0.0 0.0 0.0 0.0 0.0 Retirement 0.0 0.0 0.0 0.0 0.0

Adults
Social Policy Research Associates 53
Table II-15 Number of Adults Exiters, by Services Received, Trends Over Time
(Derived from PY 2013Q4 WIASRD Records)
WIA PY 2009
WIA PY 2010
WIA PY 2011
WIA PY 2012
WIA 4/1/13-3/31/14
Number of exiters 1,187,450 1,252,411 1,218,275 1,200,782 1,076,347
Coenrollment WIA dislocated worker 167,201 336,093 354,836 316,620 289,028 WIA youth 5,540 7,042 5,089 4,415 4,115 Partner program 1,037,258 1,123,381 1,115,172 1,088,952 945,478
Wagner-Peyser 1,028,068 1,115,444 1,107,810 1,082,273 938,396
TAA 9,982 9,551 6,213 4,005 3,299 National Farmworker Jobs 269 100 49 53 58 Veterans programs 29,360 25,747 23,579 34,305 23,977 Vocational Education 733 1,079 959 483 286 Adult Education 1,574 1,677 1,283 657 542 Title V Older Worker 260 221 97 57 60 Other partner programs 26,454 27,192 24,238 23,882 21,893
Services Received Core self-service and informational activities
748,741 889,045 839,312 759,074 658,669
Staff-assisted core services 1,187,450 1,252,411 1,218,275 1,200,782 1,076,347 Intensive Services 502,247 495,637 372,131 295,734 275,446
Prevocational activities 66,392 62,482 50,903 43,660 41,113 Training services 156,824 167,071 122,958 115,477 101,498 Type of Training (among trainees)
On-the-job training 11,635 14,889 13,773 15,105 12,616 Skill upgrading 22,665 21,968 15,961 13,134 10,043 Entrepreneurial training 202 546 357 184 153 ABE or ESL in combination with training (non-TAA)
4,624 7,115 4,092 2,106 1,598
Customized training 11,702 11,278 7,304 6,713 6,807 Apprenticeship training 258 259 Other occupational skills training
110,938 118,602 86,585 80,109 71,615
Remedial training (ABE/ESL TAA only)
532 503
Prerequisite training 41 43 Completed any training (among trainees)
81,374 71,025
ITA established (among trainees) 100,322 103,751 77,576 72,925 65,521

Adults
Social Policy Research Associates 54
WIA PY 2009
WIA PY 2010
WIA PY 2011
WIA PY 2012
WIA 4/1/13-3/31/14
Number of exiters 1,187,450 1,252,411 1,218,275 1,200,782 1,076,347
Pell Grant recipient (among trainees, excludes Puerto Rico)
12,322 14,476 12,654 11,949 10,559
Needs-related payments 3,122 7,511 6,004 1,096 681 Other supportive services 91,061 93,484 63,774 70,614 63,415
Service category Core services, including staff assisted, only
685,203 756,774 846,144 905,048 800,901
Intensive & core services only 345,423 328,566 249,173 180,257 173,948 Training services 156,824 167,071 122,958 115,477 101,498
Weeks participated 4 or fewer weeks 438,130 475,713 469,902 459,094 449,059 5 to 13weeks 250,935 248,133 228,338 217,407 203,124 14 to 26 weeks 209,018 192,792 176,015 183,125 163,251 27 to 39 weeks 110,494 96,095 87,819 103,436 87,604 40 to 52 weeks 67,203 61,534 61,499 68,347 52,652 53 to 104 weeks 87,441 139,421 139,552 118,096 81,713 More than 104 weeks 24,229 38,723 55,150 51,277 38,944
Weeks of training 4 or fewer weeks 28,677 24,764 16,535 17,419 16,250 5 to 13 weeks 44,154 40,374 29,091 30,872 26,470 14 to 26 weeks 30,721 31,651 21,500 21,910 18,982 27 to 39 weeks 16,265 18,045 11,485 10,939 10,231 40 to 52 weeks 11,270 15,679 10,048 8,216 8,049 53 to 104 weeks 16,993 26,977 22,078 15,566 13,607 More than 104 weeks 5,744 6,545 9,381 8,287 6,224
Occupation of training Managerial, prof., technical 41,522 49,331 39,163 37,599 34,491
Healthcare practitioners and technical occupations
20,775 24,014 19,471 18,962 18,235
Service occupations 25,503 28,658 22,989 22,958 20,466 Healthcare support occupations
19,701 21,920 17,682 17,147 15,066
Sales and clerical 12,268 13,337 11,800 10,760 9,586 Farming, fishing, forestry, construction, and extraction
4,410 5,907 3,800 3,836 3,010
Installation, repair, production, transportation, material moving
28,130 28,146 23,897 27,114 24,618

Adults
Social Policy Research Associates 55
WIA PY 2009
WIA PY 2010
WIA PY 2011
WIA PY 2012
WIA 4/1/13-3/31/14
Number of exiters 1,187,450 1,252,411 1,218,275 1,200,782 1,076,347
Reason for exit Institutionalized 1,380 1,480 1,384 919 728 Health/medical 2,848 3,058 2,435 2,409 2,210 Deceased 354 501 515 386 281 Family care 840 941 745 631 577 Reserve called to active duty 63 76 75 54 47 Retirement 93 141 134 132 111

Adults
Social Policy Research Associates 56
Table II-16 Services Received by Adult Exiters from April 2013 to March 2014, by Age
(Derived from PY 2013Q4 WIASRD Records)
Age at Participation
18 to 21 22 to 29 30 – 44 45 – 54 55 and Over
Number of exiters 91,966 256,449 355,367 214,468 158,081
Coenrollment
WIA dislocated worker 11.1 20.4 27.4 32.3 37.9 WIA youth 4.5 0.0 0.0 0.0 0.0 Partner program 89.3 87.2 87.3 88.3 88.7
Wagner-Peyser 89.0 86.6 86.6 87.6 87.7 TAA 0.0 0.1 0.3 0.5 0.5 National Farmworker Jobs 0.0 0.0 0.0 0.0 0.0 Veterans programs 0.3 1.5 1.9 2.8 4.5 Vocational Education 0.0 0.0 0.0 0.0 0.0 Adult Education 0.1 0.1 0.1 0.0 0.0 Title V Older Worker 0.0 0.0 0.0 0.0 0.0 Other partner programs 2.3 2.3 2.6 1.8 0.7
Services Received
Core self-service and informational activities
53.1 56.9 63.0 63.9 65.2
Staff-assisted core services 100.0 100.0 100.0 100.0 100.0 Intensive Services 26.9 27.5 26.4 25.1 20.7
Prevocational activities 3.2 3.3 3.7 4.5 4.3 Training services 12.2 11.6 10.1 8.0 4.9 Type of Training (among trainees)
On-the-job training 14.0 14.1 12.0 10.8 9.5 Skill upgrading 6.9 8.2 10.0 12.4 14.5 Entrepreneurial training 0.0 0.1 0.1 0.3 0.5 ABE or ESL in combination with training (non-TAA)
1.7 1.9 1.5 1.3 1.3
Customized training 2.7 4.7 7.0 9.1 13.6 Apprenticeship training 0.4 0.4 0.2 0.1 0.0 Other occupational skills training
69.2 73.3 71.4 68.2 63.1
Remedial training (ABE/ESL TAA only)
0.3 0.4 0.4 0.8 0.8
Prerequisite training 0.0 0.1 0.0 0.0 0.1 Completed any training (among trainees)
69.4 69.1 70.8 70.0 70.1

Adults
Social Policy Research Associates 57
Age at Participation
18 to 21 22 to 29 30 – 44 45 – 54 55 and Over
Number of exiters 91,966 256,449 355,367 214,468 158,081
ITA established (among trainees) 60.4 68.3 65.9 61.6 56.6
Pell Grant recipient (among trainees, excludes Puerto Rico)
11.2 12.7 11.6 6.7 2.8
Needs-related payments 0.2 0.1 0.1 0.0 0.0 Other supportive services 7.9 6.8 6.4 5.2 3.0
Service category
Core services, including staff assisted, only
73.1 72.5 73.6 74.9 79.3
Intensive & core services only 14.8 15.9 16.3 17.1 15.9 Training services 12.2 11.6 10.1 8.0 4.9
Weeks participated (average) 18.8 19.6 21.7 22.4 20.1 4 or fewer weeks 50.5 44.2 40.4 38.2 40.3 5 to 13 weeks 17.1 18.8 19.2 19.4 18.8 14 to 26 weeks 12.4 14.5 15.5 16.1 15.9 27 to 39 weeks 5.9 7.5 8.3 8.9 9.0 40 to 52 weeks 3.8 4.4 4.9 5.4 5.5 53 to 104 weeks 6.7 7.2 7.7 8.1 7.8 More than 104 weeks 3.8 3.4 4.0 3.9 2.8
Weeks of training (average) 35.8 32.8 35.0 31.5 25.7 4 or fewer weeks 13.5 14.5 15.7 19.3 23.0 5 to 13 weeks 26.8 26.4 25.8 27.6 27.9 14 to 26 weeks 19.1 19.7 18.6 18.5 19.4 27 to 39 weeks 10.7 10.5 10.3 9.7 9.8 40 to 52 weeks 9.0 9.1 8.1 6.5 6.0 53 to 104 weeks 14.1 14.5 14.5 11.8 9.7 More than 104 weeks 6.8 5.4 7.0 6.6 4.3
Occupation of training
Managerial, prof., technical 31.0 39.6 39.4 34.6 35.2 Healthcare practitioners and technical occupations
19.0 25.6 21.0 12.1 9.1
Service occupations 34.8 26.7 19.1 16.3 13.8 Healthcare support occupations
23.7 19.9 14.5 12.1 9.6
Sales and clerical 8.4 8.1 9.6 14.1 17.8 Farming, fishing, forestry, construction, and extraction
4.6 3.1 3.2 3.1 2.9
Installation, repair, production, transportation, material moving
21.2 22.4 28.7 31.9 30.4

Adults
Social Policy Research Associates 58
Age at Participation
18 to 21 22 to 29 30 – 44 45 – 54 55 and Over
Number of exiters 91,966 256,449 355,367 214,468 158,081
Reason for exit
Institutionalized 0.1 0.1 0.1 0.0 0.0 Health/medical 0.2 0.1 0.2 0.3 0.3 Deceased 0.0 0.0 0.0 0.0 0.0 Family care 0.1 0.1 0.1 0.1 0.0 Reserve called to active duty 0.0 0.0 0.0 0.0 0.0 Retirement 0.0 0.0 0.0 0.0 0.1

Adults
Social Policy Research Associates 59
Table II-17 Services Received by Adult Exiters from April 2013 to March 2014, by Ethnicity and Race
(Derived from PY 2013Q4 WIASRD Records)
Hispanic Not Hispanic
All Black White Other
Number of exiters 116,537 912,508 250,301 595,237 66,970
Coenrollment
WIA dislocated worker 15.1 28.5 17.5 33.7 24.1 WIA youth 0.6 0.4 0.4 0.3 0.4 Partner program 85.9 88.4 88.3 88.8 84.5
Wagner-Peyser 85.4 87.7 87.6 88.2 83.8 TAA 0.2 0.3 0.1 0.4 0.3 National Farmworker Jobs 0.0 0.0 0.0 0.0 0.0 Veterans programs 1.6 2.3 1.4 2.7 1.9 Vocational Education 0.0 0.0 0.0 0.0 0.0 Adult Education 0.1 0.0 0.1 0.0 0.0 Title V Older Worker 0.0 0.0 0.0 0.0 0.0 Other partner programs 2.1 2.0 2.1 2.0 2.1
Services Received
Core self-service and informational activities
51.0 62.9 51.6 67.9 60.1
Staff-assisted core services 100.0 100.0 100.0 100.0 100.0 Intensive Services 32.0 24.4 26.8 23.7 22.0
Prevocational activities 3.4 3.8 4.0 3.9 3.1 Training services 11.9 8.9 10.5 8.4 7.9 Type of Training (among trainees)
On-the-job training 15.5 11.8 8.2 13.9 10.2 Skill upgrading 6.5 10.8 10.2 11.2 8.8 Entrepreneurial training 0.1 0.1 0.1 0.1 0.5 ABE or ESL in combination with training (non-TAA)
3.1 1.4 2.0 1.1 1.1
Customized training 7.3 6.1 2.7 7.7 8.1 Apprenticeship training 0.4 0.2 0.1 0.3 0.6 Other occupational skills training
70.1 70.7 77.6 66.8 73.2
Remedial training (ABE/ESL TAA only)
0.2 0.5 0.6 0.4 1.1
Prerequisite training 0.0 0.0 0.0 0.1 0.0 Completed any training (among trainees)
75.4 68.7 67.6 68.8 73.3

Adults
Social Policy Research Associates 60
Hispanic Not Hispanic
All Black White Other
Number of exiters 116,537 912,508 250,301 595,237 66,970
ITA established (among trainees) 64.7 65.3 74.7 60.1 67.7
Pell Grant recipient (among trainees, excludes Puerto Rico)
5.5 11.7 10.8 12.6 7.8
Needs-related payments 0.1 0.1 0.1 0.1 0.1 Other supportive services 9.0 5.5 8.9 4.0 5.2
Service category
Core services, including staff assisted, only
68.0 75.6 73.2 76.3 78.0
Intensive & core services only 20.1 15.5 16.3 15.3 14.2 Training services 11.9 8.9 10.5 8.4 7.9
Weeks participated (average) 20.0 21.0 20.0 21.8 18.1 4 or fewer weeks 46.0 40.9 42.0 39.7 47.8 5 to 13 weeks 17.5 19.1 18.6 19.4 18.3 14 to 26 weeks 14.0 15.4 16.2 15.4 12.9 27 to 39 weeks 7.0 8.4 8.5 8.5 6.8 40 to 52 weeks 4.5 5.0 4.7 5.2 4.1 53 to 104 weeks 7.6 7.6 6.8 8.0 6.9 More than 104 weeks 3.5 3.6 3.2 3.9 3.1
Weeks of training (average) 32.1 33.8 32.4 35.0 29.9 4 or fewer weeks 15.5 16.2 15.5 16.4 17.4 5 to 13 weeks 27.8 26.0 28.5 24.8 25.5 14 to 26 weeks 18.9 19.0 19.0 18.7 21.2 27 to 39 weeks 11.0 10.2 10.4 10.0 11.0 40 to 52 weeks 8.5 8.1 7.6 8.3 8.1 53 to 104 weeks 13.1 13.9 12.5 14.8 11.8 More than 104 weeks 5.3 6.6 6.3 6.9 5.0
Occupation of training
Managerial, prof., technical 32.3 38.4 34.4 40.5 38.9 Healthcare practitioners and technical occupations
15.9 20.7 19.5 21.4 19.3
Service occupations 26.3 21.5 27.9 17.8 24.2 Healthcare support occupations
14.7 16.7 21.1 14.1 18.4
Sales and clerical 12.8 9.9 8.8 10.2 11.3 Farming, fishing, forestry, construction, and extraction
3.3 3.2 2.6 3.4 3.7
Installation, repair, production, transportation, material moving
25.4 27.1 26.2 28.1 21.9

Adults
Social Policy Research Associates 61
Hispanic Not Hispanic
All Black White Other
Number of exiters 116,537 912,508 250,301 595,237 66,970
Reason for exit
Institutionalized 0.1 0.1 0.1 0.1 0.1 Health/medical 0.3 0.2 0.2 0.2 0.2 Deceased 0.0 0.0 0.0 0.0 0.0 Family care 0.1 0.0 0.0 0.0 0.1 Reserve called to active duty 0.0 0.0 0.0 0.0 0.0 Retirement 0.0 0.0 0.0 0.0 0.0

Adults
Social Policy Research Associates 62
Table II-18 Services Received by Adult Exiters from April 2013 to March 2014, by
Employment at Participation, Gender, and Disability Status (Derived from PY 2013Q4 WIASRD Records)
Employed at Participation Gender
Yes
No
Male
Female
With a Disability
Number of exiters 177,560 898,787 546,133 517,079 51,758
Coenrollment
WIA dislocated worker 17.6 28.7 27.5 26.7 19.6 WIA youth 0.3 0.4 0.3 0.5 0.6 Partner program 83.2 88.8 88.7 87.4 90.7
Wagner-Peyser 82.4 88.1 87.8 87.0 89.1 TAA 0.2 0.3 0.3 0.3 0.1 National Farmworker Jobs 0.0 0.0 0.0 0.0 0.0 Veterans programs 1.9 2.3 3.8 0.5 6.5 Vocational Education 0.0 0.0 0.0 0.0 0.1 Adult Education 0.0 0.1 0.0 0.1 0.1 Title V Older Worker 0.0 0.0 0.0 0.0 0.0 Other partner programs 1.8 2.1 2.1 2.0 2.9
Services Received
Core self-service and informational activities
61.4 61.2 60.5 62.0 55.3
Staff-assisted core services 100.0 100.0 100.0 100.0 100.0 Intensive Services 31.2 24.5 24.0 26.4 28.9
Prevocational activities 3.2 3.9 3.4 4.2 4.5 Training services 17.2 7.9 8.1 10.4 6.6 Type of Training (among trainees)
On-the-job training 9.0 13.9 16.5 8.7 9.3 Skill upgrading 13.0 8.5 10.6 9.7 10.8 Entrepreneurial training 0.1 0.2 0.2 0.1 0.2 ABE or ESL in combination with training (non-TAA)
0.7 2.0 1.4 1.8 1.5
Customized training 18.6 1.6 7.3 6.2 4.2 Apprenticeship training 0.7 0.1 0.6 0.0 0.1 Other occupational skills training
58.9 75.6 65.3 74.4 75.2
Remedial training (ABE/ESL TAA only)
0.2 0.6 0.5 0.6 0.4
Prerequisite training 0.0 0.1 0.0 0.1 0.1 Completed any training (among trainees)
76.3 67.2 70.5 68.8 63.1

Adults
Social Policy Research Associates 63
Employed at Participation Gender
Yes
No
Male
Female
With a Disability
Number of exiters 177,560 898,787 546,133 517,079 51,758
ITA established (among trainees) 54.9 68.7 59.4 69.3 66.9
Pell Grant recipient (among trainees, excludes Puerto Rico)
11.2 10.1 6.1 14.4 8.2
Needs-related payments 0.1 0.1 0.1 0.1 0.0 Other supportive services 9.2 5.2 4.9 6.6 5.6
Service category
Core services, including staff assisted, only
68.8 75.5 76.0 73.6 71.1
Intensive & core services only 14.0 16.6 15.9 16.0 22.3 Training services 17.2 7.9 8.1 10.4 6.6
Weeks participated (average) 21.7 20.7 19.4 22.0 21.9 4 or fewer weeks 47.7 40.5 42.7 40.9 42.3 5 to 13 weeks 16.5 19.3 19.6 18.2 18.0 14 to 26 weeks 12.4 15.7 15.3 15.0 14.5 27 to 39 weeks 6.4 8.5 7.9 8.4 7.9 40 to 52 weeks 4.1 5.0 4.6 5.2 5.1 53 to 104 weeks 8.2 7.5 6.7 8.3 8.1 More than 104 weeks 4.8 3.4 3.2 3.9 4.1
Weeks of training (average) 31.2 34.0 27.2 38.6 33.2 4 or fewer weeks 22.7 13.5 20.8 12.5 17.6 5 to 13 weeks 23.4 27.9 30.8 22.7 25.3 14 to 26 weeks 17.4 19.7 18.4 19.4 19.0 27 to 39 weeks 9.6 10.6 8.7 11.5 10.1 40 to 52 weeks 8.2 8.0 6.1 9.7 7.8 53 to 104 weeks 13.3 13.8 10.2 16.7 14.3 More than 104 weeks 5.5 6.5 4.9 7.6 6.0
Occupation of training
Managerial, prof., technical 46.4 33.4 27.1 46.2 37.7 Healthcare practitioners and technical occup.
27.8 16.2 7.0 30.4 16.9
Service occupations 18.8 23.7 9.4 32.4 19.9 Healthcare support occup. 15.5 16.7 3.2 27.0 12.8
Sales and clerical 7.8 11.6 5.6 13.9 15.4 Farming, fishing, forestry, construction, and extraction
3.5 3.2 6.7 0.4 3.3
Installation, repair, production, transportation, material moving
23.4 28.2 51.2 7.0 23.7

Adults
Social Policy Research Associates 64
Employed at Participation Gender
Yes
No
Male
Female
With a Disability
Number of exiters 177,560 898,787 546,133 517,079 51,758
Reason for exit
Institutionalized 0.0 0.1 0.1 0.0 0.1 Health/medical 0.1 0.2 0.1 0.2 0.7 Deceased 0.0 0.0 0.0 0.0 0.1 Family care 0.0 0.1 0.0 0.1 0.1 Reserve called to active duty 0.0 0.0 0.0 0.0 0.0 Retirement 0.0 0.0 0.0 0.0 0.0

Adults
Social Policy Research Associates 65
Table II-19 Services Received by Adult Exiters from April 2013 to March 2014, by Veteran Status
(Derived from PY 2013Q4 WIASRD Records)
All Exiters Veteran Campaign Veteran
Recently Separated Veteran
Disabled Veteran
Number of exiters 1,076,347 77,068 23,395 11,785 11,588
Coenrollment
WIA dislocated worker 26.9 31.3 36.2 31.9 29.7 WIA youth 0.4 0.1 0.0 0.1 0.0 Partner program 87.8 91.0 88.2 92.2 91.2
Wagner-Peyser 87.2 85.2 81.8 85.3 82.1 TAA 0.3 0.4 0.3 0.1 0.2 National Farmworker Jobs 0.0 0.0 0.0 0.0 0.0 Veterans programs 2.2 30.7 34.3 32.2 38.7 Vocational Education 0.0 0.1 0.1 0.0 0.1 Adult Education 0.1 0.0 0.0 0.0 0.0 Title V Older Worker 0.0 0.0 0.0 0.0 0.0 Other partner programs 2.0 1.8 1.3 1.0 1.0
Services Received
Core self-service and informational activities
61.2 65.5 77.3 71.8 65.5
Staff-assisted core services 100.0 100.0 100.0 100.0 100.0 Intensive Services 25.6 29.4 24.6 23.2 27.7
Prevocational activities 3.8 3.9 3.5 2.3 3.8 Training services 9.4 8.9 9.7 6.6 7.6 Type of Training (among trainees)
On-the-job training 12.4 15.4 15.9 31.2 17.0 Skill upgrading 9.9 8.1 8.5 5.9 9.8 Entrepreneurial training 0.2 0.1 0.2 0.3 0.1 ABE or ESL in combination with training (non-TAA)
1.6 0.3 0.2 0.0 0.7
Customized training 6.7 4.8 6.4 6.3 4.7 Apprenticeship training 0.3 0.3 0.3 0.9 0.5 Other occupational skills training
70.6 74.6 74.2 59.2 73.2
Remedial training (ABE/ESL TAA only)
0.5 0.3 0.5 0.1 0.2
Prerequisite training 0.0 0.0 0.0 0.0 0.0 Completed any training (among trainees)
70.0 67.8 74.5 76.6 64.4
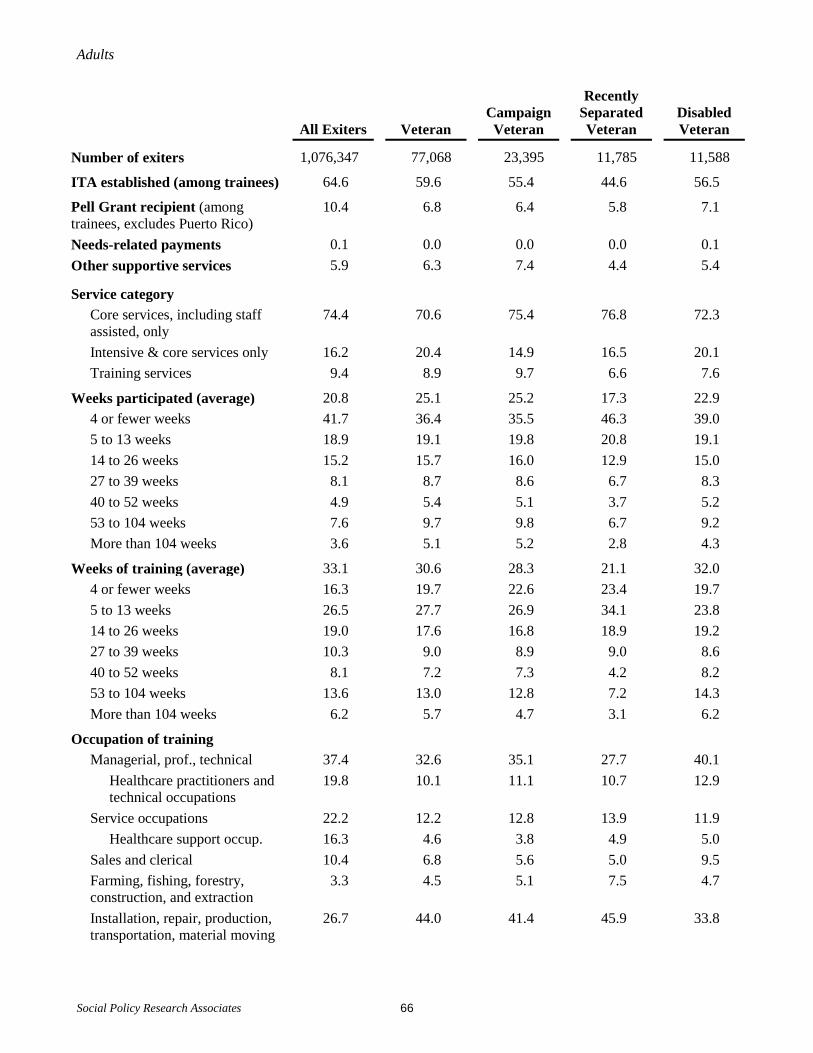
Adults
Social Policy Research Associates 66
All Exiters Veteran Campaign Veteran
Recently Separated Veteran
Disabled Veteran
Number of exiters 1,076,347 77,068 23,395 11,785 11,588
ITA established (among trainees) 64.6 59.6 55.4 44.6 56.5
Pell Grant recipient (among trainees, excludes Puerto Rico)
10.4 6.8 6.4 5.8 7.1
Needs-related payments 0.1 0.0 0.0 0.0 0.1 Other supportive services 5.9 6.3 7.4 4.4 5.4
Service category Core services, including staff assisted, only
74.4 70.6 75.4 76.8 72.3
Intensive & core services only 16.2 20.4 14.9 16.5 20.1 Training services 9.4 8.9 9.7 6.6 7.6
Weeks participated (average) 20.8 25.1 25.2 17.3 22.9 4 or fewer weeks 41.7 36.4 35.5 46.3 39.0 5 to 13 weeks 18.9 19.1 19.8 20.8 19.1 14 to 26 weeks 15.2 15.7 16.0 12.9 15.0 27 to 39 weeks 8.1 8.7 8.6 6.7 8.3 40 to 52 weeks 4.9 5.4 5.1 3.7 5.2 53 to 104 weeks 7.6 9.7 9.8 6.7 9.2 More than 104 weeks 3.6 5.1 5.2 2.8 4.3
Weeks of training (average) 33.1 30.6 28.3 21.1 32.0 4 or fewer weeks 16.3 19.7 22.6 23.4 19.7 5 to 13 weeks 26.5 27.7 26.9 34.1 23.8 14 to 26 weeks 19.0 17.6 16.8 18.9 19.2 27 to 39 weeks 10.3 9.0 8.9 9.0 8.6 40 to 52 weeks 8.1 7.2 7.3 4.2 8.2 53 to 104 weeks 13.6 13.0 12.8 7.2 14.3 More than 104 weeks 6.2 5.7 4.7 3.1 6.2
Occupation of training
Managerial, prof., technical 37.4 32.6 35.1 27.7 40.1 Healthcare practitioners and technical occupations
19.8 10.1 11.1 10.7 12.9
Service occupations 22.2 12.2 12.8 13.9 11.9 Healthcare support occup. 16.3 4.6 3.8 4.9 5.0
Sales and clerical 10.4 6.8 5.6 5.0 9.5 Farming, fishing, forestry, construction, and extraction
3.3 4.5 5.1 7.5 4.7
Installation, repair, production, transportation, material moving
26.7 44.0 41.4 45.9 33.8

Adults
Social Policy Research Associates 67
All Exiters Veteran Campaign Veteran
Recently Separated Veteran
Disabled Veteran
Number of exiters 1,076,347 77,068 23,395 11,785 11,588
Reason for exit
Institutionalized 0.1 0.0 0.0 0.0 0.0 Health/medical 0.2 0.3 0.2 0.1 0.3 Deceased 0.0 0.0 0.0 0.0 0.0 Family care 0.1 0.0 0.0 0.0 0.1 Reserve called to active duty 0.0 0.0 0.0 0.0 0.0 Retirement 0.0 0.0 0.0 0.0 0.1

Adults
Social Policy Research Associates 68
Table II-20 Services Received by Adult Exiters from April 2013 to March 2014, by UI Status
(Derived from PY 2013Q4 WIASRD Records)
All Exiters
UI Claimant
All
Referred by WPRS
Not Referred by WPRS
UI Exhaustee
Number of exiters 1,076,347 388,200 88,410 299,790 14,675
Coenrollment
WIA dislocated worker 26.9 56.5 28.9 64.6 44.5 WIA youth 0.4 0.0 0.1 0.0 0.6 Partner program 87.8 86.4 76.0 89.5 76.5
Wagner-Peyser 87.2 85.8 75.4 88.8 75.6 TAA 0.3 0.6 0.9 0.5 0.3 National Farmworker Jobs 0.0 0.0 0.0 0.0 0.0 Veterans programs 2.2 2.5 2.2 2.6 4.0 Vocational Education 0.0 0.0 0.0 0.0 0.1 Adult Education 0.1 0.0 0.0 0.0 0.3 Title V Older Worker 0.0 0.0 0.0 0.0 0.0 Other partner programs 2.0 0.9 0.8 1.0 3.5
Services Received
Core self-service and informational activities
61.2 74.7 80.2 73.1 81.9
Staff-assisted core services 100.0 100.0 100.0 100.0 100.0 Intensive Services 25.6 26.7 25.3 27.0 47.2
Prevocational activities 3.8 5.0 5.8 4.7 6.9 Training services 9.4 6.5 9.2 5.6 23.6
Type of Training (among trainees) On-the-job training 12.4 9.3 11.4 8.2 10.7 Skill upgrading 9.9 8.5 5.4 10.0 8.9 Entrepreneurial training 0.2 0.1 0.1 0.1 0.1 ABE or ESL in combination with training (non-TAA)
1.6 1.9 2.5 1.7 0.8
Customized training 6.7 1.3 1.0 1.5 2.5 Apprenticeship training 0.3 0.1 0.0 0.1 0.1 Other occupational skills training
70.6 80.9 81.4 80.7 79.0
Remedial training (ABE/ESL TAA only)
0.5 1.0 0.9 1.0 0.1
Prerequisite training 0.0 0.1 0.2 0.0 0.0 Completed any training (among trainees)
70.0 59.6 54.7 62.0 73.7
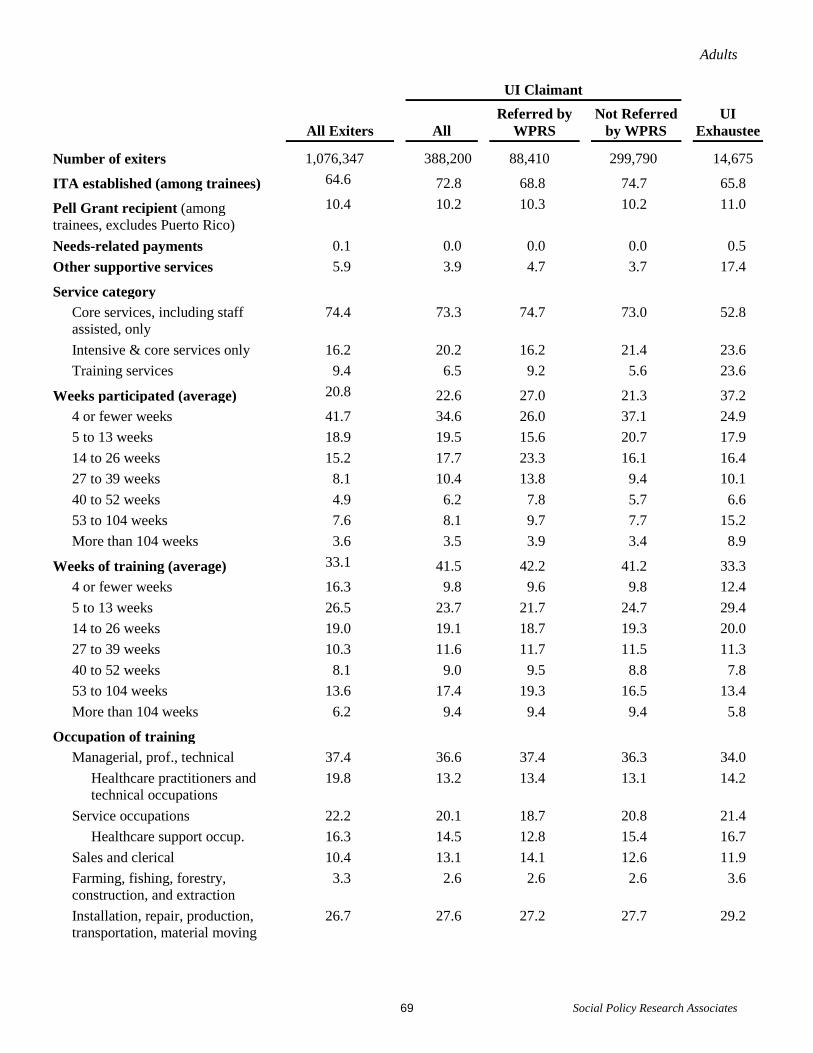
Adults
Social Policy Research Associates 69
All Exiters
UI Claimant
All
Referred by WPRS
Not Referred by WPRS
UI Exhaustee
Number of exiters 1,076,347 388,200 88,410 299,790 14,675
ITA established (among trainees) 64.6 72.8 68.8 74.7 65.8
Pell Grant recipient (among trainees, excludes Puerto Rico)
10.4 10.2 10.3 10.2 11.0
Needs-related payments 0.1 0.0 0.0 0.0 0.5 Other supportive services 5.9 3.9 4.7 3.7 17.4
Service category Core services, including staff assisted, only
74.4 73.3 74.7 73.0 52.8
Intensive & core services only 16.2 20.2 16.2 21.4 23.6 Training services 9.4 6.5 9.2 5.6 23.6
Weeks participated (average) 20.8 22.6 27.0 21.3 37.2 4 or fewer weeks 41.7 34.6 26.0 37.1 24.9 5 to 13 weeks 18.9 19.5 15.6 20.7 17.9 14 to 26 weeks 15.2 17.7 23.3 16.1 16.4 27 to 39 weeks 8.1 10.4 13.8 9.4 10.1 40 to 52 weeks 4.9 6.2 7.8 5.7 6.6 53 to 104 weeks 7.6 8.1 9.7 7.7 15.2 More than 104 weeks 3.6 3.5 3.9 3.4 8.9
Weeks of training (average) 33.1 41.5 42.2 41.2 33.3 4 or fewer weeks 16.3 9.8 9.6 9.8 12.4 5 to 13 weeks 26.5 23.7 21.7 24.7 29.4 14 to 26 weeks 19.0 19.1 18.7 19.3 20.0 27 to 39 weeks 10.3 11.6 11.7 11.5 11.3 40 to 52 weeks 8.1 9.0 9.5 8.8 7.8 53 to 104 weeks 13.6 17.4 19.3 16.5 13.4 More than 104 weeks 6.2 9.4 9.4 9.4 5.8
Occupation of training Managerial, prof., technical 37.4 36.6 37.4 36.3 34.0
Healthcare practitioners and technical occupations
19.8 13.2 13.4 13.1 14.2
Service occupations 22.2 20.1 18.7 20.8 21.4 Healthcare support occup. 16.3 14.5 12.8 15.4 16.7
Sales and clerical 10.4 13.1 14.1 12.6 11.9 Farming, fishing, forestry, construction, and extraction
3.3 2.6 2.6 2.6 3.6
Installation, repair, production, transportation, material moving
26.7 27.6 27.2 27.7 29.2

Adults
Social Policy Research Associates 70
All Exiters
UI Claimant
All
Referred by WPRS
Not Referred by WPRS
UI Exhaustee
Number of exiters 1,076,347 388,200 88,410 299,790 14,675
Reason for exit
Institutionalized 0.1 0.0 0.0 0.0 0.2 Health/medical 0.2 0.1 0.2 0.1 0.6 Deceased 0.0 0.0 0.0 0.0 0.0 Family care 0.1 0.0 0.0 0.0 0.2 Reserve called to active duty 0.0 0.0 0.0 0.0 0.0 Retirement 0.0 0.0 0.1 0.0 0.0

Adults
Social Policy Research Associates 71
Table II-21 Services Received by Adult Exiters from April 2013 to March 2014 who Received Intensive or Training
Services, by Highest Grade Completed (Derived from PY 2013Q4 WIASRD Records)
With Intensive or Training Services
Less than High School
High School Graduate
Some Post-secondary
College Graduate
Number of exiters 275,446 30,130 124,472 84,348 34,978
Coenrollment
WIA dislocated worker 11.5 7.9 10.8 12.9 13.6 WIA youth 1.4 5.4 1.5 0.4 0.0 Partner program 77.2 82.3 74.5 78.2 78.9 Wagner-Peyser 75.8 81.4 73.1 76.6 77.8
TAA 1.0 0.6 1.2 1.0 0.9 National Farmworker Jobs 0.0 0.0 0.0 0.0 0.0 Veterans programs 3.6 0.9 3.1 5.1 4.5 Vocational Education 0.1 0.0 0.1 0.1 0.1 Adult Education 0.2 0.2 0.2 0.2 0.1 Title V Older Worker 0.0 0.0 0.0 0.0 0.0 Other partner programs 4.6 5.9 5.4 4.2 1.9
Services Received
Core self-service and informational activities
52.4 48.5 56.1 50.1 47.9
Staff-assisted core services 100.0 100.0 100.0 100.0 100.0 Intensive Services 100.0 100.0 100.0 100.0 100.0
Prevocational activities 14.9 13.8 14.1 14.5 18.7 Training services 36.8 22.5 40.3 39.6 31.8
Type of Training (among trainees) On-the-job training 12.4 12.1 13.4 10.4 14.3 Skill upgrading 9.9 8.6 9.5 9.7 13.0 Entrepreneurial training 0.2 0.2 0.1 0.1 0.3 ABE or ESL in combination with training (non-TAA)
1.6 18.0 0.4 0.4 0.4
Customized training 6.7 2.9 7.1 5.3 11.8 Apprenticeship training 0.3 0.1 0.3 0.2 0.1 Other occupational skills training
70.6 55.8 70.9 75.7 62.7
Remedial training (ABE/ESL TAA only)
0.5 2.2 0.4 0.3 0.5
Prerequisite training 0.0 0.0 0.0 0.1 0.0 Completed any training (among trainees)
70.0 70.0 71.6 67.2 71.1

Adults
Social Policy Research Associates 72
With Intensive or Training Services
Less than High School
High School Graduate
Some Post-secondary
College Graduate
Number of exiters 275,446 30,130 124,472 84,348 34,978
ITA established (among trainees) 64.6 51.7 63.7 69.9 60.2
Pell Grant recipient (among trainees, excludes Puerto Rico)
10.4 2.7 10.2 15.2 1.7
Needs-related payments 0.2 0.5 0.3 0.2 0.1 Other supportive services 21.6 23.0 23.7 21.6 13.6
Service category Core services, including staff assisted, only
0.0 0.0 0.0 0.0 0.0
Intensive & core services only 63.2 77.5 59.7 60.4 68.2 Training services 36.8 22.5 40.3 39.6 31.8
Weeks participated (average) 41.2 36.4 41.2 43.9 39.6 4 or fewer weeks 16.4 19.8 16.5 15.1 16.0 5 to 13 weeks 16.9 17.7 17.1 15.7 17.6 14 to 26 weeks 19.2 19.2 19.2 18.6 20.2 27 to 39 weeks 12.3 12.3 12.3 12.2 12.3 40 to 52 weeks 8.8 8.9 8.7 9.2 8.8 53 to 104 weeks 17.0 14.7 16.6 18.7 16.4 More than 104 weeks 9.5 7.5 9.5 10.5 8.8
Weeks of training (average) 33.1 29.3 30.7 38.3 30.7 4 or fewer weeks 16.3 16.6 18.3 13.3 16.0 5 to 13 weeks 26.5 31.8 29.0 22.1 25.4 14 to 26 weeks 19.0 19.6 18.7 18.5 21.9 27 to 39 weeks 10.3 9.5 9.6 11.1 11.2 40 to 52 weeks 8.1 6.6 7.1 9.9 7.6 53 to 104 weeks 13.6 10.3 11.4 17.7 13.3 More than 104 weeks 6.2 5.6 5.9 7.3 4.7
Occupation of training Managerial, prof., technical 37.4 18.6 26.4 48.8 62.9
Healthcare practitioners and technical occupations
19.8 7.2 14.8 29.3 19.7
Service occupations 22.2 30.6 26.2 19.0 9.3 Healthcare support occupations
16.3 18.6 19.7 14.1 6.5
Sales and clerical 10.4 8.8 9.9 10.4 13.9 Farming, fishing, forestry, construction, and extraction
3.3 5.8 3.9 2.4 1.5
Installation, repair, production, transportation, material moving
26.7 36.3 33.6 19.4 12.3

Adults
Social Policy Research Associates 73
With Intensive or Training Services
Less than High School
High School Graduate
Some Post-secondary
College Graduate
Number of exiters 275,446 30,130 124,472 84,348 34,978
Reason for exit
Institutionalized 0.2 0.5 0.3 0.1 0.1 Health/medical 0.7 0.8 0.8 0.7 0.6 Deceased 0.1 0.0 0.1 0.1 0.1 Family care 0.2 0.2 0.2 0.2 0.1 Reserve called to active duty 0.0 0.0 0.0 0.0 0.0 Retirement 0.0 0.0 0.0 0.0 0.0

Adults
Social Policy Research Associates 74
Table II-22 Services Received by Adult Exiters from April 2013 to March 2014
who Received Intensive or Training Services, by Low Income and Receipt of Public Assistance (Derived from PY 2013Q4 WIASRD Records)
With Intensive
or Training Services
Public Assistance
Low Income Any TANF Other
Number of exiters 275,446 132,405 75,754 10,490 74,002
Coenrollment
WIA dislocated worker 11.5 8.9 7.2 4.5 7.2 WIA youth 1.4 2.7 2.6 2.5 2.6 Partner program 77.2 71.7 72.3 74.6 72.2
Wagner-Peyser 75.8 70.4 71.3 73.5 71.1 TAA 1.0 0.4 0.2 0.1 0.2 National Farmworker Jobs 0.0 0.0 0.0 0.0 0.0 Veterans programs 3.6 2.0 1.5 0.8 1.6 Vocational Education 0.1 0.1 0.1 0.0 0.1 Adult Education 0.2 0.3 0.1 0.1 0.1 Title V Older Worker 0.0 0.0 0.0 0.0 0.0 Other partner programs 4.6 7.2 9.3 8.9 9.3
Services Received
Core self-service and informational activities
52.4 65.5 64.2 61.3 64.7
Staff-assisted core services 100.0 100.0 100.0 100.0 100.0 Intensive Services 100.0 100.0 100.0 100.0 100.0
Prevocational activities 14.9 13.5 13.7 12.4 13.7 Training services 36.8 45.2 42.2 35.4 42.5 Type of Training (among trainees)
On-the-job training 12.4 11.2 9.3 18.9 9.3 Skill upgrading 9.9 9.5 10.4 7.7 10.4 Entrepreneurial training 0.2 0.2 0.1 0.2 0.1 ABE or ESL in combination with training (non-TAA)
1.6 2.1 2.3 2.0 2.3
Customized training 6.7 1.8 1.4 1.7 1.4 Apprenticeship training 0.3 0.2 0.1 0.1 0.1 Other occupational skills training
70.6 76.6 77.8 78.1 77.9
Remedial training (ABE/ESL TAA only)
0.5 0.5 0.5 0.9 0.5
Prerequisite training 0.0 0.0 0.1 0.0 0.1 Completed any training (among trainees)
70.0 73.7 73.0 69.7 73.4

Adults
Social Policy Research Associates 75
With Intensive or Training
Services
Public Assistance
Low Income Any TANF Other
Number of exiters 275,446 132,405 75,754 10,490 74,002
ITA established (among trainees) 64.6 71.1 75.3 63.7 75.6
Pell Grant recipient (among trainees, excludes Puerto Rico)
10.4 12.9 15.0 9.4 15.1
Needs-related payments 0.2 0.4 0.3 0.3 0.3 Other supportive services 21.6 27.5 29.6 26.8 29.4
Service category Core services, including staff assisted, only
0.0 0.0 0.0 0.0 0.0
Intensive & core services only 63.2 54.8 57.8 64.6 57.5 Training services 36.8 45.2 42.2 35.4 42.5
Weeks participated (average) 41.2 49.0 48.9 44.1 49.2 4 or fewer weeks 16.4 10.8 10.7 12.4 10.4 5 to 13 weeks 16.9 14.3 14.0 16.0 14.0 14 to 26 weeks 19.2 19.0 18.3 19.1 18.3 27 to 39 weeks 12.3 13.4 13.5 13.9 13.5 40 to 52 weeks 8.8 9.8 10.1 9.7 10.2 53 to 104 weeks 17.0 20.6 21.4 18.7 21.5 More than 104 weeks 9.5 12.1 12.0 10.2 12.1
Weeks of training (average) 33.1 34.1 34.0 28.4 34.0 4 or fewer weeks 16.3 13.9 13.6 12.1 13.6 5 to 13 weeks 26.5 27.2 26.5 31.2 26.4 14 to 26 weeks 19.0 19.7 19.8 24.6 19.8 27 to 39 weeks 10.3 10.4 10.7 11.0 10.7 40 to 52 weeks 8.1 8.3 8.8 6.8 8.8 53 to 104 weeks 13.6 14.0 14.5 9.6 14.5 More than 104 weeks 6.2 6.4 6.2 4.7 6.2
Occupation of training Managerial, prof., technical 37.4 34.7 33.2 23.4 33.3
Healthcare practitioners and technical occupations
19.8 20.6 20.4 12.3 20.5
Service occupations 22.2 27.0 31.6 43.4 31.4 Healthcare support occupations
16.3 20.8 25.3 33.1 25.2
Sales and clerical 10.4 9.7 10.4 18.7 10.3 Farming, fishing, forestry, construction, and extraction
3.3 2.9 2.2 1.7 2.2
Installation, repair, production, transportation, material moving
26.7 25.7 22.6 12.7 22.8

Adults
Social Policy Research Associates 76
With Intensive or Training
Services
Public Assistance
Low Income Any TANF Other
Number of exiters 275,446 132,405 75,754 10,490 74,002
Reason for exit
Institutionalized 0.2 0.4 0.4 0.2 0.4 Health/medical 0.7 1.1 1.3 1.1 1.3 Deceased 0.1 0.1 0.1 0.1 0.1 Family care 0.2 0.3 0.3 0.4 0.3 Reserve called to active duty 0.0 0.0 0.0 0.0 0.0 Retirement 0.0 0.0 0.0 0.0 0.0

Adults
Social Policy Research Associates 77
Table II-23 Services Received by Adult Exiters from April 2013 to March 2014
who Received Intensive or Training Services, by Selected Characteristics (Derived from PY 2013Q4 WIASRD Records)
With Intensive or
Training Services
Limited English-
Language1 Single Parent
Pell Grant Recipient (among
trainees)1 Offender
Number of exiters 275,446 3,958 37,478 10,559 23,717 Coenrollment
WIA dislocated worker 11.5 6.6 8.5 12.5 6.5 WIA youth 1.4 2.1 1.8 1.9 1.7 Partner program 77.2 67.9 66.1 60.3 72.2
Wagner-Peyser 75.8 66.8 64.5 56.4 69.8 TAA 1.0 1.0 0.6 0.8 0.2 National Farmworker Jobs 0.0 0.2 0.0 0.0 0.0 Veterans programs 3.6 0.8 1.0 0.7 2.4 Vocational Education 0.1 0.3 0.1 0.6 0.1 Adult Education 0.2 0.5 0.2 0.2 0.1 Title V Older Worker 0.0 0.1 0.0 0.0 0.0 Other partner programs 4.6 2.7 5.6 10.6 15.2
Services Received Core self-service and informational activities
52.4 59.3 67.1 62.8 65.1
Staff-assisted core services 100.0 100.0 100.0 100.0 100.0 Intensive Services 100.0 100.0 100.0 100.0 100.0
Prevocational activities 14.9 19.5 13.1 12.7 13.3 Training services 36.8 36.2 51.9 100.0 31.2 Type of Training (among trainees)
On-the-job training 12.4 11.6 9.0 1.5 12.9 Skill upgrading 9.9 9.2 9.7 9.5 11.8 Entrepreneurial training 0.2 0.2 0.1 0.0 0.1 ABE or ESL in combination with training (non-TAA)
1.6 3.6 2.0 0.4 3.6
Customized training 6.7 5.5 3.1 0.5 2.2 Apprenticeship training 0.3 0.0 0.2 0.0 0.1 Other occupational skills training
70.6 71.9 77.6 88.9 73.7
Remedial training (ABE/ESL TAA only)
0.5 1.0 0.5 0.2 0.8
Prerequisite training 0.0 0.0 0.1 0.2 0.0 Completed any training (among trainees)
70.0 77.2 74.1 70.2 74.7
1 Excludes Puerto Rico.

Adults
Social Policy Research Associates 78
With Intensive or
Training Services
Limited English-
Language1 Single Parent
Pell Grant Recipient (among
trainees)1 Offender
Number of exiters 275,446 3,958 37,478 10,559 23,717 ITA established (among trainees) 64.6 67.1 72.1 83.0 72.0
Pell Grant recipient (among trainees, excludes Puerto Rico)
10.4 4.7 17.9 100.0 8.1
Needs-related payments 0.2 0.1 0.5 0.6 0.4 Other supportive services 21.6 25.3 36.1 45.2 37.6 Service category
Core services, including staff assisted, only
0.0 0.0 0.0 0.0 0.0
Intensive & core services only 63.2 63.8 48.1 0.0 68.8 Training services 36.8 36.2 51.9 100.0 31.2
Weeks participated (average) 41.2 45.2 50.9 93.0 41.9 4 or fewer weeks 16.4 12.6 11.0 0.4 17.4 5 to 13 weeks 16.9 16.1 12.9 1.9 15.9 14 to 26 weeks 19.2 19.6 17.6 6.3 18.9 27 to 39 weeks 12.3 12.5 13.1 9.5 12.9 40 to 52 weeks 8.8 9.8 10.4 10.5 8.4 53 to 104 weeks 17.0 19.8 22.3 38.3 16.3 More than 104 weeks 9.5 9.6 12.7 33.1 10.3
Weeks of training (average) 33.1 27.8 36.8 63.4 26.4 4 or fewer weeks 16.3 11.8 12.0 2.4 17.9 5 to 13 weeks 26.5 32.6 24.5 7.9 32.4 14 to 26 weeks 19.0 24.9 19.9 12.9 19.8 27 to 39 weeks 10.3 10.2 11.3 14.8 9.1 40 to 52 weeks 8.1 7.0 9.6 15.1 6.3 53 to 104 weeks 13.6 9.9 15.5 31.1 10.1 More than 104 weeks 6.2 3.6 7.1 15.7 4.2
Occupation of training Managerial, prof., technical 37.4 22.4 40.9 63.6 18.9
Healthcare practitioners and technical occupations
19.8 10.6 28.4 46.2 7.9
Service occupations 22.2 30.1 33.3 15.6 13.4 Healthcare support occupations
16.3 19.7 28.6 12.5 8.0
Sales and clerical 10.4 11.9 10.7 7.7 8.0 Farming, fishing, forestry, construction, and extraction
3.3 2.6 1.3 1.1 6.1
Installation, repair, production, transportation, material moving
26.7 32.9 13.8 12.0 53.6

Adults
Social Policy Research Associates 79
With Intensive or
Training Services
Limited English-
Language1 Single Parent
Pell Grant Recipient (among
trainees)1 Offender
Number of exiters 275,446 3,958 37,478 10,559 23,717 Reason for exit
Institutionalized 0.2 0.2 0.2 0.4 1.4 Health/medical 0.7 1.7 1.1 1.5 1.0 Deceased 0.1 0.1 0.1 0.1 0.1 Family care 0.2 0.7 0.4 0.5 0.1 Reserve called to active duty 0.0 0.0 0.0 0.0 0.0 Retirement 0.0 0.0 0.0 0.0 0.0

Adults
Social Policy Research Associates 80
Table II-24 Number of Adults Exiters from April 2013 to March 2014, by Occupation of Training
(Derived from PY 2013Q4 WIASRD Records)
Occupation Title O*Net Code
Any Training
On-the-job/ Apprentice Training
Customized Training
Skill Upgrading and Other
Occupational Skills Training
Twenty Most Common Occupations Nursing Assistants 31101400 8,648 83 119 8,340 Heavy and Tractor-Trailer Truck Drivers 53303200 8,585 113 31 8,484 Registered Nurses 29114100 6,170 176 256 5,836 Licensed Practical and Licensed Vocational Nurses 29206100 5,384 30 39 5,286 Medical Assistants 31909200 2,968 105 9 2,854 Welders, Cutters, Solderers, and Brazers 51412100 1,637 156 26 1,461 Medical Records and Health Information Technicians 29207100 1,539 29 249 1,265 Production Workers, All Other 51919900 1,334 301 819 209 Computer User Support Specialists 15115100 1,313 81 22 1,197 Customer Service Representatives 43405100 1,131 510 149 485 Heating, Air Conditioning, and Refrigeration Mechanics and Installers 49902100 1,121 105 5 1,017 Bookkeeping, Accounting, and Auditing Clerks 43303100 1,070 101 53 918 Security Guards 33903200 1,063 85 3 989 Medical Secretaries 43601300 992 64 23 910 Office Clerks, General 43906100 979 111 31 830 Network and Computer Systems Administrators 15114200 852 16 40 800 Dental Assistants 31909100 793 35 3 761 Healthcare Support Workers, All Other 31909900 778 16 222 497 Executive Secretaries and Executive Administrative Assistants 43601100 757 155 15 590 Helpers--Production Workers 51919800 743 486 91 158

Adults
Social Policy Research Associates 81
Occupation Title O*Net Code
Any Training
On-the-job/ Apprentice Training
Customized Training
Skill Upgrading and Other
Occupational Skills Training
Ten Most Common Healthcare Occupations Nursing Assistants 31101400 8,648 83 119 8,340 Registered Nurses 29114100 6,170 176 256 5,836 Licensed Practical and Licensed Vocational Nurses 29206100 5,384 30 39 5,286 Medical Assistants 31909200 2,968 105 9 2,854 Medical Records and Health Information Technicians 29207100 1,539 29 249 1,265 Dental Assistants 31909100 793 35 3 761 Healthcare Support Workers, All Other 31909900 778 16 222 497 Pharmacy Technicians 29205200 716 14 3 699 Home Health Aides 31101100 657 24 85 534 Emergency Medical Technicians and Paramedics 29204100 518 20 21 470

Adults
Social Policy Research Associates 82
Table II-25 Services Received by Adult Exiters from April 2013 to March 2014, by State
(Derived from PY 2013Q4 WIASRD Records)
Number of
Exiters
Core Services
Only
Core and Intensive
Services Only
Training
ITA
Established (among trainees)
Nation 1,076,347 74.4 16.2 9.4 64.6 Alabama 2,517 0.1 10.5 89.4 72.3 Alaska 198 0.5 27.8 71.7 100.0 Arizona 2,884 2.8 30.6 66.6 82.5 Arkansas 618 0.2 4.4 95.5 99.5 California 29,956 22.3 45.0 32.6 52.2 Colorado 1,957 0.1 18.9 81.1 81.9 Connecticut 973 8.7 41.0 50.3 50.9 Delaware 290 0.0 4.8 95.2 99.3 District of Columbia 362 23.8 27.6 48.6 100.0 Florida 14,566 5.0 16.2 78.8 52.0 Georgia 4,567 11.6 21.7 66.7 94.8 Hawaii 224 15.2 44.6 40.2 81.1 Idaho 404 0.0 13.6 86.4 0.0 Illinois 3,659 6.3 27.6 66.1 87.2 Indiana 38,733 48.8 41.9 9.3 0.0 Iowa 29,227 96.0 1.7 2.3 0.3 Kansas 4,904 61.9 12.0 26.0 87.5 Kentucky 2,642 0.7 53.5 45.8 52.6 Louisiana 59,643 94.6 2.7 2.7 73.3 Maine 562 20.3 5.3 74.4 96.4 Maryland 1,741 2.7 27.9 69.4 43.3 Massachusetts 1,441 0.3 26.2 73.6 93.2 Michigan 7,524 3.8 35.7 60.5 57.7 Minnesota 1,042 0.1 40.6 59.3 100.0 Mississippi 4,929 54.2 13.0 32.8 44.4 Missouri 230,997 97.4 0.7 1.9 56.1 Montana 367 9.3 32.4 58.3 100.0 Nebraska 382 0.0 14.7 85.3 95.1 Nevada 2,659 0.9 44.5 54.6 79.5 New Hampshire 346 4.0 43.6 52.3 61.9 New Jersey 3,437 5.4 12.7 81.8 85.5 New Mexico 1,109 1.8 5.2 93.0 29.7 New York 264,713 69.8 26.3 3.9 78.7 North Carolina 17,760 72.2 13.8 14.0 72.5

Adults
Social Policy Research Associates 83
Number of
Exiters
Core Services
Only
Core and Intensive
Services Only
Training
ITA
Established (among trainees)
North Dakota 233 3.0 29.2 67.8 95.6 Ohio 7,626 27.9 31.6 40.4 63.4 Oklahoma 44,736 95.0 1.7 3.3 83.1 Oregon 142,587 95.7 3.1 1.1 27.7 Pennsylvania 8,218 4.5 70.0 25.5 65.4 Puerto Rico 5,644 47.1 30.4 22.5 24.4 Rhode Island 452 19.2 40.5 40.3 73.1 South Carolina 5,566 0.0 54.4 45.6 64.9 South Dakota 607 4.6 67.9 27.5 0.0 Tennessee 4,561 3.7 15.7 80.6 63.8 Texas 23,519 12.6 69.7 17.8 92.6 Utah 85,791 83.9 15.9 0.2 100.0 Vermont 269 0.0 53.2 46.8 15.9 Virgin Islands 202 5.4 60.4 34.2 100.0 Virginia 2,698 6.8 40.0 53.2 94.7 Washington 3,332 6.8 44.5 48.7 66.3 West Virginia 470 3.2 27.2 69.6 83.8 Wisconsin 2,224 2.0 37.8 60.2 78.0 Wyoming 279 0.0 22.6 77.4 95.8

Adults
Social Policy Research Associates 84
Table II-26 Number of Adult Exiters from April 2013 to March 2014 Who Received Training, by State
(Derived from PY 2013Q4 WIASRD Records)
State Any
Training
On-the-job/ Apprentice
Training
Entrepre-neurial
Training
ABE/ESL/ Remedial/
Prerequisite Training
Customized Training
Skill Upgrading and Other
Occupational Skills Training
Nation 101,498 12,875 153 2,042 6,807 80,878 Alabama 2,251 235 0 2 0 2,018
Alaska 142 19 0 0 51 116
Arizona 1,922 312 0 60 15 1,572
Arkansas 590 0 0 14 0 588
California 9,777 1,953 5 45 795 7,763
Colorado 1,587 211 0 0 31 1,357
Connecticut 489 18 0 0 15 456
Delaware 276 2 0 0 0 274
District of Columbia
176 0 0 0 0 176
Florida 11,478 932 29 5 4,104 6,485
Georgia 3,047 155 0 2 1 2,902
Hawaii 90 17 0 0 0 90
Idaho 349 16 0 1 1 332
Illinois 2,418 134 0 0 40 2,227
Indiana 3,594 595 0 5 2 2,907
Iowa 672 10 0 0 0 665
Kansas 1,277 157 1 27 7 1,103
Kentucky 1,209 492 21 3 9 714
Louisiana 1,615 249 45 1 0 1,377
Maine 418 16 0 4 0 398
Maryland 1,209 31 0 284 15 1,159
Massachusetts 1,060 5 0 72 1 982
Michigan 4,553 409 1 36 145 4,006
Minnesota 618 10 0 4 4 604
Mississippi 1,616 808 1 0 29 777
Missouri 4,493 713 3 107 10 2,908
Montana 214 15 0 0 1 197
Nebraska 326 21 0 2 0 314
Nevada 1,451 414 0 6 9 1,138
New Hampshire
181 75 0 0 0 112
New Jersey 2,812 109 0 28 5 2,686
New Mexico 1,031 126 0 39 580 308

Adults
Social Policy Research Associates 85
New York 10,351 540 7 182 531 9,098
North Carolina
2,494 220 0 42 5 2,291
North Dakota 158 5 0 5 0 153
Ohio 3,084 839 0 9 148 2,096
Oklahoma 1,470 23 0 0 17 1,445
Oregon 1,599 363 5 1 0 1,245
Pennsylvania 2,099 611 0 3 52 1,443
Puerto Rico 1,271 540 14 225 44 471
Rhode Island 182 47 0 1 0 135
South Carolina
2,540 270 0 632 0 1,734
South Dakota 167 30 0 2 0 136
Tennessee 3,675 417 0 1 9 3,248
Texas 4,177 127 0 32 64 4,021
Utah 155 141 0 11 0 16
Vermont 126 20 0 0 0 112
Virgin Islands 69 0 0 0 3 66
Virginia 1,436 58 8 32 0 1,357
Washington 1,622 224 11 94 2 1,399
West Virginia 327 40 0 0 4 283
Wisconsin 1,339 93 2 11 44 1,211
Wyoming 216 8 0 12 14 207

Adults
Social Policy Research Associates 86
Table II-27 Outcomes of Adult Exiters, Trends Over Time
(Derived from PY 2013Q4 WIASRD Records)
WIA Oct. 2009
to Sep. 2010
WIA Oct. 2010
to Sep. 2011
WIA Oct. 2011
to Sep. 2012
WIA Apr. 2012
to Mar. 2013
WIA Oct. 2012
to Sep. 2013
Number of exiters 1,208,517 1,217,445 1,264,945 1,263,065 1,119,787
Common Measures Entered employment (quarter after exit) (excludes employed at entry)
55.7 57.7 60.0 60.2 60.5
Retention in 2nd and 3rd quarters 81.1 81.6 82.3 82.4 83.1 Average earnings in 2nd & 3rd qtrs. quarters
$13,717 $13,432 $13,466 $13,542 $13,567
Other WIA Performance and 12-Month Outcomes
Retained employment 3rd quarter after exit
84.4 84.7 85.3 85.5 86.1
Retained employment 4th quarter after exit
80.9 77.1 81.1 83.4
Earnings Change 2nd and 3rd quarters after exit $1,649 $2,422 $1,955 $1,797 $1,803 3rd and 4th quarters after exit $1,503 $1,826 $1,635 $1,790
Credential and employment rate 48.5 47.2 49.0 50.1 51.4
Employment in Quarter after exit
Occupation of employment (very incomplete)
Managerial, professional, & technical
26.4 27.7 23.8 23.6 24.1
Healthcare practitioners and technical occupations
13.2 12.0 10.0 9.7 10.0
Service occupations 24.3 22.9 23.3 22.9 22.8 Healthcare support occupations 11.3 10.3 9.5 9.2 8.8
Sales and clerical 19.3 19.9 21.0 21.8 21.2 Farming, fishing, forestry, construction and extraction
4.6 5.4 5.6 5.4 5.0
Installation, repair, production, transportation, and material moving
25.4 24.1 26.3 26.2 26.9
Nontraditional employment 2.3 2.1 1.9 2.0 2.0 Males 1.9 2.0 1.9 2.0 1.9 Females 2.6 2.3 2.0 1.9 2.0

Adults
Social Policy Research Associates 87
WIA Oct. 2009
to Sep. 2010
WIA Oct. 2010
to Sep. 2011
WIA Oct. 2011
to Sep. 2012
WIA Apr. 2012
to Mar. 2013
WIA Oct. 2012
to Sep. 2013
Number of exiters 1,208,517 1,217,445 1,264,945 1,263,065 1,119,787
Other Outcome Information
Employment
Quarter after exit 60.1 62.0 63.9 64.1 64.3 Second quarter after exit 61.1 62.6 64.3 64.6 65.2 Third quarter after exit 61.6 62.5 64.2 64.5 65.1 Fourth quarter after exit 61.2 58.9 62.8 64.5
Average earnings (among earners) Quarter after exit $5,660 $5,540 $5,718 $5,733 $5,579 Second quarter after exit $6,016 $5,959 $6,017 $6,050 $6,040 Third quarter after exit $6,233 $6,116 $6,145 $6,177 $6,183 Fourth quarter after exit $6,400 $6,143 $6,251 $6,394
Earnings quarter after exit $1 to $2,499 29.0 28.8 27.5 27.5 28.2 $2,500 to $4,999 27.8 28.8 28.1 27.9 28.1 $5,000 to $7,499 18.8 19.1 19.8 20.0 20.0 $7,500 to $9,999 10.4 10.1 10.8 10.8 10.6 $10,000 or more 14.0 13.1 13.7 13.9 13.1
Earnings 3rd quarter after exit $1 to $2,499 25.4 25.4 24.9 24.7 24.5 $2,500 to $4,999 26.2 26.6 26.6 26.3 26.1 $5,000 to $7,499 19.8 20.2 20.6 20.7 20.9 $7,500 to $9,999 11.8 11.7 12.0 12.1 12.3 $10,000 or more 16.8 16.1 16.0 16.2 16.2
Attained Credential (among trainees)
59.4 59.8 61.0
High school diploma/equivalency 1.0 1.3 1.3 1.2 1.3 AA, AS, BA, BS or other college degree
5.5 6.3 8.3 7.7 7.1
Postgraduate degree 0.1 0.1 0.1 Occupational skills license/credential/certificate
46.7 45.0 44.9 46.0 47.4
Other 5.8 5.3 4.4 4.7 5.2

Adults
Social Policy Research Associates 88
Note: Outcome data for exiters from April 2012 to March 2013 are incomplete. Data for outcomes in the fourth quarter after exit are based on 9 months of exiters.
Outcome data for exiters from October 2012 to September 2013 do not include fourth quarter outcomes; second and third quarter outcomes are based on 9 and 6 months of exiters, respectively.
Postgraduate degree for October 2011 to September 2012 is based on only 9 months of exiters.

Adults
Social Policy Research Associates 89
Table II-28 Number of Adult Exiters Attaining Outcomes, Trends Over Time
(Derived from PY 2013Q4 WIASRD Records)
WIA Oct. 2009
to Sep. 2010
WIA Oct. 2010
to Sep. 2011
WIA Oct. 2011
to Sep. 2012
WIA Apr. 2012
to Mar. 2013
WIA Oct. 2012
to Sep. 2013
Number of exiters 1,208,517 1,217,445 1,264,945 1,263,065 1,119,787
Common Measures Entered employment (quarter after exit) (excludes employed at entry)
556,156 578,807 628,264 633,575 565,146
Retention in 2nd and 3rd quarters 584,090 610,362 660,588 662,406 299,253
Other WIA Performance and 12-Month Outcomes
Retained employment 3rd quarter after exit
607,744 633,354 685,112 687,126 309,987
Retained employment 4th quarter after exit
582,481 576,731 650,949 516,825
Credential and employment rate1 78,392 73,167 56,530 57,257 56,122 Information about Employment in
Quarter after exit
Occupation of employment Managerial, professional, & technical
23,304 28,355 22,126 23,611 23,336
Healthcare practitioners and technical occupations
11,668 12,307 9,289 9,721 9,679
Service occupations 21,467 23,523 21,710 22,958 22,046 Healthcare support occupations 10,012 10,508 8,855 9,222 8,525
Sales and clerical 17,094 20,448 19,582 21,807 20,469 Farming, fishing, forestry, construction and extraction
4,088 5,494 5,213 5,423 4,850
Installation, repair, production, transportation, and material moving
22,477 24,677 24,442 26,245 26,004
Occupation not reported 632,922 646,844 710,755 704,687 618,484 Nontraditional employment 12,729 12,291 7,815 6,861 6,689
Males 5,831 6,153 3,872 3,380 3,152 Females 6,898 6,138 3,749 3,229 3,343
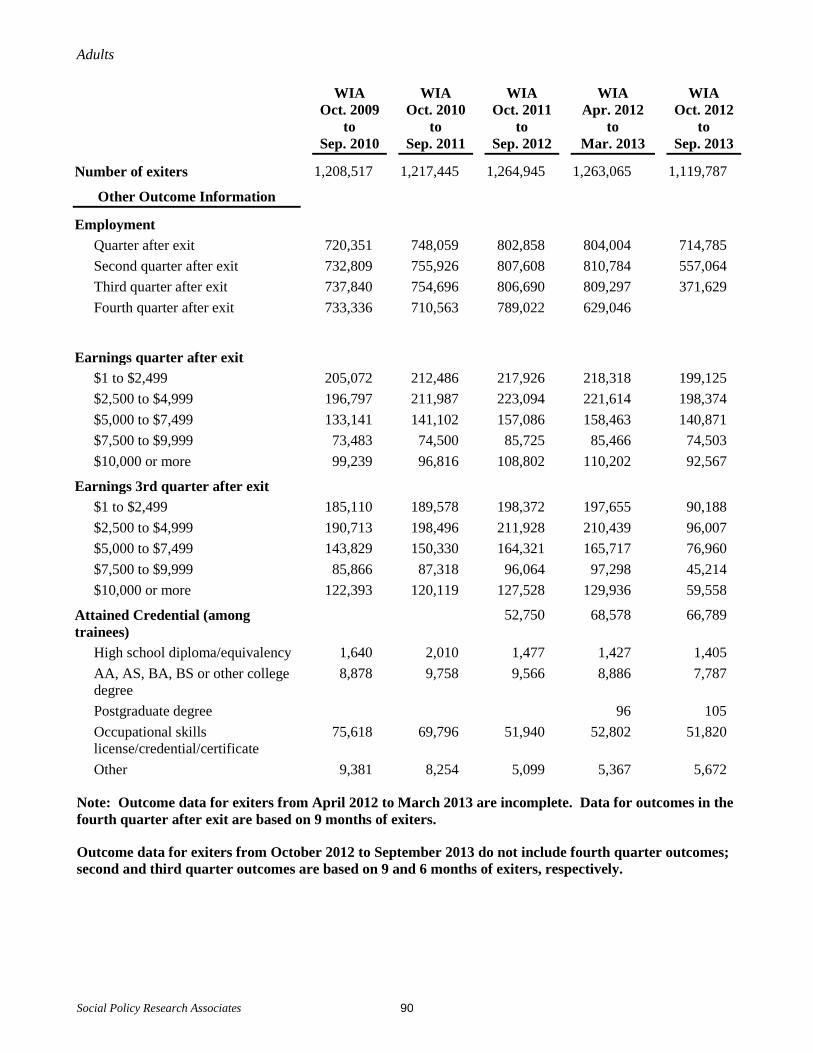
Adults
Social Policy Research Associates 90
WIA Oct. 2009
to Sep. 2010
WIA Oct. 2010
to Sep. 2011
WIA Oct. 2011
to Sep. 2012
WIA Apr. 2012
to Mar. 2013
WIA Oct. 2012
to Sep. 2013
Number of exiters 1,208,517 1,217,445 1,264,945 1,263,065 1,119,787
Other Outcome Information
Employment Quarter after exit 720,351 748,059 802,858 804,004 714,785 Second quarter after exit 732,809 755,926 807,608 810,784 557,064 Third quarter after exit 737,840 754,696 806,690 809,297 371,629 Fourth quarter after exit 733,336 710,563 789,022 629,046
Earnings quarter after exit $1 to $2,499 205,072 212,486 217,926 218,318 199,125 $2,500 to $4,999 196,797 211,987 223,094 221,614 198,374 $5,000 to $7,499 133,141 141,102 157,086 158,463 140,871 $7,500 to $9,999 73,483 74,500 85,725 85,466 74,503 $10,000 or more 99,239 96,816 108,802 110,202 92,567
Earnings 3rd quarter after exit $1 to $2,499 185,110 189,578 198,372 197,655 90,188 $2,500 to $4,999 190,713 198,496 211,928 210,439 96,007 $5,000 to $7,499 143,829 150,330 164,321 165,717 76,960 $7,500 to $9,999 85,866 87,318 96,064 97,298 45,214 $10,000 or more 122,393 120,119 127,528 129,936 59,558
Attained Credential (among trainees)
52,750 68,578 66,789
High school diploma/equivalency 1,640 2,010 1,477 1,427 1,405 AA, AS, BA, BS or other college degree
8,878 9,758 9,566 8,886 7,787
Postgraduate degree 96 105 Occupational skills license/credential/certificate
75,618 69,796 51,940 52,802 51,820
Other 9,381 8,254 5,099 5,367 5,672
Note: Outcome data for exiters from April 2012 to March 2013 are incomplete. Data for outcomes in the fourth quarter after exit are based on 9 months of exiters.
Outcome data for exiters from October 2012 to September 2013 do not include fourth quarter outcomes; second and third quarter outcomes are based on 9 and 6 months of exiters, respectively.

Adults
Social Policy Research Associates 91
Table II-29 Outcomes of Adult Exiters, by Age
(Derived from PY 2013Q4 WIASRD Records)
Age at Participation
18 to 21 22 to 29 30 – 44 45 – 54 55 and Over
Number of exiters1 99,825 265,332 371,691 224,187 158,740
Common Measures Entered employment (quarter after exit) (excludes employed at entry)1
64.7 65.2 62.1 59.2 48.8
Retention in 2nd and 3rd quarters2 78.5 82.0 83.5 83.7 80.8 Average earnings in 2nd & 3rd qtrs.2 $8,475 $11,970 $14,756 $15,321 $14,381
Other WIA Performance and 12-Month Outcomes
Retained employment 3rd quarter after exit2
82.9 85.4 86.4 86.3 83.4
Retained employment 4th quarter after exit3
80.0 82.3 83.2 83.1 79.4
Earnings Change 2nd and 3rd quarters after exit2 $3,137 $2,809 $2,116 $822 $-1,057 3rd and 4th quarters after exit3 $3,150 $2,806 $2,054 $627 $-1,590
Credential and employment rate1 50.0 52.7 52.2 50.7 46.7
Information about Employment in Quarter after exit
Occupation of employment1
Managerial, professional, & technical
13.1 25.5 26.0 23.9 26.3
Healthcare practitioners and technical occupations
7.8 14.6 10.8 5.4 4.0
Service occupations 30.8 25.7 20.9 18.8 19.0 Healthcare support occupations
10.5 11.1 8.6 6.2 5.5
Sales and clerical 26.2 20.4 19.8 21.0 23.2 Farming, fishing, forestry, construction and extraction
5.0 4.9 5.2 5.1 4.3
Installation, repair, production, transportation, and material moving
24.9 23.4 28.0 31.1 27.3
Nontraditional employment1 2.1 2.0 2.1 2.0 1.5 Males 2.8 2.1 2.0 1.5 1.4 Females 1.7 1.7 2.2 2.5 1.6

Adults
Social Policy Research Associates 92
Age at Participation
18 to 21 22 to 29 30 – 44 45 – 54 55 and Over
Number of exiters 99,825 265,332 371,691 224,187 158,740
Other Outcome Information
Employment Quarter after exit1 68.5 69.0 65.8 62.7 52.5 Second quarter after exit4 68.2 69.5 66.6 63.3 52.3 Third quarter after exit2 68.4 69.3 66.6 62.7 50.7 Fourth quarter after exit3 67.7 68.5 65.9 61.8 49.3
Average earnings (among earners)
Quarter after exit1 $3,356 $4,784 $6,017 $6,521 $6,255 Second quarter after exit4 $3,644 $5,231 $6,535 $6,930 $6,545 Third quarter after exit2 $3,784 $5,442 $6,762 $7,082 $6,585 Fourth quarter after exit3 $3,945 $5,617 $6,938 $7,182 $6,611
Earnings quarter after exit1
$1 to $2,499 45.9 31.0 24.8 22.9 26.8 $2,500 to $4,999 33.3 30.9 26.5 25.7 26.5 $5,000 to $7,499 13.5 20.0 21.3 21.3 19.0 $7,500 to $9,999 4.2 9.4 12.1 12.4 10.8 $10,000 or more 3.1 8.6 15.3 17.7 16.9
Earnings 3rd quarter after exit2
$1 to $2,499 39.9 26.6 21.3 20.1 25.5 $2,500 to $4,999 34.2 28.4 24.0 23.9 25.5 $5,000 to $7,499 16.1 21.6 21.4 21.5 18.8 $7,500 to $9,999 5.6 11.5 13.8 13.7 11.4 $10,000 or more 4.2 11.8 19.5 20.8 18.7
Attained Credential (among trainees)1
59.2 60.5 61.4 61.8 62.1
High school diploma/equivalency
5.5 1.1 0.7 0.4 0.3
AA, AS, BA, BS or other college degree
6.6 8.3 8.0 5.4 2.7
Postgraduate degree 0.0 0.1 0.1 0.1 0.1 Occupational skills license/credential/certificate
42.0 46.5 47.6 50.0 51.9
Other 5.1 4.4 5.0 6.0 7.1
1 Based on exiters from October 2012 to September 2013. 2 Based on exiters from April 2012 to March 2013. 3 Based on exiters from January 2012 to December 2012. 4 Based on exiters from July 2012 to June 2013.

Adults
Social Policy Research Associates 93
Table II-30 Outcomes of Adult Exiters, by Ethnicity and Race
(Derived from PY 2013Q4 WIASRD Records)
Hispanic Not Hispanic
All Black White
Other
Number of exiters1 117,341 950,033 251,798 627,270 70,965
Common Measures Entered employment (quarter after exit) (excludes employed at entry)1
63.3 60.3 60.2 60.7 57.0
Retention in 2nd and 3rd quarters 2 82.5 82.4 79.8 83.4 81.3 Average earnings in 2nd and 3rd qtrs.2 $12,795 $13,593 $10,626 $14,549 $13,429
Other WIA Performance and 12-Month Outcomes
Retained employment 3rd quarter after exit2
85.7 85.4 83.5 86.2 84.5
Retained employment 4th quarter after exit3
81.6 82.3 80.3 83.1 81.4
Earnings Change 2nd and 3rd quarters after exit2 $2,991 $1,588 $2,264 $1,273 $2,507 3rd and 4th quarters after exit3 $2,876 $1,486 $2,252 $1,154 $2,352
Credential and employment rate1 52.9 51.6 48.5 53.4 49.9
Information about Employment in Quarter after exit
Occupation of employment1
Managerial, professional, & technical 18.2 25.1 17.8 29.1 24.9 Healthcare practitioners and technical occupations
6.6 11.0 7.2 13.0 10.5
Service occupations 25.7 22.3 27.8 18.9 26.6 Healthcare support occupations 7.0 9.3 11.3 8.1 10.7
Sales and clerical 25.7 19.9 20.9 19.3 19.8 Farming, fishing, forestry, construction and extraction
6.4 4.7 4.4 5.0 3.9
Installation, repair, production, transportation, and material moving
24.0 27.9 29.0 27.6 24.9
Nontraditional employment1 2.0 2.0 2.4 1.8 1.8 Males 2.1 1.9 2.2 1.8 1.9 Females 1.8 2.1 2.7 1.8 1.7

Adults
Social Policy Research Associates 94
Hispanic Not Hispanic
All Black White
Other
Number of exiters 117,341 950,033 251,798 627,270 70,965
Other Outcome Information
Employment
Quarter after exit1 66.5 64.1 63.9 64.6 60.8 Second quarter after exit4 66.9 64.7 63.8 65.3 62.0 Third quarter after exit2 66.7 64.4 63.2 65.0 62.1 Fourth quarter after exit3 65.2 63.6 62.4 64.2 61.7
Average earnings (among earners)
Quarter after exit1 $5,245 $5,606 $4,399 $6,105 $5,393 Second quarter after exit4 $5,643 $6,041 $4,654 $6,558 $5,886 Third quarter after exit2 $5,813 $6,204 $4,773 $6,694 $6,077 Fourth quarter after exit3 $5,964 $6,329 $4,902 $6,811 $6,196
Earnings quarter after exit1
$1 to $2,499 29.2 28.1 35.0 25.0 30.8 $2,500 to $4,999 29.3 28.1 31.1 26.9 28.0 $5,000 to $7,499 20.3 19.9 18.6 20.5 19.3 $7,500 to $9,999 10.0 10.6 8.1 11.7 9.7 $10,000 or more 11.2 13.3 7.1 15.8 12.3
Earnings 3rd quarter after exit2
$1 to $2,499 25.2 24.6 31.9 22.1 26.1 $2,500 to $4,999 27.9 26.1 30.2 24.8 26.4 $5,000 to $7,499 21.5 20.6 19.7 20.9 20.9 $7,500 to $9,999 11.8 12.2 9.4 13.2 11.4 $10,000 or more 13.7 16.4 8.8 19.1 15.2
Attained Credential (among trainees)1 64.0 60.8 59.6 61.5 60.6
High school diploma/equivalency 3.1 1.0 1.1 1.0 0.6 AA, AS, BA, BS or other college degree
3.3 8.1 5.1 9.9 6.1
Postgraduate degree 0.1 0.1 0.0 0.1 0.1 Occupational skills license/credential/certificate
53.0 46.1 50.0 43.9 48.1
Other 4.3 5.5 3.4 6.5 5.7
1 Based on exiters from October 2012 to September 2013. 2 Based on exiters from April 2012 to March 2013. 3 Based on exiters from January 2012 to December 2012. 4 Based on exiters from July 2012 to June 2013.

Adults
Social Policy Research Associates 95
Table II-31 Outcomes of Adult Exiters, by Employment at Participation, Gender, and Disability Status
(Derived from PY 2013Q4 WIASRD Records)
Employed at Participation Gender
Yes
No
Male
Female With a
Disability
Number of exiters1 179,065 940,722 573,240 528,471 51,263
Common Measures
Entered employment (quarter after exit) (excludes employed at entry)1
60.5 61.2 59.6 42.4
Retention in 2nd and 3rd quarters 2 88.5 80.7 81.6 83.3 76.7 Average earnings in 2nd and 3rd quarters2 $14,352 $13,302 $15,453 $11,366 $12,171
Other WIA Performance and 12-Month Outcomes
Retained employment 3rd quarter after exit2 90.5 84.1 84.9 86.1 80.0 Retained employment 4th quarter after exit3 87.9 80.7 81.7 82.9 76.2 Earnings Change
2nd and 3rd quarters after exit2 $2,581 $1,585 $1,876 $1,559 $1,993 3rd and 4th quarters after exit3 $2,442 $1,485 $1,774 $1,437 $1,804
Credential and employment rate1 65.5 45.8 49.9 53.1 42.1
Information about Employment in Quarter after exit
Occupation of employment1 Managerial, professional, & technical 34.7 20.2 17.4 30.2 25.6
Healthcare practitioners and technical occupations
17.5 7.2 2.9 16.5 10.8
Service occupations 21.1 23.4 13.7 30.5 24.2 Healthcare support occupations 10.7 8.1 1.7 15.1 5.9
Sales and clerical 15.5 23.3 12.8 27.7 22.8 Farming, fishing, forestry, construction and extraction
4.8 5.1 10.1 0.7 4.1
Installation, repair, production, transportation, and material moving
24.0 28.0 46.0 11.0 23.3
Nontraditional employment1 2.8 1.8 1.9 2.0 2.1 Males 3.3 1.6 1.9 2.5 Females 2.4 1.9 2.0 1.4

Adults
Social Policy Research Associates 96
Employed at Participation Gender
Yes
No
Male
Female With a
Disability
Number of exiters 179,065 940,722 573,240 528,471 51,263
Other Outcome Information
Employment Quarter after exit1 84.1 60.5 64.5 64.0 45.9 Second quarter after exit4 82.2 61.5 64.9 64.7 46.7 Third quarter after exit2 80.7 61.4 64.5 64.5 45.8 Fourth quarter after exit3 79.1 60.7 63.6 63.8 44.9
Average earnings (among earners) Quarter after exit1 $6,254 $5,399 $6,354 $4,723 $4,734 Second quarter after exit4 $6,724 $5,823 $6,851 $5,053 $5,187 Third quarter after exit2 $6,887 $5,997 $7,026 $5,207 $5,343 Fourth quarter after exit3 $7,065 $6,121 $7,188 $5,296 $5,487
Earnings quarter after exit1 $1 to $2,499 20.9 30.2 24.7 32.0 38.3 $2,500 to $4,999 27.7 28.2 24.9 31.7 27.4 $5,000 to $7,499 22.3 19.4 20.5 19.4 16.1 $7,500 to $9,999 13.0 9.9 12.4 8.6 8.3 $10,000 or more 16.2 12.3 17.4 8.3 10.0
Earnings 3rd quarter after exit2 $1 to $2,499 18.3 26.3 21.7 28.1 34.2 $2,500 to $4,999 24.6 26.7 22.7 30.3 26.0 $5,000 to $7,499 22.5 20.2 20.6 20.9 16.9 $7,500 to $9,999 14.6 11.5 13.8 10.2 10.0 $10,000 or more 20.1 15.2 21.2 10.5 12.9
Attained Credential (among trainees)1 70.5 57.3 59.8 62.2 57.9 High school diploma/equivalency 0.4 1.6 1.2 1.4 2.5 AA, AS, BA, BS or other college degree 9.2 6.3 4.3 10.0 7.1 Postgraduate degree 0.1 0.1 0.1 0.1 0.1 Occupational skills license/credential/certificate
52.8 45.2 48.0 46.1 44.4
Other 8.0 4.1 6.2 4.5 3.9
1 Based on exiters from October 2012 to September 2013. 2 Based on exiters from April 2012 to March 2013. 3 Based on exiters from January 2012 to December 2012. 4 Based on exiters from July 2012 to June 2013.

Adults
Social Policy Research Associates 97
Table II-32 Outcomes of Adult Exiters, by Veteran Status (Derived from PY 2013Q4 WIASRD Records)
All Exiters Veteran
Campaign Veteran
Recently Separated Veteran
Disabled Veteran
Number of exiters1 1,119,787 87,789 27,486 11,611 13,035
Common Measures
Entered employment (quarter after exit) (excludes employed at entry)1
60.5 58.1 58.1 64.1 53.6
Retention in 2nd and 3rd quarters 2 82.4 82.0 82.3 81.9 81.3 Average earnings in 2nd and 3rd quarters2 $13,542 $17,161 $18,884 $16,069 $18,677
Other WIA Performance and 12-Month Outcomes
Retained employment 3rd quarter after exit2 85.5 84.8 84.9 84.7 83.8 Retained employment 4th quarter after exit3 82.3 81.2 81.1 81.3 80.2 Earnings Change
2nd and 3rd quarters after exit2 $1,797 $1,617 $1,940 $873 $2,175 3rd and 4th quarters after exit3 $1,692 $1,316 $1,481 $591 $1,781
Credential and employment rate1 51.4 45.0 47.3 41.7 38.6
Information about Employment in Quarter after exit
Occupation of employment1 Managerial, professional, & technical 24.1 22.3 26.8 21.0 29.0
Healthcare practitioners and technical occupations
10.0 4.6 5.2 3.0 3.3
Service occupations 22.8 17.1 17.5 19.3 16.6 Healthcare support occupations 8.8 2.6 1.8 2.4 2.6
Sales and clerical 21.2 15.6 14.7 15.0 17.7 Farming, fishing, forestry, construction and extraction
5.0 6.9 6.4 7.6 4.9
Installation, repair, production, transportation, and material moving
26.9 38.2 34.6 37.2 31.8
Nontraditional employment1 2.0 2.2 2.8 2.9 1.9 Males 1.9 1.9 2.6 2.5 1.8 Females 2.0 3.1 4.7 3.6 2.0

Adults
Social Policy Research Associates 98
All
Exiters Veteran Campaign Veteran
Recently Separated Veteran
Disabled Veteran
Number of exiters 1,119,787 87,789 27,486 11,611 13,035
Other Outcome Information
Employment Quarter after exit1 64.3 61.5 62.0 66.9 57.4 Second quarter after exit4 64.8 61.2 61.6 67.3 56.8 Third quarter after exit2 64.5 60.1 60.3 67.3 55.5 Fourth quarter after exit3 63.7 59.1 59.0 66.5 54.4
Average earnings (among earners) Quarter after exit1 $5,579 $7,350 $8,069 $6,518 $7,662 Second quarter after exit4 $6,007 $7,743 $8,511 $7,038 $8,367 Third quarter after exit2 $6,177 $7,822 $8,593 $7,223 $8,460 Fourth quarter after exit3 $6,313 $7,901 $8,688 $7,346 $8,614
Earnings quarter after exit1 $1 to $2,499 28.2 21.1 19.1 23.7 20.9 $2,500 to $4,999 28.1 22.6 20.8 23.6 20.6 $5,000 to $7,499 20.0 20.3 19.4 21.8 19.3 $7,500 to $9,999 10.6 13.8 14.6 13.6 14.8 $10,000 or more 13.1 22.3 26.1 17.4 24.4
Earnings 3rd quarter after exit2 $1 to $2,499 24.7 19.8 17.9 21.0 18.4 $2,500 to $4,999 26.3 20.4 17.9 21.2 18.2 $5,000 to $7,499 20.7 19.8 18.8 20.7 18.5 $7,500 to $9,999 12.1 14.6 15.3 15.3 15.7 $10,000 or more 16.2 25.4 30.1 21.9 29.2
Attained Credential (among trainees)1 61.0 57.3 60.2 52.1 52.1 High school diploma/equivalency 1.3 0.1 0.1 0.0 0.0 AA, AS, BA, BS or other college degree
7.1 5.3 5.1 4.1 5.5
Postgraduate degree 0.1 0.1 0.0 0.0 0.1 Occupational skills license/credential/certificate
47.4 47.0 49.9 43.0 40.9
Other 5.2 4.8 5.0 4.9 5.6
1 Based on exiters from October 2012 to September 2013. 2 Based on exiters from April 2012 to March 2013. 3 Based on exiters from January 2012 to December 2012. 4 Based on exiters from July 2012 to June 2013.

Adults
Social Policy Research Associates 99
Table II-33 Outcomes of Adult Exiters, by UI Status
(Derived from PY 2013Q4 WIASRD Records)
All Exiters
UI Claimant UI
Exhaustee
All Referred by
WPRS Not Referred
by WPRS
Number of exiters1 1,119,787 414,000 102,357 311,643 16,245
Common Measures
Entered employment (quarter after exit) (excludes employed at entry)1
60.5 62.5 60.6 63.1 60.5
Retention in 2nd and 3rd quarters 2 82.4 83.9 84.4 83.7 80.7 Average earnings in 2nd and 3rd quarters2 $13,542 $14,108 $13,549 $14,265 $12,732
Other WIA Performance and 12-Month Outcomes
Retained employment 3rd quarter after exit2 85.5 86.7 87.2 86.6 84.3 Retained employment 4th quarter after exit3 82.3 83.5 84.6 83.2 81.6 Earnings Change
2nd and 3rd quarters after exit2 $1,797 $-581 $-878 $-499 $6,104 3rd and 4th quarters after exit3 $1,692 $-787 $-759 $-795 $6,172
Credential and employment rate1 51.4 43.0 37.1 45.8 47.0
Information about Employment in Quarter after exit
Occupation of employment1
Managerial, professional, & technical 24.1 22.1 20.4 22.9 21.2 Healthcare practitioners and technical occupations
10.0 5.5 4.3 6.0 6.5
Service occupations 22.8 19.7 19.7 19.7 21.0 Healthcare support occupations 8.8 7.9 6.2 8.7 7.9
Sales and clerical 21.2 22.9 22.6 23.0 23.1 Farming, fishing, forestry, construction and extraction
5.0 5.6 7.4 4.7 5.2
Installation, repair, production, transportation, and material moving
26.9 29.8 30.0 29.8 29.4
Nontraditional employment1 2.0 1.9 1.9 1.9 3.6 Males 1.9 1.5 1.4 1.5 3.4 Females 2.0 2.3 2.3 2.3 3.9

Adults
Social Policy Research Associates 100
All Exiters
UI Claimant UI
Exhaustee
All Referred by
WPRS Not Referred
by WPRS
Number of exiters 1,119,787 414,000 102,357 311,643 16,245
Other Outcome Information
Employment
Quarter after exit1 64.3 64.4 61.6 65.3 62.6 Second quarter after exit4 64.8 66.2 63.9 66.9 62.8 Third quarter after exit2 64.5 66.1 64.5 66.6 62.1 Fourth quarter after exit3 63.7 65.5 64.8 65.7 61.4
Average earnings (among earners) Quarter after exit1 $5,579 $6,014 $5,938 $6,038 $5,206 Second quarter after exit4 $6,007 $6,434 $6,144 $6,523 $5,591 Third quarter after exit2 $6,177 $6,510 $6,217 $6,596 $5,841 Fourth quarter after exit3 $6,313 $6,550 $6,412 $6,590 $6,068
Earnings quarter after exit1
$1 to $2,499 28.2 24.5 24.9 24.4 27.8 $2,500 to $4,999 28.1 27.1 26.8 27.2 29.6 $5,000 to $7,499 20.0 21.5 21.8 21.4 21.8 $7,500 to $9,999 10.6 11.8 11.8 11.9 10.4 $10,000 or more 13.1 15.0 14.8 15.1 10.4
Earnings 3rd quarter after exit2
$1 to $2,499 24.7 21.7 22.6 21.4 24.8 $2,500 to $4,999 26.3 25.6 26.1 25.5 26.5 $5,000 to $7,499 20.7 21.9 22.2 21.8 22.5 $7,500 to $9,999 12.1 13.1 13.1 13.1 12.6 $10,000 or more 16.2 17.7 16.0 18.2 13.6
Attained Credential (among trainees)1 61.0 51.5 45.0 54.5 59.6
High school diploma/equivalency 1.3 0.7 0.9 0.6 0.9 AA, AS, BA, BS or other college degree
7.1 7.3 6.7 7.5 5.6
Postgraduate degree 0.1 0.1 0.0 0.1 0.1 Occupational skills license/credential/certificate
47.4 39.6 34.5 42.0 49.6
Other 5.2 3.8 2.9 4.2 3.5
1 Based on exiters from October 2012 to September 2013. 2 Based on exiters from April 2012 to March 2013. 3 Based on exiters from January 2012 to December 2012. 4 Based on exiters from July 2012 to June 2013.

Adults
Social Policy Research Associates 101
Table II-34 Outcomes of Adult Exiters who Received Intensive or Training Services, by Highest Grade Completed
(Derived from PY 2013Q4 WIASRD Records)
With Intensive or
Training Services
Less than High
School
High School
Graduate
Some Post-secondary
College
Graduate
Number of exiters1 283,833 32,692 128,119 86,858 35,553
Common Measures
Entered employment (quarter after exit) (excludes employed at entry)1
68.7 59.5 69.7 70.5 70.4
Retention in 2nd and 3rd quarters 2 84.6 77.7 84.3 86.2 87.8 Average earnings in 2nd and 3rd quarters2
$13,838 $10,299 $12,441 $14,307 $19,795
Other WIA Performance and 12-Month Outcomes
Retained employment 3rd quarter after exit2
87.3 81.4 87.0 88.7 89.8
Retained employment 4th quarter after exit3
83.6 76.6 83.1 85.5 86.6
Earnings Change 2nd and 3rd quarters after exit2 $3,497 $2,265 $3,387 $3,976 $3,713 3rd and 4th quarters after exit3 $3,302 $1,949 $3,226 $3,865 $3,343
Credential and employment rate1 51.4 43.1 52.4 52.0 50.9
Information about Employment in Quarter after exit
Occupation of employment1
Managerial, professional, & technical
26.2 5.5 17.0 35.5 55.6
Healthcare practitioners and technical occupations
12.4 1.4 7.8 21.7 14.9
Service occupations 22.9 33.9 25.5 20.6 9.9 Healthcare support occupations 10.9 10.1 12.1 11.5 4.5
Sales and clerical 19.5 19.9 18.8 20.0 20.9 Farming, fishing, forestry, construction and extraction
4.3 6.9 5.4 3.0 1.6
Installation, repair, production, transportation, and material moving
27.1 33.8 33.3 20.9 12.0
Nontraditional employment1 3.1 3.1 3.2 3.0 3.0 Males 3.3 2.3 2.9 3.8 4.2 Females 2.9 4.2 3.5 2.3 1.9

Adults
Social Policy Research Associates 102
With Intensive or
Training Services
Less than High
School
High School
Graduate
Some Post-secondary
College
Graduate
Number of exiters 283,833 32,692 128,119 86,858 35,553
Other Outcome Information
Employment
Quarter after exit1 72.2 61.6 73.1 74.3 73.6 Second quarter after exit4 70.9 60.2 71.6 73.4 72.8 Third quarter after exit2 69.3 58.3 69.9 72.1 71.7 Fourth quarter after exit3 67.2 56.0 67.5 70.5 70.2
Average earnings (among earners) Quarter after exit1 $6,060 $4,350 $5,471 $6,271 $8,905 Second quarter after exit4 $6,315 $4,469 $5,695 $6,572 $9,280 Third quarter after exit2 $6,417 $4,562 $5,771 $6,700 $9,367 Fourth quarter after exit3 $6,540 $4,634 $5,884 $6,777 $9,588
Earnings quarter after exit1
$1 to $2,499 22.9 34.8 24.1 20.6 15.4 $2,500 to $4,999 26.9 32.8 29.0 25.7 18.1 $5,000 to $7,499 22.1 18.0 23.3 23.0 19.2 $7,500 to $9,999 12.7 7.7 12.3 13.7 15.2 $10,000 or more 15.4 6.6 11.4 17.0 32.2
Earnings 3rd quarter after exit2
$1 to $2,499 21.7 32.9 22.7 19.1 15.2 $2,500 to $4,999 24.7 32.1 26.8 23.0 15.7 $5,000 to $7,499 22.1 19.3 23.6 22.7 17.8 $7,500 to $9,999 13.8 8.0 13.7 15.2 15.5 $10,000 or more 17.8 7.6 13.3 20.0 35.8
Attained Credential (among trainees)1
61.0 58.9 62.0 60.6 59.4
High school diploma/equivalency 1.3 17.0 0.1 0.0 0.0 AA, AS, BA, BS or other college degree
7.1 1.2 5.1 12.1 5.4
Postgraduate degree 0.1 0.0 0.0 0.0 0.5 Occupational skills license/credential/certificate
47.4 37.6 51.0 43.8 47.9
Other 5.2 3.1 5.7 4.6 5.7
1 Based on exiters from October 2012 to September 2013. 2 Based on exiters from April 2012 to March 2013. 3 Based on exiters from January 2012 to December 2012. 4 Based on exiters from July 2012 to June 2013.

Adults
Social Policy Research Associates 103
Table II-35 Outcomes of Adult Exiters who Received Intensive or Training Services,
by Low Income and Receipt of Public Assistance (Derived from PY 2013Q4 WIASRD Records)
With Intensive or
Training Services Low
Income Public Assistance
Any TANF Other
Number of exiters1 283,833 141,939 78,987 11,102 77,143
Common Measures
Entered employment (quarter after exit) (excludes employed at entry)1
68.7 68.0 65.8 63.9 65.8
Retention in 2nd and 3rd quarters 2 84.6 82.9 81.3 79.3 81.3 Average earnings in 2nd and 3rd qtrs.2 $13,838 $11,880 $10,863 $9,755 $10,882
Other WIA Performance and 12-Month Outcomes
Retained employment 3rd quarter after exit2
87.3 85.8 84.6 82.9 84.7
Retained employment 4th quarter after exit3
83.6 81.4 80.6 78.7 80.7
Earnings Change 2nd and 3rd quarters after exit2 $3,497 $5,176 $4,715 $4,783 $4,738 3rd and 4th quarters after exit3 $3,302 $5,044 $4,566 $4,649 $4,585
Credential and employment rate1 51.4 51.4 50.5 43.7 50.6
Information about Employment in Quarter after exit
Occupation of employment1
Managerial, professional, & technical
26.2 21.9 20.3 13.4 20.4
Healthcare practitioners and technical occupations
12.4 11.6 11.2 5.4 11.3
Service occupations 22.9 27.6 31.5 39.0 31.4 Healthcare support occupations 10.9 13.5 17.0 19.9 16.9
Sales and clerical 19.5 21.0 22.4 31.7 22.2 Farming, fishing, forestry, construction and extraction
4.3 3.9 2.9 1.7 3.0
Installation, repair, production, transportation, and material moving
27.1 25.6 22.9 14.3 23.1
Nontraditional employment1 3.1 4.4 4.3 3.7 4.4 Males 3.3 5.4 5.4 4.0 5.5 Females 2.9 3.7 3.8 3.6 3.9

Adults
Social Policy Research Associates 104
With Intensive or Training Services
Low Income
Public Assistance
Any TANF Other
Number of exiters 283,833 141,939 78,987 11,102 77,143
Other Outcome Information
Employment
Quarter after exit1 72.2 71.1 68.7 65.5 68.7 Second quarter after exit4 70.9 69.1 66.6 63.7 66.6 Third quarter after exit2 69.3 67.3 64.8 62.3 64.8 Fourth quarter after exit3 67.2 64.5 62.3 59.9 62.3
Average earnings (among earners) Quarter after exit1 $6,060 $5,083 $4,687 $4,048 $4,705 Second quarter after exit4 $6,315 $5,307 $4,850 $4,212 $4,864 Third quarter after exit2 $6,417 $5,469 $4,949 $4,402 $4,958 Fourth quarter after exit3 $6,540 $5,586 $5,045 $4,510 $5,055
Earnings quarter after exit1
$1 to $2,499 22.9 27.3 29.6 34.3 29.5 $2,500 to $4,999 26.9 30.8 32.8 36.1 32.7 $5,000 to $7,499 22.1 21.8 21.0 18.9 21.1 $7,500 to $9,999 12.7 10.4 8.9 6.2 9.0 $10,000 or more 15.4 9.8 7.6 4.5 7.7
Earnings 3rd quarter after exit2
$1 to $2,499 21.7 25.8 28.7 32.1 28.6 $2,500 to $4,999 24.7 28.2 30.6 34.1 30.5 $5,000 to $7,499 22.1 22.2 21.6 19.6 21.6 $7,500 to $9,999 13.8 11.8 10.2 8.1 10.2 $10,000 or more 17.8 12.1 9.0 6.1 9.1
Attained credential (among trainees)1 61.0 62.7 62.4 56.2 62.5 High school diploma/equivalency 1.3 1.9 1.9 2.2 1.8 AA, AS, BA, BS or other college degree
7.1 7.2 6.7 4.4 6.7
Postgraduate degree 0.1 0.1 0.0 0.0 0.0 Occupational skills license/credential/certificate
47.4 49.6 50.3 46.5 50.4
Other 5.2 3.9 3.4 3.0 3.5
1 Based on exiters from October 2012 to September 2013. 2 Based on exiters from April 2012 to March 2013. 3 Based on exiters from January 2012 to December 2012. 4 Based on exiters from July 2012 to June 2013.

Adults
Social Policy Research Associates 105
Table II-36 Outcomes of Adult Exiters who Received Intensive or Training Services,
by Selected Characteristics (Derived from PY 2013Q4 WIASRD Records)
With Intensive or
Training Services
Limited English-
Language1 Single Parent
Pell Grant Recipient (among
trainees)1 Offender
Number of exiters1 283,833 4,086 39,545 11,682 24,980
Common Measures
Entered employment (quarter after exit) (excludes employed at entry)1
68.7 70.3 72.8 76.4 62.9
Retention in 2nd and 3rd quarters 2 84.6 85.7 85.7 90.4 76.0 Average earnings in 2nd and 3rd quarters2 $13,838 $12,407 $12,096 $14,439 $11,442
Other WIA Performance and 12-Month Outcomes
Retained employment 3rd quarter after exit2 87.3 87.9 88.4 92.1 80.2 Retained employment 4th quarter after exit3 83.6 82.9 85.2 89.0 75.5 Earnings Change
2nd and 3rd quarters after exit2 $3,497 $5,251 $4,951 $8,466 $5,002 3rd and 4th quarters after exit3 $3,302 $5,108 $4,935 $8,566 $4,739
Credential and employment rate1 51.4 53.3 53.1 56.2 46.3
Information about Employment in Quarter after exit
Occupation of employment1
Managerial, professional, & technical 26.2 10.9 26.9 53.6 10.5 Healthcare practitioners and technical occupations
12.4 3.3 16.8 43.3 3.8
Service occupations 22.9 37.3 32.6 19.9 20.0 Healthcare support occupations 10.9 12.5 20.1 12.7 5.2
Sales and clerical 19.5 15.3 22.9 12.6 17.1 Farming, fishing, forestry, construction and extraction
4.3 3.9 1.9 1.8 10.4
Installation, repair, production, transportation, and material moving
27.1 32.6 15.8 12.1 41.9
Nontraditional employment1 3.1 4.2 3.8 4.4 3.8
Males 3.3 5.2 4.3 11.1 3.0 Females 2.9 3.8 3.7 2.3 5.7
1 Excludes Puerto Rico.

Adults
Social Policy Research Associates 106
With Intensive or
Training Services
Limited English-
Language1 Single Parent
Pell Grant Recipient (among
trainees)1 Offender
Number of exiters 283,833 4,086 39,545 11,682 24,980
Other Outcome Information
Employment
Quarter after exit1 72.2 72.8 76.7 80.7 64.9 Second quarter after exit4 70.9 72.8 75.4 80.4 61.2 Third quarter after exit2 69.3 70.9 74.5 80.4 58.4 Fourth quarter after exit3 67.2 67.1 73.0 78.8 55.6
Average earnings (among earners) Quarter after exit1 $6,060 $5,478 $5,243 $6,410 $4,842 Second quarter after exit4 $6,315 $5,722 $5,502 $6,702 $4,987 Third quarter after exit2 $6,417 $5,829 $5,663 $6,913 $5,062 Fourth quarter after exit3 $6,540 $5,964 $5,819 $7,091 $5,162
Earnings quarter after exit1
$1 to $2,499 22.9 21.7 24.8 16.9 31.0 $2,500 to $4,999 26.9 31.3 30.9 24.5 29.4 $5,000 to $7,499 22.1 25.9 23.0 24.4 21.1 $7,500 to $9,999 12.7 10.6 11.2 16.3 9.6 $10,000 or more 15.4 10.5 10.2 17.9 8.9
Earnings 3rd quarter after exit2
$1 to $2,499 21.7 21.4 22.9 15.5 30.9 $2,500 to $4,999 24.7 27.7 28.2 21.6 27.4 $5,000 to $7,499 22.1 26.0 23.4 23.6 20.7 $7,500 to $9,999 13.8 12.3 12.6 17.2 10.6 $10,000 or more 17.8 12.6 12.9 22.1 10.3
Attained credential (among trainees)1 61.0 65.9 62.7 64.9 60.5
High school diploma/equivalency 1.3 1.3 1.2 0.3 1.6 AA, AS, BA, BS or other college degree 7.1 2.2 9.0 24.8 3.4 Postgraduate degree 0.1 0.0 0.1 0.0 0.0 Occupational skills license/credential/certificate
47.4 56.4 48.9 36.0 51.2
Other 5.2 6.0 3.5 3.8 4.3
1 Based on exiters from October 2012 to September 2013. 2 Based on exiters from April 2012 to March 2013. 3 Based on exiters from January 2012 to December 2012. 4 Based on exiters from July 2012 to June 2013.

Adults
Social Policy Research Associates 107
Table II-37 Outcomes of Adult Exiters, by Major Service Categories
(Derived from PY 2013Q4 WIASRD Records)
All Exiters
Core Services
Only
Core and Intensive
Services Only
Training
ITA
Established (among
trainees)
Number of exiters1 1,119,787 835,954 172,169 111,664 71,095
Common Measures
Entered employment (quarter after exit) (excludes employed at entry)1
60.5 57.9 64.7 76.1 75.8
Retention in 2nd and 3rd quarters 2 82.4 81.6 82.3 87.9 87.4 Average earnings in 2nd & 3rd qtrs.2 $13,542 $13,434 $12,880 $15,106 $14,220
Other WIA Performance and 12-Month Outcomes
Retained employment 3rd quarter after exit2
85.5 84.8 85.3 90.0 89.7
Retained employment 4th quarter after exit3
82.3 81.7 82.1 85.9 85.6
Earnings Change 2nd and 3rd quarters after exit2 $1,797 $1,195 $1,713 $6,024 $6,448 3rd and 4th quarters after exit3 $1,692 $1,097 $1,590 $5,977 $6,409
Credential and employment rate1 51.4 51.4 56.3
Information about Employment in Quarter after exit
Occupation of employment1
Managerial, professional, & technical
24.1 15.4 17.2 31.0 32.7
Healthcare practitioners and technical occupations
10.0 0.0 4.7 16.5 21.2
Service occupations 22.8 22.4 24.3 22.1 26.4 Healthcare support occupations
8.8 0.0 6.0 13.5 17.9
Sales and clerical 21.2 28.1 27.7 15.1 14.0 Farming, fishing, forestry, construction and extraction
5.0 7.9 5.4 3.8 2.8
Installation, repair, production, transportation, and material moving
26.9 26.1 25.3 28.0 24.1
Nontraditional employment1 2.0 1.1 2.2 4.1 3.9 Males 1.9 0.9 1.9 5.0 5.6 Females 2.0 1.2 2.4 3.4 2.6

Adults
Social Policy Research Associates 108
All Exiters
Core Services
Only
Core and Intensive
Services Only
Training
ITA
Established (among
trainees)
Number of exiters 1,119,787 835,954 172,169 111,664 71,095
Other Outcome Information
Employment
Quarter after exit1 64.3 61.6 67.0 80.3 79.2 Second quarter after exit4 64.8 62.8 65.9 78.9 78.1 Third quarter after exit2 64.5 62.9 64.4 77.5 77.2 Fourth quarter after exit3 63.7 62.5 63.2 74.7 74.5
Average earnings (among earners)
Quarter after exit1 $5,579 $5,395 $5,551 $6,736 $6,215 Second quarter after exit4 $6,007 $5,898 $5,764 $7,054 $6,550 Third quarter after exit2 $6,177 $6,094 $5,892 $7,162 $6,748 Fourth quarter after exit3 $6,313 $6,230 $6,023 $7,363 $6,912
Earnings quarter after exit1
$1 to $2,499 28.2 30.3 26.8 17.7 19.4 $2,500 to $4,999 28.1 28.6 29.0 24.0 26.7 $5,000 to $7,499 20.0 19.1 21.0 23.6 23.4 $7,500 to $9,999 10.6 9.8 10.7 15.3 14.3 $10,000 or more 13.1 12.3 12.4 19.3 16.2
Earnings 3rd quarter after exit2
$1 to $2,499 24.7 25.7 25.4 16.4 17.2 $2,500 to $4,999 26.3 26.8 26.8 21.6 23.2 $5,000 to $7,499 20.7 20.2 21.1 23.4 23.7 $7,500 to $9,999 12.1 11.6 12.1 16.2 15.9 $10,000 or more 16.2 15.7 14.6 22.4 20.0
Attained credential (among trainees)1
61.0 61.0 67.5
High school diploma/equivalency
1.3 1.3 0.4
AA, AS, BA, BS or other college degree
7.1 7.1 8.8
Postgraduate degree 0.1 0.1 0.1 Occupational skills license/credential/certificate
47.4 47.4 55.1
Other 5.2 5.2 3.1
1 Based on exiters from October 2012 to September 2013. 2 Based on exiters from April 2012 to March 2013. 3 Based on exiters from January 2012 to December 2012. 4 Based on exiters from July 2012 to June 2013.

Adults
Social Policy Research Associates 109
Table II-38 Outcomes of Adult Exiters, by Type of Training
(Derived from PY 2013Q4 WIASRD Records)
No Training Any
Training
Basic Skills/ Remedial/
Prerequisite Training
On-the-job/ Apprentice
Training
Occupational/ Entrep./ Custom Training
Number of exiters1 1,008,123 111,664 2,526 14,733 95,202
Common Measures Entered employment (quarter after exit) (excludes employed at entry)1
59.1 76.1 63.3 86.5 75.0
Retention in 2nd and 3rd quarters 2 81.7 87.9 85.0 88.8 87.9 Average earnings in 2nd & 3rd qtrs.2 $13,338 $15,106 $11,214 $15,069 $15,255
Other WIA Performance and 12-Month Outcomes
Retained employment 3rd quarter after exit2
84.9 90.0 87.3 90.7 90.1
Retained employment 4th quarter after exit3
81.8 85.9 78.8 85.6 86.1
Earnings Change 2nd and 3rd quarters after exit2 $1,284 $6,024 $4,043 $6,985 $5,952 3rd and 4th quarters after exit3 $1,188 $5,977 $4,041 $6,767 $5,909
Credential and employment rate1 51.4 30.1 22.8 56.4
Information about Employment in Quarter after exit
Occupation of employment1
Managerial, professional, & technical
16.5 31.0 9.5 17.4 34.1
Healthcare practitioners and technical occupations
2.8 16.5 2.3 2.6 19.5
Service occupations 23.6 22.1 35.8 10.2 24.1 Healthcare support occupations
3.6 13.5 11.0 2.2 15.7
Sales and clerical 27.9 15.1 24.4 22.3 13.6 Farming, fishing, forestry, construction and extraction
6.4 3.8 5.4 6.2 3.3
Installation, repair, production, transportation, and material moving
25.6 28.0 24.9 43.8 25.0
Nontraditional employment1 1.4 4.1 6.9 3.8 4.1 Males 1.2 5.0 4.8 2.9 5.4 Females 1.6 3.4 8.3 5.1 3.1

Adults
Social Policy Research Associates 110
No Training Any
Training
Basic Skills/ Remedial/
Prerequisite Training
On-the-job/ Apprentice
Training
Occupational/ Entrep./ Custom Training
Number of exiters 1,008,123 111,664 2,526 14,733 95,202
Other Outcome Information
Employment
Quarter after exit1 62.5 80.3 65.6 88.2 79.5 Second quarter after exit4 63.3 78.9 66.1 85.3 78.3 Third quarter after exit2 63.2 77.5 58.8 83.8 77.0 Fourth quarter after exit3 62.6 74.7 53.0 79.2 74.5
Average earnings (among earners)
Quarter after exit1 $5,423 $6,736 $5,001 $6,921 $6,772 Second quarter after exit4 $5,875 $7,054 $5,058 $7,053 $7,125 Third quarter after exit2 $6,060 $7,162 $5,077 $7,262 $7,225 Fourth quarter after exit3 $6,192 $7,363 $5,245 $7,317 $7,435
Earnings quarter after exit1
$1 to $2,499 29.6 17.7 30.1 12.6 18.1 $2,500 to $4,999 28.7 24.0 33.4 21.1 24.3 $5,000 to $7,499 19.5 23.6 17.9 29.8 22.7 $7,500 to $9,999 9.9 15.3 8.4 18.9 14.9 $10,000 or more 12.3 19.3 10.2 17.7 19.9
Earnings 3rd quarter after exit2
$1 to $2,499 25.7 16.4 30.6 13.3 16.4 $2,500 to $4,999 26.8 21.6 31.6 19.4 21.7 $5,000 to $7,499 20.4 23.4 19.8 27.3 22.8 $7,500 to $9,999 11.7 16.2 7.7 19.2 16.0 $10,000 or more 15.5 22.4 10.3 20.9 23.1
Attained credential (among trainees)1
61.0 45.1 24.5 67.0
High school diploma/equivalency
1.3 26.7 0.2 0.5
AA, AS, BA, BS or other college degree
7.1 2.2 0.5 8.3
Postgraduate degree 0.1 0.0 0.1 0.1 Occupational skills license/credential/certificate
47.4 14.6 12.3 53.8
Other 5.2 1.7 11.4 4.3
1 Based on exiters from October 2012 to September 2013. 2 Based on exiters from April 2012 to March 2013. 3 Based on exiters from January 2012 to December 2012. 4 Based on exiters from July 2012 to June 2013.

Adults
Social Policy Research Associates 111
Table II-39 Performance Outcomes of Adult Exiters, by Characteristics
(Derived from PY 2013Q4 WIASRD Records)
Exiters from
October 2012 to September 2013 Exiters from
April 2012 to March 2013
Number
of Exiters
Entered Employment
Rate (%)
Credential Attainment Rate (%)
Number of Exiters
Retention 2nd and 3rd Quarters
(%)
Average Earnings
($)
All Exiters 1,119,787 60.5 61.0 1,263,065 82.4 13,542 Statewide programs 9,273 64.9 63.6 13,964 85.9 17,264 Local programs 1,113,265 60.5 61.0 1,253,527 82.4 13,509
Characteristics of All Exiters Age categories
18 to 21 99,825 64.7 59.2 115,500 78.5 8,475 22 to 29 265,332 65.2 60.5 303,488 82.0 11,970 30 to 44 371,691 62.1 61.4 424,069 83.5 14,756 45 to 54 224,187 59.2 61.8 250,049 83.7 15,321 55 and over 158,740 48.8 62.1 169,951 80.8 14,381
Gender Female 528,471 59.6 62.2 582,763 83.3 11,366 Male 573,240 61.2 59.8 657,347 81.6 15,453
Individual with a disability 51,263 42.4 57.9 56,633 76.7 12,171 Race and ethnicity
Hispanic 117,341 63.3 64.0 128,742 82.5 12,795 Not Hispanic American Indian or Alaskan Native
18,077 53.3 61.5 20,222 78.6 12,422
Asian 19,930 57.6 61.7 21,319 85.8 16,292 Black or African American
251,798 60.2 59.6 255,560 79.8 10,626
Hawaiian or other Pacific Islander
4,392 64.4 62.6 5,843 84.3 13,859
White 627,270 60.7 61.5 740,486 83.4 14,549 More than one race 28,566 58.0 58.1 31,061 79.3 11,812
Veteran Status Veteran 87,789 58.1 57.3 103,019 82.0 17,161 Disabled veteran 13,035 53.6 52.1 14,894 81.3 18,677 Campaign veteran 27,486 58.1 60.2 31,737 82.3 18,884 Recently separated veteran 11,611 64.1 52.1 13,490 81.9 16,069 Other eligible person 2,079 53.8 52.4 2,745 82.4 13,516

Adults
Social Policy Research Associates 112
Exiters from
October 2012 to September 2013 Exiters from
April 2012 to March 2013
Number
of Exiters
Entered Employment
Rate (%)
Credential Attainment Rate (%)
Number of Exiters
Retention 2nd and 3rd Quarters
(%)
Average Earnings
($)
All exiters 1,119,787 60.5 61 1,263,065 82.4 13,542 Employed at participation
Employed 179,065 70.5 204,257 88.5 14,352 Not employed or received layoff notice
940,722 60.5 57.3 1,058,808 80.7 13,302
Preprogram quarterly earnings
None 291,023 46.7 61.1 347,722 74.4 11,086 $1 to $2,499 208,913 63.0 60.2 236,154 77.3 8,484 $2,500 to $4,999 227,318 66.3 59.5 250,106 84.1 10,066 $5,000 to $7,499 161,474 66.8 59.7 175,772 87.1 12,922 $7,500 to $9,999 94,978 66.7 62.8 104,460 88.8 16,451 $10,000 or more 136,081 67.0 65.9 148,851 88.8 26,855
UI Claimant (all exiters) 414,000 62.5 51.5 443,858 83.9 14,108 UI Claimant referred by WPRS
102,357 60.6 45.0 103,567 84.4 13,549
UI Exhaustee 16,245 60.5 59.6 19,929 80.7 12,732 Characteristics of Exiters who Received
Intensive or Training Services
UI Claimant 105,992 70.7 51.5 119,664 85.1 14,195 UI Claimant referred by WPRS
25,156 70.2 45.0 27,780 85.6 13,443
UI Exhaustee 7,508 69.6 59.6 8,800 82.8 13,068
Limited English-language (excludes Puerto Rico)
4,086 70.3 65.9 4,361 85.7 12,407
Single parent 39,545 72.8 62.7 40,043 85.7 12,096
Low income 141,939 68.0 62.7 159,038 82.9 11,880
Public assistance recipient 78,987 65.8 62.4 88,011 81.3 10,863
TANF recipient 11,102 63.9 56.2 12,129 79.3 9,755 Other public assistance, including SNAP and SSI
77,143 65.8 62.5 86,209 81.3 10,882
Homeless 6,267 60.0 59.2 7,471 73.7 10,492
Offender 24,980 62.9 60.5 28,106 76.0 11,442

Adults
Social Policy Research Associates 113
Exiters from
October 2012 to September 2013 Exiters from
April 2012 to March 2013
Number
of Exiters
Entered Employment
Rate (%)
Credential Attainment Rate (%)
Number of Exiters
Retention 2nd and 3rd Quarters
(%)
Average Earnings
($)
All exiters 1,119,787 60.5 61 1,263,065 82.4 13,542
Highest grade completed
8th or less 4,296 59.3 53.4 5,435 79.4 11,163 Some high school 28,396 59.5 59.7 33,079 77.4 10,156 High school graduate 106,298 70.3 62.4 114,422 85.0 12,621 High school equivalency 21,821 67.1 60.0 24,376 80.7 11,486 Some postsecondary 86,858 70.5 60.6 93,376 86.2 14,307 College graduate (4-year) 35,553 70.4 59.4 39,535 87.8 19,795

Adults
Social Policy Research Associates 114
Table II-40 Performance Outcomes of Adult Exiters, by Services Received
(Derived from PY 2013Q4 WIASRD Records)
Exiters from
October 2012 to September 2013 Exiters from
April 2012 to March 2013
Number of
Exiters
Entered Employ-
ment Rate (%)
Credential Attainment Rate (%)
Number of
Exiters
Retention 2nd and 3rd Quarters
(%)
Average Earnings
($)
Number of exiters 1,119,787 60.5 61.0 1,263,065 82.4 13,542 Coenrollment
WIA dislocated worker 307,220 59.8 48.6 332,226 82.7 13,543 WIA youth 4,392 68.1 64.2 4,282 78.8 8,401 Partner program 1,004,056 60.0 58.8 1,150,362 82.1 13,503
Wagner-Peyser 997,190 60.0 58.8 1,143,534 82.1 13,493 TAA 3,744 71.3 53.8 4,299 90.2 16,996 National Farmworker Jobs 63 79.6 57.1 53 83.8 11,266 Veterans programs 31,454 60.8 52.1 34,083 83.8 19,963 Vocational Education 439 66.4 49.8 606 90.8 18,335 Adult Education 603 76.1 47.2 780 87.2 13,311 Title V Older Worker 50 47.4 46.7 55 70.4 9,275 Other partner programs 22,204 56.2 60.4 24,991 78.8 11,089
Services Received Core self-service and informational activities
691,538 62.3 66.4 809,476 83.4 13,677
Staff-assisted core services 1,119,787 60.5 61.0 1,263,065 82.4 13,542 Intensive Services 283,833 68.7 61.0 310,907 84.6 13,838
Prevocational activities 42,218 66.5 52.5 44,647 84.3 13,251 Training services 111,664 76.1 61.0 117,024 87.9 15,106 Type of Training (among trainees)
On-the-job training 14,460 86.6 23.6 15,378 88.7 15,015 Skill upgrading 12,178 73.7 68.0 14,012 88.3 16,294 Entrepreneurial training 184 39.2 35.2 197 85.9 10,465 ABE or ESL in combination with training (non-TAA)
2,043 60.0 42.9 2,716 84.2 10,629
Customized training 6,701 73.9 78.7 7,144 93.3 21,641 Apprenticeship training 273 82.6 73.8 174 90.2 19,417 Other occupational skills training
77,616 75.3 66.1 80,781 87.2 14,373
Remedial training (ABE/ESL TAA only)
526 73.1 50.7 532 86.9 12,984
Prerequisite training 44 78.0 58.1 36 89.3 13,122 Completed any training (among trainees)
78,507 80.0 74.5 82,647 88.7 15,586

Adults
Social Policy Research Associates 115
Exiters from
October 2012 to September 2013 Exiters from
April 2012 to March 2013
Number of
Exiters
Entered Employ-
ment Rate (%)
Credential Attainment Rate (%)
Number of
Exiters
Retention 2nd and 3rd Quarters
(%)
Average Earnings
($)
Number of exiters 1,119,787 60.5 61 1,263,065 82.4 13,542 ITA established (among trainees)
71,095 75.8 67.5 71,682 87.4 14,220
Pell Grant recipient (among trainees, excludes Puerto Rico)
11,633 76.4 64.9 12,241 90.3 14,459
Needs-related payments 947 75.2 59.9 1,242 86.1 13,070 Other supportive services 69,495 73.7 69.1 68,988 84.1 13,301 Service category
Core services, including staff assisted, only
835,954 57.9 952,158 81.6 13,434
Intensive & core services only 172,169 64.7 193,883 82.3 12,880 Training services 111,664 76.1 61.0 117,024 87.9 15,106
Weeks participated 4 or fewer weeks 447,054 55.5 77.7 471,743 80.4 13,097 5 to 13 weeks 207,093 63.7 60.5 230,510 82.1 13,588 14 to 26 weeks 166,327 66.3 57.3 195,722 82.7 13,750 27 to 39 weeks 92,812 63.9 60.2 105,775 84.2 14,068 40 to 52 weeks 60,917 60.1 62.8 70,786 84.5 13,754 53 to 104 weeks 101,037 60.2 61.5 133,171 84.5 13,598 More than 104 weeks 44,547 66.1 60.2 55,358 86.9 14,443
Weeks of training (average)
4 or fewer weeks 16,962 76.4 70.6 16,399 87.2 16,718 5 to 13 weeks 29,749 78.5 63.2 30,808 86.7 14,517 14 to 26 weeks 21,401 77.0 54.1 21,936 87.6 14,775 27 to 39 weeks 10,956 75.4 58.2 10,735 87.5 14,850 40 to 52 weeks 8,387 75.7 62.8 8,298 89.0 14,984 53 to 104 weeks 14,625 73.5 59.0 17,046 89.5 15,547 More than 104 weeks 7,502 73.6 56.9 9,223 90.5 15,548
Occupation of training Managerial, prof., technical 36,692 76.1 63.9 37,335 91.1 17,743
Healthcare practitioners and technical occupations
19,023 79.7 71.1 19,017 93.0 17,636
Service occupations 22,323 76.4 67.3 23,459 86.4 10,254 Healthcare support occup. 16,506 77.5 70.1 17,795 87.1 10,062
Sales and clerical 10,447 73.7 49.0 11,319 87.7 12,759 Farming, fishing, forestry, construction, and extraction
3,591 71.8 59.9 3,649 84.8 15,592
Installation, repair, production, transportation
26,470 79.8 63.7 26,026 85.8 15,726

Adults
Social Policy Research Associates 116
Exiters from
October 2012 to September 2013 Exiters from
April 2012 to March 2013
Number of
Exiters
Entered Employ-
ment Rate (%)
Credential Attainment Rate (%)
Number of
Exiters
Retention 2nd and 3rd Quarters
(%)
Average Earnings
($) Reason for exit
Institutionalized 890 1,035 Health/medical 2,407 2,365 Deceased 355 417 Family care 622 635 Reserve called to active duty 59 64 Retirement 136 7.5 68.0 138 87.5 5,051

Adults
Social Policy Research Associates 117
Table II-41 Performance Outcomes of Adult Exiters, by Occupation of Training
(Derived from PY 2013Q4 WIASRD Records)
Exiters from
October 2012 to September 2013 Exiters from
April 2012 to March 2013
Occupation Title O*Net Code
Number of
Exiters
Entered Employment
Rate (%)
Credential Attainment Rate (%)
Number of
Exiters
Retention 2nd & 3rd Quarters
(%)
Average Earnings
($)
Twenty Most Common Occupations Nursing Assistants 31101400 9,349 79.2 74.2 9,818 86.6 9,250 Heavy and Tractor-Trailer Truck Drivers
53303200 9,224 80.5 78.5 9,367 83.0 14,956
Registered Nurses 29114100 6,180 84.5 73.9 6,163 95.7 23,404 Licensed Practical and Licensed Vocational Nurses
29206100 5,701 81.8 72.5 5,859 93.6 15,157
Medical Assistants 31909200 3,384 75.4 62.3 3,682 87.5 10,319 Welders, Cutters, Solderers, and Brazers
51412100 1,784 78.6 64.0 1,641 85.1 15,100
Medical Records and Health Information Technicians
29207100 1,794 70.4 68.9 1,578 88.5 11,839
Production Workers, All Other
51919900 1,260 84.3 74.1 934 89.4 16,731
Computer User Support Specialists
15115100 1,511 74.6 57.3 1,508 86.7 15,601
Customer Service Representatives
43405100 1,306 81.2 43.6 1,624 90.5 14,787
Heating, Air Conditioning, and Refrigeration Mechanics and Installers
49902100 1,309 71.7 59.3 1,400 84.4 14,924
Bookkeeping, Accounting, and Auditing Clerks
43303100 1,134 73.7 52.3 1,150 85.9 12,978
Security Guards 33903200 1,119 80.9 86.3 868 84.1 11,154 Medical Secretaries 43601300 1,053 75.2 60.8 1,034 87.0 10,695 Office Clerks, General 43906100 992 68.9 56.9 1,046 84.2 11,201 Network and Computer Systems Administrators
15114200 845 70.7 65.4 830 89.3 18,796
Dental Assistants 31909100 849 75.4 69.6 818 86.7 10,157 Healthcare Support Workers, All Other
31909900 846 72.6 65.5 1,223 87.9 13,195

Adults
Social Policy Research Associates 118
Exiters from
October 2012 to September 2013 Exiters from
April 2012 to March 2013
Occupation Title O*Net Code
Number of
Exiters
Entered Employment
Rate (%)
Credential Attainment Rate (%)
Number of
Exiters
Retention 2nd & 3rd Quarters
(%)
Average Earnings
($)
Executive Secretaries and Executive Administrative Assistants
43601100 819 74.5 51.9 870 87.8 11,837
Helpers--Production Workers
51919800 743 84.2 39.4 554 87.2 14,946
Ten Most Common Healthcare Occupations
Nursing Assistants 31101400 9,349 79.2 74.2 9,818 86.6 9,250 Registered Nurses 29114100 6,180 84.5 73.9 6,163 95.7 23,404 Licensed Practical and Licensed Vocational Nurses
29206100 5,701 81.8 72.5 5,859 93.6 15,157
Medical Assistants 31909200 3,384 75.4 62.3 3,682 87.5 10,319 Medical Records and Health Information Technicians
29207100 1,794 70.4 68.9 1,578 88.5 11,839
Dental Assistants 31909100 849 75.4 69.6 818 86.7 10,157 Healthcare Support Workers, All Other
31909900 846 72.6 65.5 1,223 87.9 13,195
Pharmacy Technicians 29205200 818 79.0 64.2 863 90.4 10,072 Home Health Aides 31101100 756 79.3 64.0 801 86.0 10,382 Emergency Medical Technicians and Paramedics
29204100 517 77.4 54.0 573 90.9 14,102
Note: Most common occupations of training based on trainees who exited from April 2013 to March 2014.

Adults
Social Policy Research Associates 119
Table II-42 Performance Outcomes of Adult Exiters, by State
(Derived from PY 2013Q4 WIASRD Records)
Exiters from
October 2012 to September 2013 Exiters from
April 2012 to March 2013
Number of
Exiters
Entered Employment
Rate (%)
Credential Attainment Rate (%)
Number of
Exiters
Retention 2nd and 3rd
Quarters (%)
Average Earnings
($)
Nation 1,119,787 60.5 61.0 1,263,065 82.4 13,542
Alabama 2,859 67.4 57.3 3,191 84.9 12,179 Alaska 205 82.1 77.2 190 85.0 21,857 Arizona 3,288 75.2 76.5 3,429 84.1 13,185 Arkansas 655 87.9 82.8 687 94.2 13,896 California 35,054 64.7 58.5 42,334 82.5 14,610 Colorado 1,943 78.9 33.9 2,020 87.6 16,952 Connecticut 923 72.5 78.1 912 83.4 11,054 Delaware 300 72.1 63.8 298 88.4 10,847 District of Columbia 596 56.9 81.7 738 76.2 14,031 Florida 15,067 79.9 86.9 14,217 90.7 17,484 Georgia 4,776 74.4 67.9 4,540 84.3 12,339 Hawaii 233 67.5 61.1 241 81.3 10,826 Idaho 560 86.8 68.6 671 87.9 13,857 Illinois 4,939 73.2 65.5 5,897 84.1 14,024 Indiana 33,630 70.0 44.1 36,134 84.9 12,756 Iowa 26,410 58.7 70.1 31,131 81.7 11,153 Kansas 5,467 78.4 74.1 5,606 88.9 14,537 Kentucky 3,064 85.4 46.7 2,710 84.7 12,456 Louisiana 61,388 63.4 59.4 59,913 81.8 13,332 Maine 603 74.5 74.2 529 87.5 11,147 Maryland 1,919 80.5 60.7 2,030 88.4 16,326 Massachusetts 1,723 82.8 80.3 1,807 88.9 11,558 Michigan 7,569 86.0 89.5 7,160 93.5 16,793 Minnesota 1,152 86.3 85.3 1,189 88.3 13,550 Mississippi 5,559 74.2 31.6 8,084 87.1 11,690 Missouri 248,749 54.8 49.5 263,755 77.6 11,139 Montana 363 65.9 0.0 354 83.7 14,634 Nebraska 393 80.1 62.8 414 85.4 11,144 Nevada 2,458 76.3 53.8 2,322 82.2 15,756 New Hampshire 304 76.6 57.0 272 80.8 11,378 New Jersey 3,973 82.9 57.0 3,974 84.8 13,029 New Mexico 1,138 63.8 60.8 1,334 88.4 20,328 New York 260,512 59.1 34.9 264,754 80.1 12,889

Adults
Social Policy Research Associates 120
Exiters from
October 2012 to September 2013 Exiters from
April 2012 to March 2013
Number of
Exiters
Entered Employment
Rate (%)
Credential Attainment Rate (%)
Number of
Exiters
Retention 2nd and 3rd
Quarters (%)
Average Earnings
($) North Carolina 3,109 67.9 52.7 3,109 86.2 11,719 North Dakota 187 81.4 69.8 208 81.2 11,861 Ohio 8,433 82.2 54.7 9,049 89.3 15,597 Oklahoma 56,501 54.5 64.9 60,659 82.1 12,619 Oregon 157,014 57.1 48.8 182,025 83.3 13,954 Pennsylvania 7,256 71.8 42.8 6,389 84.8 13,410 Puerto Rico 5,873 64.1 69.9 6,153 85.1 6,421 Rhode Island 408 84.1 62.9 496 88.7 12,409 South Carolina 5,774 72.5 52.3 5,584 85.8 11,062 South Dakota 734 74.0 53.8 741 85.7 10,949 Tennessee 4,793 83.0 76.5 4,236 92.0 14,788 Texas 26,044 69.2 71.8 23,223 79.7 12,348 Utah 96,459 64.0 1.8 179,152 86.7 16,995 Vermont 278 63.7 60.7 225 83.8 10,859 Virgin Islands 161 30.3 64.9 91 65.4 7,655 Virginia 2,764 71.1 74.1 2,813 84.2 10,652 Washington 3,016 76.5 61.5 2,730 85.4 14,650 West Virginia 503 76.2 83.2 657 86.3 13,621 Wisconsin 2,435 77.6 62.7 2,423 85.2 11,846 Wyoming 273 76.4 70.1 265 88.4 15,995

Social Policy Research Associates 121
Part III Dislocated Worker Exiters

Dislocated Workers
Social Policy Research Associates 122
Table III-1 Characteristics of Dislocated Worker Exiters, by Characteristics, Trends Over Time
(Derived from PY 2013Q4 WIASRD Records)
WIA
PY 2009 WIA
PY 2010 WIA
PY 2011 WIA
PY 2012 WIA
4/1/13-3/31/14
Number of exiters 581,985 760,853 754,108 705,589 669,117 Statewide programs 20,462 28,730 28,337 17,541 12,685 Local programs 561,923 745,155 732,560 686,766 654,050 National Emergency Grants 23,768 24,987 31,274 27,302 22,281
Disaster Relief 3,020 2,665 4,358 4,054 3,022 Other 20,748 22,322 26,916 23,248 19,259
Characteristics of All Exiters
Age categories
Under 22 3.9 4.1 3.6 3.1 2.9 22 to 29 17.7 18.4 18.4 18.0 17.7 30 to 44 35.7 35.0 34.6 34.1 33.6 45 to 54 26.2 25.6 25.1 24.9 24.6 55 and over 16.6 16.9 18.2 19.9 21.2
Gender Female 44.7 45.8 47.6 48.6 49.2 Male 55.3 54.2 52.4 51.4 50.8
Individual with a disability 2.8 2.9 2.9 3.2 3.6
Race and ethnicity Hispanic 15.4 13.4 13.0 13.4 13.6 Not Hispanic
American Indian or Alaskan Native
1.1 1.0 0.8 0.8 0.8
Asian 3.8 2.9 2.9 3.0 3.0 Black or African American 18.0 16.1 17.1 18.5 19.3 Hawaiian or other Pacific Islander
0.3 0.3 0.3 0.3 0.3
White 59.6 64.2 63.6 61.7 60.6 More than one race 1.9 2.2 2.3 2.3 2.4
Veteran Status Veteran 7.8 7.5 7.9 7.5 7.2 Disabled veteran 0.9 1.0 0.9 0.9 1.0 Campaign veteran 1.8 2.2 2.3 2.1 2.1 Recently separated veteran 1.0 1.0 0.9 0.8 0.9 Other eligible person 0.2 0.2 0.1 0.1 0.1
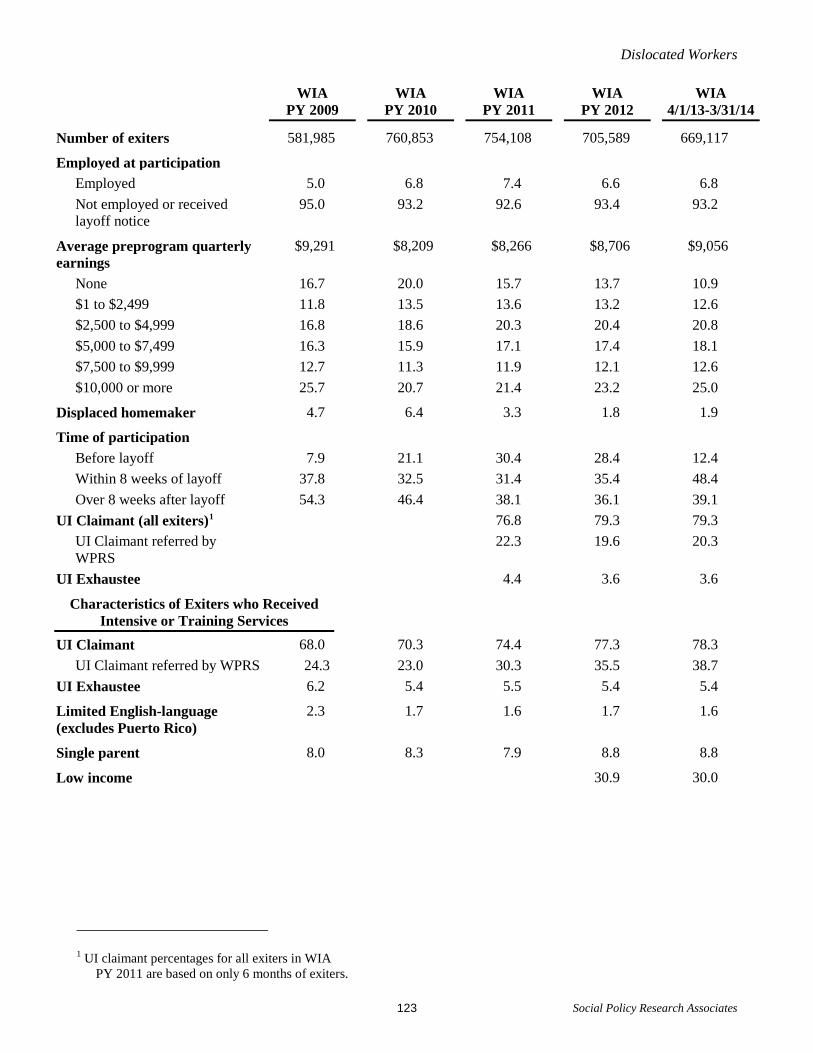
Dislocated Workers
Social Policy Research Associates 123
WIA
PY 2009 WIA
PY 2010 WIA
PY 2011 WIA
PY 2012 WIA
4/1/13-3/31/14
Number of exiters 581,985 760,853 754,108 705,589 669,117
Employed at participation
Employed 5.0 6.8 7.4 6.6 6.8 Not employed or received layoff notice
95.0 93.2 92.6 93.4 93.2
Average preprogram quarterly earnings
$9,291 $8,209 $8,266 $8,706 $9,056
None 16.7 20.0 15.7 13.7 10.9 $1 to $2,499 11.8 13.5 13.6 13.2 12.6 $2,500 to $4,999 16.8 18.6 20.3 20.4 20.8 $5,000 to $7,499 16.3 15.9 17.1 17.4 18.1 $7,500 to $9,999 12.7 11.3 11.9 12.1 12.6 $10,000 or more 25.7 20.7 21.4 23.2 25.0
Displaced homemaker 4.7 6.4 3.3 1.8 1.9
Time of participation Before layoff 7.9 21.1 30.4 28.4 12.4 Within 8 weeks of layoff 37.8 32.5 31.4 35.4 48.4 Over 8 weeks after layoff 54.3 46.4 38.1 36.1 39.1
UI Claimant (all exiters)1 76.8 79.3 79.3 UI Claimant referred by WPRS
22.3 19.6 20.3
UI Exhaustee 4.4 3.6 3.6
Characteristics of Exiters who Received Intensive or Training Services
UI Claimant 68.0 70.3 74.4 77.3 78.3 UI Claimant referred by WPRS 24.3 23.0 30.3 35.5 38.7
UI Exhaustee 6.2 5.4 5.5 5.4 5.4
Limited English-language (excludes Puerto Rico)
2.3 1.7 1.6 1.7 1.6
Single parent 8.0 8.3 7.9 8.8 8.8
Low income 30.9 30.0
1 UI claimant percentages for all exiters in WIA
PY 2011 are based on only 6 months of exiters.

Dislocated Workers
Social Policy Research Associates 124
WIA
PY 2009 WIA
PY 2010 WIA
PY 2011 WIA
PY 2012 WIA
4/1/13-3/31/14
Number of exiters 581,985 760,853 754,108 705,589 669,117
Highest grade completed (avg.) 12.8 12.9 13.0 13.2 13.2 8th or less 2.7 2.7 2.1 1.5 1.5 Some high school 8.4 7.5 6.9 5.8 5.5 High school graduate 38.8 37.6 35.6 35.7 34.5 High school equivalency 6.9 7.4 6.5 5.6 5.2 Some postsecondary 26.4 27.5 29.8 31.3 32.1 College graduate (4-year) 16.7 17.3 19.0 20.0 21.3

Dislocated Workers
Social Policy Research Associates 125
Table III-2 Number of Dislocated Worker Exiters, Trends Over Time
(Derived from PY 2013Q4 WIASRD Records)
WIA
PY 2009 WIA
PY 2010 WIA
PY 2011 WIA
PY 2012 WIA
4/1/13-3/31/14
Number of exiters 581,985 760,853 754,108 705,589 669,117 Statewide programs 20,462 28,730 28,337 17,541 12,685 Local programs 561,923 745,155 732,560 686,766 654,050 National Emergency Grants 23,768 24,987 31,274 27,302 22,281
Disaster Relief 3,020 2,665 4,358 4,054 3,022 Other 20,748 22,322 26,916 23,248 19,259
Characteristics of All Exiters
Age categories
Under 22 22,589 30,961 27,461 21,850 19,374 22 to 29 102,785 140,141 138,743 126,721 118,694 30 to 44 207,624 266,645 261,249 240,912 224,958 45 to 54 152,449 194,743 189,617 175,528 164,533 55 and over 96,536 128,362 137,034 140,576 141,552
Gender Female 259,891 348,365 354,834 335,245 324,022 Male 321,656 411,451 390,607 354,176 334,132
Individual with a disability 16,004 21,474 21,424 21,668 23,148
Race and ethnicity Hispanic 86,200 98,030 93,445 88,649 85,179 Not Hispanic
American Indian or Alaskan Native
5,954 7,266 5,659 5,055 4,722
Asian 21,426 21,570 20,987 19,869 19,100 Black or African American 100,421 117,852 122,540 122,413 121,364 Hawaiian or other Pacific Islander
1,631 2,134 2,031 1,918 1,747
White 333,028 470,875 456,697 408,551 380,226 More than one race 10,546 15,982 16,223 15,388 14,899
Veteran Status Veteran 45,280 57,345 59,268 52,585 47,964 Disabled veteran 4,964 7,232 7,045 6,682 6,559 Campaign veteran 10,425 16,452 17,232 15,144 13,950 Recently separated veteran 5,808 7,668 7,151 5,296 5,837 Other eligible person 1,040 1,149 834 685 683

Dislocated Workers
Social Policy Research Associates 126
WIA
PY 2009 WIA
PY 2010 WIA
PY 2011 WIA
PY 2012 WIA
4/1/13-3/31/14
Number of exiters 581,985 760,853 754,108 705,589 669,117
Employed at participation
Employed 29,162 51,454 55,468 46,385 45,427 Not employed or received layoff notice
552,821 709,397 698,640 659,204 623,690
Average preprogram quarterly earnings
None 97,108 151,749 118,407 96,825 72,516 $1 to $2,499 68,488 102,837 102,534 93,127 83,908 $2,500 to $4,999 97,672 141,188 153,224 144,222 138,169 $5,000 to $7,499 94,876 121,049 128,986 122,425 120,017 $7,500 to $9,999 73,686 86,236 89,448 85,138 84,008 $10,000 or more 149,144 157,449 161,368 163,852 165,945
Displaced homemaker 27,255 48,394 24,748 12,894 12,624
Time of participation Before layoff 29,026 111,394 153,052 126,613 51,542 Within 8 weeks of layoff 139,394 171,926 158,202 157,840 200,693 Over 8 weeks after layoff 200,327 244,873 191,898 160,803 162,233
UI Claimant (all exiters) 390,553 355,493 UI Claimant referred by WPRS
96,392 90,997
UI Exhaustee 17,898 15,994
Characteristics of Exiters who Received Intensive or Training Services
UI Claimant 213,261 260,679 224,006 167,335 148,864 UI Claimant referred by WPRS
76,322 85,305 91,371 76,889 73,558
UI Exhaustee 19,573 19,900 16,576 11,779 10,225
Limited English-language (excludes Puerto Rico)
7,014 6,047 4,701 3,617 3,014
Single parent 24,812 30,188 23,333 18,815 16,468
Low income 48,902 38,927
Highest grade completed (avg.) 8th or less 8,461 9,960 6,444 3,350 2,917 Some high school 26,066 27,878 20,790 12,644 10,366 High school graduate 120,486 138,812 107,219 77,611 65,579 High school equivalency 21,543 27,396 19,658 12,262 9,828 Some postsecondary 81,819 101,579 89,604 68,028 60,931 College graduate (4-year) 51,863 63,984 57,307 43,347 40,457

Dislocated Workers
Social Policy Research Associates 127
Table III-3 Characteristics of Dislocated Worker Exiters from April 2013 to March 2014, by Funding Source
(Derived from PY 2013Q4 WIASRD Records)
Formula Funds
All Exiters All Local Statewide NEG
Number of exiters 669,117 658,970 654,050 12,685 22,281 Statewide programs 12,685 12,685 7,765 12,685 4,022 Local programs 654,050 654,050 654,050 7,765 10,191 National Emergency Grants 22,281 12,134 10,191 4,022 22,281
Disaster Relief 3,022 724 679 84 3,022 Other 19,259 11,410 9,512 3,938 19,259
Characteristics of All Exiters
Age categories
Under 22 2.9 2.9 2.9 1.7 2.6 22 to 29 17.7 17.8 17.8 12.4 13.7 30 to 44 33.6 33.6 33.6 34.7 34.2 45 to 54 24.6 24.5 24.5 32.1 30.7 55 and over 21.2 21.2 21.2 19.1 18.8
Gender
Female 49.2 49.5 49.5 44.3 37.0 Male 50.8 50.5 50.5 55.7 63.0
Individual with a disability 3.6 3.6 3.6 3.9 3.2
Race and ethnicity Hispanic 13.6 13.6 13.6 11.1 11.4 Not Hispanic
American Indian or Alaskan Native
0.8 0.7 0.7 1.8 2.0
Asian 3.0 3.0 3.0 3.8 3.7 Black or African American 19.3 19.3 19.3 14.1 18.2 Hawaiian or other Pacific Islander
0.3 0.3 0.3 0.3 0.3
White 60.6 60.6 60.6 68.0 63.0 More than one race 2.4 2.4 2.4 0.9 1.5
Veteran Status Veteran 7.2 7.1 7.1 11.1 10.5 Disabled veteran 1.0 1.0 1.0 1.7 1.7 Campaign veteran 2.1 2.0 2.0 4.8 4.5 Recently separated veteran 0.9 0.9 0.8 2.1 1.2 Other eligible person 0.1 0.1 0.1 0.1 0.1

Dislocated Workers
Social Policy Research Associates 128
Formula Funds
All Exiters All Local Statewide NEG
Number of exiters 669,117 658,970 654,050 12,685 22,281
Employed at participation Employed 6.8 6.6 6.7 3.9 10.0 Not employed or received layoff notice
93.2 93.4 93.3 96.1 90.0
Average preprogram quarterly earnings
$9,056 $9,015 $8,994 $11,769 $12,284
None 10.9 10.6 10.5 15.3 23.7 $1 to $2,499 12.6 12.7 12.7 5.8 8.3 $2,500 to $4,999 20.8 21.0 21.1 10.2 8.8 $5,000 to $7,499 18.1 18.2 18.3 14.4 10.2 $7,500 to $9,999 12.6 12.7 12.7 14.2 10.0 $10,000 or more 25.0 24.8 24.7 40.1 39.1
Displaced homemaker 1.9 1.9 1.9 2.2 1.3
Time of participation
Before layoff 12.4 12.3 12.3 21.5 20.5 Within 8 weeks of layoff 48.4 49.0 49.2 28.0 23.2 Over 8 weeks after layoff 39.1 38.7 38.5 50.5 56.2
UI Claimant (all exiters) 79.3 80.1 80.5 62.1 53.9 UI Claimant referred by WPRS
20.3 20.6 20.7 12.7 11.8
UI Exhaustee 3.6 3.5 3.5 2.9 5.2
Characteristics of Exiters who Received Intensive or Training Services
UI Claimant 78.3 80.1 81.0 62.2 54.0 UI Claimant referred by WPRS
38.7 40.3 41.1 12.7 11.3
UI Exhaustee 5.4 5.4 5.5 2.9 5.2
Limited English-language (excludes Puerto Rico)
1.6 1.6 1.5 3.2 2.3
Single parent 8.8 8.8 8.9 9.8 8.3
Low income 30.0 30.4 31.2 12.9 24.7

Dislocated Workers
Social Policy Research Associates 129
Formula Funds
All Exiters All Local Statewide NEG
Number of exiters 669,117 658,970 654,050 12,685 22,281
Highest grade completed (avg.) 13.2 13.2 13.3 13.0 13.1 8th or less 1.5 1.5 1.5 1.6 1.7 Some high school 5.5 5.4 5.4 4.0 5.5 High school graduate 34.5 34.4 34.1 43.4 39.9 High school equivalency 5.2 5.1 5.1 5.6 5.6 Some postsecondary 32.1 32.5 32.6 30.7 27.7 College graduate (4-year) 21.3 21.2 21.3 14.7 19.6

Dislocated Workers
Social Policy Research Associates 130
Table III-4 Characteristics of Dislocated Worker Exiters from April 2013 to March 2014, by Type of NEG Project
(Derived from PY 2013Q4 WIASRD Records)
All Exiters Formula
Funds NEG
All Disaster Relief Other
Number of exiters 669,117 658,970 22,281 3,022 19,259 Statewide programs 12,685 12,685 4,022 84 3,938 Local programs 654,050 654,050 10,191 679 9,512 National Emergency Grants 22,281 12,134 22,281 3,022 19,259
Disaster Relief 3,022 724 3,022 3,022 0 Other 19,259 11,410 19,259 0 19,259
Characteristics of All Exiters
Age categories
Under 22 2.9 2.9 2.6 7.6 1.8 22 to 29 17.7 17.8 13.7 21.0 12.6 30 to 44 33.6 33.6 34.2 32.4 34.5 45 to 54 24.6 24.5 30.7 23.9 31.8 55 and over 21.2 21.2 18.8 15.2 19.3
Gender
Female 49.2 49.5 37.0 27.0 38.6
Male 50.8 50.5 63.0 73.0 61.4
Individual with a disability 3.6 3.6 3.2 2.1 3.3
Race and ethnicity
Hispanic 13.6 13.6 11.4 6.4 12.3 Not Hispanic
American Indian or Alaskan Native
0.8 0.7 2.0 0.6 2.2
Asian 3.0 3.0 3.7 2.5 3.9 Black or African American 19.3 19.3 18.2 36.2 15.2 Hawaiian or other Pacific Islander
0.3 0.3 0.3 0.0 0.3
White 60.6 60.6 63.0 52.6 64.7 More than one race 2.4 2.4 1.5 1.7 1.4
Veteran Status
Veteran 7.2 7.1 10.5 7.5 11.0 Disabled veteran 1.0 1.0 1.7 1.0 1.8 Campaign veteran 2.1 2.0 4.5 2.6 4.8 Recently separated veteran 0.9 0.9 1.2 1.0 1.3 Other eligible person 0.1 0.1 0.1 0.1 0.2
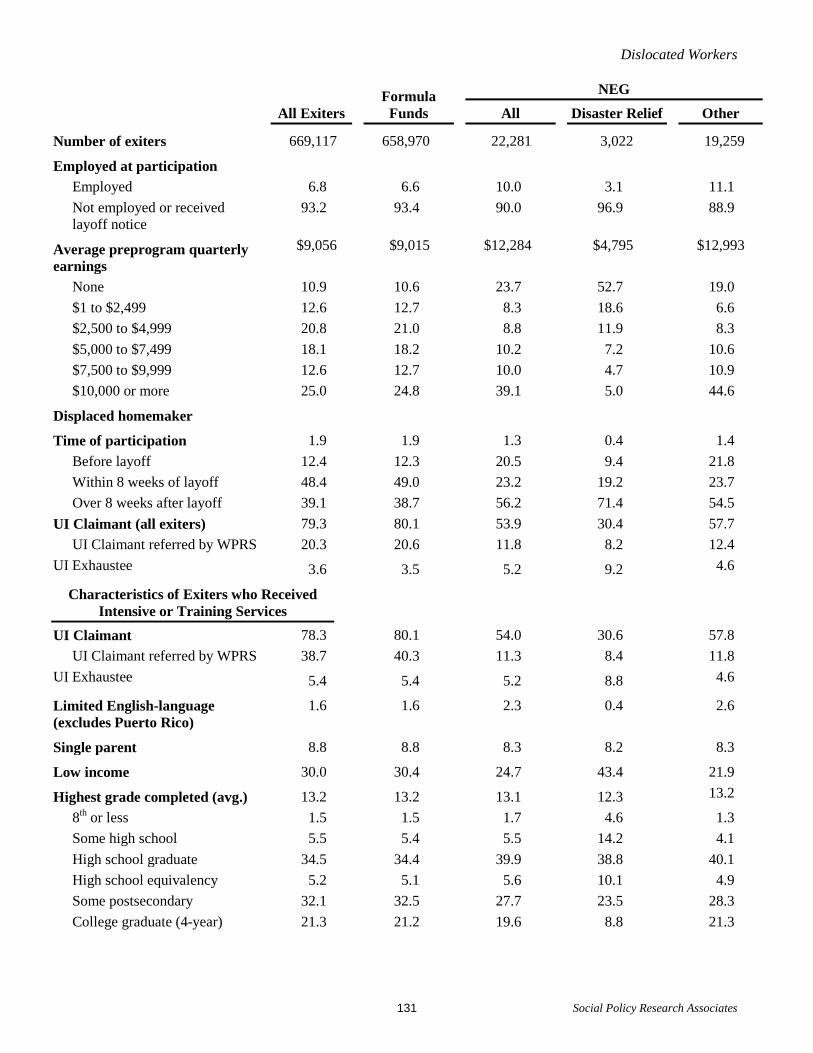
Dislocated Workers
Social Policy Research Associates 131
All Exiters
Formula Funds
NEG
All Disaster Relief Other
Number of exiters 669,117 658,970 22,281 3,022 19,259
Employed at participation
Employed 6.8 6.6 10.0 3.1 11.1 Not employed or received layoff notice
93.2 93.4 90.0 96.9 88.9
Average preprogram quarterly earnings
$9,056 $9,015 $12,284 $4,795 $12,993
None 10.9 10.6 23.7 52.7 19.0 $1 to $2,499 12.6 12.7 8.3 18.6 6.6 $2,500 to $4,999 20.8 21.0 8.8 11.9 8.3 $5,000 to $7,499 18.1 18.2 10.2 7.2 10.6 $7,500 to $9,999 12.6 12.7 10.0 4.7 10.9 $10,000 or more 25.0 24.8 39.1 5.0 44.6
Displaced homemaker
Time of participation 1.9 1.9 1.3 0.4 1.4 Before layoff 12.4 12.3 20.5 9.4 21.8 Within 8 weeks of layoff 48.4 49.0 23.2 19.2 23.7 Over 8 weeks after layoff 39.1 38.7 56.2 71.4 54.5
UI Claimant (all exiters) 79.3 80.1 53.9 30.4 57.7 UI Claimant referred by WPRS 20.3 20.6 11.8 8.2 12.4
UI Exhaustee 3.6 3.5 5.2 9.2 4.6
Characteristics of Exiters who Received Intensive or Training Services
UI Claimant 78.3 80.1 54.0 30.6 57.8 UI Claimant referred by WPRS 38.7 40.3 11.3 8.4 11.8
UI Exhaustee 5.4 5.4 5.2 8.8 4.6
Limited English-language (excludes Puerto Rico)
1.6 1.6 2.3 0.4 2.6
Single parent 8.8 8.8 8.3 8.2 8.3
Low income 30.0 30.4 24.7 43.4 21.9
Highest grade completed (avg.) 13.2 13.2 13.1 12.3 13.2
8th or less 1.5 1.5 1.7 4.6 1.3 Some high school 5.5 5.4 5.5 14.2 4.1 High school graduate 34.5 34.4 39.9 38.8 40.1 High school equivalency 5.2 5.1 5.6 10.1 4.9 Some postsecondary 32.1 32.5 27.7 23.5 28.3 College graduate (4-year) 21.3 21.2 19.6 8.8 21.3

Dislocated Workers
Social Policy Research Associates 132
Table III-5 Characteristics of Dislocated Worker Exiters from April 2013 to March 2014, by Age
(Derived from PY 2013Q4 WIASRD Records) Age at Participation
Under 22 22 to 29 30 – 44 45 – 54 55 and Over
Number of exiters 19,374 118,694 224,958 164,533 141,552 Statewide programs 217 1,568 4,404 4,078 2,418 Local programs 18,853 116,452 219,952 160,032 138,755 National Emergency Grants 585 3,062 7,618 6,838 4,178
Disaster Relief 230 634 979 721 458 Other 355 2,428 6,639 6,117 3,720
Characteristics of All Exiters
Age categories
Under 22 100.0 0.0 0.0 0.0 0.0 22 to 29 0.0 100.0 0.0 0.0 0.0 30 to 44 0.0 0.0 100.0 0.0 0.0 45 to 54 0.0 0.0 0.0 100.0 0.0 55 and over 0.0 0.0 0.0 0.0 100.0
Gender
Female 49.8 47.9 49.4 50.3 48.7 Male 50.2 52.1 50.6 49.7 51.3
Individual with a disability 2.1 2.6 3.2 4.1 4.8
Race and ethnicity Hispanic 19.1 17.4 15.2 12.0 8.8 Not Hispanic
American Indian or Alaskan Native
1.0 0.7 0.8 0.8 0.6
Asian 1.1 2.1 3.2 3.3 3.5 Black or African American 27.4 24.8 21.2 17.9 12.4 Hawaiian or other Pacific Islander
0.3 0.3 0.4 0.3 0.2
White 47.7 51.7 56.6 63.8 72.7 More than one race 3.3 3.0 2.6 2.1 1.8
Veteran Status Veteran 2.5 5.9 5.1 7.4 11.9 Disabled veteran 0.2 0.8 1.0 0.9 1.3 Campaign veteran 0.5 2.4 1.9 1.5 3.1 Recently separated veteran 1.2 2.6 0.7 0.3 0.3 Other eligible person 0.2 0.1 0.1 0.1 0.2

Dislocated Workers
Social Policy Research Associates 133
Age at Participation
Under 22 22 to 29 30 – 44 45 – 54 55 and Over
Number of exiters 19,374 118,694 224,958 164,533 141,552
Employed at participation
Employed 7.3 7.1 6.9 6.9 6.1 Not employed or received layoff notice
92.7 92.9 93.1 93.1 93.9
Average preprogram quarterly earnings
$3,538 $5,775 $8,933 $10,618 $10,913
None 13.3 11.1 11.0 11.3 9.9 $1 to $2,499 33.2 17.7 11.4 10.0 10.6 $2,500 to $4,999 36.1 28.5 20.0 17.6 17.3 $5,000 to $7,499 12.2 20.7 18.9 17.2 16.4 $7,500 to $9,999 3.1 11.0 13.7 13.4 12.8 $10,000 or more 2.0 11.1 25.1 30.7 33.0
Displaced homemaker 8.8 2.4 1.8 1.5 1.0
Time of participation Before layoff 10.9 11.0 12.4 13.3 12.7 Within 8 weeks of layoff 54.3 51.4 47.8 46.3 48.9 Over 8 weeks after layoff 34.8 37.6 39.8 40.4 38.4
UI Claimant (all exiters) 69.6 78.4 79.3 79.3 81.4 UI Claimant referred by WPRS
13.2 18.6 19.0 20.7 24.4
UI Exhaustee 1.3 2.6 3.8 4.1 3.6
Characteristics of Exiters who Received Intensive or Training Services
UI Claimant 66.0 77.0 77.9 78.0 81.3 UI Claimant referred by WPRS
36.6 41.9 36.3 35.4 45.0
UI Exhaustee 2.5 4.6 5.9 5.7 4.9
Limited English-language (excludes Puerto Rico)
0.5 0.9 1.6 2.0 1.7
Single parent 7.5 10.8 13.6 7.0 2.3
Low income 45.4 38.3 33.1 26.3 23.0
Highest grade completed (avg.) 12.2 13.0 13.2 13.3 13.5 8th or less 0.8 0.9 1.3 1.7 2.2 Some high school 9.4 6.7 5.8 5.1 4.2 High school graduate 53.3 37.6 33.5 34.9 31.7 High school equivalency 5.7 5.8 6.3 5.2 2.9 Some postsecondary 30.2 34.3 33.0 30.7 31.0 College graduate (4-year) 0.6 14.7 20.1 22.4 28.1

Dislocated Workers
Social Policy Research Associates 134
Table III-6 Characteristics of Dislocated Worker Exiters from April 2013 to March 2014, by Ethnicity and Race
(Derived from PY 2013Q4 WIASRD Records) Hispanic Not Hispanic
All Black White Other
Number of exiters 85,179 542,058 121,364 380,226 40,468 Statewide programs 1,283 10,318 1,631 7,893 794 Local programs 83,631 529,458 118,591 371,418 39,449 National Emergency Grants 2,342 18,124 3,716 12,888 1,520
Disaster Relief 185 2,716 1,049 1,527 140 Other 2,157 15,408 2,667 11,361 1,380
Characteristics of All Exiters
Age categories
Under 22 4.1 2.8 4.2 2.3 2.6 22 to 29 22.8 17.0 22.8 15.2 16.9 30 to 44 37.7 32.9 36.8 31.3 36.3 45 to 54 21.7 25.0 22.7 25.9 24.3 55 and over 13.6 22.3 13.5 25.3 19.8
Gender
Female 49.9 49.1 55.0 47.3 48.6 Male 50.1 50.9 45.0 52.7 51.4
Individual with a disability 3.1 3.7 3.4 3.7 4.0
Race and ethnicity Hispanic 100.0 0.0 0.0 0.0 0.0 Not Hispanic
American Indian or Alaskan Native
0.0 0.9 0.0 0.0 11.7
Asian 0.0 3.5 0.0 0.0 47.2 Black or African American 0.0 22.4 100.0 0.0 0.0 Hawaiian or other Pacific Islander
0.0 0.3 0.0 0.0 4.3
White 0.0 70.1 0.0 100.0 0.0 More than one race 0.0 2.7 0.0 0.0 36.8
Veteran Status Veteran 4.5 7.7 5.5 8.6 5.4 Disabled veteran 0.6 1.0 0.7 1.2 0.9 Campaign veteran 1.2 2.3 1.2 2.6 1.7 Recently separated veteran 0.6 0.9 0.6 1.1 0.9 Other eligible person 0.1 0.1 0.1 0.1 0.1

Dislocated Workers
Social Policy Research Associates 135
Hispanic Not Hispanic
All Black White Other
Number of exiters 85,179 542,058 121,364 380,226 40,468
Employed at participation
Employed 4.6 7.3 6.8 7.6 6.7 Not employed or received layoff notice
95.4 92.7 93.2 92.4 93.3
Average preprogram quarterly earnings
$7,284 $9,143 $6,503 $9,893 $9,776
None 13.1 10.4 12.8 9.4 12.5 $1 to $2,499 14.7 12.5 18.2 10.6 12.9 $2,500 to $4,999 23.7 20.6 25.5 19.1 20.1 $5,000 to $7,499 18.8 18.1 18.4 18.2 16.8 $7,500 to $9,999 11.8 12.8 10.7 13.7 11.1 $10,000 or more 17.9 25.5 14.5 28.9 26.6
Displaced homemaker 1.9 1.9 1.5 2.0 2.5
Time of participation Before layoff 8.0 13.1 14.3 12.9 11.1 Within 8 weeks of layoff 42.6 49.2 39.8 51.7 48.0 Over 8 weeks after layoff 49.3 37.7 45.9 35.4 40.9
UI Claimant (all exiters) 76.6 79.7 80.6 79.8 75.7 UI Claimant referred by WPRS
24.0 19.9 22.2 19.7 15.5
UI Exhaustee 5.5 3.3 4.2 3.0 3.8
Characteristics of Exiters who Received Intensive or Training Services
UI Claimant 79.0 77.9 74.4 79.2 76.0 UI Claimant referred by WPRS
36.7 39.5 37.0 40.8 33.1
UI Exhaustee 6.9 5.1 8.2 4.2 5.1
Limited English-language (excludes Puerto Rico)
6.1 0.9 0.8 0.4 5.9
Single parent 10.9 8.4 14.3 6.6 8.3
Low income 42.4 27.5 37.9 24.0 28.9
Highest grade completed (avg.) 12.5 13.3 13.2 13.4 13.5 8th or less 4.9 1.0 1.1 0.8 3.2 Some high school 10.7 4.7 6.2 4.1 5.9 High school graduate 37.2 34.2 34.6 34.7 27.6 High school equivalency 5.5 5.3 5.0 5.5 3.9 Some postsecondary 28.0 32.9 35.7 32.4 28.6 College graduate (4-year) 13.7 21.9 17.4 22.4 30.7

Dislocated Workers
Social Policy Research Associates 136
Table III-7 Characteristics of Dislocated Worker Exiters from April 2013 to March 2014,
by Employment at Participation, Gender, and Disability (Derived from PY 2013Q4 WIASRD Records)
Employed at Participation Gender With a
Disability Yes No Male Female
Number of exiters 45,427 623,690 334,132 324,022 23,148
Statewide programs 499 12,186 6,419 5,113 476 Local programs 43,560 610,490 324,949 318,861 22,703 National Emergency Grants 2,234 20,047 13,014 7,628 675
Disaster Relief 95 2,927 2,196 814 59 Other 2,139 17,120 10,818 6,814 616
Characteristics of All Exiters
Age categories
Under 22 3.1 2.9 2.9 2.9 1.7 22 to 29 18.5 17.7 18.3 17.4 12.7 30 to 44 34.3 33.6 33.5 33.7 29.8 45 to 54 24.9 24.6 24.0 25.0 28.1 55 and over 19.2 21.3 21.3 20.9 27.7
Gender
Female 48.8 49.3 0.0 100.0 44.5 Male 51.2 50.7 100.0 0.0 55.5
Individual with a disability 3.9 3.6 3.9 3.3 100.0
Race and ethnicity
Hispanic 9.1 13.9 13.0 13.4 11.6 Not Hispanic
American Indian or Alaskan Native
1.0 0.7 0.8 0.8 1.1
Asian 1.7 3.1 3.1 3.0 1.7 Black or African American 18.8 19.4 17.2 21.7 17.9 Hawaiian or other Pacific Islander 0.3 0.3 0.3 0.3 0.2 White 65.9 60.2 63.2 58.5 63.4 More than one race 3.2 2.3 2.4 2.4 4.1
Veteran Status
Veteran 8.5 7.1 12.7 1.5 18.1 Disabled veteran 1.4 1.0 1.7 0.2 10.7 Campaign veteran 3.0 2.0 3.8 0.3 7.1 Recently separated veteran 1.1 0.9 1.5 0.2 2.6 Other eligible person 0.1 0.1 0.1 0.1 0.3

Dislocated Workers
Social Policy Research Associates 137
Employed at Participation Gender With a Disability Yes No Male Female
Number of exiters 45,427 623,690 334,132 324,022 23,148
Employed at participation
Employed 100.0 0.0 6.9 6.8 7.3 Not employed or received layoff notice
0.0 100.0 93.1 93.2 92.7
Average preprogram quarterly earnings
$6,665 $9,238 $10,057 $7,981 $7,124
None 7.3 11.2 11.1 10.3 17.8 $1 to $2,499 16.6 12.3 10.8 14.6 18.4 $2,500 to $4,999 26.4 20.4 18.8 23.2 21.3 $5,000 to $7,499 20.1 17.9 17.6 18.7 15.3 $7,500 to $9,999 12.6 12.6 13.0 12.3 10.3 $10,000 or more 17.0 25.6 28.7 20.9 17.0
Displaced homemaker 3.2 1.8 1.5 2.3 4.0
Time of participation
Before layoff 24.6 11.3 11.9 12.7 8.7 Within 8 weeks of layoff 52.8 48.0 49.3 48.7 42.8 Over 8 weeks after layoff 22.6 40.6 38.8 38.6 48.5
UI Claimant (all exiters) 69.2 80.2 78.6 80.1 70.3 UI Claimant referred by WPRS 9.1 21.3 19.4 21.8 18.5
UI Exhaustee 2.6 3.7 3.4 3.4 6.9
Characteristics of Exiters who Received Intensive or Training Services
UI Claimant 52.6 79.6 77.2 79.5 75.1 UI Claimant referred by WPRS 27.5 39.3 38.8 41.4 37.8
UI Exhaustee 5.8 5.4 5.2 5.2 7.4
Limited English-language (excludes Puerto Rico)
1.3 1.6 1.3 1.5 1.4
Single parent 10.2 8.7 4.3 12.9 7.3
Low income 26.7 30.2 27.0 31.4 37.7
Highest grade completed (avg.) 13.4 13.2 13.2 13.3 13.2 8th or less 1.0 1.6 1.5 1.5 2.0 Some high school 3.6 5.5 6.3 4.5 6.1 High school graduate 34.2 34.5 35.9 32.2 32.0 High school equivalency 4.9 5.2 5.8 4.7 5.0 Some postsecondary 35.1 31.9 30.2 34.7 35.0 College graduate (4-year) 21.1 21.3 20.3 22.4 19.9

Dislocated Workers
Social Policy Research Associates 138
Table III-8 Characteristics of Dislocated Worker Exiters from April 2013 to March 2014, by Veteran Status
(Derived from PY 2013Q4 WIASRD Records)
All Exiters Veteran Campaign Veteran
Recently Separated Veteran
Disabled Veteran
Number of exiters 669,117 47,964 13,950 5,837 6,559 Statewide programs 12,685 1,404 606 272 213 Local programs 654,050 46,172 13,106 5,457 6,233 National Emergency Grants 22,281 2,347 995 275 372
Disaster Relief 3,022 228 80 29 29 Other 19,259 2,119 915 246 343
Characteristics of All Exiters
Age categories
Under 22 2.9 1.0 0.7 3.9 0.5 22 to 29 17.7 14.7 20.6 52.5 14.9 30 to 44 33.6 23.8 30.2 28.8 32.9 45 to 54 24.6 25.4 17.1 8.7 23.7 55 and over 21.2 35.1 31.5 6.2 27.9
Gender
Female 49.2 10.0 7.1 11.9 11.7 Male 50.8 90.0 92.9 88.1 88.3
Individual with a disability 3.6 9.1 12.1 10.8 41.5
Race and ethnicity
Hispanic 13.6 8.5 7.5 9.5 8.1 Not Hispanic
American Indian or Alaskan Native
0.8 0.9 1.1 0.9 1.1
Asian 3.0 1.0 1.0 1.9 1.0 Black or African American 19.3 14.7 11.1 12.2 13.0 Hawaiian or other Pacific Islander 0.3 0.3 0.4 0.5 0.4 White 60.6 72.0 76.1 71.7 73.3 More than one race 2.4 2.6 2.8 3.2 3.1
Veteran Status
Veteran 7.2 100.0 100.0 100.0 100.0 Disabled veteran 1.0 13.7 19.5 17.9 100.0 Campaign veteran 2.1 29.1 100.0 51.7 41.5 Recently separated veteran 0.9 12.2 21.6 100.0 15.9 Other eligible person 0.1 0.0 0.0 0.0 0.0

Dislocated Workers
Social Policy Research Associates 139
All Exiters Veteran Campaign Veteran
Recently Separated Veteran
Disabled Veteran
Number of exiters 669,117 47,964 13,950 5,837 6,559
Employed at participation
Employed 6.8 8.1 9.8 8.7 9.6 Not employed or received layoff notice
93.2 91.9 90.2 91.3 90.4
Average preprogram quarterly earnings
$9,056 $10,242 $10,614 $11,744 $10,792
None 10.9 18.7 19.4 17.7 20.2 $1 to $2,499 12.6 9.1 8.0 7.0 8.0 $2,500 to $4,999 20.8 14.3 13.1 10.6 12.9 $5,000 to $7,499 18.1 14.5 13.1 9.9 12.4 $7,500 to $9,999 12.6 11.9 11.4 8.6 11.4 $10,000 or more 25.0 31.4 34.9 46.3 35.2
Displaced homemaker 1.9 1.6 1.9 2.6 2.0
Time of participation
Before layoff 12.4 14.4 14.7 13.0 15.1 Within 8 weeks of layoff 48.4 45.9 44.6 41.5 45.9 Over 8 weeks after layoff 39.1 39.7 40.7 45.6 39.0
UI Claimant (all exiters) 79.3 75.6 71.0 65.3 72.2 UI Claimant referred by WPRS 20.3 24.7 15.2 15.3 23.2
UI Exhaustee 3.6 4.2 4.7 3.6 4.6
Characteristics of Exiters who Received Intensive or Training Services
UI Claimant 78.3 76.6 68.3 64.6 73.3 UI Claimant referred by WPRS 38.7 44.4 29.6 33.8 43.8
UI Exhaustee 5.4 5.6 7.2 6.4 5.9
Limited English-language (excludes Puerto Rico)
1.6 0.4 0.3 0.6 0.3
Single parent 8.8 4.1 4.7 5.0 4.4
Low income 30.0 25.8 26.0 25.0 23.5
Highest grade completed (avg.) 13.2 13.4 13.5 13.2 13.7 8th or less 1.5 0.5 0.2 0.5 0.5 Some high school 5.5 2.0 1.0 1.2 1.2 High school graduate 34.5 35.1 33.8 41.3 28.4 High school equivalency 5.2 3.7 3.3 4.4 2.3 Some postsecondary 32.1 39.8 40.7 36.7 43.5 College graduate (4-year) 21.3 18.9 20.9 15.8 24.1
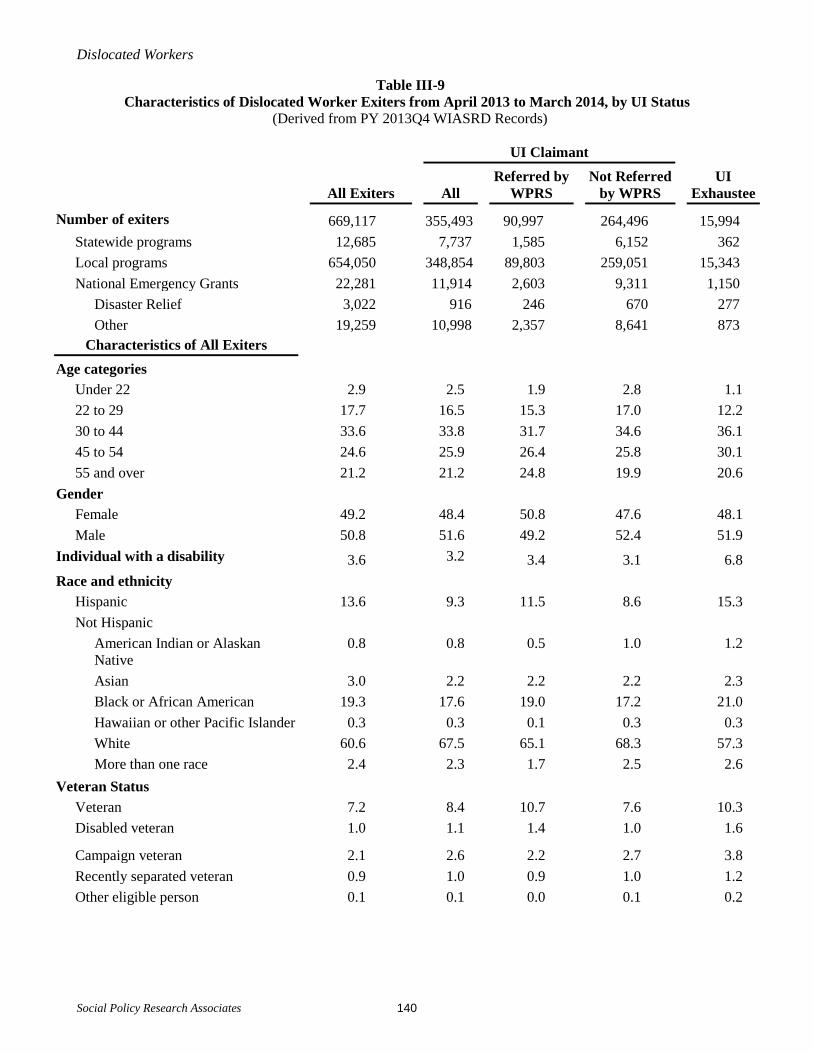
Dislocated Workers
Social Policy Research Associates 140
Table III-9 Characteristics of Dislocated Worker Exiters from April 2013 to March 2014, by UI Status
(Derived from PY 2013Q4 WIASRD Records)
All Exiters
UI Claimant UI
Exhaustee All Referred by
WPRS Not Referred
by WPRS
Number of exiters 669,117 355,493 90,997 264,496 15,994 Statewide programs 12,685 7,737 1,585 6,152 362 Local programs 654,050 348,854 89,803 259,051 15,343 National Emergency Grants 22,281 11,914 2,603 9,311 1,150
Disaster Relief 3,022 916 246 670 277 Other 19,259 10,998 2,357 8,641 873
Characteristics of All Exiters Age categories
Under 22 2.9 2.5 1.9 2.8 1.1 22 to 29 17.7 16.5 15.3 17.0 12.2 30 to 44 33.6 33.8 31.7 34.6 36.1 45 to 54 24.6 25.9 26.4 25.8 30.1 55 and over 21.2 21.2 24.8 19.9 20.6
Gender Female 49.2 48.4 50.8 47.6 48.1 Male 50.8 51.6 49.2 52.4 51.9
Individual with a disability 3.6 3.2 3.4 3.1 6.8 Race and ethnicity
Hispanic 13.6 9.3 11.5 8.6 15.3 Not Hispanic
American Indian or Alaskan Native
0.8 0.8 0.5 1.0 1.2
Asian 3.0 2.2 2.2 2.2 2.3 Black or African American 19.3 17.6 19.0 17.2 21.0 Hawaiian or other Pacific Islander 0.3 0.3 0.1 0.3 0.3 White 60.6 67.5 65.1 68.3 57.3 More than one race 2.4 2.3 1.7 2.5 2.6
Veteran Status Veteran 7.2 8.4 10.7 7.6 10.3 Disabled veteran 1.0 1.1 1.4 1.0 1.6
Campaign veteran 2.1 2.6 2.2 2.7 3.8 Recently separated veteran 0.9 1.0 0.9 1.0 1.2 Other eligible person 0.1 0.1 0.0 0.1 0.2

Dislocated Workers
Social Policy Research Associates 141
All Exiters
UI Claimant UI
Exhaustee All Referred by
WPRS Not Referred
by WPRS
Number of exiters 669,117 355,493 90,997 264,496 15,994
Employed at participation
Employed 6.8 7.4 3.8 8.6 6.2 Not employed or received layoff notice
93.2 92.6 96.2 91.4 93.8
Average preprogram quarterly earnings
$9,056 $8,467 $10,145 $7,885 $5,362
None 10.9 7.9 6.9 8.3 53.1 $1 to $2,499 12.6 11.6 8.2 12.8 17.1 $2,500 to $4,999 20.8 22.2 18.1 23.6 11.6 $5,000 to $7,499 18.1 20.2 19.9 20.3 7.3 $7,500 to $9,999 12.6 13.8 15.6 13.2 4.8 $10,000 or more 25.0 24.3 31.4 21.9 6.2
Displaced homemaker 1.9 0.2 0.2 0.2 0.7
Time of participation
Before layoff 12.4 11.9 15.8 11.1 3.7 Within 8 weeks of layoff 48.4 50.3 47.6 50.8 12.2 Over 8 weeks after layoff 39.1 37.9 36.6 38.1 84.1
UI Claimant (all exiters) 79.3 100.0 100.0 100.0 0.0 UI Claimant referred by WPRS 20.3 25.6 100.0 0.0 0.0
UI Exhaustee 3.6 0.0 0.0 0.0 100.0
Characteristics of Exiters who Received Intensive or Training Services
UI Claimant 78.3 100.0 100.0 100.0 0.0 UI Claimant referred by WPRS 38.7 49.4 100.0 0.0 0.0
UI Exhaustee 5.4 0.0 0.0 0.0 100.0
Limited English-language (excludes Puerto Rico)
1.6 1.6 0.9 2.4 1.9
Single parent 8.8 8.2 5.2 11.2 12.4
Low income 30.0 28.3 25.5 29.4 47.7
Highest grade completed (avg.) 13.2 13.3 13.3 13.2 13.2 8th or less 1.5 1.6 1.9 1.3 1.3 Some high school 5.5 5.4 5.8 5.1 5.1 High school graduate 34.5 34.1 30.3 37.7 33.9 High school equivalency 5.2 4.7 3.3 6.1 7.1 Some postsecondary 32.1 32.1 34.3 30.1 34.3 College graduate (4-year) 21.3 22.1 24.5 19.7 18.3

Dislocated Workers
Social Policy Research Associates 142
Table III-10 Characteristics of Dislocated Worker Exiters from April 2013 to March 2014 who Received Intensive or Training Services, by Highest Grade Completed
(Derived from PY 2013Q4 WIASRD Records)
With Intensive or Training
Services
Less than High
School
High School
Graduate
Some Post-
secondary College
Graduate
Number of exiters 190,824 13,283 75,407 60,931 40,457 Statewide programs 11,877 660 5,805 3,636 1,743 Local programs 176,704 12,091 69,059 57,332 37,549 National Emergency Grants 21,244 1,530 9,631 5,854 4,148
Disaster Relief 2,876 537 1,400 673 251 Other 18,368 993 8,231 5,181 3,897
Characteristics of All Exiters Age categories
Under 22 2.0 3.0 3.0 1.9 0.1 22 to 29 14.5 15.8 15.8 15.5 10.0 30 to 44 33.6 34.2 33.6 34.6 31.7 45 to 54 28.7 27.8 29.1 27.5 30.2 55 and over 21.2 19.3 18.5 20.5 27.9
Gender
Female 48.3 41.7 45.3 51.8 50.9 Male 51.7 58.3 54.7 48.2 49.1
Individual with a disability 3.8 4.4 3.5 4.2 3.6
Race and ethnicity Hispanic 14.3 31.4 15.2 12.4 9.4 Not Hispanic
American Indian or Alaskan Native
0.8 1.5 0.9 0.8 0.4
Asian 3.0 3.6 1.8 2.2 6.3 Black or African American 18.6 19.1 18.4 20.6 15.6 Hawaiian or other Pacific Islander 0.2 0.2 0.3 0.2 0.3 White 61.5 42.2 62.0 62.0 66.6 More than one race 1.6 1.9 1.5 1.8 1.4
Veteran Status Veteran 10.2 3.6 10.0 12.6 9.0 Disabled veteran 1.4 0.3 1.1 1.9 1.6 Campaign veteran 2.8 0.5 2.7 3.6 2.8 Recently separated veteran 1.1 0.3 1.2 1.2 0.8 Other eligible person 0.1 0.0 0.1 0.1 0.1

Dislocated Workers
Social Policy Research Associates 143
With Intensive or Training
Services
Less than High
School
High School
Graduate
Some Post-
secondary College
Graduate
Number of exiters 190,824 13,283 75,407 60,931 40,457
Employed at participation
Employed 4.9 3.3 4.8 5.4 4.8 Not employed or received layoff notice
95.1 96.7 95.2 94.6 95.2
Average preprogram quarterly earnings
$9,906 $6,492 $7,901 $8,996 $15,812
None 17.0 17.6 18.8 17.0 13.8 $1 to $2,499 9.5 13.8 10.6 9.8 5.9 $2,500 to $4,999 15.0 23.8 16.8 15.1 8.4 $5,000 to $7,499 16.3 19.4 18.3 17.0 10.6 $7,500 to $9,999 13.5 11.7 14.3 14.2 11.3 $10,000 or more 28.7 13.7 21.2 27.0 49.9
Displaced homemaker 1.1 1.5 1.2 1.2 0.8
Time of participation Before layoff 10.7 9.2 11.0 10.6 10.9 Within 8 weeks of layoff 31.8 33.9 30.5 32.2 32.7 Over 8 weeks after layoff 57.5 56.8 58.5 57.2 56.4
UI Claimant (all exiters) 78.3 78.2 76.6 78.6 81.1 UI Claimant referred by WPRS 38.7 42.3 32.7 41.3 44.3
UI Exhaustee 5.4 5.0 5.6 5.8 4.6
Characteristics of Exiters who Received Intensive or Training Services
UI Claimant 78.3 78.2 76.6 78.6 81.1 UI Claimant referred by WPRS 38.7 42.3 32.7 41.3 44.3
UI Exhaustee 5.4 5.0 5.6 5.8 4.6
Limited English-language (excludes Puerto Rico)
1.6 9.3 1.6 0.6 0.6
Single parent 8.8 9.0 10.4 9.4 4.7
Low income 30.0 43.2 32.6 29.1 21.5
Highest grade completed (avg.) 13.2 9.4 12.0 13.6 16.3 8th or less 1.5 22.0 0.0 0.0 0.0 Some high school 5.5 78.0 0.0 0.0 0.0 High school graduate 34.5 0.0 87.0 0.0 0.0 High school equivalency 5.2 0.0 13.0 0.0 0.0 Some postsecondary 32.1 0.0 0.0 100.0 0.0 College graduate (4-year) 21.3 0.0 0.0 0.0 100.0

Dislocated Workers
Social Policy Research Associates 144
Table III-11 Characteristics of Dislocated Worker Exiters from April 2013 to March 2014
who Received Intensive or Training Services, by Selected Characteristics (Derived from PY 2013Q4 WIASRD Records)
With Intensive or
Training Services
Limited English-
Language1 Single Parent
Pell Grant Recipient (among
trainees)1
Number of exiters 190,824 3,014 16,468 5,697 Statewide programs 11,877 368 1,131 469 Local programs 176,704 2,617 15,506 5,522 National Emergency Grants 21,244 483 1,738 371
Disaster Relief 2,876 11 232 49 Other 18,368 472 1,506 322
Characteristics of All Exiters Age categories
Under 22 2.0 0.7 1.7 2.3 22 to 29 14.5 8.2 17.8 20.7 30 to 44 33.6 33.4 51.9 48.6 45 to 54 28.7 35.5 23.1 22.7 55 and over 21.2 22.3 5.5 5.7
Gender Female 48.3 51.8 73.9 61.4 Male 51.7 48.2 26.1 38.6
Individual with a disability 3.8 3.3 3.1 2.6 Race and ethnicity
Hispanic 14.3 53.5 17.9 8.1 Not Hispanic
American Indian or Alaskan Native
0.8 3.9 1.4 0.6
Asian 3.0 16.0 1.8 1.1 Black or African American 18.6 9.5 30.3 21.3 Hawaiian or other Pacific Islander 0.2 0.5 0.3 0.1 White 61.5 15.8 46.4 67.8 More than one race 1.6 0.8 1.9 1.0
Veteran Status Veteran 10.2 2.3 4.8 6.9 Disabled veteran 1.4 0.3 0.7 1.0 Campaign veteran 2.8 0.6 1.5 2.4 Recently separated veteran 1.1 0.4 0.6 0.8 Other eligible person 0.1 0.1 0.1 0.1
1 Excludes Puerto Rico.

Dislocated Workers
Social Policy Research Associates 145
With Intensive or
Training Services
Limited English-
Language1 Single Parent
Pell Grant Recipient (among
trainees)1
Number of exiters 190,824 3,014 16,468 5,697
Employed at participation
Employed 4.9 3.9 5.7 4.9 Not employed or received layoff notice
95.1 96.1 94.3 95.1
Average preprogram quarterly earnings
$9,906 $7,120 $7,230 $6,227
None 17.0 18.8 21.4 32.5 $1 to $2,499 9.5 9.2 13.2 12.3 $2,500 to $4,999 15.0 19.7 19.2 17.5 $5,000 to $7,499 16.3 22.7 17.4 17.5 $7,500 to $9,999 13.5 14.7 12.0 10.6 $10,000 or more 28.7 14.9 16.8 9.7
Displaced homemaker 1.1 0.9 2.5 2.3
Time of participation
Before layoff 10.7 8.2 9.9 9.6 Within 8 weeks of layoff 31.8 28.2 26.9 19.7 Over 8 weeks after layoff 57.5 63.6 63.3 70.7
UI Claimant (all exiters) 78.3 80.2 73.8 73.7 UI Claimant referred by WPRS 38.7 21.1 22.9 20.9
UI Exhaustee 5.4 6.3 7.7 10.4
Characteristics of Exiters who Received Intensive or Training Services
UI Claimant 78.3 80.2 73.8 73.7 UI Claimant referred by WPRS 38.7 21.1 22.9 20.9
UI Exhaustee 5.4 6.3 7.7 10.4
Limited English-language (excludes Puerto Rico)
1.6 100.0 2.5 0.8
Single parent 8.8 13.6 100.0 25.6
Low income 30.0 38.5 49.5 37.0
Highest grade completed (avg.) 13.2 10.8 12.9 12.8 8th or less 1.5 21.3 1.0 0.2 Some high school 5.5 19.1 6.2 1.5 High school graduate 34.5 34.9 39.0 42.6 High school equivalency 5.2 4.0 7.9 11.5 Some postsecondary 32.1 12.6 34.5 41.7 College graduate (4-year) 21.3 8.1 11.5 2.4

Dislocated Workers
Social Policy Research Associates 146
Table III-12 Characteristics of Dislocated Worker Exiters from April 2013 to March 2014, by Major Service Categories
(Derived from PY 2013Q4 WIASRD Records)
All Exiters
Core Services
Only
Core and Intensive
Services Only Training
ITA Established
(among trainees)
Number of exiters 669,117 478,293 110,235 80,589 55,970
Statewide programs 12,685 808 4,072 7,805 3,966 Local programs 654,050 477,346 103,666 73,038 52,894 National Emergency Grants 22,281 1,037 7,977 13,267 5,640
Disaster Relief 3,022 146 2,060 816 402 Other 19,259 891 5,917 12,451 5,238
Characteristics of All Exiters Age categories
Under 22 2.9 3.2 1.9 2.2 2.0 22 to 29 17.7 19.0 14.1 15.0 15.0 30 to 44 33.6 33.6 30.4 37.8 38.6 45 to 54 24.6 22.9 28.0 29.8 29.6 55 and over 21.2 21.1 25.6 15.2 14.8
Gender
Female 49.2 49.6 48.6 47.9 49.8 Male 50.8 50.4 51.4 52.1 50.2
Individual with a disability 3.6 3.6 4.4 3.0 2.8
Race and ethnicity Hispanic 13.6 13.3 14.3 14.3 14.9 Not Hispanic
American Indian or Alaskan Native
0.8 0.7 0.7 1.0 1.0
Asian 3.0 3.1 3.0 3.0 2.9 Black or African American 19.3 19.7 17.8 19.7 21.2 Hawaiian or other Pacific Islander 0.3 0.3 0.2 0.3 0.3 White 60.6 60.3 62.4 60.4 58.3 More than one race 2.4 2.7 1.7 1.4 1.5
Veteran Status Veteran 7.2 6.0 10.9 9.2 8.5 Disabled veteran 1.0 0.8 1.5 1.3 1.0 Campaign veteran 2.1 1.8 2.5 3.3 2.8 Recently separated veteran 0.9 0.8 1.1 1.0 0.6 Other eligible person 0.1 0.1 0.1 0.1 0.1

Dislocated Workers
Social Policy Research Associates 147
All Exiters
Core Services
Only
Core and Intensive
Services Only Training
ITA Established
(among trainees)
Number of exiters 669,117 478,293 110,235 80,589 55,970
Employed at participation
Employed 6.8 7.6 4.0 6.1 4.3 Not employed or received layoff notice
93.2 92.4 96.0 93.9 95.7
Average preprogram quarterly earnings
$9,056 $8,754 $10,372 $9,197 $9,083
None 10.9 8.5 13.1 22.4 22.4 $1 to $2,499 12.6 13.8 9.6 9.5 9.7 $2,500 to $4,999 20.8 23.1 16.1 13.4 13.9 $5,000 to $7,499 18.1 18.7 16.6 15.9 16.2 $7,500 to $9,999 12.6 12.3 13.6 13.3 13.2 $10,000 or more 25.0 23.5 31.0 25.5 24.5
Displaced homemaker 1.9 2.2 1.1 1.2 1.1
Time of participation
Before layoff 12.4 13.2 10.8 10.7 8.2 Within 8 weeks of layoff 48.4 56.1 38.4 25.4 24.8 Over 8 weeks after layoff 39.1 30.7 50.8 63.9 67.0
UI Claimant (all exiters) 79.3 80.1 82.2 72.9 76.4 UI Claimant referred by WPRS 20.3 6.8 51.7 20.9 21.8
UI Exhaustee 3.6 2.2 4.1 7.1 7.3 Characteristics of Exiters who Received
Intensive or Training Services
UI Claimant 78.3 82.2 72.9 76.4 UI Claimant referred by WPRS 38.7 51.7 20.9 21.8
UI Exhaustee 5.4 4.1 7.1 7.3
Limited English-language (excludes Puerto Rico)
1.6 1.5 1.8 1.6
Single parent 8.8 6.6 11.8 8.8
Low income 30.0 30.6 29.6 30.0
Highest grade completed (avg.) 13.2 13.3 13.2 13.3 8th or less 1.5 2.0 0.9 0.7 Some high school 5.5 6.6 3.9 3.2 High school graduate 34.5 32.0 37.9 36.6 High school equivalency 5.2 4.0 6.7 6.9 Some postsecondary 32.1 31.5 32.8 34.0 College graduate (4-year) 21.3 23.9 17.8 18.6

Dislocated Workers
Social Policy Research Associates 148
Table III-13 Number of Dislocated Worker Exiters from April 2013 to March 2014 with Specific Characteristics,
by Major Service Categories (Derived from PY 2013Q4 WIASRD Records)
All
Exiters
Core Services
Only
Core and Intensive
Services Only Training
ITA Established
(among trainees)
Number of exiters 669,117 478,293 110,235 80,589 55,970 Statewide programs 12,685 808 4,072 7,805 3,966
Local programs 654,050 477,346 103,666 73,038 52,894 National Emergency Grants 22,281 1,037 7,977 13,267 5,640
Disaster Relief 3,022 146 2,060 816 402 Other 19,259 891 5,917 12,451 5,238 Characteristics of All Exiters
Age categories
Under 22 19,374 15,512 2,108 1,754 1,133 22 to 29 118,694 91,108 15,501 12,085 8,408 30 to 44 224,958 160,921 33,537 30,500 21,595 45 to 54 164,533 109,674 30,882 23,977 16,541 55 and over 141,552 101,073 28,207 12,272 8,292
Gender
Female 324,022 235,683 51,816 36,523 26,587 Male 334,132 239,704 54,715 39,713 26,772
Individual with a disability 23,148 16,195 4,581 2,372 1,514
Race and ethnicity Hispanic 85,179 59,885 14,575 10,719 7,801 Not Hispanic
American Indian or Alaskan Native 4,722 3,272 671 779 528 Asian 19,100 13,820 3,062 2,218 1,501 Black or African American 121,364 88,410 18,176 14,778 11,141 Hawaiian or other Pacific Islander 1,747 1,312 224 211 150 White 380,226 271,112 63,789 45,325 30,625 More than one race 14,899 12,075 1,783 1,041 771
Veteran Status Veteran 47,964 28,568 11,965 7,431 4,739 Disabled veteran 6,559 3,938 1,610 1,011 581 Campaign veteran 13,950 8,536 2,746 2,668 1,576 Recently separated veteran 5,837 3,818 1,178 841 360 Other eligible person 683 489 94 100 73

Dislocated Workers
Social Policy Research Associates 149
All
Exiters
Core Services
Only
Core and Intensive
Services Only Training
ITA Established
(among trainees)
Number of exiters 669,117 478,293 110,235 80,589 55,970
Employed at participation
Employed 45,427 36,120 4,371 4,936 2,380 Not employed or received layoff notice 623,690 442,173 105,864 75,653 53,590
Average preprogram quarterly earnings
None 72,516 40,692 14,058 17,766 12,397 $1 to $2,499 83,908 66,081 10,326 7,501 5,380 $2,500 to $4,999 138,169 110,237 17,344 10,588 7,678 $5,000 to $7,499 120,017 89,520 17,896 12,601 8,952 $7,500 to $9,999 84,008 58,862 14,625 10,521 7,328 $10,000 or more 165,945 112,402 33,340 20,203 13,579
Displaced homemaker 12,624 10,434 1,219 971 610
Time of participation
Before layoff 51,542 37,553 6,861 7,128 3,675 Within 8 weeks of layoff 200,693 159,266 24,419 17,008 11,102 Over 8 weeks after layoff 162,233 87,260 32,260 42,713 29,961
UI Claimant (all exiters) 355,493 206,637 90,474 58,382 42,747 UI Claimant referred by WPRS 90,997 17,441 56,842 16,714 12,182
UI Exhaustee 15,994 5,771 4,544 5,679 4,105
Characteristics of Exiters who Received Intensive or Training Services
UI Claimant 148,864 90,474 58,382 42,747 UI Claimant referred by WPRS 73,558 56,842 16,714 12,182
UI Exhaustee 10,225 4,544 5,679 4,105
Limited English-language (excludes Puerto Rico)
3,014 1,595 1,419 901
Single parent 16,468 7,256 9,212 6,583
Low income 38,927 17,083 21,844 14,937
Highest grade completed (avg.) 8th or less 2,917 2,159 758 404 Some high school 10,366 7,229 3,137 1,775 High school graduate 65,579 35,101 30,478 20,456 High school equivalency 9,828 4,424 5,404 3,847 Some postsecondary 60,931 34,555 26,376 19,001 College graduate (4-year) 40,457 26,153 14,304 10,423

Dislocated Workers
Social Policy Research Associates 150
Table III-14 Characteristics of Dislocated Worker Exiters from April 2013 to March 2014, by Type of Training
(Derived from PY 2013Q4 WIASRD Records)
No Training Any
Training
Basic Skills/ Remedial/
Prerequisite Training
On-the-job/ Apprentice
Training
Occupational/ Entrep./ Custom Training
Number of exiters 588,528 80,589 2,141 9,482 70,954 Statewide programs 4,880 7,805 262 1,317 6,501 Local programs 581,012 73,038 1,973 8,228 64,741 National Emergency Grants 9,014 13,267 458 2,903 10,428
Disaster Relief 2,206 816 3 104 722 Other 6,808 12,451 455 2,799 9,706
Characteristics of All Exiters
Age categories
Under 22 3.0 2.2 0.9 2.5 2.0 22 to 29 18.1 15.0 9.8 18.6 14.5 30 to 44 33.0 37.8 35.5 36.1 38.2 45 to 54 23.9 29.8 35.0 29.3 29.9 55 and over 22.0 15.2 18.8 13.5 15.4
Gender
Female 49.4 47.9 59.0 38.4 48.9 Male 50.6 52.1 41.0 61.6 51.1
Individual with a disability 3.7 3.0 2.5 3.5 3.0
Race and ethnicity Hispanic 13.5 14.3 20.9 14.2 14.3 Not Hispanic
American Indian or Alaskan Native
0.7 1.0 5.9 0.6 0.9
Asian 3.1 3.0 5.1 1.4 3.1 Black or African American 19.3 19.7 17.6 17.1 20.0 Hawaiian or other Pacific Islander
0.3 0.3 0.4 0.2 0.3
White 60.7 60.4 49.1 65.4 60.0 More than one race 2.5 1.4 0.9 1.0 1.4
Veteran Status Veteran 6.9 9.2 4.5 11.3 9.0 Disabled veteran 0.9 1.3 0.8 1.4 1.2 Campaign veteran 1.9 3.3 1.7 4.6 3.2 Recently separated veteran 0.8 1.0 0.2 2.7 0.8 Other eligible person 0.1 0.1 0.0 0.1 0.1

Dislocated Workers
Social Policy Research Associates 151
No Training Any
Training
Basic Skills/ Remedial/
Prerequisite Training
On-the-job/ Apprentice
Training
Occupational/ Entrep./ Custom Training
Number of exiters 588,528 80,589 2,141 9,482 70,954
Employed at participation
Employed 6.9 6.1 4.5 5.6 6.2 Not employed or received layoff notice
93.1 93.9 95.5 94.4 93.8
Average preprogram quarterly earnings
$9,039 $9,197 $8,605 $7,777 $9,410
None 9.4 22.4 16.1 25.5 22.1 $1 to $2,499 13.1 9.5 7.3 11.4 9.1 $2,500 to $4,999 21.8 13.4 13.9 15.5 13.0 $5,000 to $7,499 18.3 15.9 21.5 16.3 15.8 $7,500 to $9,999 12.6 13.3 17.4 12.3 13.4 $10,000 or more 24.9 25.5 23.8 19.1 26.5
Displaced homemaker 2.0 1.2 0.7 1.1 1.2
Time of participation
Before layoff 12.8 10.7 14.0 9.4 10.7 Within 8 weeks of layoff 52.8 25.4 35.9 23.3 25.6 Over 8 weeks after layoff 34.4 63.9 50.1 67.3 63.7
UI Claimant (all exiters) 80.7 72.9 78.4 61.8 74.4 UI Claimant referred by WPRS 20.2 20.9 24.5 18.4 21.1
UI Exhaustee 2.8 7.1 3.4 11.1 6.6
Characteristics of Exiters who Received Intensive or Training
Services
Intensive Services, No
Training
UI Claimant 82.2 72.9 78.4 61.8 74.4 UI Claimant referred by WPRS 51.6 20.9 24.5 18.4 21.1
UI Exhaustee 4.1 7.1 3.4 11.1 6.6
Limited English-language (excludes Puerto Rico)
1.5 1.8 13.6 1.3 1.7
Single parent 6.6 11.8 12.3 11.1 11.9
Low income 30.6 29.6 28.0 32.8 29.0
Highest grade completed (avg.) 13.3 13.2 11.8 13.0 13.2 8th or less 2.0 0.9 8.6 0.8 0.8 Some high school 6.6 3.9 23.8 3.8 3.4 High school graduate 32.0 37.9 32.9 42.8 37.4 High school equivalency 4.0 6.7 5.0 7.3 6.7 Some postsecondary 31.5 32.8 19.5 30.9 33.3 College graduate (4-year) 23.9 17.8 10.1 14.4 18.4

Dislocated Workers
Social Policy Research Associates 152
Table III-15 Services Received by Dislocated Worker Exiters, Trends Over Time
(Derived from PY 2013Q4 WIASRD Records)
WIA PY 2009
WIA PY 2010
WIA PY 2011
WIA PY 2012
WIA 4/1/13-3/31/14
Number of exiters 581,985 760,853 754,108 705,589 669,117
Coenrollment
WIA adult 28.7 44.2 47.1 44.9 43.2 WIA youth 0.1 0.1 0.1 0.0 0.0 Partner program 85.7 89.9 92.4 93.6 90.8
Wagner-Peyser 84.1 88.7 91.4 92.9 89.9 TAA 4.8 4.2 3.4 2.4 2.0 National Farmworker Jobs 0.0 0.0 0.0 0.1 0.1 Veterans programs 3.0 2.5 2.4 2.5 2.7 Vocational Education 0.0 0.1 0.1 0.0 0.0 Adult Education 0.2 0.1 0.1 0.1 0.0 Title V Older Worker 0.0 0.0 0.0 0.0 0.0 Other partner programs 1.1 1.2 1.3 1.0 0.8
Services Received
Rapid response 3.5 4.2 4.7 4.6 4.4 Disaster Relief 0.5 0.4 0.6 0.6 0.5 Core self-service and informational activities
56.1 65.8 63.8 55.5 50.5
Staff-assisted core services 100.0 100.0 100.0 100.0 100.0 Intensive Services 53.9 48.7 40.0 30.8 28.5
Prevocational activities 7.9 6.5 6.3 5.8 5.5 Training services 19.2 18.2 15.6 13.8 12.0 Type of Training (among trainees)
On-the-job training 5.9 6.8 10.2 11.8 11.7 Skill upgrading 16.3 14.6 14.8 12.7 12.9 Entrepreneurial training 0.3 0.3 0.4 0.3 0.4 ABE or ESL in combination with training (non-TAA)
2.3 1.8 1.5 1.0 1.0
Customized training 1.4 1.3 1.3 1.2 1.4 Apprenticeship training 0.0 0.1 Other occupational skills training
76.4 78.2 75.0 75.3 74.7
Remedial training (ABE/ESL TAA only)
1.6 1.6
Prerequisite training 0.2 0.3 Completed any training (among trainees)
72.5 70.8

Dislocated Workers
Social Policy Research Associates 153
WIA PY 2009
WIA PY 2010
WIA PY 2011
WIA PY 2012
WIA 4/1/13-3/31/14
Number of exiters 581,985 760,853 754,108 705,589 669,117
ITA established (among trainees) 76.9 78.4 72.8 69.8 69.5
Pell Grant recipient (among trainees, excludes Puerto Rico)
5.1 6.2 7.7 7.7 7.1
Needs-related payments 0.2 0.3 0.4 0.1 0.1 Other supportive services 9.9 9.2 7.2 6.5 5.9
Service category
Core services, including staff assisted, only
46.1 51.3 60.0 69.2 71.5
Intensive & core services only 34.7 30.6 24.4 17.0 16.5 Training services 19.2 18.2 15.6 13.8 12.0
Weeks participated (average) 23.8 29.6 35.6 30.8 26.0 4 or fewer weeks 34.7 29.2 26.8 33.9 34.8 5 to 13 weeks 20.2 20.4 18.6 17.6 19.2 14 to 26 weeks 14.8 14.6 13.3 12.8 15.6 27 to 39 weeks 9.5 8.4 8.2 8.3 9.5 40 to 52 weeks 7.1 6.0 6.7 6.5 6.0 53 to 104 weeks 10.2 16.1 17.8 13.7 9.6 More than 104 weeks 3.6 5.2 8.6 7.3 5.3
Weeks of training (average) 30.0 38.0 47.1 46.3 42.8 4 or fewer weeks 14.4 9.7 8.6 10.0 11.8 5 to 13 weeks 27.9 21.1 19.4 22.3 23.4 14 to 26 weeks 20.6 18.4 17.1 17.8 18.0 27 to 39 weeks 11.5 12.2 10.2 10.1 10.5 40 to 52 weeks 8.6 11.2 8.9 7.8 8.1 53 to 104 weeks 12.3 22.6 25.0 19.7 17.5 More than 104 weeks 4.6 4.8 10.8 12.3 10.7
Occupation of training
Managerial, prof., technical 34.8 40.0 42.4 40.8 41.7 Healthcare practitioners and technical occupations
10.0 11.9 12.9 12.1 12.6
Service occupations 15.8 16.5 14.9 14.7 13.9 Healthcare support occupations
12.3 12.8 11.1 10.8 10.0
Sales and clerical 12.0 11.8 13.4 13.9 14.2 Farming, fishing, forestry, construction, and extraction
3.5 3.6 3.4 3.0 2.7
Installation, repair, production, transportation, material moving
33.9 28.1 26.0 27.6 27.6

Dislocated Workers
Social Policy Research Associates 154
WIA PY 2009
WIA PY 2010
WIA PY 2011
WIA PY 2012
WIA 4/1/13-3/31/14
Number of exiters 581,985 760,853 754,108 705,589 669,117
Reason for exit Institutionalized 0.0 0.0 0.0 0.0 0.0 Health/medical 0.4 0.4 0.3 0.3 0.3 Deceased 0.1 0.1 0.1 0.0 0.0 Family care 0.1 0.1 0.1 0.1 0.1 Reserve called to active duty 0.0 0.0 0.0 0.0 0.0 Retirement 0.1 0.1 0.1 0.1 0.1

Dislocated Workers
Social Policy Research Associates 155
Table III-16 Number of Dislocated Worker Exiters, by Services Received, Trends Over Time
(Derived from PY 2013Q4 WIASRD Records)
WIA PY 2009
WIA PY 2010
WIA PY 2011
WIA PY 2012
WIA 4/1/13-3/31/14
Number of exiters 581,985 760,853 754,108 705,589 669,117
Coenrollment
WIA adult 167,201 336,093 354,836 316,620 289,028 WIA youth 323 516 450 331 256 Partner program 499,005 683,975 696,523 660,703 607,703
Wagner-Peyser 489,184 674,723 689,321 655,655 601,709 TAA 28,066 32,162 25,345 17,253 13,356 National Farmworker Jobs 163 82 230 369 450 Veterans programs 17,255 18,924 18,172 17,927 18,305 Vocational Education 279 487 473 285 133 Adult Education 895 868 803 372 242 Title V Older Worker 48 45 39 25 21 Other partner programs 6,259 8,784 9,911 6,897 5,419
Services Received
Rapid response 20,473 31,838 35,452 32,807 29,512 Disaster Relief 3,020 2,665 4,358 4,054 3,022 Core self-service and informational activities
326,683 500,452 481,111 391,433 337,930
Staff-assisted core services 581,985 760,853 754,108 705,589 669,117 Intensive Services 313,457 370,610 301,656 217,431 190,824
Prevocational activities 45,873 49,744 47,427 40,577 36,690 Training services 111,485 138,141 117,442 97,257 80,589 Type of Training (among trainees)
On-the-job training 6,597 9,373 11,959 11,469 9,440 Skill upgrading 18,146 20,210 17,437 12,322 10,374 Entrepreneurial training 336 365 414 336 322 ABE or ESL in combination with training (non-TAA)
2,530 2,483 1,751 931 768
Customized training 1,608 1,832 1,505 1,206 1,143 Apprenticeship training 18 42 Other occupational skills training
85,170 108,006 88,063 73,202 60,194
Remedial training (ABE/ESL TAA only)
1,597 1,297
Prerequisite training 157 204 Completed any training (among trainees)
70,480 57,018

Dislocated Workers
Social Policy Research Associates 156
WIA PY 2009
WIA PY 2010
WIA PY 2011
WIA PY 2012
WIA 4/1/13-3/31/14
Number of exiters 581,985 760,853 754,108 705,589 669,117
ITA established (among trainees) 85,705 108,371 85,547 67,893 55,970
Pell Grant recipient (among trainees, excludes Puerto Rico)
5,707 8,531 9,038 7,536 5,697
Needs-related payments 1,445 2,452 3,063 627 345 Other supportive services 57,820 69,623 54,373 45,849 39,149
Service category
Core services, including staff assisted, only
268,528 390,243 452,452 488,158 478,293
Intensive & core services only 201,972 232,469 184,214 120,174 110,235 Training services 111,485 138,141 117,442 97,257 80,589
Weeks participated
4 or fewer weeks 201,898 222,034 201,770 239,075 232,736 5 to 13 weeks 117,304 155,509 140,402 124,299 128,157 14 to 26 weeks 85,894 111,385 100,361 89,994 104,261 27 to 39 weeks 55,242 63,975 61,788 58,294 63,711 40 to 52 weeks 41,283 45,494 50,200 45,865 40,336 53 to 104 weeks 59,236 122,681 134,588 96,476 64,518 More than 104 weeks 21,128 39,775 64,999 51,586 35,398
Weeks of training
4 or fewer weeks 15,860 13,323 10,029 9,648 9,454 5 to 13 weeks 30,697 28,858 22,567 21,507 18,732 14 to 26 weeks 22,679 25,175 19,844 17,145 14,396 27 to 39 weeks 12,682 16,751 11,906 9,706 8,359 40 to 52 weeks 9,430 15,307 10,313 7,543 6,442 53 to 104 weeks 13,586 30,900 29,045 18,999 13,955 More than 104 weeks 5,078 6,584 12,578 11,897 8,549
Occupation of training
Managerial, prof., technical 27,342 43,553 42,824 35,433 30,321 Healthcare practitioners and technical occupations
7,847 12,994 13,021 10,560 9,131
Service occupations 12,418 17,932 15,019 12,795 10,098 Healthcare support occupations
9,703 13,929 11,177 9,387 7,265
Sales and clerical 9,425 12,888 13,515 12,051 10,323 Farming, fishing, forestry, construction, and extraction
2,730 3,897 3,395 2,649 1,947
Installation, repair, production, transportation, material moving
26,669 30,590 26,282 23,993 20,047

Dislocated Workers
Social Policy Research Associates 157
WIA PY 2009
WIA PY 2010
WIA PY 2011
WIA PY 2012
WIA 4/1/13-3/31/14
Number of exiters 581,985 760,853 754,108 705,589 669,117
Reason for exit Institutionalized 263 302 297 261 185 Health/medical 2,366 2,970 2,538 2,294 1,918 Deceased 411 508 457 347 229 Family care 542 721 694 850 524 Reserve called to active duty 67 58 61 37 33 Retirement 330 453 458 463 359

Dislocated Workers
Social Policy Research Associates 158
Table III-17 Services Received by Dislocated Worker Exiters from April 2013 to March 2014, by Funding Source
(Derived from PY 2013Q4 WIASRD Records)
Formula Funds
All Exiters All Local Statewide NEG
Number of exiters 669,117 658,970 654,050 12,685 22,281
Coenrollment
WIA adult 43.2 43.7 43.9 11.4 16.6 WIA youth 0.0 0.0 0.0 0.0 0.2 Partner program 90.8 91.2 91.4 78.0 75.5
Wagner-Peyser 89.9 90.3 90.6 68.9 69.9 TAA 2.0 1.9 1.7 32.6 17.8 National Farmworker Jobs 0.1 0.1 0.0 2.8 0.6 Veterans programs 2.7 2.8 2.7 4.0 2.2 Vocational Education 0.0 0.0 0.0 0.1 0.2 Adult Education 0.0 0.0 0.0 0.2 0.0 Title V Older Worker 0.0 0.0 0.0 0.1 0.0 Other partner programs 0.8 0.8 0.7 4.3 3.4
Services Received
Rapid response 4.4 4.4 4.1 63.2 18.5 Disaster relief 0.5 0.1 0.1 0.7 13.6 Core self-service and informational activities
50.5 50.3 50.2 72.2 70.0
Staff-assisted core services 100.0 100.0 100.0 100.0 100.0 Intensive Services 28.5 27.5 27.0 93.6 95.3
Prevocational activities 5.5 5.4 5.3 18.4 15.0 Training services 12.0 11.5 11.2 61.5 59.5 Type of Training (among trainees)
On-the-job training 11.7 11.5 11.2 16.7 21.7 Skill upgrading 12.9 11.4 11.4 7.7 19.8 Entrepreneurial training 0.4 0.1 0.1 0.2 1.8 ABE or ESL in combination with training (non-TAA)
1.0 1.0 1.0 0.4 0.4
Customized training 1.4 1.4 1.4 2.6 1.9 Apprenticeship training 0.1 0.1 0.0 0.2 0.2 Other occupational skills training
74.7 76.6 77.0 74.9 58.7
Remedial training (ABE/ESL TAA only)
1.6 1.6 1.6 2.3 2.8
Prerequisite training 0.3 0.3 0.3 0.6 0.3 Completed any training (among trainees)
70.8 70.2 70.8 68.5 75.6

Dislocated Workers
Social Policy Research Associates 159
Formula Funds
All Exiters All Local Statewide NEG
Number of exiters 669,117 658,970 654,050 12,685 22,281
ITA established (among trainees) 69.5 71.3 72.4 50.8 42.5
Pell Grant recipient (among trainees, excludes Puerto Rico)
7.1 7.4 7.6 6.0 2.8
Needs-related payments 0.1 0.0 0.0 0.5 0.5 Other supportive services 5.9 5.5 5.4 29.4 29.4
Service category
Core services, including staff assisted, only
71.5 72.5 73.0 6.4 4.7
Intensive & core services only 16.5 16.0 15.8 32.1 35.8 Training services 12.0 11.5 11.2 61.5 59.5
Weeks participated (average) 26.0 25.5 25.1 93.6 75.9 4 or fewer weeks 34.8 35.1 35.4 2.1 6.2 5 to 13 weeks 19.2 19.3 19.4 7.1 7.4 14 to 26 weeks 15.6 15.6 15.6 11.7 12.3 27 to 39 weeks 9.5 9.5 9.5 9.1 11.6 40 to 52 weeks 6.0 6.0 6.0 6.1 8.6 53 to 104 weeks 9.6 9.4 9.3 19.0 24.0 More than 104 weeks 5.3 5.2 4.9 45.0 30.0
Weeks of training (average) 42.8 44.1 43.9 60.6 42.3 4 or fewer weeks 11.8 10.2 10.2 7.2 20.6 5 to 13 weeks 23.4 23.5 23.4 20.7 20.0 14 to 26 weeks 18.0 18.3 18.5 11.7 15.8 27 to 39 weeks 10.5 10.7 10.9 7.7 7.9 40 to 52 weeks 8.1 8.3 8.3 7.2 5.8 53 to 104 weeks 17.5 17.9 17.5 26.3 18.8 More than 104 weeks 10.7 11.2 11.1 19.2 11.1
Occupation of training
Managerial, prof., technical 41.7 41.2 41.4 40.1 43.9 Healthcare practitioners and technical occupations
12.6 12.5 12.5 12.9 11.2
Service occupations 13.9 14.3 14.4 10.1 8.7 Healthcare support occupations
10.0 10.3 10.4 6.9 5.5
Sales and clerical 14.2 14.5 14.5 13.9 13.0 Farming, fishing, forestry, construction, and extraction
2.7 2.5 2.5 3.2 4.0
Installation, repair, production, transportation, material moving
27.6 27.5 27.2 32.7 30.4
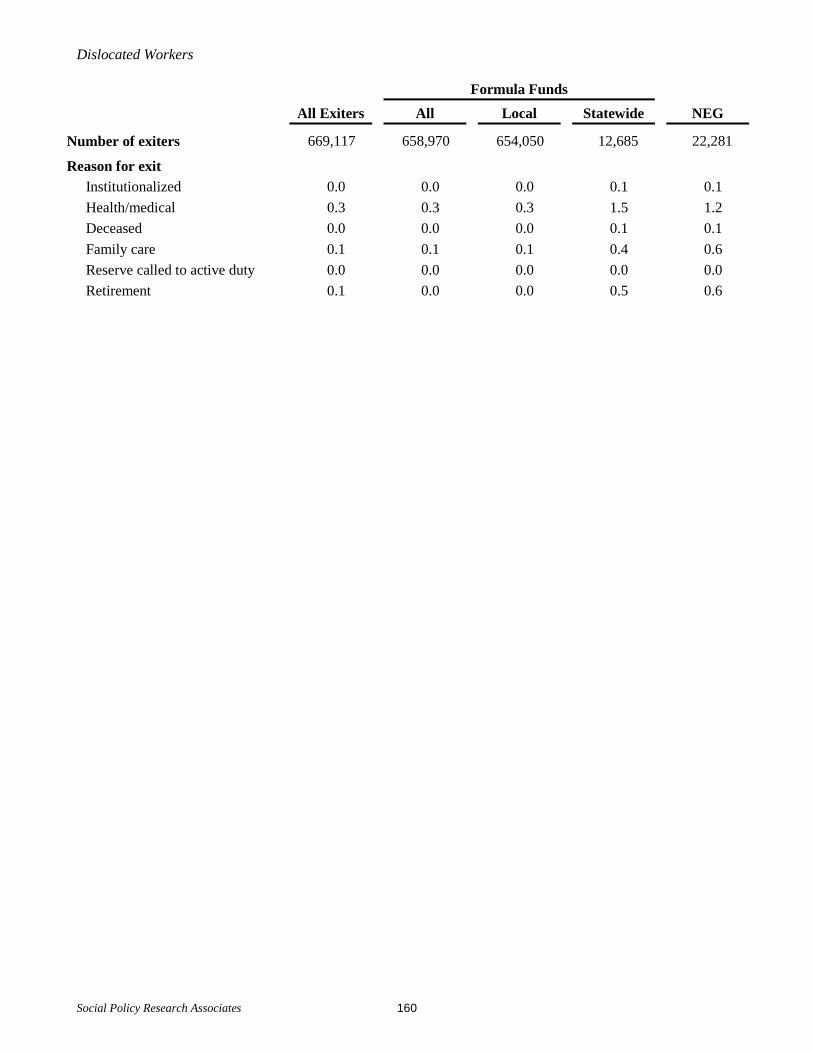
Dislocated Workers
Social Policy Research Associates 160
Formula Funds
All Exiters All Local Statewide NEG
Number of exiters 669,117 658,970 654,050 12,685 22,281
Reason for exit
Institutionalized 0.0 0.0 0.0 0.1 0.1 Health/medical 0.3 0.3 0.3 1.5 1.2 Deceased 0.0 0.0 0.0 0.1 0.1 Family care 0.1 0.1 0.1 0.4 0.6 Reserve called to active duty 0.0 0.0 0.0 0.0 0.0 Retirement 0.1 0.0 0.0 0.5 0.6

Dislocated Workers
Social Policy Research Associates 161
Table III-18 Services Received by Dislocated Worker Exiters from April 2013 to March 2014,
by Type of NEG Project (Derived from PY 2013Q4 WIASRD Records)
All Formula
Funds
NEG
All Disaster Relief Other
Number of exiters 669,117 658,970 22,281 3,022 19,259
Coenrollment
WIA adult 43.2 43.7 16.6 17.7 16.4 WIA youth 0.0 0.0 0.2 0.7 0.1 Partner program 90.8 91.2 75.5 78.7 75.0
Wagner-Peyser 89.9 90.3 69.9 77.6 68.6 TAA 2.0 1.9 17.8 1.4 20.3 National Farmworker Jobs 0.1 0.1 0.6 0.1 0.7 Veterans programs 2.7 2.8 2.2 2.3 2.2 Vocational Education 0.0 0.0 0.2 0.8 0.1 Adult Education 0.0 0.0 0.0 0.0 0.0 Title V Older Worker 0.0 0.0 0.0 0.0 0.0 Other partner programs 0.8 0.8 3.4 0.3 3.9
Services Received
Rapid response 4.4 4.4 18.5 2.1 21.1 Disaster relief 0.5 0.1 13.6 100.0 0.0 Core self-service and informational activities
50.5 50.3 70.0 55.4 72.3
Staff-assisted core services 100.0 100.0 100.0 100.0 100.0 Intensive Services 28.5 27.5 95.3 95.2 95.4
Prevocational activities 5.5 5.4 15.0 17.2 14.6 Training services 12.0 11.5 59.5 27.0 64.7 Type of Training (among trainees)
On-the-job training 11.7 11.5 21.7 12.7 22.3 Skill upgrading 12.9 11.4 19.8 10.5 20.4 Entrepreneurial training 0.4 0.1 1.8 12.7 1.1 ABE or ESL in combination with training (non-TAA)
1.0 1.0 0.4 0.4 0.4
Customized training 1.4 1.4 1.9 0.2 2.0 Apprenticeship training 0.1 0.1 0.2 0.0 0.2 Other occupational skills training
74.7 76.6 58.7 65.4 58.3
Remedial training (ABE/ESL TAA only)
1.6 1.6 2.8 0.0 2.9
Prerequisite training 0.3 0.3 0.3 0.0 0.4 Completed any training (among trainees)
70.8 70.2 75.6 78.4 75.4

Dislocated Workers
Social Policy Research Associates 162
All Formula
Funds
NEG
All Disaster Relief Other
Number of exiters 669,117 658,970 22,281 3,022 19,259
ITA established (among trainees) 69.5 71.3 42.5 49.3 42.1
Pell Grant recipient (among trainees, excludes Puerto Rico)
7.1 7.4 2.8 6.0 2.6
Needs-related payments 0.1 0.0 0.5 1.8 0.3 Other supportive services 5.9 5.5 29.4 38.0 28.0
Service category
Core services, including staff assisted, only
71.5 72.5 4.7 4.8 4.6
Intensive & core services only 16.5 16.0 35.8 68.2 30.7 Training services 12.0 11.5 59.5 27.0 64.7
Weeks participated (average) 26.0 25.5 75.9 49.5 80.1 4 or fewer weeks 34.8 35.1 6.2 1.7 6.9 5 to 13 weeks 19.2 19.3 7.4 7.7 7.3 14 to 26 weeks 15.6 15.6 12.3 22.9 10.6 27 to 39 weeks 9.5 9.5 11.6 26.7 9.3 40 to 52 weeks 6.0 6.0 8.6 12.0 8.1 53 to 104 weeks 9.6 9.4 24.0 18.4 24.9 More than 104 weeks 5.3 5.2 30.0 10.7 33.0
Weeks of training (average) 42.8 44.1 42.3 48.1 42.0 4 or fewer weeks 11.8 10.2 20.6 5.2 21.7 5 to 13 weeks 23.4 23.5 20.0 30.1 19.4 14 to 26 weeks 18.0 18.3 15.8 17.2 15.7 27 to 39 weeks 10.5 10.7 7.9 14.8 7.4 40 to 52 weeks 8.1 8.3 5.8 5.4 5.8 53 to 104 weeks 17.5 17.9 18.8 14.0 19.1 More than 104 weeks 10.7 11.2 11.1 13.3 11.0
Occupation of training
Managerial, prof., technical 41.7 41.2 43.9 43.8 43.9 Healthcare practitioners and technical occupations
12.6 12.5 11.2 11.5 11.2
Service occupations 13.9 14.3 8.7 10.5 8.6 Healthcare support occupations
10.0 10.3 5.5 6.2 5.4
Sales and clerical 14.2 14.5 13.0 8.0 13.3 Farming, fishing, forestry, construction, and extraction
2.7 2.5 4.0 6.0 3.9
Installation, repair, production, transportation, material moving
27.6 27.5 30.4 31.7 30.3

Dislocated Workers
Social Policy Research Associates 163
All Formula
Funds
NEG
All Disaster Relief Other
Number of exiters 669,117 658,970 22,281 3,022 19,259
Reason for exit
Institutionalized 0.0 0.0 0.1 0.3 0.1 Health/medical 0.3 0.3 1.2 0.5 1.3 Deceased 0.0 0.0 0.1 0.1 0.1 Family care 0.1 0.1 0.6 0.2 0.7 Reserve called to active duty 0.0 0.0 0.0 0.1 0.0 Retirement 0.1 0.0 0.6 0.1 0.7

Dislocated Workers
Social Policy Research Associates 164
Table III-19 Services Received by Dislocated Worker Exiters from April 2013 to March 2014, by Age
(Derived from PY 2013Q4 WIASRD Records)
Age at Participation
Under 22 22 to 29 30 – 44 45 – 54 55 and Over
Number of exiters 19,374 118,694 224,958 164,533 141,552
Coenrollment
WIA adult 52.5 44.2 43.2 42.1 42.3 WIA youth 1.3 0.0 0.0 0.0 0.0 Partner program 93.5 91.7 90.3 89.9 91.5
Wagner-Peyser 93.1 90.9 89.5 89.0 90.4 TAA 0.4 0.8 1.9 2.9 2.3 National Farmworker Jobs 0.2 0.1 0.1 0.1 0.0 Veterans programs 1.2 2.8 1.9 2.5 4.6 Vocational Education 0.1 0.0 0.0 0.0 0.0 Adult Education 0.0 0.0 0.0 0.0 0.0 Title V Older Worker 0.0 0.0 0.0 0.0 0.0 Other partner programs 0.6 0.7 0.9 1.0 0.6
Services Received
Rapid response 2.2 2.9 4.2 5.5 5.2 Disaster relief 1.2 0.5 0.4 0.4 0.3 Core self-service and informational activities
51.4 46.5 50.9 53.4 49.7
Staff-assisted core services 100.0 100.0 100.0 100.0 100.0 Intensive Services 19.9 23.2 28.5 33.3 28.6
Prevocational activities 2.3 3.1 4.9 7.2 6.9 Training services 9.1 10.2 13.6 14.6 8.7 Type of Training (among trainees)
On-the-job training 13.2 14.4 11.2 11.6 10.4 Skill upgrading 9.0 10.1 12.9 13.9 14.2 Entrepreneurial training 0.0 0.1 0.3 0.5 0.9 ABE or ESL in combination with training (non-TAA)
0.9 0.9 0.9 0.9 1.0
Customized training 0.8 1.2 1.4 1.4 1.8 Apprenticeship training 0.4 0.2 0.0 0.0 0.0 Other occupational skills training
72.4 74.7 75.6 74.1 73.8
Remedial training (ABE/ESL TAA only)
0.2 0.6 1.4 2.1 2.2
Prerequisite training 0.1 0.2 0.3 0.3 0.1 Completed any training (among trainees)
59.4 65.5 71.3 72.6 72.6

Dislocated Workers
Social Policy Research Associates 165
Age at Participation
Under 22 22 to 29 30 – 44 45 – 54 55 and Over
Number of exiters 19,374 118,694 224,958 164,533 141,552
ITA established (among trainees) 64.6 69.6 70.8 69.0 67.6
Pell Grant recipient (among trainees, excludes Puerto Rico)
7.6 9.7 9.1 5.4 2.6
Needs-related payments 0.1 0.0 0.1 0.1 0.0 Other supportive services 4.3 4.6 6.6 7.1 4.5
Service category
Core services, including staff assisted, only
80.1 76.8 71.5 66.7 71.4
Intensive & core services only 10.9 13.1 14.9 18.8 19.9 Training services 9.1 10.2 13.6 14.6 8.7
Weeks participated (average) 17.1 19.6 26.1 30.8 26.7 4 or fewer weeks 47.9 41.6 35.9 29.8 31.4 5 to 13 weeks 19.7 20.6 19.5 18.5 18.0 14 to 26 weeks 13.4 15.0 15.2 16.2 16.3 27 to 39 weeks 7.0 8.1 9.0 10.4 10.8 40 to 52 weeks 4.0 4.7 5.6 6.7 7.3 53 to 104 weeks 5.3 6.6 9.1 11.3 11.7 More than 104 weeks 2.8 3.3 5.7 7.1 4.5
Weeks of training (average) 44.4 42.4 46.9 42.0 34.4 4 or fewer weeks 11.2 11.6 11.1 11.8 13.9 5 to 13 weeks 25.5 24.1 22.0 23.9 25.2 14 to 26 weeks 15.3 17.3 16.7 18.8 20.9 27 to 39 weeks 11.2 10.1 10.4 10.6 10.7 40 to 52 weeks 8.1 8.6 8.3 7.7 7.8 53 to 104 weeks 18.0 18.4 18.9 16.6 14.7 More than 104 weeks 10.6 9.9 12.7 10.7 6.7
Occupation of training
Managerial, prof., technical 28.8 37.2 43.9 42.3 41.4 Healthcare practitioners and technical occupations
12.0 15.8 14.9 10.4 7.6
Service occupations 26.9 20.1 13.9 11.6 10.0 Healthcare support occupations
17.7 13.0 10.3 8.9 7.1
Sales and clerical 10.5 9.6 11.8 16.1 21.8 Farming, fishing, forestry, construction, and extraction
4.8 3.3 2.6 2.4 2.5
Installation, repair, production, transportation, material moving
29.1 29.9 27.8 27.5 24.3

Dislocated Workers
Social Policy Research Associates 166
Age at Participation
Under 22 22 to 29 30 – 44 45 – 54 55 and Over
Number of exiters 19,374 118,694 224,958 164,533 141,552
Reason for exit
Institutionalized 0.0 0.0 0.0 0.0 0.0 Health/medical 0.1 0.1 0.2 0.4 0.5 Deceased 0.0 0.0 0.0 0.0 0.1 Family care 0.0 0.1 0.1 0.1 0.1 Reserve called to active duty 0.0 0.0 0.0 0.0 0.0 Retirement 0.0 0.0 0.0 0.0 0.2

Dislocated Workers
Social Policy Research Associates 167
Table III-20 Services Received by Dislocated Worker Exiters from April 2013 to March 2014, by Ethnicity and Race
(Derived from PY 2013Q4 WIASRD Records)
Hispanic Not Hispanic
All Black White Other
Number of exiters 85,179 542,058 121,364 380,226 40,468
Coenrollment
WIA adult 20.7 48.0 36.0 52.7 39.9 WIA youth 0.0 0.0 0.1 0.0 0.0 Partner program 90.8 90.9 92.3 90.5 91.0
Wagner-Peyser 89.9 90.1 91.5 89.6 90.1 TAA 1.6 2.0 1.0 2.3 2.0 National Farmworker Jobs 0.2 0.1 0.0 0.1 0.1 Veterans programs 2.2 2.8 1.9 3.2 2.2 Vocational Education 0.0 0.0 0.0 0.0 0.0 Adult Education 0.1 0.0 0.0 0.0 0.0 Title V Older Worker 0.0 0.0 0.0 0.0 0.0 Other partner programs 0.4 0.9 1.0 0.9 0.8
Services Received
Rapid response 3.2 4.6 3.8 4.9 4.3 Disaster relief 0.2 0.5 0.9 0.4 0.3 Core self-service and informational activities
34.8 53.5 41.3 58.1 46.9
Staff-assisted core services 100.0 100.0 100.0 100.0 100.0 Intensive Services 29.7 28.1 27.2 28.7 24.7
Prevocational activities 3.8 5.8 4.7 6.3 4.1 Training services 12.6 11.9 12.2 11.9 10.5 Type of Training (among trainees)
On-the-job training 11.8 11.9 10.3 12.8 6.8 Skill upgrading 8.4 14.1 11.5 15.0 13.8 Entrepreneurial training 0.2 0.5 0.2 0.3 3.1 ABE or ESL in combination with training (non-TAA)
2.3 0.7 0.8 0.7 1.2
Customized training 2.4 1.1 1.1 1.1 1.4 Apprenticeship training 0.0 0.1 0.0 0.1 0.1 Other occupational skills training
78.5 73.3 77.7 72.0 72.7
Remedial training (ABE/ESL TAA only)
1.7 1.6 1.7 1.4 4.5
Prerequisite training 0.2 0.3 0.1 0.3 0.3 Completed any training (among trainees)
74.9 69.5 66.6 70.0 73.6

Dislocated Workers
Social Policy Research Associates 168
Hispanic Not Hispanic
All Black White Other
Number of exiters 85,179 542,058 121,364 380,226 40,468
ITA established (among trainees) 72.8 69.5 75.4 67.6 69.4
Pell Grant recipient (among trainees, excludes Puerto Rico)
4.2 7.9 8.0 8.3 3.7
Needs-related payments 0.0 0.1 0.1 0.0 0.1 Other supportive services 7.7 5.5 6.1 5.4 4.9
Service category
Core services, including staff assisted, only
70.3 71.9 72.8 71.3 75.3
Intensive & core services only 17.1 16.2 15.0 16.8 14.2 Training services 12.6 11.9 12.2 11.9 10.5
Weeks participated (average) 22.8 26.4 25.1 27.3 22.2 4 or fewer weeks 40.5 33.7 35.6 32.4 40.7 5 to 13 weeks 19.9 19.0 19.4 18.9 19.9 14 to 26 weeks 14.3 15.9 15.3 16.3 13.7 27 to 39 weeks 7.8 9.9 9.9 10.1 8.0 40 to 52 weeks 4.8 6.3 5.8 6.6 4.8 53 to 104 weeks 8.3 9.9 9.1 10.3 8.6 More than 104 weeks 4.5 5.3 4.9 5.6 4.4
Weeks of training (average) 41.2 43.7 39.8 45.4 38.8 4 or fewer weeks 11.5 11.9 11.7 11.8 13.7 5 to 13 weeks 24.6 23.2 26.2 22.5 21.1 14 to 26 weeks 17.8 17.9 18.5 17.3 21.7 27 to 39 weeks 12.0 10.1 10.5 10.0 9.6 40 to 52 weeks 8.2 7.9 7.8 7.9 8.8 53 to 104 weeks 17.0 17.5 15.8 18.2 16.4 More than 104 weeks 8.9 11.4 9.5 12.3 8.7
Occupation of training
Managerial, prof., technical 34.3 42.7 40.5 43.0 47.6 Healthcare practitioners and technical occupations
9.6 13.1 12.3 13.6 10.7
Service occupations 17.3 13.3 17.1 12.0 14.0 Healthcare support occupations
10.7 9.9 12.6 9.0 9.7
Sales and clerical 15.3 14.0 13.3 14.1 14.3 Farming, fishing, forestry, construction, and extraction
3.1 2.6 2.4 2.6 2.9
Installation, repair, production, transportation, material moving
30.0 27.5 26.7 28.2 21.2

Dislocated Workers
Social Policy Research Associates 169
Hispanic Not Hispanic
All Black White Other
Number of exiters 85,179 542,058 121,364 380,226 40,468
Reason for exit
Institutionalized 0.0 0.0 0.0 0.0 0.0 Health/medical 0.3 0.3 0.2 0.3 0.2 Deceased 0.0 0.0 0.0 0.0 0.0 Family care 0.1 0.1 0.1 0.1 0.1 Reserve called to active duty 0.0 0.0 0.0 0.0 0.0 Retirement 0.0 0.1 0.0 0.1 0.0

Dislocated Workers
Social Policy Research Associates 170
Table III-21 Services Received by Dislocated Worker Exiters from April 2013 to March 2014,
by Employment at Participation, Gender, and Disability (Derived from PY 2013Q4 WIASRD Records)
Employed at Participation Gender With a Disability Yes No Male Female
Number of exiters 45,427 623,690 334,132 324,022 23,148 Coenrollment
WIA adult 68.8 41.3 44.9 42.7 43.8 WIA youth 0.1 0.0 0.0 0.0 0.0 Partner program 86.1 91.2 90.4 91.5 91.2
Wagner-Peyser 85.4 90.3 89.1 91.1 89.5 TAA 1.7 2.0 2.1 1.5 1.9 National Farmworker Jobs 0.0 0.1 0.1 0.0 0.2 Veterans programs 2.7 2.7 4.9 0.6 8.1 Vocational Education 0.0 0.0 0.0 0.0 0.0 Adult Education 0.0 0.0 0.0 0.0 0.0 Title V Older Worker 0.0 0.0 0.0 0.0 0.0 Other partner programs 0.8 0.8 0.8 0.8 0.8
Services Received Rapid response 3.7 4.5 4.1 4.0 3.7 Disaster relief 0.2 0.5 0.7 0.3 0.3 Core self-service and informational activities
65.3 49.4 50.8 49.4 50.1
Staff-assisted core services 100.0 100.0 100.0 100.0 100.0 Intensive Services 20.5 29.1 28.3 27.3 30.0
Prevocational activities 3.5 5.6 5.0 5.9 5.5 Training services 10.9 12.1 11.9 11.3 10.2 Type of Training (among trainees)
On-the-job training 10.7 11.8 13.9 9.5 13.7 Skill upgrading 35.0 11.4 13.8 12.8 13.3 Entrepreneurial training 0.5 0.4 0.6 0.2 0.3 ABE or ESL in combination with training (non-TAA)
0.5 1.0 0.8 1.1 0.6
Customized training 1.7 1.4 1.4 1.1 1.9 Apprenticeship training 0.0 0.1 0.1 0.0 0.0 Other occupational skills training
53.1 76.1 71.3 76.9 73.1
Remedial training (ABE/ESL TAA only)
1.3 1.6 1.3 2.1 1.5
Prerequisite training 0.3 0.3 0.2 0.3 0.2 Completed any training (among trainees)
75.0 70.5 71.5 68.3 67.7

Dislocated Workers
Social Policy Research Associates 171
Employed at Participation Gender With a Disability Yes No Male Female
Number of exiters 45,427 623,690 334,132 324,022 23,148
ITA established (among trainees) 48.2 70.8 67.4 72.8 63.8
Pell Grant recipient (among trainees, excludes Puerto Rico)
5.6 7.2 5.4 9.4 6.2
Needs-related payments 0.0 0.1 0.1 0.1 0.1 Other supportive services 3.7 6.0 5.6 5.5 6.8 Service category
Core services, including staff assisted, only
79.5 70.9 71.7 72.7 70.0
Intensive & core services only 9.6 17.0 16.4 16.0 19.8 Training services 10.9 12.1 11.9 11.3 10.2
Weeks participated (average) 21.8 26.3 24.3 26.4 26.3 4 or fewer weeks 46.0 34.0 36.0 34.3 35.5 5 to 13 weeks 17.4 19.3 19.7 19.0 18.6 14 to 26 weeks 12.1 15.8 15.7 15.5 15.6 27 to 39 weeks 7.3 9.7 9.3 9.7 9.1 40 to 52 weeks 4.4 6.1 5.8 6.2 5.8 53 to 104 weeks 8.1 9.8 8.7 10.1 9.7 More than 104 weeks 4.7 5.3 4.7 5.3 5.6
Weeks of training (average) 32.5 43.5 37.1 50.0 40.8 4 or fewer weeks 34.1 10.4 15.5 7.9 11.5 5 to 13 weeks 16.3 23.9 27.6 18.9 23.2 14 to 26 weeks 13.5 18.3 17.4 18.6 17.3 27 to 39 weeks 9.0 10.6 9.2 11.4 11.4 40 to 52 weeks 6.5 8.2 6.6 9.5 9.1 53 to 104 weeks 12.4 17.8 14.6 20.4 18.3 More than 104 weeks 8.3 10.9 9.1 13.3 9.1
Occupation of training Managerial, prof., technical 49.2 41.2 36.3 48.0 44.9
Healthcare practitioners and technical occupations
19.8 12.1 5.8 20.2 10.8
Service occupations 11.8 14.0 6.0 22.3 13.1 Healthcare support occupations
8.7 10.1 2.3 18.3 7.9
Sales and clerical 11.9 14.3 5.8 22.9 17.8 Farming, fishing, forestry, construction, and extraction
2.7 2.7 4.6 0.5 2.3
Installation, repair, production, transportation, material moving
24.4 27.8 47.4 6.3 21.9

Dislocated Workers
Social Policy Research Associates 172
Employed at Participation Gender With a Disability Yes No Male Female
Number of exiters 45,427 623,690 334,132 324,022 23,148 Reason for exit
Institutionalized 0.0 0.0 0.0 0.0 0.0 Health/medical 0.1 0.3 0.2 0.3 0.8 Deceased 0.0 0.0 0.0 0.0 0.1 Family care 0.0 0.1 0.0 0.1 0.1 Reserve called to active duty 0.0 0.0 0.0 0.0 0.0 Retirement 0.0 0.1 0.1 0.0 0.1

Dislocated Workers
Social Policy Research Associates 173
Table III-22 Services Received by Dislocated Worker Exiters from April 2013 to March 2014,
by Veteran Status (Derived from PY 2013Q4 WIASRD Records)
All Exiters Veteran
Campaign Veteran
Recently Separated Veteran
Disabled Veteran
Number of exiters 669,117 47,964 13,950 5,837 6,559
Coenrollment
WIA adult 43.2 50.2 60.7 64.4 52.5 WIA youth 0.0 0.0 0.0 0.0 0.0 Partner program 90.8 90.8 86.5 91.7 90.5
Wagner-Peyser 89.9 84.0 80.6 83.3 82.5 TAA 2.0 2.4 2.5 0.4 2.1 National Farmworker Jobs 0.1 0.0 0.0 0.0 0.0 Veterans programs 2.7 38.0 34.5 31.8 42.4 Vocational Education 0.0 0.0 0.0 0.0 0.0 Adult Education 0.0 0.0 0.0 0.0 0.1 Title V Older Worker 0.0 0.0 0.0 0.0 0.0 Other partner programs 0.8 1.1 1.2 0.9 0.9
Services Received
Rapid response 4.4 4.8 5.7 4.6 4.6 Disaster relief 0.5 0.5 0.6 0.5 0.4 Core self-service and informational activities
50.5 58.5 73.9 72.1 59.4
Staff-assisted core services 100.0 100.0 100.0 100.0 100.0 Intensive Services 28.5 40.4 38.8 34.6 40.0
Prevocational activities 5.5 5.8 4.7 2.8 5.3 Training services 12.0 15.5 19.1 14.4 15.4 Type of Training (among trainees)
On-the-job training 11.7 14.1 15.5 28.4 13.5 Skill upgrading 12.9 13.9 17.2 19.0 20.9 Entrepreneurial training 0.4 0.2 0.2 0.0 0.3 ABE or ESL in combination with training (non-TAA)
1.0 0.3 0.4 0.0 0.4
Customized training 1.4 1.9 2.1 1.8 2.0 Apprenticeship training 0.1 0.3 0.7 2.4 0.0 Other occupational skills training
74.7 71.5 66.6 50.2 65.6
Remedial training (ABE/ESL TAA only)
1.6 0.9 0.8 0.4 1.1
Prerequisite training 0.3 0.1 0.1 0.2 0.2 Completed any training (among trainees)
70.8 70.1 75.8 78.0 67.8

Dislocated Workers
Social Policy Research Associates 174
All Exiters Veteran
Campaign Veteran
Recently Separated Veteran
Disabled Veteran
Number of exiters 669,117 47,964 13,950 5,837 6,559
ITA established (among trainees) 69.5 63.8 59.1 42.8 57.5
Pell Grant recipient (among trainees, excludes Puerto Rico)
7.1 5.3 5.0 5.5 5.6
Needs-related payments 0.1 0.1 0.1 0.0 0.0 Other supportive services 5.9 8.9 10.0 7.0 7.8
Service category
Core services, including staff assisted, only
71.5 59.6 61.2 65.4 60.0
Intensive & core services only 16.5 24.9 19.7 20.2 24.5 Training services 12.0 15.5 19.1 14.4 15.4
Weeks participated (average) 26.0 31.3 32.5 18.5 29.7 4 or fewer weeks 34.8 28.8 28.5 41.9 30.3 5 to 13 weeks 19.2 17.9 17.8 22.1 17.6 14 to 26 weeks 15.6 16.8 16.5 13.9 16.6 27 to 39 weeks 9.5 10.3 10.5 8.3 10.1 40 to 52 weeks 6.0 7.2 7.2 4.7 7.1 53 to 104 weeks 9.6 12.0 11.6 6.5 11.5 More than 104 weeks 5.3 7.1 7.9 2.8 6.8
Weeks of training (average) 42.8 37.7 34.6 23.1 36.3 4 or fewer weeks 11.8 18.3 23.6 27.0 24.0 5 to 13 weeks 23.4 23.7 22.6 31.0 19.7 14 to 26 weeks 18.0 16.2 14.9 17.2 15.1 27 to 39 weeks 10.5 9.9 9.8 6.6 8.7 40 to 52 weeks 8.1 7.0 6.0 4.8 7.9 53 to 104 weeks 17.5 16.0 15.3 10.0 15.4 More than 104 weeks 10.7 9.0 7.8 3.5 9.1
Occupation of training
Managerial, prof., technical 41.7 41.8 44.8 33.2 52.2 Healthcare practitioners and technical occupations
12.6 8.2 7.8 8.9 10.1
Service occupations 13.9 8.0 7.3 9.6 7.5 Healthcare support occupations
10.0 3.1 2.2 3.7 3.0
Sales and clerical 14.2 7.3 6.7 5.5 6.8 Farming, fishing, forestry, construction, and extraction
2.7 3.5 4.0 4.8 2.6
Installation, repair, production, transportation, material moving
27.6 39.5 37.2 46.8 30.8
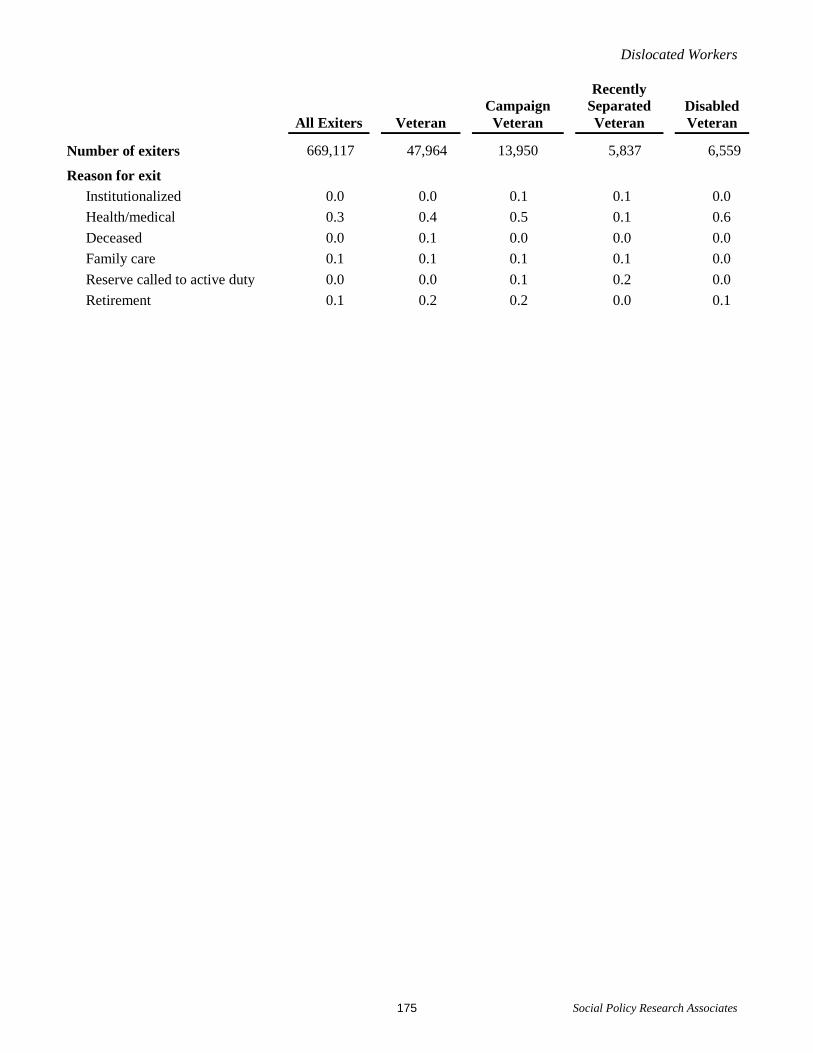
Dislocated Workers
Social Policy Research Associates 175
All Exiters Veteran
Campaign Veteran
Recently Separated Veteran
Disabled Veteran
Number of exiters 669,117 47,964 13,950 5,837 6,559
Reason for exit
Institutionalized 0.0 0.0 0.1 0.1 0.0 Health/medical 0.3 0.4 0.5 0.1 0.6 Deceased 0.0 0.1 0.0 0.0 0.0 Family care 0.1 0.1 0.1 0.1 0.0 Reserve called to active duty 0.0 0.0 0.1 0.2 0.0 Retirement 0.1 0.2 0.2 0.0 0.1

Dislocated Workers
Social Policy Research Associates 176
Table III-23 Services Received by Dislocated Worker Exiters from April 2013 to March 2014, by UI Status
(Derived from PY 2013Q4 WIASRD Records)
All Exiters
UI Claimant
All
Referred by WPRS
Not Referred by WPRS
UI Exhaustee
Number of exiters 669,117 355,493 90,997 264,496 15,994
Coenrollment
WIA adult 43.2 61.7 28.1 73.2 40.8 WIA youth 0.0 0.0 0.0 0.0 0.0 Partner program 90.8 87.9 94.8 85.5 69.6
Wagner-Peyser 89.9 86.9 93.3 84.6 68.4 TAA 2.0 2.7 2.9 2.7 1.2 National Farmworker Jobs 0.1 0.1 0.0 0.1 0.1 Veterans programs 2.7 3.0 7.1 1.6 4.0 Vocational Education 0.0 0.0 0.0 0.0 0.1 Adult Education 0.0 0.1 0.1 0.0 0.0 Title V Older Worker 0.0 0.0 0.0 0.0 0.0 Other partner programs 0.8 1.0 1.0 0.9 1.9
Services Received
Rapid response 4.4 4.8 4.8 4.8 3.3 Disaster relief 0.5 0.3 0.3 0.3 1.7 Core self-service and informational activities
50.5 71.9 38.1 83.5 74.6
Staff-assisted core services 100.0 100.0 100.0 100.0 100.0 Intensive Services 28.5 41.9 80.8 28.5 63.9
Prevocational activities 5.5 8.6 18.4 5.3 8.9 Training services 12.0 16.4 18.4 15.8 35.5 Type of Training (among trainees)
On-the-job training 11.7 10.0 10.4 9.8 18.4 Skill upgrading 12.9 11.8 8.0 13.3 7.3 Entrepreneurial training 0.4 0.1 0.1 0.1 0.1 ABE or ESL in combination with training (non-TAA)
1.0 1.0 1.5 0.8 0.6
Customized training 1.4 1.4 1.4 1.4 1.9 Apprenticeship training 0.1 0.0 0.0 0.0 0.0 Other occupational skills training
74.7 78.0 80.5 77.0 73.5
Remedial training (ABE/ESL TAA only)
1.6 1.8 1.6 1.8 0.5
Prerequisite training 0.3 0.3 0.3 0.3 0.2 Completed any training (among trainees)
70.8 71.5 57.8 77.0 73.0

Dislocated Workers
Social Policy Research Associates 177
All Exiters
UI Claimant
All
Referred by WPRS
Not Referred by WPRS
UI Exhaustee
Number of exiters 669,117 355,493 90,997 264,496 15,994
ITA established (among trainees) 69.5 73.2 72.9 73.4 72.3
Pell Grant recipient (among trainees, excludes Puerto Rico)
7.1 7.1 7.1 7.2 10.4
Needs-related payments 0.1 0.1 0.1 0.1 0.1 Other supportive services 5.9 7.9 9.2 7.4 18.9
Service category
Core services, including staff assisted, only
71.5 58.1 19.2 71.5 36.1
Intensive & core services only 16.5 25.5 62.5 12.7 28.4 Training services 12.0 16.4 18.4 15.8 35.5
Weeks participated (average) 26.0 31.6 38.5 29.2 41.8 4 or fewer weeks 34.8 29.7 11.6 36.0 21.5 5 to 13 weeks 19.2 17.3 15.2 18.0 15.7 14 to 26 weeks 15.6 15.9 21.6 14.0 16.1 27 to 39 weeks 9.5 10.9 16.0 9.1 10.8 40 to 52 weeks 6.0 7.2 11.4 5.7 7.6 53 to 104 weeks 9.6 11.8 17.5 9.8 18.0 More than 104 weeks 5.3 7.2 6.7 7.4 10.3
Weeks of training (average) 42.8 44.6 44.6 44.6 33.6 4 or fewer weeks 11.8 9.9 8.7 10.3 11.2 5 to 13 weeks 23.4 23.2 20.7 24.2 29.4 14 to 26 weeks 18.0 18.3 18.5 18.2 20.3 27 to 39 weeks 10.5 10.7 11.8 10.3 12.1 40 to 52 weeks 8.1 8.5 9.7 8.1 7.3 53 to 104 weeks 17.5 18.0 20.2 17.2 13.3 More than 104 weeks 10.7 11.4 10.4 11.8 6.3
Occupation of training
Managerial, prof., technical 41.7 42.1 40.3 42.8 38.5 Healthcare practitioners and technical occupations
12.6 11.9 12.4 11.7 13.0
Service occupations 13.9 13.9 14.7 13.6 14.6 Healthcare support occupations
10.0 10.1 10.1 10.1 10.5
Sales and clerical 14.2 14.7 16.0 14.1 14.6 Farming, fishing, forestry, construction, and extraction
2.7 2.4 2.3 2.4 2.5
Installation, repair, production, transportation, material moving
27.6 26.9 26.8 27.0 29.7

Dislocated Workers
Social Policy Research Associates 178
All Exiters
UI Claimant
All
Referred by WPRS
Not Referred by WPRS
UI Exhaustee
Number of exiters 669,117 355,493 90,997 264,496 15,994
Reason for exit
Institutionalized 0.0 0.0 0.0 0.0 0.1 Health/medical 0.3 0.4 0.3 0.4 0.9 Deceased 0.0 0.1 0.0 0.1 0.1 Family care 0.1 0.1 0.1 0.1 0.3 Reserve called to active duty 0.0 0.0 0.0 0.0 0.0 Retirement 0.1 0.1 0.1 0.1 0.1

Dislocated Workers
Social Policy Research Associates 179
Table III-24 Services Received by Dislocated Worker Exiters from April 2013 to March 2014
who Received Intensive or Training Services, by Highest Grade Completed (Derived from PY 2013Q4 WIASRD Records)
With Intensive or Training
Services
Less than High
School
High School
Graduate
Some Post-secondary
College
Graduate
Number of exiters 190,824 13,283 75,407 60,931 40,457
Coenrollment
WIA adult 16.5 17.9 17.9 17.8 11.8 WIA youth 0.1 0.5 0.2 0.0 0.0 Partner program 82.9 87.0 81.1 83.7 83.5
Wagner-Peyser 80.8 85.0 78.5 81.4 82.3 TAA 6.7 7.0 9.2 6.1 3.1 National Farmworker Jobs 0.2 0.2 0.2 0.2 0.1 Veterans programs 5.3 2.1 4.8 7.0 4.7 Vocational Education 0.1 0.1 0.1 0.0 0.0 Adult Education 0.1 0.3 0.2 0.1 0.0 Title V Older Worker 0.0 0.0 0.0 0.0 0.0 Other partner programs 2.0 2.0 2.6 2.1 0.8
Services Received
Rapid response 9.0 7.6 10.2 8.6 7.9 Disaster relief 1.5 4.0 1.9 1.1 0.6 Core self-service and informational activities
50.1 43.5 56.9 47.4 42.8
Staff-assisted core services 100.0 100.0 100.0 100.0 100.0 Intensive Services 100.0 100.0 100.0 100.0 100.0
Prevocational activities 19.2 19.5 18.6 18.3 20.7 Training services 42.2 29.3 47.6 43.3 35.4 Type of Training (among trainees)
On-the-job training 11.7 11.2 13.1 11.0 9.5 Skill upgrading 12.9 9.1 11.3 12.2 19.1 Entrepreneurial training 0.4 3.0 0.3 0.1 0.3 ABE or ESL in combination with training (non-TAA)
1.0 9.8 0.6 0.5 0.4
Customized training 1.4 1.4 1.4 1.3 1.6 Apprenticeship training 0.1 0.0 0.1 0.0 0.0 Other occupational skills training
74.7 65.9 75.1 77.0 72.0
Remedial training (ABE/ESL TAA only)
1.6 9.4 1.5 0.9 1.0
Prerequisite training 0.3 0.2 0.3 0.2 0.1 Completed any training (among trainees)
70.8 72.9 72.3 66.9 73.4
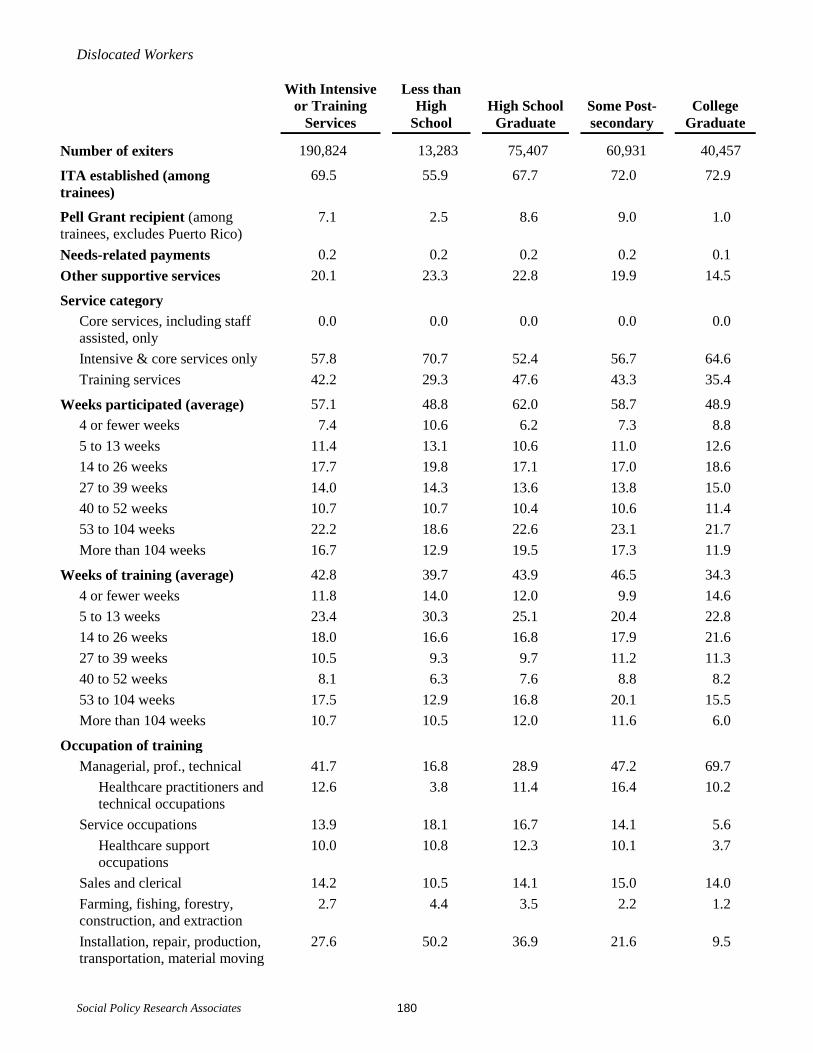
Dislocated Workers
Social Policy Research Associates 180
With Intensive or Training
Services
Less than High
School
High School
Graduate
Some Post-secondary
College
Graduate
Number of exiters 190,824 13,283 75,407 60,931 40,457
ITA established (among trainees)
69.5 55.9 67.7 72.0 72.9
Pell Grant recipient (among trainees, excludes Puerto Rico)
7.1 2.5 8.6 9.0 1.0
Needs-related payments 0.2 0.2 0.2 0.2 0.1 Other supportive services 20.1 23.3 22.8 19.9 14.5
Service category
Core services, including staff assisted, only
0.0 0.0 0.0 0.0 0.0
Intensive & core services only 57.8 70.7 52.4 56.7 64.6 Training services 42.2 29.3 47.6 43.3 35.4
Weeks participated (average) 57.1 48.8 62.0 58.7 48.9 4 or fewer weeks 7.4 10.6 6.2 7.3 8.8 5 to 13 weeks 11.4 13.1 10.6 11.0 12.6 14 to 26 weeks 17.7 19.8 17.1 17.0 18.6 27 to 39 weeks 14.0 14.3 13.6 13.8 15.0 40 to 52 weeks 10.7 10.7 10.4 10.6 11.4 53 to 104 weeks 22.2 18.6 22.6 23.1 21.7 More than 104 weeks 16.7 12.9 19.5 17.3 11.9
Weeks of training (average) 42.8 39.7 43.9 46.5 34.3 4 or fewer weeks 11.8 14.0 12.0 9.9 14.6 5 to 13 weeks 23.4 30.3 25.1 20.4 22.8 14 to 26 weeks 18.0 16.6 16.8 17.9 21.6 27 to 39 weeks 10.5 9.3 9.7 11.2 11.3 40 to 52 weeks 8.1 6.3 7.6 8.8 8.2 53 to 104 weeks 17.5 12.9 16.8 20.1 15.5 More than 104 weeks 10.7 10.5 12.0 11.6 6.0
Occupation of training Managerial, prof., technical 41.7 16.8 28.9 47.2 69.7
Healthcare practitioners and technical occupations
12.6 3.8 11.4 16.4 10.2
Service occupations 13.9 18.1 16.7 14.1 5.6 Healthcare support occupations
10.0 10.8 12.3 10.1 3.7
Sales and clerical 14.2 10.5 14.1 15.0 14.0 Farming, fishing, forestry, construction, and extraction
2.7 4.4 3.5 2.2 1.2
Installation, repair, production, transportation, material moving
27.6 50.2 36.9 21.6 9.5

Dislocated Workers
Social Policy Research Associates 181
With Intensive or Training
Services
Less than High
School
High School
Graduate
Some Post-secondary
College
Graduate
Number of exiters 190,824 13,283 75,407 60,931 40,457
Reason for exit
Institutionalized 0.1 0.1 0.1 0.1 0.0 Health/medical 1.0 0.9 1.2 0.9 0.7 Deceased 0.1 0.1 0.1 0.1 0.1 Family care 0.3 0.2 0.3 0.2 0.2 Reserve called to active duty 0.0 0.0 0.0 0.0 0.0 Retirement 0.2 0.2 0.2 0.2 0.1

Dislocated Workers
Social Policy Research Associates 182
Table III-25 Services Received by Dislocated Worker Exiters from April 2013 to March 2014
who Received Intensive or Training Services, by Selected Characteristics (Derived from PY 2013Q4 WIASRD Records)
With Intensive
or Training Services
Limited English-
Language1 Single Parent
Pell Grant Recipient (among
trainees)1
Number of exiters 190,824 3,014 16,468 5,697
Coenrollment
WIA adult 16.5 8.7 19.3 23.2 WIA youth 0.1 0.0 0.2 0.3 Partner program 82.9 79.9 76.2 66.9
Wagner-Peyser 80.8 75.6 74.4 64.8 TAA 6.7 18.7 7.0 5.9 National Farmworker Jobs 0.2 0.8 0.2 0.3 Veterans programs 5.3 1.1 1.7 1.3 Vocational Education 0.1 0.2 0.2 0.2 Adult Education 0.1 0.6 0.2 0.3 Title V Older Worker 0.0 0.0 0.0 0.0 Other partner programs 2.0 2.7 3.1 7.7
Services Received
Rapid response 9.0 18.5 9.6 9.3 Disaster relief 1.5 0.4 1.4 0.9 Core self-service and informational activities
50.1 60.5 67.4 70.4
Staff-assisted core services 100.0 100.0 100.0 100.0 Intensive Services 100.0 100.0 100.0 100.0
Prevocational activities 19.2 21.7 15.7 14.5 Training services 42.2 47.1 55.9 100.0
Type of Training (among trainees) On-the-job training 11.7 8.2 11.0 2.2 Skill upgrading 12.9 8.1 11.8 10.6 Entrepreneurial training 0.4 0.9 0.1 0.1 ABE or ESL in combination with training (non-TAA)
1.0 4.7 0.9 0.6
Customized training 1.4 2.1 1.2 0.4 Apprenticeship training 0.1 0.0 0.0 0.0 Other occupational skills training
74.7 74.2 76.7 88.5
1 Excludes Puerto Rico.

Dislocated Workers
Social Policy Research Associates 183
With Intensive
or Training Services
Limited English-
Language1 Single Parent
Pell Grant Recipient (among
trainees)1
Number of exiters 190,824 3,014 16,468 5,697 Remedial training (ABE/ESL TAA only)
1.6 15.4 1.8 0.7
Prerequisite training 0.3 0.2 0.3 0.3 Completed any training (among trainees)
70.8 80.4 74.6 72.0
ITA established (among trainees) 69.5 63.5 71.5 84.6
Pell Grant recipient (among trainees, excludes Puerto Rico)
7.1 3.1 15.1 100.0
Needs-related payments 0.2 0.3 0.4 0.5 Other supportive services 20.1 33.7 31.4 44.1
Service category Core services, including staff assisted, only
0.0 0.0 0.0 0.0
Intensive & core services only 57.8 52.9 44.1 0.0 Training services 42.2 47.1 55.9 100.0
Weeks participated (average) 57.1 71.6 66.9 110.8 4 or fewer weeks 7.4 6.5 5.3 0.2 5 to 13 weeks 11.4 8.1 9.4 1.3 14 to 26 weeks 17.7 14.4 15.4 4.0 27 to 39 weeks 14.0 10.9 12.5 5.3 40 to 52 weeks 10.7 10.2 10.3 7.3 53 to 104 weeks 22.2 24.4 25.4 34.2 More than 104 weeks 16.7 25.4 21.7 47.6
Weeks of training (average) 42.8 48.8 46.5 74.4 4 or fewer weeks 11.8 8.6 9.5 1.8 5 to 13 weeks 23.4 26.2 21.7 6.0 14 to 26 weeks 18.0 16.1 18.5 10.0 27 to 39 weeks 10.5 9.5 11.2 12.6 40 to 52 weeks 8.1 7.4 8.8 12.3 53 to 104 weeks 17.5 18.5 18.2 34.0 More than 104 weeks 10.7 13.6 12.2 23.4

Dislocated Workers
Social Policy Research Associates 184
With Intensive
or Training Services
Limited English-
Language1 Single Parent
Pell Grant Recipient (among
trainees)1
Number of exiters 190,824 3,014 16,468 5,697 Occupation of training
Managerial, prof., technical 41.7 18.8 42.6 54.0 Healthcare practitioners and technical occupations
12.6 5.0 19.6 27.7
Service occupations 13.9 23.8 21.4 15.1 Healthcare support occupations
10.0 13.2 17.6 11.5
Sales and clerical 14.2 15.8 16.0 12.3 Farming, fishing, forestry, construction, and extraction
2.7 3.1 1.8 1.8
Installation, repair, production, transportation, material moving
27.6 38.5 18.2 16.9
Reason for exit Institutionalized 0.1 0.1 0.1 0.2 Health/medical 1.0 1.8 1.0 1.6 Deceased 0.1 0.0 0.0 0.2 Family care 0.3 0.8 0.4 0.4 Reserve called to active duty 0.0 0.0 0.0 0.0 Retirement 0.2 0.8 0.0 0.1

Dislocated Workers
Social Policy Research Associates 185
Table III-26 Number of Dislocated Workers Exiters Who Received Training from April 2013 to March 2014,
by Occupation of Training All Dislocated Workers
(Derived from PY 2013Q4 WIASRD Records)
Occupation Title O*Net Code
Any Training
On-the-job/ Apprentice Training
Customized Training
Skill Upgrading and Other
Occupational Skills Training
Twenty Most Common Occupations Heavy and Tractor-Trailer Truck Drivers 53303200 7,704 89 14 7,628 Nursing Assistants 31101400 2,836 31 16 2,758 Medical Assistants 31909200 2,413 59 12 2,357 Registered Nurses 29114100 2,184 73 11 2,149 Computer User Support Specialists 15115100 1,841 100 5 1,737 Medical Records and Health Information Technicians 29207100 1,793 53 47 1,707 Licensed Practical and Licensed Vocational Nurses 29206100 1,773 24 8 1,741 Bookkeeping, Accounting, and Auditing Clerks 43303100 1,615 128 13 1,484 Network and Computer Systems Administrators 15114200 1,398 29 11 1,359 Heating, Air Conditioning, and Refrigeration Mechanics and Installers 49902100 1,348 110 9 1,250 Welders, Cutters, Solderers, and Brazers 51412100 1,186 133 14 1,050 Medical Secretaries 43601300 1,135 49 12 1,085 Executive Secretaries and Executive Administrative Assistants 43601100 1,133 130 5 987 Office Clerks, General 43906100 1,118 100 17 1,016 General and Operations Managers 11102100 1,032 57 8 970 Accountants and Auditors 13201100 815 49 12 756 Computer and Information Systems Managers 11302100 809 12 4 791 Customer Service Representatives 43405100 791 493 13 280 Computer Occupations, All Other 15119900 776 39 16 736

Dislocated Workers
Social Policy Research Associates 186
Occupation Title O*Net Code
Any Training
On-the-job/ Apprentice Training
Customized Training
Skill Upgrading and Other
Occupational Skills Training
Business Operations Specialists, All Other 13119900 749 37 1 714
Ten Most Common Healthcare Occupations Nursing Assistants 31101400 2,836 31 16 2,758 Medical Assistants 31909200 2,413 59 12 2,357 Registered Nurses 29114100 2,184 73 11 2,149 Medical Records and Health Information Technicians 29207100 1,793 53 47 1,707 Licensed Practical and Licensed Vocational Nurses 29206100 1,773 24 8 1,741 Pharmacy Technicians 29205200 538 5 6 530 Dental Assistants 31909100 422 16 2 407 Occupational Health and Safety Specialists 29901100 420 2 2 419 Healthcare Support Workers, All Other 31909900 350 9 10 332 Medical and Clinical Laboratory Technicians 29201200 309 8 0 304

Dislocated Workers
Social Policy Research Associates 187
Table III-27 Services Received by Dislocated Worker Exiters from April 2013 to March 2014 , by State
(Derived from PY 2013Q4 WIASRD Records)
Number of
Exiters
Core Services
Only
Core and Intensive
Services Only
Training
ITA
Established (among trainees)
Nation 669,117 71.5 16.5 12.0 69.5 Alabama 1,391 0.0 8.0 92.0 60.6 Alaska 101 0.0 31.7 68.3 100.0 Arizona 1,427 2.0 35.1 62.9 93.6 Arkansas 407 0.5 39.1 60.4 100.0 California 23,287 19.4 43.2 37.3 60.4 Colorado 1,067 0.4 22.3 77.3 82.2 Connecticut 1,576 7.5 37.3 55.2 54.4 Delaware 304 0.3 4.6 95.1 84.1 District of Columbia 71 4.2 14.1 81.7 98.3 Florida 8,098 5.7 23.3 70.9 76.4 Georgia 3,027 3.2 17.5 79.3 95.0 Hawaii 261 0.8 65.9 33.3 96.6 Idaho 719 0.0 27.4 72.6 0.0 Illinois 5,411 2.4 40.7 56.9 87.0 Indiana 6,358 16.1 64.7 19.2 0.0 Iowa 9,932 91.1 2.5 6.4 3.0 Kansas 995 20.5 28.6 50.9 92.1 Kentucky 2,464 0.7 34.7 64.6 83.2 Louisiana 3,096 61.5 16.1 22.5 61.9 Maine 503 3.0 12.5 84.5 94.8 Maryland 2,156 1.2 26.9 71.9 32.8 Massachusetts 3,478 0.4 37.1 62.5 72.2 Michigan 3,797 5.5 26.8 67.7 80.2 Minnesota 2,568 1.0 62.7 36.3 100.0 Mississippi 4,292 55.8 26.5 17.7 38.5 Missouri 136,738 97.3 0.6 2.0 62.3 Montana 464 2.2 22.8 75.0 98.6 Nebraska 210 0.0 28.1 71.9 84.8 Nevada 1,501 1.5 48.4 50.1 87.0 New Hampshire 693 4.2 35.4 60.5 71.1 New Jersey 4,639 5.5 17.2 77.2 95.5 New Mexico 355 0.8 8.2 91.0 64.1 New York 276,808 76.3 20.8 2.9 82.1 North Carolina 3,167 8.5 18.1 73.4 68.4
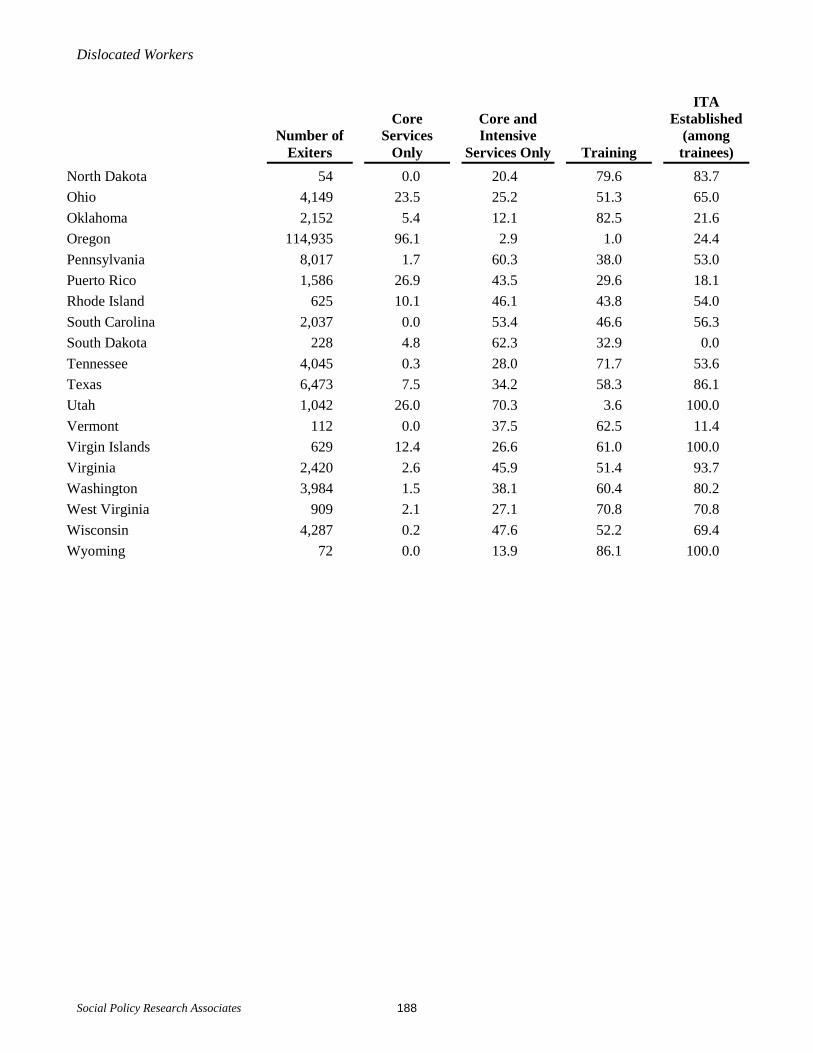
Dislocated Workers
Social Policy Research Associates 188
Number of
Exiters
Core Services
Only
Core and Intensive
Services Only
Training
ITA
Established (among trainees)
North Dakota 54 0.0 20.4 79.6 83.7 Ohio 4,149 23.5 25.2 51.3 65.0 Oklahoma 2,152 5.4 12.1 82.5 21.6 Oregon 114,935 96.1 2.9 1.0 24.4 Pennsylvania 8,017 1.7 60.3 38.0 53.0 Puerto Rico 1,586 26.9 43.5 29.6 18.1 Rhode Island 625 10.1 46.1 43.8 54.0 South Carolina 2,037 0.0 53.4 46.6 56.3 South Dakota 228 4.8 62.3 32.9 0.0 Tennessee 4,045 0.3 28.0 71.7 53.6 Texas 6,473 7.5 34.2 58.3 86.1 Utah 1,042 26.0 70.3 3.6 100.0 Vermont 112 0.0 37.5 62.5 11.4 Virgin Islands 629 12.4 26.6 61.0 100.0 Virginia 2,420 2.6 45.9 51.4 93.7 Washington 3,984 1.5 38.1 60.4 80.2 West Virginia 909 2.1 27.1 70.8 70.8 Wisconsin 4,287 0.2 47.6 52.2 69.4 Wyoming 72 0.0 13.9 86.1 100.0
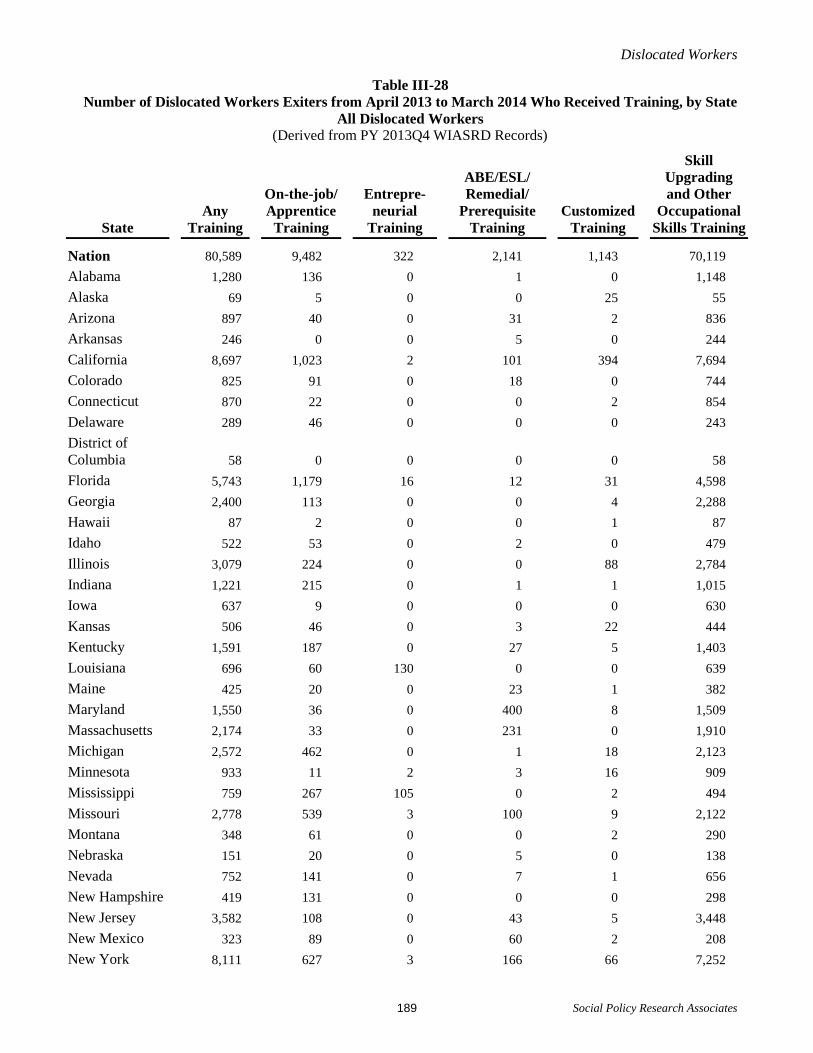
Dislocated Workers
Social Policy Research Associates 189
Table III-28 Number of Dislocated Workers Exiters from April 2013 to March 2014 Who Received Training, by State
All Dislocated Workers (Derived from PY 2013Q4 WIASRD Records)
State Any
Training
On-the-job/ Apprentice
Training
Entrepre-neurial
Training
ABE/ESL/ Remedial/
Prerequisite Training
Customized Training
Skill Upgrading and Other
Occupational Skills Training
Nation 80,589 9,482 322 2,141 1,143 70,119 Alabama 1,280 136 0 1 0 1,148 Alaska 69 5 0 0 25 55 Arizona 897 40 0 31 2 836 Arkansas 246 0 0 5 0 244 California 8,697 1,023 2 101 394 7,694 Colorado 825 91 0 18 0 744 Connecticut 870 22 0 0 2 854 Delaware 289 46 0 0 0 243 District of Columbia 58 0 0 0 0 58 Florida 5,743 1,179 16 12 31 4,598 Georgia 2,400 113 0 0 4 2,288 Hawaii 87 2 0 0 1 87 Idaho 522 53 0 2 0 479 Illinois 3,079 224 0 0 88 2,784 Indiana 1,221 215 0 1 1 1,015 Iowa 637 9 0 0 0 630 Kansas 506 46 0 3 22 444 Kentucky 1,591 187 0 27 5 1,403 Louisiana 696 60 130 0 0 639 Maine 425 20 0 23 1 382 Maryland 1,550 36 0 400 8 1,509 Massachusetts 2,174 33 0 231 0 1,910 Michigan 2,572 462 0 1 18 2,123 Minnesota 933 11 2 3 16 909 Mississippi 759 267 105 0 2 494 Missouri 2,778 539 3 100 9 2,122 Montana 348 61 0 0 2 290 Nebraska 151 20 0 5 0 138 Nevada 752 141 0 7 1 656 New Hampshire 419 131 0 0 0 298 New Jersey 3,582 108 0 43 5 3,448 New Mexico 323 89 0 60 2 208 New York 8,111 627 3 166 66 7,252

Dislocated Workers
Social Policy Research Associates 190
North Carolina 2,324 379 0 53 6 1,973 North Dakota 43 2 0 2 0 42 Ohio 2,128 438 0 7 93 1,615 Oklahoma 1,776 10 0 0 14 1,767 Oregon 1,154 216 2 1 0 946 Pennsylvania 3,047 532 0 114 10 2,517 Puerto Rico 470 221 11 77 27 146 Rhode Island 274 48 0 30 0 229 South Carolina 949 136 0 195 2 723 South Dakota 75 14 0 0 0 62 Tennessee 2,899 654 0 1 5 2,239 Texas 3,775 346 0 194 89 3,363 Utah 38 38 0 0 0 6 Vermont 70 8 0 0 0 63 Virgin Islands 384 0 3 0 6 378 Virginia 1,245 48 20 15 0 1,205 Washington 2,405 225 17 65 0 2,245 West Virginia 644 37 0 0 147 460 Wisconsin 2,237 134 8 147 39 2,096 Wyoming 62 0 0 0 0 62

Dislocated Workers
Social Policy Research Associates 191
Table III-29 Outcomes of Dislocated Worker Exiters, Trends Over Time
(Derived from PY 2013Q4 WIASRD Records)
WIA Oct. 2009
to Sep. 2010
WIA Oct. 2010
to Sep. 2011
WIA Oct. 2011
to Sep. 2012
WIA Apr. 2012
to Mar. 2013
WIA Oct. 2012
to Sep. 2013
Number of exiters 631,209 771,507 749,900 718,305 678,895 Common Measures
Entered employment (quarter after exit) (excludes employed at entry)
57.9 61.5 60.4 59.9 60.0
Retention in 2nd and 3rd quarters 83.8 84.6 84.1 83.9 84.8 Average earnings in 2nd & 3rd qtrs. $16,977 $16,199 $15,966 $16,040 $16,200
Other WIA Performance and 12-Month Outcomes
Retained employment 3rd quarter after exit
86.6 87.1 86.8 86.6 87.6
Retained employment 4th quarter after exit
83.2 79.6 82.5 84.5
Earnings replacement rate 97.0 104.7 97.1 95.4 96.0 Earnings Change
2nd and 3rd quarters after exit $-455 $627 $-417 $-670 $-587 3rd and 4th quarters after exit $-561 $-36 $-835 $-898
Credential and employment rate 49.7 52.3 50.9 51.0 50.7
Information about Employment in Quarter after exit
Occupation of employment Managerial, professional, & technical
24.8 27.6 28.8 29.3 29.3
Healthcare practitioners and technical occupations
4.8 5.9 6.1 6.0 5.8
Service occupations 14.4 14.7 14.3 14.4 14.1 Healthcare support occupations
6.9 7.0 6.5 6.4 6.2
Sales and clerical 19.5 21.2 22.2 22.5 23.0 Farming, fishing, forestry, construction and extraction
5.1 4.4 4.1 4.1 4.2
Installation, repair, production, transportation, and material moving
36.2 32.2 30.5 29.8 29.4
Nontraditional employment 2.5 2.1 1.7 1.8 1.8 Males 2.1 2.0 1.7 1.8 1.7 Females 2.9 2.3 1.8 1.9 1.8

Dislocated Workers
Social Policy Research Associates 192
WIA Oct. 2009
to Sep. 2010
WIA Oct. 2010
to Sep. 2011
WIA Oct. 2011
to Sep. 2012
WIA Apr. 2012
to Mar. 2013
WIA Oct. 2012
to Sep. 2013
Number of exiters 631,209 771,507 749,900 718,305 678,895
Other Outcome Information
Employment Quarter after exit 58.8 62.8 61.9 61.3 61.5 Second quarter after exit 60.6 64.0 63.3 62.9 63.4 Third quarter after exit 61.7 64.1 63.8 63.5 64.4 Fourth quarter after exit 61.8 60.7 62.8 63.9
Average earnings (among earners)
Quarter after exit $7,205 $6,856 $6,850 $6,862 $6,986 Second quarter after exit $7,597 $7,367 $7,256 $7,267 $7,391 Third quarter after exit $7,893 $7,533 $7,419 $7,438 $7,478 Fourth quarter after exit $8,087 $7,608 $7,514 $7,532
Earnings quarter after exit $1 to $2,499 22.4 21.9 22.6 22.9 23.0 $2,500 to $4,999 23.5 25.1 25.3 25.1 24.6 $5,000 to $7,499 20.1 21.0 20.9 20.9 20.5 $7,500 to $9,999 13.0 12.8 12.6 12.5 12.5 $10,000 or more 21.0 19.3 18.6 18.6 19.4
Earnings 3rd quarter after exit $1 to $2,499 19.0 19.2 20.1 20.2 20.1 $2,500 to $4,999 21.4 22.5 23.1 23.0 22.4 $5,000 to $7,499 20.4 20.8 20.9 20.8 20.8 $7,500 to $9,999 14.3 14.2 13.8 13.8 14.0 $10,000 or more 24.9 23.2 22.0 22.2 22.7
Attained credential (among trainees)
59.9 60.2 60.0
High school diploma/equivalency
0.6 0.6 0.5 0.4 0.5
AA, AS, BA, BS or other college degree
5.5 9.0 12.3 11.9 10.1
Postgraduate degree 0.1 0.2 0.2 Occupational skills license/credential/certificate
51.5 48.3 43.0 43.3 44.9
Other 4.2 4.6 4.3 4.3 4.4

Dislocated Workers
Social Policy Research Associates 193
Note: Outcome data for exiters from April 2012 to March 2013 are incomplete. Data for outcomes in the fourth quarter after exit are based on 9 months of exiters.
Outcome data for exiters from October 2012 to September 2013 do not include fourth quarter outcomes; Second and third quarter outcomes are based on 9 and 6 months of exiters, respectively.
Postgraduate degree for October 2011 to September 2012 is based on only 9 months of exiters.

Dislocated Workers
Social Policy Research Associates 194
Table III-30 Number of Dislocated Worker Exiters Attaining Outcomes by Trends Over Time
(Derived from PY 2013Q4 WIASRD Records)
WIA Oct. 2009
to Sep. 2010
WIA Oct. 2010
to Sep. 2011
WIA Oct. 2011
to Sep. 2012
WIA Apr. 2012
to Mar. 2013
WIA Oct. 2012
to Sep. 2013
Number of exiters 631,209 771,507 749,900 718,305 678,895
Common Measures
Entered employment (quarter after exit) (excludes employed at entry)
342,538 437,096 416,660 397,784 377,072
Retention in 2nd and 3rd quarters 308,271 405,792 386,877 365,928 170,973
Other WIA Performance and 12-Month Outcomes
Retained employment 3rd quarter after exit
318,779 417,907 399,044 378,129 176,652
Retained employment 4th quarter after exit
306,154 381,839 379,252 278,789
Credential and employment rate 61,242 69,798 55,094 50,651 45,139
Information about Employment in Quarter after exit
Occupation of employment Managerial, professional, & technical
18,850 25,289 22,355 22,254 20,103
Healthcare practitioners and technical occupations
3,614 5,382 4,756 4,578 3,981
Service occupations 10,939 13,433 11,100 10,924 9,709 Healthcare support occupations
5,272 6,385 5,023 4,846 4,232
Sales and clerical 14,827 19,445 17,244 17,136 15,832 Farming, fishing, forestry, construction and extraction
3,888 3,992 3,202 3,091 2,875
Installation, repair, production, transportation, and material moving
27,580 29,498 23,702 22,627 20,177
Occupation not reported 292,493 388,865 382,877 360,710 345,546
Nontraditional employment 7,245 7,893 4,938 4,346 4,077 Males 3,429 4,013 2,394 2,040 1,904 Females 3,816 3,880 2,376 2,100 1,987

Dislocated Workers
Social Policy Research Associates 195
WIA Oct. 2009
to Sep. 2010
WIA Oct. 2010
to Sep. 2011
WIA Oct. 2011
to Sep. 2012
WIA Apr. 2012
to Mar. 2013
WIA Oct. 2012
to Sep. 2013
Number of exiters 631,209 771,507 749,900 718,305 678,895
Other Outcome Information
Employment Quarter after exit 368,070 479,758 459,951 436,394 413,968 Second quarter after exit 379,159 488,873 470,611 448,233 326,019 Third quarter after exit 386,108 490,306 474,042 452,502 214,880 Fourth quarter after exit 386,531 464,377 467,281 347,500
Earnings quarter after exit $1 to $2,499 80,412 103,140 102,426 98,646 93,848 $2,500 to $4,999 84,613 118,209 114,887 107,961 100,598 $5,000 to $7,499 72,407 99,180 94,648 89,973 83,896 $7,500 to $9,999 46,554 60,146 57,151 53,909 51,036 $10,000 or more 75,453 90,833 84,382 80,140 79,236
Earnings 3rd quarter after exit $1 to $2,499 72,222 93,019 94,490 90,625 42,762 $2,500 to $4,999 81,437 108,868 108,330 103,037 47,767 $5,000 to $7,499 77,391 100,845 98,022 93,043 44,175 $7,500 to $9,999 54,285 68,645 64,885 61,985 29,830 $10,000 or more 94,454 112,452 103,331 99,272 48,316
Attained credential (among trainees)
48,814 59,944 53,633
High school diploma/equivalency
688 749 513 438 418
AA, AS, BA, BS or other college degree
6,804 12,029 13,296 11,882 8,991
Postgraduate degree 222 220 Occupational skills license/credential/certificate
63,560 64,538 46,696 43,082 40,106
Other 5,128 6,088 4,682 4,320 3,898
Note: Outcome data for exiters from April 2012 to March 2013 are incomplete. Data for outcomes in the fourth quarter after exit are based on 9 months of exiters.
Outcome data for exiters from October 2012 to September 2013 do not include fourth quarter outcomes; Second and third quarter outcomes are based on 9 and 6 months of exiters, respectively.

Dislocated Workers
Social Policy Research Associates 196
Table III-31 Outcomes of Dislocated Worker Exiters, by Funding Source
(Derived from PY 2013Q4 WIASRD Records)
Formula
All Exiters All Local Statewide NEG
Number of exiters1 678,895 667,422 661,345 15,360 25,188
Common Measures Entered employment (quarter after exit) (excludes employed at entry)1
60.0 59.9 59.8 79.5 73.6
Retention in 2nd and 3rd quarters 2 83.9 83.8 83.7 91.1 88.0 Average earnings in 2nd & 3rd qtrs.2
$16,040 $15,991 $15,979 $17,508 $18,292
Other WIA Performance and 12-Month Outcomes
Retained employment 3rd quarter after exit2
86.6 86.6 86.6 92.7 90.2
Retained employment 4th quarter after exit3
83.5 83.4 83.4 88.4 86.6
Earnings replacement rate2 95.4 95.0 95.0 100.4 108.2 Earnings Change
2nd and 3rd quarters after exit2 $-670 $-727 $-733 $59 $1,241 3rd and 4th quarters after exit3 $-884 $-942 $-955 $537 $1,168
Credential and employment rate1 50.7 51.7 52.0 48.0 41.2
Information about Employment in Quarter after exit
Occupation of employment1
Managerial, professional, & technical
29.3 29.2 29.3 27.9 30.6
Healthcare practitioners and technical occupations
5.8 6.0 6.1 6.1 3.7
Service occupations 14.1 14.3 14.5 10.3 10.2 Healthcare support occupations
6.2 6.3 6.4 4.1 3.6
Sales and clerical 23.0 23.5 23.7 19.8 18.8 Farming, fishing, forestry, construction and extraction
4.2 3.8 3.7 4.7 6.7
Installation, repair, production, transportation, and material moving
29.4 29.2 28.9 37.3 33.7
Nontraditional employment1 1.8 1.7 1.7 3.1 4.5 Males 1.7 1.6 1.6 2.4 3.7 Females 1.8 1.7 1.7 3.9 6.2

Dislocated Workers
Social Policy Research Associates 197
Formula
All Exiters All Local Statewide NEG
Number of exiters 678,895 667,422 661,345 15,360 25,188
Other Outcome Information
Employment
Quarter after exit1 61.5 61.4 61.2 79.8 74.4 Second quarter after exit4 62.8 62.7 62.6 78.5 73.6 Third quarter after exit2 63.5 63.5 63.4 78.3 73.9 Fourth quarter after exit3 63.4 63.4 63.3 73.8 70.8
Average earnings (among earners)
Quarter after exit1 $6,986 $6,940 $6,917 $8,645 $9,178 Second quarter after exit4 $7,352 $7,322 $7,306 $8,635 $9,029 Third quarter after exit2 $7,438 $7,418 $7,410 $8,443 $8,639 Fourth quarter after exit3 $7,517 $7,503 $7,493 $8,547 $8,625
Earnings quarter after exit1
$1 to $2,499 23.0 23.1 23.2 11.2 14.0 $2,500 to $4,999 24.6 24.7 24.8 17.3 17.1 $5,000 to $7,499 20.5 20.6 20.6 22.1 19.7 $7,500 to $9,999 12.5 12.5 12.5 19.2 15.3 $10,000 or more 19.4 19.1 18.9 30.2 33.9
Earnings 3rd quarter after exit2
$1 to $2,499 20.2 20.3 20.4 10.5 12.9 $2,500 to $4,999 23.0 23.1 23.1 17.3 17.4 $5,000 to $7,499 20.8 20.8 20.7 22.8 22.8 $7,500 to $9,999 13.8 13.8 13.8 20.4 17.1 $10,000 or more 22.2 22.1 22.0 29.0 29.8
Attained credential (among trainees)1
60.0 61.0 61.4 55.8 49.0
High school diploma/equivalency
0.5 0.5 0.5 0.4 0.4
AA, AS, BA, BS or other college degree
10.1 10.5 10.5 15.1 10.4
Postgraduate degree 0.2 0.2 0.1 0.6 0.4 Occupational skills license/credential/certificate
44.9 45.6 46.0 33.7 32.5
Other 4.4 4.2 4.2 5.5 5.5
1 Based on exiters from October 2012 to September 2013. 2 Based on exiters from April 2012 to March 2013. 3 Based on exiters from January 2012 to December 2012. 4 Based on exiters from July 2012 to June 2013.

Dislocated Workers
Social Policy Research Associates 198
Table III-32 Outcomes of Dislocated Worker Exiters, by Type of NEG Project
(Derived from PY 2013Q4 WIASRD Records)
Formula Funds
NEG
All Exiters All Disaster Other
Number of exiters1 678,895 667,422 25,188 3,885 21,303
Common Measures Entered employment (quarter after exit) (excludes employed at entry)1
60.0 59.9 73.6 56.5 76.9
Retention in 2nd and 3rd quarters2 83.9 83.8 88.0 76.0 89.6 Average earnings in 2nd & 3rd qtrs.2
$16,040 $15,991 $18,292 $14,067 $18,761
Other WIA Performance and 12-Month Outcomes
Retained employment 3rd quarter after exit2
86.6 86.6 90.2 80.5 91.5
Retained employment 4th quarter after exit3
83.5 83.4 86.6 78.9 87.6
Earnings replacement rate2 95.4 95.0 108.2 172.5 104.9 Earnings Change
2nd and 3rd quarters after exit2 $-670 $-727 $1,241 $4,597 $796 3rd and 4th quarters after exit3 $-884 $-942 $1,168 $4,264 $770
Credential and employment rate1 50.7 51.7 41.2 31.5 42.0
Employment in Quarter after exit
Occupation of employment1
Managerial, professional, & technical
29.3 29.2 30.6 20.4 31.6
Healthcare practitioners and technical occupations
5.8 6.0 3.7 5.6 3.6
Service occupations 14.1 14.3 10.2 15.5 9.7 Healthcare support occupations
6.2 6.3 3.6 3.2 3.6
Sales and clerical 23.0 23.5 18.8 19.1 18.8 Farming, fishing, forestry, construction and extraction
4.2 3.8 6.7 16.0 5.8
Installation, repair, production, transportation, and material moving
29.4 29.2 33.7 29.0 34.2
Nontraditional employment1 1.8 1.7 4.5 2.8 4.7 Males 1.7 1.6 3.7 1.7 4.1 Females 1.8 1.7 6.2 5.5 6.3

Dislocated Workers
Social Policy Research Associates 199
Formula Funds
NEG
All Exiters All Disaster Other
Number of exiters 678,895 667,422 25,188 3,885 21,303
Other Outcome Information
Employment
Quarter after exit1 61.5 61.4 74.4 57.2 77.6 Second quarter after exit4 62.8 62.7 73.6 55.8 76.8 Third quarter after exit2 63.5 63.5 73.9 60.3 76.1 Fourth quarter after exit3 63.4 63.4 70.8 60.6 72.4
Average earnings (among earners)
Quarter after exit1 $6,986 $6,940 $9,178 $5,011 $9,726 Second quarter after exit4 $7,352 $7,322 $9,029 $5,786 $9,425 Third quarter after exit2 $7,438 $7,418 $8,639 $6,191 $8,957 Fourth quarter after exit3 $7,517 $7,503 $8,625 $6,516 $8,899
Earnings quarter after exit1
$1 to $2,499 23.0 23.1 14.0 30.5 11.9 $2,500 to $4,999 24.6 24.7 17.1 28.1 15.6 $5,000 to $7,499 20.5 20.6 19.7 20.2 19.6 $7,500 to $9,999 12.5 12.5 15.3 11.6 15.8 $10,000 or more 19.4 19.1 33.9 9.7 37.1
Earnings 3rd quarter after exit2
$1 to $2,499 20.2 20.3 12.9 22.9 11.5 $2,500 to $4,999 23.0 23.1 17.4 23.6 16.6 $5,000 to $7,499 20.8 20.8 22.8 22.5 22.9 $7,500 to $9,999 13.8 13.8 17.1 14.1 17.5 $10,000 or more 22.2 22.1 29.8 16.9 31.5
Attained credential (among trainees)1
60.0 61.0 49.0 39.3 49.8
High school diploma/equivalency
0.5 0.5 0.4 1.8 0.3
AA, AS, BA, BS or other college degree
10.1 10.5 10.4 11.4 10.3
Postgraduate degree 0.2 0.2 0.4 0.3 0.4 Occupational skills license/credential/certificate
44.9 45.6 32.5 20.6 33.4
Other 4.4 4.2 5.5 5.2 5.5
1 Based on exiters from October 2012 to September 2013. 2 Based on exiters from April 2012 to March 2013. 3 Based on exiters from January 2012 to December 2012. 4 Based on exiters from July 2012 to June 2013.

Dislocated Workers
Social Policy Research Associates 200
Table III-33 Outcomes of Dislocated Worker Exiters, by Age
(Derived from PY 2013Q4 WIASRD Records)
Age at Participation
Under 22 22 to 29 30 – 44 45 – 54 55 and Over
Number of exiters1 20,735 121,430 231,128 168,563 137,035
Common Measures Entered employment (quarter after exit) (excludes employed at entry)1
67.2 63.3 62.7 62.6 48.5
Retention in 2nd and 3rd quarters2 80.4 83.3 85.1 85.2 80.2 Average earnings in 2nd & 3rd qtrs.2
$8,847 $12,869 $16,849 $17,972 $16,294
Other WIA Performance and 12-Month Outcomes
Retained employment 3rd quarter after exit2
84.4 86.4 87.8 87.8 82.8
Retained employment 4th quarter after exit3
81.4 83.4 84.9 84.8 78.6
Earnings replacement rate2 123.8 113.1 100.7 91.5 77.6 Earnings Change
2nd and 3rd quarters after exit2 $1,416 $1,272 $106 $-1,466 $-3,931 3rd and 4th quarters after exit3 $1,341 $1,143 $-9 $-1,711 $-4,543
Credential and employment rate1 42.5 49.9 53.4 51.5 43.8
Information about Employment in Quarter after exit
Occupation of employment1
Managerial, professional, & technical
10.8 23.5 30.8 29.9 31.5
Healthcare practitioners and technical occupations
4.2 8.4 7.2 4.4 3.2
Service occupations 25.5 18.9 13.9 12.5 12.5 Healthcare support occupations
10.2 8.5 6.7 5.3 4.2
Sales and clerical 20.9 21.0 21.8 23.7 26.8 Farming, fishing, forestry, construction and extraction
8.6 5.3 4.4 3.6 3.2
Installation, repair, production, transportation, and material moving
34.2 31.3 29.1 30.3 26.0
Nontraditional employment1 1.4 1.3 1.9 2.1 1.5 Males 1.6 1.4 2.0 1.7 1.5 Females 1.2 1.1 1.8 2.5 1.6
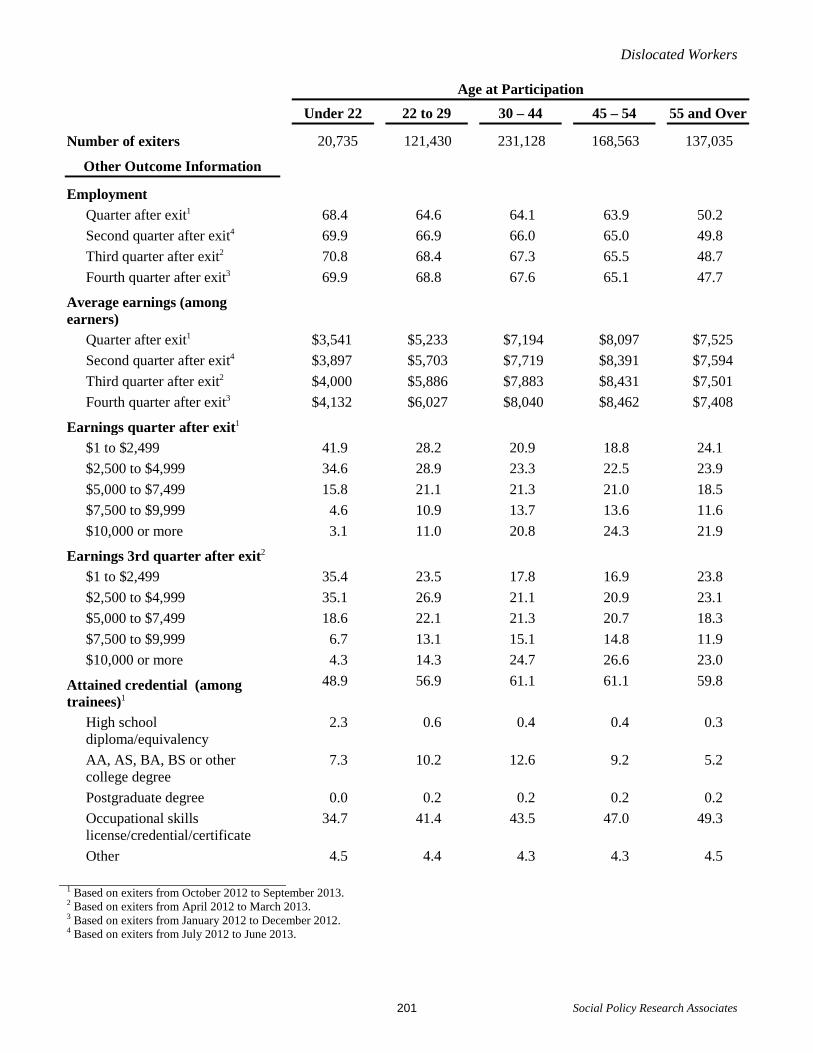
Dislocated Workers
Social Policy Research Associates 201
Age at Participation
Under 22 22 to 29 30 – 44 45 – 54 55 and Over
Number of exiters 20,735 121,430 231,128 168,563 137,035
Other Outcome Information
Employment
Quarter after exit1 68.4 64.6 64.1 63.9 50.2 Second quarter after exit4 69.9 66.9 66.0 65.0 49.8 Third quarter after exit2 70.8 68.4 67.3 65.5 48.7 Fourth quarter after exit3 69.9 68.8 67.6 65.1 47.7
Average earnings (among earners)
Quarter after exit1 $3,541 $5,233 $7,194 $8,097 $7,525 Second quarter after exit4 $3,897 $5,703 $7,719 $8,391 $7,594 Third quarter after exit2 $4,000 $5,886 $7,883 $8,431 $7,501 Fourth quarter after exit3 $4,132 $6,027 $8,040 $8,462 $7,408
Earnings quarter after exit1
$1 to $2,499 41.9 28.2 20.9 18.8 24.1 $2,500 to $4,999 34.6 28.9 23.3 22.5 23.9 $5,000 to $7,499 15.8 21.1 21.3 21.0 18.5 $7,500 to $9,999 4.6 10.9 13.7 13.6 11.6 $10,000 or more 3.1 11.0 20.8 24.3 21.9
Earnings 3rd quarter after exit2 $1 to $2,499 35.4 23.5 17.8 16.9 23.8 $2,500 to $4,999 35.1 26.9 21.1 20.9 23.1 $5,000 to $7,499 18.6 22.1 21.3 20.7 18.3 $7,500 to $9,999 6.7 13.1 15.1 14.8 11.9 $10,000 or more 4.3 14.3 24.7 26.6 23.0
Attained credential (among trainees)1
48.9 56.9 61.1 61.1 59.8
High school diploma/equivalency
2.3 0.6 0.4 0.4 0.3
AA, AS, BA, BS or other college degree
7.3 10.2 12.6 9.2 5.2
Postgraduate degree 0.0 0.2 0.2 0.2 0.2 Occupational skills license/credential/certificate
34.7 41.4 43.5 47.0 49.3
Other 4.5 4.4 4.3 4.3 4.5
1 Based on exiters from October 2012 to September 2013. 2 Based on exiters from April 2012 to March 2013. 3 Based on exiters from January 2012 to December 2012. 4 Based on exiters from July 2012 to June 2013.

Dislocated Workers
Social Policy Research Associates 202
Table III-34 Outcomes of Dislocated Worker Exiters, by Ethnicity and Race
(Derived from PY 2013Q4 WIASRD Records)
Hispanic Not Hispanic
All Black White Other
Number of exiters1 85,539 551,319 119,437 391,082 40,800
Common Measures Entered employment (quarter after exit) (excludes employed at entry)1
57.2 60.6 59.6 61.7 54.1
Retention in 2nd and 3rd quarters2 82.8 83.9 82.3 84.5 82.4 Average earnings in 2nd & 3rd qtrs.2 $14,481 $16,026 $12,790 $16,724 $17,831
Other WIA Performance and 12-Month Outcomes
Retained employment 3rd quarter after exit2
86.0 86.7 85.6 87.1 85.3
Retained employment 4th quarter after exit3
82.4 83.5 82.6 83.9 82.1
Earnings replacement rate2 106.6 93.8 104.3 91.8 95.9 Earnings Change
2nd and 3rd quarters after exit2 $766 $-908 $443 $-1,297 $-644 3rd and 4th quarters after exit3 $569 $-1,135 $402 $-1,569 $-841
Credential and employment rate1 53.8 50.5 46.7 52.0 46.5
Information about Employment in Quarter after exit
Occupation of employment1
Managerial, professional, & technical
23.2 30.1 25.5 31.1 34.0
Healthcare practitioners and technical occupations
3.8 6.3 4.6 7.0 4.5
Service occupations 16.8 13.6 17.9 12.2 15.9 Healthcare support occupations
5.8 6.3 7.9 5.8 6.6
Sales and clerical 26.2 22.2 22.4 22.3 19.9 Farming, fishing, forestry, construction and extraction
5.5 3.9 3.2 4.1 4.0
Installation, repair, production, transportation, and material moving
28.2 30.3 31.0 30.4 26.2
Nontraditional employment1 1.4 1.9 2.0 1.8 1.6 Males 1.6 1.8 1.8 1.8 1.4 Females 1.0 2.0 2.2 1.9 1.8

Dislocated Workers
Social Policy Research Associates 203
Hispanic Not Hispanic
All Black White Other
Number of exiters 85,539 551,319 119,437 391,082 40,800
Other Outcome Information
Employment
Quarter after exit1 58.1 62.2 60.6 63.3 55.7 Second quarter after exit4 60.3 63.3 61.9 64.3 57.6 Third quarter after exit2 62.5 63.7 63.3 64.3 58.6 Fourth quarter after exit3 62.8 63.5 63.6 63.9 59.4
Average earnings (among earners)
Quarter after exit1 $6,113 $7,004 $5,409 $7,417 $7,590 Second quarter after exit4 $6,411 $7,378 $5,672 $7,806 $8,075 Third quarter after exit2 $6,573 $7,448 $5,839 $7,829 $8,188 Fourth quarter after exit3 $6,681 $7,523 $6,012 $7,868 $8,341
Earnings quarter after exit1
$1 to $2,499 24.9 22.8 29.1 20.8 24.3 $2,500 to $4,999 26.2 24.7 28.6 23.6 23.6 $5,000 to $7,499 21.3 20.5 20.2 20.8 19.0 $7,500 to $9,999 12.0 12.5 10.4 13.3 11.1 $10,000 or more 15.6 19.4 11.7 21.5 22.0
Earnings 3rd quarter after exit2
$1 to $2,499 21.7 20.2 25.5 18.7 20.8 $2,500 to $4,999 25.0 22.9 27.0 21.9 22.3 $5,000 to $7,499 21.4 20.8 21.3 20.8 19.4 $7,500 to $9,999 13.5 13.9 12.0 14.5 12.7 $10,000 or more 18.4 22.2 14.2 24.2 24.8
Attained credential (among trainees)1
63.1 59.5 56.4 60.7 56.7
High school diploma/equivalency 1.2 0.4 0.3 0.4 0.6 AA, AS, BA, BS or other college degree
4.5 11.5 6.0 13.8 6.0
Postgraduate degree 0.1 0.2 0.2 0.2 0.3 Occupational skills license/credential/certificate
54.1 42.5 46.2 41.1 45.1
Other 3.2 4.7 3.7 5.1 4.5
1 Based on exiters from October 2012 to September 2013. 2 Based on exiters from April 2012 to March 2013. 3 Based on exiters from January 2012 to December 2012. 4 Based on exiters from July 2012 to June 2013.

Dislocated Workers
Social Policy Research Associates 204
Table III-35 Outcomes of Dislocated Worker Exiters, by Gender and Disability
(Derived from PY 2013Q4 WIASRD Records)
Employment at Participation Gender With a Disability Yes No Male Female
Number of exiters1 45,711 633,184 340,223 324,210 21,566
Common Measures Entered employment (quarter after exit) (excludes employed at entry)1
60.0 60.7 58.7 47.7
Retention in 2nd and 3rd quarters2 86.9 83.6 83.0 84.6 78.0 Average earnings in 2nd & 3rd qtrs.2 $13,169 $16,333 $17,878 $13,877 $13,332 Other WIA Performance and 12-
Month Outcomes
Retained employment 3rd quarter after exit2
89.1 86.4 86.0 87.2 81.3
Retained employment 4th quarter after exit3
86.2 83.2 82.6 84.2 77.3
Earnings replacement rate2 101.5 94.9 95.7 93.5 97.2 Earnings Change
2nd and 3rd quarters after exit2 $177 $-753 $-694 $-844 $-308 3rd and 4th quarters after exit3 $-250 $-949 $-967 $-1,019 $-667
Credential and employment rate1 42.1 51.2 51.0 50.3 44.6 Information about Employment in
Quarter after exit
Occupation of employment1
Managerial, professional, & technical
25.6 29.4 25.5 33.4 31.9
Healthcare practitioners and technical occupations
8.5 5.7 2.5 9.7 5.4
Service occupations 17.0 14.0 8.3 20.2 14.7 Healthcare support occupations
8.3 6.1 1.5 11.3 5.1
Sales and clerical 21.3 23.1 11.6 34.5 24.8 Farming, fishing, forestry, construction and extraction
3.4 4.2 7.4 0.6 4.6
Installation, repair, production, transportation, and material moving
32.8 29.2 47.2 11.3 24.1
Nontraditional employment1 1.7 1.8 1.7 1.8 1.9 Males 1.7 1.7 1.7 2.4 Females 1.8 1.8 1.8 1.2
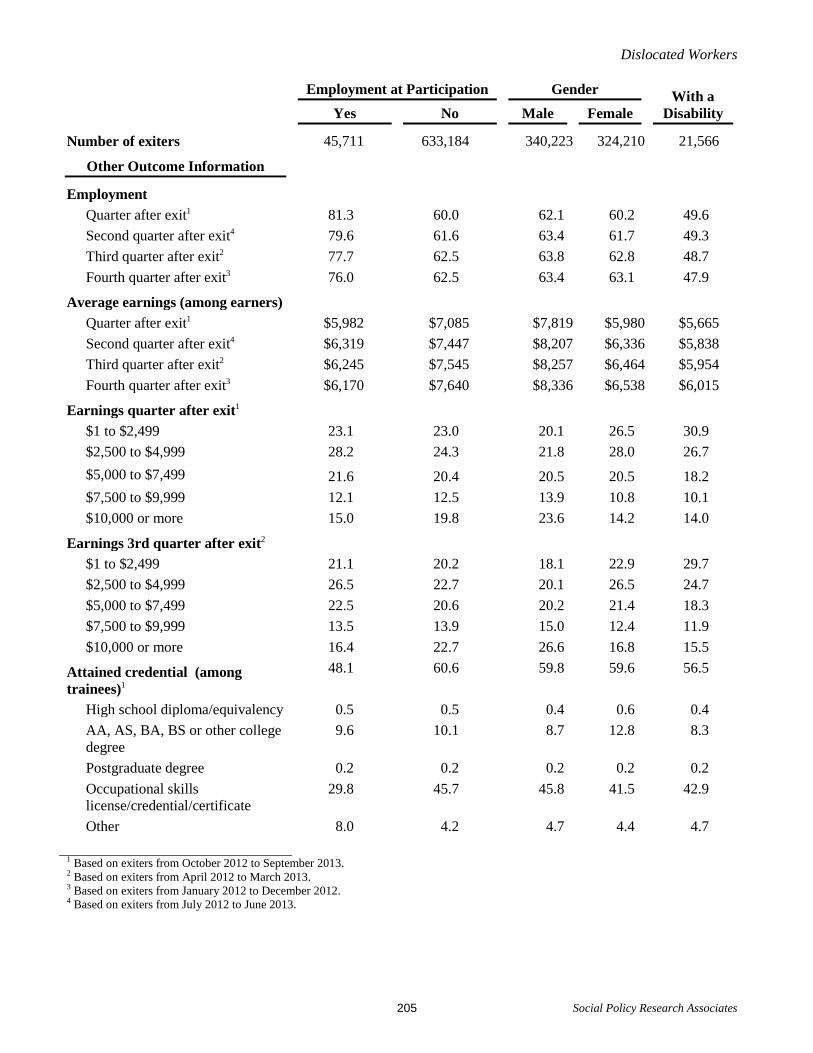
Dislocated Workers
Social Policy Research Associates 205
Employment at Participation Gender With a Disability Yes No Male Female
Number of exiters 45,711 633,184 340,223 324,210 21,566
Other Outcome Information
Employment
Quarter after exit1 81.3 60.0 62.1 60.2 49.6 Second quarter after exit4 79.6 61.6 63.4 61.7 49.3 Third quarter after exit2 77.7 62.5 63.8 62.8 48.7 Fourth quarter after exit3 76.0 62.5 63.4 63.1 47.9
Average earnings (among earners)
Quarter after exit1 $5,982 $7,085 $7,819 $5,980 $5,665 Second quarter after exit4 $6,319 $7,447 $8,207 $6,336 $5,838 Third quarter after exit2 $6,245 $7,545 $8,257 $6,464 $5,954 Fourth quarter after exit3 $6,170 $7,640 $8,336 $6,538 $6,015
Earnings quarter after exit1
$1 to $2,499 23.1 23.0 20.1 26.5 30.9 $2,500 to $4,999 28.2 24.3 21.8 28.0 26.7 $5,000 to $7,499 21.6 20.4 20.5 20.5 18.2 $7,500 to $9,999 12.1 12.5 13.9 10.8 10.1 $10,000 or more 15.0 19.8 23.6 14.2 14.0
Earnings 3rd quarter after exit2
$1 to $2,499 21.1 20.2 18.1 22.9 29.7 $2,500 to $4,999 26.5 22.7 20.1 26.5 24.7 $5,000 to $7,499 22.5 20.6 20.2 21.4 18.3 $7,500 to $9,999 13.5 13.9 15.0 12.4 11.9 $10,000 or more 16.4 22.7 26.6 16.8 15.5
Attained credential (among trainees)1
48.1 60.6 59.8 59.6 56.5
High school diploma/equivalency 0.5 0.5 0.4 0.6 0.4 AA, AS, BA, BS or other college degree
9.6 10.1 8.7 12.8 8.3
Postgraduate degree 0.2 0.2 0.2 0.2 0.2 Occupational skills license/credential/certificate
29.8 45.7 45.8 41.5 42.9
Other 8.0 4.2 4.7 4.4 4.7
1 Based on exiters from October 2012 to September 2013. 2 Based on exiters from April 2012 to March 2013. 3 Based on exiters from January 2012 to December 2012. 4 Based on exiters from July 2012 to June 2013.

Dislocated Workers
Social Policy Research Associates 206
Table III-36 Outcomes of Dislocated Worker Exiters, by Veteran Status
(Derived from PY 2013Q4 WIASRD Records)
All Exiters Veteran Campaign Veteran
Recently Separated Veteran
Disabled Veteran
Number of exiters1 678,895 49,643 14,395 5,113 6,389
Common Measures Entered employment (quarter after exit) (excludes employed at entry)1
60.0 57.3 58.2 56.9 53.5
Retention in 2nd and 3rd quarters2 83.9 81.6 81.1 78.7 80.4 Average earnings in 2nd & 3rd qtrs.2 $16,040 $17,164 $17,425 $15,422 $17,605
Other WIA Performance and 12-Month Outcomes
Retained employment 3rd quarter after exit2
86.6 84.5 83.9 81.7 83.4
Retained employment 4th quarter after exit3
83.5 80.5 79.3 77.7 78.4
Earnings replacement rate2 95.4 95.0 94.9 73.2 94.9 Earnings Change
2nd and 3rd quarters after exit2 $-670 $-761 $-790 $-4,617 $-791
3rd and 4th quarters after exit3 $-884 $-1,153 $-1,378 $-5,109 $-1,134 Credential and employment rate1 50.7 45.3 43.0 39.0 39.9
Employment in Quarter after exit
Occupation of employment1
Managerial, professional, & technical
29.3 29.1 31.5 23.9 35.5
Healthcare practitioners and technical occupations
5.8 3.8 3.2 4.1 4.1
Service occupations 14.1 10.5 10.5 15.0 10.9 Healthcare support occupations 6.2 2.3 1.6 1.8 1.7
Sales and clerical 23.0 13.7 14.6 12.2 13.6 Farming, fishing, forestry, construction and extraction
4.2 6.3 5.6 8.3 6.2
Installation, repair, production, transportation, and material moving
29.4 40.4 37.7 40.6 33.9
Nontraditional employment1 1.8 2.5 4.0 4.7 3.1 Males 1.7 2.3 3.6 4.5 2.5 Females 1.8 3.7 8.4 6.0 7.2
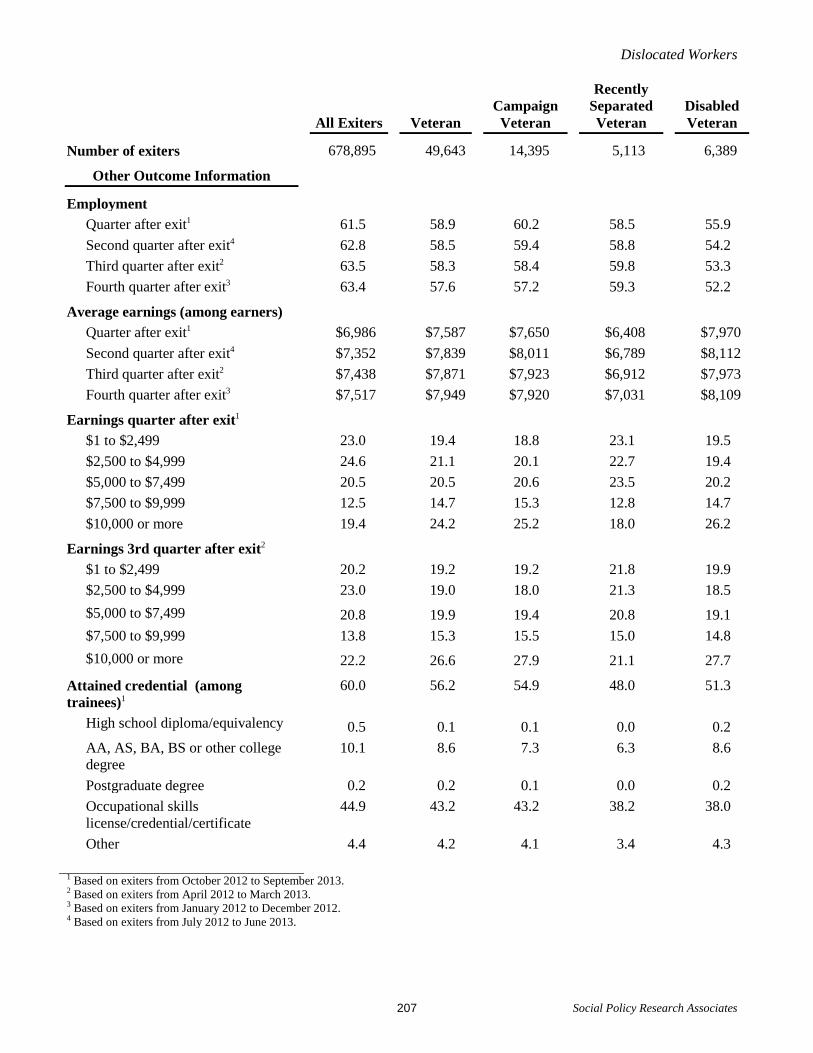
Dislocated Workers
Social Policy Research Associates 207
All Exiters Veteran Campaign Veteran
Recently Separated Veteran
Disabled Veteran
Number of exiters 678,895 49,643 14,395 5,113 6,389
Other Outcome Information
Employment
Quarter after exit1 61.5 58.9 60.2 58.5 55.9 Second quarter after exit4 62.8 58.5 59.4 58.8 54.2 Third quarter after exit2 63.5 58.3 58.4 59.8 53.3 Fourth quarter after exit3 63.4 57.6 57.2 59.3 52.2
Average earnings (among earners)
Quarter after exit1 $6,986 $7,587 $7,650 $6,408 $7,970 Second quarter after exit4 $7,352 $7,839 $8,011 $6,789 $8,112 Third quarter after exit2 $7,438 $7,871 $7,923 $6,912 $7,973 Fourth quarter after exit3 $7,517 $7,949 $7,920 $7,031 $8,109
Earnings quarter after exit1
$1 to $2,499 23.0 19.4 18.8 23.1 19.5 $2,500 to $4,999 24.6 21.1 20.1 22.7 19.4 $5,000 to $7,499 20.5 20.5 20.6 23.5 20.2 $7,500 to $9,999 12.5 14.7 15.3 12.8 14.7 $10,000 or more 19.4 24.2 25.2 18.0 26.2
Earnings 3rd quarter after exit2
$1 to $2,499 20.2 19.2 19.2 21.8 19.9 $2,500 to $4,999 23.0 19.0 18.0 21.3 18.5 $5,000 to $7,499 20.8 19.9 19.4 20.8 19.1 $7,500 to $9,999 13.8 15.3 15.5 15.0 14.8 $10,000 or more 22.2 26.6 27.9 21.1 27.7
Attained credential (among trainees)1
60.0 56.2 54.9 48.0 51.3
High school diploma/equivalency 0.5 0.1 0.1 0.0 0.2 AA, AS, BA, BS or other college degree
10.1 8.6 7.3 6.3 8.6
Postgraduate degree 0.2 0.2 0.1 0.0 0.2 Occupational skills license/credential/certificate
44.9 43.2 43.2 38.2 38.0
Other 4.4 4.2 4.1 3.4 4.3
1 Based on exiters from October 2012 to September 2013. 2 Based on exiters from April 2012 to March 2013. 3 Based on exiters from January 2012 to December 2012. 4 Based on exiters from July 2012 to June 2013.

Dislocated Workers
Social Policy Research Associates 208
Table III-37 Outcomes of Dislocated Worker Exiters, by UI Status
(Derived from PY 2013Q4 WIASRD Records)
All Exiters
UI Claimant
All Referred by WPRS
Not Referred by
WPRS UI
Exhaustee
Number of exiters1 678,895 375,301 91,994 283,307 17,184 Common Measures
Entered employment (quarter after exit) (excludes employed at entry)1
60.0 64.7 63.3 65.1 63.5
Retention in 2nd and 3rd quarters2 83.9 85.0 85.3 84.9 82.6 Average earnings in 2nd & 3rd qtrs.2
$16,040 $15,371 $16,746 $14,952 $13,660
Other WIA Performance and 12-Month Outcomes
Retained employment 3rd quarter after exit2
86.6 87.6 87.8 87.5 85.5
Retained employment 4th quarter after exit3
83.5 84.1 85.2 83.8 81.7
Earnings replacement rate2 95.4 95.3 86.3 98.8 259.5 Earnings Change
2nd and 3rd quarters after exit2 $-670 $-658 $-2,326 $-152 $7,129 3rd and 4th quarters after exit3 $-884 $-875 $-2,390 $-402 $7,039
Credential and employment rate1 50.7 52.6 43.6 56.1 49.2 Employment in Quarter after
exit
Occupation of employment1
Managerial, professional, & technical
29.3 29.7 27.5 30.4 26.5
Healthcare practitioners and technical occupations
5.8 5.5 5.6 5.5 6.9
Service occupations 14.1 14.0 14.1 13.9 15.7 Healthcare support occupations
6.2 6.2 5.8 6.4 6.5
Sales and clerical 23.0 23.8 24.1 23.8 24.9 Farming, fishing, forestry, construction and extraction
4.2 3.9 4.4 3.7 3.8
Installation, repair, production, transportation, and material moving
29.4 28.6 29.9 28.2 29.2
Nontraditional employment1 1.8 3.1 1.8 4.0 4.1 Males 1.7 2.9 1.7 3.8 4.4 Females 1.8 3.3 1.7 4.5 4.0

Dislocated Workers
Social Policy Research Associates 209
All Exiters
UI Claimant
All Referred by WPRS
Not Referred by
WPRS UI
Exhaustee
Number of exiters 678,895 375,301 91,994 283,307 17,184
Other Outcome Information
Employment
Quarter after exit1 61.5 66.2 63.8 66.9 64.3 Second quarter after exit4 62.8 67.2 64.0 68.2 64.4 Third quarter after exit2 63.5 66.9 63.9 67.9 64.0 Fourth quarter after exit3 63.4 65.9 63.9 66.6 62.2
Average earnings (among earners)
Quarter after exit1 $6,986 $6,719 $7,504 $6,475 $5,835 Second quarter after exit4 $7,352 $7,117 $7,789 $6,910 $6,124 Third quarter after exit2 $7,438 $7,156 $7,814 $6,954 $6,267 Fourth quarter after exit3 $7,517 $7,207 $7,964 $6,959 $6,424
Earnings quarter after exit1
$1 to $2,499 23.0 21.5 18.9 22.4 24.1 $2,500 to $4,999 24.6 24.9 23.2 25.5 27.1 $5,000 to $7,499 20.5 22.0 22.6 21.8 22.5 $7,500 to $9,999 12.5 13.2 14.2 12.9 12.5 $10,000 or more 19.4 18.4 21.2 17.6 13.8
Earnings 3rd quarter after exit2
$1 to $2,499 20.2 19.1 17.9 19.5 21.7 $2,500 to $4,999 23.0 23.3 21.4 23.9 24.6 $5,000 to $7,499 20.8 22.0 21.8 22.1 23.6 $7,500 to $9,999 13.8 14.4 15.1 14.2 14.1 $10,000 or more 22.2 21.1 23.8 20.3 16.0
Attained credential (among trainees)1
60.0 61.6 52.2 65.3 61.2
High school diploma/equivalency
0.5 0.4 0.4 0.3 0.3
AA, AS, BA, BS or other college degree
10.1 10.5 9.6 10.9 7.0
Postgraduate degree 0.2 0.2 0.1 0.2 0.1 Occupational skills license/credential/certificate
44.9 46.6 39.1 49.6 48.9
Other 4.4 3.9 3.0 4.2 4.9 1 Based on exiters from October 2012 to September 2013. 2 Based on exiters from April 2012 to March 2013. 3 Based on exiters from January 2012 to December 2012. 4 Based on exiters from July 2012 to June 2013.

Dislocated Workers
Social Policy Research Associates 210
Table III-38 Outcomes of Dislocated Worker Exiters who Received Intensive or Training Services,
by Highest Grade Completed (Derived from PY 2013Q4 WIASRD Records)
With Intensive or Training
Services
Less than High
School
High School
Graduate
Some Post-
secondary College
Graduate
Number of exiters1 203,218 14,674 83,229 63,967 41,157 Common Measures
Entered employment (quarter after exit) (excludes employed at entry)1
72.1 61.3 73.8 72.5 71.9
Retention in 2nd and 3rd quarters2 87.4 82.2 87.4 88.0 88.2 Average earnings in 2nd & 3rd qtrs.2 $16,983 $12,247 $14,521 $16,245 $25,044 Other WIA Performance and 12-
Month Outcomes
Retained employment 3rd quarter after exit2
89.6 85.2 89.7 90.2 90.2
Retained employment 4th quarter after exit3
86.6 81.4 86.7 87.3 87.4
Earnings replacement rate2 106.3 105.2 113.1 109.5 96.3 Earnings Change
2nd and 3rd quarters after exit2 $902 $510 $1,504 $1,266 $-857 3rd and 4th quarters after exit3 $902 $627 $1,589 $1,296 $-1,119
Credential and employment rate1 50.7 44.8 53.0 49.3 49.0 Employment in Quarter after exit
Occupation of employment1
Managerial, professional, & technical
29.5 6.4 16.8 32.3 61.8
Healthcare practitioners and technical occupations
6.3 1.0 5.1 9.5 5.7
Service occupations 14.1 22.5 16.6 13.7 6.4 Healthcare support occupations
6.7 5.5 8.1 7.4 2.7
Sales and clerical 22.7 13.8 22.5 24.9 21.9 Farming, fishing, forestry, construction and extraction
4.1 9.6 5.1 3.6 1.1
Installation, repair, production, transportation, and material moving
29.6 47.7 38.9 25.5 8.8
Nontraditional employment1 3.0 2.5 3.2 2.8 2.8 Males 2.9 1.2 2.9 3.1 3.1 Females 3.1 4.4 3.7 2.5 2.6
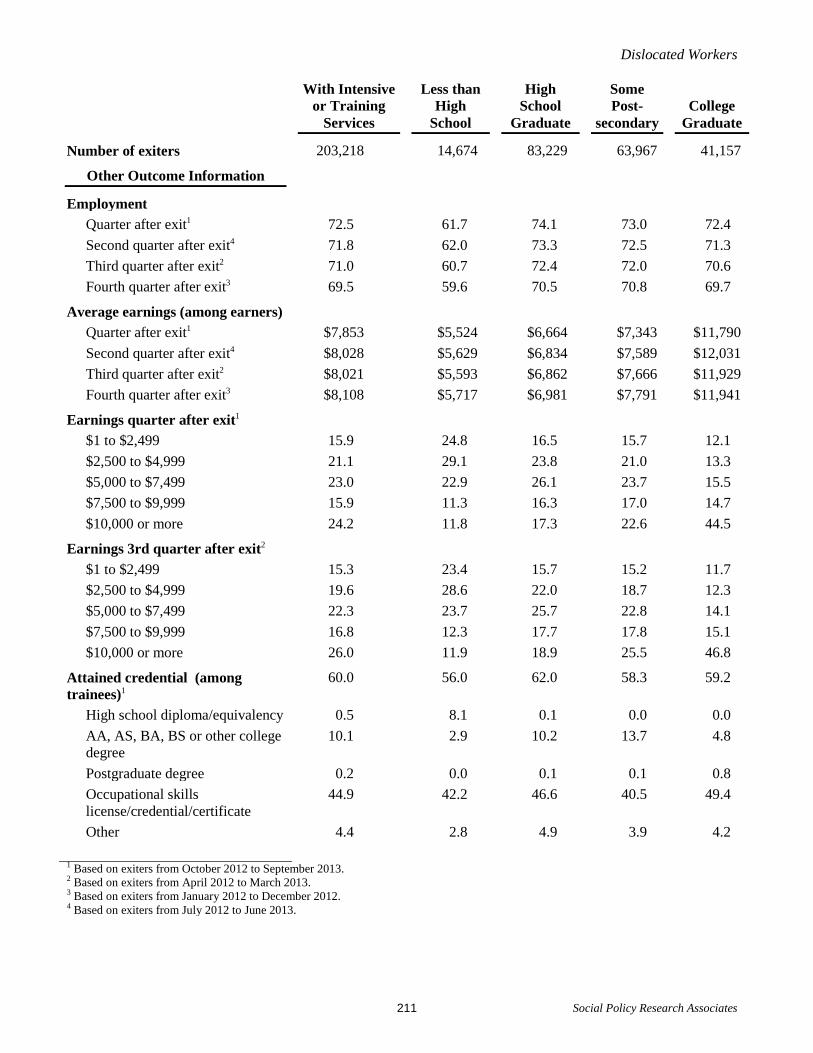
Dislocated Workers
Social Policy Research Associates 211
With Intensive or Training
Services
Less than High
School
High School
Graduate
Some Post-
secondary College
Graduate
Number of exiters 203,218 14,674 83,229 63,967 41,157
Other Outcome Information
Employment
Quarter after exit1 72.5 61.7 74.1 73.0 72.4 Second quarter after exit4 71.8 62.0 73.3 72.5 71.3 Third quarter after exit2 71.0 60.7 72.4 72.0 70.6 Fourth quarter after exit3 69.5 59.6 70.5 70.8 69.7
Average earnings (among earners)
Quarter after exit1 $7,853 $5,524 $6,664 $7,343 $11,790 Second quarter after exit4 $8,028 $5,629 $6,834 $7,589 $12,031 Third quarter after exit2 $8,021 $5,593 $6,862 $7,666 $11,929 Fourth quarter after exit3 $8,108 $5,717 $6,981 $7,791 $11,941
Earnings quarter after exit1
$1 to $2,499 15.9 24.8 16.5 15.7 12.1 $2,500 to $4,999 21.1 29.1 23.8 21.0 13.3 $5,000 to $7,499 23.0 22.9 26.1 23.7 15.5 $7,500 to $9,999 15.9 11.3 16.3 17.0 14.7 $10,000 or more 24.2 11.8 17.3 22.6 44.5
Earnings 3rd quarter after exit2
$1 to $2,499 15.3 23.4 15.7 15.2 11.7 $2,500 to $4,999 19.6 28.6 22.0 18.7 12.3 $5,000 to $7,499 22.3 23.7 25.7 22.8 14.1 $7,500 to $9,999 16.8 12.3 17.7 17.8 15.1 $10,000 or more 26.0 11.9 18.9 25.5 46.8
Attained credential (among trainees)1
60.0 56.0 62.0 58.3 59.2
High school diploma/equivalency 0.5 8.1 0.1 0.0 0.0 AA, AS, BA, BS or other college degree
10.1 2.9 10.2 13.7 4.8
Postgraduate degree 0.2 0.0 0.1 0.1 0.8 Occupational skills license/credential/certificate
44.9 42.2 46.6 40.5 49.4
Other 4.4 2.8 4.9 3.9 4.2
1 Based on exiters from October 2012 to September 2013. 2 Based on exiters from April 2012 to March 2013. 3 Based on exiters from January 2012 to December 2012. 4 Based on exiters from July 2012 to June 2013.

Dislocated Workers
Social Policy Research Associates 212
Table III-39 Outcomes of Dislocated Worker Exiters who Received Intensive or Training Services,
by Selected Characteristics (Derived from PY 2013Q4 WIASRD Records)
With Intensive or Training
Services
Limited English-Language
(excludes Puerto Rico)
Single Parent
Pell Grant Recipient (among trainees, excludes
Puerto Rico)
Number of exiters1 203,218 3,277 17,849 6,969 Common Measures
Entered employment (quarter after exit) (excludes employed at entry)1
72.1 70.5 79.2 81.9
Retention in 2nd and 3rd quarters2 87.4 87.3 88.7 92.2 Average earnings in 2nd & 3rd qtrs.2 $16,983 $13,352 $14,594 $14,821
Other WIA Performance and 12-Month Outcomes
Retained employment 3rd quarter after exit2
89.6 89.8 90.9 93.6
Retained employment 4th quarter after exit3
86.6 86.9 87.9 90.9
Earnings replacement rate2 106.3 113.9 130.6 171.8 Earnings Change
2nd and 3rd quarters after exit2 $902 $1,466 $3,093 $5,800 3rd and 4th quarters after exit3 $902 $1,838 $3,046 $5,826
Credential and employment rate1 50.7 46.6 52.6 56.4 Employment in Quarter after exit
Occupation of employment1
Managerial, professional, & technical
29.5 11.0 27.9 37.6
Healthcare practitioners and technical occupations
6.3 2.0 9.4 21.3
Service occupations 14.1 26.6 20.9 16.3 Healthcare support occupations 6.7 7.4 12.5 10.3
Sales and clerical 22.7 13.7 28.1 22.0 Farming, fishing, forestry, construction and extraction
4.1 5.3 2.5 2.1
Installation, repair, production, transportation, and material moving
29.6 43.4 20.6 22.0
Nontraditional employment1 3.0 3.4 4.2 4.9 Males 2.9 1.8 3.5 7.7 Females 3.1 4.9 4.4 3.3

Dislocated Workers
Social Policy Research Associates 213
With Intensive or Training
Services
Limited English-Language
(excludes Puerto Rico)
Single Parent
Pell Grant Recipient (among trainees, excludes
Puerto Rico)
Number of exiters 203,218 3,277 17,849 6,969
Other Outcome Information
Employment
Quarter after exit1 72.5 70.5 79.5 82.1 Second quarter after exit4 71.8 71.0 78.7 82.3 Third quarter after exit2 71.0 70.9 78.7 82.4 Fourth quarter after exit3 69.5 69.4 77.2 81.2
Average earnings (among earners)
Quarter after exit1 $7,853 $6,175 $6,633 $6,675 Second quarter after exit4 $8,028 $6,310 $6,821 $6,962 Third quarter after exit2 $8,021 $6,307 $6,943 $7,197 Fourth quarter after exit3 $8,108 $6,498 $7,096 $7,356
Earnings quarter after exit1
$1 to $2,499 15.9 17.5 16.7 13.2 $2,500 to $4,999 21.1 28.7 24.5 23.0 $5,000 to $7,499 23.0 27.1 26.4 29.2 $7,500 to $9,999 15.9 12.5 15.3 17.6 $10,000 or more 24.2 14.2 17.2 17.0
Earnings 3rd quarter after exit2
$1 to $2,499 15.3 17.2 15.3 11.7 $2,500 to $4,999 19.6 27.7 23.0 20.0 $5,000 to $7,499 22.3 27.2 25.4 27.2 $7,500 to $9,999 16.8 13.4 16.8 19.6 $10,000 or more 26.0 14.5 19.6 21.5
Attained credential (among trainees)1
60.0 60.1 60.9 64.8
High school diploma/equivalency 0.5 2.6 0.6 0.2 AA, AS, BA, BS or other college degree
10.1 3.0 11.5 28.1
Postgraduate degree 0.2 0.1 0.1 0.0 Occupational skills license/credential/certificate
44.9 51.6 45.5 32.6
Other 4.4 2.8 3.2 3.9
1 Based on exiters from October 2012 to September 2013. 2 Based on exiters from April 2012 to March 2013. 3 Based on exiters from January 2012 to December 2012. 4 Based on exiters from July 2012 to June 2013.

Dislocated Workers
Social Policy Research Associates 214
Table III-40 Outcomes of Dislocated Worker Exiters, by Major Service Categories
(Derived from PY 2013Q4 WIASRD Records)
All Exiters
Core
Services Only
Core and Intensive Services
Only
Training
ITA Established
(among trainees)
Number of exiters1 678,895 475,677 111,800 91,418 63,797 Common Measures
Entered employment (quarter after exit) (excludes employed at entry)1
60.0 54.8 65.0 81.0 80.9
Retention in 2nd and 3rd quarters2 83.9 81.7 85.0 89.9 90.0 Average earnings in 2nd & 3rd qtrs.2
$16,040 $15,452 $16,894 $17,073 $17,276
Other WIA Performance and 12-Month Outcomes
Retained employment 3rd quarter after exit2
86.6 84.9 87.5 91.7 91.8
Retained employment 4th quarter after exit3
83.5 81.4 84.9 88.5 88.5
Earnings replacement rate2 95.4 89.2 92.7 124.5 125.0 Earnings Change
2nd and 3rd quarters after exit2 $-670 $-1,585 $-1,154 $3,080 $3,171 3rd and 4th quarters after exit3 $-884 $-2,010 $-1,116 $3,194 $3,191
Credential and employment rate1 50.7 50.7 57.5 Employment in Quarter after exit
Occupation of employment1
Managerial, professional, & technical
29.3 26.4 27.3 30.6 33.4
Healthcare practitioners and technical occupations
5.8 0.0 3.0 7.9 9.3
Service occupations 14.1 14.5 13.5 14.4 15.6 Healthcare support occupations
6.2 0.0 3.7 8.2 9.4
Sales and clerical 23.0 27.1 27.6 20.3 19.3 Farming, fishing, forestry, construction and extraction
4.2 4.8 4.9 3.7 3.3
Installation, repair, production, transportation, and material moving
29.4 27.2 26.7 30.9 28.4
Nontraditional employment1 1.8 0.5 1.7 4.2 3.8 Males 1.7 0.4 1.3 4.3 4.2 Females 1.8 0.6 2.0 4.0 3.5

Dislocated Workers
Social Policy Research Associates 215
All Exiters
Core
Services Only
Core and Intensive Services
Only
Training
ITA Established
(among trainees)
Number of exiters 678,895 475,677 111,800 91,418 63,797
Other Outcome Information
Employment
Quarter after exit1 61.5 56.8 65.4 81.3 81.1 Second quarter after exit4 62.8 58.8 64.9 80.5 80.5 Third quarter after exit2 63.5 60.0 64.3 79.9 80.0 Fourth quarter after exit3 63.4 60.2 63.7 77.9 77.9
Average earnings (among earners)
Quarter after exit1 $6,986 $6,534 $7,837 $7,868 $7,783 Second quarter after exit4 $7,352 $7,000 $7,950 $8,107 $8,112 Third quarter after exit2 $7,438 $7,114 $7,829 $8,228 $8,337 Fourth quarter after exit3 $7,517 $7,157 $7,883 $8,375 $8,439
Earnings quarter after exit1
$1 to $2,499 23.0 26.7 18.7 12.9 13.5 $2,500 to $4,999 24.6 26.5 22.3 19.9 20.5 $5,000 to $7,499 20.5 19.2 21.5 24.6 24.2 $7,500 to $9,999 12.5 10.7 14.0 17.7 17.1 $10,000 or more 19.4 16.9 23.5 24.9 24.6
Earnings 3rd quarter after exit2
$1 to $2,499 20.2 23.0 18.6 11.7 11.6 $2,500 to $4,999 23.0 24.9 21.3 17.6 17.6 $5,000 to $7,499 20.8 19.9 21.1 23.7 23.2 $7,500 to $9,999 13.8 12.2 14.8 19.1 18.7 $10,000 or more 22.2 20.0 24.2 27.9 28.9
Attained credential (among trainees)1
60.0 60.0 68.0
High school diploma/equivalency
0.5 0.5 0.2
AA, AS, BA, BS or other college degree
10.1 10.1 10.8
Postgraduate degree 0.2 0.2 0.2 Occupational skills license/credential/certificate
44.9 44.9 53.5
Other 4.4 4.4 3.2 1 Based on exiters from October 2012 to September 2013.
2 Based on exiters from April 2012 to March 2013. 3 Based on exiters from January 2012 to December 2012. 4 Based on exiters from July 2012 to June 2013.

Dislocated Workers
Social Policy Research Associates 216
Table III-41 Outcomes of Dislocated Worker Exiters, by Type of Training
(Derived from PY 2013Q4 WIASRD Records)
No Training Any
Training
Basic Skills/ Remedial/
Prerequisite Training
On-the-job/ Apprentice
Training
Occupational/ Entrep./ Custom Training
Number of exiters1 587,477 91,418 2,418 10,636 80,648 Common Measures
Entered employment (quarter after exit) (excludes employed at entry)1
56.8 81.0 73.8 90.5 80.0
Retention in 2nd and 3rd quarters2 82.5 89.9 89.5 89.8 89.9 Average earnings in 2nd & 3rd qtrs.2 $15,795 $17,073 $13,849 $16,740 $17,165 Other WIA Performance and 12-
Month Outcomes
Retained employment 3rd quarter after exit2
85.5 91.7 91.4 91.6 91.8
Retained employment 4th quarter after exit3
82.3 88.5 86.7 88.0 88.6
Earnings replacement rate2 90.1 124.5 91.0 155.7 121.3 Earnings Change
2nd and 3rd quarters after exit2 $-1,486 $3,080 $-1,248 $5,469 $2,770 3rd and 4th quarters after exit3 $-1,785 $3,194 $-854 $5,778 $2,849
Credential and employment rate1 50.7 39.9 21.9 55.0 Employment in Quarter after exit
Occupation of employment1
Managerial, professional, & technical
27.1 30.6 24.2 19.2 32.8
Healthcare practitioners and technical occupations
2.3 7.9 7.9 1.5 9.1
Service occupations 13.7 14.4 19.9 6.6 15.6 Healthcare support occupations
2.8 8.2 7.2 1.8 9.3
Sales and clerical 27.5 20.3 20.8 24.5 19.6 Farming, fishing, forestry, construction and extraction
4.9 3.7 3.1 4.6 3.6
Installation, repair, production, transportation, and material moving
26.8 30.9 32.0 45.2 28.3
Nontraditional employment1 0.9 4.2 6.3 6.0 3.9 Males 0.7 4.3 5.1 5.6 4.1 Females 1.1 4.0 7.4 7.0 3.7

Dislocated Workers
Social Policy Research Associates 217
No Training Any
Training
Basic Skills/ Remedial/
Prerequisite Training
On-the-job/ Apprentice
Training
Occupational/ Entrep./ Custom Training
Number of exiters 587,477 91,418 2,418 10,636 80,648
Other Outcome Information
Employment
Quarter after exit1 58.4 81.3 73.7 90.5 80.4 Second quarter after exit4 60.0 80.5 73.1 88.1 79.7 Third quarter after exit2 60.9 79.9 72.3 86.3 79.3 Fourth quarter after exit3 61.0 77.9 70.9 83.1 77.4
Average earnings (among earners)
Quarter after exit1 $6,806 $7,868 $6,746 $8,187 $7,852 Second quarter after exit4 $7,198 $8,107 $6,657 $8,222 $8,121 Third quarter after exit2 $7,274 $8,228 $6,644 $8,090 $8,271 Fourth quarter after exit3 $7,337 $8,375 $6,856 $8,322 $8,401
Earnings quarter after exit1
$1 to $2,499 25.0 12.9 16.7 7.8 13.5 $2,500 to $4,999 25.6 19.9 25.6 15.7 20.3 $5,000 to $7,499 19.7 24.6 25.3 29.3 24.0 $7,500 to $9,999 11.4 17.7 15.0 23.6 17.0 $10,000 or more 18.3 24.9 17.4 23.7 25.2
Earnings 3rd quarter after exit2
$1 to $2,499 22.0 11.7 13.7 9.6 11.9 $2,500 to $4,999 24.1 17.6 26.0 15.5 17.7 $5,000 to $7,499 20.2 23.7 28.2 26.5 23.4 $7,500 to $9,999 12.8 19.1 15.8 23.6 18.6 $10,000 or more 21.0 27.9 16.3 24.8 28.5
Attained credential (among trainees)1
60.0 51.6 23.2 65.3
High school diploma/equivalency 0.5 10.3 0.2 0.3 AA, AS, BA, BS or other college degree
10.1 10.9 1.0 11.3
Postgraduate degree 0.2 0.0 0.0 0.2 Occupational skills license/credential/certificate
44.9 28.0 10.8 49.8
Other 4.4 2.4 11.2 3.5
1 Based on exiters from October 2012 to September 2013. 2 Based on exiters from April 2012 to March 2013. 3 Based on exiters from January 2012 to December 2012. 4 Based on exiters from July 2012 to June 2013.

Dislocated Workers
Social Policy Research Associates 218
Table III-42 Performance Outcomes of Dislocated Worker Exiters, by Characteristics
(Derived from PY 2013Q4 WIASRD Records)
Exiters from
October 2012 to September 2013 Exiters from
April 2012 to March 2013
Number
of Exiters
Entered Employ-
ment Rate (%)
Credential Attainment Rate (%)
Number of
Exiters
Retention 2nd and 3rd Quarters
(%)
Average Earnings
($)
Number of exiters 678,895 60.0 60.0 718,305 83.9 16,040 Statewide programs 15,360 79.5 55.8 18,269 91.1 17,508 Local programs 661,345 59.8 61.4 699,407 83.7 15,979 National Emergency Grants 25,188 73.6 49.0 26,648 88.0 18,292
Disaster Relief 3,885 56.5 39.3 3,735 76.0 14,067 Other 21,303 76.9 49.8 22,913 89.6 18,761
Characteristics of All Exiters Age categories
Under 22 20,735 67.2 48.9 23,042 80.4 8,847 22 to 29 121,430 63.3 56.9 129,545 83.3 12,869 30 to 44 231,128 62.7 61.1 245,625 85.1 16,849 45 to 54 168,563 62.6 61.1 179,120 85.2 17,972 55 and over 137,035 48.5 59.8 140,971 80.2 16,294
Gender Female 324,210 58.7 59.6 340,537 84.6 13,877 Male 340,223 60.7 59.8 361,888 83.0 17,878
Individual with a disability 21,566 47.7 56.5 21,818 78.0 13,332 Race and ethnicity
Hispanic 85,539 57.2 63.1 87,604 82.8 14,481 Not Hispanic
American Indian or Alaskan Native
4,860 60.7 55.8 5,250 81.4 14,078
Asian 19,093 49.8 57.2 19,683 84.6 23,563 Black or African American
119,437 59.6 56.4 120,265 82.3 12,790
Hawaiian or other Pacific Islander
1,834 60.6 58.4 1,950 84.4 15,097
White 391,082 61.7 60.7 424,987 84.5 16,724 More than one race 15,013 56.9 55.7 15,464 80.0 12,983
Veteran Status Veteran 49,643 57.3 56.2 55,023 81.6 17,164 Disabled veteran 6,389 53.5 51.3 6,780 80.4 17,605 Campaign veteran 14,395 58.2 54.9 15,855 81.1 17,425 Recently separated veteran 5,113 56.9 48.0 5,569 78.7 15,422 Other eligible person 664 55.3 52.3 700 82.8 13,622

Dislocated Workers
Social Policy Research Associates 219
Exiters from
October 2012 to September 2013 Exiters from
April 2012 to March 2013
Number
of Exiters
Entered Employ-
ment Rate (%)
Credential Attainment Rate (%)
Number of
Exiters
Retention 2nd and 3rd Quarters
(%)
Average Earnings
($)
Number of exiters 678,895 60 60 718,305 83.9 16,040 Employed at participation
Employed 45,711 48.1 47,999 86.9 13,169 Not employed or received layoff notice
633,184 60.0 60.6 670,306 83.6 16,333
Average preprogram quarterly earnings
None 86,403 50.4 59.7 103,263 81.2 13,996 $1 to $2,499 89,303 58.7 56.7 95,527 78.5 9,142 $2,500 to $4,999 140,361 60.2 59.1 146,209 82.3 10,124 $5,000 to $7,499 119,473 61.9 61.1 124,294 85.5 12,701 $7,500 to $9,999 82,683 62.9 62.7 86,539 87.0 15,710 $10,000 or more 160,672 62.9 59.9 162,473 86.7 28,194
Displaced homemaker 12,853 56.8 60.7 14,929 79.7 11,147 Time of participation
Before layoff 100,944 62.0 50.2 145,243 82.0 13,154 Within 8 weeks of layoff 172,244 67.8 60.8 152,085 86.9 16,067 Over 8 weeks after layoff 159,537 64.6 63.6 165,244 85.4 15,658
UI Claimant (all exiters) 375,301 64.7 61.6 408,032 85.0 15,371 UI Claimant referred by WPRS
91,994 63.3 52.2 100,290 85.3 16,746
UI Exhaustee 17,184 63.5 61.2 18,897 82.6 13,660 Characteristics of Exiters who Received Intensive or Training
Services
UI Claimant 156,442 72.1 61.6 180,322 87.8 17,255 UI Claimant referred by WPRS
72,507 64.3 52.2 80,744 85.6 17,613
UI Exhaustee 11,102 70.1 61.2 12,700 84.5 14,341
Limited English-language (excludes Puerto Rico)
3,277 70.5 60.1 3,834 87.3 13,352
Single parent 17,849 79.2 60.9 19,395 88.7 14,594 Low income 44,695 74.3 62.7 55,645 86.3 13,943

Dislocated Workers
Social Policy Research Associates 220
Exiters from
October 2012 to September 2013 Exiters from
April 2012 to March 2013
Number
of Exiters
Entered Employ-
ment Rate (%)
Credential Attainment Rate (%)
Number of
Exiters
Retention 2nd and 3rd Quarters
(%)
Average Earnings
($)
Number of exiters 678,895 60 60 718,305 83.9 16,040 Highest grade completed
8th or less 2,999 56.5 49.3 4,103 82.4 12,118 Some high school 11,675 62.5 57.6 14,169 82.1 12,282 High school graduate 71,977 73.7 62.2 83,649 87.7 14,679 High school equivalency 11,252 74.5 60.8 14,026 85.5 13,550 Some postsecondary 63,967 72.5 58.3 72,745 88.0 16,245 College graduate (4-year) 41,157 71.9 59.2 46,079 88.2 25,044

Dislocated Workers
Social Policy Research Associates 221
Table III-43 Performance Outcomes of Dislocated Worker Exiters, by Services Received
(Derived from PY 2013Q4 WIASRD Records)
Exiters from
October 2012 to September 2013 Exiters from
April 2012 to March 2013
Number of
Exiters
Entered Employ-
ment Rate (%)
Credential Attainment Rate (%)
Number of
Exiters
Retention 2nd and 3rd Quarters
(%)
Average Earnings
($)
All exiters 678,895 60.0 60.0 718,305 83.9 16,040
Coenrollment WIA adult 307,220 59.8 48.6 332,226 82.7 13,543 WIA youth 306 69.4 60.6 370 74.5 8,824 Partner program 630,493 58.8 59.3 670,742 83.4 15,960
Wagner-Peyser 625,367 58.7 59.2 665,877 83.3 15,941 TAA 15,611 76.0 60.3 17,792 91.4 17,335 National Farmworker Jobs 416 91.3 73.4 397 86.1 13,579 Veterans programs 17,113 56.0 53.2 18,388 81.2 17,619 Vocational Education 218 61.8 49.7 317 84.1 14,858 Adult Education 296 78.9 68.0 476 91.1 12,942 Title V Older Worker 25 41.7 77.8 26 90.9 21,282 Other partner programs 6,365 71.0 52.7 7,828 87.8 13,687
Services Received Rapid response 32,060 75.2 60.7 33,241 87.7 18,285 Disaster relief 3,885 56.5 39.3 3,735 76.0 14,067 Core self-service and informational activities
374,419 64.6 64.0 409,116 84.7 14,528
Staff-assisted core services 678,895 60.0 60.0 718,305 83.9 16,040 Intensive Services 203,218 72.1 60.0 235,047 87.4 16,983
Prevocational activities 38,515 70.4 53.9 42,896 87.7 16,799 Training services 91,418 81.0 60.0 101,773 89.9 17,073 Type of Training (among trainees)
On-the-job training 10,620 90.5 23.2 12,074 89.8 16,746 Skill upgrading 11,655 82.8 61.2 13,854 89.6 18,354 Entrepreneurial training 358 46.9 19.2 284 82.1 17,004 ABE or ESL in combination with training (non-TAA)
897 70.0 46.0 985 87.6 13,176
Customized training 1,208 77.7 67.5 1,300 89.9 18,247 Apprenticeship training 17 93.8 68.8 20 83.3 12,900 Other occupational skills training
68,633 79.8 66.3 75,893 90.0 16,918

Dislocated Workers
Social Policy Research Associates 222
Exiters from
October 2012 to September 2013 Exiters from
April 2012 to March 2013
Number of
Exiters
Entered Employ-
ment Rate (%)
Credential Attainment Rate (%)
Number of
Exiters
Retention 2nd and 3rd Quarters
(%)
Average Earnings
($) All exiters 678,895 60 60 718,305 83.9 16,040
Remedial training (ABE/ESL TAA only)
1,450 75.0 54.2 1,708 91.0 13,949
Prerequisite training 202 81.7 57.4 121 88.0 15,227 Completed any training (among trainees)
65,941 83.7 72.1 74,732 90.4 17,390
ITA established (among trainees) 63,797 80.9 68.0 71,430 90.0 17,276
Pell Grant recipient (among trainees, excludes Puerto Rico) 6,969 81.9 64.8 8,322 92.2 14,821
Needs-related payments 530 74.9 50.1 793 88.7 14,602 Other supportive services 43,669 80.0 70.1 47,089 89.3 16,332 Service category
Core services, including staff assisted, only
475,677 54.8 483,258 81.7 15,452
Intensive & core services only 111,800 65.0 133,274 85.0 16,894 Training services 91,418 81.0 60.0 101,773 89.9 17,073
Weeks participated 4 or fewer weeks 235,430 52.6 34.4 228,640 82.0 16,831 5 to 13 weeks 121,468 62.5 55.7 124,013 83.1 16,621 14 to 26 weeks 90,375 68.7 55.3 90,260 82.8 16,213 27 to 39 weeks 58,687 65.1 58.7 57,733 84.2 15,973 40 to 52 weeks 43,327 59.8 61.1 47,577 85.1 15,138 53 to 104 weeks 84,875 57.4 60.6 112,475 85.2 14,499 More than 104 weeks 44,733 72.8 63.7 57,607 89.4 15,391
Weeks of training
4 or fewer weeks 9,810 80.4 58.4 9,238 88.5 19,072 5 to 13 weeks 20,781 84.1 62.8 21,478 88.3 17,727 14 to 26 weeks 16,337 82.1 54.8 18,024 89.2 17,596 27 to 39 weeks 9,287 80.2 58.1 9,964 88.9 16,766 40 to 52 weeks 7,207 79.5 61.4 7,845 90.7 15,959 53 to 104 weeks 16,683 77.9 60.5 21,175 91.3 16,355 More than 104 weeks 10,537 80.6 63.7 13,112 92.4 16,324
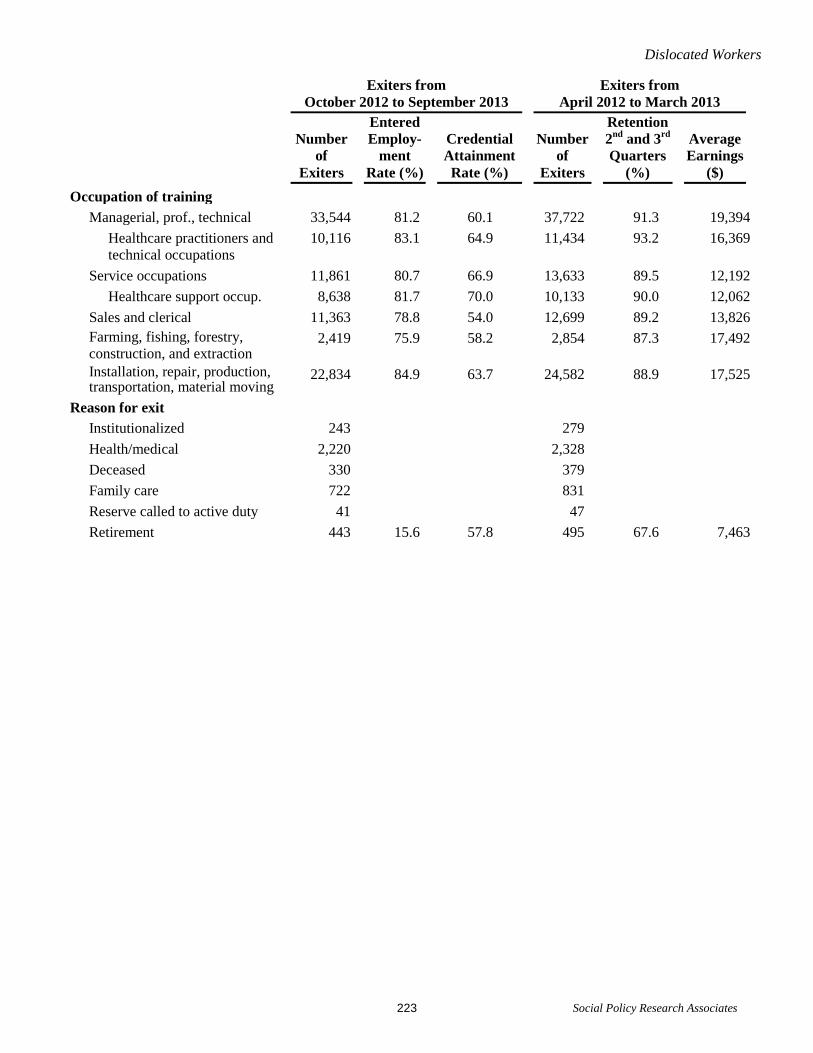
Dislocated Workers
Social Policy Research Associates 223
Exiters from
October 2012 to September 2013 Exiters from
April 2012 to March 2013
Number of
Exiters
Entered Employ-
ment Rate (%)
Credential Attainment Rate (%)
Number of
Exiters
Retention 2nd and 3rd Quarters
(%)
Average Earnings
($) Occupation of training
Managerial, prof., technical 33,544 81.2 60.1 37,722 91.3 19,394 Healthcare practitioners and technical occupations
10,116 83.1 64.9 11,434 93.2 16,369
Service occupations 11,861 80.7 66.9 13,633 89.5 12,192 Healthcare support occup. 8,638 81.7 70.0 10,133 90.0 12,062
Sales and clerical 11,363 78.8 54.0 12,699 89.2 13,826 Farming, fishing, forestry, construction, and extraction
2,419 75.9 58.2 2,854 87.3 17,492
Installation, repair, production, transportation, material moving
22,834 84.9 63.7 24,582 88.9 17,525
Reason for exit Institutionalized 243 279 Health/medical 2,220 2,328 Deceased 330 379 Family care 722 831 Reserve called to active duty 41 47 Retirement 443 15.6 57.8 495 67.6 7,463
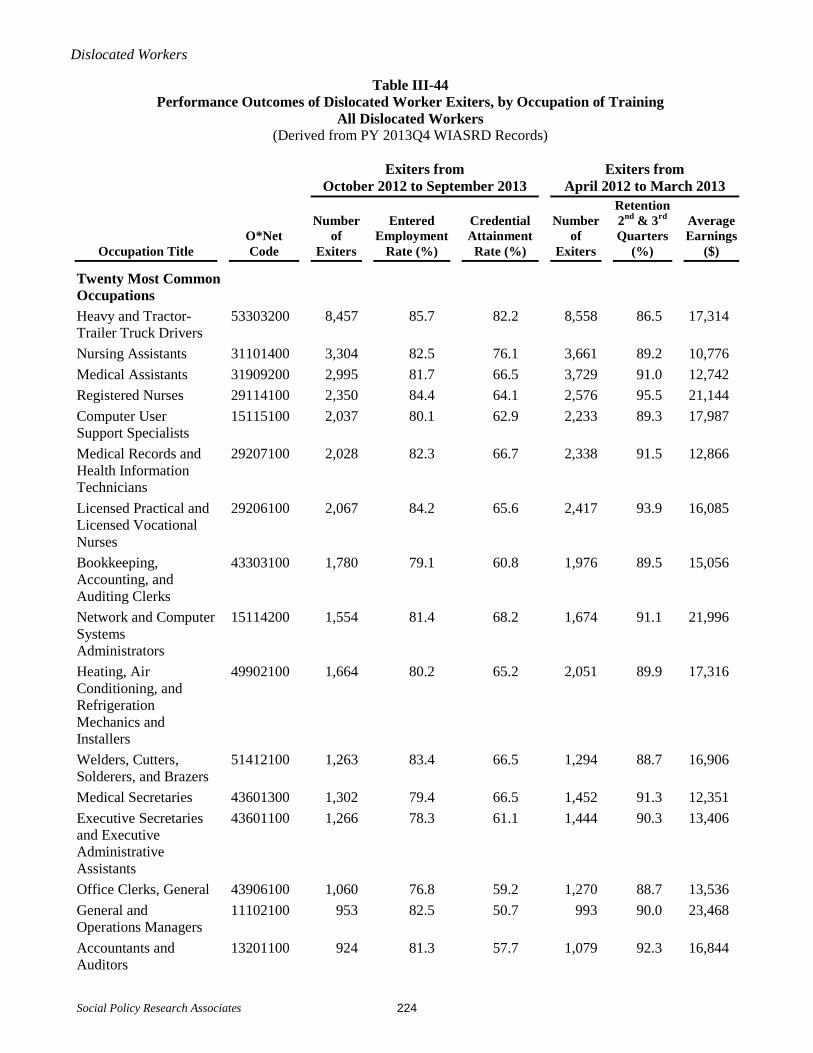
Dislocated Workers
Social Policy Research Associates 224
Table III-44 Performance Outcomes of Dislocated Worker Exiters, by Occupation of Training
All Dislocated Workers (Derived from PY 2013Q4 WIASRD Records)
Exiters from
October 2012 to September 2013 Exiters from
April 2012 to March 2013
Occupation Title O*Net Code
Number of
Exiters
Entered Employment
Rate (%)
Credential Attainment Rate (%)
Number of
Exiters
Retention 2nd & 3rd Quarters
(%)
Average Earnings
($)
Twenty Most Common Occupations
Heavy and Tractor-Trailer Truck Drivers
53303200 8,457 85.7 82.2 8,558 86.5 17,314
Nursing Assistants 31101400 3,304 82.5 76.1 3,661 89.2 10,776 Medical Assistants 31909200 2,995 81.7 66.5 3,729 91.0 12,742 Registered Nurses 29114100 2,350 84.4 64.1 2,576 95.5 21,144 Computer User Support Specialists
15115100 2,037 80.1 62.9 2,233 89.3 17,987
Medical Records and Health Information Technicians
29207100 2,028 82.3 66.7 2,338 91.5 12,866
Licensed Practical and Licensed Vocational Nurses
29206100 2,067 84.2 65.6 2,417 93.9 16,085
Bookkeeping, Accounting, and Auditing Clerks
43303100 1,780 79.1 60.8 1,976 89.5 15,056
Network and Computer Systems Administrators
15114200 1,554 81.4 68.2 1,674 91.1 21,996
Heating, Air Conditioning, and Refrigeration Mechanics and Installers
49902100 1,664 80.2 65.2 2,051 89.9 17,316
Welders, Cutters, Solderers, and Brazers
51412100 1,263 83.4 66.5 1,294 88.7 16,906
Medical Secretaries 43601300 1,302 79.4 66.5 1,452 91.3 12,351 Executive Secretaries and Executive Administrative Assistants
43601100 1,266 78.3 61.1 1,444 90.3 13,406
Office Clerks, General 43906100 1,060 76.8 59.2 1,270 88.7 13,536 General and Operations Managers
11102100 953 82.5 50.7 993 90.0 23,468
Accountants and Auditors
13201100 924 81.3 57.7 1,079 92.3 16,844

Dislocated Workers
Social Policy Research Associates 225
Exiters from
October 2012 to September 2013 Exiters from
April 2012 to March 2013
Occupation Title O*Net Code
Number of
Exiters
Entered Employment
Rate (%)
Credential Attainment Rate (%)
Number of
Exiters
Retention 2nd & 3rd Quarters
(%)
Average Earnings
($)
Computer and Information Systems Managers
11302100 801 82.6 68.4 838 89.5 27,107
Customer Service Representatives
43405100 858 86.6 33.0 885 88.8 12,683
Computer Occupations, All Other
15119900 781 82.2 65.6 876 91.6 24,258
Business Operations Specialists, All Other
13119900 867 83.2 52.5 905 93.2 20,235
Ten Most Common Healthcare Occupations
Nursing Assistants 31101400 3,304 82.5 76.1 3,661 89.2 10,776 Medical Assistants 31909200 2,995 81.7 66.5 3,729 91.0 12,742 Registered Nurses 29114100 2,350 84.4 64.1 2,576 95.5 21,144 Medical Records and Health Information Technicians
29207100 2,028 82.3 66.7 2,338 91.5 12,866
Licensed Practical and Licensed Vocational Nurses
29206100 2,067 84.2 65.6 2,417 93.9 16,085
Pharmacy Technicians 29205200 658 81.7 68.5 770 91.7 11,833 Dental Assistants 31909100 446 80.8 69.3 472 88.1 11,922 Occupational Health and Safety Specialists
29901100 218 74.4 71.4 87 82.3 20,134
Healthcare Support Workers, All Other
31909900 457 80.6 61.2 542 89.0 11,909
Medical and Clinical Laboratory Technicians
29201200 370 79.2 66.9 440 91.2 14,233
Note: Most common occupations of training based on trainees who exited from April 2013 to March 2014.
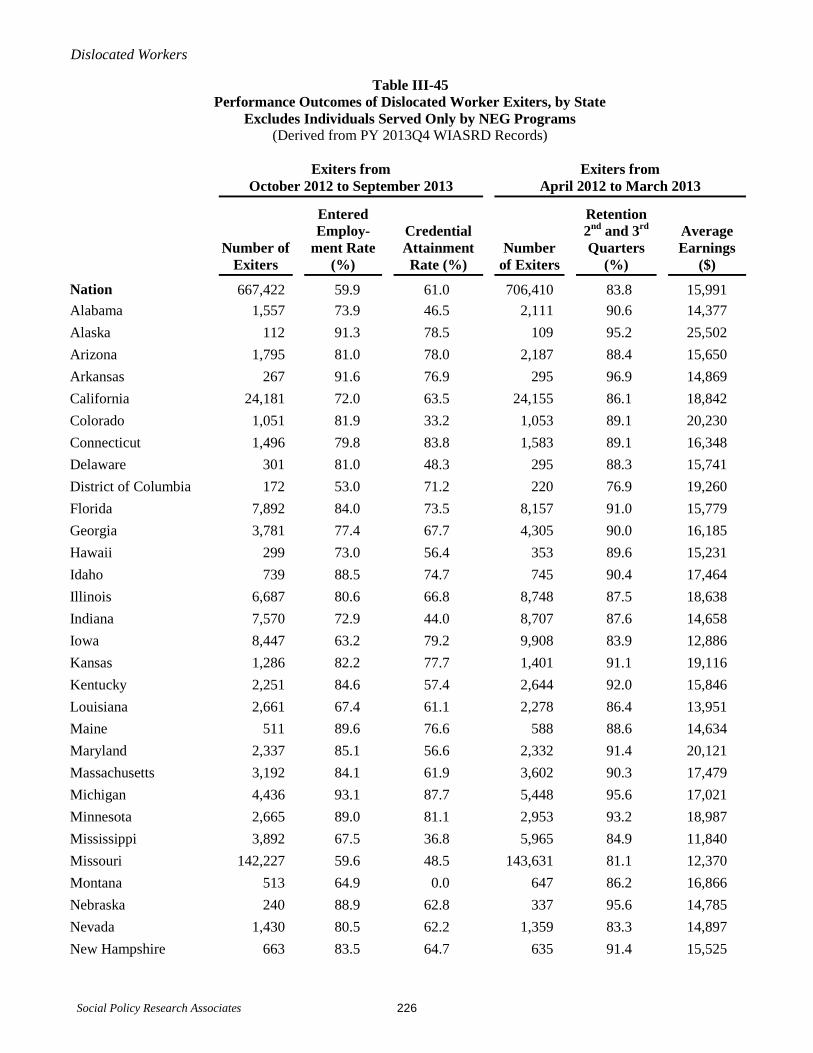
Dislocated Workers
Social Policy Research Associates 226
Table III-45 Performance Outcomes of Dislocated Worker Exiters, by State
Excludes Individuals Served Only by NEG Programs (Derived from PY 2013Q4 WIASRD Records)
Exiters from
October 2012 to September 2013 Exiters from
April 2012 to March 2013
Number of
Exiters
Entered Employ-
ment Rate (%)
Credential Attainment Rate (%)
Number of Exiters
Retention 2nd and 3rd Quarters
(%)
Average Earnings
($)
Nation 667,422 59.9 61.0 706,410 83.8 15,991 Alabama 1,557 73.9 46.5 2,111 90.6 14,377 Alaska 112 91.3 78.5 109 95.2 25,502 Arizona 1,795 81.0 78.0 2,187 88.4 15,650 Arkansas 267 91.6 76.9 295 96.9 14,869 California 24,181 72.0 63.5 24,155 86.1 18,842 Colorado 1,051 81.9 33.2 1,053 89.1 20,230 Connecticut 1,496 79.8 83.8 1,583 89.1 16,348 Delaware 301 81.0 48.3 295 88.3 15,741 District of Columbia 172 53.0 71.2 220 76.9 19,260 Florida 7,892 84.0 73.5 8,157 91.0 15,779 Georgia 3,781 77.4 67.7 4,305 90.0 16,185 Hawaii 299 73.0 56.4 353 89.6 15,231 Idaho 739 88.5 74.7 745 90.4 17,464 Illinois 6,687 80.6 66.8 8,748 87.5 18,638 Indiana 7,570 72.9 44.0 8,707 87.6 14,658 Iowa 8,447 63.2 79.2 9,908 83.9 12,886 Kansas 1,286 82.2 77.7 1,401 91.1 19,116 Kentucky 2,251 84.6 57.4 2,644 92.0 15,846 Louisiana 2,661 67.4 61.1 2,278 86.4 13,951 Maine 511 89.6 76.6 588 88.6 14,634 Maryland 2,337 85.1 56.6 2,332 91.4 20,121 Massachusetts 3,192 84.1 61.9 3,602 90.3 17,479 Michigan 4,436 93.1 87.7 5,448 95.6 17,021 Minnesota 2,665 89.0 81.1 2,953 93.2 18,987 Mississippi 3,892 67.5 36.8 5,965 84.9 11,840 Missouri 142,227 59.6 48.5 143,631 81.1 12,370 Montana 513 64.9 0.0 647 86.2 16,866 Nebraska 240 88.9 62.8 337 95.6 14,785 Nevada 1,430 80.5 62.2 1,359 83.3 14,897 New Hampshire 663 83.5 64.7 635 91.4 15,525

Dislocated Workers
Social Policy Research Associates 227
Exiters from
October 2012 to September 2013 Exiters from
April 2012 to March 2013
Number of
Exiters
Entered Employ-
ment Rate (%)
Credential Attainment Rate (%)
Number of Exiters
Retention 2nd and 3rd Quarters
(%)
Average Earnings
($) New Jersey 4,374 82.7 66.8 4,975 86.5 18,234 New Mexico 433 74.9 45.6 506 80.8 17,129 New York 256,013 51.3 33.5 256,193 81.0 19,097 North Carolina 2,630 80.3 52.3 3,274 90.1 15,136 North Dakota 66 89.5 76.9 97 94.3 17,395 Ohio 4,977 85.7 61.9 6,036 93.0 19,100 Oklahoma 771 73.4 63.5 1,053 87.1 14,435 Oregon 126,297 57.5 45.2 147,550 83.5 14,310 Pennsylvania 8,215 78.3 52.2 9,192 89.2 16,091 Puerto Rico 1,867 64.4 68.3 2,213 87.6 6,664 Rhode Island 701 82.8 69.8 836 92.5 15,565 South Carolina 2,391 79.5 52.0 2,744 92.4 14,449 South Dakota 323 86.5 60.6 411 92.1 15,332 Tennessee 4,211 88.8 74.5 3,559 93.3 16,489 Texas 6,976 77.9 70.6 6,904 89.5 18,446 Utah 1,231 75.9 4.0 1,338 90.7 17,001 Vermont 128 75.2 45.8 129 85.7 16,482 Virgin Islands 119 33.6 54.2 62 73.7 13,224 Virginia 2,820 81.7 71.6 3,977 92.7 16,220 Washington 3,178 81.7 68.3 3,227 89.1 19,517 West Virginia 904 86.7 82.7 1,118 92.5 16,776 Wisconsin 4,074 84.3 65.4 4,187 91.7 15,938 Wyoming 72 86.6 77.0 78 92.5 17,144


Social Policy Research Associates 229
Part IV Youth Exiters

Youth
Social Policy Research Associates 230
Table IV-1 Characteristics of Youth Exiters, Trends Over Time
(Derived from PY 2013Q4 WIASRD Records)
WIA
PY 2009 WIA
PY 2010 WIA
PY 2011 WIA
PY 2012 WIA
4/1/13-3/31/14
Number of exiters 133,564 139,323 122,642 109,695 102,971 Statewide programs 11,142 16,351 6,953 5,111 3,088 Local programs 128,207 130,122 119,843 108,074 102,515
Age categories
14 to 15 10.2 8.5 7.5 5.6 5.2 16 to 17 38.0 39.1 37.4 36.0 36.6 18 20.6 20.8 21.7 22.3 22.6 19 to 21 31.2 31.5 33.5 36.0 35.6
Gender
Female 54.6 54.4 54.3 54.6 54.5 Male 45.4 45.6 45.7 45.4 45.5
Individual with a disability 12.8 12.1 12.8 13.1 13.3
Race and ethnicity
Hispanic 31.2 33.0 33.2 30.0 29.0 Not Hispanic
American Indian or Alaskan Native
1.1 1.2 1.4 1.7 1.6
Asian 1.7 1.7 1.6 1.8 1.8 Black or African American 33.7 32.7 33.0 32.7 33.7 Hawaiian or other Pacific Islander
0.3 0.3 0.2 0.3 0.3
White 30.2 29.5 28.7 31.3 31.1 More than one race 1.7 1.7 1.9 2.2 2.4
Veteran (among age 19 to 21) 0.1 0.1 0.2 0.2 0.2
Employed at participation
Employed 8.8 7.4 7.4 7.7 8.1 Not employed or received layoff notice
91.2 92.6 92.6 92.3 91.9
Homeless or runaway youth 4.0 4.5 3.8 4.4 4.5
Offender 9.4 10.8 9.0 8.5 8.3
Pregnant or parenting youth 14.9 18.5 18.2 14.2 13.5
Basic literacy skills deficient 55.5 59.5 60.4 58.7 58.4
Ever in foster care 4.5 5.8 3.9 3.4 3.4

Youth
Social Policy Research Associates 231
WIA
PY 2009 WIA
PY 2010 WIA
PY 2011 WIA
PY 2012 WIA
4/1/13-3/31/14
Number of exiters 133,564 139,323 122,642 109,695 102,971
Youth who needs additional assistance
59.0 59.9 61.1 61.4 62.2
Average preprogram quarterly earnings (among age 19 to 21)
$1,864 $1,794 $1,799 $1,845 $1,870
None 49.2 57.8 60.0 58.6 58.5 $1 to $1,499 26.0 22.2 21.2 21.4 21.4 $1,500 to $2,999 15.3 12.9 12.0 12.4 12.6 $3,000 to $4,999 7.3 5.6 5.3 5.9 5.8 $5,000 or more 2.3 1.5 1.6 1.7 1.7
Limited English-language (excludes Puerto Rico)
2.1 2.0 2.1 2.0 2.2
Single parent 10.9 14.6 14.0 9.7 9.2 UI Claimant 2.6 2.3 1.7 1.6 1.4 UI Claimant referred by WPRS 0.5 0.4 0.4 0.4 0.4 UI Exhaustee 0.2 0.3 0.2 0.2 0.3
Low income 95.4 96.3 97.2 96.1 94.8
Public assistance recipient 35.8 42.8 43.2 42.6 42.1 TANF recipient 7.6 7.8 6.4 6.5 5.7 Other public assistance, including SNAP and SSI
34.0 40.6 41.5 41.0 40.6
Highest grade completed (avg.) 10.5 10.6 10.6 10.7 10.8 8th or less 9.4 8.0 7.5 6.2 5.8 Some high school 65.9 67.3 66.3 64.8 65.8 High school graduate 18.4 18.5 19.9 22.2 22.0 High school equivalency 2.6 2.5 2.5 2.6 2.5 Some postsecondary 3.6 3.7 3.9 4.2 3.9 College graduate (4-year) 0.1 0.1 0.0 0.0 0.0
Attending school at participation 53.8 54.6 52.4 49.7 49.6 High school or below 47.2 47.5 45.3 42.2 42.4 Alternative school 2.5 3.2 3.0 3.2 3.2 Postsecondary 4.1 3.9 4.1 4.4 4.1
Not attending school at participation
46.2 45.4 47.6 50.3 50.4
High school dropout 25.6 24.6 25.5 25.7 26.2 High school graduate/equiv. 20.6 20.8 22.1 24.6 24.3

Youth
Social Policy Research Associates 232
Table IV-2 Number of Youth Exiters, by Characteristics, Trends Over Time
(Derived from PY 2013Q4 WIASRD Records)
WIA
PY 2009 WIA
PY 2010 WIA
PY 2011 WIA
PY 2012 WIA
4/1/13-3/31/14
Number of exiters 133,564 139,323 122,642 109,695 102,971 Statewide programs 11,142 16,351 6,953 5,111 3,088 Local programs 128,207 130,122 119,843 108,074 102,515
Age categories
14 to 15 13,634 11,911 9,156 6,184 5,313 16 to 17 50,781 54,496 45,809 39,519 37,713 18 27,463 28,994 26,616 24,504 23,322 19 to 21 41,686 43,922 41,061 39,488 36,623
Gender
Female 72,893 75,633 65,842 58,918 55,535 Male 60,513 63,451 55,331 49,063 46,317
Individual with a disability 16,727 16,521 15,397 14,095 13,399
Race and ethnicity
Hispanic 40,876 44,943 39,309 31,574 28,739 Not Hispanic
American Indian or Alaskan Native
1,472 1,567 1,684 1,779 1,621
Asian 2,281 2,335 1,898 1,849 1,816 Black or African American 44,233 44,543 39,065 34,347 33,394 Hawaiian or other Pacific Islander
374 346 294 285 282
White 39,558 40,127 34,012 32,938 30,875 More than one race 2,270 2,361 2,294 2,319 2,422
Veteran (among age 19 to 21) 129 112 187 215 183
Employed at participation
Employed 11,708 10,335 9,127 8,463 8,318 Not employed or received layoff notice
121,856 128,988 113,515 101,232 94,653
Homeless or runaway youth 5,385 5,750 4,363 4,865 4,628
Offender 12,217 13,722 10,411 9,308 8,524
Pregnant or parenting youth 19,945 25,766 22,323 15,559 13,902
Basic literacy skills deficient 74,018 82,874 73,768 63,849 59,570
Ever in foster care 6,017 7,656 4,541 3,718 3,501

Youth
Social Policy Research Associates 233
WIA
PY 2009 WIA
PY 2010 WIA
PY 2011 WIA
PY 2012 WIA
4/1/13-3/31/14
Number of exiters 133,564 139,323 122,642 109,695 102,971
Youth who needs additional assistance
78,814 83,488 74,906 67,237 63,915
Average preprogram quarterly earnings (among age 19 to 21)
None 20,245 25,178 24,511 23,147 20,967 $1 to $1,499 10,713 9,683 8,673 8,437 7,670 $1,500 to $2,999 6,280 5,613 4,899 4,893 4,514 $3,000 to $4,999 2,987 2,425 2,156 2,341 2,060 $5,000 or more 930 659 640 670 611
Limited English-language (excludes Puerto Rico)
2,408 2,399 2,229 1,960 2,066
Single parent 14,458 20,005 16,841 10,445 9,364 UI Claimant 3,480 3,164 2,104 1,793 1,447 UI Claimant referred by WPRS 658 609 520 464 369 UI Exhaustee 308 375 292 263 260
Low income 126,777 133,354 118,382 105,086 97,475
Public assistance recipient 47,861 59,648 53,007 46,708 43,364 TANF recipient 10,139 10,434 7,874 7,108 5,879 Other public assistance, including SNAP and SSI
45,369 56,516 50,931 44,931 41,839
Highest grade completed (avg.)
8th or less 12,489 11,098 9,165 6,763 6,002 Some high school 88,018 93,644 81,262 71,041 67,635 High school graduate 24,600 25,773 24,379 24,321 22,572 High school equivalency 3,506 3,445 3,006 2,857 2,564 Some postsecondary 4,866 5,169 4,724 4,614 4,012 College graduate (4-year) 74 99 43 18 20
Attending school at participation 71,858 76,000 64,254 54,502 51,059 High school or below 63,063 66,140 55,509 46,249 43,615 Alternative school 4,407 3,708 3,465 3,264 Postsecondary 5,444 5,453 5,037 4,788 4,180
Not attending school at participation
61,629 63,176 58,375 55,155 51,893
High school dropout 34,107 34,249 31,277 28,189 26,923 High school graduate/equiv. 27,522 28,927 27,098 26,966 24,970

Youth
Social Policy Research Associates 234
Table IV-3 Characteristics of Youth Exiters from April 2013 to March 2014, by Age
(Derived from PY 2013Q4 WIASRD Records)
Age at Participation
All 14 to 15 16 to 17 18 19 to 21
Number of exiters 102,971 5,313 37,713 23,322 36,623 Statewide programs 3,088 201 1,383 581 923 Local programs 102,515 5,291 37,492 23,164 36,568
Age categories
14 to 15 5.2 100.0 0.0 0.0 0.0 16 to 17 36.6 0.0 100.0 0.0 0.0 18 22.6 0.0 0.0 100.0 0.0 19 to 21 35.6 0.0 0.0 0.0 100.0
Gender
Female 54.5 51.7 55.4 52.1 55.6 Male 45.5 48.3 44.6 47.9 44.4
Individual with a disability 13.3 17.0 16.1 14.5 9.1
Race and ethnicity
Hispanic 29.0 35.1 30.2 29.0 26.8 Not Hispanic
American Indian or Alaskan Native
1.6 2.3 1.7 1.5 1.6
Asian 1.8 2.5 2.2 1.8 1.4 Black or African American 33.7 34.6 31.8 31.6 36.8 Hawaiian or other Pacific Islander
0.3 0.1 0.3 0.3 0.3
White 31.1 23.3 31.5 33.3 30.6 More than one race 2.4 2.1 2.3 2.6 2.5
Veteran (among age 19 to 21) 0.2 0.1 0.1 0.1 0.3
Employed at participation
Employed 8.1 2.0 4.5 8.8 12.2 Not employed or received layoff notice
91.9 98.0 95.5 91.2 87.8
Homeless or runaway youth 4.5 1.0 2.3 5.4 6.7
Offender 8.3 4.1 7.7 7.4 10.1
Pregnant or parenting youth 13.5 1.2 5.6 11.2 24.9
Basic literacy skills deficient 58.4 56.0 54.2 58.3 63.1
Ever in foster care 3.4 4.3 4.6 3.3 2.1

Youth
Social Policy Research Associates 235
Age at Participation
All 14 to 15 16 to 17 18 19 to 21
Number of exiters 102,971 5,313 37,713 23,322 36,623
Youth who needs additional assistance
62.2 63.6 65.5 63.0 58.2
Average preprogram quarterly earnings (among age 19 to 21)
$1,870 $1,870
None 58.5 58.5 $1 to $1,499 21.4 21.4 $1,500 to $2,999 12.6 12.6 $3,000 to $4,999 5.8 5.8 $5,000 or more 1.7 1.7
Limited English-language (excludes Puerto Rico)
2.2 2.1 2.2 2.4 2.2
Single parent 9.2 3.0 3.5 7.2 17.5 UI Claimant 1.4 0.4 0.3 0.7 3.2 UI Claimant referred by WPRS 0.4 0.2 0.1 0.1 0.8 UI Exhaustee 0.3 0.2 0.1 0.2 0.5
Low income 94.8 95.8 95.6 92.7 95.2
Public assistance recipient 42.1 41.7 42.3 39.1 43.9 TANF recipient 5.7 6.2 6.0 4.6 6.1 Other public assistance, including SNAP and SSI
40.6 40.4 40.8 37.9 42.2
Highest grade completed (avg.) 10.8 8.6 10.3 11.0 11.4 8th or less 5.8 48.5 5.0 2.6 2.5 Some high school 65.8 51.0 90.8 68.2 40.6 High school graduate 22.0 0.4 3.0 25.0 42.7 High school equivalency 2.5 0.0 0.8 2.1 4.8 Some postsecondary 3.9 0.1 0.3 2.2 9.3 College graduate (4-year) 0.0 0.0 0.0 0.0 0.1
Attending school at participation 49.6 98.1 77.5 45.2 16.6 High school or below 42.4 96.5 72.8 37.8 6.1 Alternative school 3.2 1.4 4.2 3.7 1.9 Postsecondary 4.1 0.1 0.5 3.6 8.6
Not attending school at participation
50.4 1.9 22.5 54.8 83.4
High school dropout 26.2 1.6 18.8 29.3 35.3 High school graduate/equiv. 24.3 0.4 3.7 25.6 48.1

Youth
Social Policy Research Associates 236
Table IV-4 Characteristics of Youth Exiters from April 2013 to March 2014, by Ethnicity and Race
(Derived from PY 2013Q4 WIASRD Records)
Hispanic Not Hispanic
All Black White Other
Number of exiters 28,739 70,410 33,394 30,875 6,141 Statewide programs 855 2,026 1,125 680 221 Local programs 28,671 70,027 33,280 30,614 6,133
Age categories
14 to 15 6.3 4.7 5.3 3.9 5.8 16 to 17 38.2 36.0 34.6 37.0 38.6 18 22.7 22.7 21.3 24.3 22.5 19 to 21 32.8 36.5 38.7 34.8 33.0
Gender
Female 54.7 54.5 56.9 51.6 56.2 Male 45.3 45.5 43.1 48.4 43.8
Individual with a disability 7.2 15.7 8.8 24.0 11.7
Race and ethnicity
Hispanic 100.0 0.0 0.0 0.0 0.0 Not Hispanic
American Indian or Alaskan Native
0.0 2.3 0.0 0.0 26.4
Asian 0.0 2.6 0.0 0.0 29.6 Black or African American 0.0 47.4 100.0 0.0 0.0 Hawaiian or other Pacific Islander
0.0 0.4 0.0 0.0 4.6
White 0.0 43.9 0.0 100.0 0.0 More than one race 0.0 3.4 0.0 0.0 39.4
Veteran (among age 19 to 21) 0.1 0.2 0.1 0.3 0.3
Employed at participation
Employed 5.4 9.2 6.4 12.6 7.1 Not employed or received layoff notice
94.6 90.8 93.6 87.4 92.9
Homeless or runaway youth 3.3 4.9 4.2 5.3 6.6
Offender 6.7 8.9 7.9 10.0 8.9
Pregnant or parenting youth 13.1 13.7 14.0 13.6 12.2
Basic literacy skills deficient 57.7 58.7 66.8 50.0 59.0
Ever in foster care 2.9 3.6 3.1 3.9 4.8

Youth
Social Policy Research Associates 237
Hispanic Not Hispanic
All Black White Other
Number of exiters 28,739 70,410 33,394 30,875 6,141
Youth who needs additional assistance
61.6 61.9 56.8 67.6 61.3
Average preprogram quarterly earnings (among age 19 to 21)
$2,109 $1,786 $1,685 $1,891 $1,801
None 62.3 57.4 60.0 53.4 60.8 $1 to $1,500 18.6 22.4 22.2 22.8 21.8 $1,500 to $2,999 11.3 13.1 11.7 15.2 11.1 $3,000 to $4,999 5.9 5.6 4.8 6.8 4.4 $5,000 or more 1.9 1.6 1.3 1.9 2.0
Limited English-language (excludes Puerto Rico)
4.6 1.5 1.1 0.7 7.8
Single parent 7.4 10.0 10.9 9.3 8.6 UI Claimant 1.1 1.6 1.7 1.5 1.3 UI Claimant referred by WPRS 0.2 0.4 0.4 0.4 0.3 UI Exhaustee 0.3 0.2 0.2 0.3 0.2
Low income 93.6 95.3 95.6 95.2 94.0
Public assistance recipient 33.5 45.7 50.7 40.2 45.6 TANF recipient 5.6 5.6 6.2 4.2 9.1 Other public assistance, including SNAP and SSI
32.2 44.1 48.8 39.2 43.7
Highest grade completed (avg.) 10.8 10.7 10.8 10.7 10.7 8th or less 6.1 5.8 5.5 6.0 6.0 Some high school 63.4 66.8 66.8 66.5 68.6 High school graduate 23.9 21.0 22.2 20.1 19.7 High school equivalency 1.5 2.9 2.0 3.9 2.8 Some postsecondary 5.1 3.5 3.5 3.5 2.9 College graduate (4-year) 0.0 0.0 0.0 0.0 0.0
Attending school at participation 52.4 48.8 49.7 46.9 53.6 High school or below 44.1 42.0 44.2 38.8 46.0 Alternative school 3.4 3.0 2.4 3.6 3.9 Postsecondary 4.9 3.8 3.1 4.5 3.7
Not attending school at participation
47.6 51.2 50.3 53.1 46.4
High school dropout 22.0 27.7 25.8 30.3 24.7 High school graduate/equiv. 25.6 23.5 24.5 22.8 21.6

Youth
Social Policy Research Associates 238
Table IV-5 Characteristics of Youth Exiters from April 2013 to March 2014, by Gender and Disability
(Derived from PY 2013Q4 WIASRD Records)
Gender With a Disability
Ever in Foster Care All Exiters Male Female
Number of exiters 102,971 46,317 55,535 13,399 3,501 Statewide programs 3,088 1,405 1,666 344 111 Local programs 102,515 46,081 55,315 13,310 3,478
Age categories
14 to 15 5.2 5.5 4.9 6.6 6.6 16 to 17 36.6 36.2 37.4 44.4 49.9 18 22.6 23.9 21.7 24.7 22.0 19 to 21 35.6 34.4 35.9 24.4 21.5
Gender
Female 54.5 0.0 100.0 40.7 53.6 Male 45.5 100.0 0.0 59.3 46.4
Individual with a disability 13.3 17.4 9.9 100.0 14.3
Race and ethnicity
Hispanic 29.0 28.8 28.9 15.8 24.6 Not Hispanic
American Indian or Alaskan Native
1.6 1.6 1.7 1.7 2.4
Asian 1.8 1.8 1.9 1.0 1.1 Black or African American 33.7 32.0 35.2 22.4 30.7 Hawaiian or other Pacific Islander
0.3 0.3 0.3 0.2 0.5
White 31.1 33.2 29.5 56.2 35.9 More than one race 2.4 2.2 2.6 2.6 4.7
Veteran (among age 19 to 21) 0.2 0.2 0.1 0.1 0.4
Employed at participation
Employed 8.1 6.3 9.6 7.8 7.3 Not employed or received layoff notice
91.9 93.7 90.4 92.2 92.7
Homeless or runaway youth 4.5 4.8 4.1 2.7 10.9
Offender 8.3 12.9 4.4 8.6 18.2
Pregnant or parenting youth 13.5 4.2 21.2 4.4 8.9
Basic literacy skills deficient 58.4 58.5 58.0 59.6 57.9
Ever in foster care 3.4 3.5 3.3 3.7 100.0

Youth
Social Policy Research Associates 239
Gender With a Disability
Ever in Foster Care All Exiters Male Female
Number of exiters 102,971 46,317 55,535 13,399 3,501
Youth who needs additional assistance
62.2 63.4 61.2 70.8 56.2
Average preprogram quarterly earnings (among age 19 to 21)
$1,870 $1,861 $1,870 $1,560 $1,440
None 58.5 61.7 56.2 68.9 59.4 $1 to $1,499 21.4 20.5 22.1 19.3 26.5 $1,500 to $2,999 12.6 10.8 14.1 7.7 9.1 $3,000 to $4,999 5.8 5.2 6.1 2.8 3.5 $5,000 or more 1.7 2.0 1.5 1.3 1.5
Limited English-language (excludes Puerto Rico)
2.2 2.1 2.3 1.5 1.4
Single parent 9.2 2.3 14.9 3.9 6.6 UI Claimant 1.4 1.2 1.6 0.7 0.7 UI Claimant referred by WPRS 0.4 0.3 0.4 0.2 0.1 UI Exhaustee 0.3 0.2 0.3 0.2 0.1
Low income 94.8 94.1 95.4 95.6 97.3
Public assistance recipient 42.1 36.3 46.8 25.7 20.7 TANF recipient 5.7 3.5 7.4 2.6 2.6 Other public assistance, including SNAP and SSI
40.6 35.5 44.7 25.1 19.5
Highest grade completed (avg.) 10.8 10.7 10.8 10.6 10.5 8th or less 5.8 6.9 5.0 6.4 8.5 Some high school 65.8 67.0 65.1 75.0 68.4 High school graduate 22.0 20.3 23.0 15.9 18.4 High school equivalency 2.5 2.8 2.2 1.0 2.7 Some postsecondary 3.9 3.0 4.5 1.7 2.0 College graduate (4-year) 0.0 0.0 0.0 0.0 0.0
Attending school at participation 49.6 48.8 50.8 68.6 59.3 High school or below 42.4 42.2 43.0 62.1 48.2 Alternative school 3.2 3.5 2.9 3.9 7.2 Postsecondary 4.1 3.2 4.8 2.5 3.9
Not attending school at participation
50.4 51.2 49.2 31.4 40.7
High school dropout 26.2 28.3 24.3 15.4 21.5 High school graduate/equiv. 24.3 22.9 24.9 16.0 19.2

Youth
Social Policy Research Associates 240
Table IV-6 Characteristics of Youth Exiters from April 2013 to March 2014,
by Employment at Participation and Basic Skills Deficiency (Derived from PY 2013Q4 WIASRD Records)
All Exiters
Employed at participation Basic Skills Deficient
Yes No Yes No
Number of exiters 102,971 8,318 94,653 59,570 42,396 Statewide programs 3,088 207 2,881 1,817 1,085 Local programs 102,515 8,254 94,261 59,336 42,174
Age categories
14 to 15 5.2 1.3 5.5 4.9 5.4 16 to 17 36.6 20.6 38.0 33.8 40.1 18 22.6 24.5 22.5 22.6 22.8 19 to 21 35.6 53.6 34.0 38.7 31.8
Gender
Female 54.5 64.5 53.6 54.3 54.8 Male 45.5 35.5 46.4 45.7 45.2
Individual with a disability 13.3 12.8 13.3 13.4 12.9
Race and ethnicity
Hispanic 29.0 19.4 29.8 28.7 29.6 Not Hispanic
American Indian or Alaskan Native
1.6 1.5 1.6 1.7 1.5
Asian 1.8 1.1 1.9 2.0 1.6 Black or African American 33.7 26.7 34.3 38.4 26.9 Hawaiian or other Pacific Islander
0.3 0.2 0.3 0.3 0.3
White 31.1 48.5 29.6 26.7 37.5 More than one race 2.4 2.7 2.4 2.3 2.7
Veteran (among age 19 to 21) 0.2 0.4 0.2 0.2 0.2
Employed at participation
Employed 8.1 100.0 0.0 7.0 9.7 Not employed or received layoff notice
91.9 0.0 100.0 93.0 90.3
Homeless or runaway youth 4.5 3.8 4.6 4.6 4.3
Offender 8.3 6.9 8.4 8.9 7.5
Pregnant or parenting youth 13.5 21.3 12.8 14.1 12.9
Basic literacy skills deficient 58.4 50.2 59.2 100.0 0.0
Ever in foster care 3.4 3.1 3.4 3.4 3.5

Youth
Social Policy Research Associates 241
All Exiters
Employed at participation Basic Skills Deficient
Yes No Yes No
Number of exiters 102,971 8,318 94,653 59,570 42,396
Youth who needs additional assistance
62.2 62.0 62.3 51.3 76.7
Average preprogram quarterly earnings (among age 19 to 21) $1,870 $2,220 $1,771 $1,810 $1,962
None 58.5 23.6 63.3 60.7 54.8 $1 to $1,499 21.4 26.3 20.7 21.3 21.5 $1,500 to $2,999 12.6 30.9 10.1 11.4 14.8 $3,000 to $4,999 5.8 15.8 4.4 5.1 6.9 $5,000 or more 1.7 3.4 1.5 1.5 2.1
Limited English-language (excludes Puerto Rico)
2.2 1.5 2.3 2.6 1.6
Single parent 9.2 15.7 8.7 9.9 8.6 UI Claimant 1.4 1.9 1.4 1.4 1.4 UI Claimant referred by WPRS 0.4 0.6 0.3 0.4 0.4 UI Exhaustee 0.3 0.4 0.2 0.3 0.2
Low income 94.8 94.5 94.8 95.3 94.0
Public assistance recipient 42.1 35.8 42.7 45.6 37.5 TANF recipient 5.7 2.8 6.0 6.6 4.5 Other public assistance, including SNAP and SSI
40.6 35.2 41.1 44.0 36.3
Highest grade completed (avg.) 10.8 11.3 10.7 10.7 10.9 8th or less 5.8 2.5 6.1 6.7 4.5 Some high school 65.8 49.5 67.2 66.0 64.9 High school graduate 22.0 35.9 20.7 22.1 22.3 High school equivalency 2.5 3.9 2.4 2.1 3.1 Some postsecondary 3.9 8.1 3.5 3.1 5.1 College graduate (4-year) 0.0 0.0 0.0 0.0 0.0
Attending school at participation 49.6 38.6 50.6 41.2 60.1 High school or below 42.4 25.2 43.9 35.8 50.3 Alternative school 3.2 2.4 3.2 3.0 3.4 Postsecondary 4.1 11.0 3.4 2.4 6.5
Not attending school at participation
50.4 61.4 49.4 58.8 39.9
High school dropout 26.2 24.6 26.3 33.9 15.8 High school graduate/equiv. 24.3 36.7 23.2 24.8 24.0

Youth
Social Policy Research Associates 242
Table IV-7 Characteristics of Youth Exiters from April 2013 to March 2014, by School Status at Participation
(Derived from PY 2013Q4 WIASRD Records)
Attending School Not Attending School
All Exiters High School
or Below Post-
secondary High School
Dropout High School
Graduate
Number of exiters 102,971 46,879 4,180 26,923 24,970 Statewide programs 3,088 1,735 57 622 672 Local programs 102,515 46,522 4,143 26,913 24,919
Age categories
14 to 15 5.2 11.1 0.2 0.3 0.1 16 to 17 36.6 62.0 4.2 26.4 5.5 18 22.6 20.6 20.4 25.4 23.9 19 to 21 35.6 6.3 75.3 48.0 70.5
Gender
Female 54.5 54.7 64.5 50.8 56.6 Male 45.5 45.3 35.5 49.2 43.4
Individual with a disability 13.3 19.3 8.1 7.9 8.7
Race and ethnicity
Hispanic 29.0 30.1 34.6 24.5 30.7 Not Hispanic
American Indian or Alaskan Native
1.6 1.7 1.2 1.9 1.3
Asian 1.8 2.6 1.7 0.8 1.4 Black or African American 33.7 34.3 25.6 33.4 34.2 Hawaiian or other Pacific Islander
0.3 0.3 0.1 0.3 0.3
White 31.1 28.8 34.2 36.2 29.5 More than one race 2.4 2.1 2.5 2.8 2.6
Veteran (among age 19 to 21) 0.2 0.1 0.3 0.1 0.4
Employed at participation
Employed 8.1 4.9 21.9 7.6 12.2 Not employed or received layoff notice
91.9 95.1 78.1 92.4 87.8
Homeless or runaway youth 4.5 2.6 2.7 6.9 5.9
Offender 8.3 5.4 3.9 13.7 8.6
Pregnant or parenting youth 13.5 4.9 16.0 21.6 20.4
Basic literacy skills deficient 58.4 50.4 34.2 75.1 59.2
Ever in foster care 3.4 4.1 3.3 2.8 2.7

Youth
Social Policy Research Associates 243
Attending School Not Attending School
All Exiters High School
or Below Post-
secondary High School
Dropout High School
Graduate
Number of exiters 102,971 46,879 4,180 26,923 24,970
Youth who needs additional assistance
62.2 67.0 71.7 55.2 59.4
Average preprogram quarterly earnings (among age 19 to 21)
$1,870 $1,509 $1,869 $1,701 $2,001
None 58.5 74.1 52.6 63.2 53.6 $1 to $1,499 21.4 17.3 22.2 20.5 22.6 $1,500 to $2,999 12.6 6.2 17.2 10.5 14.4 $3,000 to $4,999 5.8 1.7 6.4 4.4 7.3 $5,000 or more 1.7 0.8 1.7 1.3 2.1
Limited English-language (excludes Puerto Rico)
2.2 2.7 2.3 1.5 2.2
Single parent 9.2 3.6 12.5 14.0 14.2 UI Claimant 1.4 0.3 2.8 1.6 3.0 UI Claimant referred by WPRS 0.4 0.1 0.4 0.5 0.8 UI Exhaustee 0.3 0.1 0.6 0.2 0.5
Low income 94.8 94.7 94.6 95.5 94.3
Public assistance recipient 42.1 40.9 29.9 49.0 39.1 TANF recipient 5.7 5.8 2.9 6.6 5.0 Other public assistance, including SNAP and SSI
40.6 39.4 28.9 47.1 37.8
Highest grade completed (avg.) 10.8 10.3 12.6 10.0 12.1 8th or less 5.8 7.1 0.0 10.0 0.0 Some high school 65.8 92.9 0.0 89.8 0.0 High school graduate 22.0 0.0 59.7 0.2 80.3 High school equivalency 2.5 0.0 3.8 0.0 9.7 Some postsecondary 3.9 0.0 36.4 0.0 10.0 College graduate (4-year) 0.0 0.0 0.2 0.0 0.0
Attending school at participation 49.6 100.0 100.0 0.0 0.0 High school or below 42.4 93.0 0.0 0.0 0.0 Alternative school 3.2 7.0 0.0 0.0 0.0 Postsecondary 4.1 0.0 100.0 0.0 0.0
Not attending school at participation
50.4 0.0 0.0 100.0 100.0
High school dropout 26.2 0.0 0.0 100.0 0.0 High school graduate/equiv. 24.3 0.0 0.0 0.0 100.0

Youth
Social Policy Research Associates 244
Table IV-8 Characteristics of Youth Exiters from April 2013 to March 2014,
Out-of-School and In-School Youth at Participation (Derived from PY 2013Q4 WIASRD Records)
Out of School In School
All
High School
Dropout
High School
Graduate
Attending Postsecondary
but Basic Skills Deficient
Attending High School
or Alternative School
Attending Postsecondary but Not Basic
Skills Deficient
Number of exiters 53,324 26,923 24,970 1,431 46,879 2,749 Statewide programs 1,306 622 672 12 1,735 45 Local programs 53,259 26,913 24,919 1,427 46,522 2,716
Age categories
14 to 15 0.2 0.3 0.1 0.3 11.1 0.1 16 to 17 16.0 26.4 5.5 4.4 62.0 4.0 18 24.5 25.4 23.9 20.9 20.6 20.1 19 to 21 59.2 48.0 70.5 74.4 6.3 75.8
Gender
Female 53.9 50.8 56.6 66.7 54.7 63.3 Male 46.1 49.2 43.4 33.3 45.3 36.7
Individual with a disability 8.3 7.9 8.7 9.5 19.3 7.4
Race and ethnicity
Hispanic 27.5 24.5 30.7 29.2 30.1 37.3 Not Hispanic
American Indian or Alaskan Native
1.6 1.9 1.3 2.0 1.7 0.8
Asian 1.1 0.8 1.4 2.4 2.6 1.3 Black or African American 33.9 33.4 34.2 37.0 34.3 19.9 Hawaiian or other Pacific Islander
0.3 0.3 0.3 0.4 0.3 0.0
White 32.8 36.2 29.5 26.3 28.8 38.2 More than one race 2.7 2.8 2.6 2.8 2.1 2.4
Veteran (among age 19 to 21) 0.3 0.1 0.4 0.4 0.1 0.2
Employed at participation
Employed 10.1 7.6 12.2 19.4 4.9 23.2 Not employed or received layoff notice
89.9 92.4 87.8 80.6 95.1 76.8
Homeless or runaway youth 6.3 6.9 5.9 3.8 2.6 2.1
Offender 11.1 13.7 8.6 4.1 5.4 3.8
Pregnant or parenting youth 20.9 21.6 20.4 15.4 4.9 16.4
Basic literacy skills deficient 68.3 75.1 59.2 100.0 50.4 0.0
Ever in foster care 2.8 2.8 2.7 4.5 4.1 2.7

Youth
Social Policy Research Associates 245
Out of School In School
All
High School
Dropout
High School
Graduate
Attending Postsecondary
but Basic Skills Deficient
Attending High School
or Alternative School
Attending Postsecondary but Not Basic
Skills Deficient
Number of exiters 53,324 26,923 24,970 1,431 46,879 2,749
Youth who needs additional assistance
57.1 55.2 59.4 52.1 67.0 81.9
Average preprogram quarterly earnings (among age 19 to 21)
$1,889 $1,701 $2,001 $1,823 $1,509 $1,893
None 57.5 63.2 53.6 52.8 74.1 52.5 $1 to $1,499 21.8 20.5 22.6 22.7 17.3 21.9 $1,500 to $2,999 12.9 10.5 14.4 16.8 6.2 17.4 $3,000 to $4,999 6.1 4.4 7.3 6.3 1.7 6.4 $5,000 or more 1.8 1.3 2.1 1.5 0.8 1.8
Limited English-language (excludes Puerto Rico)
1.9 1.5 2.2 2.2 3.6 2.7
Single parent 14.1 14.0 14.2 13.1 3.6 12.2
UI Claimant 2.3 1.6 3.0 2.7 0.3 2.9 UI Claimant referred by WPRS 0.6 0.5 0.8 0.5 0.1 0.4 UI Exhaustee 0.4 0.2 0.5 0.7 0.1 0.6
Low income 94.9 95.5 94.3 94.0 94.7 95.0
Public assistance recipient 44.1 49.0 39.1 38.2 40.9 25.6
TANF recipient 5.8 6.6 5.0 4.3 5.8 2.2 Other public assistance, including SNAP and SSI
42.5 47.1 37.8 37.0 39.4 24.8
Highest grade completed (avg.) 11.1 10.0 12.1 12.4 10.3 12.7 8th or less 5.0 10.0 0.0 0.0 7.1 0.0 Some high school 45.3 89.8 0.0 0.0 92.9 0.0 High school graduate 39.6 0.2 80.3 69.4 0.0 54.6 High school equivalency 4.6 0.0 9.7 4.6 0.0 3.3 Some postsecondary 5.4 0.0 10.0 25.8 0.0 41.9 College graduate (4-year) 0.0 0.0 0.0 0.1 0.0 0.2
Attending school at participation 2.7 0.0 0.0 100.0 100.0 100.0 High school or below 0.0 0.0 0.0 0.0 93.0 0.0 Alternative school 0.0 0.0 0.0 0.0 7.0 0.0 Postsecondary 2.7 0.0 0.0 100.0 0.0 100.0
Not attending school at participation
97.3 100.0 100.0 0.0 0.0 0.0
High school dropout 50.5 100.0 0.0 0.0 0.0 0.0 High school graduate/equiv. 46.8 0.0 100.0 0.0 0.0 0.0

Youth
Social Policy Research Associates 246
Table IV-9 Characteristics of Youth Exiters from April 2013 to March 2014, by Barriers to Employment
(Derived from PY 2013Q4 WIASRD Records)
All Exiters
Homeless or
Runaway
Offender
Pregnant or Parenting
Needs Additional Assistance
Number of exiters 102,971 4,628 8,524 13,902 63,915 Statewide programs 3,088 46 105 191 1,586 Local programs 102,515 4,628 8,516 13,891 63,830
Age categories
14 to 15 5.2 1.1 2.5 0.4 5.3 16 to 17 36.6 18.9 33.9 15.1 38.6 18 22.6 27.4 20.2 18.8 22.9 19 to 21 35.6 52.7 43.4 65.6 33.2
Gender
Female 54.5 51.0 28.9 85.9 53.6 Male 45.5 49.0 71.1 14.1 46.4
Individual with a disability 13.3 8.2 13.8 4.3 15.1
Race and ethnicity
Hispanic 29.0 21.4 23.6 28.0 28.9 Not Hispanic
American Indian or Alaskan Native 1.6 3.5 1.5 1.9 1.3 Asian 1.8 0.7 0.8 0.4 2.0 Black or African American 33.7 32.2 32.2 35.0 31.0 Hawaiian or other Pacific Islander 0.3 0.6 0.5 0.2 0.3 White 31.1 37.1 37.5 31.3 33.9 More than one race 2.4 4.5 3.8 3.0 2.6
Veteran (among age 19 to 21) 0.2 0.3 0.6 0.3 0.2
Employed at participation
Employed 8.1 6.8 6.7 12.7 8.0 Not employed or received layoff notice 91.9 93.2 93.3 87.3 92.0
Homeless or runaway youth 4.5 100.0 8.8 4.7 4.3
Offender 8.3 16.3 100.0 8.2 7.8
Pregnant or parenting youth 13.5 14.0 13.4 100.0 11.1
Basic literacy skills deficient 58.4 59.9 62.7 60.4 48.4
Ever in foster care 3.4 8.2 7.5 2.3 3.1
Youth
Social Policy Research Associates 247
All Exiters
Homeless or
Runaway
Offender
Pregnant or Parenting
Needs Additional Assistance
Number of exiters 102,971 4,628 8,524 13,902 63,915
Youth who needs additional assistance 62.2 59.6 58.7 51.3 100.0
Average preprogram quarterly earnings (among age 19 to 21)
$1,870 $1,674 $1,641 $1,938 $1,832
None 58.5 60.6 61.2 52.0 58.8 $1 to $1,499 21.4 23.5 22.0 23.4 21.2 $1,500 to $2,999 12.6 10.0 11.1 15.1 12.8 $3,000 to $4,999 5.8 4.3 4.5 7.4 5.5 $5,000 or more 1.7 1.7 1.3 2.1 1.7
Limited English-language (excludes Puerto Rico)
2.2 1.5 1.0 1.4 2.1
Single parent 9.2 8.9 8.2 58.9 7.8 UI Claimant 1.4 1.3 1.7 3.4 1.5 UI Claimant referred by WPRS 0.4 0.3 0.4 0.9 0.4 UI Exhaustee 0.3 0.2 0.5 0.6 0.2
Low income 94.8 99.7 93.0 96.9 94.6
Public assistance recipient 42.1 39.5 44.7 63.6 40.3 TANF recipient 5.7 4.3 4.6 16.3 5.0 Other public assistance, including SNAP and SSI
40.6 38.3 43.7 59.1 39.0
Highest grade completed (avg.) 10.8 10.9 10.6 11.0 10.8 8th or less 5.8 4.5 8.0 4.6 5.6 Some high school 65.8 61.4 64.8 53.8 66.6 High school graduate 22.0 26.6 19.0 31.1 21.9 High school equivalency 2.5 4.9 6.6 5.3 2.4 Some postsecondary 3.9 2.6 1.7 5.2 3.5 College graduate (4-year) 0.0 0.0 0.0 0.0 0.0
Attending school at participation 49.6 28.5 31.4 21.4 53.7 High school or below 42.4 20.6 21.6 12.7 45.7 Alternative school 3.2 5.4 7.8 3.9 3.3 Postsecondary 4.1 2.4 1.9 4.8 4.7
Not attending school at participation 50.4 71.5 68.6 78.6 46.3 High school dropout 26.2 39.9 43.4 41.9 23.2 High school graduate/equiv. 24.3 31.6 25.2 36.7 23.1

Youth
Social Policy Research Associates 248
Table IV-10 Characteristics of Youth Exiters from April 2013 to March 2014,
by Low Income and Public Assistance (Derived from PY 2013Q4 WIASRD Records)
Public Assistance
All Exiters Low Income Any TANF Other
Number of exiters 102,971 97,475 43,364 5,879 41,839 Statewide programs 3,088 2,973 378 80 338 Local programs 102,515 97,054 43,311 5,857 41,804
Age categories
14 to 15 5.2 5.2 5.1 5.6 5.1 16 to 17 36.6 36.9 36.8 38.5 36.8 18 22.6 22.2 21.1 18.3 21.1 19 to 21 35.6 35.7 37.0 37.7 36.9
Gender
Female 54.5 54.9 60.7 71.8 60.2 Male 45.5 45.1 39.3 28.2 39.8
Individual with a disability 13.3 13.3 8.1 5.9 8.1
Race and ethnicity
Hispanic 29.0 28.7 23.1 29.1 23.0 Not Hispanic
American Indian or Alaskan Native 1.6 1.7 1.9 3.1 1.9 Asian 1.8 1.8 1.7 3.6 1.7 Black or African American 33.7 33.9 40.5 37.4 40.4 Hawaiian or other Pacific Islander 0.3 0.3 0.2 0.3 0.3 White 31.1 31.3 29.7 23.5 30.0 More than one race 2.4 2.4 2.8 3.1 2.8
Veteran (among age 19 to 21) 0.2 0.2 0.2 0.2 0.2
Employed at participation
Employed 8.1 8.1 6.9 3.9 7.0 Not employed or received layoff notice 91.9 91.9 93.1 96.1 93.0
Homeless or runaway youth 4.5 4.7 4.2 3.4 4.2
Offender 8.3 8.1 8.8 6.7 8.9
Pregnant or parenting youth 13.5 13.8 20.4 38.5 19.6
Basic literacy skills deficient 58.4 58.8 63.1 67.1 63.0
Ever in foster care 3.4 3.5 1.7 1.6 1.6

Youth
Social Policy Research Associates 249
Public Assistance
All Exiters Low Income Any TANF Other
Number of exiters 102,971 97,475 43,364 5,879 41,839
Youth who needs additional assistance 62.2 62.1 59.4 54.9 59.6
Average preprogram quarterly earnings (among age 19 to 21)
$1,870 $1,852 $1,816 $1,648 $1,824
None 58.5 58.6 59.7 66.9 59.5 $1 to $1,499 21.4 21.5 21.6 20.4 21.6 $1,500 to $2,999 12.6 12.6 11.9 8.3 12.0 $3,000 to $4,999 5.8 5.7 5.3 3.1 5.3 $5,000 or more 1.7 1.6 1.6 1.2 1.6
Limited English-language (excludes Puerto Rico)
2.2 2.1 2.1 3.9 2.1
Single parent 9.2 9.5 14.6 30.3 13.9 UI Claimant 1.4 1.4 1.6 1.1 1.6 UI Claimant referred by WPRS 0.4 0.4 0.4 0.4 0.4 UI Exhaustee 0.3 0.3 0.2 0.5 0.2
Low income 94.8 100.0 100.0 100.0 100.0
Public assistance recipient 42.1 44.4 100.0 100.0 100.0 TANF recipient 5.7 6.0 13.6 100.0 10.4 Other public assistance, including SNAP and SSI
40.6 42.9 96.5 74.1 100.0
Highest grade completed (avg.) 10.8 10.8 10.6 10.6 10.6 8th or less 5.8 5.9 6.4 6.0 6.4 Some high school 65.8 65.9 68.1 70.6 68.1 High school graduate 22.0 21.8 20.1 18.2 20.1 High school equivalency 2.5 2.5 2.8 2.5 2.8 Some postsecondary 3.9 3.9 2.5 2.6 2.5 College graduate (4-year) 0.0 0.0 0.0 0.0 0.0
Attending school at participation 49.6 49.5 47.1 48.3 47.1 High school or below 42.4 42.3 40.5 41.6 40.5 Alternative school 3.2 3.2 3.6 4.6 3.7 Postsecondary 4.1 4.1 2.9 2.1 2.9
Not attending school at participation 50.4 50.5 52.9 51.7 52.9 High school dropout 26.2 26.4 30.4 30.4 30.3 High school graduate/equiv. 24.3 24.1 22.5 21.2 22.6

Youth
Social Policy Research Associates 250
Table IV-11 Characteristics of Youth Exiters from April 2013 to March 2014, by Selected Characteristics
(Derived from PY 2013Q4 WIASRD Records)
All
Exiters
Limited English-
Language1 Single Parent
Pell Grant Recipient1 (a
mong trainees)
Basic Skills
Deficient
Number of exiters 102,971 2,066 9,364 821 59,570 Statewide programs 3,088 92 141 10 1,817 Local programs 102,515 2,062 9,352 815 59,336
Age categories
14 to 15 5.2 4.3 1.7 0.0 4.9 16 to 17 36.6 34.9 13.7 0.0 33.8 18 22.6 25.4 17.6 0.0 22.6 19 to 21 35.6 35.3 67.0 100.0 38.7
Gender
Female 54.5 56.6 88.5 68.4 54.3 Male 45.5 43.4 11.5 31.6 45.7
Individual with a disability 13.3 9.9 5.5 7.8 13.4
Race and ethnicity
Hispanic 29.0 48.0 23.4 11.3 28.7 Not Hispanic
American Indian or Alaskan Native 1.6 1.4 1.9 1.1 1.7 Asian 1.8 20.9 0.6 1.2 2.0 Black or African American 33.7 17.1 39.9 28.0 38.4 Hawaiian or other Pacific Islander 0.3 0.5 0.2 0.5 0.3 White 31.1 11.1 31.0 54.4 26.7 More than one race 2.4 1.0 3.1 3.5 2.3
Veteran (among age 19 to 21) 0.2 0.1 0.2 0.4 0.2
Employed at participation
Employed 8.1 5.7 13.5 35.2 7.0 Not employed or received layoff notice 91.9 94.3 86.5 64.8 93.0
Homeless or runaway youth 4.5 3.3 4.3 1.7 4.6
Offender 8.3 3.9 7.4 5.4 8.9
Pregnant or parenting youth 13.5 8.8 86.9 26.1 14.1
Basic literacy skills deficient 58.4 72.1 62.1 30.8 100.0
Ever in foster care 3.4 2.2 2.4 2.1 3.4
1 Excludes Puerto Rico.

Youth
Social Policy Research Associates 251
All
Exiters
Limited English-
Language1 Single Parent
Pell Grant Recipient1 (a
mong trainees)
Basic Skills
Deficient
Number of exiters 102,971 2,066 9,364 821 59,570
Youth who needs additional assistance 62.2 58.4 52.4 72.7 51.3
Average preprogram quarterly earnings (among age 19 to 21)
$1,870 $2,120 $1,915 $2,011 $1,810
None 58.5 67.8 51.0 40.1 60.7 $1 to $1,499 21.4 15.7 23.9 24.9 21.3 $1,500 to $2,999 12.6 8.8 15.2 22.7 11.4 $3,000 to $4,999 5.8 5.6 8.0 10.2 5.1 $5,000 or more 1.7 2.2 1.9 2.1 1.5
Limited English-language (excludes Puerto Rico)
2.2 100.0 1.7 2.0 2.6
Single parent 9.2 7.5 100.0 22.9 9.9 UI Claimant 1.4 0.7 3.7 4.8 1.4 UI Claimant referred by WPRS 0.4 0.1 1.1 1.7 0.4 UI Exhaustee 0.3 0.3 0.7 0.6 0.3
Low income 94.8 90.6 97.3 95.5 95.3
Public assistance recipient 42.1 44.1 66.8 34.1 45.6 TANF recipient 5.7 10.8 18.9 3.2 6.6 Other public assistance, including SNAP and SSI
40.6 42.4 61.5 33.7 44.0
Highest grade completed (avg.) 10.8 10.9 11.0 12.4 10.7 8th or less 5.8 3.9 5.1 0.1 6.7 Some high school 65.8 68.7 52.1 5.1 66.0 High school graduate 22.0 19.1 31.7 58.2 22.1 High school equivalency 2.5 0.6 5.5 7.4 2.1 Some postsecondary 3.9 7.6 5.5 29.1 3.1 College graduate (4-year) 0.0 0.1 0.0 0.0 0.0
Attending school at participation 49.6 57.4 23.3 53.0 41.2 High school or below 42.4 50.4 14.4 2.1 35.8 Alternative school 3.2 3.4 3.6 0.5 3.0 Postsecondary 4.1 3.6 5.3 50.4 2.4
Not attending school at participation 50.4 42.6 76.7 47.0 58.8 High school dropout 26.2 18.7 39.3 2.8 33.9 High school graduate/equiv. 24.3 23.9 37.4 44.2 24.8
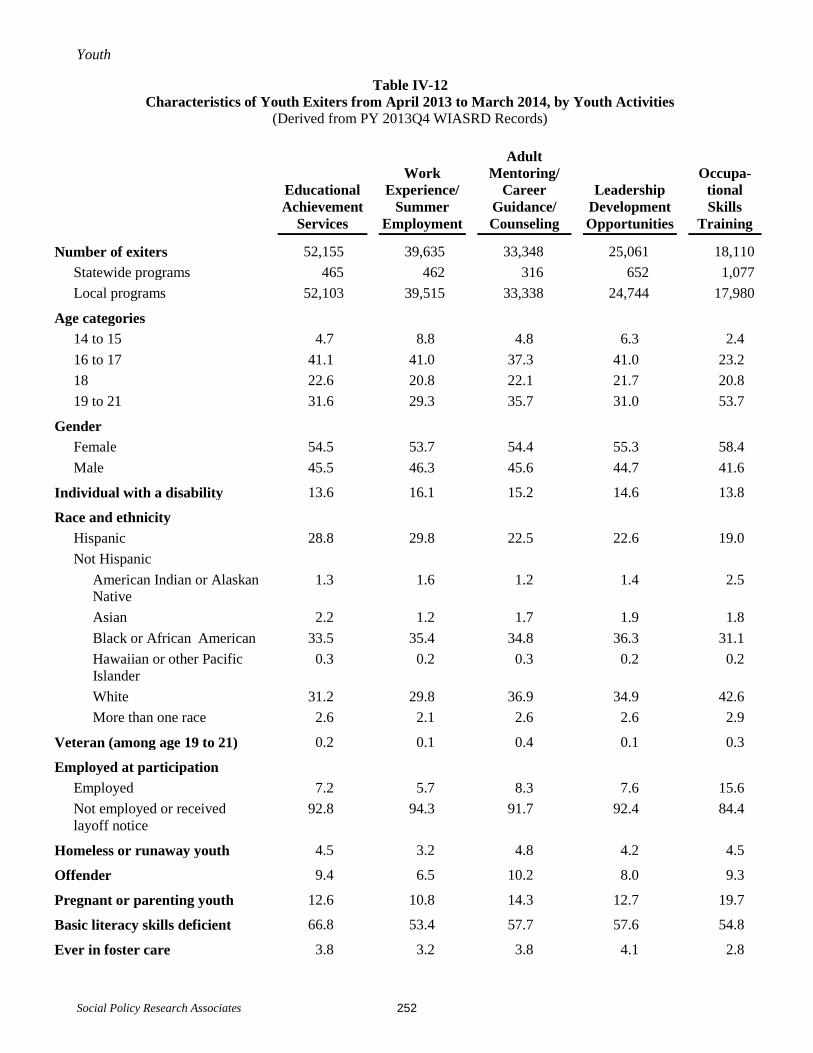
Youth
Social Policy Research Associates 252
Table IV-12 Characteristics of Youth Exiters from April 2013 to March 2014, by Youth Activities
(Derived from PY 2013Q4 WIASRD Records)
Educational Achievement
Services
Work Experience/
Summer Employment
Adult Mentoring/
Career Guidance/ Counseling
Leadership Development Opportunities
Occupa- tional Skills
Training
Number of exiters 52,155 39,635 33,348 25,061 18,110 Statewide programs 465 462 316 652 1,077 Local programs 52,103 39,515 33,338 24,744 17,980
Age categories
14 to 15 4.7 8.8 4.8 6.3 2.4 16 to 17 41.1 41.0 37.3 41.0 23.2 18 22.6 20.8 22.1 21.7 20.8 19 to 21 31.6 29.3 35.7 31.0 53.7
Gender
Female 54.5 53.7 54.4 55.3 58.4 Male 45.5 46.3 45.6 44.7 41.6
Individual with a disability 13.6 16.1 15.2 14.6 13.8
Race and ethnicity
Hispanic 28.8 29.8 22.5 22.6 19.0 Not Hispanic
American Indian or Alaskan Native
1.3 1.6 1.2 1.4 2.5
Asian 2.2 1.2 1.7 1.9 1.8 Black or African American 33.5 35.4 34.8 36.3 31.1 Hawaiian or other Pacific Islander
0.3 0.2 0.3 0.2 0.2
White 31.2 29.8 36.9 34.9 42.6 More than one race 2.6 2.1 2.6 2.6 2.9
Veteran (among age 19 to 21) 0.2 0.1 0.4 0.1 0.3
Employed at participation
Employed 7.2 5.7 8.3 7.6 15.6 Not employed or received layoff notice
92.8 94.3 91.7 92.4 84.4
Homeless or runaway youth 4.5 3.2 4.8 4.2 4.5
Offender 9.4 6.5 10.2 8.0 9.3
Pregnant or parenting youth 12.6 10.8 14.3 12.7 19.7
Basic literacy skills deficient 66.8 53.4 57.7 57.6 54.8
Ever in foster care 3.8 3.2 3.8 4.1 2.8

Youth
Social Policy Research Associates 253
Educational Achievement
Services
Work Experience/
Summer Employment
Adult Mentoring/
Career Guidance/ Counseling
Leadership Development Opportunities
Occupa- tional Skills
Training
Number of exiters 52,155 39,635 33,348 25,061 18,110
Youth who needs additional assistance
57.7 64.0 67.0 61.8 58.2
Average preprogram quarterly earnings (among age 19 to 21)
$1,864 $1,710 $1,833 $1,940 $1,994
None 61.8 62.1 58.8 59.9 49.2 $1 to $1,499 20.3 20.9 21.2 20.9 23.2 $1,500 to $2,999 11.4 11.2 12.6 12.2 16.8 $3,000 to $4,999 5.0 4.3 5.7 5.2 8.5 $5,000 or more 1.5 1.4 1.7 1.8 2.3
Limited English-language (excludes Puerto Rico)
2.6 1.5 1.7 1.7 1.9
Single parent 8.5 7.5 9.7 8.6 14.7 UI Claimant 1.0 1.1 1.4 1.3 2.6 UI Claimant referred by WPRS 0.3 0.3 0.5 0.3 0.6 UI Exhaustee 0.1 0.1 0.1 0.2 0.7
Low income 96.1 96.0 96.5 94.8 95.1
Public assistance recipient 47.4 44.5 48.0 48.1 42.7 TANF recipient 6.7 4.2 5.8 6.4 5.4 Other public assistance, including SNAP and SSI
46.1 43.5 46.9 46.8 41.2
Highest grade completed (avg.) 10.6 10.6 10.7 10.6 11.2 8th or less 6.4 7.6 6.0 7.1 3.3 Some high school 74.3 65.1 67.4 70.3 47.4 High school graduate 15.0 21.3 21.0 18.6 37.3 High school equivalency 1.6 2.2 2.9 2.0 5.5 Some postsecondary 2.7 3.8 2.7 2.1 6.5 College graduate (4-year) 0.0 0.0 0.0 0.0 0.0
Attending school at participation 51.1 60.4 49.0 54.4 37.7 High school or below 44.5 52.8 41.9 48.5 26.2 Alternative school 4.5 2.8 3.7 3.2 3.0 Postsecondary 2.1 4.7 3.3 2.7 8.5
Not attending school at participation
48.9 39.6 51.0 45.6 62.3
High school dropout 31.8 17.1 27.7 25.7 21.5 High school graduate/equiv. 17.1 22.5 23.3 19.9 40.8

Youth
Social Policy Research Associates 254
Table IV-13 Services Received by Youth Exiters, Trends Over Time
(Derived from PY 2013Q4 WIASRD Records)
WIA
PY 2009 WIA
PY 2010 WIA
PY 2011 WIA
PY 2012 WIA
4/1/13-3/31/14
Number of exiters 133,564 139,323 122,642 109,695 102,971
Coenrollment
WIA adult 4.1 5.1 4.1 4.0 4.0 WIA dislocated worker 0.2 0.4 0.4 0.3 0.2 Partner program 44.0 45.8 43.0 45.4 46.1
Wagner-Peyser 39.1 41.4 39.7 41.9 42.5 TAA 0.0 0.0 0.0 0.0 0.0 National Farmworker Jobs 0.0 0.0 0.0 0.0 0.0 Veterans programs 0.2 0.1 0.0 0.0 0.0 Vocational Education 0.4 0.2 0.1 0.1 0.1 Adult Education 0.5 0.4 0.5 0.4 0.5 Other partner programs 6.9 5.9 4.8 5.4 5.8
Weeks participated (average) 58.0 58.9 60.4 59.4 57.6 26 or fewer weeks 35.9 33.4 31.7 30.7 30.4 26 to 52 weeks 26.5 26.5 25.8 28.8 30.0 52 to 78 weeks 13.5 14.6 15.2 15.4 15.8 More than 78 weeks 24.1 25.5 27.3 25.1 23.8
Supportive services 37.1 38.2 43.8 46.2 46.0
Youth Activities (among with activities)1 Educational achievement services 50.2 51.8 Alternative school 5.9 5.9 Summer employment 18.7 17.2 Work experience 33.8 33.6 Leadership development 27.6 28.4 Adult mentoring 8.5 9.5 Career guidance/counseling 32.9 33.7 Basic skills training 12.1 11.6 Occupational skills training 22.0 20.5
1 Some states reported that many youth did not receive any youth activities.

Youth
Social Policy Research Associates 255
WIA
PY 2009 WIA
PY 2010 WIA
PY 2011 WIA
PY 2012 WIA
4/1/13-3/31/14
Youth pre-PY2013 Activities (among with activities) Educational achievement services 52.3 59.7 60.7 57.6 59.0 Employment services 56.9 64.9 56.9 48.6 47.9 Summer youth employment 31.1 32.5 28.6 18.7 17.2 Leadership development 28.1 37.3 36.4 27.6 28.4 Additional support for youth services 52.1 53.6 45.6 36.6 37.8
Enrolled in Education 79.2 79.9 80.5 80.6 80.3
Pell Grant recipient (among trainees, excludes Puerto Rico)
9.0 8.0 7.2 6.9 6.5

Youth
Social Policy Research Associates 256
Table IV-14 Number of Youth Exiters, by Services Received, Trends Over Time
(Derived from PY 2013Q4 WIASRD Records)
WIA
PY 2009 WIA
PY 2010 WIA
PY 2011 WIA
PY 2012 WIA
4/1/13-3/31/14
Number of exiters 133,564 139,323 122,642 109,695 102,971
Coenrollment
WIA adult 5,540 7,042 5,089 4,415 4,115 WIA dislocated worker 323 516 450 331 256 Partner program 58,710 63,845 52,777 49,773 47,458
Wagner-Peyser 52,193 57,647 48,713 46,011 43,771 TAA 6 10 8 2 5 National Farmworker Jobs 9 20 51 21 26 Veterans programs 201 195 61 11 6 Vocational Education 474 292 156 116 95 Adult Education 650 526 615 481 513 Other partner programs 9,214 8,285 5,913 5,876 6,005
Weeks participated
26 or fewer weeks 47,991 46,591 38,880 33,724 31,307 26 to 52 weeks 35,390 36,852 31,619 31,599 30,915 52 to 78 weeks 17,989 20,395 18,668 16,888 16,226 More than 78 weeks 32,194 35,485 33,475 27,484 24,523
Supportive services 49,507 53,252 53,701 50,665 47,400 Youth Activities (among with activities)1
Educational achievement services 47,303 45,741 Alternative school 5,552 5,192 Summer employment 17,585 15,174 Work experience 31,858 29,667 Leadership development 26,017 25,061 Adult mentoring 8,015 8,399 Career guidance/counseling 31,003 29,731 Basic skills training 11,408 10,231 Occupational skills training 20,775 18,110
1 Some states reported that many youth did not receive any youth activities.

Youth
Social Policy Research Associates 257
WIA
PY 2009 WIA
PY 2010 WIA
PY 2011 WIA
PY 2012 WIA
4/1/13-3/31/14 Youth pre-PY2013 Activities (among with activities)
Educational achievement services 63,868 77,500 67,762 54,345 52,155 Employment services 69,461 84,211 63,515 45,862 42,327 Summer youth employment 38,025 42,174 31,919 17,585 15,174 Leadership development 34,332 48,424 40,696 26,017 25,061 Additional support for youth services
63,616 69,547 50,934 34,537 33,348
Enrolled in Education 105,722 111,277 98,776 88,371 82,709
Pell Grant recipient (among trainees, excludes Puerto Rico)
1,171 1,104 1,027 983 821

Youth
Social Policy Research Associates 258
Table IV-15 Services Received by Youth Exiters from April 2013 to March 2014, by Age
(Derived from PY 2013Q4 WIASRD Records)
Age at Participation
All Exiters 14 to 15 16 to 17 18 19 to 21
Number of exiters 102,971 5,313 37,713 23,322 36,623
Coenrollment
WIA adult 4.0 0.4 0.8 4.5 7.5 WIA dislocated worker 0.2 0.1 0.0 0.2 0.5 Partner program 46.1 34.6 41.0 47.4 52.1
Wagner-Peyser 42.5 31.0 37.2 44.7 48.2 TAA 0.0 0.0 0.0 0.0 0.0 National Farmworker Jobs 0.0 0.0 0.0 0.0 0.0 Veterans programs 0.0 0.0 0.0 0.0 0.0 Vocational Education 0.1 0.0 0.1 0.1 0.1 Adult Education 0.5 0.0 0.4 0.6 0.6 Other partner programs 5.8 4.6 5.3 4.8 7.2
Weeks participated (average) 57.6 105.5 62.2 50.2 50.6
26 or fewer weeks 30.4 31.3 23.8 33.6 35.1 26 to 52 weeks 30.0 8.7 29.4 34.1 31.2 52 to 78 weeks 15.8 6.2 17.7 15.2 15.5 More than 78 weeks 23.8 53.8 29.1 17.1 18.3
Supportive services 46.0 48.8 45.2 44.0 47.8 Youth Activities (among with activities)1
Educational achievement services 51.8 47.0 57.5 52.9 45.8 Alternative school 5.9 5.3 6.4 6.4 5.1 Summer employment 17.2 44.4 20.6 14.5 11.1 Work experience 33.6 40.5 36.8 33.1 29.5 Leadership development 28.4 33.0 31.4 27.8 24.8 Adult mentoring 9.5 11.9 11.1 9.1 7.7 Career guidance/counseling 33.7 27.2 33.3 33.7 35.0 Basic skills training 11.6 10.1 14.1 11.6 9.2 Occupational skills training 20.5 9.0 12.8 19.2 31.1
Enrolled in Education 80.3 99.0 92.0 78.3 66.9
Pell Grant recipient (among trainees, excludes Puerto Rico)
6.5 0.0 0.0 0.0 6.9
1 Some states reported that many youth did not receive any youth activities.

Youth
Social Policy Research Associates 259
Table IV-16 Services Received by Youth Exiters from April 2013 to March 2014, by Ethnicity and Race
(Derived from PY 2013Q4 WIASRD Records)
Hispanic Not Hispanic
All Black White Other
Number of exiters 28,739 70,410 33,394 30,875 6,141
Coenrollment
WIA adult 2.6 4.5 3.3 5.9 4.4 WIA dislocated worker 0.1 0.3 0.2 0.4 0.3 Partner program 41.0 48.1 45.7 50.8 47.9
Wagner-Peyser 37.8 44.5 40.6 49.0 43.6 TAA 0.0 0.0 0.0 0.0 0.0 National Farmworker Jobs 0.0 0.0 0.0 0.1 0.0 Veterans programs 0.0 0.0 0.0 0.0 0.0 Vocational Education 0.1 0.1 0.1 0.1 0.1 Adult Education 0.3 0.6 0.5 0.7 0.4 Other partner programs 3.8 6.6 8.2 4.8 6.7
Weeks participated (average) 43.3 63.3 62.2 64.8 61.5
26 or fewer weeks 43.1 25.6 26.4 24.9 24.9
26 to 52 weeks 29.8 30.0 29.8 29.9 31.2 52 to 78 weeks 12.7 16.9 16.8 16.7 18.0 More than 78 weeks 14.4 27.6 27.0 28.5 26.0
Supportive services 59.3 41.0 39.4 43.1 38.7
Youth Activities (among with activities)1 Educational achievement services 54.1 50.9 52.7 47.8 57.4 Alternative school 4.5 6.3 4.3 8.6 5.7 Summer employment 18.7 16.8 19.3 14.7 13.9 Work experience 30.3 34.8 36.4 34.3 29.0 Leadership development 21.4 31.1 31.3 31.2 29.3 Adult mentoring 6.4 10.7 11.2 10.8 7.1
Career guidance/counseling 24.5 37.2 34.9 40.2 33.9
Basic skills training 3.7 15.2 15.2 15.7 12.1
Occupational skills training 13.0 23.6 19.4 27.6 25.4
Enrolled in Education 77.6 81.5 80.6 82.2 83.1
Pell Grant recipient (among trainees, excludes Puerto Rico)
4.2 7.1 5.1 9.1 6.5
1 Some states reported that many youth did not receive any youth activities.

Youth
Social Policy Research Associates 260
Table IV-17 Services Received by Youth Exiters from April 2013 to March 2014, by Gender and Disability
(Derived from PY 2013Q4 WIASRD Records)
Gender With a Disability
Ever in Foster Care All Exiters Male Female
Number of exiters 102,971 46,317 55,535 13,399 3,501
Coenrollment
WIA adult 4.0 3.6 4.2 2.4 3.7 WIA dislocated worker 0.2 0.2 0.3 0.1 0.2 Partner program 46.1 45.7 46.6 42.6 44.8
Wagner-Peyser 42.5 42.1 43.0 40.8 42.2 TAA 0.0 0.0 0.0 0.0 0.0 National Farmworker Jobs 0.0 0.0 0.0 0.0 0.0 Veterans programs 0.0 0.0 0.0 0.0 0.0 Vocational Education 0.1 0.1 0.1 0.2 0.0 Adult Education 0.5 0.5 0.5 0.2 0.3 Other partner programs 5.8 5.7 6.0 3.1 6.6
Weeks participated (average) 57.6 56.6 58.5 71.7 60.1 26 or fewer weeks 30.4 31.9 29.3 20.6 30.4 26 to 52 weeks 30.0 29.6 30.3 28.8 28.1 52 to 78 weeks 15.8 15.4 16.1 17.6 16.9 More than 78 weeks 23.8 23.2 24.4 32.9 24.6
Supportive services 46.0 45.5 46.3 43.1 44.1 Youth Activities (among with activities)1
Educational achievement services 51.8 51.9 51.3 52.7 54.2 Alternative school 5.9 6.1 5.8 6.4 10.6 Summer employment 17.2 18.3 16.4 22.0 16.3 Work experience 33.6 33.9 33.8 41.0 31.2 Leadership development 28.4 27.8 28.7 30.5 33.7 Adult mentoring 9.5 9.1 9.8 9.9 10.6 Career guidance/counseling 33.7 33.8 33.5 38.4 37.6 Basic skills training 11.6 11.2 12.0 13.2 9.5 Occupational skills training 20.5 18.8 22.0 20.8 16.8
Enrolled in Education 80.3 79.1 81.6 86.9 85.3
Pell Grant recipient (among trainees, excludes Puerto Rico)
6.5 5.2 7.5 5.8 7.5
1 Some states reported that many youth did not receive any youth activities.
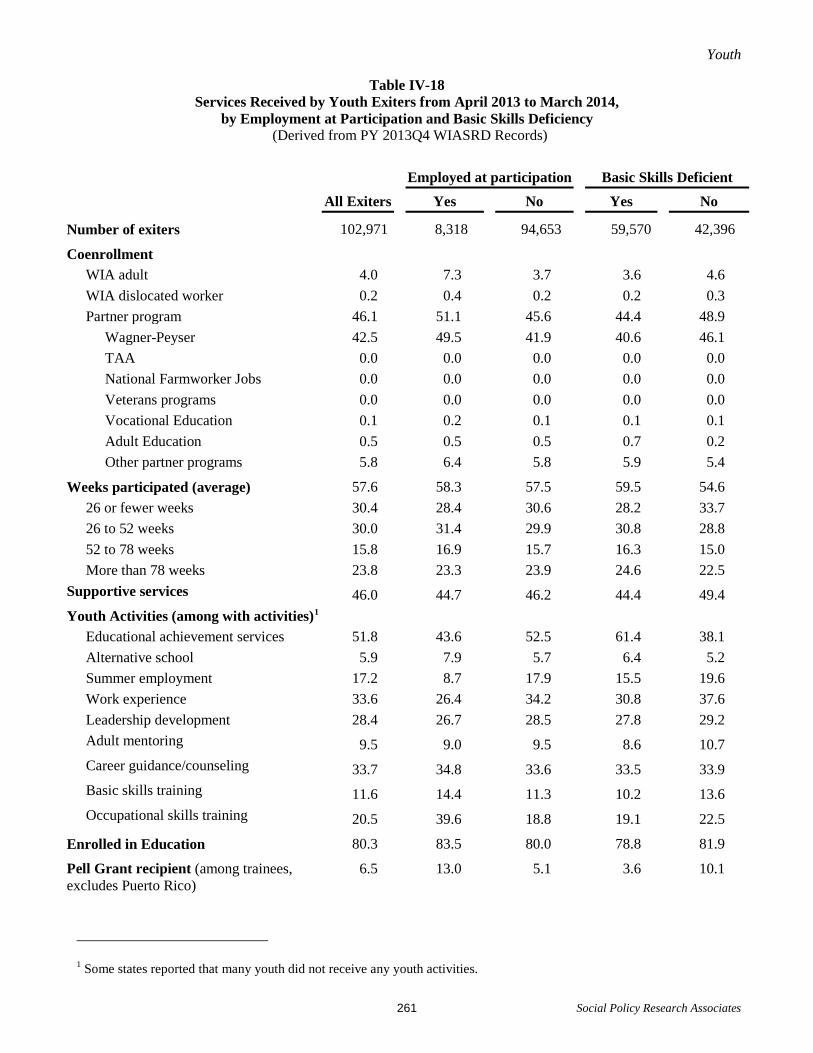
Youth
Social Policy Research Associates 261
Table IV-18 Services Received by Youth Exiters from April 2013 to March 2014,
by Employment at Participation and Basic Skills Deficiency (Derived from PY 2013Q4 WIASRD Records)
All Exiters
Employed at participation Basic Skills Deficient
Yes No Yes No
Number of exiters 102,971 8,318 94,653 59,570 42,396
Coenrollment
WIA adult 4.0 7.3 3.7 3.6 4.6 WIA dislocated worker 0.2 0.4 0.2 0.2 0.3 Partner program 46.1 51.1 45.6 44.4 48.9
Wagner-Peyser 42.5 49.5 41.9 40.6 46.1 TAA 0.0 0.0 0.0 0.0 0.0 National Farmworker Jobs 0.0 0.0 0.0 0.0 0.0 Veterans programs 0.0 0.0 0.0 0.0 0.0 Vocational Education 0.1 0.2 0.1 0.1 0.1 Adult Education 0.5 0.5 0.5 0.7 0.2 Other partner programs 5.8 6.4 5.8 5.9 5.4
Weeks participated (average) 57.6 58.3 57.5 59.5 54.6 26 or fewer weeks 30.4 28.4 30.6 28.2 33.7 26 to 52 weeks 30.0 31.4 29.9 30.8 28.8 52 to 78 weeks 15.8 16.9 15.7 16.3 15.0 More than 78 weeks 23.8 23.3 23.9 24.6 22.5
Supportive services 46.0 44.7 46.2 44.4 49.4 Youth Activities (among with activities)1
Educational achievement services 51.8 43.6 52.5 61.4 38.1 Alternative school 5.9 7.9 5.7 6.4 5.2 Summer employment 17.2 8.7 17.9 15.5 19.6 Work experience 33.6 26.4 34.2 30.8 37.6 Leadership development 28.4 26.7 28.5 27.8 29.2 Adult mentoring 9.5 9.0 9.5 8.6 10.7 Career guidance/counseling 33.7 34.8 33.6 33.5 33.9 Basic skills training 11.6 14.4 11.3 10.2 13.6 Occupational skills training 20.5 39.6 18.8 19.1 22.5
Enrolled in Education 80.3 83.5 80.0 78.8 81.9
Pell Grant recipient (among trainees, excludes Puerto Rico)
6.5 13.0 5.1 3.6 10.1
1 Some states reported that many youth did not receive any youth activities.

Youth
Social Policy Research Associates 262
Table IV-19 Services Received by Youth Exiters from April 2013 to March 2014, by School Status at Participation
(Derived from PY 2013Q4 WIASRD Records)
Attending School Not Attending School
All
Exiters High School
or Below Post-
secondary High School
Dropout High School
Graduate
Number of exiters 102,971 46,879 4,180 26,923 24,970
Coenrollment
WIA adult 4.0 1.6 8.3 3.9 7.9 WIA dislocated worker 0.2 0.1 0.5 0.3 0.6 Partner program 46.1 39.1 62.6 50.6 51.6
Wagner-Peyser 42.5 35.9 59.6 45.8 48.5 TAA 0.0 0.0 0.1 0.0 0.0 National Farmworker Jobs 0.0 0.0 0.1 0.0 0.0 Veterans programs 0.0 0.0 0.0 0.0 0.0 Vocational Education 0.1 0.1 0.1 0.0 0.2 Adult Education 0.5 0.2 0.1 1.4 0.1 Other partner programs 5.8 4.1 9.7 7.8 6.4
Weeks participated (average) 57.6 65.4 57.8 53.6 47.2 26 or fewer weeks 30.4 24.7 36.6 31.9 38.6 26 to 52 weeks 30.0 28.7 22.6 32.5 31.1 52 to 78 weeks 15.8 16.3 15.3 16.0 14.5 More than 78 weeks 23.8 30.4 25.5 19.6 15.8
Supportive services 46.0 43.0 52.2 48.2 48.4 Youth Activities (among with activities)1
Educational achievement services 51.8 54.8 24.2 66.1 35.7 Alternative school 5.9 4.9 1.3 12.4 1.8 Summer employment 17.2 24.1 27.3 7.0 12.8 Work experience 33.6 38.2 31.0 26.5 32.6 Leadership development 28.4 31.6 18.7 28.9 23.3 Adult mentoring 9.5 10.6 5.5 11.3 6.3 Career guidance/counseling 33.7 32.0 28.1 37.8 33.4 Basic skills training 11.6 13.9 9.1 12.8 6.3 Occupational skills training 20.5 12.9 43.2 17.5 34.4
Enrolled in Education 80.3 97.7 95.3 73.2 52.9
Pell Grant recipient (among trainees, excludes Puerto Rico)
6.5 1.8 28.6 0.7 5.5
1 Some states reported that many youth did not receive any youth activities.
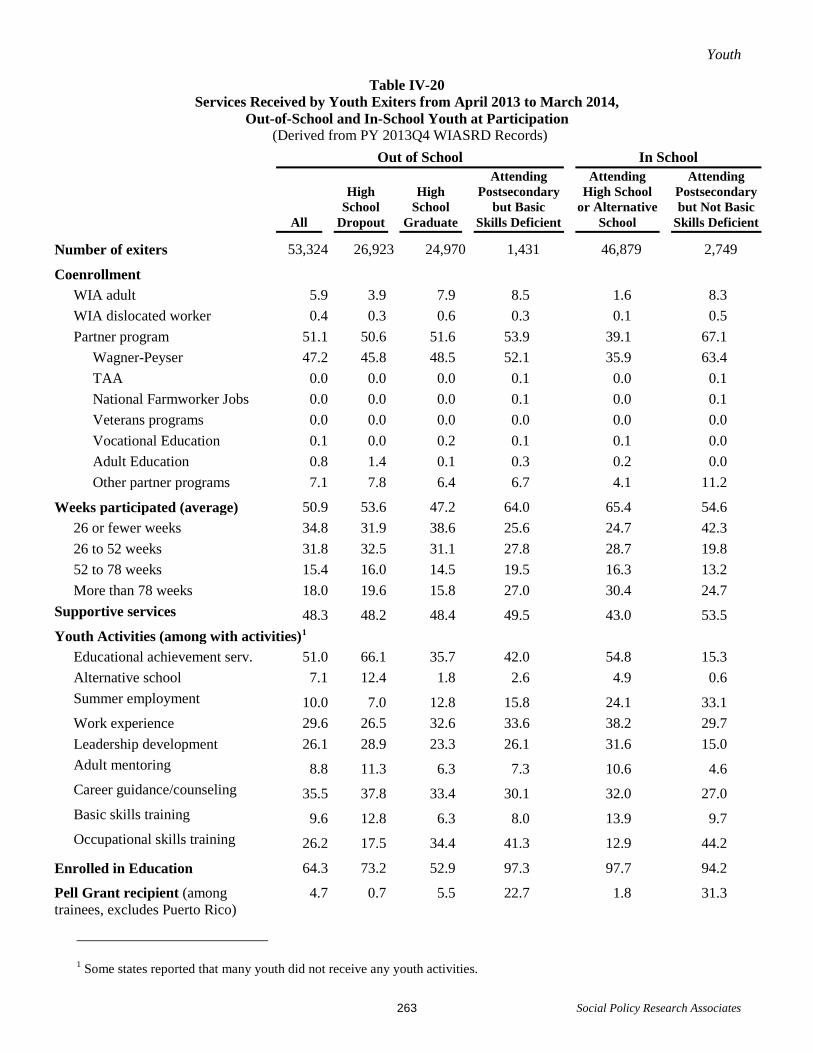
Youth
Social Policy Research Associates 263
Table IV-20 Services Received by Youth Exiters from April 2013 to March 2014,
Out-of-School and In-School Youth at Participation (Derived from PY 2013Q4 WIASRD Records)
Out of School In School
All
High School
Dropout
High School
Graduate
Attending Postsecondary
but Basic Skills Deficient
Attending High School
or Alternative School
Attending Postsecondary but Not Basic
Skills Deficient
Number of exiters 53,324 26,923 24,970 1,431 46,879 2,749
Coenrollment
WIA adult 5.9 3.9 7.9 8.5 1.6 8.3 WIA dislocated worker 0.4 0.3 0.6 0.3 0.1 0.5 Partner program 51.1 50.6 51.6 53.9 39.1 67.1
Wagner-Peyser 47.2 45.8 48.5 52.1 35.9 63.4 TAA 0.0 0.0 0.0 0.1 0.0 0.1 National Farmworker Jobs 0.0 0.0 0.0 0.1 0.0 0.1 Veterans programs 0.0 0.0 0.0 0.0 0.0 0.0 Vocational Education 0.1 0.0 0.2 0.1 0.1 0.0 Adult Education 0.8 1.4 0.1 0.3 0.2 0.0 Other partner programs 7.1 7.8 6.4 6.7 4.1 11.2
Weeks participated (average) 50.9 53.6 47.2 64.0 65.4 54.6 26 or fewer weeks 34.8 31.9 38.6 25.6 24.7 42.3 26 to 52 weeks 31.8 32.5 31.1 27.8 28.7 19.8 52 to 78 weeks 15.4 16.0 14.5 19.5 16.3 13.2 More than 78 weeks 18.0 19.6 15.8 27.0 30.4 24.7
Supportive services 48.3 48.2 48.4 49.5 43.0 53.5 Youth Activities (among with activities)1
Educational achievement serv. 51.0 66.1 35.7 42.0 54.8 15.3 Alternative school 7.1 12.4 1.8 2.6 4.9 0.6 Summer employment 10.0 7.0 12.8 15.8 24.1 33.1 Work experience 29.6 26.5 32.6 33.6 38.2 29.7 Leadership development 26.1 28.9 23.3 26.1 31.6 15.0 Adult mentoring 8.8 11.3 6.3 7.3 10.6 4.6 Career guidance/counseling 35.5 37.8 33.4 30.1 32.0 27.0 Basic skills training 9.6 12.8 6.3 8.0 13.9 9.7 Occupational skills training 26.2 17.5 34.4 41.3 12.9 44.2
Enrolled in Education 64.3 73.2 52.9 97.3 97.7 94.2
Pell Grant recipient (among trainees, excludes Puerto Rico)
4.7 0.7 5.5 22.7 1.8 31.3
1 Some states reported that many youth did not receive any youth activities.
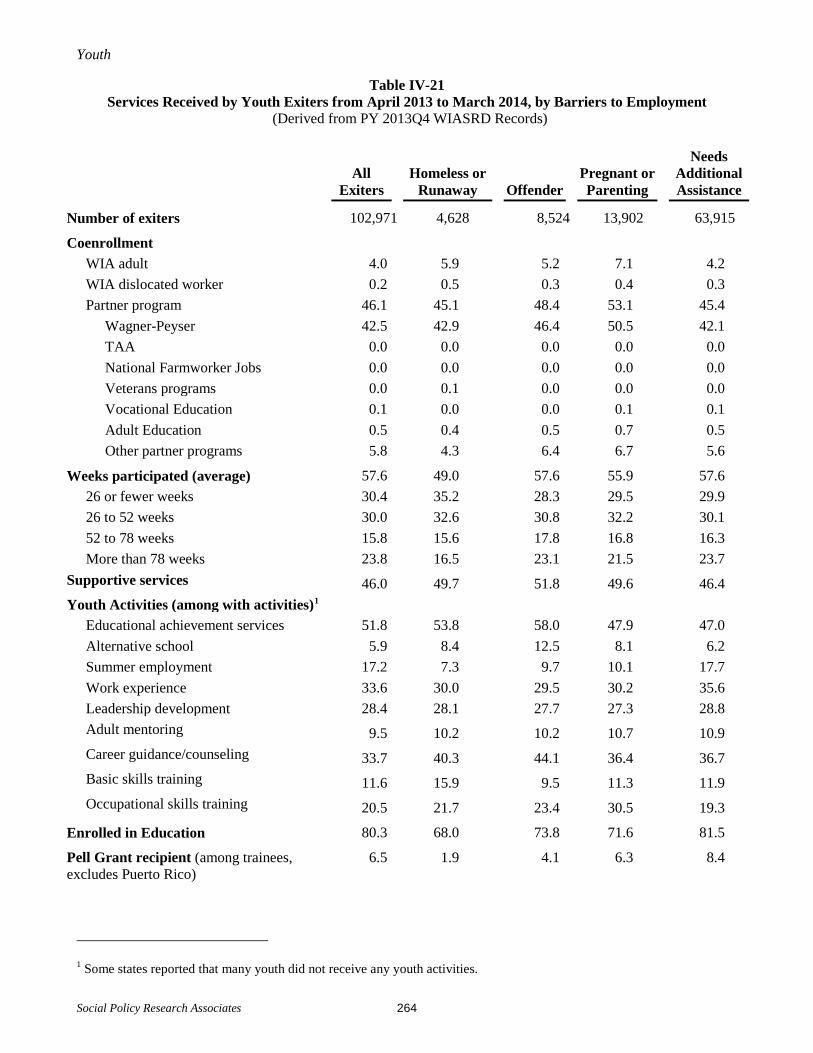
Youth
Social Policy Research Associates 264
Table IV-21 Services Received by Youth Exiters from April 2013 to March 2014, by Barriers to Employment
(Derived from PY 2013Q4 WIASRD Records)
All Exiters
Homeless or Runaway
Offender
Pregnant or Parenting
Needs Additional Assistance
Number of exiters 102,971 4,628 8,524 13,902 63,915
Coenrollment
WIA adult 4.0 5.9 5.2 7.1 4.2 WIA dislocated worker 0.2 0.5 0.3 0.4 0.3 Partner program 46.1 45.1 48.4 53.1 45.4
Wagner-Peyser 42.5 42.9 46.4 50.5 42.1 TAA 0.0 0.0 0.0 0.0 0.0 National Farmworker Jobs 0.0 0.0 0.0 0.0 0.0 Veterans programs 0.0 0.1 0.0 0.0 0.0 Vocational Education 0.1 0.0 0.0 0.1 0.1 Adult Education 0.5 0.4 0.5 0.7 0.5 Other partner programs 5.8 4.3 6.4 6.7 5.6
Weeks participated (average) 57.6 49.0 57.6 55.9 57.6 26 or fewer weeks 30.4 35.2 28.3 29.5 29.9 26 to 52 weeks 30.0 32.6 30.8 32.2 30.1 52 to 78 weeks 15.8 15.6 17.8 16.8 16.3 More than 78 weeks 23.8 16.5 23.1 21.5 23.7
Supportive services 46.0 49.7 51.8 49.6 46.4 Youth Activities (among with activities)1
Educational achievement services 51.8 53.8 58.0 47.9 47.0 Alternative school 5.9 8.4 12.5 8.1 6.2 Summer employment 17.2 7.3 9.7 10.1 17.7 Work experience 33.6 30.0 29.5 30.2 35.6 Leadership development 28.4 28.1 27.7 27.3 28.8 Adult mentoring 9.5 10.2 10.2 10.7 10.9 Career guidance/counseling 33.7 40.3 44.1 36.4 36.7 Basic skills training 11.6 15.9 9.5 11.3 11.9 Occupational skills training 20.5 21.7 23.4 30.5 19.3
Enrolled in Education 80.3 68.0 73.8 71.6 81.5
Pell Grant recipient (among trainees, excludes Puerto Rico)
6.5 1.9 4.1 6.3 8.4
1 Some states reported that many youth did not receive any youth activities.
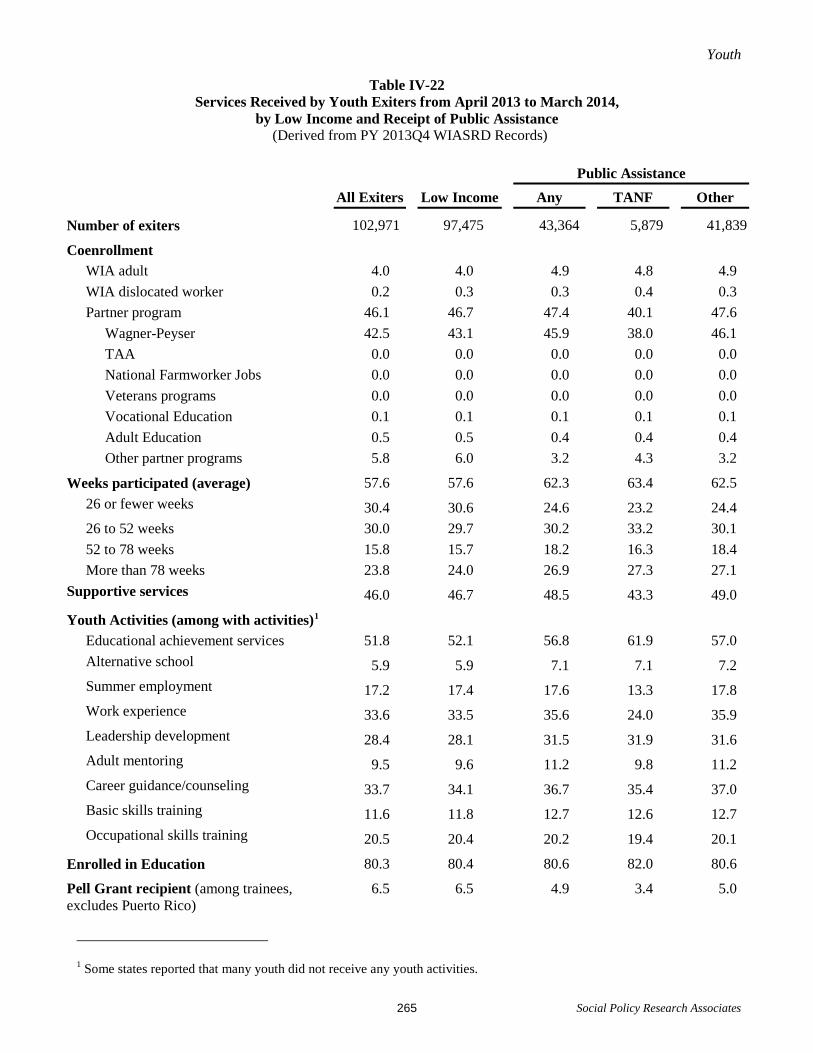
Youth
Social Policy Research Associates 265
Table IV-22 Services Received by Youth Exiters from April 2013 to March 2014,
by Low Income and Receipt of Public Assistance (Derived from PY 2013Q4 WIASRD Records)
Public Assistance
All Exiters Low Income Any TANF Other
Number of exiters 102,971 97,475 43,364 5,879 41,839
Coenrollment
WIA adult 4.0 4.0 4.9 4.8 4.9 WIA dislocated worker 0.2 0.3 0.3 0.4 0.3 Partner program 46.1 46.7 47.4 40.1 47.6
Wagner-Peyser 42.5 43.1 45.9 38.0 46.1 TAA 0.0 0.0 0.0 0.0 0.0 National Farmworker Jobs 0.0 0.0 0.0 0.0 0.0 Veterans programs 0.0 0.0 0.0 0.0 0.0 Vocational Education 0.1 0.1 0.1 0.1 0.1 Adult Education 0.5 0.5 0.4 0.4 0.4 Other partner programs 5.8 6.0 3.2 4.3 3.2
Weeks participated (average) 57.6 57.6 62.3 63.4 62.5 26 or fewer weeks 30.4 30.6 24.6 23.2 24.4 26 to 52 weeks 30.0 29.7 30.2 33.2 30.1 52 to 78 weeks 15.8 15.7 18.2 16.3 18.4 More than 78 weeks 23.8 24.0 26.9 27.3 27.1
Supportive services 46.0 46.7 48.5 43.3 49.0
Youth Activities (among with activities)1
Educational achievement services 51.8 52.1 56.8 61.9 57.0 Alternative school 5.9 5.9 7.1 7.1 7.2 Summer employment 17.2 17.4 17.6 13.3 17.8 Work experience 33.6 33.5 35.6 24.0 35.9 Leadership development 28.4 28.1 31.5 31.9 31.6 Adult mentoring 9.5 9.6 11.2 9.8 11.2 Career guidance/counseling 33.7 34.1 36.7 35.4 37.0 Basic skills training 11.6 11.8 12.7 12.6 12.7 Occupational skills training 20.5 20.4 20.2 19.4 20.1
Enrolled in Education 80.3 80.4 80.6 82.0 80.6
Pell Grant recipient (among trainees, excludes Puerto Rico)
6.5 6.5 4.9 3.4 5.0
1 Some states reported that many youth did not receive any youth activities.

Youth
Social Policy Research Associates 266
Table IV-23 Services Received by Youth Exiters from April 2013 to March 2014, by Selected Characteristics
(Derived from PY 2013Q4 WIASRD Records)
All
Exiters Limited English-
Language1 Single Parent
Pell Grant Recipient1 (
among trainees)
Basic Skills
Deficient
Number of exiters 102,971 2,066 9,364 821 59,570
Coenrollment
WIA adult 4.0 4.2 7.4 18.6 3.6 WIA dislocated worker 0.2 0.0 0.4 2.1 0.2 Partner program 46.1 33.2 54.2 66.7 44.4
Wagner-Peyser 42.5 27.9 51.2 64.6 40.6 TAA 0.0 0.0 0.0 0.1 0.0 National Farmworker Jobs 0.0 0.1 0.0 0.0 0.0 Veterans programs 0.0 0.0 0.0 0.0 0.0 Vocational Education 0.1 0.0 0.1 1.7 0.1 Adult Education 0.5 0.8 0.7 0.2 0.7 Other partner programs 5.8 5.5 8.3 18.3 5.9
Weeks participated (average) 57.6 56.7 58.0 84.3 59.5
26 or fewer weeks 30.4 26.4 29.6 11.3 28.2 26 to 52 weeks 30.0 37.8 30.6 24.2 30.8 52 to 78 weeks 15.8 15.7 17.1 20.0 16.3 More than 78 weeks 23.8 20.1 22.7 44.5 24.6
Supportive services 46.0 37.1 48.0 47.3 44.4 Youth Activities (among with activities)2
Educational achievement services 51.8 69.1 47.1 19.0 61.4 Alternative school 5.9 3.9 7.6 1.0 6.4 Summer employment 17.2 13.0 11.1 9.0 15.5 Work experience 33.6 19.0 30.0 21.4 30.8 Leadership development 28.4 23.2 26.7 16.1 27.8 Adult mentoring 9.5 6.7 10.4 6.1 8.6 Career guidance/counseling 33.7 29.0 36.0 39.7 33.5 Basic skills training 11.6 7.4 10.7 19.4 10.2 Occupational skills training 20.5 19.5 32.7 86.0 19.1
Enrolled in Education 80.3 87.2 73.8 94.8 78.8
Pell Grant recipient (among trainees, excludes Puerto Rico)
6.5 7.1 7.0 100.0 3.6
1 Excludes Puerto Rico. 2 Some states reported that many youth did not receive any youth activities.

Youth
Social Policy Research Associates 267
Table IV-24 Services Received by Youth Exiters from April 2013 to March 2014, by State
(Derived from PY 2013Q4 WIASRD Records)
Number of
Exiters Educational Achievement
Work Experience/
Summer Employment
Adult Mentoring/
Career Guidance/ Counseling
Leadership Development Opportunities
Occupa-tional Skills
Training
Nation 102,971 59.0 44.9 37.8 28.4 20.5 Alabama 2,023 2.9 0.0 2.9 0.0 99.2 Alaska 148 17.4 48.8 3.3 0.0 73.6 Arizona 1,426 73.4 71.4 69.2 47.5 25.7 Arkansas 716 44.5 96.6 0.0 45.6 14.0 California 14,440 82.5 6.6 22.0 28.0 7.0 Colorado 1,378 43.5 59.9 30.8 46.9 46.8 Connecticut 490 56.6 43.6 92.3 9.5 0.0 Delaware 220 85.0 92.3 0.0 0.0 0.0 District of Columbia
171 95.2 9.6 4.8 0.6 34.1
Florida 5,325 97.4 45.2 99.9 6.5 36.2 Georgia 3,196 8.1 56.0 29.3 41.4 16.8 Hawaii 163 94.7 17.0 6.4 19.1 14.9 Idaho 631 91.4 49.4 2.0 0.0 24.0 Illinois 3,238 48.5 87.7 15.2 16.0 0.1 Indiana 2,896 78.9 14.5 98.1 0.0 6.1 Iowa 540 0.0 0.0 0.0 0.0 100.0 Kansas 722 48.7 93.1 23.3 44.4 36.6 Kentucky 1,924 33.7 56.7 6.3 47.1 17.6 Louisiana 860 40.6 54.2 19.6 11.4 45.0 Maine 380 61.1 51.5 6.3 11.0 53.4 Maryland 1,016 25.7 100.0 10.0 34.8 0.8 Massachusetts 1,462 22.4 0.0 0.0 0.0 77.6 Michigan 4,199 57.4 65.4 13.7 40.1 30.3 Minnesota 1,517 68.2 47.3 89.2 0.0 18.7 Mississippi 2,012 75.2 45.9 66.5 26.8 1.7 Missouri 2,082 80.1 65.0 99.7 43.2 1.0 Montana 214 0.0 97.9 0.0 12.8 2.1 Nebraska 303 45.6 30.2 35.9 59.1 61.9 Nevada 2,437 26.9 56.0 30.1 31.1 15.9 New Hampshire 171 98.8 98.8 98.2 95.3 100.0 New Jersey 2,311 23.0 45.9 52.8 22.6 11.1 New Mexico 634 78.9 100.0 13.6 0.3 23.7 New York 4,582 0.6 0.0 0.0 0.0 99.4
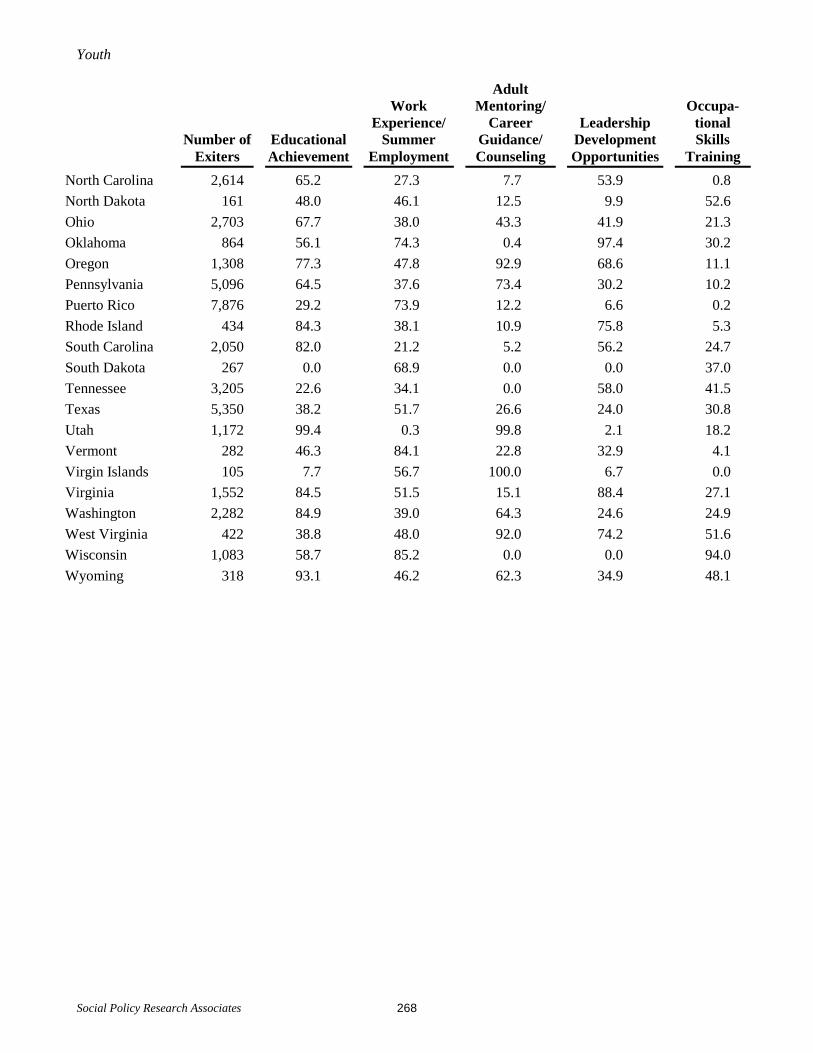
Youth
Social Policy Research Associates 268
Number of
Exiters Educational Achievement
Work Experience/
Summer Employment
Adult Mentoring/
Career Guidance/ Counseling
Leadership Development Opportunities
Occupa-tional Skills
Training North Carolina 2,614 65.2 27.3 7.7 53.9 0.8 North Dakota 161 48.0 46.1 12.5 9.9 52.6 Ohio 2,703 67.7 38.0 43.3 41.9 21.3 Oklahoma 864 56.1 74.3 0.4 97.4 30.2 Oregon 1,308 77.3 47.8 92.9 68.6 11.1 Pennsylvania 5,096 64.5 37.6 73.4 30.2 10.2 Puerto Rico 7,876 29.2 73.9 12.2 6.6 0.2 Rhode Island 434 84.3 38.1 10.9 75.8 5.3 South Carolina 2,050 82.0 21.2 5.2 56.2 24.7 South Dakota 267 0.0 68.9 0.0 0.0 37.0 Tennessee 3,205 22.6 34.1 0.0 58.0 41.5 Texas 5,350 38.2 51.7 26.6 24.0 30.8 Utah 1,172 99.4 0.3 99.8 2.1 18.2 Vermont 282 46.3 84.1 22.8 32.9 4.1 Virgin Islands 105 7.7 56.7 100.0 6.7 0.0 Virginia 1,552 84.5 51.5 15.1 88.4 27.1 Washington 2,282 84.9 39.0 64.3 24.6 24.9 West Virginia 422 38.8 48.0 92.0 74.2 51.6 Wisconsin 1,083 58.7 85.2 0.0 0.0 94.0 Wyoming 318 93.1 46.2 62.3 34.9 48.1

Youth
Social Policy Research Associates 269
Table IV-25 Outcomes of Youth Exiters, Trends Over Time
(Derived from PY 2013Q4 WIASRD Records)
Oct. 2010 to
Sep. 2011 Oct. 2011 to
Sep. 2012 Apr. 2012 to Mar. 2013
Oct. 2012 to Sep. 2013
Apr. 2013 to Mar. 2014
Number of exiters 134,254 114,824 116,175 108,389 102,971
Youth Common Measures
Placement in Employment or Education
60.5 65.2 64.9 65.4 66.4
Employment 45.7 50.5 50.6 52.9 51.8 Education 14.8 14.7 14.3 12.4 14.6
Attainment of Degree or Certificate
57.6 64.0 64.5 66.3 67.5
Secondary school diploma 34.9 36.5 36.1 36.4 41.9 GED or equivalency 10.0 10.9 10.6 11.7 10.5 Certificate or postsecondary degree
12.8 16.6 17.9 18.2 15.1
PY 2009 PY 2010 PY 2011 PY 2012 PY 2013
Literacy and Numeracy Gains (not based on exiters)
43.2 44.7 49.0 53.7 53.3
Outcomes for All Youth Oct. 2010 to
Sep. 2011 Oct. 2011 to
Sep. 2012 Apr. 2012 to Mar. 2013
Oct. 2012 to Sep. 2013
Apr. 2013 to Mar. 2014
Attending secondary school at exit
20.5 16.6 17.1 16.1 15.4
Placement (quarter after exit) 31.0 36.9 35.8 38.0 41.0 Retention (3rd quarter after exit)
32.6 39.5 39.4 44.4
Not attending secondary school at exit 79.5 83.4 82.9 83.9 84.6
Placement (quarter after exit) 72.4 74.5 74.4 74.2 75.2 Postsecondary education 16.1 15.2 15.0 12.8 14.9 Advanced training 1.3 1.0 0.9 0.8 0.9 Apprenticeships 0.0 0.0 0.0 0.0 0.0 Military service 0.2 0.2 0.2 0.2 0.2 Employment 54.8 58.1 58.2 60.3 59.1
Retention (3rd quarter after exit)
67.3 67.3 67.3 67.7
Postsecondary education 11.8 9.8 9.7 5.1 Advanced training 1.0 0.8 0.7 0.5 Apprenticeships 0.0 0.0 0.0 0.0 Military service 0.2 0.2 0.2 0.1 Employment 54.3 56.5 56.7 62.0

Youth
Social Policy Research Associates 270
Oct. 2010 to
Sep. 2011 Oct. 2011 to
Sep. 2012 Apr. 2012 to Mar. 2013
Oct. 2012 to Sep. 2013
Apr. 2013 to Mar. 2014
Outcomes for All Youth
Nontraditional employment (quarter after exit)
7.3 4.6 3.9 4.0 4.0
Males 9.5 7.2 6.2 6.0 6.0 Females 5.6 2.8 2.2 2.5 2.6
Earnings of employed in quarter after exit (average)
$2,611 $2,707 $2,703 $2,703 $2,663
$1 - $2,499 57.0 55.3 55.4 55.2 56.3 $2,500 - $4,999 31.4 32.2 32.0 32.1 31.3 $5,000 - $7,499 8.2 8.8 8.8 9.1 8.9 $7,500 or more 3.4 3.7 3.8 3.6 3.5
Earnings of employed in 3rd quarter after exit (average)
$2,901 $2,996 $2,993 $3,138
$1 - $2,499 51.8 50.3 50.5 47.3 $2,500 - $4,999 33.6 34.0 33.5 34.4 $5,000 - $7,499 10.2 10.8 11.0 12.8 $7,500 or more 4.5 4.9 4.9 5.5
Older Youth Performance and 12-Month Outcomes
Entered employment (quarter after exit, excludes employed at entry)
63.9 67.6 67.6 68.2 67.8
Retained employment 3rd quarter after exit
81.4 82.3 82.6 83.6
Retained employment 4th quarter after exit
74.7 77.0 77.4 78.1
Earnings change 2nd and 3rd quarters after exit $4,274 $4,434 $4,485 $4,620 3rd and 4th quarters after exit $4,193 $4,434 $4,499 $4,573
Credential rate 38.3 40.4 39.9 39.3 39.6
Younger Youth Performance Outcomes
Youth retention 65.1 65.1 64.9 64.3 Diploma attainment rate 70.6 74.1 74.3 74.9 73.6 Skill attainment rate 82.7 85.0 84.8 82.9 82.0
Note: Outcome data for exiters from October 2012 to September 2013 are incomplete. Retention outcomes are based on 6 months of exiters.
Outcome data for exiters from April 2013 to March 2014 do not include retention outcomes. Placement outcomes are based on 6 months of exiters.

Youth
Social Policy Research Associates 271
Table IV-26 Number of Youth Exiters Attaining Outcomes Trends Over Time
(Derived from PY 2013Q4 WIASRD Records)
Oct. 2010 to
Sep. 2011 Oct. 2011 to
Sep. 2012 Apr. 2012 to Mar. 2013
Oct. 2012 to Sep. 2013
Apr. 2013 to Mar. 2014
Number of exiters 134,254 114,824 116,175 108,389 102,971
Youth Common Measures
Placement in Employment or Education 69,710 63,813 64,523 60,576 40,173
Employment 52,679 49,404 50,319 49,050 31,343 Education 17,031 14,409 14,204 11,526 8,830
Attainment of Degree or Certificate 59,213 57,426 58,373 55,784 37,722
Secondary school diploma 35,817 32,725 32,619 30,606 23,428 GED or equivalency 10,238 9,827 9,599 9,873 5,850 Certificate or postsecondary degree
13,158 14,874 16,155 15,305 8,444
PY 2009 PY 2010 PY 2011 PY 2012 PY 2013
Literacy and Numeracy Gains (not based on exiters)
12,395 18,900 19,582 20,760 20,552
Outcomes for All Youth Oct. 2010 to
Sep. 2011 Oct. 2011 to
Sep. 2012 Apr. 2012 to Mar. 2013
Oct. 2012 to Sep. 2013
Apr. 2013 to Mar. 2014
Attending secondary school at exit
23,327 16,290 16,959 14,680 13,225
Placement (quarter after exit) 7,228 6,010 6,070 5,572 3,960 Retention (3rd quarter after exit)
7,611 6,440 6,686 2,234
Not attending secondary school at exit
90,210 81,558 81,983 76,711 72,481
Placement (quarter after exit) 65,297 60,790 60,984 56,917 37,776 Postsecondary education 14,489 12,410 12,324 9,849 7,502 Advanced training 1,185 840 767 639 459 Apprenticeships 39 30 28 23 18 Military service 180 165 156 159 121 Employment 49,404 47,345 47,709 46,247 29,676
Retention (3rd quarter after exit) 60,707 54,857 55,150 17,913
Postsecondary education 10,665 7,966 7,957 1,350 Advanced training 924 612 580 133 Apprenticeships 39 14 18 5 Military service 137 148 134 26 Employment 48,942 46,117 46,461 16,399

Youth
Social Policy Research Associates 272
Outcomes for All Youth Oct. 2010 to
Sep. 2011 Oct. 2011 to
Sep. 2012 Apr. 2012 to Mar. 2013
Oct. 2012 to Sep. 2013
Apr. 2013 to Mar. 2014
Nontraditional employment (quarter after exit)
1,834 986 821 811 470
Males 1,046 632 539 513 293 Females 788 333 261 284 168
Earnings of employed in quarter after exit (average)
$1 - $2,499 31,493 28,847 29,521 28,914 18,743 $2,500 - $4,999 17,386 16,785 17,059 16,816 10,437 $5,000 - $7,499 4,507 4,578 4,666 4,780 2,972 $7,500 or more 1,898 1,910 2,002 1,887 1,164
Earnings of employed in 3rd quarter after exit (average)
$1 - $2,499 29,665 26,506 27,237 9,437 $2,500 - $4,999 19,221 17,934 18,051 6,868 $5,000 - $7,499 5,835 5,681 5,931 2,544 $7,500 or more 2,567 2,592 2,663 1,101
Older Youth WIA Performance and 12-Month
Outcomes
Entered employment (quarter after exit, excludes employed at entry)
21,123 20,791 21,247 20,504 11,905
Retained employment 3rd quarter after exit
20,181 20,140 20,511 8,468
Retained employment 4th quarter after exit
18,519 18,848 15,373 4,016
Credential rate 15,936 15,563 15,485 14,524 8,627
Younger Youth WIA Performance Outcomes
Youth retention 40,298 34,752 34,863 9,889 Diploma attainment rate 37,121 33,870 33,852 31,883 30,563
Note: Outcome data for exiters from October 2012 to September 2013 are incomplete. Retention outcomes are based on 6 months of exiters.
Outcome data for exiters from April 2013 to March 2014 do not include retention outcomes. Placement outcomes are based on 6 months of exiters.

Youth
Social Policy Research Associates 273
Table IV-27 Outcomes of Youth Exiters, by Age
(Derived from PY 2013Q4 WIASRD Records)
Age at Participation
All 14 to 15 16 to 17 18 19 to 21
Number of exiters1 102,971 5,313 37,713 23,322 36,623
Youth Common Measures
Placement in Employment or Education3
65.4 42.9 63.7 68.0 69.7
Employment 52.9 31.4 46.0 55.7 63.3 Education 12.4 11.5 17.7 12.3 6.4
Attainment of Degree or Certificate3
66.3 45.4 71.3 69.3 61.7
Secondary school diploma 36.4 35.3 54.1 39.7 9.1 GED or equivalency 11.7 2.7 10.6 12.9 14.5 Certificate or postsecondary degree
18.2 7.4 6.6 16.6 38.1
Literacy and Numeracy Gains (not based on exiters) 5
53.3 45.6 55.5 54.3 52.3
Outcomes for All Youth
Attending secondary school at exit1
15.4 58.4 25.2 9.0 2.6
Placement (quarter after exit)3 38.0 20.9 39.7 49.6 55.4 Retention (3rd quarter after exit)2 39.4 22.4 42.4 52.3 54.8
Not attending secondary school at exit1 84.6 41.6 74.8 91.0 97.4
Placement (quarter after exit)3 74.2 78.1 74.7 73.3 74.1 Postsecondary education 12.8 19.7 19.9 12.4 6.8 Advanced training 0.8 1.0 1.0 0.9 0.7 Apprenticeships 0.0 0.1 0.0 0.1 0.0 Military service 0.2 0.6 0.3 0.3 0.1 Employment 60.3 56.8 53.5 59.7 66.4
Retention (3rd quarter after exit)2
67.3 68.6 67.3 66.4 67.6
Postsecondary education 9.7 14.5 15.8 9.4 4.4 Advanced training 0.7 0.8 1.0 0.8 0.4 Apprenticeships 0.0 0.0 0.0 0.0 0.0 Military service 0.2 0.5 0.3 0.2 0.0 Employment 56.7 52.8 50.3 55.9 62.8

Youth
Social Policy Research Associates 274
Age at Participation
All 14 to 15 16 to 17 18 19 to 21 Other Outcomes
Nontraditional employment (quarter after exit)3
4.0 0.0 9.7 6.5 3.9
Males 6.0 0.0 12.3 9.5 5.9 Females 2.5 0.0 7.6 4.5 2.4
Earnings of employed in quarter after exit (average) 3 $2,703 $2,339 $2,256 $2,621 $3,108
$1 - $2,499 55.2 65.0 64.5 56.4 46.9 $2,500 - $4,999 32.1 26.4 27.7 32.0 35.8 $5,000 - $7,499 9.1 6.2 5.7 8.6 12.2 $7,500 or more 3.6 2.5 2.1 3.0 5.1
Earnings of employed in 3rd quarter after exit (average)2 $2,993 $2,427 $2,542 $2,890 $3,445
$1 - $2,499 50.5 62.7 58.9 50.8 43.0 $2,500 - $4,999 33.5 27.1 30.7 35.4 35.1 $5,000 - $7,499 11.0 6.7 7.6 9.8 14.7 $7,500 or more 4.9 3.6 2.9 3.9 7.2
Older Youth WIA Performance and 12-Month Outcomes
Entered employment (quarter after exit, excludes employed at entry)3
68.2 68.2
Retained employment 3rd quarter after exit2
82.6 82.6
Retained employment 4th quarter after exit4
77.4 77.4
Earnings change 2nd and 3rd quarters after exit2 $4,485 $4,485 3rd and 4th quarters after exit4 $4,499 $4,499
Credential rate3 39.3 39.3
Younger Youth WIA Performance Outcomes
Youth retention2 64.9 60.2 65.3 65.0 Diploma attainment rate1 73.6 73.2 77.0 67.3 Skill attainment rate1 82.0 85.4 82.8 78.9
1 Based on exiters from April 2013 to March 2014. 2 Based on exiters from April 2012 to March 2013. 3 Based on exiters from October 2012 to September 2013. 4 Based on exiters from January 2012 to December 2012. 5 Based on Basic literacy skills deficient out-of-school youth with participation years ending July 2013 to June 2014.

Youth
Social Policy Research Associates 275
Table IV-28 Outcomes of Youth Exiters, by Ethnicity and Race
(Derived from PY 2013Q4 WIASRD Records)
Hispanic Not Hispanic
All Black White Other
Number of exiters1 28,739 70,410 33,394 30,875 6,141
Youth Common Measures
Placement in Employment or Education3
61.5 66.8 64.6 69.1 68.4
Employment 44.5 56.3 53.1 60.5 53.6 Education 17.0 10.6 11.5 8.6 14.8
Attainment of Degree or Certificate3
60.1 68.7 65.0 72.6 68.8
Secondary school diploma 33.2 37.7 36.8 38.0 40.9 GED or equivalency 7.9 13.1 8.4 18.3 12.7 Certificate or postsecondary degree
19.0 17.8 19.7 16.3 15.2
Literacy and Numeracy Gains (not based on exiters) 5
59.4 51.0 49.3 53.8 49.7
Outcomes for All Youth
Attending secondary school at exit1
23.8 12.2 15.5 8.6 13.3
Placement (quarter after exit)3 32.3 41.0 38.6 45.7 41.8 Retention (3rd quarter after exit)2 33.1 45.0 43.5 48.2 44.0
Not attending secondary school at exit1 76.2 87.8 84.5 91.4 86.7
Placement (quarter after exit)3 75.1 73.9 72.2 75.4 74.6 Postsecondary education 20.1 10.5 12.1 8.1 15.2 Advanced training 1.1 0.7 0.8 0.7 0.6 Apprenticeships 0.1 0.0 0.0 0.0 0.0 Military service 0.1 0.2 0.3 0.2 0.2 Employment 53.6 62.4 59.1 66.5 58.6
Retention (3rd quarter after exit)2
69.8 66.6 64.3 68.6 69.0
Postsecondary education 19.0 6.5 7.2 4.6 12.4 Advanced training 0.9 0.6 0.5 0.6 1.6 Apprenticeships 0.1 0.0 0.0 0.0 0.0 Military service 0.1 0.2 0.2 0.2 0.0 Employment 49.8 59.3 56.3 63.2 55.0

Youth
Social Policy Research Associates 276
Hispanic Not Hispanic
All Black White Other Other Outcomes
Nontraditional employment (quarter after exit)3
3.7 4.1 4.6 3.6 4.6
Males 6.2 6.1 7.1 4.9 7.0 Females 1.7 2.8 2.9 2.6 2.8
Earnings of employed in quarter after exit (average) 3 $2,803 $2,675 $2,394 $2,954 $2,615
$1 - $2,499 53.6 55.6 60.9 50.1 58.0 $2,500 - $4,999 32.8 31.9 29.5 34.6 29.7 $5,000 - $7,499 9.8 9.0 7.3 10.6 8.9 $7,500 or more 3.8 3.5 2.3 4.7 3.3
Earnings of employed in 3rd quarter after exit (average)2 $3,089 $2,964 $2,611 $3,323 $2,894
$1 - $2,499 50.4 50.6 56.0 45.0 52.7 $2,500 - $4,999 32.8 33.7 32.4 35.2 31.8 $5,000 - $7,499 11.8 10.8 8.5 12.9 11.2 $7,500 or more 4.9 5.0 3.2 6.8 4.3
Older Youth WIA Performance and 12-Month Outcomes
Entered employment (quarter after exit, excludes employed at entry)3
68.1 68.1 66.2 70.7 68.3
Retained employment 3rd quarter after exit2
84.1 82.3 80.8 83.8 82.7
Retained employment 4th quarter after exit4
75.2 78.4 77.8 79.2 76.8
Earnings change 2nd and 3rd quarters after exit2 $4,456 $4,512 $3,985 $5,090 $4,482 3rd and 4th quarters after exit4 $4,538 $4,515 $3,974 $5,148 $4,346
Credential rate3 40.5 39.1 34.0 44.9 40.7
Younger Youth WIA Performance Outcomes
Youth retention2 68.1 64.5 61.7 66.4 66.8 Diploma attainment rate1 74.0 73.8 70.4 76.6 75.5 Skill attainment rate1 86.4 80.8 79.6 81.2 84.4
1 Based on exiters from April 2013 to March 2014. 2 Based on exiters from April 2012 to March 2013. 3 Based on exiters from October 2012 to September 2013. 4 Based on exiters from January 2012 to December 2012. 5 Based on Basic literacy skills deficient out-of-school youth with participation years ending July 2013 to June 2014.

Youth
Social Policy Research Associates 277
Table IV-29 Outcomes of Youth Exiters, by Gender and Disability
(Derived from PY 2013Q4 WIASRD Records)
Gender With a
Disability Ever in
Foster Care
All Exiters
Male
Female
Number of exiters1 102,971 46,317 55,535 13,399 3,501
Youth Common Measures
Placement in Employment or Education3
65.4 63.9 66.6 63.8 56.5
Employment 52.9 52.8 52.8 53.0 46.7 Education 12.4 11.1 13.7 10.8 9.8
Attainment of Degree or Certificate3
66.3 64.9 67.5 73.9 57.4
Secondary school diploma 36.4 35.7 37.3 54.9 31.9 GED or equivalency 11.7 13.0 10.9 7.8 10.9 Certificate or postsecondary degree
18.2 16.3 19.3 11.2 14.6
Literacy and Numeracy Gains (not based on exiters) 5
53.3 53.1 53.1 53.4 49.5
Outcomes for All Youth
Attending secondary school at exit1
15.4 16.2 14.9 13.9 22.0
Placement (quarter after exit)3 38.0 36.0 39.5 37.8 33.1 Retention (3rd quarter after exit)2
39.4 37.4 40.9 40.0 36.4
Not attending secondary school at exit1 84.6 83.8 85.1 86.1 78.0
Placement (quarter after exit)3 74.2 72.6 75.6 71.2 65.3 Postsecondary education 12.8 11.5 14.1 10.5 10.2 Advanced training 0.8 0.8 0.8 1.3 1.2 Apprenticeships 0.0 0.0 0.0 0.0 0.0 Military service 0.2 0.3 0.1 0.2 0.2 Employment 60.3 59.9 60.5 59.3 53.7
Retention (3rd quarter after exit)2
67.3 66.3 67.9 62.1 59.5
Postsecondary education 9.7 8.8 10.6 5.9 7.0 Advanced training 0.7 0.7 0.7 1.0 1.0 Apprenticeships 0.0 0.0 0.0 0.0 0.0 Military service 0.2 0.3 0.1 0.2 0.3 Employment 56.7 56.6 56.5 54.9 51.2

Youth
Social Policy Research Associates 278
Gender With a
Disability Ever in
Foster Care
All Exiters
Male
Female Other Outcomes
Nontraditional employment (quarter after exit)3
4.0 6.0 2.5 4.3 5.0
Males 6.0 6.0 5.1 6.6 Females 2.5 2.5 2.7 4.1
Earnings of employed in quarter after exit (average) 3 $2,703 $2,833 $2,594 $2,520 $2,316
$1 - $2,499 55.2 53.3 56.9 59.2 64.2 $2,500 - $4,999 32.1 31.6 32.3 29.8 25.4 $5,000 - $7,499 9.1 10.6 7.9 8.0 7.5 $7,500 or more 3.6 4.5 2.9 3.0 3.0
Earnings of employed in 3rd quarter after exit (average)2 $2,993 $3,146 $2,867 $2,870 $2,460
$1 - $2,499 50.5 48.9 51.9 52.1 60.2 $2,500 - $4,999 33.5 32.7 34.1 33.2 28.1 $5,000 - $7,499 11.0 12.3 10.0 10.2 9.1 $7,500 or more 4.9 6.1 4.0 4.5 2.7
Older Youth WIA Performance and 12-Month Outcomes
Entered employment (quarter after exit, excludes employed at entry)3
68.2 68.1 68.3 62.1 63.3
Retained employment 3rd quarter after exit2
82.6 81.8 83.2 81.3 77.6
Retained employment 4th quarter after exit4
77.4 76.2 78.3 76.4 70.7
Earnings change 2nd and 3rd quarters after exit2 $4,485 $4,625 $4,379 $4,341 $3,904 3rd and 4th quarters after exit4 $4,499 $4,725 $4,322 $4,347 $3,619
Credential rate3 39.3 37.5 41.2 38.3 32.7
Younger Youth WIA Performance Outcomes
Youth retention2 64.9 63.7 65.8 60.3 57.0 Diploma attainment rate1 73.6 71.2 75.8 80.3 65.3 Skill attainment rate1 82.0 81.6 82.3 83.6 77.5
1 Based on exiters from April 2013 to March 2014. 2 Based on exiters from April 2012 to March 2013. 3 Based on exiters from October 2012 to September 2013. 4 Based on exiters from January 2012 to December 2012. 5 Based on Basic literacy skills deficient out-of-school youth with participation years ending July 2013 to June 2014.

Youth
Social Policy Research Associates 279
Table IV-30 Outcomes of Youth Exiters, by Employment at Participation and Basic Skills Deficiency
(Derived from PY 2013Q4 WIASRD Records)
All Exiters
Employed at Participation Basic Skills Deficient
Yes No Yes No
Number of exiters1 102,971 8,318 94,653 59,570 42,396
Youth Common Measures
Placement in Employment or Education3
65.4 65.4 63.4 68.1
Employment 52.9 52.9 52.9 52.9 Education 12.4 12.4 10.5 15.2
Attainment of Degree or Certificate3
66.3 72.9 65.7 63.9 69.2
Secondary school diploma 36.4 26.9 37.2 32.3 40.9 GED or equivalency 11.7 13.6 11.6 12.4 11.1 Certificate or postsecondary degree
18.2 32.4 16.9 19.2 17.3
Literacy and Numeracy Gains (not based on exiters) 5
53.3 55.8 53.0 53.3
Outcomes for All Youth
Attending secondary school at exit1
15.4 4.8 16.4 14.4 16.6
Placement (quarter after exit)3 38.0 65.0 37.3 37.0 38.5 Retention (3rd quarter after exit)2 39.4 62.7 38.9 39.0 40.0
Not attending secondary school at exit1 84.6 95.2 83.6 85.6 83.4
Placement (quarter after exit)3 74.2 88.4 72.9 70.7 79.2 Postsecondary education 12.8 3.4 13.7 10.6 16.0 Advanced training 0.8 0.4 0.9 0.9 0.7 Apprenticeships 0.0 0.0 0.0 0.0 0.0 Military service 0.2 0.1 0.2 0.2 0.3 Employment 60.3 84.5 58.0 59.1 62.2
Retention (3rd quarter after exit)2
67.3 83.6 65.8 65.1 70.7
Postsecondary education 9.7 2.5 10.3 8.6 11.5 Advanced training 0.7 0.3 0.7 0.7 0.7 Apprenticeships 0.0 0.0 0.0 0.0 0.0 Military service 0.2 0.1 0.2 0.2 0.2 Employment 56.7 80.7 54.5 55.6 58.3

Youth
Social Policy Research Associates 280
All Exiters
Employed at Participation Basic Skills Deficient
Yes No Yes No Other Outcomes
Nontraditional employment (quarter after exit)3
4.0 3.8 4.0 3.8 4.3
Males 6.0 7.5 5.9 5.7 6.6 Females 2.5 2.1 2.6 2.5 2.6
Earnings of employed in quarter after exit (average) 3
$2,703 $3,556 $2,584 $2,598 $2,867
$1 - $2,499 55.2 38.7 57.5 56.7 52.7 $2,500 - $4,999 32.1 39.1 31.1 31.9 32.6 $5,000 - $7,499 9.1 15.0 8.3 8.6 10.0 $7,500 or more 3.6 7.1 3.1 2.9 4.7
Earnings of employed in 3rd quarter after exit (average)2
$2,993 $4,050 $2,857 $2,851 $3,212
$1 - $2,499 50.5 32.6 52.9 52.3 47.7 $2,500 - $4,999 33.5 38.3 32.9 33.6 33.5 $5,000 - $7,499 11.0 18.6 10.0 10.1 12.4 $7,500 or more 4.9 10.5 4.2 4.0 6.4
Older Youth WIA Performance and 12-Month Outcomes
Entered employment (quarter after exit, excludes employed at entry)3
68.2 68.2 65.8 72.5
Retained employment 3rd quarter after exit2
82.6 90.1 81.2 80.8 85.0
Retained employment 4th quarter after exit4
77.4 87.7 75.6 76.6 78.7
Earnings change 2nd and 3rd quarters after exit2 $4,485 $5,035 $4,376 $4,041 $5,135 3rd and 4th quarters after exit4 $4,499 $5,184 $4,363 $4,015 $5,211
Credential rate3 39.3 57.0 36.9 34.9 46.4
Younger Youth WIA Performance Outcomes
Youth retention2 64.9 80.3 63.9 64.4 65.6 Diploma attainment rate1 73.6 78.9 73.3 69.7 78.7 Skill attainment rate1 82.0 80.1 82.1 82.4 81.2
1 Based on exiters from April 2013 to March 2014. 2 Based on exiters from April 2012 to March 2013. 3 Based on exiters from October 2012 to September 2013. 4 Based on exiters from January 2012 to December 2012. 5 Based on Basic literacy skills deficient out-of-school youth with participation years ending July 2013 to June 2014.

Youth
Social Policy Research Associates 281
Table IV-31 Outcomes of Youth Exiters, by School Status at Participation
(Derived from PY 2013Q4 WIASRD Records)
Attending School Not Attending School
All Exiters High School
or Below Post-
secondary High School
Dropout High School
Graduate
Number of exiters1 102,971 46,879 4,180 26,923 24,970
Youth Common Measures
Placement in Employment or Education3
65.4 63.4 60.1 75.0
Employment 52.9 45.6 54.4 66.0 Education 12.4 17.7 5.7 9.0
Attainment of Degree or Certificate3
66.3 70.9 41.8 65.1 59.7
Secondary school diploma 36.4 61.1 0.0 10.0 0.0 GED or equivalency 11.7 4.0 0.0 41.6 0.0 Certificate or postsecondary degree 18.2 5.8 41.8 13.5 59.7
Literacy and Numeracy Gains (not based on exiters) 5
53.3 45.2 53.7 53.6
Outcomes for All Youth
Attending secondary school at exit1
15.4 31.0 3.5
Placement (quarter after exit)3 38.0 37.3 46.5 Retention (3rd quarter after exit)2 39.4 39.0 44.6
Not attending secondary school at exit1 84.6 69.0 99.9 96.5 100.0
Placement (quarter after exit)3 74.2 77.8 85.2 63.0 78.8 Postsecondary education 12.8 21.1 21.4 5.0 8.2 Advanced training 0.8 0.8 0.7 0.9 0.8 Apprenticeships 0.0 0.0 0.0 0.0 0.0 Military service 0.2 0.4 0.0 0.1 0.1 Employment 60.3 55.5 63.1 57.0 69.8
Retention (3rd quarter after exit)2 67.3 69.9 81.0 55.8 72.7
Postsecondary education 9.7 16.5 17.5 3.2 5.3 Advanced training 0.7 0.8 0.8 0.7 0.6 Apprenticeships 0.0 0.0 0.0 0.0 0.0 Military service 0.2 0.3 0.0 0.1 0.1 Employment 56.7 52.3 62.7 51.9 66.7

Youth
Social Policy Research Associates 282
Attending School Not Attending School
All Exiters High School
or Below Post-
secondary High School
Dropout High School
Graduate Other Outcomes
Nontraditional employment (quarter after exit)3
4.0 5.3 4.6 3.4 4.0
Males 6.0 6.3 9.3 4.4 6.6 Females 2.5 4.2 2.2 2.6 2.3
Earnings of employed in quarter after exit (average) 3 $2,703 $2,352 $3,807 $2,432 $3,184
$1 - $2,499 55.2 62.5 40.2 58.9 45.4 $2,500 - $4,999 32.1 28.8 33.9 31.3 36.6 $5,000 - $7,499 9.1 6.5 15.3 7.3 13.0 $7,500 or more 3.6 2.2 10.6 2.5 5.1
Earnings of employed in 3rd quarter after exit (average)2 $2,993 $2,591 $4,219 $2,744 $3,501
$1 - $2,499 50.5 57.8 38.4 53.4 41.0 $2,500 - $4,999 33.5 31.5 31.5 33.4 36.6 $5,000 - $7,499 11.0 7.7 15.4 10.0 15.3 $7,500 or more 4.9 3.0 14.7 3.2 7.1
Older Youth WIA Performance and 12-Month Outcomes
Entered employment (quarter after exit, excludes employed at entry)3 68.2 61.2 77.6 60.2 74.1
Retained employment 3rd quarter after exit2 82.6 80.5 91.7 76.1 84.9
Retained employment 4th quarter after exit4 77.4 74.2 86.4 71.6 79.6
Earnings change 2nd and 3rd quarters after exit2 $4,485 $4,225 $6,645 $3,431 $4,718 3rd and 4th quarters after exit4 $4,499 $3,960 $6,897 $3,427 $4,731
Credential rate3 39.3 51.9 49.2 37.7 36.6
Younger Youth WIA Performance Outcomes
Youth retention2 64.9 67.6 79.9 53.4 70.5 Diploma attainment rate1 73.6 82.7 51.7 Skill attainment rate1 82.0 82.9 80.9 78.8 81.0
1 Based on exiters from April 2013 to March 2014. 2 Based on exiters from April 2012 to March 2013. 3 Based on exiters from October 2012 to September 2013. 4 Based on exiters from January 2012 to December 2012. 5 Based on Basic literacy skills deficient out-of-school youth with participation years ending July 2013 to June 2014.

Youth
Social Policy Research Associates 283
Table IV-32 Outcomes of Youth Exiters for Out-Of-School and In-School Youth
(Derived from PY 2013Q4 WIASRD Records) Out of School In School
All
High School
Dropout
High School
Graduate
Attending Postsecondary
but Basic Skills Deficient
Attending High School
or Alternative School
Attending Postsecondary but Not Basic
Skills Deficient
Number of exiters1 53,324 26,923 24,970 1,431 46,879 2,749
Youth Common Measures
Placement in Employment or Education3
67.3 60.1 75.0 63.4
Employment 60.0 54.4 66.0 45.6 Education 7.3 5.7 9.0 17.7
Attainment of Degree or Certificate3
62.0 65.1 59.7 42.2 70.9 41.5
Secondary school diploma 5.6 10.0 0.0 0.0 61.1 0.0 GED or equivalency 23.2 41.6 0.0 0.0 4.0 0.0 Certificate or postsecondary degree
33.2 13.5 59.7 42.2 5.8 41.5
Literacy and Numeracy Gains (not based on exiters) 5
53.3 53.7 53.6 45.2
Outcomes for All Youth
Attending secondary school at exit1
1.8 3.5 0.0 0.1 31.0 0.0
Placement (quarter after exit)3 47.3 46.5 93.8 100.0 37.3 100.0 Retention (3rd quarter after exit)2 45.2 44.6 73.9 66.7 39.0 60.0
Not attending secondary school at exit1 98.2 96.5 100.0 99.9 69.0 100.0
Placement (quarter after exit)3 71.1 63.0 78.8 80.5 77.8 87.7 Postsecondary education 6.7 5.0 8.2 12.0 21.1 26.4 Advanced training 0.8 0.9 0.8 0.6 0.8 0.8 Apprenticeships 0.0 0.0 0.0 0.0 0.0 0.0 Military service 0.1 0.1 0.1 0.0 0.4 0.0 Employment 63.5 57.0 69.8 68.0 55.5 60.5
Retention (3rd quarter after exit)2 64.7 55.8 72.7 81.5 69.9 80.7
Postsecondary education 4.6 3.2 5.3 16.9 16.5 17.8 Advanced training 0.7 0.7 0.6 1.1 0.8 0.6 Apprenticeships 0.0 0.0 0.0 0.0 0.0 0.0 Military service 0.1 0.1 0.1 0.0 0.3 0.0 Employment 59.4 51.9 66.7 63.5 52.3 62.3
Youth
Social Policy Research Associates 284
Out of School In School
All
High School
Dropout
High School
Graduate
Attending Postsecondary
but Basic Skills Deficient
Attending High School
or Alternative School
Attending Postsecondary but Not Basic
Skills Deficient
Other Outcomes Nontraditional employment (quarter after exit)3 3.8 3.4 4.0 4.1 5.3 4.9
Males 5.8 4.4 6.6 7.9 6.3 10.2 Females 2.4 2.6 2.3 1.8 4.2 2.4
Earnings of employed in quarter after exit (average) 3 $2,861 $2,432 $3,184 $3,239 $2,352 $4,144
$1 - $2,499 51.2 58.9 45.4 45.2 62.5 37.3 $2,500 - $4,999 34.3 31.3 36.6 35.1 28.8 33.2 $5,000 - $7,499 10.5 7.3 13.0 14.0 6.5 16.0 $7,500 or more 4.0 2.5 5.1 5.8 2.2 13.5
Earnings of employed in 3rd quarter after exit (average)2 $3,184 $2,744 $3,501 $3,606 $2,591 $4,578
$1 - $2,499 46.2 53.4 41.0 39.8 57.8 37.6 $2,500 - $4,999 35.3 33.4 36.6 37.3 31.5 28.0 $5,000 - $7,499 13.1 10.0 15.3 15.1 7.7 15.7 $7,500 or more 5.5 3.2 7.1 7.8 3.0 18.7
Older Youth WIA Performance and 12-Month Outcomes
Entered employment (quarter after exit, excludes employed at entry)3 68.3 60.2 74.1 75.0 61.2 79.3
Retained employment 3rd quarter after exit2 82.1 76.1 84.9 91.5 80.5 91.7
Retained employment 4th quarter after exit4 77.1 71.6 79.6 88.3 74.2 85.4
Earnings change 2nd and 3rd quarters after exit2 $4,305 $3,431 $4,718 $5,522 $4,225 $7,273 3rd and 4th quarters after exit4 $4,317 $3,427 $4,731 $5,674 $3,960 $7,571
Credential rate3 37.2 37.7 36.6 40.0 51.9 53.9 Younger Youth WIA
Performance Outcomes
Youth retention2 60.0 53.4 70.5 78.9 67.6 80.6 Diploma attainment rate1 51.7 51.7 82.7 Skill attainment rate1 79.5 78.8 81.0 78.0 82.9 82.9
1 Based on exiters from April 2013 to March 2014. 2 Based on exiters from April 2012 to March 2013. 3 Based on exiters from October 2012 to September 2013. 4 Based on exiters from January 2012 to December 2012. 5 Based on Basic literacy skills deficient out-of-school youth with participation years ending July 2013 to June 2014.

Youth
Social Policy Research Associates 285
Table IV-33 Outcomes of Youth Exiters, by Barriers to Employment
(Derived from PY 2013Q4 WIASRD Records)
All Exiters
Homeless or
Runaway
Offender
Pregnant or Parenting
Needs Additional Assistance
Number of exiters1 102,971 4,628 8,524 13,902 63,915
Youth Common Measures
Placement in Employment or Education3
65.4 64.0 58.4 67.4 65.3
Employment 52.9 57.4 54.2 61.8 52.1 Education 12.4 6.5 4.2 5.6 13.2
Attainment of Degree or Certificate3
66.3 62.5 58.4 63.8 67.7
Secondary school diploma 36.4 23.7 16.8 14.7 37.8 GED or equivalency 11.7 18.6 21.0 18.6 11.7 Certificate or postsecondary degree
18.2 20.2 20.6 30.4 18.2
Literacy and Numeracy Gains (not based on exiters) 5
53.3 46.9 49.4 51.0 55.1
Outcomes for All Youth
Attending secondary school at exit1
15.4 8.7 11.9 5.4 16.0
Placement (quarter after exit)3 38.0 40.1 39.1 50.4 38.3 Retention (3rd quarter after exit)2 39.4 46.2 39.5 46.7 40.2
Not attending secondary school at exit1 84.6 91.3 88.1 94.6 84.0
Placement (quarter after exit)3 74.2 68.2 64.0 72.3 74.8 Postsecondary education 12.8 6.4 3.8 5.3 13.8 Advanced training 0.8 0.6 0.6 0.5 0.9 Apprenticeships 0.0 0.1 0.0 0.0 0.0 Military service 0.2 0.3 0.0 0.0 0.2 Employment 60.3 60.8 59.6 66.5 59.9
Retention (3rd quarter after exit)2
67.3 62.2 57.8 65.0 66.8
Postsecondary education 9.7 3.7 2.1 3.4 9.5 Advanced training 0.7 1.1 0.4 0.4 0.6 Apprenticeships 0.0 0.0 0.0 0.0 0.0 Military service 0.2 0.0 0.0 0.0 0.2 Employment 56.7 57.3 55.2 61.1 56.4

Youth
Social Policy Research Associates 286
All Exiters
Homeless or
Runaway
Offender
Pregnant or Parenting
Needs Additional Assistance
Other Outcomes
Nontraditional employment (quarter after exit)3
4.0 4.5 3.9 2.8 3.8
Males 6.0 5.4 4.1 6.0 5.5 Females 2.5 3.6 3.2 2.4 2.6
Earnings of employed in quarter after exit (average) 3
$2,703 $2,566 $2,729 $2,941 $2,689
$1 - $2,499 55.2 56.5 54.5 48.6 55.3 $2,500 - $4,999 32.1 32.6 31.5 36.1 32.0 $5,000 - $7,499 9.1 7.9 9.8 11.5 9.1 $7,500 or more 3.6 3.1 4.2 3.8 3.6
Earnings of employed in 3rd quarter after exit (average)2
$2,993 $2,797 $2,895 $3,209 $3,007
$1 - $2,499 50.5 52.5 51.9 45.1 50.6 $2,500 - $4,999 33.5 32.9 31.7 36.0 33.2 $5,000 - $7,499 11.0 10.6 11.8 13.7 11.0 $7,500 or more 4.9 4.0 4.6 5.3 5.2
Older Youth WIA Performance and 12-Month Outcomes
Entered employment (quarter after exit, excludes employed at entry)3
68.2 63.7 63.4 68.3 68.0
Retained employment 3rd quarter after exit2
82.6 78.6 78.8 81.9 83.1
Retained employment 4th quarter after exit4
77.4 74.7 75.0 78.3 78.0
Earnings change 2nd and 3rd quarters after exit2 $4,485 $3,832 $4,015 $4,100 $4,628 3rd and 4th quarters after exit4 $4,499 $3,725 $4,051 $4,057 $4,664
Credential rate3 39.3 31.6 32.8 39.8 39.8
Younger Youth WIA Performance Outcomes
Youth retention2 64.9 59.6 53.8 61.2 63.4 Diploma attainment rate1 73.6 60.9 55.0 59.5 74.2 Skill attainment rate1 82.0 78.0 76.3 76.7 80.8
1 Based on exiters from April 2013 to March 2014. 2 Based on exiters from April 2012 to March 2013. 3 Based on exiters from October 2012 to September 2013. 4 Based on exiters from January 2012 to December 2012. 5 Based on Basic literacy skills deficient out-of-school youth with participation years ending July 2013 to June 2014.

Youth
Social Policy Research Associates 287
Table IV-34 Outcomes of Youth Exiters, by Low Income and Receipt of Public Assistance
(Derived from PY 2013Q4 WIASRD Records)
Public Assistance
All Exiters Low Income Any TANF Other
Number of exiters1 102,971 97,475 43,364 5,879 41,839
Youth Common Measures
Placement in Employment or Education3
65.4 65.2 65.5 63.7 65.6
Employment 52.9 52.7 55.4 52.5 55.5 Education 12.4 12.5 10.1 11.2 10.1
Attainment of Degree or Certificate3
66.3 66.1 66.9 63.7 67.1
Secondary school diploma 36.4 36.1 35.3 35.8 35.4 GED or equivalency 11.7 11.7 13.4 10.8 13.5 Certificate or postsecondary degree
18.2 18.3 18.3 17.1 18.3
Literacy and Numeracy Gains (not based on exiters) 5
53.3 53.3 51.2 50.5 51.1
Outcomes for All Youth
Attending secondary school at exit1
15.4 15.7 14.0 15.6 13.9
Placement (quarter after exit)3 38.0 37.6 39.1 40.9 39.0 Retention (3rd quarter after exit)2 39.4 39.2 41.8 38.0 41.9
Not attending secondary school at exit1 84.6 84.3 86.0 84.4 86.1
Placement (quarter after exit)3 74.2 74.1 72.2 69.7 72.3 Postsecondary education 12.8 12.9 10.4 11.4 10.4 Advanced training 0.8 0.8 0.6 0.8 0.6 Apprenticeships 0.0 0.0 0.0 0.0 0.0 Military service 0.2 0.2 0.2 0.1 0.2 Employment 60.3 60.2 61.0 57.3 61.0
Retention (3rd quarter after exit)2
67.3 67.3 64.9 62.3 65.0
Postsecondary education 9.7 9.8 5.8 7.7 5.7 Advanced training 0.7 0.7 0.5 0.8 0.5 Apprenticeships 0.0 0.0 0.0 0.0 0.0 Military service 0.2 0.2 0.1 0.1 0.1 Employment 56.7 56.6 58.5 53.8 58.8
Youth
Social Policy Research Associates 288
Public Assistance
All Exiters Low Income Any TANF Other Other Outcomes
Nontraditional employment (quarter after exit)3
4.0 4.0 4.4 2.3 4.5
Males 6.0 6.1 7.5 5.1 7.4 Females 2.5 2.5 2.9 1.8 3.0
Earnings of employed in quarter after exit (average) 3
$2,703 $2,696 $2,618 $2,518 $2,625
$1 - $2,499 55.2 55.4 55.7 58.3 55.5 $2,500 - $4,999 32.1 32.0 33.0 30.9 33.1 $5,000 - $7,499 9.1 9.1 8.5 8.5 8.5 $7,500 or more 3.6 3.6 2.8 2.3 2.9
Earnings of employed in 3rd quarter after exit (average)2
$2,993 $2,983 $2,884 $2,905 $2,891
$1 - $2,499 50.5 50.7 51.3 53.1 51.2 $2,500 - $4,999 33.5 33.5 34.5 34.1 34.6 $5,000 - $7,499 11.0 10.9 10.2 9.5 10.2 $7,500 or more 4.9 4.9 4.0 3.2 4.0
Older Youth WIA Performance and 12-Month Outcomes
Entered employment (quarter after exit, excludes employed at entry)3
68.2 68.1 66.9 65.6 66.9
Retained employment 3rd quarter after exit2
82.6 82.5 81.0 79.5 81.0
Retained employment 4th quarter after exit4
77.4 77.3 77.0 75.4 77.0
Earnings change 2nd and 3rd quarters after exit2 $4,485 $4,494 $4,153 $4,200 $4,148 3rd and 4th quarters after exit4 $4,499 $4,502 $4,064 $4,165 $4,052
Credential rate3 39.3 39.4 36.7 34.9 36.9
Younger Youth WIA Performance Outcomes
Youth retention2 64.9 65.2 64.4 62.8 64.6 Diploma attainment rate1 73.6 73.9 72.6 72.8 72.6 Skill attainment rate1 82.0 82.9 81.2 86.8 81.0
1 Based on exiters from April 2013 to March 2014. 2 Based on exiters from April 2012 to March 2013. 3 Based on exiters from October 2012 to September 2013. 4 Based on exiters from January 2012 to December 2012. 5 Based on Basic literacy skills deficient out-of-school youth with participation years ending July 2013 to June 2014.

Youth
Social Policy Research Associates 289
Table IV-35 Outcomes of Youth Exiters, by Selected Characteristics
(Derived from PY 2013Q4 WIASRD Records)
All Exiters
Limited English-
Language (excludes
Puerto Rico) Single Parent
Pell Grant Recipient (among trainees, excludes
Puerto Rico Basic Skills
Deficient
Number of exiters1 102,971 2,066 9,364 821 59,570
Youth Common Measures
Placement in Employment or Education3
65.4 69.7 68.0 84.7 63.4
Employment 52.9 52.9 62.9 79.7 52.9 Education 12.4 16.8 5.1 5.0 10.5
Attainment of Degree or Certificate3
66.3 66.1 63.0 67.7 63.9
Secondary school diploma 36.4 42.5 14.0 1.3 32.3 GED or equivalency 11.7 6.1 17.0 2.3 12.4 Certificate or postsecondary degree
18.2 17.5 32.1 64.1 19.2
Literacy and Numeracy Gains (not based on exiters) 5
53.3 55.3 51.2 54.8 53.3
Outcomes for All Youth
Attending secondary school at exit1
15.4 13.9 6.8 0.0 14.4
Placement (quarter after exit)3 38.0 49.6 42.9 37.0 Retention (3rd quarter after exit)2 39.4 45.5 49.9 50.0 39.0
Not attending secondary school at exit1 84.6 86.1 93.2 100.0 85.6
Placement (quarter after exit)3 74.2 74.7 73.3 90.2 70.7 Postsecondary education 12.8 18.6 4.7 3.2 10.6 Advanced training 0.8 0.4 0.4 0.3 0.9 Apprenticeships 0.0 0.0 0.0 0.0 0.0 Military service 0.2 0.0 0.1 0.0 0.2 Employment 60.3 55.8 68.1 86.7 59.1
Retention (3rd quarter after exit)2
67.3 70.5 66.0 86.3 65.1
Postsecondary education 9.7 15.3 3.0 2.4 8.6 Advanced training 0.7 0.6 0.5 0.6 0.7 Apprenticeships 0.0 0.0 0.0 0.1 0.0 Military service 0.2 0.1 0.0 0.1 0.2 Employment 56.7 54.5 62.5 83.0 55.6

Youth
Social Policy Research Associates 290
All Exiters
Limited English-
Language (excludes
Puerto Rico) Single Parent
Pell Grant Recipient (among trainees, excludes
Puerto Rico Basic Skills
Deficient Other Outcomes
Nontraditional employment (quarter after exit)3
4.0 5.1 2.9 5.6 3.8
Males 6.0 5.3 6.7 10.1 5.7 Females 2.5 4.7 2.6 3.4 2.5
Earnings of employed in quarter after exit (average) 3
$2,703 $2,650 $2,977 $4,641 $2,598
$1 - $2,499 55.2 57.2 48.1 27.6 56.7 $2,500 - $4,999 32.1 30.5 36.3 37.3 31.9 $5,000 - $7,499 9.1 9.3 11.7 17.5 8.6 $7,500 or more 3.6 3.1 3.9 17.5 2.9
Earnings of employed in 3rd quarter after exit (average)2
$2,993 $3,126 $3,205 $5,301 $2,851
$1 - $2,499 50.5 47.4 44.6 25.6 52.3 $2,500 - $4,999 33.5 35.2 36.6 28.8 33.6 $5,000 - $7,499 11.0 12.5 13.7 21.4 10.1 $7,500 or more 4.9 4.9 5.2 24.3 4.0
Older Youth WIA Performance and 12-Month Outcomes
Entered employment (quarter after exit, excludes employed at entry)3
68.2 68.4 69.3 84.6 65.8
Retained employment 3rd quarter after exit2
82.6 82.6 82.1 92.1 80.8
Retained employment 4th quarter after exit4
77.4 80.3 79.2 88.0 76.6
Earnings change 2nd and 3rd quarters after exit2 $4,485 $5,009 $4,104 $7,608 $4,041 3rd and 4th quarters after exit4 $4,499 $5,150 $4,128 $7,627 $4,015
Credential rate3 39.3 40.7 39.8 63.7 34.9
Younger Youth WIA Performance Outcomes
Youth retention2 64.9 71.0 62.9 64.4 Diploma attainment rate1 73.6 76.2 58.6 69.7 Skill attainment rate1 82.0 81.7 77.8 82.4 1 Based on exiters from April 2013 to March 2014. 2 Based on exiters from April 2012 to March 2013. 3 Based on exiters from October 2012 to September 2013. 4 Based on exiters from January 2012 to December 2012. 5 Based on Basic literacy skills deficient out-of-school youth with participation years ending July 2013 to June 2014.

Youth
Social Policy Research Associates 291
Table IV-36 Outcomes of Youth Exiters, by Youth Activities
(Derived from PY 2013Q4 WIASRD Records)
Educational Achievement
Services
Work Experience/
Summer Employment
Adult Mentoring/
Career Guidance/ Counseling
Leadership Development Opportunities
Occupa-tional Skills
Training
Number of exiters1 52,155 39,635 33,348 25,061 18,110
Youth Common Measures
Placement in Employment or Education3
65.8 64.9 67.1 69.7 71.3
Employment 53.5 50.6 56.3 54.8 64.0 Education 12.2 14.4 10.8 14.9 7.3
Attainment of Degree or Certificate3
70.7 66.7 71.6 72.9 76.3
Secondary school diploma 39.1 42.7 36.6 45.4 21.3 GED or equivalency 14.1 9.0 14.7 13.7 9.9 Certificate or postsecondary degree
17.5 15.1 20.3 13.8 45.2
Literacy and Numeracy Gains (not based on exiters) 5
61.4 61.9 60.6 63.2 58.8
Outcomes for All Youth
Attending secondary school at exit1
13.9 19.3 11.5 12.2 6.0
Placement (quarter after exit)3 40.8 31.2 39.9 44.1 33.6 Retention (3rd quarter after exit)2 45.2 34.6 44.4 45.3 41.6
Not attending secondary school at exit1 86.1 80.7 88.5 87.8 94.0
Placement (quarter after exit)3
72.9 77.4 74.8 76.1 79.6
Postsecondary education 12.2 16.7 11.0 15.2 6.8 Advanced training 0.7 1.0 0.7 0.8 0.7 Apprenticeships 0.0 0.0 0.0 0.0 0.0 Military service 0.2 0.3 0.3 0.2 0.1 Employment 59.7 59.4 62.8 59.9 72.0
Retention (3rd quarter after exit)2
67.7 69.9 67.5 68.7 75.0
Postsecondary education 6.4 8.4 3.9 7.7 3.6 Advanced training 0.5 0.5 0.3 0.5 0.6 Apprenticeships 0.0 0.0 0.0 0.0 0.0 Military service 0.1 0.2 0.1 0.2 0.1 Employment 60.7 60.8 63.2 60.4 70.7
Youth
Social Policy Research Associates 292
Educational Achievement
Services
Work Experience/
Summer Employment
Adult Mentoring/
Career Guidance/ Counseling
Leadership Development Opportunities
Occupa-tional Skills
Training Other Outcomes
Nontraditional employment (quarter after exit)3
5.8 5.2 6.2 4.6 3.8
Males 8.4 7.5 9.1 6.3 6.5 Females 3.9 3.5 4.1 3.3 2.2
Earnings of employed in quarter after exit (average) 3
$2,638 $2,632 $2,735 $2,607 $3,303
$1 - $2,499 56.2 55.8 53.9 56.0 44.8 $2,500 - $4,999 32.2 32.3 33.2 32.7 35.1 $5,000 - $7,499 8.4 8.8 9.5 8.5 13.5 $7,500 or more 3.2 3.0 3.4 2.8 6.5
Earnings of employed in 3rd quarter after exit (average)2
$2,969 $2,881 $3,066 $2,995 $3,697
$1 - $2,499 49.3 51.0 47.6 48.5 40.3 $2,500 - $4,999 35.1 34.1 35.3 35.4 34.4 $5,000 - $7,499 11.1 10.7 12.1 11.8 15.9 $7,500 or more 4.4 4.1 4.9 4.3 9.3
Older Youth WIA Performance and 12-Month Outcomes
Entered employment (quarter after exit, excludes employed at entry)3
66.4 69.8 69.1 69.6 75.4
Retained employment 3rd quarter after exit2
82.0 84.1 83.9 83.1 86.3
Retained employment 4th quarter after exit4
77.5 77.2 79.1 77.7 81.1
Earnings change 2nd and 3rd quarters after exit2 $4,260 $4,570 $4,498 $4,422 $5,517 3rd and 4th quarters after exit4 $4,309 $4,528 $4,570 $4,422 $5,516
Credential rate3 41.9 39.7 40.8 42.7 60.4 Younger Youth WIA
Performance Outcomes
Youth retention2 67.4 67.3 64.9 67.1 74.7 Diploma attainment rate1 75.8 78.5 74.1 78.4 79.2 Skill attainment rate1 84.8 84.0 82.5 83.8 84.6
1 Based on exiters from April 2013 to March 2014. 2 Based on exiters from April 2012 to March 2013. 3 Based on exiters from October 2012 to September 2013. 4 Based on exiters from January 2012 to December 2012. 5 Based on Basic literacy skills deficient out-of-school youth with participation years ending July 2013 to June 2014.
Youth
Social Policy Research Associates 293
Table IV-37 Youth Common Measures, by Characteristics (Derived from PY 2013Q4 WIASRD Records)
Exiters from
October 2012 to September 2013
Basic Literacy Skills Deficient Out-of-School Youth with
Participation Years Ending July 2013 to June 2014
Number of
Exiters
Placed in Employment or Education
Attained Degree or Certificate
Literacy and Numeracy Gains (%)
Number of exiters 108,389 65.4 66.3 53.3 Statewide programs 4,102 63.7 69.2 51.4 Local programs 107,259 65.7 66.4 53.4
Age categories 14 to 15 5,788 42.9 45.4 45.6 16 to 17 39,415 63.7 71.3 55.5 18 24,568 68.0 69.3 54.3 19 to 21 38,618 69.7 61.7 52.3
Gender Female 58,324 66.6 67.5 53.1 Male 48,635 63.9 64.9 53.1
Individual with a disability 13,692 63.8 73.9 53.4 Race and ethnicity
Hispanic 30,930 61.5 60.1 59.4 Not Hispanic
American Indian or Alaskan Native
1,732 64.2 60.9 41.1
Asian 1,780 73.0 77.4 58.4 Black or African American
34,745 64.6 65.0 49.3
Hawaiian or other Pacific Islander
305 64.6 68.9 50.3
White 32,129 69.1 72.6 53.8 More than one race 2,377 68.3 67.2 50.4
Veteran (among age 19 to 21) 201 70.3 55.8 34.1 Employed at participation
Employed 8,400 72.9 55.8 Not employed or received layoff notice
99,989 65.4 65.7 53.0
Homeless or runaway youth 4,814 64.0 62.5 46.9
Offender 9,000 58.4 58.4 49.4
Pregnant or parenting youth 14,968 67.4 63.8 51.0
Basic literacy skills deficient 62,605 63.4 63.9 53.3
Ever in foster care 3,638 56.5 57.4 49.5

Youth
Social Policy Research Associates 294
Exiters from
October 2012 to September 2013
Basic Literacy Skills Deficient Out-of-School Youth with
Participation Years Ending July 2013 to June 2014
Number of
Exiters
Placed in Employment or Education
Attained Degree or Certificate
Literacy and Numeracy Gains (%)
Number of exiters 108,389 65.4 66.3 53.3 Youth who needs additional assistance
67,279 65.3 67.7 55.1
Average preprogram quarterly earnings (among age 19 to 21)
None 22,452 64.6 59.3 58.2 $1 to $1,499 8,314 74.4 62.1 55.7 $1,500 to $2,999 4,902 80.6 67.3 57.2 $3,000 to $4,499 2,280 84.5 69.3 58.4 $5,000 or more 670 89.7 63.1 58.2
Limited English-language (excludes Puerto Rico)
1,998 69.7 66.1 55.3
Single parent 10,027 68.0 63.0 51.2 UI Claimant 1,654 79.3 67.4 55.3
UI Claimant referred by WPRS 435 80.5 73.2 56.9 UI Exhaustee 266 72.2 63.3 56.0 Low income 102,995 65.2 66.1 53.3 Public assistance recipient 45,729 65.5 66.9 51.2
TANF recipient 6,519 63.7 63.7 50.5 Other public assistance, including SNAP and SSI
44,078 65.6 67.1 51.1
Highest grade completed
8th or less 6,474 44.6 50.8 54.1 Some high school 70,638 63.9 70.8 53.6 High school graduate 23,977 74.9 57.1 52.8 High school equivalency 2,799 70.9 56.3 46.6 Some postsecondary 4,404 78.7 49.1 56.2 College graduate (4-year) 15 85.7 66.7 33.3
Attending school at participation
53,905 63.4 68.5 45.2
High school or below 46,145 63.4 71.2 Alternative school 3,308 63.1 65.9 Postsecondary 4,452 41.8 45.2
Not Attending school at participation
54,456 67.3 62.8 53.6
High school dropout 27,777 60.1 65.1 53.7 High school graduate/equiv. 26,679 75.0 59.7 53.6

Youth
Social Policy Research Associates 295
Table IV-38 Youth Common Measures, by Services Received
(Derived from PY 2013Q4 WIASRD Records)
Exiters from
October 2012 to September 2013
Basic Literacy Skills Deficient Out-of-School
Youth with Participation Years Ending
July 2013 to June 2014
Number of
Exiters
Placed in Employment or
Education
Attained Degree or Certificate
Literacy and Numeracy Gains (%)
Number of exiters 108,389 65.4 66.3 53.3 Coenrollment
WIA adult 4,392 73.9 64.1 50.3 WIA dislocated worker 306 75.1 64.2 49.2 Partner program 49,323 67.1 65.9 50.1
Wagner-Peyser 45,711 67.3 66.4 49.4 TAA 1 100.0 0.0 National Farmworker Jobs
25 83.3 81.3 20.0
Veterans programs 8 100.0 66.7 33.3 Vocational Education 104 71.4 64.6 85.7 Adult Education 488 69.4 71.9 67.6 Other partner programs
5,844 64.1 57.9 53.6
Weeks participated 26 or fewer weeks 33,454 57.1 54.6 54.5 26 to 52 weeks 32,252 68.1 72.8 62.1 52 to 78 weeks 16,482 68.7 69.1 57.8 More than 78 weeks 26,201 70.5 69.6 38.7
Supportive services 50,681 64.6 68.0 63.5 Youth Activities (among with activities)1
Educational achievement 47,212 65.2 70.8 61.8 Alternative school 5,464 65.3 62.8 54.9
Summer employment 16,382 63.1 59.8 59.9
Work experience 32,552 67.2 71.9 62.8
Leadership development 25,572 69.7 72.9 63.2
Adult mentoring 8,300 69.5 74.7 66.9 Career guidance/ counseling
31,266 67.1 71.6 60.1
Basic skills training 11,092 70.5 69.9 60.1 Occupational skills training
20,339 71.3 76.3 58.8
1 Some states reported that many youth did not receive any youth activities.

Youth
Social Policy Research Associates 296
Exiters from
October 2012 to September 2013
Basic Literacy Skills Deficient Out-of-School
Youth with Participation Years Ending
July 2013 to June 2014
Number of
Exiters
Placed in Employment or
Education
Attained Degree or Certificate
Literacy and Numeracy Gains (%)
Enrolled in Education 86,855 65.6 66.3 59.1
Pell Grant recipient (among trainees, excludes Puerto Rico)
908 84.7 67.7 54.8

Youth
Social Policy Research Associates 297
Table IV-39 Youth Common Measures, by State
(Derived from PY 2013Q4 WIASRD Records)
Exiters from
October 2012 to September 2013
Basic Literacy Skills Deficient Out-of-School Youth with
Participation Years Ending July 2013 to June 2014
Number of
Exiters
Placed in Employment or Education
(%)
Attained Degree or Certificate
(%) Literacy and Numeracy
Gains (%)
Nation 108,389 65.4 66.3 53.3 Alabama 1,853 50.6 40.4 51.5 Alaska 198 58.2 72.8 48.8 Arizona 1,754 67.7 63.5 57.0 Arkansas 732 81.6 85.1 71.2 California 15,242 66.3 67.7 61.6 Colorado 1,359 66.5 72.4 52.0 Connecticut 470 78.0 87.6 59.6 Delaware 258 65.4 85.9 72.0 District of Columbia 179 35.4 24.6 47.7 Florida 6,318 61.2 81.8 56.2 Georgia 3,354 66.7 66.6 48.8 Hawaii 183 60.3 67.8 46.3 Idaho 587 81.8 73.5 33.9 Illinois 4,065 69.5 68.3 65.5 Indiana 3,019 69.5 66.5 44.9 Iowa 517 72.5 65.1 39.6 Kansas 671 74.9 75.9 55.3 Kentucky 2,086 73.0 67.0 50.6 Louisiana 902 67.9 69.8 57.3 Maine 405 66.2 71.0 31.3 Maryland 1,102 77.2 80.1 78.6 Massachusetts 1,562 77.4 70.7 43.2 Michigan 4,382 65.8 50.2 5.5 Minnesota 1,553 67.0 51.6 18.5 Mississippi 1,998 76.7 96.1 84.5 Missouri 2,592 68.4 71.3 58.6 Montana 197 48.8 60.1 28.6 Nebraska 286 83.0 78.0 64.1 Nevada 2,281 62.5 67.5 41.1 New Hampshire 204 62.8 70.5 69.2 New Jersey 2,407 66.6 73.5 64.7

Youth
Social Policy Research Associates 298
Exiters from
October 2012 to September 2013
Basic Literacy Skills Deficient Out-of-School Youth with
Participation Years Ending July 2013 to June 2014
Number of
Exiters
Placed in Employment or Education
(%)
Attained Degree or Certificate
(%) Literacy and Numeracy
Gains (%) New Mexico 742 56.0 46.3 27.8 New York 5,092 69.9 67.6 58.4 North Carolina 1,869 56.8 55.9 32.9 North Dakota 189 74.0 63.0 44.3 Ohio 2,963 70.3 64.9 51.6 Oklahoma 820 63.0 51.0 36.4 Oregon 1,248 70.5 71.4 40.8 Pennsylvania 4,785 63.0 84.1 64.8 Puerto Rico 9,066 44.1 31.6 Rhode Island 402 44.9 43.9 56.6 South Carolina 2,009 69.6 72.2 59.8 South Dakota 260 69.7 48.9 36.1 Tennessee 3,186 80.9 76.5 62.8 Texas 5,976 71.3 65.4 62.1 Utah 1,156 64.7 43.3 31.2 Vermont 351 26.4 22.5 Virgin Islands 117 28.7 53.3 25.0 Virginia 1,514 64.2 75.9 60.9 Washington 2,141 67.3 75.7 52.6 West Virginia 376 67.4 71.6 71.8 Wisconsin 1,087 76.5 83.0 37.7 Wyoming 324 75.6 77.6 44.4

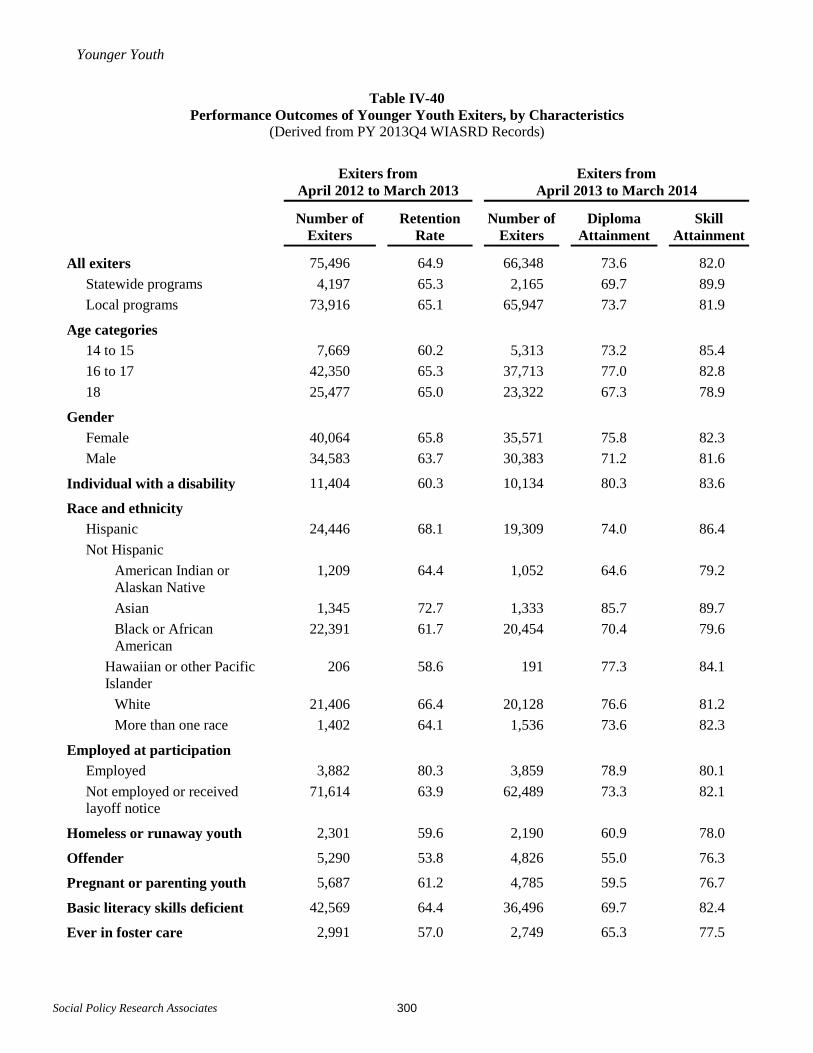
Younger Youth
Social Policy Research Associates 300
Table IV-40 Performance Outcomes of Younger Youth Exiters, by Characteristics
(Derived from PY 2013Q4 WIASRD Records)
Exiters from
April 2012 to March 2013 Exiters from
April 2013 to March 2014
Number of
Exiters Retention
Rate Number of
Exiters Diploma
Attainment Skill
Attainment
All exiters 75,496 64.9 66,348 73.6 82.0 Statewide programs 4,197 65.3 2,165 69.7 89.9 Local programs 73,916 65.1 65,947 73.7 81.9
Age categories
14 to 15 7,669 60.2 5,313 73.2 85.4 16 to 17 42,350 65.3 37,713 77.0 82.8 18 25,477 65.0 23,322 67.3 78.9
Gender
Female 40,064 65.8 35,571 75.8 82.3 Male 34,583 63.7 30,383 71.2 81.6
Individual with a disability 11,404 60.3 10,134 80.3 83.6
Race and ethnicity Hispanic 24,446 68.1 19,309 74.0 86.4 Not Hispanic American Indian or Alaskan Native
1,209 64.4 1,052 64.6 79.2
Asian 1,345 72.7 1,333 85.7 89.7 Black or African American
22,391 61.7 20,454 70.4 79.6
Hawaiian or other Pacific Islander
206 58.6 191 77.3 84.1
White 21,406 66.4 20,128 76.6 81.2 More than one race 1,402 64.1 1,536 73.6 82.3
Employed at participation Employed 3,882 80.3 3,859 78.9 80.1 Not employed or received layoff notice
71,614 63.9 62,489 73.3 82.1
Homeless or runaway youth 2,301 59.6 2,190 60.9 78.0
Offender 5,290 53.8 4,826 55.0 76.3
Pregnant or parenting youth 5,687 61.2 4,785 59.5 76.7
Basic literacy skills deficient 42,569 64.4 36,496 69.7 82.4
Ever in foster care 2,991 57.0 2,749 65.3 77.5

Younger Youth
Social Policy Research Associates 301
Exiters from
April 2012 to March 2013 Exiters from
April 2013 to March 2014
Number of
Exiters Retention
Rate Number of
Exiters Diploma
Attainment Skill
Attainment
All exiters 75,496 64.9 66,348 73.6 82
Youth who needs additional assistance
47,222 63.4 42,672 74.2 80.8
Limited English-language (excludes Puerto Rico)
1,400 71.0 1,336 76.2 81.7
Single parent 3,530 62.9 3,091 58.6 77.8 UI Claimant 378 67.8 274 59.4 67.1 UI Claimant referred by WPRS 88 65.7 65 61.4 64.4 UI Exhaustee 109 68.6 91 72.3 76.7
Low income 72,471 65.2 62,651 73.9 82.9
Public assistance recipient 30,063 64.4 27,301 72.6 81.2 TANF recipient 4,680 62.8 3,664 72.8 86.8 Other public assistance, including SNAP and SSI
28,895 64.6 26,394 72.6 81.0
Highest grade completed 8th or less 6,862 53.3 5,072 59.8 82.4 Some high school 59,257 64.5 52,794 74.7 82.1 High school graduate 7,867 72.3 6,976 80.6 High school equivalency 858 65.1 804 72.1 Some postsecondary 586 75.0 613 90.5 College graduate (4-year) 3 0.0 1 100.0
Attending school at participation
52,471 68.0 44,970 82.7 82.8
High school or below 48,413 68.0 41,387 83.3 83.0 Alternative school 2,783 60.3 2,551 72.3 80.0 Postsecondary 1,275 79.9 1,032 80.9
Not Attending school at participation
23,006 59.5 21,369 51.7 79.5
High school dropout 14,974 53.4 14,009 51.7 78.8 High school graduate/equiv. 8,032 70.5 7,360 81.0

Younger Youth
Social Policy Research Associates 302
Table IV-41 Performance Outcomes of Younger Youth Exiters, by Services Received
(Derived from PY 2013Q4 WIASRD Records)
Exiters from
April 2012 to March 2013 Exiters from
April 2013 to March 2014
Number of
Exiters Retention
Rate Number of
Exiters Diploma
Attainment Skill
Attainment
Number of exiters 75,496 64.9 66,348 73.6 82.0
Coenrollment
WIA adult 1,480 66.5 1,369 71.7 82.6 WIA dislocated worker 100 60.0 62 73.8 92.0 Partner program 30,612 67.7 28,363 72.2 82.4
Wagner-Peyser 28,187 67.6 26,107 72.9 82.3 TAA 3 66.7 3 100.0 40.0 National Farmworker Jobs 13 81.8 9 100.0 90.0 Veterans programs 2 50.0 0 Vocational Education 73 65.7 55 88.2 69.2 Adult Education 284 75.8 304 59.3 63.2 Other partner programs 3,304 65.4 3,351 55.4 83.9
Weeks participated
Under 26 weeks 22,723 62.8 18,466 64.5 80.5 26 to 52 weeks 20,465 66.4 19,494 76.4 82.4 52 to 78 weeks 11,147 64.6 10,554 74.2 78.2 More than 78 weeks 21,161 65.2 17,834 76.3 83.8
Supportive services 35,439 66.5 29,895 74.6 86.8
Youth Activities (among with activities)1
Educational achievement services 19,434 67.9 31,393 76.6 85.2 Alternative school 2,619 59.7 3,596 63.9 85.0 Summer employment 10,337 68.9 11,706 80.5 86.2 Work experience 14,107 66.7 20,436 78.5 82.4 Leadership development 11,158 67.1 17,292 78.4 83.8 Adult mentoring 3,399 64.9 5,975 74.5 80.3 Career guidance/counseling 12,495 65.3 18,773 73.8 83.0 Basic skills training 4,691 69.4 7,357 76.2 80.9 Occupational skills training 7,045 74.7 8,386 79.2 84.6
Enrolled in Education 66,222 66.1 58,197 77.4 82.5
1 Some states reported that many youth did not receive any youth activities.

Younger Youth
Social Policy Research Associates 303
Table IV-42 Performance Outcomes of Younger Youth Exiters, by State
(Derived from PY 2013Q4 WIASRD Records)
Exiters from
April 2012 to March 2013 Exiters from
April 2013 to March 2014
Number of
Exiters Retention
Rate Number of
Exiters Diploma
Attainment Skill
Attainment
Nation 75,496 64.9 66,348 73.6 82.0 Alabama 597 53.4 1,038 44.9 65.4 Alaska 164 54.5 88 27.9 77.7 Arizona 1,132 65.5 869 68.9 85.0 Arkansas 601 84.5 578 90.8 86.7 California 10,500 68.9 8,534 77.6 97.9 Colorado 789 57.1 767 73.7 Connecticut 289 76.5 264 74.3 Delaware 195 66.3 168 66.1 75.6 District of Columbia 112 27.5 85 9.8 0.0 Florida 3,883 69.9 3,038 75.1 84.5 Georgia 2,206 65.9 2,165 77.7 75.2 Hawaii 142 57.0 125 94.3 94.7 Idaho 363 84.0 413 72.6 Illinois 3,084 53.9 1,819 75.3 Indiana 1,940 74.1 2,006 81.0 65.1 Iowa 324 73.9 304 71.2 59.4 Kansas 367 70.6 407 68.8 61.4 Kentucky 1,406 55.5 1,323 77.4 24.6 Louisiana 562 67.4 422 55.4 63.2 Maine 251 68.1 211 66.9 83.0 Maryland 706 63.6 697 79.0 78.8 Massachusetts 1,081 72.7 1,016 68.1 Michigan 3,590 88.6 3,319 91.5 95.4 Minnesota 1,399 91.5 1,123 88.4 90.4 Mississippi 1,575 73.8 1,368 75.7 91.4 Missouri 1,555 58.7 1,261 61.9 Montana 129 52.9 157 80.4 Nebraska 96 85.4 115 90.2 70.2 Nevada 769 9.2 1,844 58.3 33.5 New Hampshire 156 73.0 141 86.7 82.6 New Jersey 2,039 17.0 1,801 75.5 88.6 New Mexico 639 60.4 456 53.9 75.9 New York 3,111 64.4 2,684 63.5 77.2 North Carolina 1,396 63.7 1,555 58.3 56.2

Younger Youth
Social Policy Research Associates 304
Exiters from
April 2012 to March 2013 Exiters from
April 2013 to March 2014
Number of
Exiters Retention
Rate Number of
Exiters Diploma
Attainment Skill
Attainment North Dakota 152 73.3 98 82.1 100.0 Ohio 2,569 65.6 1,889 75.2 82.3 Oklahoma 416 67.2 482 50.2 11.7 Oregon 980 51.5 933 70.7 Pennsylvania 3,111 53.6 3,355 66.1 Puerto Rico 9,450 73.1 5,932 79.8 87.9 Rhode Island 244 65.6 315 70.4 95.3 South Carolina 1,003 65.2 1,030 72.4 73.2 South Dakota 98 74.2 114 52.1 Tennessee 2,233 78.0 2,167 85.9 89.9 Texas 3,495 2,997 88.3 Utah 688 66.0 762 51.3 Vermont 289 48.5 240 42.9 73.8 Virgin Islands 66 47.6 52 24.0 23.4 Virginia 979 63.8 1,038 90.3 65.1 Washington 1,279 60.4 1,491 70.7 76.3 West Virginia 339 49.7 287 71.6 71.1 Wisconsin 750 73.5 759 84.6 79.8 Wyoming 207 72.5 246 84.5 78.2

Older Youth
Social Policy Research Associates 305
Table IV-43 Performance Outcomes of Older Youth Exiters, by Characteristics
((Derived from PY 2013Q4 WIASRD Records)
Exiters from
October 2012 to September 2013 Exiters from
April 2012 to March 2013
Number of
Exiters
Entered Employment
Rate (%) Credential Rate (%)
Number of
Exiters
Employment Retention Rate (%)
Earnings Change
($) Number of exiters 38,618 68.2 39.3 40,679 82.6 4,485
Statewide programs 1,066 67.2 51.3 1,304 82.4 4,834 Local programs 38,536 68.2 39.3 40,509 82.6 4,480
Age categories 19 to 21 38,618 68.2 39.3 40,679 82.6 4,485
Gender Female 20,955 68.3 41.2 22,102 83.2 4,379 Male 16,732 68.1 37.5 17,416 81.8 4,625
Individual with a disability 3,289 62.1 38.3 3,472 81.3 4,341 Race and ethnicity
Hispanic 10,073 68.1 40.5 10,853 84.1 4,456 Not Hispanic
American Indian or Alaskan Native
603 68.0 39.6 665 83.9 4,503
Asian 500 66.2 43.9 510 85.6 5,230 Black or African American 13,385 66.2 34.0 13,912 80.8 3,985 Hawaiian or other Pacific Islander
98 65.4 43.3 104 80.6 5,527
White 11,330 70.7 44.9 11,855 83.8 5,090 More than one race 890 70.0 39.3 873 80.6 3,978
Veteran (among age 19 to 21) 114 79.5 46.4 145 87.7 4,251 Employed at participation
Employed 4,518 57.0 4,637 90.1 5,035 Not employed or received layoff notice
34,100 68.2 36.9 36,042 81.2 4,376
Homeless or runaway youth 2,512 63.7 31.6 2,445 78.6 3,832
Offender 3,959 63.4 32.8 4,192 78.8 4,015
Pregnant or parenting youth 9,838 68.3 39.8 10,576 81.9 4,100
Basic literacy skills deficient 23,889 65.8 34.9 24,664 80.8 4,041
Ever in foster care 741 63.3 32.7 770 77.6 3,904

Older Youth
Social Policy Research Associates 306
Exiters from
October 2012 to September 2013 Exiters from
April 2012 to March 2013
Number of
Exiters
Entered Employment
Rate (%) Credential Rate (%)
Number of
Exiters
Employment Retention Rate (%)
Earnings Change
($) Number of exiters 38,618 68.2 39.3 40,679 82.6 4,485 Youth who needs additional assistance
22,479 68.0 39.8 23,515 83.1 4,628
Average preprogram quarterly earnings (among age 19 to 21)
None 22,452 62.2 35.6 24,360 79.3 5,534 $1 to $1,499 8,314 73.6 39.8 8,520 82.8 4,557 $1,500 to $2,999 4,902 80.4 48.4 4,897 87.8 3,406 $3,000 to $4,499 2,280 84.6 51.7 2,259 91.0 1,738 $5,000 or more 670 89.0 47.2 643 90.0 -893
Limited English-language (excludes Puerto Rico)
700 68.4 40.7 701 82.6 5,009
Single parent 6,808 69.3 39.8 7,310 82.1 4,104
UI Claimant 1,328 81.0 44.9 1,420 86.1 3,300
UI Claimant referred by WPRS 346 80.9 41.0 373 85.0 2,818 UI Exhaustee 167 76.6 44.8 180 92.1 5,633 Low income 36,898 68.1 39.4 39,224 82.5 4,494 Public assistance recipient 17,053 66.9 36.7 17,841 81.0 4,153
TANF recipient 2,521 65.6 34.9 2,821 79.5 4,200 Other public assistance, including SNAP and SSI
16,398 66.9 36.9 17,152 81.0 4,148
Highest grade completed
8th or less 957 52.0 32.6 1,098 73.2 3,411 Some high school 15,462 60.9 40.9 16,231 77.1 3,585 High school graduate 16,441 73.7 37.1 17,073 86.2 4,786 High school equivalency 1,972 71.9 34.3 2,119 79.3 4,435 Some postsecondary 3,745 79.8 46.6 4,104 87.9 6,185 College graduate (4-year) 14 77.8 57.1 16 90.0 11,597
Attending school at participation
6,405 68.6 50.5 7,025 87.0 5,665
High school or below 2,321 60.1 52.7 2,465 81.2 4,309 Alternative school 743 64.5 49.3 791 78.2 3,975 Postsecondary 3,341 77.6 49.2 3,769 91.7 6,645
Not Attending school at participation
32,197 68.1 37.1 33,642 81.7 4,254
High school dropout 13,415 60.2 37.7 14,125 76.1 3,431 High school graduate/equiv. 18,782 74.1 36.6 19,517 84.9 4,718

Younger Youth
Social Policy Research Associates 307
Table IV-44 Performance Outcomes of Older Youth, by Services Received
(Derived from PY 2013Q4 WIASRD Records)
Exiters from
October 2012 to September 2013 Exiters from
April 2012 to March 2013
Number of
Exiters
Entered Employ-
ment Rate (%)
Credential Rate (%)
Number of Exiters
Employment Retention Rate (%)
Earnings Change
($) Number of exiters 38,618 68.2 39.3 40,679 82.6 4,485 Coenrollment
WIA adult 2,882 73.3 42.2 2,802 84.0 4,958 WIA dislocated worker 225 74.9 34.6 270 79.6 2,779 Partner program 19,919 69.4 41.5 21,506 83.5 4,419
Wagner-Peyser 18,543 70.0 41.3 20,066 83.6 4,430 TAA 1 100.0 100.0 3 100.0 3,501 National Farmworker Jobs
15 91.7 64.3 13 83.3 9,480
Veterans programs 6 100.0 20.0 7 80.0 2,257 Vocational Education 38 77.8 40.5 49 88.9 5,540 Adult Education 211 62.0 46.3 254 75.4 3,300 Other partner programs
2,610 64.7 39.0 2,635 83.5 4,660
Weeks participated (average) 26 or fewer weeks 13,660 68.4 38.2 14,607 83.1 3,725 26 to 52 weeks 11,786 68.2 40.3 11,657 80.9 4,202 52 to 78 weeks 5,922 68.0 38.6 6,187 81.0 4,518 More than 78 weeks 7,250 68.0 40.4 8,228 85.1 5,991
Supportive services 18,641 69.1 43.8 20,016 82.4 4,515 Youth Activities (among with activities)1
Educational achievement 14,609 65.9 41.1 9,265 81.3 4,210 Alternative school 1,736 64.8 49.2 1,245 83.1 3,796 Summer employment 3,775 65.9 38.9 2,945 84.5 4,462 Work experience 10,252 71.3 39.9 7,717 83.6 4,557 Leadership development 7,935 69.6 42.7 5,614 83.1 4,422 Adult mentoring 2,389 68.4 41.5 1,626 82.7 4,514 Career guidance/ counseling
11,384 69.0 40.5 7,766 83.9 4,458
Basic skills training 3,331 69.6 44.6 2,458 83.1 4,765 Occupational skills training
10,475 75.4 60.4 7,707 86.3 5,517
Enrolled in Education 25,765 68.8 50.9 27,187 82.7 4,711 Pell Grant recipient (among trainees, excludes Puerto Rico)
908 84.6 63.7 1,050 92.1 7,608
1 Some states reported that many youth did not receive any youth activities.

Older Youth
Social Policy Research Associates 308
Table IV-45 Performance Outcomes of Older Youth Exiters, by State
(Derived from PY 2013Q4 WIASRD Records)
Exiters from
October 2012 to September 2013 Exiters from
April 2012 to March 2013
Number
of Exiters
Entered Employment
Rate (%) Credential Rate (%)
Number of Exiters
Employment Retention Rate (%)
Earnings Change
($)
Nation 38,618 68.2 39.3 40,679 82.6 4,485 Alabama 926 57.2 32.4 764 87.5 5,842 Alaska 86 68.2 32.9 122 83.1 6,096 Arizona 646 72.3 44.2 665 84.7 5,110 Arkansas 148 82.4 56.4 138 88.8 5,475 California 6,294 66.3 31.7 6,312 80.6 4,604 Colorado 609 68.7 43.0 561 79.0 4,201 Connecticut 209 72.3 62.6 215 88.9 3,511 Delaware 51 53.7 49.0 45 73.3 3,226 District of Columbia 91 38.2 10.0 151 60.0 2,981 Florida 2,303 72.2 47.6 2,325 83.9 4,589 Georgia 1,113 62.6 36.8 986 84.1 4,914 Hawaii 34 76.9 61.8 34 88.0 4,645 Idaho 206 82.3 55.3 228 93.5 6,081 Illinois 1,741 69.0 35.2 2,126 80.8 4,043 Indiana 987 66.7 30.8 941 84.7 3,853 Iowa 246 73.2 52.0 257 87.0 5,313 Kansas 284 77.3 51.1 262 81.8 4,003 Kentucky 682 73.0 30.5 746 82.0 4,611 Louisiana 460 69.3 41.9 597 86.8 5,064 Maine 184 79.1 48.6 154 82.7 4,553 Maryland 365 78.9 57.1 331 80.1 4,301 Massachusetts 475 76.0 51.5 499 86.2 4,634 Michigan 1,002 87.7 80.8 1,193 93.5 5,369 Minnesota 414 83.0 58.3 453 91.2 5,786 Mississippi 669 74.5 27.3 915 86.2 4,038 Missouri 1,067 68.3 36.0 1,079 77.1 4,002 Montana 55 50.0 16.7 45 81.8 4,586 Nebraska 178 82.0 51.2 170 88.1 5,123 Nevada 531 57.1 20.3 253 79.6 3,975 New Hampshire 39 60.0 47.1 53 82.8 4,505 New Jersey 547 69.6 37.4 671 74.8 3,890 New Mexico 205 62.1 20.1 233 76.9 3,099

Younger Youth
Social Policy Research Associates 309
Exiters from
October 2012 to September 2013 Exiters from
April 2012 to March 2013
Number
of Exiters
Entered Employment
Rate (%) Credential Rate (%)
Number of Exiters
Employment Retention Rate (%)
Earnings Change
($) New York 2,154 67.1 42.9 2,255 77.0 3,707 North Carolina 751 62.0 24.0 957 79.8 4,779 North Dakota 75 75.0 38.0 73 89.8 4,273 Ohio 962 71.5 42.0 1,262 79.7 8,322 Oklahoma 370 67.5 30.9 356 81.5 3,871 Oregon 371 68.2 36.2 395 70.9 3,304 Pennsylvania 1,681 56.8 40.0 1,565 77.4 3,429 Puerto Rico 2,165 53.5 43.1 2,852 92.2 3,455 Rhode Island 116 75.0 48.2 133 85.5 4,174 South Carolina 980 67.4 40.5 1,048 81.8 3,770 South Dakota 143 73.6 32.2 135 90.4 4,931 Tennessee 960 82.6 54.4 850 87.9 7,113 Texas 2,732 73.0 32.7 2,931 81.6 4,315 Utah 412 71.6 50.1 411 86.8 3,475 Vermont 59 42.3 33.3 91 82.8 3,125 Virgin Islands 60 32.7 1.8 50 72.7 2,156 Virginia 491 67.8 40.5 530 81.7 3,764 Washington 765 67.6 45.8 727 80.6 4,512 West Virginia 124 63.8 34.8 173 70.5 4,039 Wisconsin 326 73.3 35.1 295 90.8 4,659 Wyoming 74 71.2 36.9 66 84.8 4,155


Social Policy Research Associates 311
Appendix A Notes to Tables


Appendix A: Notes to Tables
Social Policy Research Associates 313
Part I: Summary Comparisons Across Programs Table I-1
This table shows trends in the number of exiters by program of participation. Subcategories do not sum to totals because individuals may be included in more than one subcategory. For example, a person may be coenrolled in both a local program and a statewide program.
Table I-2 This table shows the number of exiters by state and program of participation. Both statewide and local programs are included. NEG programs are included in the dislocated worker and total columns.
Table I-3 This table shows the number of exiters with selected characteristics by program of participation. Both statewide and local programs are included. NEG programs are included in the dislocated worker and total columns.
Table I-4 to Table I-7
These tables show trends over time in the number of exiters by state. Table I-4 shows trends in the number of exiters for adults. Table I-5 shows dislocated workers who participated in state and local (formula-funded) programs. Table I-6 shows dislocated workers who participated in National Emergency Grant (NEG) projects. Table I-7 shows youth. A significant portion of the increase in the number of adult exiters over time is due to changes in coenrollment practices between WIA and Wagner-Peyser. For example , the number of adult exiters in Missouri increased from 4,031 in PY 2009 to 197,029 in PY 2010, probably because of increased coenrollment with Wagner-Peyser.
Part II: Adult Exiters
Tables in Part II include all exiters from adult programs, including both local and statewide programs.
Table II-1 to Table II-13
These tables show the characteristics of adult exiters. Most numbers shown are the percentages within the column heading. Exceptions include the number of exiters shown in the first three rows, which are counts, and preprogram earnings and average highest grade completed, for which both averages and percentages within categories are shown. In calculating percentages, individuals with missing data on either the row or column heading are excluded. Values of zero are excluded when calculating average preprogram earnings Some characteristics, those shown under “Characteristics of Exiters who Received Intensive or Training Services,” are available only for individuals who received intensive or training services. Percentages for these characteristics are calculated within this smaller universe, again excluding missing data.
Table II-1 to Table II-2
These tables show trends over time in the characteristics of exiters. Table II-2 shows counts of exiters with particular characteristics. These counts exclude missing data and cannot be used to compute the percentages in Table II-1. Also, the counts for the characteristics under the heading “Characteristics of Exiters who Received Training or Intensive Services” do not include individuals who received only core services and, thus, are an underestimate of the total number of persons with the characteristic who were served by WIA. See the notes to Tables I-4 to I-7 for discussion of some of the significant changes in the number of exiters.
Table II-8 to Table II-10
These tables are based only on individuals who received intensive or training services because this is the universe for which the column headings are available. Some of these tables include a column labeled “With Intensive or Training Services,” which represents all individuals for whom data on the column headings is collected and is the appropriate comparison for the other columns (rather than the data in other tables for all exiters).
Table II-11 This table shows the characteristics of individuals by major service categories. The column headings “Core Services Only,” “Core and Intensive Services Only,” and “Training” are mutually exclusive and exhaustive. An individual is included in one and only one of these columns.

Appendix A: Notes to Tables
Social Policy Research Associates 314
Table II-12 This table shows the number of individuals with specified characteristics by major service categories. Missing data are excluded from these counts. Therefore, they cannot be used to calculate the percentages shown in Table II-11, which exclude missing data from the denominator of percentages. The number of exiters shown for characteristics that are available only for individuals who received intensive or training services is a substantial undercount of the total number with these characteristics because individuals who receive only core services are not counted. The column headings “Core Services Only,” “Core and Intensive Services Only,” and “Training” are mutually exclusive and exhaustive. An individual is included in one and only one of these columns.
Table II-14 to Table II-23
These tables show the services received by exiters. Most numbers shown are the percentages within the column heading. Exceptions include the number of exiters shown in the first row, which is a count, and weeks participated, for which both the average and percentages within categories are shown. In calculating percentages, individuals with missing data on either the row or column heading are excluded. The row headings “Core services, including staff-assisted, only,” “Intensive & core services only,” and “Training services” are mutually exclusive and exhaustive. An individual is included in one and only one of these rows. The percentages shown for the types of training are calculated among those who received training. There is no clear distinction between skill upgrading and other occupational skills training.
Table II-14 to Table II-15
These table show trends over time in the services received by exiters. For exiters before January 1, 2012 (PY09, PY10, and the first six-months of PY11), apprenticeship, remedial, and prerequisite training are included in “Other occupational skills training.”

Appendix A: Notes to Tables
Social Policy Research Associates 315
Table II-21 to
Table II-23
These tables are based only on individuals who received intensive or training services because this is the universe for which the column headings are available. Some of these tables include a column labeled “With Intensive or Training Services,” which represents all individuals for whom data on the column headings is collected and is the appropriate comparison for the other columns (rather than the data in other tables for all exiters). Because these tables show services for a universe that is limited to individuals who receive intensive or training services, they should be interpreted with caution. For example, Table II-22 indicates the percentage of low-income individuals who receive training. However, because low-income individuals who receive only core services are excluded, the true percentage receiving training may be considerably less.
Table II-24 This table shows the number of adult exiters who received training by the type of training and the occupation of training. Both the 20 most common occupations and the ten most common healthcare occupations are shown. Data is not shown for individuals who received entrepreneurial training or ABE or ESL in combination with training, although they are included in the “Any Training” column. The occupation of training is frequently missing so the actual number receiving training in these occupations is likely larger.
Table II-25 This table shows services provided by state. The column for number of exiters shows the count of exiters in the state. The remaining columns show the percentage within the state that received the service identified by the column heading. These values can be compared with the national values in the first row. Thus, unlike most other tables, this table presents row percentages, not column percentages. The distribution among the service categories within a state may be strongly affected by policies and practices regarding payment for services by WIA and Wagner-Peyser and coenrollment between the two programs. For example, Delaware shows that a high percentage of exiters received training, possibly because Wagner-Peyser funds were used for core and intensive services. Conversely, New York shows that a high percentage of exiters received only core services, possibly because of extensive coenrollment with Wagner-Peyser.
Table II-26 This table shows the number of adult exiters who received training by the type of training and state.
Table II-27 to Table II-38
These tables calculate each outcome for the most recent year’s worth of exiters for whom the outcome data is available, with the exception of Tables II-27 and II-28, which show time trends. Individuals who were reported as institutionalized or deceased at exit, those who had medical conditions that precluded continued participation in WIA or entry into employment or continued participation in the program, those providing care to a family member with a health/medical condition that precludes entry into employment or continued participation in the program, returning Reservists who choose not to continue WIA services, and individuals who did not provide a valid Social Security number are excluded from the calculations. However, they are included in the number of exiters shown. All outcomes are calculated within the group defined by the column heading:
• The first group of outcomes shown contains the Common Measures, including entered employment rate, retention in the 2nd and 3rd quarters after exit, and average earnings in the 2nd and 3rd quarters after exit.
• The second group of outcomes contains the other WIA performance measures and comparable 12-month outcomes. These have been calculated following the official definitions. See Appendix B for summary definitions.
• The third group of outcomes includes information about the job held in the quarter after exit. This information is reported for all individuals employed in the quarter after exit, whether or not they were employed at participation.
• Other outcome information includes detail on some of the data used in the computation of the common and WIA performance measures.

Appendix A: Notes to Tables
Social Policy Research Associates 316
Most numbers shown are the percentages within the column heading. Exceptions include the number of exiters, earnings change, and average earnings. The distributions of earnings in the quarter after exit and earnings in the 3rd quarter after exit include only individuals with earnings in the quarter. Thus, the percentages shown sum to 100%. In calculating percentages and averages, individuals with missing data on either the row or column heading are excluded.
Table II-27 to II-28
These tables show trends over time in the outcomes of WIA exiters. Data for exiters from April 2012 to March 2013 are complete except for the data on outcomes in the 4th quarter after exit. Data on outcomes in the 4th quarter after exit are for exiters from April 2012 to December 2012. Data for exiters from October 2012 to September 2013 do not include data on outcomes for the 4th quarter after exit. Data on outcomes in the 2nd quarter after exit are for exiters from October 2012 to June 2013. Data on outcomes in the 3rd quarter after exit are for exiters from October 2012 to March 2013. Data for earlier periods are complete, except for a few states. See the notes to Tables II-25 to II-36 for additional information. Table II-27 shows the calculated outcomes, while Table II-28 shows the number of exiters attaining positive outcomes. The calculated outcomes in Table II-27 generally cannot be computed from the data in Table II-28 due to exclusions from outcome measurement.
Table II-39 This table shows the WIA performance measures calculated within detailed groups based on the characteristics of exiters from two different cohorts of exiters. The entered employment rate and employment and credential rate performance measures are given for exiters from October 2012 to September 2013, whereas the employment retention and average earnings performance measures are given for exiters from April 2012 to March 2013. Using two cohorts ensures that each performance measure is calculated for the most recent year’s worth of exiters available. The column titled “Number of Exiters” contains the number of exiters in the group defined by the row heading. The remaining columns show the four performance measures calculated within the group of exiters defined by the row heading. All of the performance measures, except average earnings, are percentages. Outcomes for characteristics listed under “Characteristics of Exiters who Received Intensive or Training Services” include only individuals who received intensive or training services because information on the row heading is not collected for individuals who receive only core services. See Appendix B for summary definitions of the performance measures.
Table II-40 This table shows the WIA performance measures calculated within detailed groups based on the services received by exiters from two different cohorts of exiters. The entered employment rate and employment and credential rate performance measures are given for exiters from October 2012 to September 2013, whereas the employment retention and average earnings performance measures are given for exiters from April 2012 to March 2013. Using two cohorts ensures that each performance measure is calculated for the most recent year’s worth of exiters available. The column titled “Number of Exiters” contains the number of exiters in the group defined by the row heading. The remaining columns show the four performance measures calculated within the group of exiters defined by the row heading. All of the performance measures, except average earnings, are percentages. See the Appendix B for summary definitions of the performance measures.
Table II-41 This table shows the WIA performance measures calculated within detailed groups based on the occupation of training for exiters. Both the 20 most common occupations and the 10 most common healthcare occupations are shown. The occupations listed are based on the most common occupations among adults who started training between July 2013 and June 2014. Data are shown for two different cohorts of exiters: one cohort for the entered employment rate and employment and credential rate performance measures and another cohort for the

Appendix A: Notes to Tables
Social Policy Research Associates 317
employment retention and average earnings performance measures. Using two cohorts ensures that each performance measure is calculated for the most recent year’s worth of exiters available. The column titled “Number of Exiters” contains the number of exiters in the group defined by the row heading. The remaining columns show the four performance measures calculated within the group of exiters defined by the row heading. All of the performance measures, except average earnings, are percentages.
Table II-42 This table shows the WIA performance measures calculated within each state for exiters from two different cohorts of exiters. The entered employment rate and employment and credential rate performance measures are given for exiters from October 2012 to September 2013, whereas the employment retention and average earnings performance measures are given for exiters from April 2012 to March 2013. Using two cohorts ensures that each performance measure is calculated for the most recent year’s worth of exiters available. The columns titled “Number of Exiters” contain the number of exiters in the state identified by the row heading. The remaining columns show the four performance measures calculated within the state. All of the performance measures, except average earnings, are percentages. These performance measures are calculated using WIASRD data and may differ, sometimes substantially, from the performance reported by the state in its PY 2013 Annual Report. See Appendix B for the summary definitions of the performance measures.
Part III: Dislocated Worker Exiters Tables in Part III contain information on all dislocated worker exiters, including exiters from
local and statewide programs and National Emergency Grant (NEG) projects, except that Table III-45 excludes exiters served only by NEG projects. Individuals served only by rapid response are excluded from WIASRD reporting and are not included in the tables. However, individuals served by rapid response—additional assistance funds are included.
Table III-1 to Table III-14
These tables show the characteristics of exiters. Most numbers shown are the percentages within the column heading. Exceptions include the number of exiters shown in the first three rows, which are counts, and preprogram earnings and average highest grade completed, for which both averages and percentages within categories are shown. In calculating percentages, individuals with missing data on either the row or column heading are excluded. Values of zero are excluded when calculating average preprogram quarterly earnings. The characteristics shown under “Characteristics of Exiters who Received Intensive or Training Services” are available only for individuals who received intensive or training services. Percentages for these characteristics are calculated within this smaller universe, again excluding missing data. See the notes for Tables I-4 to I-7 for a discussion of trends over time in the number of exiters.
Table III-1 to Table III-2
These tables show trends over time in the characteristics of exiters. Table III-2 shows counts of exiters with particular characteristics. These counts exclude missing data and cannot be used to compute the percentages in Table III-1. Also, the counts for the “Characteristics of Exiters who Received Training or Intensive Services” do not include individuals who received only core services and, thus, are an underestimate of the total number of persons with the characteristic who were served by WIA.
Table III-10 to Table III-11
These tables are based only on individuals who received intensive or training services because this is the universe for which the column headings are available. Some of these tables include a column labeled “With Intensive or Training Services,” which represents all individuals for whom data on the column headings is collected and is the appropriate comparison for the other columns (rather than the data in other tables for all exiters).
Table III-12 This table shows the characteristics of individuals by major service categories. The column headings “Core Services Only,” “Core and Intensive Services Only,” and “Training” are mutually exclusive and exhaustive. An individual is included in one and only one of these

Appendix A: Notes to Tables
Social Policy Research Associates 318
columns. Table III-13 This table shows the number of individuals with specified characteristics by major service
categories. Missing data are excluded from these counts. Therefore, they cannot be used to calculate the percentages shown in Table III-12, which exclude missing data from the denominator of percentages. The number of exiters shown for characteristics that are available only for individuals who received intensive or training services is a substantial undercount of the total number with these characteristics because individuals who receive only core services are not counted. The columns “Core Services Only,” “Core and Intensive Services Only,” and “Training” are mutually exclusive and exhaustive—a person is included in one and only one of these columns.
Table III-15 to Table III-28
These tables show the services received by exiters. Most numbers shown are the percentages within the column heading. Exceptions include the number of exiters, which is a count, and weeks participated, for which both the average and percentages within categories are shown. In calculating percentages, individuals with missing data on either the row or column heading are excluded. The row headings “Core services only,” “Intensive & core services only,” and “Training services” are mutually exclusive and exhaustive. An individual is included in one and only one of these rows. The percentages shown for the types of training—on-the-job, skill upgrading, entrepreneurial training, ABE or ESL in combination with training, customized training, apprenticeship training, other occupational skills training, remedial training, and prerequisite training—are calculated among those who received training. There is no clear distinction between skill upgrading and other occupational skills training.
Table III-15 to Table III-16
These tables show trends over time in the services received by exiters.
Table III-24 to Table III-25
These tables are based only on individuals who received intensive or training services because this is the universe for which the column headings are available. These tables include a column labeled “With Intensive or Training Services,” which represents all individuals for whom data on the column headings is collected and is the appropriate comparison for the other columns (rather than the data in other tables for all exiters). Because these tables show services for a universe that is limited to individuals who receive intensive or training services, they should be interpreted with caution. For example, Table III-24 indicates the percentage of high school graduates who receive training. However, because high school graduates who receive only core services are excluded, the true percentage receiving training may be considerably less.
Table III-26 This table shows the number of dislocated worker exiters who received training by the type of training and the occupation of training. Both the 20 most common occupations and the ten most common healthcare occupations are shown. Data is not shown for individuals who received ABE or ESL in combination with training, remedial training, and prerequisite training, although they are included in the “Any Training” column. The occupation of training is frequently missing so the actual number receiving training in these occupations is larger.

Appendix A: Notes to Tables
Social Policy Research Associates 319
Table III-27 This table shows services provided by state. The column for number of exiters shows the count of exiters in the state. The remaining columns show the percentage within the state that received the service identified by the column heading. These values can be compared with the national values in the first row. Thus, unlike most other tables, this table presents row percentages, not column percentages. The distribution among the service categories within a state may be strongly affected by policies and practices regarding payment for services by WIA and Wagner-Peyser and coenrollment between the two programs. For example, Nebraska shows a high percentage of exiters received training, possibly because Wagner-Peyser funds were used for core and intensive services. Conversely, a high percentage of exiters in New York received only core services, possibly because of extensive coenrollment with Wagner-Peyser.
Table III-28 This table shows the number of dislocated worker exiters who received training by the type of training and state.
Table III-29 to Table III-41
These tables calculate each outcome for the most recent year’s worth of exiters for whom the outcome data is available, with the exception of Table III-29 and Table III-30, which show trends over time. Individuals who were reported as institutionalized or deceased at exit, those who had medical conditions that precluded continued participation in WIA or entry into employment or continued participation in the program, those providing care to a family member with a health/medical condition that precludes entry into employment or continued participation in the program, returning reservists who choose not to continue WIA services, and individuals who did not provide a valid Social Security number are excluded from the calculations. However, they are included in the number of exiters shown. All outcomes are calculated within the group defined by the column heading:
• The first group of outcomes shown contains the Common Measures, including entered employment rate, retention in the 2nd and 3rd quarters after exit, and average earnings in the 2nd and 3rd quarters after exit.
• The second group of outcomes contains the other WIA performance measures and comparable 12-month outcomes. These have been calculated following the official definitions. See Appendix B for summary definitions.
• The third group of outcomes includes information about the job held in the quarter after exit. This information is reported for all individuals employed in the quarter after exit, whether or not they were employed at participation.
• Other outcome information includes detail on some of the data used in the computation of the common and WIA performance measures.
Most numbers shown are the percentages within the column heading. Exceptions include the number of exiters, earnings change, and average earnings. The distributions of earnings in the quarter after exit and earnings in the 3rd quarter after exit include only individuals with earnings in the quarter. Thus, the percentages shown sum to 100%. In calculating percentages and averages, individuals with missing data on either the row or column heading are excluded.
Table III-29 to Table III-30
These tables show trends over time in the outcomes of WIA exiters. Data for exiters from April 2012 to March 2013 are complete except for the data on outcomes in the 4th quarter after exit. Data on outcomes in the 4th quarter after exit are for exiters from April 2012 to December 2012. Data for exiters from October 2012 to September 2013 do not include data on outcomes for the 4th quarter after exit. Data on outcomes in the 2nd quarter after exit are for exiters from October 2012 to June 2013. Data on outcomes in the 3rd quarter after exit are for exiters from October 2012 to March 2013.

Appendix A: Notes to Tables
Social Policy Research Associates 320
Data for earlier periods are complete, except for a few states. See the notes to Tables III-29 to III-41 for additional information. See the notes to Tables I-4 to I-7 for a discussion of trends over time in the number of exiters. These trends can have impacts on the trends in outcomes. Table III-29 shows the calculated outcomes, while Table III-30 shows the number of exiters attaining positive outcomes. The calculated outcomes in Table II-29 generally cannot be computed from the data in Table II-30 due to exclusions from outcome measurement.
Table III-42 This table shows the WIA performance measures calculated within detailed groups based on the characteristics of exiters from two different cohorts of exiters. The entered employment rate and employment and credential rate performance measures are given for exiters from October 2012 to September 2013, whereas the employment retention and average earnings performance measures are given for exiters from April 2012 to March 2013. Using two cohorts ensures that each performance measure is calculated for the most recent year’s worth of exiters available. The column titled “Number of Exiters” contains the number of exiters in the group defined by the row heading. The remaining columns show the four performance measures calculated within the group of exiters defined by the row heading. All of the performance measures, except average earnings, are percentages. Outcomes for “Characteristics of Exiters who Received Intensive or Training Services” include only individuals who received intensive or training services because information on the row heading is not collected for individuals who receive only core services. See Appendix B for summary definitions of the performance measures.
Table III-43 This table shows the WIA performance measures calculated within detailed groups based on services received by exiters from two different cohorts of exiters. The entered employment rate and employment and credential rate performance measures are given for exiters from October 2012 to September 2013, whereas the employment retention and average earnings performance measures are given for exiters from April 2012 to March 2013. Using two cohorts ensures that each performance measure is calculated for the most recent year’s worth of exiters available. The column titled “Number of Exiters” contains the number of exiters in the group defined by the row heading. The remaining columns show the four performance measures calculated within the group of exiters defined by the row heading. All of the performance measures, except average earnings, are percentages. See the Appendix B for the calculations of the performance measures.
Table III-44 This table shows the WIA performance measures calculated within detailed groups based on the occupation of training for exiters. Both the 20 most common occupations and the 10 most common healthcare occupations are shown. The occupations listed are based on the most common occupations among dislocated workers who started training between July 2013 and June 2014. Data are shown for two different cohorts of exiters: one cohort for the entered employment rate and employment and credential rate performance measures and another cohort for the employment retention and average earnings performance measures. Using two cohorts ensures that each performance measure is calculated for the most recent year’s worth of exiters available. The column titled “Number of Exiters” contains the number of exiters in the group defined by the row heading. The remaining columns show the four performance measures calculated within the group of exiters defined by the row heading. All of the performance measures, except average earnings, are percentages.

Appendix A: Notes to Tables
Social Policy Research Associates 321
Table III-45 This table shows the WIA performance measures calculated within each state for exiters from two different cohorts of exiters. The entered employment rate and employment and credential rate performance measures are given for exiters from October 2012 to September 2013, whereas the employment retention and average earnings performance measures are given for exiters from April 2012 to March 2013. Using two cohorts ensures that each performance measure is calculated for the most recent year’s worth of exiters available. Unlike the other outcome tables, exiters who received services only from NEG projects are excluded from the calculations of the performance measures and the exiter counts in this table because they are excluded from the states’ official performance calculations. The columns titled “Number of Exiters” contain the number of exiters in the state identified by the row heading. The remaining columns show the four performance measures calculated within the state. All of the performance measures are percentage. These performance measures are calculated using WIASRD data and may differ, sometimes substantially, from the performance reported by the state in its PY 2013 Annual Report. See Appendix B for the calculations of the performance measures.
Part IV: Youth Exiters Tables in Part IV include all exiters from youth programs, including both local and statewide
programs. Table IV-1 to Table IV-12
These tables show the characteristics of exiters for both older and younger youth. Most numbers shown are the percentages within the column heading. Exceptions include the number of exiters shown in the first three rows, which are counts, and preprogram earnings and average highest grade completed, for which both averages and percentages within categories are shown. In calculating percentages, individuals with missing data on either the row or column heading are excluded. Values of zero are excluded when calculating average preprogram earnings. Veteran and preprogram quarterly earnings are available only for older youth, those at least age 19 at participation.
Table IV-1 to Table IV-2
These tables show trends over time in the characteristics of exiters. Table IV-2 shows counts of exiters with particular characteristics. These counts exclude missing data and cannot be used to compute the percentages in Table II-1.
Table IV-12 This table shows the characteristics of youth who received specific youth activities. Youth who are not reported as receiving any of the youth activities are excluded from the table. Some states reported that many youth did not receive any youth activities.
Table IV-13 to Table IV-23
These tables show the services received by exiters. Most numbers shown are the percentages within the column heading. Exceptions include the number of exiters shown in the first row, which is a count, and weeks participated, for which both the average and percentages within categories are shown. The percentages for the youth activities are based on youth reported as receiving at least one of the activities. Some states reported that many youth did not receive any youth activities. In calculating percentages, individuals with missing data on either the row or column heading are excluded.
Table IV-13 to Table IV-14
These tables show trends over time in the services received by exiters. New activity types were added in the PY 2013 WIASRD—alternative school, work experience, adult mentoring, career guidance/counseling and basic skills training and occupational skills training—and are not available for exiters before January 2012. The pre-PY2013 youth activities are also shown for comparison. For youth reported in the PY2013 WIASRD (those who exited after December 2011), the new activity types are combined to approximate the previous activity types.
• Educational achievement services include educational achievement services, alternative school, and basic skills training.

Appendix A: Notes to Tables
Social Policy Research Associates 322
• Employment services include work experience and occupational skills training. • Additional support for youth services include adult mentoring and career
guidance/counseling.
Table IV-24 This table shows youth activities provided by state. The column for number of exiters shows the count of exiters in the state. The remaining columns show the percentage within the state that received the youth activity identified by the column heading. These percentages are based on youth reported as receiving at least one of the youth activities. Some states reported that many youth did not receive any youth activities. These values can be compared with the national values in the first row. Thus, unlike most other tables, this table presents row percentages, not column percentages.
Table IV-25 to Table IV-36
These tables show outcomes attained by youth exiters. Except in Tables IV-25 and 26, data for youth retention are for exiters from April 2012 to March 2013, data for diploma attainment and skill attainment are for exiters from April 2013 to March 2014, data for placement are for exiters from October 2012 to September 2013, data for attending secondary school at exit are for exiters from April 2013 to March 2014, and data for literacy and numeracy gains are based on participation years that ended between July 2013 and June 2014. Individuals who were reported as institutionalized or deceased at exit, those who had medical conditions that precluded continued participation in WIA or entry into employment or continued participation in the program, those providing care to a family member with a health/medical condition that precludes entry into employment or continued participation in the program, returning Reservists who choose not to continue WIA services, and individuals who did not provide a valid Social Security number are excluded from the calculations. However, they are included in the number of exiters shown. All outcomes are calculated within the group defined by the column heading.
• The first group of outcomes shown contains the youth common measures.
• The second group contains additional outcomes for all youth. These include detail on some of the data used in the computation of the common measures and additional outcomes.
• The third group includes the older youth WIA performance measures.
• The fourth group contains the younger youth WIA performance measures. The skill attainment rate differs substantially from the official definition because it is based only on exiters and includes all goals set for the youth during the youth’s period of participation. It is calculated as the total number of goals attained by the youth divided by the total number of goals set for the youth, excluding goals pending at exit for youth reported as institutionalized or deceased at exit and those who had medical conditions that precluded continued participation in WIA or entry into employment.
See Appendix B for summary definitions of the outcomes. Most numbers shown are the percentages within the column heading. Exceptions include the number of exiters. The skill attainment rate is based on all goals set for youth identified by the column head.
Table IV-25 to Table IV-26
These tables show trends over time in the outcomes of WIA exiters. Data for exiters from October 2012 to September 2013 are complete except for data on retention. Data on retention are for exiters from October 2012 to March 2013. Data for exiters from April 2013 to March 2014 do not include data on retention. Data on placement is for exiters from April 2013 to September 2013. Data for literacy and numeracy gains below the heading “PY 2013” are based on participation years that ended between July 2012 and June 2013; those below the heading “PY 2012” are based on participation years that ended between July 2011 and June 2012.
Appendix A: Notes to Tables
Social Policy Research Associates 323
Table IV-25 shows the calculated outcomes, while Table IV-26 shows the number of exiters attaining positive outcomes. The calculated outcomes in Table II-25 generally cannot be computed from the data in Table IV-26 due to exclusions from outcome measurement.
Tables IV-37 to IV-39
These tables show outcomes on the youth common measures: placement in employment or education, attainment of a degree or certificate, and literacy and numeracy gains. Placement in employment or education is based on exiters from October 2012 to September 2013 who were not in post-secondary education or employment at the date of participation. Attainment of a degree or certificate is based on exiters from October 2012 to September 2013 who were enrolled in education at the date of participation or at any point during the program. Literacy and numeracy gains is based on the definition for the third and subsequent years of implementation and includes basic skills deficient out-of-school youth who began participation between July 2010 and June 2013.
Table IV-37 This table shows the youth common measures calculated within detailed groups based on the characteristics of two different cohorts of youth. Placement in employment or education and attainment of a degree or certificate are given for exiters from October 2012 to September 2013, whereas literacy and numeracy gains is based on basic skills deficient out-of-school youth who began participation between July 2010 and June 2013 with participation years ending in PY 2014. The column titled “Number of Exiters” contains the number of youth in the group defined by the row heading. The remaining columns show the three common measures calculated within the group of youth defined by the row heading. All of the common measures are percentages. See Appendix B for summary definitions of the common measures.
Table IV-38 This table shows the youth common measures calculated within detailed groups based on the services received by two different cohorts of youth. Placement in employment or education and attainment of a degree or certificate are given for exiters from October 2012 to September 2013, whereas literacy and numeracy gains is based on basic skills deficient out-of-school youth who began participation between July 2010 and June 2013 with participation years ending in PY 2014. The column titled “Number of Exiters” contains the number of youth in the group defined by the row heading. The remaining columns show the three common measures calculated within the group of youth defined by the row heading. All of the common measures are percentages. See Appendix B for summary definitions of the common measures.
Table IV-39 This table shows the youth common measures calculated within each state. Placement in employment or education and attainment of a degree or certificate are given for exiters from October 2012 to September 2013, whereas literacy and numeracy gains is based on basic skills deficient out-of-school youth who began participation between July 2010 and June 2013 with participation years ending in PY 2014. The column titled “Number of Exiters” contains the number of youth in the group defined by the row heading. The remaining columns show the three common measures calculated within the group of youth defined by the row heading. All of the common measures are percentages. These common measures are calculated using WIASRD data and may differ, sometimes substantially, from the outcomes reported by the state in its PY 2013 Annual Report. In particular, some states were in the second year of implementation for literacy and numeracy gains and reported that measure based on a different calculation in the PY 2013 Annual Report. See Appendix B for summary definitions of the common measures.

Appendix A: Notes to Tables
Social Policy Research Associates 324
Table IV-40 This table shows the WIA younger youth performance measures calculated within detailed groups based on the characteristics of exiters. The retention rate is based on exiters from April 2012 to March 2013; diploma attainment and skill attainment are based on exiters from April 2013 to March 2014. The columns titled “Number of Exiters” contain the number of exiters in the group defined by the row heading, within the relevant time period shown by the column heading. The remaining columns show the three performance measures calculated within the group of exiters defined by the row heading, again for the time period shown by the column heading. All of the performance measures are percentages. However, the skill attainment rate is a percentage of all goals set for exiters, rather than of exiters. This skill attainment rate is different from the official performance measure. See Appendix B for summary definitions of the performance measures and the notes to Tables IV-25 to IV-36 for more detail.
Table IV-41 This table shows the younger youth WIA performance measures calculated within detailed groups based on the services received by exiters. See the notes to Table IV-40 for more detail on the calculations and Appendix B for summary definitions of the performance measures.
Table IV-42 This table shows the younger youth WIA performance measures for younger youth calculated within states. See the notes to Table IV-40 for more detail on the calculations and Appendix B for summary definitions of the performance measures. The skill attainment rate differs from the official performance measure. Because these performance measures are calculated from WIASRD data, the numbers shown may differ, sometimes substantially, from the performance reported by the states in their PY 2013 Annual Reports.
Table IV-43 This table shows the older youth WIA performance measures calculated within detailed groups based on the characteristics of exiters from two different cohorts of exiters. The entered employment rate and employment and credential rate performance measures are given for exiters from October 2012 to September 2013, whereas the employment retention and earnings change performance measures are given for exiters from April 2012 to March 2013. Using two cohorts ensures that each performance measure is calculated for the most recent year’s worth of exiters available. The columns titled “Number of Exiters” contain the number of exiters in the group defined by the row heading. The remaining columns show the four performance measures calculated within the group of exiters defined by the row heading. All of the performance measures, except earnings change, are percentages. See Appendix B for summary definitions of the performance measures.
Table IV-44 This table shows the older youth WIA performance measures calculated within detailed groups based on the services received by exiters from two different cohorts of exiters. The entered employment rate and employment and credential rate performance measures are given for exiters from October 2012 to September 2013, whereas the employment retention and earnings change performance measures are given for exiters from April 2012 to March 2013. Using two cohorts ensures that each performance measure is calculated for the most recent year’s worth of exiters available. The columns titled “Number of Exiters” contain the number of exiters in the group defined by the row heading. The remaining columns show the four performance measures calculated within the group of exiters defined by the row heading. All of the performance measures, except earnings change, are percentages. See the Appendix B for summary definitions of the performance measures

Appendix A: Notes to Tables
Social Policy Research Associates 325
Table IV-45 This table shows the WIA older youth performance measures calculated within each state for exiters from two different cohorts of exiters. The entered employment rate and employment and credential rate performance measures are given for exiters from October 2012 to September 2013, whereas the employment retention and earnings change performance measures are given for exiters from April 2012 to March 2013. Using two cohorts ensures that each performance measure is calculated for the most recent year’s worth of exiters available. The columns titled “Number of Exiters” contain the number of exiters in the state identified by the row heading. The remaining columns show the four performance measures calculated within the state. All of the performance measures, except earnings change, are percentages. These performance measures are calculated using WIASRD data and may differ, sometimes substantially, from the performance reported by the state in its PY 2013 Annual Report. See Appendix B for the calculations of the performance measures.


Social Policy Research Associates 327
Appendix B Definitions


Appendix B: Definitions
Social Policy Research Associates 329
Definitions of Characteristics
Age categories Age is calculated as the difference in days between the birth date and the participation date, divided by 365.25.
Individual with a disability An individual who indicates that he/she has any "disability," as defined in Section 3(2)(a) of the Americans with Disabilities Act of 1990 (42 U.S.C. 12102). Under that definition, a "disability" is a physical or mental impairment that substantially limits one or more of the person's major life activities. (For definitions and examples of "physical or mental impairment" and "major life activities," see paragraphs (1) and (2) of the definition of the term "disability" in 29 CFR 37.4, the definition section of the WIA non-discrimination regulations.)
Race and ethnicity Hispanic A person of Cuban, Mexican, Puerto Rican, South or Central
American, or other Spanish culture in origin, regardless of race Not Hispanic
American Indian or Alaskan Native
A person having origins only in any of the original peoples of North America and South America (including Central America), and who maintains cultural identification through tribal affiliation or community recognition.
Asian A person having origins only in any of the original people of the Far East, Southeast Asia, or the Indian Subcontinent (e.g., India, Pakistan, Bangladesh, Sri Lanka, Nepal, Sikkim, and Bhutan). This area includes, for example, Cambodia, China, Japan, Korea, Malaysia, the Philippine Islands, Thailand, and Vietnam.
Black or African American A person having origins only in any of the black racial groups of Africa.
Hawaiian or other Pacific Islander
A person having origins only in any of the original people of Hawaii, Guam, Samoa, or other Pacific Islands.
White A person having origins only in any of the original peoples of Europe, the Middle East, or North Africa.
More than one race A person was reported as being in more than one of the above non-Hispanic race categories.
Veteran A person who served in the active U.S. military, naval, or air service and who was discharged or released from such service under conditions other than dishonorable.
Disabled veteran A veteran who served in the active U.S. armed forces and who is entitled to compensation regardless of rating (including those rated at 0%); or who but for the receipt of military retirement pay would be entitled to compensation, under laws administered by the Department of Veterans Affairs (DVA); or was discharged or released from activity duty because of a service-connected disability.
Appendix B: Definitions
Social Policy Research Associates 330
Campaign veteran An eligible veteran who served on active duty in the U.S. armed forces during a war or in a campaign or expedition for which a campaign badge or expeditionary medal has been authorized as identified and listed by the Office of Personnel Management (OPM).
Recently separated veteran A veteran who applied for participation under Title I of WIA within 48 months after discharge or release from active U.S. military, naval, or air service.
Other eligible person A person who is (a) the spouse of any person who died on active duty or of a service-connected disability, (b) the spouse of any member of the Armed Forces serving on active duty who at the time of application for assistance under this part, is listed, pursuant to 38 U.S.C 101 and the regulations issued thereunder, by the Secretary concerned, in one or more of the following categories and has been so listed for more than 90 days:
(i) missing in action; (ii) captured in the line of duty by a hostile force; or (iii) forcibly detained or interned in the line of duty by a foreign government or power; or
(c) the spouse of any person who has a total disability permanent in nature resulting from a service-connected disability or the spouse of a veteran who died while a disability so evaluated was in existence.
Employed at participation Employed A person who either (a) did any work at all as a paid employee,
(b) did any work at all in his or her own business, profession, or farm, (c) worked as un unpaid worker in an enterprise operated by a member of the family, or (d) is one who was not working, but has a job or business from which he or she was temporarily absent because of illness, bad weather, vacation, labor-management dispute, or personal reasons, whether or not paid by the employer for time-off, and whether or not seeking another job.
Excludes persons who, although employed, either (a) have received a notice of termination of employment or the employer has issued a Worker Adjustment and Retraining Notification (WARN) or other notice that the facility or enterprise will close, or (b) are transitioning service members.
Not employed or received layoff notice
An individual who does not meet the definition of employed above.
Average preprogram quarterly earnings
Quarterly earnings are derived by the state from UI wage records. If earnings in both the 2nd and 3rd quarters before participation are greater than zero, then the average of those two values. If only one is greater than zero, then that value.
UI status For adults and dislocated workers, this is presented two ways: for all exiters (as it is now reported) and for exiters who

Appendix B: Definitions
Social Policy Research Associates 331
received intensive or training services (as it was reported in prior program years.
UI Claimant Eligible Unemployment Compensation (U.C.) claimant who has not exhausted their U.C. benefits.
UI Claimant referred by WPRS
Eligible U.C. claimant referred by the Worker Profiling and Reemployment Services (WPRS) system.
UI Exhaustee Eligible U.C. claimant who has exhausted their U.C. benefits. Characteristics of Exiters who Received intensive or training
Services
The following data is collected for youth and for adults and dislocated workers who received intensive or training services.
Limited English-language A person who has limited ability in speaking, reading, writing or understanding the English language and (a) whose native language is a language other than English, or (b) who lives in a family or community environment where a language other than English is the dominant language. Puerto Rico is excluded.
Single parent A single, separated, divorced, or widowed individual who has primary responsibility for one or more dependent children under age 18.
Low income An indivdual in one or more of the following categories:
(A) receives, or is a member of a family which receives, cash payments under a Federal, state or income based public assistance program;
(B) received an income, or is a member of a family that received a total family income, for the six month period prior to participation for the program involved (exclusive of unemployment compensation, child support payments, payments described in subparagraph (A) and old age and survivors insurance benefits received under section 202 of the Social Security Act (42 U.S.C. 402)) that, in relation to family size does not exceed the higher of:
(i) the poverty line, for an equivalent period; or
(ii) 70 percent of the lower living standard income level, for an equivalent period;
(C) a member of a household that receives (or has been determined within the 6 month period prior to participation for the program involved to be eligible to receive) Food Stamps pursuant to the Food Stamp Act of l977 (7 U.S.C. 2011 et seq.);
(D) qualifies as a homeless individual, as defined in subsections (a) and (c)of section 103 of the Stewart B. McKinney Homeless Assistance Act(42 U.S.C. 11302);
(E) is a foster child on behalf of whom state or local government payments are made;
(F) is a person with a disability whose own income meets the income criteria established in WIA section 101(25)(A) or (B), but is a member of a family whose income does not meet the established criteria.
Public assistance recipient A person who qualifies as a TANF recipient or other public

Appendix B: Definitions
Social Policy Research Associates 332
assistance recipient, as defined below. TANF recipient A person who is listed on the welfare grant or has received cash
assistance or other support services from the TANF agency in the last six months prior to participation in the program.
Other public assistance, including SNAP and SSI
A person who is receiving or has received cash assistance or other support services from one of the following sources in the last six months prior to participation in the program: General Assistance (GA) (State/local government), Refugee Cash Assistance (RCA), Food Stamp Assistance (SNAP), or Supplemental Security Income (SSI-SSA Title XVI). Does not include foster child payments. Before PY 2005, this field did not include Food Stamps. Some states implemented the change to record receipt of Food Stamps and others did not. Therefore, the count of Food Stamps recipients is quite incomplete.
Offender An individual (adult or youth) who either (a) is or has been subject to any stage of the criminal justice process for committing a status offense or delinquent act, or (b) requires assistance in overcoming barriers to employment resulting from a record of arrest or conviction for committing delinquent acts, such as crimes against persons, crimes against property, status offenses, or other crimes.
Homeless or runaway youth An individual (adult or youth) who lacks a fixed, regular, adequate night time residence. This definition includes any individual who has a primary night time residence that is a publicly or privately operated shelter for temporary accommodation; an institution providing temporary residence for individuals intended to be institutionalized; or a public or private place not designated for or ordinarily used as a regular sleeping accommodation for human beings; or a person under 18 years of age who absents himself or herself from home or place of legal residence without the permission of his or her family (i.e., runaway youth). This definition does not include an individual imprisoned or detained under an Act of Congress or State law. An individual who may be sleeping in a temporary accommodation while away from home should not, as a result of that alone, be recorded as homeless.
Highest school grade completed 8th or less Highest grade completed of 8 or less. Some high school Highest grade completed between 9 and 11 or highest grade
completed is 12 but the individual did not receive a high school diploma or GED.
High school graduate Completed the 12th grade and attained a high school diploma. Also includes individuals with a disability who receive a certificate of attendance/completion. Note: When used as column heading high school graduate also includes high school equivalency
High school equivalency GED or other high school equivalency. Some postsecondary Includes college or full-time technical or vocational school. College graduate 4-year Bachelor’s degree or equivalent or beyond.

Appendix B: Definitions
Social Policy Research Associates 333
Characteristics Available for Dislocated Workers
The following characteristics are available only for dislocated workers.
Displaced homemaker An person who has been providing unpaid services to family members in the home and has been dependent on the income of another family member but is no longer supported by that income and is unemployed or underemployed and is experiencing difficulty in obtaining or upgrading employment.
Time of participation Based on the length of time between the dislocation date (the last day of employment at the dislocation job) and the participation date. Individuals whose dislocation date is not reported are excluded from the calculation.
Characteristics Available for Youth
The following characteristics are available only for youth.
Pregnant or parenting youth An individual who is under 22 years of age and who is pregnant, or a youth (male or female) who is providing custodial care for one or more dependents under age 18.
Basic literacy skills deficient A person who computes or solves problems, reads, writes, or speaks English at or below the 8th grade level or is unable to compute or solve problems, read, write, or speak English at a level necessary to function on the job, in the individual's family, or in society. In addition, states and grantees have the option of establishing their own definition, which must include the above language. In cases where states or grantees establish such a definition, that definition will be used for basic literacy skills determination.
Ever in foster care A person who is in foster care or has been in the foster care system.
Youth who needs additional assistance
A youth aged 14-21 who requires additional assistance to complete an educational program, or to secure and hold employment as defined by state or local policy. If the State Board defines a policy, the policy must be included in the State Plan.
Attending school at participation School status has been adjusted to be consistent with highest grade completed.
High school or below The individual has not received a secondary school diploma or its recognized equivalent and is attending any secondary school (including elementary, intermediate, junior high school, whether full or part-time), or is between school terms and intends to return to school. Includes attending alternative school when used as a column heading.
Alternative school The individual has not received a secondary school diploma or its recognized equivalent and is attending an alternative high school or an alternative course of study approved by the local educational agency whether full or part-time.
Postsecondary The individual has received a secondary school diploma or its recognized equivalent and is attending a post-secondary school or program (whether full or part-time), or is between school

Appendix B: Definitions
Social Policy Research Associates 334
terms and intends to return to school. Not attending school at participation
High school dropout The individual is no longer attending any school and has not received a secondary school diploma or its recognized equivalent.
High school graduate/equivalent The individual is not attending any school and has either graduated from high school or holds a GED.

Appendix B: Definitions
Social Policy Research Associates 335
Definitions of Services Services for Adults, Dislocated Workers, and Youth
Coenrollment WIA adult WIA Title 1B local or statewide adult programs. WIA dislocated worker WIA Title 1B local or statewide dislocated worker programs or
National Emergency Grants. WIA youth WIA Title 1B local or statewide youth programs Partner program Any partner program. Note: reporting of some partner
programs is optional and may be seriously under counted. Wagner-Peyser The participant received services financially assisted under the
Wagner-Peyser Act (29 USC 49 et seq.) WIA section 121 (b)(1)(B)(ii).
TAA The participant received services financially assisted under the Trade Adjustment Act (WIA section 121(b)(1)(B)(viii)).
National Farmworker Jobs Program
The participant received services financially assisted under WIA Title I-D, Section 167
Veterans programs The participant received services financially assisted by DVOP/LVER funds (WIA section 121(b)(1)(B)(ix)) or training services financially assisted under WIA section 168.
Vocational Education The participant received services financially assisted under the Carl D. Perkins Vocational and Applied Technology Education Act (20 USC 2471) (WIA section 121(b)(1)(B)(vii))
Adult Education The participant received services financially assisted under WIA Title II.
Title V Older Worker The participant received services financially assisted under the Older Americans Act of 1998 (WIA section 121(b)(1)(B)(vi)
Other partner programs
The participant received services financially assisted by Job Corps, Indian and Native American Programs, Vocational Rehabilitation, YouthBuild, and other WIA and non-WIA partner programs.
Pell Grant recipient (among trainees)
An individual who is or has been notified s/he will be receiving a Pell Grant at any time during participation in the program. This information may be updated at any time during participation in the program. Based only on trainees for adults and dislocated workers but based on all particpants for youth. Excludes Puerto Rico and younger youth.
Weeks participated Weeks between participation and the last service (exit).
Services for Adults and Dislocated Workers Services Received
Core self-service and informational activities
The individual received self-service and informational activities. Self-service and informational activities are those core services accessible to the general public electronically or through a physical location that are designed to inform and educate individuals about the labor market and their employment strengths, weaknesses, and the range of services appropriate to their situation, and that do not require significant staff involvement with the individual.

Appendix B: Definitions
Social Policy Research Associates 336
Staff-assisted core services Staff-assisted core services, excluding self-service and informational activities. Core services include (but are not limited to): • Staff-assisted job search and placement assistance, including
career counseling; • Follow-up services, including counseling regarding the
workplace; • Staff-assisted job referrals (such as testing and background
checks); • Staff-assisted job development (working with employer and
jobseeker); and
• Staff-assisted workshops and job clubs.
• Intensive services (as described below).
• Training services (as described below). Intensive Services Intensive services may include:
• Comprehensive and specialized assessments of skill levels and service needs including:
diagnostic testing and use of other assessment tools; and in-depth interviewing and evaluation to identify
employment barriers and appropriate employment goals; • Development of an individual employment plan, to identify the
employment goals, appropriate achievement objectives, and appropriate combination of services for the participant to achieve the employment goals;
• Group counseling;
• Individual counseling and career planning; • Case management for participants seeking training services;
• Short-term prevocational services, including development of learning skills, communication skills, interviewing skills, punctuality, personal maintenance skills, and professional conduct, to prepare individuals for unsubsidized employment or training;
• Out-of-area job search assistance; Relocation assistance; Internships; and Work experience.
Intensive services beyond those listed in the Act may also be provided.
Prevocational activities The individual received short-term prevocational services, including development of learning skills, communication skills, interviewing skills, punctuality, personal maintenance skills, and professional conduct, to prepare individuals for unsubsidized employment or training (i.e., intensive services for adults and dislocated workers).
Training Services The individual received any of the following types of training services:
Type of Training (among trainees) On-the-job training Training by an employer that is provided to a paid participant
while engaged in productive work in a job that: (A) provides knowledge or skills essential to the full and adequate

Appendix B: Definitions
Social Policy Research Associates 337
performance of the job;
(B) provides reimbursement to the employer of up to 50 percent of the wage rate of the participant, for the extraordinary costs of providing the training and additional supervision related to the training; and
(C) is limited to the period of time required for a participant to become proficient in the occupation for which the training is being provided. In determining the appropriate length of the contract, consideration should be given to the skill requirements of the occupation, the academic and occupational skill level of the participant, prior work experience, and the participant's individual employment plan.
Skill upgrading Entrepreneurial training ABE or ESL in combination with training (non-TAA)
Customized training Apprenticeship training Other occupational skills training
Includes the receipt of the following types of services:
• Occupational skills training, including training for nontraditional employment;
• Programs that combine workplace training with related instruction, which may include cooperative education programs;
• Training programs operated by the private sector; Remedial training (ABE/ESL TAA only)
Prerequisite training Completed any training (among trainees)
Individual completed any approved training.
ITA established (among trainees) Any of the individual's services were purchased utilizing an Individual Training Account established for adults or dislocated workers and funded by WIA title I.
Needs-related payments The individual received needs related payments WIA title IB funded for the purpose of enabling the individual to participate in approved training funded under WIA Title IB.
Other supportive services The individual received supportive services (WIA section 134(e)(2)) which include, but are not limited to, assistance with transportation, child care, dependent care, and housing that are necessary to enable the individual to participate in activities authorized under WIA title IB.
Service category Core services, including staff-assisted, only
Individuals that received core services other than information or self-service (and, thus were registered for WIA), but not intensive or training services.
Intensive & core services only Individual who received core and intensive services, but not training.
Training services Individual who received any of the training services described

Appendix B: Definitions
Social Policy Research Associates 338
above.
Weeks of training Weeks between date started training and date completed or withdrew from training.
Occupation of training The 8 digit O*Net 4.0 (or later versions) code that best describes the training occupation for which the participant received training services.
Managerial, prof., technical O*Net codes in the range from 11000000 to 29999999. Healthcare practitioners and technical occupations
O*Net codes in the range from 29000000 to 29999999.
Service Occupations O*Net codes in the range from 31000000 to 39999999. Healthcare support occupations O*Net codes in the range from 31000000 to 31999999.
Sales and Clerical O*Net codes in the range from 41000000 to 43999999. Farming, fishing, forestry, construction, and extraction
O*Net codes in the range from 45000000 to 47999999.
Installation, repair, production, transportation, material moving
O*Net codes in the range from 49000000 to 55999999.
Reason for exit
Institutionalized Participant is residing in an institution or facility providing 24-hour support such as a prison or hospital and is expected to remain in that institution for at least 90 days.
Health/medical Participant is receiving medical treatment that precludes entry into unsubsidized employment or continued participation in the program. Does not include temporary conditions expected to last for less than 90 days.
Deceased Participant was found to be deceased or no longer living. Family care Participant is providing care for a family member with a
health/medical condition that precludes entry into unsubsidized employment or continued participation in the program. Does not include temporary conditions expected to last for less than 90 days.
Reserve called to active duty Participant is a member of the National Guard or other reserve military unit of the armed forces and is called to active duty for at least 90 days.
Retirement Participant has retired.
Services for Dislocated Workers Rapid response The individual participated in rapid response activities
authorized at WIA section 134(a)(2)(A)(i) at any time prior to or subsequent to participation in the program. Does not include rapid response, additional assistance (WIA section 134(a)(2)(A)(ii)). Individuals who receive only rapid response are not included in the file.
Disaster relief The individual received any of the following:
• A temporary job working in clean-up and recovery of the affected area and received workforce services through a Disaster National Emergency Grant (Disaster NEG), including core, intensive, and training services as defined in the WIA.

Appendix B: Definitions
Social Policy Research Associates 339
• A temporary job through a Disaster NEG working in clean-up and recovery of the affected area, but received no other workforce services through the Disaster NEG.
• Workforce services through a Disaster NEG, including core, intensive, and training services as defined in the WIA, but did not receive a temporary job through the Disaster NEG.
Services for Youth
Supportive services The youth received supportive services (WIA section 101(46)) including (a) linkages to community services; (b) assistance with transportation; (c) assistance with child care and dependent care; (d) assistance with housing; (e) referrals to medical services; and (f) assistance with uniforms or other appropriate work attire and work-related tools, including such items as eye glasses and protective eye gear.
Youth Activities Among youth with any of the following activities: Educational achievement services
Educational achievement services include, but are not limited to, tutoring, study skills training, and instruction leading to secondary school completion, including dropout prevention strategies.
Alternative school Attending an alternative secondary school. Summer employment Summer employment opportunities directly linked to academic
and occupational learning. Work experience Work experience, whether paid or unpaid, including internships
and job shadowing. Leadership development Leadership development opportunities include, but are not
limited to, opportunities that encourage responsibility, employability, and other positive social behaviors such as (a) exposure to post-secondary educational opportunities; (b) community and service learning projects; (c) peer-centered activities, including peer mentoring and tutoring; (d) organizational and team work training, including team leadership training; (e) training in decision making, including determining priorities; and (f) citizenship training, including life skills training such as parenting, work behavior training, and budgeting of resources.
Adult mentoring Adult mentoring services that may last for a duration of at least twelve (12) months and may occur both during and after program participation.
Career guidance/counseling Career guidance or counseling services. Basic skills training Basic skills training include skill upgrading, remedial training
(TAA only), or other basic skills training. Occupational skills training Occupational skills training includes on-the-job training,
entrepreneurial training, ABE or ESL in conjunction with training (non-TAA funded), customized training, other occupation skills training, prerequisite training, or apprenticeship training.
Enrolled in Education The individual is enrolled in secondary school, post-secondary school, adult education programs, or any other organized program of study. States may use this coding value if the youth

Appendix B: Definitions
Social Policy Research Associates 340
was either already enrolled in education at the time of participation in the program or became enrolled in education at any point while participating in the program.

Appendix B: Definitions
Social Policy Research Associates 341
Definitions of Outcomes All outcomes exclude individuals who were reported at exit as
any of the following:
• Residing in an institution or facility providing 24-hour support such as a prison or hospital and expected to remain in that institution for at least 90 days.
• Receiving medical treatment that precludes entry into unsubsidized employment or continued participation in the program that is expected to last for more than 90 days.
• Found to be deceased or no longer living.
• Providing care for a family member with a health/medical condition that precludes entry into unsubsidized employment or continued participation in the program that is expected to last for more than 90 days.
• A member of the National Guard or other reserve military unit of the armed forces and is called to active duty for at least 90 days.
Youth outcomes also exclude individuals who were reported at exit as relocated to mandated residential program or who meet criteria for exclusion from WIA youth performance measures.
Outcomes for Adults, Dislocated Workers and Older Youth Common Measures Official definitions of the common measures are in TEGL 17-05
Entered employment (quarter after exit)
Employed in the quarter after exit. Excludes individuals who were employed at participation at participation unless they received a notice of layoff or plant closing.
Retention in 2nd and 3rd quarters after exit (adults and dislocated workers)
Employed in both the 2nd and 3rd quarters after exit among those employed in the quarter after exit.
Average earnings in 2nd and 3rd quarters after exit (adults and dislocated workers)
Average of earnings in the 2nd and 3rd quarters after exit among those with earnings in the 1st, 2nd, and 3rd quarters after exit. This measure became a common measure beginning with PY 2006. The corresponding common measure for PY 2005 was earnings change in the 2nd and 3rd quarters after exit (see below).
Other WIA Performance and 12-Month Outcomes
Official definitions of the other WIA performance outcomes are included in TEGL 17-05, Attachment D. Definitions of the 12-month outcomes are in the reporting instructions for the WIA Annual Report.
Retained employment 3rd quarter after exit
Employed in the 3rd quarter after exit among those who were employed in the quarter after exit. For older youth, excludes those who were not employed in the 3rd quarter after exit, but were in postsecondary education or advanced training in the 3rd quarter after exit.
Retained employment 4th quarter after exit
Employed in the 4th quarter after exit among those who were employed in the quarter after exit. For older youth, excludes those who were not employed in the 4th quarter after exit, but were in postsecondary education or advanced training in the 3rd quarter after exit.
Earnings change 2nd and 3rd quarters after exit Earnings in the 2nd and 3rd quarters after exit minus earnings in

Appendix B: Definitions
Social Policy Research Associates 342
the 2nd and 3rd quarters before participation among those who were employed in the quarter after exit. Excludes those whose employment in the 1st, 2nd or quarter after exit or the 3rd quarter after exit was determined through supplemental data and no earnings were found in wage records. For older youth, excludes those who were not employed in the 3rd quarter after exit, but were in postsecondary education or advanced training in the 3rd quarter after exit.
3rd and 4th quarters after exit Earnings in the 4th and 5th quarters after exit minus earnings in the 2nd and 3rd quarters before participation among those who were employed in the quarter after exit. Excludes those whose employment in the quarter after exit or the 3rd or 4th quarters after exit was determined through supplemental data and no earnings were found in wage records. For older youth, excludes those who were not employed in the 4th quarter after exit, but were in postsecondary education or advanced training in the 3rd quarter after exit.
Earnings replacement rate (dislocated workers)
Earnings in the 2nd and 3rd quarters after exit divided by earnings in the 2nd and 3rd quarters before participation among those who were employed in the quarter after exit. Earnings are aggregated over all included exiters before the division. Excludes those whose employment in the 1st, 2nd, or 3rd quarters after exit was determined through supplemental data and no earnings were found in wage records
Credential and employment rate (adults and dislocated workers)
Employed in the quarter after exit and received credential among adults and dislocated workers who received training. See attained credential below for the types of credentials included.
Employment in Quarter after exit The following outcomes are determined for persons who are employed in the quarter after exit.
Occupation of employment Occupation of employment is determined in the same way as occupation of training (see above). This information is often missing.
Nontraditional employment Employment is in an occupation or field of work for which individuals of the participant's gender comprise less than 25% of the individuals employed in such occupation or field of work. Non-traditional employment can be based on either local or national data, and both males and females can be in non-traditional employment. This information can be based on any job held after exit and only applies to adults, dislocated workers, and older youth.
Other Outcome Information Employment and earnings outcome measures exclude individuals who did not provide a SSN at participation.
Employment The individual is considered employed in a quarter after the exit quarter if wage records for that quarter show earnings greater than zero. When supplemental data sources are used, individuals are be counted as employed if, in the calendar quarter of measurement after the exit quarter, they did any work at all as paid employees (i.e., received at least some earnings), worked in their own business, profession, or worked on their own farm.
Quarter after exit Third quarter after exit Fifth quarter after exit
Average earnings (among earners)
The total earnings in the quarter as determined from wage records. Wage record information can be obtained from the

Appendix B: Definitions
Social Policy Research Associates 343
Quarter after exit state, other states, other entities maintaining wage record systems, or from WRIS. Earnings from all employers of the individual should be summed. What if the individual appears in several different wage record systems (e.g., systems in two different states)? Earnings from these different sources of wage records should be summed for each quarter. Individuals with no earnings in a quarter are excluded when computing average earnings for that quarter and are excluded from the distribution of earnings as well.
Second quarter after exit Third quarter after exit Fourth quarter after exit
Earnings quarter after exit $1 to $2,499 $2,500 to $4,999 $5,000 to $7,499 $7,500 to $9,999 $10,000 or more
Earnings 3rd quarter after exit $1 to $2,499 $2,500 to $4,999 $5,000 to $7,499 $7,500 to $9,999 $10,000 or more
Attained credential A nationally recognized degree or certificate or state or locally recognized credential. Credentials include, but are not limited to, a high school diploma, GED, or other recognized equivalents, post-secondary degrees/certificates, recognized skill standards, and licensure or industry-recognized certificates. States should include all state education agency recognized credentials. In addition, states should work with local workforce investment boards to encourage certificates to recognize successful completion of the training services listed above that are designed to equip individuals to enter or re-enter employment, retain employment, or advance into better employment. Credential must be obtained either during participation or by the end of the third quarter after exit from services.
High school diploma/equivalency AA, AS, BA, BS or other college degree Postgraduate degree Occupational skills license/credential/certificate Other
Youth Common Measures
Placement in Employment or Education
Participants in employment (including the military) or enrolled in secondary education and/or advanced training/occupational skills training in the first quarter after the exit quarter, calculated among youth who were not in post-secondary education or employment at the date of participation.
Attainment of Degree or Certificate
Participants who attain a diploma, GED, or certificate by the end of the third quarter after the exit quarter, calculated among those enrolled in education at the date of participation or at any point during the program.
Literacy and Numeracy Gains Participants who increase one or more educational functioning levels, as a percentage of youth who have completed a first, second, or third year of participation in the program or exit before completing a first year, calculated among out-of-school youth who are basic skills deficient. Out-of-school youth are youth who were not attending school at the date of participation and youth attending postsecondary school who are basic skills deficient.

Appendix B: Definitions
Social Policy Research Associates 344
Outcomes for All Youth
Attending secondary school at exit
The youth exited WIA services but was still attending secondary school at exit.
Placement (quarter after exit) Primary activity in 1st quarter following the exit quarter is employment or entry to postsecondary education, advanced training, military service, or a qualified apprenticeship.
Retention (3rd quarter after exit) Primary activity in 3rd quarter following the exit quarter is employment or entry to postsecondary education, advanced training, military service, or a qualified apprenticeship.
Not attending secondary school at exit
The youth exited WIA services and was not attending secondary school at exit.
Placement (quarter after exit) The percentage of youth entering any of the following activities in 1st quarter after exit:
Postsecondary education A program at an accredited degree-granting institution that leads to an academic degree (e.g., A.A., A.S., B.A., B.S.). Programs offered by degree-granting institutions that do not lead to an academic degree (e.g., certificate programs) do not count as a placement in post-secondary education, but may count as a placement in “advanced training/occupational skills training.”
Advanced training Advanced training is an occupational skills employment/ training program, not funded under Title I of the WIA, which does not duplicate training received under Title I. It includes only training outside of the One-Stop, WIA, and partner system (i.e., training following exit).
Training that leads to an academic degree (e.g., AA, AS, BA, BS) should be categorized as post-secondary education and not reported as advanced training.
Apprenticeships A program approved and recorded by the ETA Bureau of Apprenticeship and Training or by a recognized state apprenticeship agency or council. Approval is by certified registration or other appropriate written credential.
Military service On active duty any time during the 3rd quarter after exit. Employment The individual is considered employed in a quarter after the exit
quarter if wage records for that quarter show earnings greater than zero. When supplemental data sources are used, individuals should be counted as employed if, in the calendar quarter of measurement after the exit quarter, they did any work at all as paid employees (i.e., received at least some earnings), worked in their own business, profession, or worked on their own farm.
Retention (3rd quarter after exit)
Youth in any of the above activities at any time during the third quarter after exit.
Credential rate (older youth) Youth employed or in postsecondary education or advanced training in the quarter after exit and received credential. See attained credential above for the types of credentials included.
Younger Youth Performance Outcomes
Appendix B: Definitions
Social Policy Research Associates 345
Youth retention Youth in any of the following activities at any time during the third quarter after exit: postsecondary education, advanced training, apprenticeship, military service, or employment. Excludes youth who were attending secondary school at exit.
Diploma attainment rate Youth attained a secondary (high school) diploma or equivalent during enrollment or by the end of the first quarter after exit. The term diploma means any credential that the state education agency accepts as equivalent to a high school diploma. Youth still in secondary school at exit are excluded.
Skill attainment rate The skill attainment rate differs substantially from the official definition (except in Table IV-42) because it is based only on exiters and includes all goals set for the youth during the youth’s period of participation. It is calculated as the total number of goals attained by the youth divided by the total number of goals set for the youth, excluding goals pending at exit for youth reported as institutionalized or deceased at exit and those who had medical conditions that precluded continued participation in WIA or entry into employment.