pyqgis developer cookbook - documentation · pyqgis developer cookbook, versão 2.14 # when your...
TRANSCRIPT
PyQGIS developer cookbookVersão 2.14
QGIS Project
08/08/2017


Contents
1 Introdução 11.1 Executa o código em Phyton quando o QGIS é iniciado . . . . . . . . . . . . . . . . . . . . . . 21.2 Terminal Python . . . . . . . . . . . . . . . . . . . . . . . . . . . . . . . . . . . . . . . . . . . 21.3 Complementos Python . . . . . . . . . . . . . . . . . . . . . . . . . . . . . . . . . . . . . . . . 31.4 Aplicações Python . . . . . . . . . . . . . . . . . . . . . . . . . . . . . . . . . . . . . . . . . . 3
2 Carregando projetos 7
3 Carregando Camadas 93.1 Camadas Vetoriais . . . . . . . . . . . . . . . . . . . . . . . . . . . . . . . . . . . . . . . . . . 93.2 Camadas Matriciais . . . . . . . . . . . . . . . . . . . . . . . . . . . . . . . . . . . . . . . . . 113.3 Registro de Camada de Mapa . . . . . . . . . . . . . . . . . . . . . . . . . . . . . . . . . . . . 11
4 Usando Camadas Raster 134.1 Detalhes da Camada . . . . . . . . . . . . . . . . . . . . . . . . . . . . . . . . . . . . . . . . . 134.2 Renderer . . . . . . . . . . . . . . . . . . . . . . . . . . . . . . . . . . . . . . . . . . . . . . . 134.3 Atualizando camadas . . . . . . . . . . . . . . . . . . . . . . . . . . . . . . . . . . . . . . . . . 154.4 Query Values . . . . . . . . . . . . . . . . . . . . . . . . . . . . . . . . . . . . . . . . . . . . . 15
5 Usando Camadas Vetor 175.1 Retrieving information about attributes . . . . . . . . . . . . . . . . . . . . . . . . . . . . . . . 175.2 Selecionando características . . . . . . . . . . . . . . . . . . . . . . . . . . . . . . . . . . . . . 185.3 Interagindo sobre camada vetor . . . . . . . . . . . . . . . . . . . . . . . . . . . . . . . . . . . 185.4 Modificando Camadas Vetoriais . . . . . . . . . . . . . . . . . . . . . . . . . . . . . . . . . . . 205.5 Modificando Camadas Vetoriais com um Buffer . . . . . . . . . . . . . . . . . . . . . . . . . . 215.6 Utilizando Índices Espaciais . . . . . . . . . . . . . . . . . . . . . . . . . . . . . . . . . . . . . 225.7 Escrevendo Camadas Vetoriais . . . . . . . . . . . . . . . . . . . . . . . . . . . . . . . . . . . . 235.8 provedor de Memória . . . . . . . . . . . . . . . . . . . . . . . . . . . . . . . . . . . . . . . . 245.9 Aparencia (Simbologia) de Camadas de Vetor . . . . . . . . . . . . . . . . . . . . . . . . . . . . 255.10 Outros Tópicos . . . . . . . . . . . . . . . . . . . . . . . . . . . . . . . . . . . . . . . . . . . . 32
6 Manipulação Geométrica 356.1 Construção de Geométria . . . . . . . . . . . . . . . . . . . . . . . . . . . . . . . . . . . . . . 356.2 Acesso a Geometria . . . . . . . . . . . . . . . . . . . . . . . . . . . . . . . . . . . . . . . . . 366.3 Operações e Predicados Geométricos . . . . . . . . . . . . . . . . . . . . . . . . . . . . . . . . 36
7 Suporte a projeções 397.1 Sistemas de Referencia de Coordenadas . . . . . . . . . . . . . . . . . . . . . . . . . . . . . . . 397.2 Projeções . . . . . . . . . . . . . . . . . . . . . . . . . . . . . . . . . . . . . . . . . . . . . . . 40
8 Utilizando a Tela do Mapa 418.1 Incorporar o Mapa da Tela . . . . . . . . . . . . . . . . . . . . . . . . . . . . . . . . . . . . . . 418.2 Usando Ferramentas de Mapas na Tela . . . . . . . . . . . . . . . . . . . . . . . . . . . . . . . 42
i

8.3 Bandas raster e fazedor de vértices . . . . . . . . . . . . . . . . . . . . . . . . . . . . . . . . . 438.4 Desenhar ferramenta de mapa personalizada . . . . . . . . . . . . . . . . . . . . . . . . . . . . 448.5 Desenhar itens da tela do mapa . . . . . . . . . . . . . . . . . . . . . . . . . . . . . . . . . . . 45
9 Renderização em impressão de mapas 479.1 Renderização simples . . . . . . . . . . . . . . . . . . . . . . . . . . . . . . . . . . . . . . . . 479.2 Renderizando camadas com CRS diferente . . . . . . . . . . . . . . . . . . . . . . . . . . . . . 489.3 Saída usando Compositor de Mapa . . . . . . . . . . . . . . . . . . . . . . . . . . . . . . . . . 48
10 Expressões, filtragem e cálculo dos valores 5110.1 Expressões de Análise . . . . . . . . . . . . . . . . . . . . . . . . . . . . . . . . . . . . . . . . 5210.2 Expressões de Avaliação . . . . . . . . . . . . . . . . . . . . . . . . . . . . . . . . . . . . . . . 5210.3 Exemplos . . . . . . . . . . . . . . . . . . . . . . . . . . . . . . . . . . . . . . . . . . . . . . . 53
11 Leitura e Armazenamento de Configurações 55
12 Comunicação com o usuário 5712.1 Mostrando mensagens. Classe QgsMessageBar . . . . . . . . . . . . . . . . . . . . . . . . . 5712.2 Mostrando progresso . . . . . . . . . . . . . . . . . . . . . . . . . . . . . . . . . . . . . . . . . 5812.3 Carregando . . . . . . . . . . . . . . . . . . . . . . . . . . . . . . . . . . . . . . . . . . . . . . 59
13 Desenvolvimento de Complementos Python 6113.1 Escrevendo um complemento . . . . . . . . . . . . . . . . . . . . . . . . . . . . . . . . . . . . 6213.2 Conteúdo do complemento . . . . . . . . . . . . . . . . . . . . . . . . . . . . . . . . . . . . . . 6213.3 Documentação . . . . . . . . . . . . . . . . . . . . . . . . . . . . . . . . . . . . . . . . . . . . 6713.4 Tradução . . . . . . . . . . . . . . . . . . . . . . . . . . . . . . . . . . . . . . . . . . . . . . . 67
14 Configurações de IDE para escrita e depuração de plugins 6914.1 Uma nota na configuração IDE para Windows . . . . . . . . . . . . . . . . . . . . . . . . . . . 6914.2 Depuração usando Eclipse e PyDev . . . . . . . . . . . . . . . . . . . . . . . . . . . . . . . . . 7014.3 Depuração usando PDB . . . . . . . . . . . . . . . . . . . . . . . . . . . . . . . . . . . . . . . 74
15 Usando Camadas de Plugins 7515.1 Subclasses QgsPluginLayer . . . . . . . . . . . . . . . . . . . . . . . . . . . . . . . . . . . . . 75
16 Compatibilidade com versões anteriores do QGIS 7716.1 menu Complementos . . . . . . . . . . . . . . . . . . . . . . . . . . . . . . . . . . . . . . . . . 77
17 Liberando seu complemento 7917.1 Metadados e nome . . . . . . . . . . . . . . . . . . . . . . . . . . . . . . . . . . . . . . . . . . 7917.2 Código e ajuda . . . . . . . . . . . . . . . . . . . . . . . . . . . . . . . . . . . . . . . . . . . . 7917.3 Repositório oficial de complementos python . . . . . . . . . . . . . . . . . . . . . . . . . . . . 80
18 Fragmentos de código 8318.1 Cómo llamar a un método por un atajo de teclado . . . . . . . . . . . . . . . . . . . . . . . . . . 8318.2 Como alternar camadas . . . . . . . . . . . . . . . . . . . . . . . . . . . . . . . . . . . . . . . 8318.3 Cómo acceder a la tabla de atributos de los objetos espaciales seleccionados . . . . . . . . . . . . 84
19 Escrevendo um complemento de processamento 8519.1 Criando um complemente que adiciona um provedor de algoritmo . . . . . . . . . . . . . . . . . 8519.2 Criando um plugin que contém um conjunto de scripts de processamento . . . . . . . . . . . . . 85
20 Biblioteca de análise de rede 8720.1 Informação Geral . . . . . . . . . . . . . . . . . . . . . . . . . . . . . . . . . . . . . . . . . . . 8720.2 Elaborando um gráfico . . . . . . . . . . . . . . . . . . . . . . . . . . . . . . . . . . . . . . . . 8720.3 Análise de Gráficos . . . . . . . . . . . . . . . . . . . . . . . . . . . . . . . . . . . . . . . . . . 89
21 Complementos de servidores Python do QGIS 9521.1 Server Filter Plugins architecture . . . . . . . . . . . . . . . . . . . . . . . . . . . . . . . . . . 9521.2 Raising exception from a plugin . . . . . . . . . . . . . . . . . . . . . . . . . . . . . . . . . . . 97
ii

21.3 Writing a server plugin . . . . . . . . . . . . . . . . . . . . . . . . . . . . . . . . . . . . . . . . 9721.4 Access control plugin . . . . . . . . . . . . . . . . . . . . . . . . . . . . . . . . . . . . . . . . 100
Índice 103
iii

iv
CHAPTER 1
Introdução
• Executa o código em Phyton quando o QGIS é iniciado– PYQGIS_STARTUP environment variable– The startup.py file
• Terminal Python• Complementos Python• Aplicações Python
– Using PyQGIS in standalone scripts– Using PyQGIS in custom applications– Executando aplicativos personalizados
Este documento é um tutorial e um guia de referência. Ela não lista todos os possíveis casos de uso, mas dá umaboa visão geral dos principais recursos.
Desde a versão 0.9, o QGIS tem suporte opcional à scripts usando a linguagem Python. Nós decidimos peloPython por ser ela uma das linguagens favoritas para scripts. As ligações PyQGIS dependem da SIP e da PyQt4.A razão para usar SIP ao invés da mais usada SWIG é que todo o código QGIS depende das bibliotecas Qt. Asligações Python para o Qt (PyQt) são feitas usando SIP também e isso permite uma integração perfeita do PyQGIScom PyQt.
There are several ways how to use Python bindings in QGIS desktop, they are covered in detail in the followingsections:
• executar automaticamente código em Phyton quando o QGIS é iniciado
• emitir comandos no console do Python no QGIS
• criar e utilizar plugins em Python
• criar aplicativos personalizados com base na API do QGIS
Python bindings are also available for QGIS Server:
• starting from 2.8 release, Python plugins are also available on QGIS Server (see: Server Python Plugins)
• starting from 2.11 version (Master at 2015-08-11), QGIS Server library has Python bindings that can beused to embed QGIS Server into a Python application.
Existe uma referência completa à API QGIS que documenta as classes das bibliotecas QGIS. A API Python équase identica à API em C++.
A good resource when dealing with plugins is to download some plugins from plugin repository and examine theircode. Also, the python/plugins/ folder in your QGIS installation contains some plugin that you can use tolearn how to develop such plugin and how to perform some of the most common tasks.
1

PyQGIS developer cookbook, Versão 2.14
1.1 Executa o código em Phyton quando o QGIS é iniciado
Existem dois métodos distintos de executar o código em Phyton toda vez que o QGIS é iniciado.
1.1.1 PYQGIS_STARTUP environment variable
You can run Python code just before QGIS initialization completes by setting the PYQGIS_STARTUP environ-ment variable to the path of an existing Python file.
This method is something you will probably rarely need, but worth mentioning here because it is one of the severalways to run Python code within QGIS and because this code will run before QGIS initialization is complete. Thismethod is very useful for cleaning sys.path, which may have undesireable paths, or for isolating/loading the initialenviron without requiring a virt env, e.g. homebrew or MacPorts installs on Mac.
1.1.2 The startup.py file
Every time QGIS starts, the user’s Python home directory (usually: .qgis2/python) is searched for a filenamed startup.py, if that file exists, it is executed by the embedded Python interpreter.
1.2 Terminal Python
Para usar scripts é possível tirar proveito do terminal Python integrado. Ele pode ser aberto a partir do menu:Complementos → Terminal Python. O terminal abre como uma janela não modal:
Figure 1.1: Terminal Python QGIS
The screenshot above illustrates how to get the layer currently selected in the layer list, show its ID and optionally,if it is a vector layer, show the feature count. For interaction with QGIS environment, there is a iface variable,which is an instance of QgsInterface. This interface allows access to the map canvas, menus, toolbars andother parts of the QGIS application.
For convenience of the user, the following statements are executed when the console is started (in future it will bepossible to set further initial commands)
from qgis.core import *import qgis.utils
2 Chapter 1. Introdução

PyQGIS developer cookbook, Versão 2.14
For those which use the console often, it may be useful to set a shortcut for triggering the console (within menuSettings → Configure shortcuts...)
1.3 Complementos Python
QGIS allows enhancement of its functionality using plugins. This was originally possible only with C++ language.With the addition of Python support to QGIS, it is also possible to use plugins written in Python. The mainadvantage over C++ plugins is its simplicity of distribution (no compiling for each platform needed) and easierdevelopment.
Many plugins covering various functionality have been written since the introduction of Python support. The plu-gin installer allows users to easily fetch, upgrade and remove Python plugins. See the Python Plugin Repositoriespage for various sources of plugins.
Creating plugins in Python is simple, see Desenvolvimento de Complementos Python for detailed instructions.
Nota: Python plugins are also available in QGIS server (label_qgisserver), see Complementos de servidoresPython do QGIS for further details.
1.4 Aplicações Python
Often when processing some GIS data, it is handy to create some scripts for automating the process instead ofdoing the same task again and again. With PyQGIS, this is perfectly possible — import the qgis.core module,initialize it and you are ready for the processing.
Or you may want to create an interactive application that uses some GIS functionality — measure some data,export a map in PDF or any other functionality. The qgis.gui module additionally brings various GUI compo-nents, most notably the map canvas widget that can be very easily incorporated into the application with supportfor zooming, panning and/or any further custom map tools.
PyQGIS custom applications or standalone scripts must be configured to locate the QGIS resources such as pro-jection information, providers for reading vector and raster layers, etc. QGIS Resources are initialized by addinga few lines to the beginning of your application or script. The code to initialize QGIS for custom applications andstandalone scripts is similar, but examples of each are provided below.
Note: do not use qgis.py as a name for your test script — Python will not be able to import the bindings as thescript’s name will shadow them.
1.4.1 Using PyQGIS in standalone scripts
To start a standalone script, initialize the QGIS resources at the beginning of the script similar to the followingcode:
from qgis.core import *
# supply path to qgis install locationQgsApplication.setPrefixPath("/path/to/qgis/installation", True)
# create a reference to the QgsApplication, setting the# second argument to False disables the GUIqgs = QgsApplication([], False)
# load providersqgs.initQgis()
# Write your code here to load some layers, use processing algorithms, etc.
1.3. Complementos Python 3
PyQGIS developer cookbook, Versão 2.14
# When your script is complete, call exitQgis() to remove the provider and# layer registries from memoryqgs.exitQgis()
We begin by importing the qgis.core module and then configuring the prefix path. The prefix path is thelocation where QGIS is installed on your system. It is configured in the script by calling the setPrefixPathmethod. The second argument of setPrefixPath is set to True, which controls whether the default paths areused.
The QGIS install path varies by platform; the easiest way to find it for your your system is to use the TerminalPython from within QGIS and look at the output from running QgsApplication.prefixPath().
After the prefix path is configured, we save a reference to QgsApplication in the variable qgs. The secondargument is set to False, which indicates that we do not plan to use the GUI since we are writing a standalonescript. With the QgsApplication configured, we load the QGIS data providers and layer registry by callingthe qgs.initQgis() method. With QGIS initialized, we are ready to write the rest of the script. Finally, wewrap up by calling qgs.exitQgis() to remove the data providers and layer registry from memory.
1.4.2 Using PyQGIS in custom applications
The only difference between Using PyQGIS in standalone scripts and a custom PyQGIS application is the secondargument when instantiating the QgsApplication. Pass True instead of False to indicate that we plan touse a GUI.
from qgis.core import *
# supply path to qgis install locationQgsApplication.setPrefixPath("/path/to/qgis/installation", True)
# create a reference to the QgsApplication# setting the second argument to True enables the GUI, which we need to do# since this is a custom applicationqgs = QgsApplication([], True)
# load providersqgs.initQgis()
# Write your code here to load some layers, use processing algorithms, etc.
# When your script is complete, call exitQgis() to remove the provider and# layer registries from memoryqgs.exitQgis()
Now you can work with QGIS API — load layers and do some processing or fire up a GUI with a map canvas.The possibilities are endless :-)
1.4.3 Executando aplicativos personalizados
You will need to tell your system where to search for QGIS libraries and appropriate Python modules if they arenot in a well-known location — otherwise Python will complain:
>>> import qgis.coreImportError: No module named qgis.core
This can be fixed by setting the PYTHONPATH environment variable. In the following commands, qgispathshould be replaced with your actual QGIS installation path:
• no Linux: export PYTHONPATH=/qgispath/share/qgis/python
• no Windows: set PYTHONPATH=c:\qgispath\python
4 Chapter 1. Introdução

PyQGIS developer cookbook, Versão 2.14
The path to the PyQGIS modules is now known, however they depend on qgis_core and qgis_gui libraries(the Python modules serve only as wrappers). Path to these libraries is typically unknown for the operating system,so you get an import error again (the message might vary depending on the system):
>>> import qgis.coreImportError: libqgis_core.so.1.5.0: cannot open shared object file: No such file or directory
Fix this by adding the directories where the QGIS libraries reside to search path of the dynamic linker:
• no Linux: export LD_LIBRARY_PATH=/qgispath/lib
• no Windows: set PATH=C:\qgispath;%PATH%
These commands can be put into a bootstrap script that will take care of the startup. When deploying customapplications using PyQGIS, there are usually two possibilities:
• require user to install QGIS on his platform prior to installing your application. The application installershould look for default locations of QGIS libraries and allow user to set the path if not found. This approachhas the advantage of being simpler, however it requires user to do more steps.
• package QGIS together with your application. Releasing the application may be more challenging and thepackage will be larger, but the user will be saved from the burden of downloading and installing additionalpieces of software.
The two deployment models can be mixed - deploy standalone application on Windows and Mac OS X, for Linuxleave the installation of QGIS up to user and his package manager.
1.4. Aplicações Python 5
PyQGIS developer cookbook, Versão 2.14
6 Chapter 1. Introdução

CHAPTER 2
Carregando projetos
Sometimes you need to load an existing project from a plugin or (more often) when developing a stand-aloneQGIS Python application (see: Aplicações Python).
To load a project into the current QGIS application you need a QgsProject instance() object and call itsread() method passing to it a QFileInfo object that contains the path from where the project will be loaded:
# If you are not inside a QGIS console you first need to import# qgis and PyQt4 classes you will use in this script as shown below:from qgis.core import QgsProjectfrom PyQt4.QtCore import QFileInfo# Get the project instanceproject = QgsProject.instance()# Print the current project file name (might be empty in case no projects have been loaded)print project.fileNameu’/home/user/projects/my_qgis_project.qgs’# Load another projectproject.read(QFileInfo(’/home/user/projects/my_other_qgis_project.qgs’))print project.fileNameu’/home/user/projects/my_other_qgis_project.qgs’
In case you need to make some modifications to the project (for example add or remove some layers) and saveyour changes, you can call the write() method of your project instance. The write() method also accepts anoptional QFileInfo that allows you to specify a path where the project will be saved:
# Save the project to the sameproject.write()# ... or to a new fileproject.write(QFileInfo(’/home/user/projects/my_new_qgis_project.qgs’))
Both read() and write() funtions return a boolean value that you can use to check if the operation wassuccessful.
Nota: If you are writing a QGIS standalone application, in order to synchronise the loaded project with the canvasyou need to instanciate a QgsLayerTreeMapCanvasBridge as in the example below:
bridge = QgsLayerTreeMapCanvasBridge( \QgsProject.instance().layerTreeRoot(), canvas)
# Now you can safely load your project and see it in the canvasproject.read(QFileInfo(’/home/user/projects/my_other_qgis_project.qgs’))
7
PyQGIS developer cookbook, Versão 2.14
8 Chapter 2. Carregando projetos
CHAPTER 3
Carregando Camadas
• Camadas Vetoriais• Camadas Matriciais• Registro de Camada de Mapa
Vamos abrir algumas camadas com dados. QGIS reconhece camadas vetoriais e matriciais. Adicionalmente,camadas personalizadas estão disponíveis, mas não discutiremos este tipo de camadas aqui.
3.1 Camadas Vetoriais
To load a vector layer, specify layer’s data source identifier, name for the layer and provider’s name:
layer = QgsVectorLayer(data_source, layer_name, provider_name)if not layer.isValid():print "Layer failed to load!"
O identificador da fonte de dados é uma string e é especifico para cada provedor de dados vetoriais. O nome dacamada é usado no painel de lista de camadas. É importante verificar se a camada foi carregada com sucesso. Senão for, uma instância de camada inválida é retornada.
The quickest way to open and display a vector layer in QGIS is the addVectorLayer function of theQgisInterface:
layer = iface.addVectorLayer("/path/to/shapefile/file.shp", "layer name you like", "ogr")if not layer:print "Layer failed to load!"
This creates a new layer and adds it to the map layer registry (making it appear in the layer list) in one step. Thefunction returns the layer instance or None if the layer couldn’t be loaded.
A lista a seguir mostra como acessar várias fontes de dados usando provedores de dados vetoriais:
• OGR library (shapefiles and many other file formats) — data source is the path to the file:
– for shapefile:
vlayer = QgsVectorLayer("/path/to/shapefile/file.shp", "layer_name_you_like", "ogr")
– for dxf (note the internal options in data source uri):
uri = "/path/to/dxffile/file.dxf|layername=entities|geometrytype=Point"vlayer = QgsVectorLayer(uri, "layer_name_you_like", "ogr")
• PostGIS database — data source is a string with all information needed to create a connection to PostgreSQLdatabase. QgsDataSourceURI class can generate this string for you. Note that QGIS has to be compiledwith Postgres support, otherwise this provider isn’t available:
9
PyQGIS developer cookbook, Versão 2.14
uri = QgsDataSourceURI()# set host name, port, database name, username and passworduri.setConnection("localhost", "5432", "dbname", "johny", "xxx")# set database schema, table name, geometry column and optionally# subset (WHERE clause)uri.setDataSource("public", "roads", "the_geom", "cityid = 2643")
vlayer = QgsVectorLayer(uri.uri(), "layer name you like", "postgres")
• CSV or other delimited text files — to open a file with a semicolon as a delimiter, with field “x” for x-coordinate and field “y” with y-coordinate you would use something like this:
uri = "/some/path/file.csv?delimiter=%s&xField=%s&yField=%s" % (";", "x", "y")vlayer = QgsVectorLayer(uri, "layer name you like", "delimitedtext")
Note: from QGIS version 1.7 the provider string is structured as a URL, so the path must be prefixed withfile://. Also it allows WKT (well known text) formatted geometries as an alternative to “x” and “y” fields,and allows the coordinate reference system to be specified. For example:
uri = "file:///some/path/file.csv?delimiter=%s&crs=epsg:4723&wktField=%s" % (";", "shape")
• GPX files — the “gpx” data provider reads tracks, routes and waypoints from gpx files. To open a file, thetype (track/route/waypoint) needs to be specified as part of the url:
uri = "path/to/gpx/file.gpx?type=track"vlayer = QgsVectorLayer(uri, "layer name you like", "gpx")
• SpatiaLite database — supported from QGIS v1.1. Similarly to PostGIS databases, QgsDataSourceURIcan be used for generation of data source identifier:
uri = QgsDataSourceURI()uri.setDatabase(’/home/martin/test-2.3.sqlite’)schema = ’’table = ’Towns’geom_column = ’Geometry’uri.setDataSource(schema, table, geom_column)
display_name = ’Towns’vlayer = QgsVectorLayer(uri.uri(), display_name, ’spatialite’)
• MySQL WKB-based geometries, through OGR — data source is the connection string to the table:
uri = "MySQL:dbname,host=localhost,port=3306,user=root,password=xxx|layername=my_table"vlayer = QgsVectorLayer( uri, "my table", "ogr" )
• WFS connection:. the connection is defined with a URI and using the WFS provider:
uri = "http://localhost:8080/geoserver/wfs?srsname=EPSG:23030&typename=union&version=1.0.0&request=GetFeature&service=WFS",vlayer = QgsVectorLayer(uri, "my wfs layer", "WFS")
The uri can be created using the standard urllib library:
params = {’service’: ’WFS’,’version’: ’1.0.0’,’request’: ’GetFeature’,’typename’: ’union’,’srsname’: "EPSG:23030"
}uri = ’http://localhost:8080/geoserver/wfs?’ + urllib.unquote(urllib.urlencode(params))
Nota: You can change the data source of an existing layer by calling setDataSource() on aQgsVectorLayer instance, as in the following example:
10 Chapter 3. Carregando Camadas

PyQGIS developer cookbook, Versão 2.14
# layer is a vector layer, uri is a QgsDataSourceURI instancelayer.setDataSource(uri.uri(), "layer name you like", "postgres")
3.2 Camadas Matriciais
For accessing raster files, GDAL library is used. It supports a wide range of file formats. In case you have troubleswith opening some files, check whether your GDAL has support for the particular format (not all formats areavailable by default). To load a raster from a file, specify its file name and base name:
fileName = "/path/to/raster/file.tif"fileInfo = QFileInfo(fileName)baseName = fileInfo.baseName()rlayer = QgsRasterLayer(fileName, baseName)if not rlayer.isValid():print "Layer failed to load!"
Similarly to vector layers, raster layers can be loaded using the addRasterLayer function of the QgisInterface:
iface.addRasterLayer("/path/to/raster/file.tif", "layer name you like")
Isto cria uma nova camada e adiciona ao registro de camadas do mapa (fazendo ele aparecer na lista de camadas)em um passo.
Raster layers can also be created from a WCS service:
layer_name = ’modis’uri = QgsDataSourceURI()uri.setParam(’url’, ’http://demo.mapserver.org/cgi-bin/wcs’)uri.setParam("identifier", layer_name)rlayer = QgsRasterLayer(str(uri.encodedUri()), ’my wcs layer’, ’wcs’)
detailed URI settings can be found in provider documentation
Alternatively you can load a raster layer from WMS server. However currently it’s not possible to access GetCa-pabilities response from API — you have to know what layers you want:
urlWithParams = ’url=http://wms.jpl.nasa.gov/wms.cgi&layers=global_mosaic&styles=pseudo&format=image/jpeg&crs=EPSG:4326’rlayer = QgsRasterLayer(urlWithParams, ’some layer name’, ’wms’)if not rlayer.isValid():print "Layer failed to load!"
3.3 Registro de Camada de Mapa
Se você gostaria de usar as camadas abertas para renderização, não se esqueça de adicioná-los ao registro dacamada de mapa. O registro camada de mapa apropria-se das camadas e podem ser mais tarde acessadas a partirde qualquer parte do aplicativo pelo seu ID único. Quando a camada é removida do registro camada do mapa, eleé excluído, também.
Adding a layer to the registry:
QgsMapLayerRegistry.instance().addMapLayer(layer)
Layers are destroyed automatically on exit, however if you want to delete the layer explicitly, use:
QgsMapLayerRegistry.instance().removeMapLayer(layer_id)
For a list of loaded layers and layer ids, use:
3.2. Camadas Matriciais 11

PyQGIS developer cookbook, Versão 2.14
QgsMapLayerRegistry.instance().mapLayers()
12 Chapter 3. Carregando Camadas
CHAPTER 4
Usando Camadas Raster
• Detalhes da Camada• Renderer
– Rasters única banda– Rasters Multi Banda
• Atualizando camadas• Query Values
Esta seção lista várias operações que você pode fazer com camadas raster.
4.1 Detalhes da Camada
A raster layer consists of one or more raster bands — it is referred to as either single band or multi band raster.One band represents a matrix of values. Usual color image (e.g. aerial photo) is a raster consisting of red, blue andgreen band. Single band layers typically represent either continuous variables (e.g. elevation) or discrete variables(e.g. land use). In some cases, a raster layer comes with a palette and raster values refer to colors stored in thepalette:
rlayer.width(), rlayer.height()(812, 301)rlayer.extent()<qgis._core.QgsRectangle object at 0x000000000F8A2048>rlayer.extent().toString()u’12.095833,48.552777 : 18.863888,51.056944’rlayer.rasterType()2 # 0 = GrayOrUndefined (single band), 1 = Palette (single band), 2 = Multibandrlayer.bandCount()3rlayer.metadata()u’<p class="glossy">Driver:</p>...’rlayer.hasPyramids()False
4.2 Renderer
When a raster layer is loaded, it gets a default renderer based on its type. It can be altered either in raster layerproperties or programmatically.
To query the current renderer:
13
PyQGIS developer cookbook, Versão 2.14
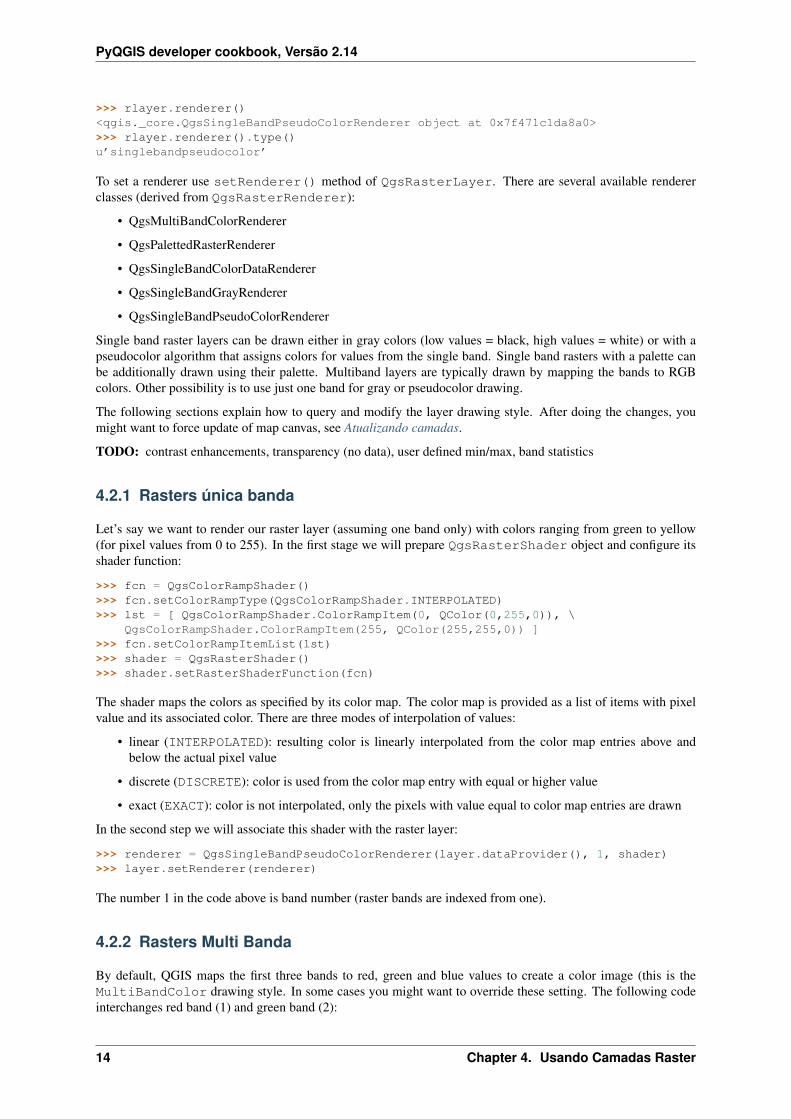
>>> rlayer.renderer()<qgis._core.QgsSingleBandPseudoColorRenderer object at 0x7f471c1da8a0>>>> rlayer.renderer().type()u’singlebandpseudocolor’
To set a renderer use setRenderer() method of QgsRasterLayer. There are several available rendererclasses (derived from QgsRasterRenderer):
• QgsMultiBandColorRenderer
• QgsPalettedRasterRenderer
• QgsSingleBandColorDataRenderer
• QgsSingleBandGrayRenderer
• QgsSingleBandPseudoColorRenderer
Single band raster layers can be drawn either in gray colors (low values = black, high values = white) or with apseudocolor algorithm that assigns colors for values from the single band. Single band rasters with a palette canbe additionally drawn using their palette. Multiband layers are typically drawn by mapping the bands to RGBcolors. Other possibility is to use just one band for gray or pseudocolor drawing.
The following sections explain how to query and modify the layer drawing style. After doing the changes, youmight want to force update of map canvas, see Atualizando camadas.
TODO: contrast enhancements, transparency (no data), user defined min/max, band statistics
4.2.1 Rasters única banda
Let’s say we want to render our raster layer (assuming one band only) with colors ranging from green to yellow(for pixel values from 0 to 255). In the first stage we will prepare QgsRasterShader object and configure itsshader function:
>>> fcn = QgsColorRampShader()>>> fcn.setColorRampType(QgsColorRampShader.INTERPOLATED)>>> lst = [ QgsColorRampShader.ColorRampItem(0, QColor(0,255,0)), \
QgsColorRampShader.ColorRampItem(255, QColor(255,255,0)) ]>>> fcn.setColorRampItemList(lst)>>> shader = QgsRasterShader()>>> shader.setRasterShaderFunction(fcn)
The shader maps the colors as specified by its color map. The color map is provided as a list of items with pixelvalue and its associated color. There are three modes of interpolation of values:
• linear (INTERPOLATED): resulting color is linearly interpolated from the color map entries above andbelow the actual pixel value
• discrete (DISCRETE): color is used from the color map entry with equal or higher value
• exact (EXACT): color is not interpolated, only the pixels with value equal to color map entries are drawn
In the second step we will associate this shader with the raster layer:
>>> renderer = QgsSingleBandPseudoColorRenderer(layer.dataProvider(), 1, shader)>>> layer.setRenderer(renderer)
The number 1 in the code above is band number (raster bands are indexed from one).
4.2.2 Rasters Multi Banda
By default, QGIS maps the first three bands to red, green and blue values to create a color image (this is theMultiBandColor drawing style. In some cases you might want to override these setting. The following codeinterchanges red band (1) and green band (2):
14 Chapter 4. Usando Camadas Raster
PyQGIS developer cookbook, Versão 2.14
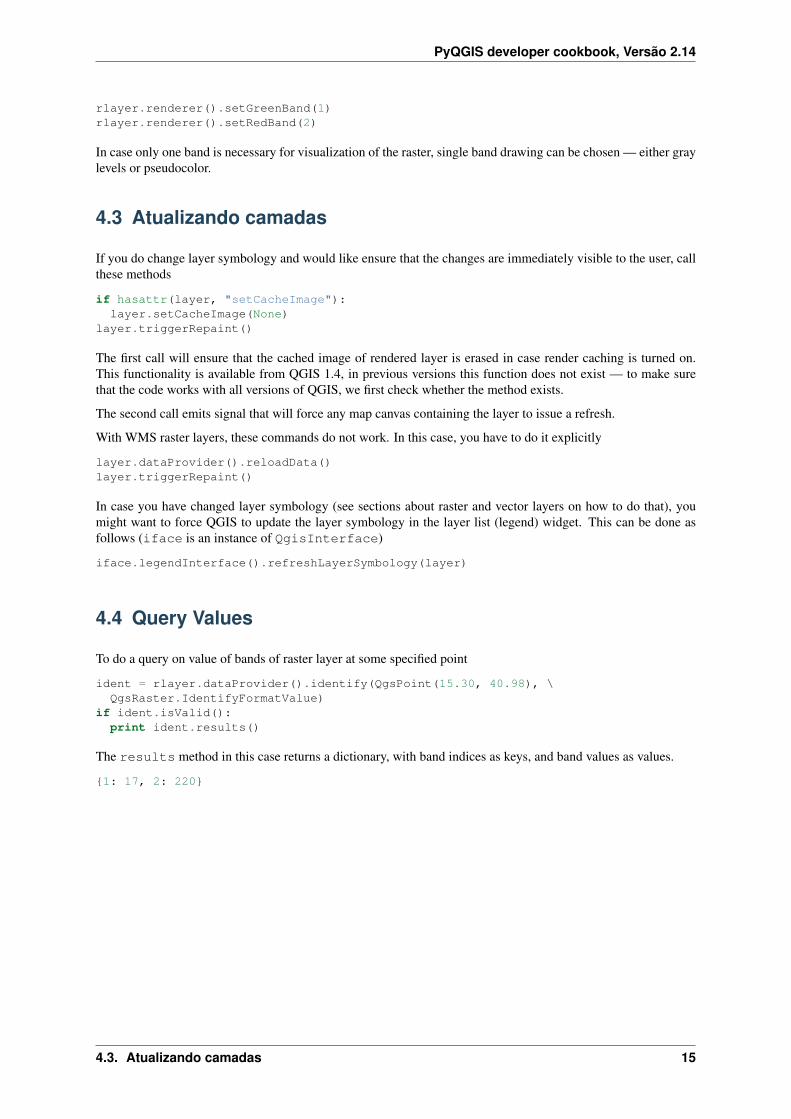
rlayer.renderer().setGreenBand(1)rlayer.renderer().setRedBand(2)
In case only one band is necessary for visualization of the raster, single band drawing can be chosen — either graylevels or pseudocolor.
4.3 Atualizando camadas
If you do change layer symbology and would like ensure that the changes are immediately visible to the user, callthese methods
if hasattr(layer, "setCacheImage"):layer.setCacheImage(None)
layer.triggerRepaint()
The first call will ensure that the cached image of rendered layer is erased in case render caching is turned on.This functionality is available from QGIS 1.4, in previous versions this function does not exist — to make surethat the code works with all versions of QGIS, we first check whether the method exists.
The second call emits signal that will force any map canvas containing the layer to issue a refresh.
With WMS raster layers, these commands do not work. In this case, you have to do it explicitly
layer.dataProvider().reloadData()layer.triggerRepaint()
In case you have changed layer symbology (see sections about raster and vector layers on how to do that), youmight want to force QGIS to update the layer symbology in the layer list (legend) widget. This can be done asfollows (iface is an instance of QgisInterface)
iface.legendInterface().refreshLayerSymbology(layer)
4.4 Query Values
To do a query on value of bands of raster layer at some specified point
ident = rlayer.dataProvider().identify(QgsPoint(15.30, 40.98), \QgsRaster.IdentifyFormatValue)
if ident.isValid():print ident.results()
The results method in this case returns a dictionary, with band indices as keys, and band values as values.
{1: 17, 2: 220}
4.3. Atualizando camadas 15

PyQGIS developer cookbook, Versão 2.14
16 Chapter 4. Usando Camadas Raster

CHAPTER 5
Usando Camadas Vetor
• Retrieving information about attributes• Selecionando características• Interagindo sobre camada vetor
– Acessando atributos– Iteração sobre os feições selecionadas– Iterando sobre um subconjunto de feições
• Modificando Camadas Vetoriais– Adicionar feições– Excluir feições– Modificar Feições– Adicionando e Removendo Campos
• Modificando Camadas Vetoriais com um Buffer• Utilizando Índices Espaciais• Escrevendo Camadas Vetoriais• provedor de Memória• Aparencia (Simbologia) de Camadas de Vetor
– Single Symbol Renderer– Categorized Symbol Renderer– Graduated Symbol Renderer– Trabalhando com Símbolos
* Trabalhando com Camadas de Símbolos* Creating Custom Symbol Layer Types
– Creating Custom Renderers• Outros Tópicos
Esta seção lista várias operações que podem ser realizadas com camadas vetoriais.
5.1 Retrieving information about attributes
You can retrieve information about the fields associated with a vector layer by calling pendingFields() on aQgsVectorLayer instance:
# "layer" is a QgsVectorLayer instancefor field in layer.pendingFields():
print field.name(), field.typeName()
Nota: Starting from QGIS 2.12 there is also a fields() in QgsVectorLayer which is an alias topendingFields().
17
PyQGIS developer cookbook, Versão 2.14
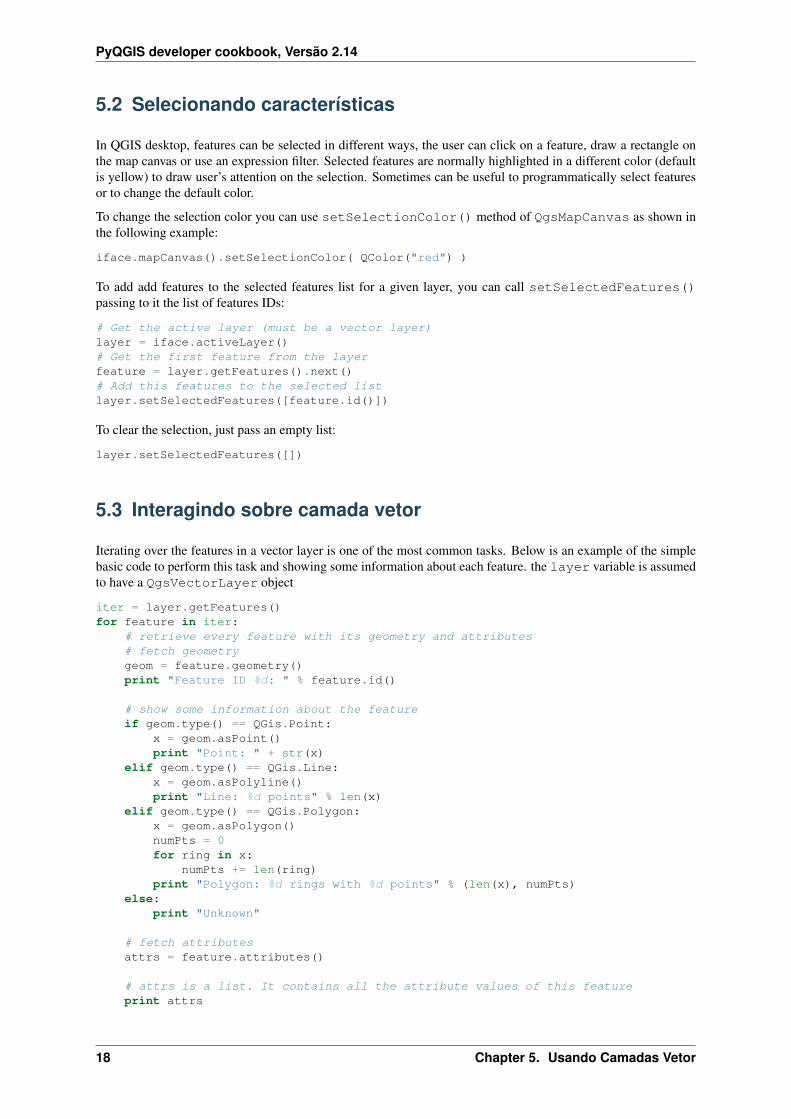
5.2 Selecionando características
In QGIS desktop, features can be selected in different ways, the user can click on a feature, draw a rectangle onthe map canvas or use an expression filter. Selected features are normally highlighted in a different color (defaultis yellow) to draw user’s attention on the selection. Sometimes can be useful to programmatically select featuresor to change the default color.
To change the selection color you can use setSelectionColor() method of QgsMapCanvas as shown inthe following example:
iface.mapCanvas().setSelectionColor( QColor("red") )
To add add features to the selected features list for a given layer, you can call setSelectedFeatures()passing to it the list of features IDs:
# Get the active layer (must be a vector layer)layer = iface.activeLayer()# Get the first feature from the layerfeature = layer.getFeatures().next()# Add this features to the selected listlayer.setSelectedFeatures([feature.id()])
To clear the selection, just pass an empty list:
layer.setSelectedFeatures([])
5.3 Interagindo sobre camada vetor
Iterating over the features in a vector layer is one of the most common tasks. Below is an example of the simplebasic code to perform this task and showing some information about each feature. the layer variable is assumedto have a QgsVectorLayer object
iter = layer.getFeatures()for feature in iter:
# retrieve every feature with its geometry and attributes# fetch geometrygeom = feature.geometry()print "Feature ID %d: " % feature.id()
# show some information about the featureif geom.type() == QGis.Point:
x = geom.asPoint()print "Point: " + str(x)
elif geom.type() == QGis.Line:x = geom.asPolyline()print "Line: %d points" % len(x)
elif geom.type() == QGis.Polygon:x = geom.asPolygon()numPts = 0for ring in x:
numPts += len(ring)print "Polygon: %d rings with %d points" % (len(x), numPts)
else:print "Unknown"
# fetch attributesattrs = feature.attributes()
# attrs is a list. It contains all the attribute values of this featureprint attrs
18 Chapter 5. Usando Camadas Vetor

PyQGIS developer cookbook, Versão 2.14
5.3.1 Acessando atributos
Atributos podem ser refenciados pelo nome
print feature[’name’]
Alternatively, attributes can be referred to by index. This is will be a bit faster than using the name. For example,to get the first attribute:
print feature[0]
5.3.2 Iteração sobre os feições selecionadas
if you only need selected features, you can use the selectedFeatures() method from vector layer:
selection = layer.selectedFeatures()print len(selection)for feature in selection:
# do whatever you need with the feature
Outra opção é o metódo de processamento features()
import processingfeatures = processing.features(layer)for feature in features:
# do whatever you need with the feature
By default, this will iterate over all the features in the layer, in case there is no selection, or over the selectedfeatures otherwise. Note that this behavior can be changed in the Processing options to ignore selections.
5.3.3 Iterando sobre um subconjunto de feições
Se você quer iterar sobre um conjunto de feições em uma camada, como por exemplo em uma determinada área,você precisa adicionar um objeto QgsFeatureRequest para a função getFeatures(). Segue um exemplo
request = QgsFeatureRequest()request.setFilterRect(areaOfInterest)for feature in layer.getFeatures(request):
# do whatever you need with the feature
If you need an attribute-based filter instead (or in addition) of a spatial one like shown in the example above, youcan build an QgsExpression object and pass it to the QgsFeatureRequest constructor. Here’s an example
# The expression will filter the features where the field "location_name" contains# the word "Lake" (case insensitive)exp = QgsExpression(’location_name ILIKE \’%Lake%\’’)request = QgsFeatureRequest(exp)
See Expressões, filtragem e cálculo dos valores for the details about the syntax supported by QgsExpression.
The request can be used to define the data retrieved for each feature, so the iterator returns all features, but returnspartial data for each of them.
# Only return selected fieldsrequest.setSubsetOfAttributes([0,2])# More user friendly versionrequest.setSubsetOfAttributes([’name’,’id’],layer.pendingFields())# Don’t return geometry objectsrequest.setFlags(QgsFeatureRequest.NoGeometry)
Dica: If you only need a subset of the attributes or you don’t need the geometry information, you can significantly
5.3. Interagindo sobre camada vetor 19

PyQGIS developer cookbook, Versão 2.14
increase the speed of the features request by using QgsFeatureRequest.NoGeometry flag or specifying asubset of attributes (possibly empty) like shown in the example above.
5.4 Modificando Camadas Vetoriais
Most vector data providers support editing of layer data. Sometimes they support just a subset of possible editingactions. Use the capabilities() function to find out what set of functionality is supported
caps = layer.dataProvider().capabilities()# Check if a particular capability is supported:caps & QgsVectorDataProvider.DeleteFeatures# Print 2 if DeleteFeatures is supported
For a list of all available capabilities, please refer to the API Documentation of QgsVectorDataProvider
To print layer’s capabilities textual description in a comma separated list you can usecapabilitiesString() as in the following example:
caps_string = layer.dataProvider().capabilitiesString()# Print:# u’Add Features, Delete Features, Change Attribute Values,# Add Attributes, Delete Attributes, Create Spatial Index,# Fast Access to Features at ID, Change Geometries,# Simplify Geometries with topological validation’
By using any of the following methods for vector layer editing, the changes are directly committed to the underly-ing data store (a file, database etc). In case you would like to do only temporary changes, skip to the next sectionthat explains how to do modifications with editing buffer.
Nota: If you are working inside QGIS (either from the console or from a plugin), it might be necessary to force aredraw of the map canvas in order to see the changes you’ve done to the geometry, to the style or to the attributes:
# If caching is enabled, a simple canvas refresh might not be sufficient# to trigger a redraw and you must clear the cached image for the layerif iface.mapCanvas().isCachingEnabled():
layer.setCacheImage(None)else:
iface.mapCanvas().refresh()
5.4.1 Adicionar feições
Create some QgsFeature instances and pass a list of them to provider’s addFeatures() method. It willreturn two values: result (true/false) and list of added features (their ID is set by the data store).
To set up the attributes you can either initialize the feature passing a QgsFields instance or callinitAttributes() passing the number of fields you want to be added.
if caps & QgsVectorDataProvider.AddFeatures:feat = QgsFeature(layer.pendingFields())feat.setAttributes([0, ’hello’])# Or set a single attribute by key or by index:feat.setAttribute(’name’, ’hello’)feat.setAttribute(0, ’hello’)feat.setGeometry(QgsGeometry.fromPoint(QgsPoint(123, 456)))(res, outFeats) = layer.dataProvider().addFeatures([feat])
20 Chapter 5. Usando Camadas Vetor
PyQGIS developer cookbook, Versão 2.14
5.4.2 Excluir feições
Para excluir algumas características, apenas providencie a lista com a identificação das características
if caps & QgsVectorDataProvider.DeleteFeatures:res = layer.dataProvider().deleteFeatures([5, 10])
5.4.3 Modificar Feições
It is possible to either change feature’s geometry or to change some attributes. The following example first changesvalues of attributes with index 0 and 1, then it changes the feature’s geometry
fid = 100 # ID of the feature we will modify
if caps & QgsVectorDataProvider.ChangeAttributeValues:attrs = { 0 : "hello", 1 : 123 }layer.dataProvider().changeAttributeValues({ fid : attrs })
if caps & QgsVectorDataProvider.ChangeGeometries:geom = QgsGeometry.fromPoint(QgsPoint(111,222))layer.dataProvider().changeGeometryValues({ fid : geom })
Dica: If you only need to change geometries, you might consider using the QgsVectorLayerEditUtilswhich provides some of useful methods to edit geometries (translate, insert or move vertex etc.)
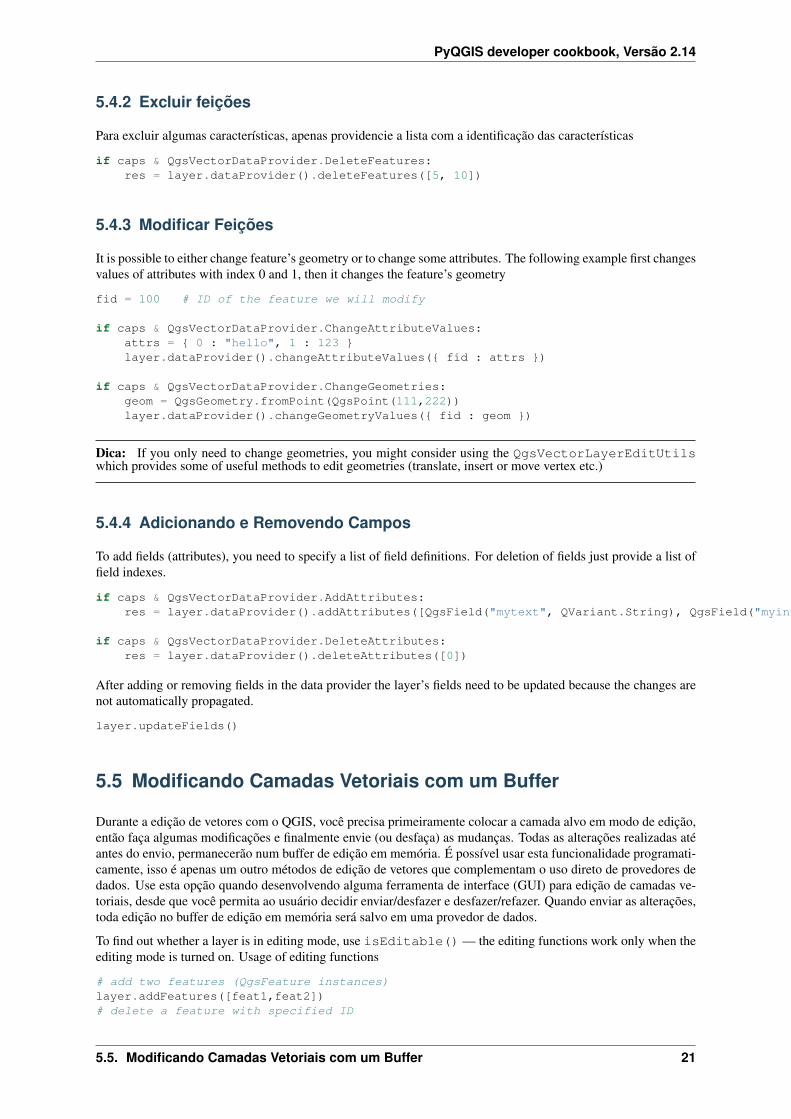
5.4.4 Adicionando e Removendo Campos
To add fields (attributes), you need to specify a list of field definitions. For deletion of fields just provide a list offield indexes.
if caps & QgsVectorDataProvider.AddAttributes:res = layer.dataProvider().addAttributes([QgsField("mytext", QVariant.String), QgsField("myint", QVariant.Int)])
if caps & QgsVectorDataProvider.DeleteAttributes:res = layer.dataProvider().deleteAttributes([0])
After adding or removing fields in the data provider the layer’s fields need to be updated because the changes arenot automatically propagated.
layer.updateFields()
5.5 Modificando Camadas Vetoriais com um Buffer
Durante a edição de vetores com o QGIS, você precisa primeiramente colocar a camada alvo em modo de edição,então faça algumas modificações e finalmente envie (ou desfaça) as mudanças. Todas as alterações realizadas atéantes do envio, permanecerão num buffer de edição em memória. É possível usar esta funcionalidade programati-camente, isso é apenas um outro métodos de edição de vetores que complementam o uso direto de provedores dedados. Use esta opção quando desenvolvendo alguma ferramenta de interface (GUI) para edição de camadas ve-toriais, desde que você permita ao usuário decidir enviar/desfazer e desfazer/refazer. Quando enviar as alterações,toda edição no buffer de edição em memória será salvo em uma provedor de dados.
To find out whether a layer is in editing mode, use isEditable() — the editing functions work only when theediting mode is turned on. Usage of editing functions
# add two features (QgsFeature instances)layer.addFeatures([feat1,feat2])# delete a feature with specified ID
5.5. Modificando Camadas Vetoriais com um Buffer 21

PyQGIS developer cookbook, Versão 2.14
layer.deleteFeature(fid)
# set new geometry (QgsGeometry instance) for a featurelayer.changeGeometry(fid, geometry)# update an attribute with given field index (int) to given value (QVariant)layer.changeAttributeValue(fid, fieldIndex, value)
# add new fieldlayer.addAttribute(QgsField("mytext", QVariant.String))# remove a fieldlayer.deleteAttribute(fieldIndex)
In order to make undo/redo work properly, the above mentioned calls have to be wrapped into undo commands.(If you do not care about undo/redo and want to have the changes stored immediately, then you will have easierwork by editing with data provider.) How to use the undo functionality
layer.beginEditCommand("Feature triangulation")
# ... call layer’s editing methods ...
if problem_occurred:layer.destroyEditCommand()return
# ... more editing ...
layer.endEditCommand()
The beginEditCommand() will create an internal “active” command and will record subsequent changesin vector layer. With the call to endEditCommand() the command is pushed onto the undo stack andthe user will be able to undo/redo it from GUI. In case something went wrong while doing the changes, thedestroyEditCommand() method will remove the command and rollback all changes done while this com-mand was active.
To start editing mode, there is startEditing() method, to stop editing there are commitChanges() androllBack()— however normally you should not need these methods and leave this functionality to be triggeredby the user.
You can also use the with edit(layer)-statement to wrap commit and rollback into a more semantic codeblock as shown in the example below:
with edit(layer):f = layer.getFeatures().next()f[0] = 5layer.updateFeature(f)
This will automatically call commitChanges() in the end. If any exception occurs, it will rollBack() allthe changes. In case a problem is encountered within commitChanges() (when the method returns False) aQgsEditError exception will be raised.
5.6 Utilizando Índices Espaciais
Spatial indexes can dramatically improve the performance of your code if you need to do frequent queries to avector layer. Imagine, for instance, that you are writing an interpolation algorithm, and that for a given location youneed to know the 10 closest points from a points layer, in order to use those point for calculating the interpolatedvalue. Without a spatial index, the only way for QGIS to find those 10 points is to compute the distance from eachand every point to the specified location and then compare those distances. This can be a very time consumingtask, especially if it needs to be repeated for several locations. If a spatial index exists for the layer, the operationis much more effective.
22 Chapter 5. Usando Camadas Vetor

PyQGIS developer cookbook, Versão 2.14
Think of a layer without a spatial index as a telephone book in which telephone numbers are not ordered orindexed. The only way to find the telephone number of a given person is to read from the beginning until you findit.
Spatial indexes are not created by default for a QGIS vector layer, but you can create them easily. This is whatyou have to do:
• criar um índice espacial — o seguinte código cria um índice vazio.
index = QgsSpatialIndex()
• add features to index — index takes QgsFeature object and adds it to the internal data structure.You can create the object manually or use one from previous call to provider’s nextFeature()
index.insertFeature(feat)
• uma vez que o índice espacial é preenchido com alguns valores, você pode fazer algumas consultas
# returns array of feature IDs of five nearest featuresnearest = index.nearestNeighbor(QgsPoint(25.4, 12.7), 5)
# returns array of IDs of features which intersect the rectangleintersect = index.intersects(QgsRectangle(22.5, 15.3, 23.1, 17.2))
5.7 Escrevendo Camadas Vetoriais
Você pode escrever um arquivo de camada vetorial utilizando a classe QgsVectorFileWriter. Ela atende aqualquer outro tipo de arquivo vetorial com suporte OGR (shapefiles, GeoJSON, KML e outros).
Há duas possibilidades de exportação de camadas vetoriais:
• from an instance of QgsVectorLayer
error = QgsVectorFileWriter.writeAsVectorFormat(layer, "my_shapes.shp", "CP1250", None, "ESRI Shapefile")
if error == QgsVectorFileWriter.NoError:print "success!"
error = QgsVectorFileWriter.writeAsVectorFormat(layer, "my_json.json", "utf-8", None, "GeoJSON")if error == QgsVectorFileWriter.NoError:
print "success again!"
The third parameter specifies output text encoding. Only some drivers need thisfor correct operation - shapefiles are one of those --- however in case youare not using international characters you do not have to care much aboutthe encoding. The fourth parameter that we left as ‘‘None‘‘ may specifydestination CRS --- if a valid instance of :class:‘QgsCoordinateReferenceSystem‘is passed, the layer is transformed to that CRS.
For valid driver names please consult the ‘supported formats by OGR‘_ --- youshould pass the value in the "Code" column as the driver name. Optionallyyou can set whether to export only selected features, pass furtherdriver-specific options for creation or tell the writer not to createattributes --- look into the documentation for full syntax.
• diretamente das características
# define fields for feature attributes. A QgsFields object is neededfields = QgsFields()fields.append(QgsField("first", QVariant.Int))fields.append(QgsField("second", QVariant.String))
# create an instance of vector file writer, which will create the vector file.
5.7. Escrevendo Camadas Vetoriais 23
PyQGIS developer cookbook, Versão 2.14
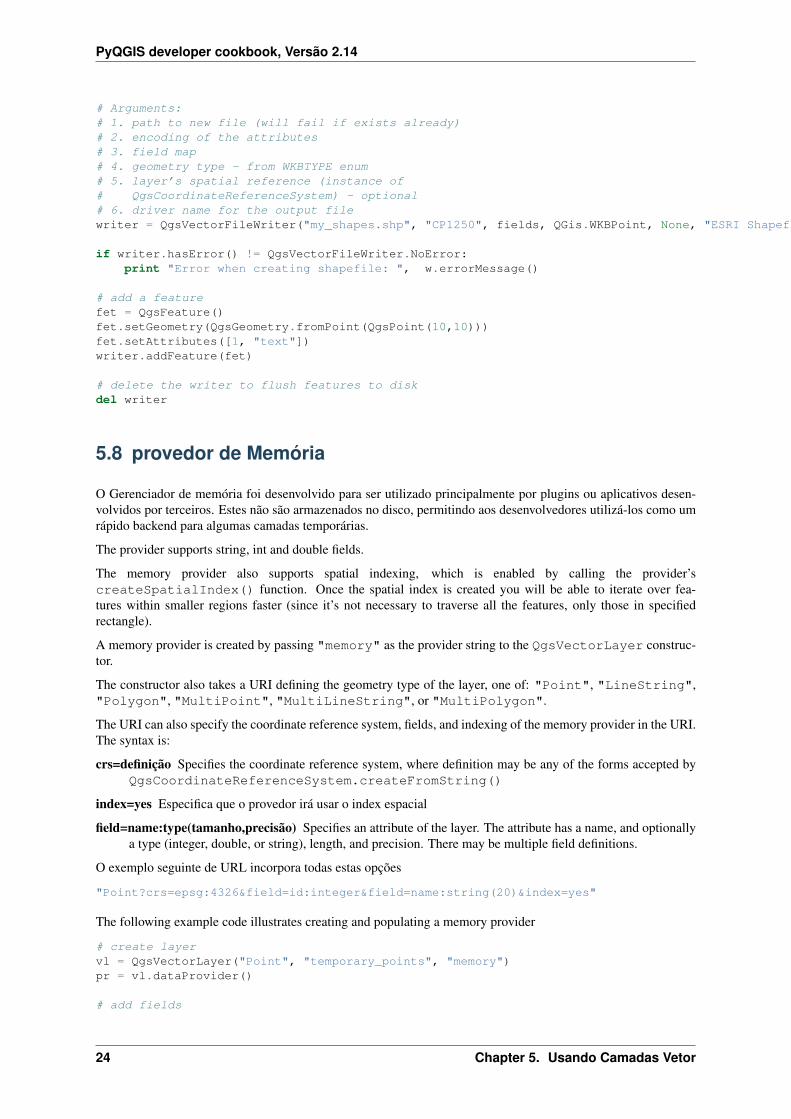
# Arguments:# 1. path to new file (will fail if exists already)# 2. encoding of the attributes# 3. field map# 4. geometry type - from WKBTYPE enum# 5. layer’s spatial reference (instance of# QgsCoordinateReferenceSystem) - optional# 6. driver name for the output filewriter = QgsVectorFileWriter("my_shapes.shp", "CP1250", fields, QGis.WKBPoint, None, "ESRI Shapefile")
if writer.hasError() != QgsVectorFileWriter.NoError:print "Error when creating shapefile: ", w.errorMessage()
# add a featurefet = QgsFeature()fet.setGeometry(QgsGeometry.fromPoint(QgsPoint(10,10)))fet.setAttributes([1, "text"])writer.addFeature(fet)
# delete the writer to flush features to diskdel writer
5.8 provedor de Memória
O Gerenciador de memória foi desenvolvido para ser utilizado principalmente por plugins ou aplicativos desen-volvidos por terceiros. Estes não são armazenados no disco, permitindo aos desenvolvedores utilizá-los como umrápido backend para algumas camadas temporárias.
The provider supports string, int and double fields.
The memory provider also supports spatial indexing, which is enabled by calling the provider’screateSpatialIndex() function. Once the spatial index is created you will be able to iterate over fea-tures within smaller regions faster (since it’s not necessary to traverse all the features, only those in specifiedrectangle).
A memory provider is created by passing "memory" as the provider string to the QgsVectorLayer construc-tor.
The constructor also takes a URI defining the geometry type of the layer, one of: "Point", "LineString","Polygon", "MultiPoint", "MultiLineString", or "MultiPolygon".
The URI can also specify the coordinate reference system, fields, and indexing of the memory provider in the URI.The syntax is:
crs=definição Specifies the coordinate reference system, where definition may be any of the forms accepted byQgsCoordinateReferenceSystem.createFromString()
index=yes Especifica que o provedor irá usar o index espacial
field=name:type(tamanho,precisão) Specifies an attribute of the layer. The attribute has a name, and optionallya type (integer, double, or string), length, and precision. There may be multiple field definitions.
O exemplo seguinte de URL incorpora todas estas opções
"Point?crs=epsg:4326&field=id:integer&field=name:string(20)&index=yes"
The following example code illustrates creating and populating a memory provider
# create layervl = QgsVectorLayer("Point", "temporary_points", "memory")pr = vl.dataProvider()
# add fields
24 Chapter 5. Usando Camadas Vetor

PyQGIS developer cookbook, Versão 2.14
pr.addAttributes([QgsField("name", QVariant.String),QgsField("age", QVariant.Int),QgsField("size", QVariant.Double)])
vl.updateFields() # tell the vector layer to fetch changes from the provider
# add a featurefet = QgsFeature()fet.setGeometry(QgsGeometry.fromPoint(QgsPoint(10,10)))fet.setAttributes(["Johny", 2, 0.3])pr.addFeatures([fet])
# update layer’s extent when new features have been added# because change of extent in provider is not propagated to the layervl.updateExtents()
Finally, let’s check whether everything went well
# show some statsprint "fields:", len(pr.fields())print "features:", pr.featureCount()e = layer.extent()print "extent:", e.xMiniminum(), e.yMinimum(), e.xMaximum(), e.yMaximum()
# iterate over featuresf = QgsFeature()features = vl.getFeatures()for f in features:
print "F:", f.id(), f.attributes(), f.geometry().asPoint()
5.9 Aparencia (Simbologia) de Camadas de Vetor
When a vector layer is being rendered, the appearance of the data is given by renderer and symbols associatedwith the layer. Symbols are classes which take care of drawing of visual representation of features, while renderersdetermine what symbol will be used for a particular feature.
A renderização para uma dada camada pode ser obtida como mostrada abaixo
renderer = layer.rendererV2()
And with that reference, let us explore it a bit
print "Type:", rendererV2.type()
Existem muitos tipos de renderização conhecidas disponíveis na biblioteca principal do QGIS
Tipo Classes DescriçãosingleSymbol QgsSingleSymbolRendererV2Renderiza todas as características com o mesmo símbolocatego-rizedSymbol
QgsCategorizedSymbolRendererV2Renderiza características usando um símbolo diferentepara cada categoria
graduat-edSymbol
QgsGraduatedSymbolRendererV2Renderiza caracter´sticas usando diferents símbolos paracada limite de valores
There might be also some custom renderer types, so never make an assumption there are just these types. You canquery QgsRendererV2Registry singleton to find out currently available renderers:
print QgsRendererV2Registry.instance().renderersList()# Print:[u’singleSymbol’,u’categorizedSymbol’,u’graduatedSymbol’,u’RuleRenderer’,u’pointDisplacement’,
5.9. Aparencia (Simbologia) de Camadas de Vetor 25
PyQGIS developer cookbook, Versão 2.14
u’invertedPolygonRenderer’,u’heatmapRenderer’]
It is possible to obtain a dump of a renderer contents in text form — can be useful for debugging
print rendererV2.dump()
5.9.1 Single Symbol Renderer
You can get the symbol used for rendering by calling symbol() method and change it with setSymbol()method (note for C++ devs: the renderer takes ownership of the symbol.)
You can change the symbol used by a particular vector layer by calling setSymbol() passing an instanceof the appropriate symbol instance. Symbols for point, line and polygon layers can be created by calling thecreateSimple() function of the corresponding classes QgsMarkerSymbolV2, QgsLineSymbolV2 andQgsFillSymbolV2.
The dictionary passed to createSimple() sets the style properties of the symbol.
For example you can replace the symbol used by a particular point layer by calling setSymbol() passing aninstance of a QgsMarkerSymbolV2 as in the following code example:
symbol = QgsMarkerSymbolV2.createSimple({’name’: ’square’, ’color’: ’red’})layer.rendererV2().setSymbol(symbol)
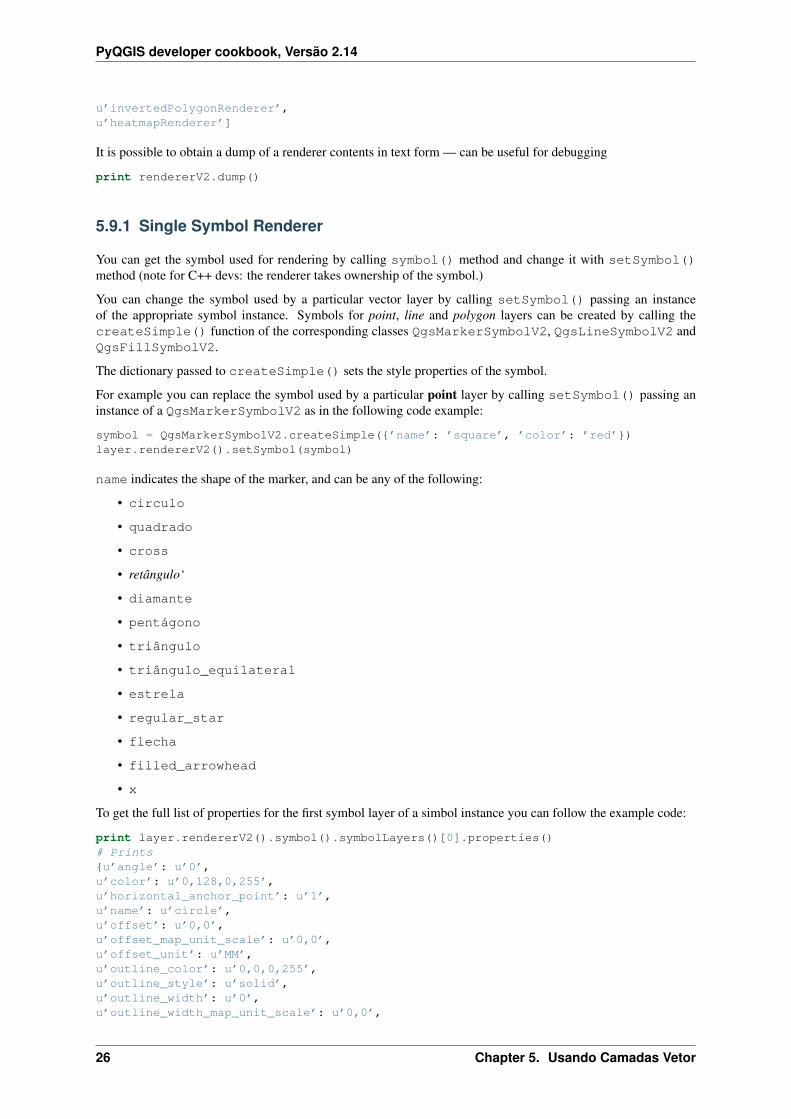
name indicates the shape of the marker, and can be any of the following:
• circulo
• quadrado
• cross
• retângulo‘
• diamante
• pentágono
• triângulo
• triângulo_equilateral
• estrela
• regular_star
• flecha
• filled_arrowhead
• x
To get the full list of properties for the first symbol layer of a simbol instance you can follow the example code:
print layer.rendererV2().symbol().symbolLayers()[0].properties()# Prints{u’angle’: u’0’,u’color’: u’0,128,0,255’,u’horizontal_anchor_point’: u’1’,u’name’: u’circle’,u’offset’: u’0,0’,u’offset_map_unit_scale’: u’0,0’,u’offset_unit’: u’MM’,u’outline_color’: u’0,0,0,255’,u’outline_style’: u’solid’,u’outline_width’: u’0’,u’outline_width_map_unit_scale’: u’0,0’,
26 Chapter 5. Usando Camadas Vetor

PyQGIS developer cookbook, Versão 2.14
u’outline_width_unit’: u’MM’,u’scale_method’: u’area’,u’size’: u’2’,u’size_map_unit_scale’: u’0,0’,u’size_unit’: u’MM’,u’vertical_anchor_point’: u’1’}
This can be useful if you want to alter some properties:
# You can alter a single propery...layer.rendererV2().symbol().symbolLayer(0).setName(’square’)# ... but not all properties are accessible from methods,# you can also replace the symbol completely:props = layer.rendererV2().symbol().symbolLayer(0).properties()props[’color’] = ’yellow’props[’name’] = ’square’layer.rendererV2().setSymbol(QgsMarkerSymbolV2.createSimple(props))
5.9.2 Categorized Symbol Renderer
You can query and set attribute name which is used for classification: use classAttribute() andsetClassAttribute() methods.
To get a list of categories
for cat in rendererV2.categories():print "%s: %s :: %s" % (cat.value().toString(), cat.label(), str(cat.symbol()))
Where value() is the value used for discrimination between categories, label() is a text used for categorydescription and symbol() method returns assigned symbol.
The renderer usually stores also original symbol and color ramp which were used for the classification:sourceColorRamp() and sourceSymbol() methods.
5.9.3 Graduated Symbol Renderer
This renderer is very similar to the categorized symbol renderer described above, but instead of one attribute valueper class it works with ranges of values and thus can be used only with numerical attributes.
To find out more about ranges used in the renderer
for ran in rendererV2.ranges():print "%f - %f: %s %s" % (
ran.lowerValue(),ran.upperValue(),ran.label(),str(ran.symbol())
)
you can again use classAttribute() to find out classification attribute name, sourceSymbol() andsourceColorRamp() methods. Additionally there is mode() method which determines how the ranges werecreated: using equal intervals, quantiles or some other method.
If you wish to create your own graduated symbol renderer you can do so as illustrated in the example snippetbelow (which creates a simple two class arrangement)
from qgis.core import *
myVectorLayer = QgsVectorLayer(myVectorPath, myName, ’ogr’)myTargetField = ’target_field’myRangeList = []myOpacity = 1
5.9. Aparencia (Simbologia) de Camadas de Vetor 27

PyQGIS developer cookbook, Versão 2.14
# Make our first symbol and range...myMin = 0.0myMax = 50.0myLabel = ’Group 1’myColour = QtGui.QColor(’#ffee00’)mySymbol1 = QgsSymbolV2.defaultSymbol(myVectorLayer.geometryType())mySymbol1.setColor(myColour)mySymbol1.setAlpha(myOpacity)myRange1 = QgsRendererRangeV2(myMin, myMax, mySymbol1, myLabel)myRangeList.append(myRange1)#now make another symbol and range...myMin = 50.1myMax = 100myLabel = ’Group 2’myColour = QtGui.QColor(’#00eeff’)mySymbol2 = QgsSymbolV2.defaultSymbol(
myVectorLayer.geometryType())mySymbol2.setColor(myColour)mySymbol2.setAlpha(myOpacity)myRange2 = QgsRendererRangeV2(myMin, myMax, mySymbol2 myLabel)myRangeList.append(myRange2)myRenderer = QgsGraduatedSymbolRendererV2(’’, myRangeList)myRenderer.setMode(QgsGraduatedSymbolRendererV2.EqualInterval)myRenderer.setClassAttribute(myTargetField)
myVectorLayer.setRendererV2(myRenderer)QgsMapLayerRegistry.instance().addMapLayer(myVectorLayer)
5.9.4 Trabalhando com Símbolos
Para representação de símbolos, existe QgsSymbolV2 que é a classe básica com três classes derivadas.
• QgsMarkerSymbolV2 — for point features
• QgsLineSymbolV2 — for line features
• QgsFillSymbolV2 — for polygon features
Every symbol consists of one or more symbol layers (classes derived from QgsSymbolLayerV2). The sym-bol layers do the actual rendering, the symbol class itself serves only as a container for the symbol layers.
Having an instance of a symbol (e.g. from a renderer), it is possible to explore it: type() method says whetherit is a marker, line or fill symbol. There is a dump() method which returns a brief description of the symbol. Toget a list of symbol layers
for i in xrange(symbol.symbolLayerCount()):lyr = symbol.symbolLayer(i)print "%d: %s" % (i, lyr.layerType())
To find out symbol’s color use color() method and setColor() to change its color. With marker symbolsadditionally you can query for the symbol size and rotation with size() and angle()methods, for line symbolsthere is width() method returning line width.
Por padrão, tamanho e largura são em milimetros e ângulos em graus.
Trabalhando com Camadas de Símbolos
As said before, symbol layers (subclasses of QgsSymbolLayerV2) determine the appearance of the features.There are several basic symbol layer classes for general use. It is possible to implement new symbol layer typesand thus arbitrarily customize how features will be rendered. The layerType() method uniquely identifiesthe symbol layer class — the basic and default ones are SimpleMarker, SimpleLine and SimpleFill symbol layerstypes.
28 Chapter 5. Usando Camadas Vetor

PyQGIS developer cookbook, Versão 2.14
You can get a complete list of the types of symbol layers you can create for a given symbol layer class like this
from qgis.core import QgsSymbolLayerV2RegistrymyRegistry = QgsSymbolLayerV2Registry.instance()myMetadata = myRegistry.symbolLayerMetadata("SimpleFill")for item in myRegistry.symbolLayersForType(QgsSymbolV2.Marker):
print item
Saída
EllipseMarkerFontMarkerSimpleMarkerSvgMarkerVectorField
A classe QgsSymbolLayerV2Registry gerencia um banco de dados com todos os tipo de símbolo de ca-madas.
To access symbol layer data, use its properties() method that returns a key-value dictionary of propertieswhich determine the appearance. Each symbol layer type has a specific set of properties that it uses. Additionally,there are generic methods color(), size(), angle(), width() with their setter counterparts. Of coursesize and angle is available only for marker symbol layers and width for line symbol layers.
Creating Custom Symbol Layer Types
Imagine you would like to customize the way how the data gets rendered. You can create your own symbol layerclass that will draw the features exactly as you wish. Here is an example of a marker that draws red circles withspecified radius
class FooSymbolLayer(QgsMarkerSymbolLayerV2):
def __init__(self, radius=4.0):QgsMarkerSymbolLayerV2.__init__(self)self.radius = radiusself.color = QColor(255,0,0)
def layerType(self):return "FooMarker"
def properties(self):return { "radius" : str(self.radius) }
def startRender(self, context):pass
def stopRender(self, context):pass
def renderPoint(self, point, context):# Rendering depends on whether the symbol is selected (QGIS >= 1.5)color = context.selectionColor() if context.selected() else self.colorp = context.renderContext().painter()p.setPen(color)p.drawEllipse(point, self.radius, self.radius)
def clone(self):return FooSymbolLayer(self.radius)
The layerType() method determines the name of the symbol layer, it has to be unique among all symbollayers. Properties are used for persistence of attributes. clone() method must return a copy of the symbollayer with all attributes being exactly the same. Finally there are rendering methods: startRender() is called
5.9. Aparencia (Simbologia) de Camadas de Vetor 29
PyQGIS developer cookbook, Versão 2.14
before rendering first feature, stopRender() when rendering is done. And renderPoint() method whichdoes the rendering. The coordinates of the point(s) are already transformed to the output coordinates.
For polylines and polygons the only difference would be in the rendering method: you would userenderPolyline() which receives a list of lines, resp. renderPolygon() which receives list of points onouter ring as a first parameter and a list of inner rings (or None) as a second parameter.
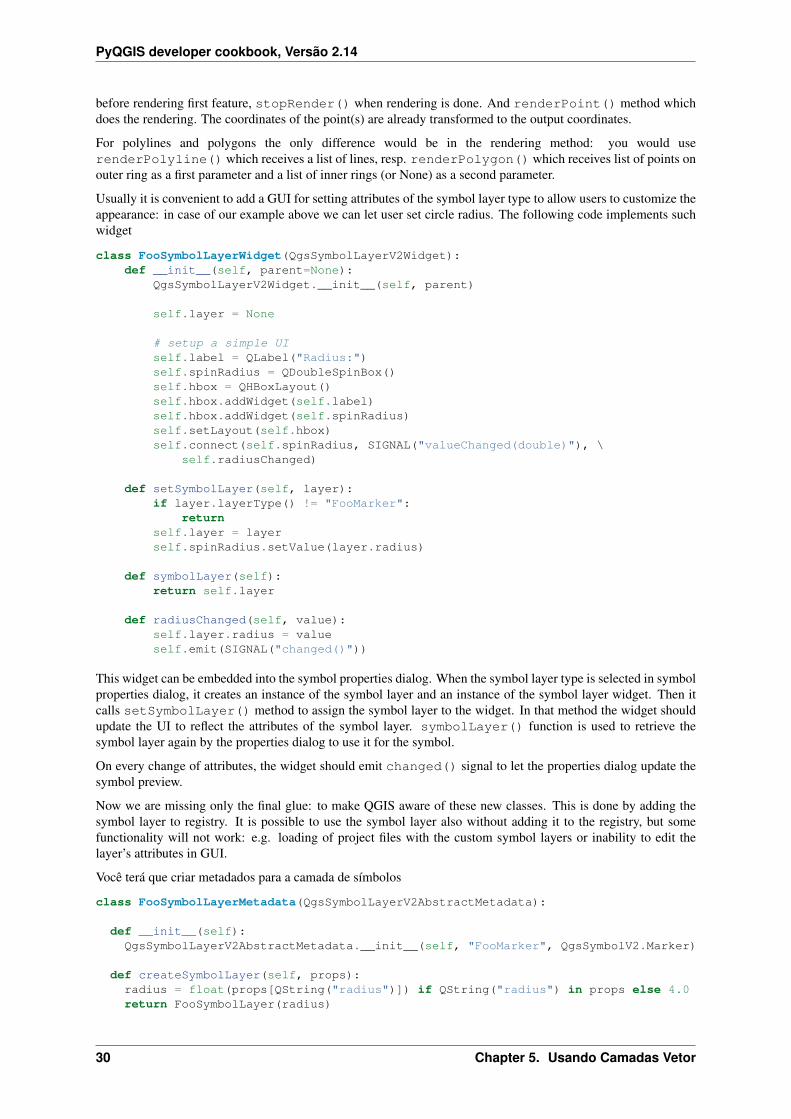
Usually it is convenient to add a GUI for setting attributes of the symbol layer type to allow users to customize theappearance: in case of our example above we can let user set circle radius. The following code implements suchwidget
class FooSymbolLayerWidget(QgsSymbolLayerV2Widget):def __init__(self, parent=None):
QgsSymbolLayerV2Widget.__init__(self, parent)
self.layer = None
# setup a simple UIself.label = QLabel("Radius:")self.spinRadius = QDoubleSpinBox()self.hbox = QHBoxLayout()self.hbox.addWidget(self.label)self.hbox.addWidget(self.spinRadius)self.setLayout(self.hbox)self.connect(self.spinRadius, SIGNAL("valueChanged(double)"), \
self.radiusChanged)
def setSymbolLayer(self, layer):if layer.layerType() != "FooMarker":
returnself.layer = layerself.spinRadius.setValue(layer.radius)
def symbolLayer(self):return self.layer
def radiusChanged(self, value):self.layer.radius = valueself.emit(SIGNAL("changed()"))
This widget can be embedded into the symbol properties dialog. When the symbol layer type is selected in symbolproperties dialog, it creates an instance of the symbol layer and an instance of the symbol layer widget. Then itcalls setSymbolLayer() method to assign the symbol layer to the widget. In that method the widget shouldupdate the UI to reflect the attributes of the symbol layer. symbolLayer() function is used to retrieve thesymbol layer again by the properties dialog to use it for the symbol.
On every change of attributes, the widget should emit changed() signal to let the properties dialog update thesymbol preview.
Now we are missing only the final glue: to make QGIS aware of these new classes. This is done by adding thesymbol layer to registry. It is possible to use the symbol layer also without adding it to the registry, but somefunctionality will not work: e.g. loading of project files with the custom symbol layers or inability to edit thelayer’s attributes in GUI.
Você terá que criar metadados para a camada de símbolos
class FooSymbolLayerMetadata(QgsSymbolLayerV2AbstractMetadata):
def __init__(self):QgsSymbolLayerV2AbstractMetadata.__init__(self, "FooMarker", QgsSymbolV2.Marker)
def createSymbolLayer(self, props):radius = float(props[QString("radius")]) if QString("radius") in props else 4.0return FooSymbolLayer(radius)
30 Chapter 5. Usando Camadas Vetor
PyQGIS developer cookbook, Versão 2.14
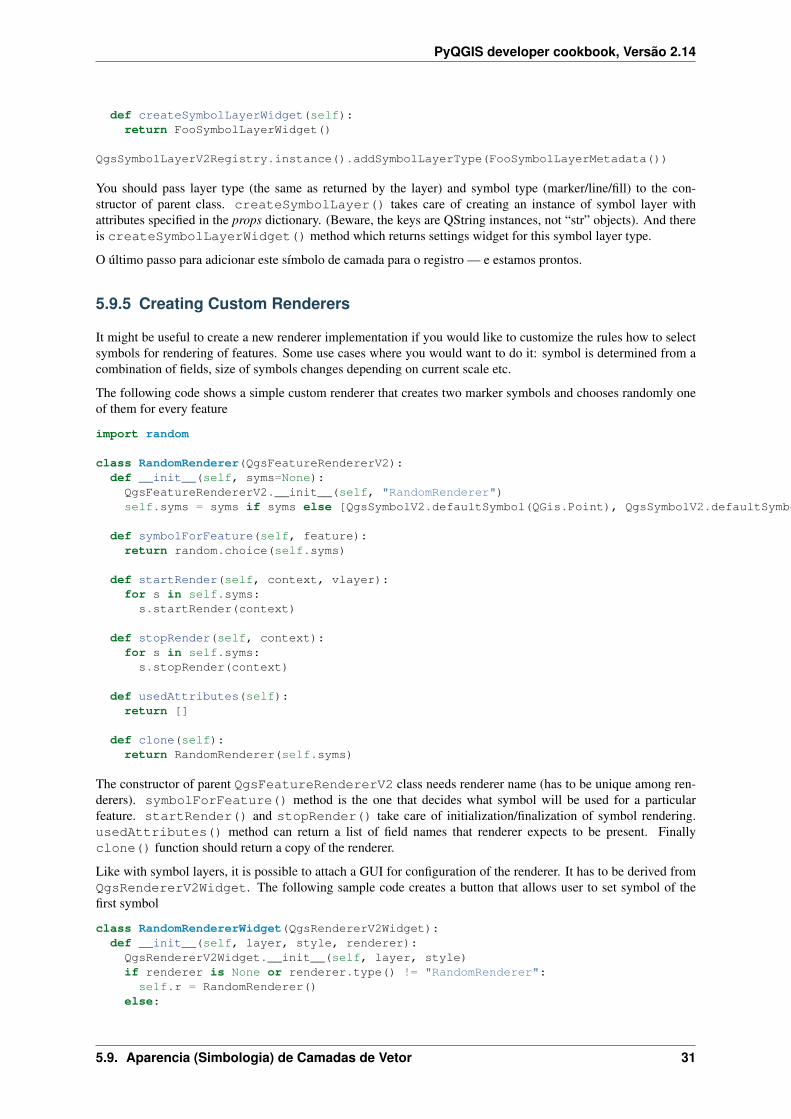
def createSymbolLayerWidget(self):return FooSymbolLayerWidget()
QgsSymbolLayerV2Registry.instance().addSymbolLayerType(FooSymbolLayerMetadata())
You should pass layer type (the same as returned by the layer) and symbol type (marker/line/fill) to the con-structor of parent class. createSymbolLayer() takes care of creating an instance of symbol layer withattributes specified in the props dictionary. (Beware, the keys are QString instances, not “str” objects). And thereis createSymbolLayerWidget() method which returns settings widget for this symbol layer type.
O último passo para adicionar este símbolo de camada para o registro — e estamos prontos.
5.9.5 Creating Custom Renderers
It might be useful to create a new renderer implementation if you would like to customize the rules how to selectsymbols for rendering of features. Some use cases where you would want to do it: symbol is determined from acombination of fields, size of symbols changes depending on current scale etc.
The following code shows a simple custom renderer that creates two marker symbols and chooses randomly oneof them for every feature
import random
class RandomRenderer(QgsFeatureRendererV2):def __init__(self, syms=None):QgsFeatureRendererV2.__init__(self, "RandomRenderer")self.syms = syms if syms else [QgsSymbolV2.defaultSymbol(QGis.Point), QgsSymbolV2.defaultSymbol(QGis.Point)]
def symbolForFeature(self, feature):return random.choice(self.syms)
def startRender(self, context, vlayer):for s in self.syms:
s.startRender(context)
def stopRender(self, context):for s in self.syms:
s.stopRender(context)
def usedAttributes(self):return []
def clone(self):return RandomRenderer(self.syms)
The constructor of parent QgsFeatureRendererV2 class needs renderer name (has to be unique among ren-derers). symbolForFeature() method is the one that decides what symbol will be used for a particularfeature. startRender() and stopRender() take care of initialization/finalization of symbol rendering.usedAttributes() method can return a list of field names that renderer expects to be present. Finallyclone() function should return a copy of the renderer.
Like with symbol layers, it is possible to attach a GUI for configuration of the renderer. It has to be derived fromQgsRendererV2Widget. The following sample code creates a button that allows user to set symbol of thefirst symbol
class RandomRendererWidget(QgsRendererV2Widget):def __init__(self, layer, style, renderer):QgsRendererV2Widget.__init__(self, layer, style)if renderer is None or renderer.type() != "RandomRenderer":
self.r = RandomRenderer()else:
5.9. Aparencia (Simbologia) de Camadas de Vetor 31
PyQGIS developer cookbook, Versão 2.14
self.r = renderer# setup UIself.btn1 = QgsColorButtonV2()self.btn1.setColor(self.r.syms[0].color())self.vbox = QVBoxLayout()self.vbox.addWidget(self.btn1)self.setLayout(self.vbox)self.connect(self.btn1, SIGNAL("clicked()"), self.setColor1)
def setColor1(self):color = QColorDialog.getColor(self.r.syms[0].color(), self)if not color.isValid(): returnself.r.syms[0].setColor(color);self.btn1.setColor(self.r.syms[0].color())
def renderer(self):return self.r
The constructor receives instances of the active layer (QgsVectorLayer), the global style (QgsStyleV2) andcurrent renderer. If there is no renderer or the renderer has different type, it will be replaced with our new renderer,otherwise we will use the current renderer (which has already the type we need). The widget contents should beupdated to show current state of the renderer. When the renderer dialog is accepted, widget’s renderer()method is called to get the current renderer — it will be assigned to the layer.
The last missing bit is the renderer metadata and registration in registry, otherwise loading of layers with therenderer will not work and user will not be able to select it from the list of renderers. Let us finish our Random-Renderer example
class RandomRendererMetadata(QgsRendererV2AbstractMetadata):def __init__(self):QgsRendererV2AbstractMetadata.__init__(self, "RandomRenderer", "Random renderer")
def createRenderer(self, element):return RandomRenderer()
def createRendererWidget(self, layer, style, renderer):return RandomRendererWidget(layer, style, renderer)
QgsRendererV2Registry.instance().addRenderer(RandomRendererMetadata())
Similarly as with symbol layers, abstract metadata constructor awaits renderer name, name visible for users andoptionally name of renderer’s icon. createRenderer() method passes QDomElement instance that can beused to restore renderer’s state from DOM tree. createRendererWidget()method creates the configurationwidget. It does not have to be present or can return None if the renderer does not come with GUI.
To associate an icon with the renderer you can assign it in QgsRendererV2AbstractMetadata construc-tor as a third (optional) argument — the base class constructor in the RandomRendererMetadata __init__()function becomes
QgsRendererV2AbstractMetadata.__init__(self,"RandomRenderer","Random renderer",QIcon(QPixmap("RandomRendererIcon.png", "png")))
The icon can be associated also at any later time using setIcon() method of the metadata class. The icon canbe loaded from a file (as shown above) or can be loaded from a Qt resource (PyQt4 includes .qrc compiler forPython).
5.10 Outros Tópicos
TODO: creating/modifying symbols working with style (QgsStyleV2) working with color ramps(QgsVectorColorRampV2) rule-based renderer (see this blogpost) exploring symbol layer and renderer
32 Chapter 5. Usando Camadas Vetor
PyQGIS developer cookbook, Versão 2.14
registries
5.10. Outros Tópicos 33

PyQGIS developer cookbook, Versão 2.14
34 Chapter 5. Usando Camadas Vetor
CHAPTER 6
Manipulação Geométrica
• Construção de Geométria• Acesso a Geometria• Operações e Predicados Geométricos
Pontos, cadeias lineares e polígonos que representam uma característica espacial são comumente referido comogeometrias. Em QGIS eles são representados com a classe : class QgsGeometry. Todos os tipos possíveis degeometria são mostrados na página de discussão JTS discussion page.
Às vezes, uma geometria é realmente uma coleção dex simples geometrias (single-part). Tal geometria é chamadade geometria de várias partes. Se ele contém apenas um tipo de simples geometria, podemos chamar de multi-ponto, multi-cadeia linear ou multi-polígono. Por exemplo, um país que consiste de múltiplas ilhas pode serrepresentado como um sistema multi-polígono.
As coordenadas de geometrias podem estar em qualquer sistema de referência de coordenadas (SRC). Ao buscarfeições a partir de uma camada, geometrias associadas terão coordenadas no SRC da camada.
6.1 Construção de Geométria
Existem várias opções para criar uma geometria:
• a partir das coordenadas
gPnt = QgsGeometry.fromPoint(QgsPoint(1,1))gLine = QgsGeometry.fromPolyline([QgsPoint(1, 1), QgsPoint(2, 2)])gPolygon = QgsGeometry.fromPolygon([[QgsPoint(1, 1), QgsPoint(2, 2), QgsPoint(2, 1)]])
As coordenadas são dadas usando a classe QgsPoint.
Polyline (Cadeia Linear) é representado por uma lista de pontos. Polígono é representado por uma lista deanéis lineares (ou seja, cadeias lineares fechada). Primeiro anel é o anel exterior (fronteira), anéis subse-quentes opcionais são buracos no polígono.
Geometrias multi-parte passam para um nível maior: multi-ponto é uma lista de pontos, multi-cadeia linearé uma lista de cadeias lineares e multi-polígono é uma lista de polígonos.
• a partir de textos conhecidos (WKT)
gem = QgsGeometry.fromWkt("POINT(3 4)")
• a partir de binários conhecidos (WKB)
g = QgsGeometry()g.setWkbAndOwnership(wkb, len(wkb))
35
PyQGIS developer cookbook, Versão 2.14
6.2 Acesso a Geometria
Primeiro, você deve descobrir o tipo de geometria, wkbType() é o método único a usar — ele retorna um valorde enumeração do QGis.WkbType
>>> gPnt.wkbType() == QGis.WKBPointTrue>>> gLine.wkbType() == QGis.WKBLineStringTrue>>> gPolygon.wkbType() == QGis.WKBPolygonTrue>>> gPolygon.wkbType() == QGis.WKBMultiPolygonFalse
Como alternativa, pode-se usar o método type() que retorna um valor de enumeração QGis.GeometryType.Há também uma função de ajuda : isMultipart() para descobrir se uma geometria é multi-parte ou não.
Para extrair informações de geometria existem funções de acesso para cada tipo de vetor. Como usar acessores
>>> gPnt.asPoint()(1, 1)>>> gLine.asPolyline()[(1, 1), (2, 2)]>>> gPolygon.asPolygon()[[(1, 1), (2, 2), (2, 1), (1, 1)]]
Note: as variáveis (x, y) não são variáveis reais, elas são objetos QgsPoint , os valores são acessíveis com:osmetódos: x() and y().
Para geometrias de multi-partes existem funções de acesso similares: asMultiPoint(),asMultiPolyline(), asMultiPolygon().
6.3 Operações e Predicados Geométricos
QGIS usa biblioteca GEOS para operações avançadas de geometria como predicados geométrico (contains(),intersects(), ...) e operações de conjunto (union(), difference(), ...). Também podem calcular pro-priedades geométricas das geometrias, tais como a área (no caso de polígonos) ou comprimentos (para polígonose linhas)
Aqui você tem um pequeno exemplo que combina a iteração sobre as caracteríticas em uma determinada camadae executando alguns cálculos geométricos com base em suas geometrias.
# we assume that ’layer’ is a polygon layerfeatures = layer.getFeatures()for f in features:geom = f.geometry()print "Area:", geom.area()print "Perimeter:", geom.length()
Áreas e perímetros não levam em conta CRS quando calculado usando esses métodos da classe : QgsGeometry.Para um cálculo de área e distância mais poderoso, a classe QgsDistanceArea pode ser usada. Se as projeçõesestão desligadas, os cálculos serão planos, caso contrário, eles vão ser feitas no elipsóide. Quando um elipsóidenão é definido explicitamente, os parâmetros de WGS84 são utilizados para os cálculos.
d = QgsDistanceArea()d.setEllipsoidalMode(True)
print "distance in meters: ", d.measureLine(QgsPoint(10,10),QgsPoint(11,11))
Você pode encontrar muitos exemplo de algoritmos que estão incluídos no QGIS e usar esses métodos para analisare transformar dados vetoriais. Aqui estão alguns links para o código de alguns deles.
36 Chapter 6. Manipulação Geométrica

PyQGIS developer cookbook, Versão 2.14
Informação adicional pode ser encontada nas seguintes fontes:
• Transformação Geométrica: Reproject algorithm
• Distancia e área usando a classe QgsDistanceArea: Distance matrix algorithm
• Algoritmos de Multi-partes para Partes-simples <https://raw.github.com/qgis/QGIS/release-2_0/python/plugins/processing/algs/ftools/MultipartToSingleparts.py>‘_
6.3. Operações e Predicados Geométricos 37

PyQGIS developer cookbook, Versão 2.14
38 Chapter 6. Manipulação Geométrica

CHAPTER 7
Suporte a projeções
• Sistemas de Referencia de Coordenadas• Projeções
7.1 Sistemas de Referencia de Coordenadas
Os Sistemas de Referencia de Coordenadas (SRC), estão incluídas na classe:Sistema de ReferenciaCoorde-nadasQgs . Instâncias desta classe podem ser criados de diferentes maneiras:
• especificar CRS pela sua identificação
# PostGIS SRID 4326 is allocated for WGS84crs = QgsCoordinateReferenceSystem(4326, QgsCoordinateReferenceSystem.PostgisCrsId)
O QGIS usa três diferentes ID para cada sistema de referencia:
– PostgisCrsId — Identificação usada nos bancos de dados PostGIS
– InternalCrsId — Identificação usada internamente no banco de dados QGIS
– EpsgCrsId — Identificação designada pela organização EPSG
Se não é determinado uma coisa diferente no segundo parâmetro, o SRID PostGIS será usado por padrão..
• especificar CRS pelo seu texto conhecido (WKT)
wkt = ’GEOGCS["WGS84", DATUM["WGS84", SPHEROID["WGS84", 6378137.0, 298.257223563]],’PRIMEM["Greenwich", 0.0], UNIT["degree",0.017453292519943295],’AXIS["Longitude",EAST], AXIS["Latitude",NORTH]]’
crs = QgsCoordinateReferenceSystem(wkt)
• crie CRS inválidos e, em seguida, use uma das funções create*() para inicializa-la. No exemploseguinte, nós usamos seqüência Proj4 para inicializar a projeção
crs = QgsCoordinateReferenceSystem()crs.createFromProj4("+proj=longlat +ellps=WGS84 +datum=WGS84 +no_defs")
É interessante checar se a criação do SRC foi bem sucedida, a função : Évalido() deve retornar o valorVerdadeiro.
Note que para a inicialização de sistemas de referência espacial QGIS precisa procurar os valores apropriados emseu banco de dados interno srs.db. Assim, no caso de você criar um aplicativo independente que você precisapara definir os caminhos corretamente com QgsApplication.setPrefixPath() caso contrário ele nãovai encontrar o banco de dados. Se você estiver executando os comandos a partir do console QGIS python oudesenvolvendo um plugin você não precisa se preocupar: tudo já está configurado para você.
Acessando informações do sistema de referência espacial
39

PyQGIS developer cookbook, Versão 2.14
print "QGIS CRS ID:", crs.srsid()print "PostGIS SRID:", crs.srid()print "EPSG ID:", crs.epsg()print "Description:", crs.description()print "Projection Acronym:", crs.projectionAcronym()print "Ellipsoid Acronym:", crs.ellipsoidAcronym()print "Proj4 String:", crs.proj4String()# check whether it’s geographic or projected coordinate systemprint "Is geographic:", crs.geographicFlag()# check type of map units in this CRS (values defined in QGis::units enum)print "Map units:", crs.mapUnits()
7.2 Projeções
Você pode fazer a transformação entre os diferentes sistemas de referência espacial usando a classeQgsCoordinateTransform. A maneira mais fácil de usá-lo é criar a origem e o destino CRS e con-struir a instância QgsCoordinateTransform com eles. Em seguida, chamar repetidamente apenas a funçãotransform() para fazer a transformação. Por padrão, ele faz a transformação para a frente, mas é capaz defazer também transformação inversa
crsSrc = QgsCoordinateReferenceSystem(4326) # WGS 84crsDest = QgsCoordinateReferenceSystem(32633) # WGS 84 / UTM zone 33Nxform = QgsCoordinateTransform(crsSrc, crsDest)
# forward transformation: src -> destpt1 = xform.transform(QgsPoint(18,5))print "Transformed point:", pt1
# inverse transformation: dest -> srcpt2 = xform.transform(pt1, QgsCoordinateTransform.ReverseTransform)print "Transformed back:", pt2
40 Chapter 7. Suporte a projeções

CHAPTER 8
Utilizando a Tela do Mapa
• Incorporar o Mapa da Tela• Usando Ferramentas de Mapas na Tela• Bandas raster e fazedor de vértices• Desenhar ferramenta de mapa personalizada• Desenhar itens da tela do mapa
O Widget tela Mapa é provavelmente o widget mais importante dentro de QGIS porque mostra o mapa compostode camadas de mapas sobrepostos e permite a interação com o mapa e camadas. A tela mostra sempre uma partedo mapa definido pela extensão tela atual. A interação é feita através do uso de ferramentas de mapa existemferramentas para panorâmica, zoom, identificando camadas, de medida, de edição de vetores e outros. Semelhantea outros programas gráficos, há sempre uma ferramenta ativa e que o usuário pode alternar entre as ferramentasdisponíveis.
Mapa na tela é implementado como: class: class QgsMapCanvas no módulo: mod:‘ qgis.gui‘. A implementaçãoé baseada no framework Qt Gráficos View. Este quadro geralmente fornece uma superfície e uma vista onde ositens gráficos personalizados são colocados e usuário pode interagir com eles. Vamos supor que você está bastantefamiliarizado com Qt para entender os conceitos de cena, vista e itens gráficos. Se não, por favor, certifique-se deler a visão geral do quadro.
Sempre que o mapa foi muito deslocado, zoom in / out (ou alguma outra ação dispara uma atualização), o mapa éprocessado novamente dentro da extensão atual. As camadas são prestados a uma imagem (usando: class: classeQgsMapRenderer) e essa imagem é exibida na tela. O item gráfico (em termos de gráficos vista framework Qt)responsável por mostrar o mapa é: class: classe QgsMapCanvasMap. Esta classe também controla a atualizaçãodo mapa renderizado. Além disso este item, que atua como um fundo, pode haver mais itens ** mapa de itens natela**. Mapa típica itens na tela são elásticos (usados para medir, edição vetor etc.) ou marcadores de vértice. Ositens de lona são normalmente utilizados para dar algum feedback visual para ferramentas de mapa, por exemplo,ao criar um novo polígono, a ferramenta de mapa cria um item de canvas elástico que mostra a forma atual dopolígono. Todos os itens de mapa de lona são subclasses de: class: QgsMapCanvasItem que acrescenta maisalgumas funcionalidades para os‘ objetos básicos QGraphicsItem‘.
Para resumir, a arquitetura do mapa na tela são constituídas por três conceitos:
• tela do mapa — para visualização do mapa
• itens na tela do mapa — itens adicionais que podem ser exibidos na tela do mapa
• ferramentas do mapa — para a interagir com o mapa na tela
8.1 Incorporar o Mapa da Tela
Mapa natela é um widget, como qualquer outro widget Qt, então usá-lo é tão simples como criar e mostrá-lo
41

PyQGIS developer cookbook, Versão 2.14
canvas = QgsMapCanvas()canvas.show()
Isso produz uma janela independente com o mapa de lona. Ela também pode ser incorporado em um widget oujanela existente. Ao usar .ui arquivos e Qt Designer, coloque um ‘‘ QWidget‘‘ no formulário e promovê-lo a umanova classe: definir ‘‘ QgsMapCanvas‘‘ como nome da classe e definir ‘‘ qgis.gui‘‘ como arquivo de cabeçalho.O utilitário ‘‘ pyuic4‘‘ vai cuidar dele. Esta é uma maneira muito conveniente de incorporar a tela. A outrapossibilidade é escrever manualmente o código para construir do mapa na tela e outros widgets (como filhos deuma janela principal ou diálogo) e criar um layout.
Por padrão, o mapa na tela tem fundo preto e não usa anti-aliasing. Para definir o fundo branco e permitir anti-aliasing para renderização suave
canvas.setCanvasColor(Qt.white)canvas.enableAntiAliasing(True)
(Caso você esteja se perguntando, ‘‘ Qt‘‘ vem de ‘‘ módulo PyQt4.QtCore‘‘ e ‘‘ Qt.white‘‘ é um dos pré-definido‘‘ QColor‘‘ instâncias.)
Agora é hora de adicionar algumas camadas do mapa. Vamos abrir primeiro uma camada e adicioná-lo ao registrocamada do mapa. Então, vamos definir a extensão da tela e definir a lista de camadas para tela
layer = QgsVectorLayer(path, name, provider)if not layer.isValid():raise IOError, "Failed to open the layer"
# add layer to the registryQgsMapLayerRegistry.instance().addMapLayer(layer)
# set extent to the extent of our layercanvas.setExtent(layer.extent())
# set the map canvas layer setcanvas.setLayerSet([QgsMapCanvasLayer(layer)])
Depois de executar esses comandos, a tela deve mostrar a camada que você carregou.
8.2 Usando Ferramentas de Mapas na Tela
O exemplo a seguir constrói uma janela que contém um mapa de tela e ferramentas básicas de mapa para mapapanorâmico e zoom. Ações são criadas para a ativação de cada ferramenta: panorâmica é feito com: class:QgsMapToolPan, zoom in / out com um par de instâncias: class:‘ QgsMapToolZoom‘. As ações são definidascomo verificável e posteriormente atribuído às ferramentas para permitir o tratamento automático de do estadodas ações verificado / não verificado - quando uma ferramenta de mapa é ativado, a sua ação está marcado comoselecionado e a acção da ferramenta mapa anterior é desmarcada. As ferramentas de mapa são ativadas usando ometodo: func: setMapTool.
from qgis.gui import *from PyQt4.QtGui import QAction, QMainWindowfrom PyQt4.QtCore import SIGNAL, Qt, QString
class MyWnd(QMainWindow):def __init__(self, layer):QMainWindow.__init__(self)
self.canvas = QgsMapCanvas()self.canvas.setCanvasColor(Qt.white)
self.canvas.setExtent(layer.extent())self.canvas.setLayerSet([QgsMapCanvasLayer(layer)])
42 Chapter 8. Utilizando a Tela do Mapa
PyQGIS developer cookbook, Versão 2.14
self.setCentralWidget(self.canvas)
actionZoomIn = QAction(QString("Zoom in"), self)actionZoomOut = QAction(QString("Zoom out"), self)actionPan = QAction(QString("Pan"), self)
actionZoomIn.setCheckable(True)actionZoomOut.setCheckable(True)actionPan.setCheckable(True)
self.connect(actionZoomIn, SIGNAL("triggered()"), self.zoomIn)self.connect(actionZoomOut, SIGNAL("triggered()"), self.zoomOut)self.connect(actionPan, SIGNAL("triggered()"), self.pan)
self.toolbar = self.addToolBar("Canvas actions")self.toolbar.addAction(actionZoomIn)self.toolbar.addAction(actionZoomOut)self.toolbar.addAction(actionPan)
# create the map toolsself.toolPan = QgsMapToolPan(self.canvas)self.toolPan.setAction(actionPan)self.toolZoomIn = QgsMapToolZoom(self.canvas, False) # false = inself.toolZoomIn.setAction(actionZoomIn)self.toolZoomOut = QgsMapToolZoom(self.canvas, True) # true = outself.toolZoomOut.setAction(actionZoomOut)
self.pan()
def zoomIn(self):self.canvas.setMapTool(self.toolZoomIn)
def zoomOut(self):self.canvas.setMapTool(self.toolZoomOut)
def pan(self):self.canvas.setMapTool(self.toolPan)
Você pode colocar o código acima para um arquivo, por exemplo, : file: mywnd.py e experimentá-lo no consoledo Python dentro QGIS. Este código irá colocar a camada selecionada atualmente na tela recém-criada
import mywndw = mywnd.MyWnd(qgis.utils.iface.activeLayer())w.show()
Apenas certifique-se de que o arquivo: file: mywnd.py está localizado dentro do caminhoo de busca Python (‘sys.path‘). Se não for, você pode simplesmente adicioná-lo: sys.path.insert(0, ’/my/path’) — casocontrário, a declaração de importação irá falhar, não encontrando o módulo.
8.3 Bandas raster e fazedor de vértices
Para mostrar alguns dados adicionais na parte superior do mapa na tela, use itens de mapa de tela. É possívelcriar classes de itens de tela (mostradas abaixo), no entanto, existem duas classes úteis de item de tela parasua conveniência:: class: QgsRubberBand para desenhar multilinhas ou polígonos, e: class:‘ QgsVertexMarker‘para desenhar pontos. Ambos trabalham com as coordenadas do mapa, assim que a forma é movida/escaladaautomaticamente quando a tela está em panorâmica ou ampliada.
Para mostrar as polilinhas
8.3. Bandas raster e fazedor de vértices 43

PyQGIS developer cookbook, Versão 2.14
r = QgsRubberBand(canvas, False) # False = not a polygonpoints = [QgsPoint(-1, -1), QgsPoint(0, 1), QgsPoint(1, -1)]r.setToGeometry(QgsGeometry.fromPolyline(points), None)
Para mostrar o poligono
r = QgsRubberBand(canvas, True) # True = a polygonpoints = [[QgsPoint(-1, -1), QgsPoint(0, 1), QgsPoint(1, -1)]]r.setToGeometry(QgsGeometry.fromPolygon(points), None)
Note-se que aponta para polígono não é uma lista simples: na verdade, é uma lista de anéis contendo anéis linearesdo polígono: primeiro anel é a borda externa, ainda mais (opcional) anéis correspondem aos buracos no polígono.
As Bandas Raster permitem alguma personalização, ou seja, para mudar sua cor e linha de largura
r.setColor(QColor(0, 0, 255))r.setWidth(3)
Os itens em tela são obrigados a cena na tela. Para escondê-los temporariamente (e mostrar mais uma vez, usea Combinação: hide() and show() Para remover completamente o item, você tem que removê-lo da cena natela
canvas.scene().removeItem(r)
(em C ++ é possível simplesmente apagar o item, no entanto, em Python ‘‘ del r‘‘ seria apenas suprimir a referênciaeo objeto continuará a existir, uma vez que é de propriedade da tela)
As bandas Rasters também podem serem usadas para desenhar pontos, no entanto a classe : class: class QgsVer-texMarker é mais adequado para isso (QgsRubberBand só desenhar um retângulo ao redor do ponto desejado).Como usar o fazedor de Vértices
m = QgsVertexMarker(canvas)m.setCenter(QgsPoint(0, 0))
Isso vai chamar a uma cruz vermelha sobre a posição [0,0]. É possível personalizar o tipo de ícone, tamanho, core espessura da caneta
m.setColor(QColor(0, 255, 0))m.setIconSize(5)m.setIconType(QgsVertexMarker.ICON_BOX) # or ICON_CROSS, ICON_Xm.setPenWidth(3)
Para esconder temporáriamente os marcadores de vértice e removê-los da tela, o mesmo se aplica quanto para asbandas rasters.
8.4 Desenhar ferramenta de mapa personalizada
Você pode escrever suas ferramentas personalizadas, para implementar um comportamento personalizado às açõesrealizadas pelos usuários na tela.
Ferramentas de mapa deve herdar a classe: class: QgsMapTool ou qualquer outra classe derivada, e selecionadocomo ferramentas ativas na tela usando o método: func:setMapTool como já vimos.
Aqui está um exemplo de uma ferramenta de mapa que permite definir uma medida retangular, clicando e arras-tando na tela. Quando o retângulo é definido, ele imprime coordena seu limite no console. Ele utiliza os elementosde banda de borracha descritos antes para mostrar o retângulo selecionado, uma vez que está a ser definida.
class RectangleMapTool(QgsMapToolEmitPoint):def __init__(self, canvas):
self.canvas = canvasQgsMapToolEmitPoint.__init__(self, self.canvas)self.rubberBand = QgsRubberBand(self.canvas, QGis.Polygon)self.rubberBand.setColor(Qt.red)
44 Chapter 8. Utilizando a Tela do Mapa

PyQGIS developer cookbook, Versão 2.14
self.rubberBand.setWidth(1)self.reset()
def reset(self):self.startPoint = self.endPoint = Noneself.isEmittingPoint = Falseself.rubberBand.reset(QGis.Polygon)
def canvasPressEvent(self, e):self.startPoint = self.toMapCoordinates(e.pos())self.endPoint = self.startPointself.isEmittingPoint = Trueself.showRect(self.startPoint, self.endPoint)
def canvasReleaseEvent(self, e):self.isEmittingPoint = Falser = self.rectangle()if r is not None:print "Rectangle:", r.xMinimum(), r.yMinimum(), r.xMaximum(), r.yMaximum()
def canvasMoveEvent(self, e):if not self.isEmittingPoint:return
self.endPoint = self.toMapCoordinates(e.pos())self.showRect(self.startPoint, self.endPoint)
def showRect(self, startPoint, endPoint):self.rubberBand.reset(QGis.Polygon)if startPoint.x() == endPoint.x() or startPoint.y() == endPoint.y():
return
point1 = QgsPoint(startPoint.x(), startPoint.y())point2 = QgsPoint(startPoint.x(), endPoint.y())point3 = QgsPoint(endPoint.x(), endPoint.y())point4 = QgsPoint(endPoint.x(), startPoint.y())
self.rubberBand.addPoint(point1, False)self.rubberBand.addPoint(point2, False)self.rubberBand.addPoint(point3, False)self.rubberBand.addPoint(point4, True) # true to update canvasself.rubberBand.show()
def rectangle(self):if self.startPoint is None or self.endPoint is None:
return Noneelif self.startPoint.x() == self.endPoint.x() or self.startPoint.y() == self.endPoint.y():return None
return QgsRectangle(self.startPoint, self.endPoint)
def deactivate(self):super(RectangleMapTool, self).deactivate()self.emit(SIGNAL("deactivated()"))
8.5 Desenhar itens da tela do mapa
TODO: Como criar itens do mapa na tela
8.5. Desenhar itens da tela do mapa 45

PyQGIS developer cookbook, Versão 2.14
import sysfrom qgis.core import QgsApplicationfrom qgis.gui import QgsMapCanvas
def init():a = QgsApplication(sys.argv, True)QgsApplication.setPrefixPath(’/home/martin/qgis/inst’, True)QgsApplication.initQgis()return a
def show_canvas(app):canvas = QgsMapCanvas()canvas.show()app.exec_()
app = init()show_canvas(app)
46 Chapter 8. Utilizando a Tela do Mapa
CHAPTER 9
Renderização em impressão de mapas
• Renderização simples• Renderizando camadas com CRS diferente• Saída usando Compositor de Mapa
– Exportando para um arquivo de imagem– Exportando em PDF
Em geral, há duas abordagens quando os dados de entrada deve ser processado como um mapa: quer fazê-lomaneira rápida usando: class: QgsMapRenderer ou produzir saída mais afinadas, compondo o mapa na classe deamigos: class:‘ classe QgsComposition‘.
9.1 Renderização simples
Renderizar algumas camadas usando: class: QgsMapRenderer — cria um dispositivo de pintura de destino (‘QImage‘,‘ QPainter‘ etc.), configurar conjunto de camadas, extensão, tamanho de saída e fazer a renderização
# create imageimg = QImage(QSize(800, 600), QImage.Format_ARGB32_Premultiplied)
# set image’s background colorcolor = QColor(255, 255, 255)img.fill(color.rgb())
# create painterp = QPainter()p.begin(img)p.setRenderHint(QPainter.Antialiasing)
render = QgsMapRenderer()
# set layer setlst = [layer.getLayerID()] # add ID of every layerrender.setLayerSet(lst)
# set extentrect = QgsRectangle(render.fullExtent())rect.scale(1.1)render.setExtent(rect)
# set output sizerender.setOutputSize(img.size(), img.logicalDpiX())
# do the renderingrender.render(p)
47
PyQGIS developer cookbook, Versão 2.14
p.end()
# save imageimg.save("render.png","png")
9.2 Renderizando camadas com CRS diferente
Se você tiver mais de uma camada e eles têm CRS diferente, o simples exemplo acima provavelmente não vaifuncionar: para obter os valores corretos dos cálculos de extensão, você tem que definir explicitamente a CRS dedestino e permitem reprojeção OTF como no exemplo abaixo (apenas a parte de configuração do renderizador érelatada)...# set layer setlayers = QgsMapLayerRegistry.instance().mapLayers()lst = layers.keys()render.setLayerSet(lst)
# Set destination CRS to match the CRS of the first layerrender.setDestinationCrs(layers.values()[0].crs())# Enable OTF reprojectionrender.setProjectionsEnabled(True)...
9.3 Saída usando Compositor de Mapa
Compositor de Mapa é uma ferramenta muito útil se você gostaria de fazer uma produção mais sofisticada do quea prestação simples mostrado acima. Usando o compositor é possível criar layouts mapa complexas consistindode visualizações de mapas, etiquetas, legenda, tabelas e outros elementos que estão normalmente presentes emmapas de papel. Os layouts podem ser depois exportados para PDF, imagens raster ou diretamente impresso emuma impressora.
O compositor consiste em um grupo de classes. Todas elas pertencem à biblioteca núcleo. A aplicação QGIS temuma interface gráfica para colocação conveniente dos elementos, embora ele não estejam disponíveis na bibliotecaGUI. Se você não estiver familiarizado Com Qt Gráficos Ver quadro, em seguida, um cheque que são incentivadosa documentação agora, porque o compositor é baseado nele. Verifique também a documentação do Python daImplementação do QGraphicView.
A classe central de composição é: class: QgsComposition que é derivada de: class:‘ QGraphicsScene‘. Vamoscriar um
mapRenderer = iface.mapCanvas().mapRenderer()c = QgsComposition(mapRenderer)c.setPlotStyle(QgsComposition.Print)
Note-se que a composição leva uma instância de: class: QgsMapRenderer. No código esperamos que estamos ex-ecutando dentro aplicativo QGIS e, assim, usar o renderizador mapa do mapa de lona. A composição utiliza váriosparâmetros do renderizador mapa, o mais importante o conjunto padrão de camadas de mapas e da extensão atual.Ao utilizar compositor em um aplicativo independente, você pode criar sua própria instância mapa processador damesma forma como mostrado na seção acima e passá-lo para a composição.
É possível adicionar vários elementos (mapa, etiqueta, ...) para a composição — estes elementos têm de serdescendentes de: class: classe QgsComposerItem. Itens atualmente suportados são:
• map — este item diz as bibliotecas onde colocar o próprio mapa. Aqui criamos um mapa e esticamos sobreo tamanho do papel inteiro
48 Chapter 9. Renderização em impressão de mapas

PyQGIS developer cookbook, Versão 2.14
x, y = 0, 0w, h = c.paperWidth(), c.paperHeight()composerMap = QgsComposerMap(c, x ,y, w, h)c.addItem(composerMap)
• label — permite exibir rótulos. É possível modificar a sua fonte, cor, alinhamento e margem
composerLabel = QgsComposerLabel(c)composerLabel.setText("Hello world")composerLabel.adjustSizeToText()c.addItem(composerLabel)
• legenda
legend = QgsComposerLegend(c)legend.model().setLayerSet(mapRenderer.layerSet())c.addItem(legend)
• barra de escala
item = QgsComposerScaleBar(c)item.setStyle(’Numeric’) # optionally modify the styleitem.setComposerMap(composerMap)item.applyDefaultSize()c.addItem(item)
• Seta
• Imagem
• Formato
• Tabela
Por padrão, os itens de composição recém-criados têm posição zero (canto superior esquerdo da página) e tamanhozero. A posição e tamanho são sempre medido em milímetros
# set label 1cm from the top and 2cm from the left of the pagecomposerLabel.setItemPosition(20, 10)# set both label’s position and size (width 10cm, height 3cm)composerLabel.setItemPosition(20, 10, 100, 30)
Um quadro é desenhado em torno de cada item por padrão. Como remover o quadro
composerLabel.setFrame(False)
Além de criar os itens compositor à mão, QGIS tem suporte para modelos compositor que são essencialmentecomposições com todos os seus itens salvos em um arquivo .qpt (com a sintaxe XML). Infelizmente essa fun-cionalidade ainda não está disponível na API.
Uma vez que a composição está pronta (os itens do compositor tenham sido criados e adicionados à composição),podemos prosseguir para produzir um raster e / ou um vetor de saída.
As definições de saída padrão para a composição são página de tamanho A4 e resolução de 300 DPI. Você podealterá-los, se necessário. O tamanho do papel é especificada em milímetros
c.setPaperSize(width, height)c.setPrintResolution(dpi)
9.3.1 Exportando para um arquivo de imagem
O seguinte fragmento de código mostra como renderizar a composição para uma imagem raster
9.3. Saída usando Compositor de Mapa 49

PyQGIS developer cookbook, Versão 2.14
dpi = c.printResolution()dpmm = dpi / 25.4width = int(dpmm * c.paperWidth())height = int(dpmm * c.paperHeight())
# create output image and initialize itimage = QImage(QSize(width, height), QImage.Format_ARGB32)image.setDotsPerMeterX(dpmm * 1000)image.setDotsPerMeterY(dpmm * 1000)image.fill(0)
# render the compositionimagePainter = QPainter(image)sourceArea = QRectF(0, 0, c.paperWidth(), c.paperHeight())targetArea = QRectF(0, 0, width, height)c.render(imagePainter, targetArea, sourceArea)imagePainter.end()
image.save("out.png", "png")
9.3.2 Exportando em PDF
O seguinte fragmento de código renderiza a composição para um arquivo PDF
printer = QPrinter()printer.setOutputFormat(QPrinter.PdfFormat)printer.setOutputFileName("out.pdf")printer.setPaperSize(QSizeF(c.paperWidth(), c.paperHeight()), QPrinter.Millimeter)printer.setFullPage(True)printer.setColorMode(QPrinter.Color)printer.setResolution(c.printResolution())
pdfPainter = QPainter(printer)paperRectMM = printer.pageRect(QPrinter.Millimeter)paperRectPixel = printer.pageRect(QPrinter.DevicePixel)c.render(pdfPainter, paperRectPixel, paperRectMM)pdfPainter.end()
50 Chapter 9. Renderização em impressão de mapas
CHAPTER 10
Expressões, filtragem e cálculo dos valores
• Expressões de Análise• Expressões de Avaliação
– Expressões Básicas– Expressões com características– Manipulação de erros
• Exemplos
O QGIS possui alguns recursos para análise de expressões semelhantes à SQL. Apenas um pequeno subconjuntoda sintaxe SQL é suportado. As expressões podem ser avaliadas tanto como predicados booleanos (retornandoVerdadeiro ou Falso) ou como funções (retornando um valor escalar) . Veja vector_expressions no Manual doUsuário para uma lista completa das funções disponíveis.
Três tipos básicos são suportados:
• número — ambos os números inteiros e números decimais, por exemplo, 123, 3.14
• texto — eles devem estar entre aspas simples: ‘Olá world’‘
• coluna referência — ao avaliar, a referência é substituída com o valor real do campo. Os nomes não alteram.
As seguintes operações estão disponíveis:
• operadores aritméticos: +, -, *, /, ^
• parênteses: para fazer cumprir a precedência do operador: (1 + 1) * 3
• Sinal mais e menos: -12, +5
• funções matemáticas: sqrt, sen, cos, tan, asen, acos, atan
• Funções de conversão: “to_int”, “to_real”, “to_string”, “to_date”
• funções geométricas: $area, $length
• funções de manipulação de geometria: “$x”, “$y”, “$geometry”, “num_geometries”, “centroid”
E os seguintes predicados são suportados:
• comparação: =, !=, >, >=, <, <=
• correspondência padrão: LIKE (usando % e _), ~ (expressões regulares)
• predicados lógicos: AND, OR, NOT
• verificação de valor nulo: IS NULL, IS NOT NULL
Exemplos de predicados:
• 1 + 2 = 3
• sen(ângulo) > 0
51

PyQGIS developer cookbook, Versão 2.14
• ’Hello’ LIKE ’He%’
• (x > 10 AND y > 10) OR z = 0
Exemplos de expressões escalares:
• 2 ^ 10
• sqrt(val)
• $length + 1
10.1 Expressões de Análise
>>> exp = QgsExpression(’1 + 1 = 2’)>>> exp.hasParserError()False>>> exp = QgsExpression(’1 + 1 = ’)>>> exp.hasParserError()True>>> exp.parserErrorString()PyQt4.QtCore.QString(u’syntax error, unexpected $end’)
10.2 Expressões de Avaliação
10.2.1 Expressões Básicas
>>> exp = QgsExpression(’1 + 1 = 2’)>>> value = exp.evaluate()>>> value1
10.2.2 Expressões com características
O exemplo seguinte irá avaliar a expressão dada contra uma característica. “Column” é o nome do campo nacamada.
>>> exp = QgsExpression(’Column = 99’)>>> value = exp.evaluate(feature, layer.pendingFields())>>> bool(value)True
Você também pode usar QgsExpression.prepare() se você precisar verificar mais de uma característica.Usando QgsExpression.prepare() irá aumentar a velocidade que a avaliação leva para executar.
>>> exp = QgsExpression(’Column = 99’)>>> exp.prepare(layer.pendingFields())>>> value = exp.evaluate(feature)>>> bool(value)True
10.2.3 Manipulação de erros
exp = QgsExpression("1 + 1 = 2 ")if exp.hasParserError():
raise Exception(exp.parserErrorString())
52 Chapter 10. Expressões, filtragem e cálculo dos valores

PyQGIS developer cookbook, Versão 2.14
value = exp.evaluate()if exp.hasEvalError():
raise ValueError(exp.evalErrorString())
print value
10.3 Exemplos
O exemplo seguinte pode ser usado para filtrar uma camada e devolver qualquer característica que corresponda aum predicado.
def where(layer, exp):print "Where"exp = QgsExpression(exp)if exp.hasParserError():raise Exception(exp.parserErrorString())
exp.prepare(layer.pendingFields())for feature in layer.getFeatures():value = exp.evaluate(feature)if exp.hasEvalError():
raise ValueError(exp.evalErrorString())if bool(value):
yield feature
layer = qgis.utils.iface.activeLayer()for f in where(layer, ’Test > 1.0’):print f + " Matches expression"
10.3. Exemplos 53
PyQGIS developer cookbook, Versão 2.14
54 Chapter 10. Expressões, filtragem e cálculo dos valores
CHAPTER 11
Leitura e Armazenamento de Configurações
Muitas vezes é útil para o plugin salvar algumas variáveis para que o utilizador não necessite introduzir ou sele-cionar outra vez numa próxima vez que o plugin for acionado.
Estas variáveis podem ser salvas e recuperadas com a ajuda do Qt e QGIS API. Para cada variável, você devepegar a chave que será usada para acessar a variável — para cor favorita do usuário use a chave “favourite_color”ou alguma outra palavra com significado. É recomendado dar alguma estrutura para criação do nome das chaves.
Nós podemos diferenciar os diversos tipos de configurações:
• global settings — eles são amarrados ao usuário em uma determinada máquina. QGIS armazena um montede configurações globais, por exemplo, o tamanho da janela principal ou tolerância padrão de quebra. Essafuncionalidade é fornecida diretamente pelo framework Qt pela classe QSettings. Por padrão, essaclasse armazena as configurações na forma “nativa” de sistema de armazenamento de configrações, que é —registro (no Windows), o arquivo .plist (no Mac OS X) ou arquivo ini (no Unix). A documentação QSettings<http://doc.qt.io/qt-4.8/qsettings.html> _ é abrangente, por isso vamos fornecer apenas um exemplo simples
def store():s = QSettings()s.setValue("myplugin/mytext", "hello world")s.setValue("myplugin/myint", 10)s.setValue("myplugin/myreal", 3.14)
def read():s = QSettings()mytext = s.value("myplugin/mytext", "default text")myint = s.value("myplugin/myint", 123)myreal = s.value("myplugin/myreal", 2.71)
O segundo parâmetro do método value() é opcional e especifica o valor padrão se não for fornecido umadefinição do valor prévio para o nome da configuração passada.
• project settings — variar entre diferentes projetos e, portanto, eles estão conectados com um arquivo deprojeto. Cor de fundo de mapa de tela ou destino no sistema de coordenadas de referência (CRS) sãoexemplos — fundo branco e WGS84 pode ser adequado para um projeto, enquanto fundo amarelo e projeçãoUTM são melhores para outra. Um exemplo de uso segue
proj = QgsProject.instance()
# store valuesproj.writeEntry("myplugin", "mytext", "hello world")proj.writeEntry("myplugin", "myint", 10)proj.writeEntry("myplugin", "mydouble", 0.01)proj.writeEntry("myplugin", "mybool", True)
# read valuesmytext = proj.readEntry("myplugin", "mytext", "default text")[0]myint = proj.readNumEntry("myplugin", "myint", 123)[0]
55

PyQGIS developer cookbook, Versão 2.14
Como pode ver, o método writeEntry() é usado para todos os tipos de dados, mas em diversos métodosexiste para leitura um valor de configuração de retorno, e o correspondente tem de ser selecionado para cadatipo de dado.
• map layer settings — essas configurações estão relacionadas a uma instância específica de uma camadade mapa com um projeto. Eles não estão conectados com a fonte de uma camada de dados subjacente,por isso, se você criar duas instâncias da camada de mapa de um shapefile, eles não vão compartilhar asconfigurações. As configurações são armazenadas no arquivo de projeto, por isso, se o usuário abre oprojeto novamente, as definições relacionadas com a camada vai estar lá novamente. Esta funcionalidadefoi adicionada no QGIS v1.4. A API é semelhante à QSettings — leva e retorna instâncias QVariant
# save a valuelayer.setCustomProperty("mytext", "hello world")
# read the value againmytext = layer.customProperty("mytext", "default text")
56 Chapter 11. Leitura e Armazenamento de Configurações

CHAPTER 12
Comunicação com o usuário
• Mostrando mensagens. Classe QgsMessageBar• Mostrando progresso• Carregando
Esta seção mostra alguns métodos e elementos que devem ser usados para se comunicar com o usuário, a fim demanter a consistência na interface do usuário.
12.1 Mostrando mensagens. Classe QgsMessageBar
Usando caixas de mensagem pode ser uma má idéia, do ponto de vista da experiência do usuário. Para mostraruma pequena linha de informação ou uma mensagem de aviso/erro, a barra de mensagens QGIS é geralmente umaopção melhor.
Usando a referência ao objeto de interface QGIS, você pode mostrar uma mensagem na barra de mensagem como seguinte código
from qgis.gui import QgsMessageBariface.messageBar().pushMessage("Error", "I’m sorry Dave, I’m afraid I can’t do that", level=QgsMessageBar.CRITICAL)
Figure 12.1: Barra de mensagem do QGIS
Você pode definir uma duração de mostrá-lo por um tempo limitado
iface.messageBar().pushMessage("Error", ""Ooops, the plugin is not working as it should", level=QgsMessageBar.CRITICAL, duration=3)
Figure 12.2: Barra de Mensagem QGIS como temporizar
Os exemplos acima mostram uma barra de erro, mas o parâmetro ‘‘ level‘‘ pode ser usado para criarmensagens de aviso ou mensagens de informação, usando as constantes QgsMessageBar.WARNING e
57

PyQGIS developer cookbook, Versão 2.14
QgsMessageBar.INFO respectivamente.
Figure 12.3: Barra de mensagens QGIS (informação)
Widgets podem ser adicionados à barra de mensagens, como por exemplo, um botão para mostrar mais infor-mações
def showError():pass
widget = iface.messageBar().createMessage("Missing Layers", "Show Me")button = QPushButton(widget)button.setText("Show Me")button.pressed.connect(showError)widget.layout().addWidget(button)iface.messageBar().pushWidget(widget, QgsMessageBar.WARNING)
Figure 12.4: Barra de mensagens QGIS com um botão
Você ainda pode usar uma barra de mensagens em sua própria caixa de diálogo para que você não tenha de mostraruma caixa de mensagem, ou se ela não faz sentido para mostrá-la na janela principal QGIS
class MyDialog(QDialog):def __init__(self):
QDialog.__init__(self)self.bar = QgsMessageBar()self.bar.setSizePolicy( QSizePolicy.Minimum, QSizePolicy.Fixed )self.setLayout(QGridLayout())self.layout().setContentsMargins(0, 0, 0, 0)self.buttonbox = QDialogButtonBox(QDialogButtonBox.Ok)self.buttonbox.accepted.connect(self.run)self.layout().addWidget(self.buttonbox, 0, 0, 2, 1)self.layout().addWidget(self.bar, 0, 0, 1, 1)
def run(self):self.bar.pushMessage("Hello", "World", level=QgsMessageBar.INFO)
12.2 Mostrando progresso
As barras de progresso também pode ser colocado na barra de mensagem QGIS, uma vez que, como vimos, eleaceita widgets. Aqui está um exemplo que você pode tentar no console.
import timefrom PyQt4.QtGui import QProgressBarfrom PyQt4.QtCore import *
58 Chapter 12. Comunicação com o usuário
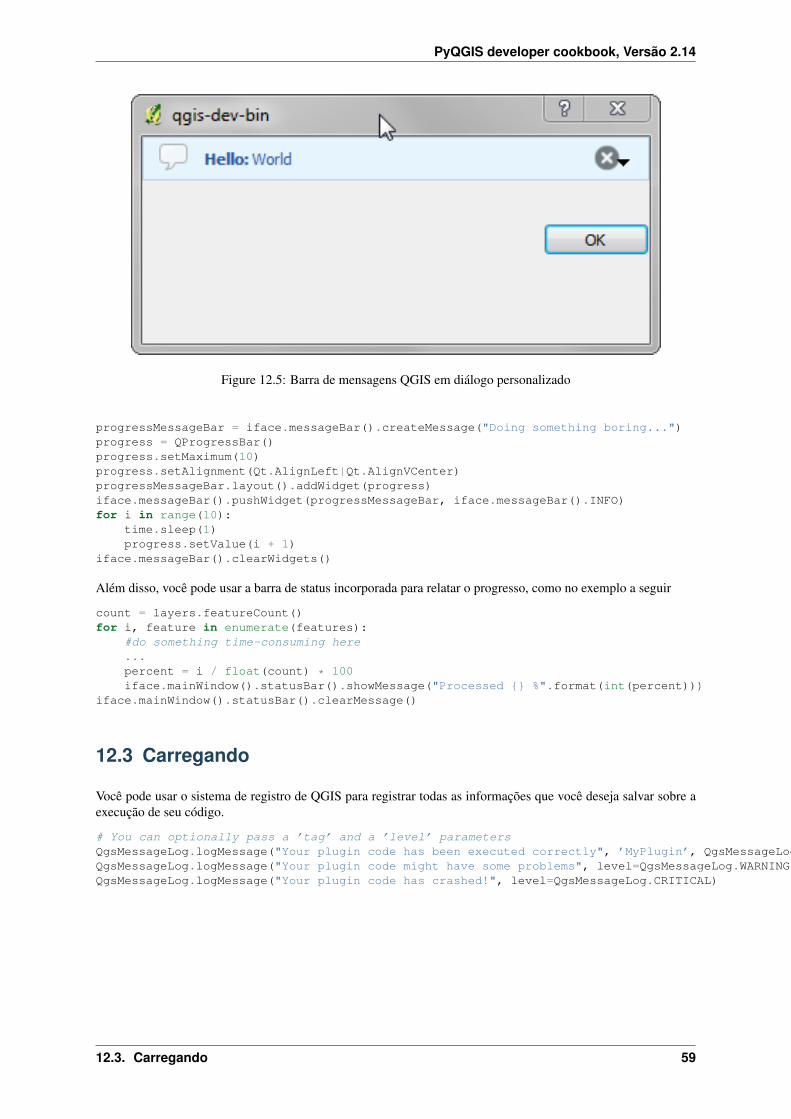
PyQGIS developer cookbook, Versão 2.14
Figure 12.5: Barra de mensagens QGIS em diálogo personalizado
progressMessageBar = iface.messageBar().createMessage("Doing something boring...")progress = QProgressBar()progress.setMaximum(10)progress.setAlignment(Qt.AlignLeft|Qt.AlignVCenter)progressMessageBar.layout().addWidget(progress)iface.messageBar().pushWidget(progressMessageBar, iface.messageBar().INFO)for i in range(10):
time.sleep(1)progress.setValue(i + 1)
iface.messageBar().clearWidgets()
Além disso, você pode usar a barra de status incorporada para relatar o progresso, como no exemplo a seguir
count = layers.featureCount()for i, feature in enumerate(features):
#do something time-consuming here...percent = i / float(count) * 100iface.mainWindow().statusBar().showMessage("Processed {} %".format(int(percent)))
iface.mainWindow().statusBar().clearMessage()
12.3 Carregando
Você pode usar o sistema de registro de QGIS para registrar todas as informações que você deseja salvar sobre aexecução de seu código.
# You can optionally pass a ’tag’ and a ’level’ parametersQgsMessageLog.logMessage("Your plugin code has been executed correctly", ’MyPlugin’, QgsMessageLog.INFO)QgsMessageLog.logMessage("Your plugin code might have some problems", level=QgsMessageLog.WARNING)QgsMessageLog.logMessage("Your plugin code has crashed!", level=QgsMessageLog.CRITICAL)
12.3. Carregando 59

PyQGIS developer cookbook, Versão 2.14
60 Chapter 12. Comunicação com o usuário

CHAPTER 13
Desenvolvimento de Complementos Python
• Escrevendo um complemento– arquivos de complementos
• Conteúdo do complemento– Plugin metadados– __init__.py– mainPlugin.py– Arquivo de Recursos
• Documentação• Tradução
– Software requirements– Files and directory
* .pro file* .ts file* .qm file
– Carregar o complemento
É possível criar plugins usando a linguagem de programação Python. Em comparação com plugins clássicoscriados em C++, esses devem ser mais fáceis de escrever, entender, manter e distribuir devido à natureza dinâmicada linguagem Python.
Python plugins are listed together with C++ plugins in QGIS plugin manager. They are searched for in these paths:
• UNIX/Mac: ~/.qgis2/python/plugins and (qgis_prefix)/share/qgis/python/plugins
• Windows: ~/.qgis2/python/plugins and (qgis_prefix)/python/plugins
Home directory (denoted by above ~) on Windows is usually something like C:\Documents andSettings\(user) (on Windows XP or earlier) or C:\Users\(user). Since QGIS is using Python 2.7,subdirectories of these paths have to contain an __init__.py file to be considered Python packages that can beimported as plugins.
Nota: By setting QGIS_PLUGINPATH to an existing directory path, you can add this path to the list of pathsthat are searched for plugins.
Passos:
1. Ideia: Tenha uma ideia sobre o que você quer fazer com seu novo plugin QGIS. Por que você quer fazê-lo?Qual problema você gostaria de resolver? Já existe outro plugin para este tipo de problema?
2. Create files: Create the files described next. A starting point (__init__.py). Fill in the Plugin metadados(metadata.txt) A main python plugin body (mainplugin.py). A form in QT-Designer (form.ui),with its resources.qrc.
3. Write code: Write the code inside the mainplugin.py
4. Test: Close and re-open QGIS and import your plugin again. Check if everything is OK.
61
PyQGIS developer cookbook, Versão 2.14
5. Publish: Publish your plugin in QGIS repository or make your own repository as an “arsenal” of personal“GIS weapons”.
13.1 Escrevendo um complemento
Since the introduction of Python plugins in QGIS, a number of plugins have appeared - on Plugin Repositorieswiki page you can find some of them, you can use their source to learn more about programming with PyQGIS orfind out whether you are not duplicating development effort. The QGIS team also maintains an Repositório oficialde complementos python. Ready to create a plugin but no idea what to do? Python Plugin Ideas wiki page listswishes from the community!
13.1.1 arquivos de complementos
Está é a estrutura de diretórios do nosso exemplo de complemento
PYTHON_PLUGINS_PATH/MyPlugin/__init__.py --> *required*mainPlugin.py --> *required*metadata.txt --> *required*resources.qrc --> *likely useful*resources.py --> *compiled version, likely useful*form.ui --> *likely useful*form.py --> *compiled version, likely useful*
Qual o significado dos arquivos:
• __init__.py = The starting point of the plugin. It has to have the classFactory() method and mayhave any other initialisation code.
• mainPlugin.py = The main working code of the plugin. Contains all the information about the actionsof the plugin and the main code.
• resources.qrc = The .xml document created by Qt Designer. Contains relative paths to resources ofthe forms.
• resources.py = A tradução do arquivo .qrc descrito acima para Python.
• form.ui = A GUI creiada pelo Qt Designer.
• form.py = A tradução do formulário .ui descrito acima para Python.
• metadata.txt = Required for QGIS >= 1.8.0. Contains general info, version, name and someother metadata used by plugins website and plugin infrastructure. Since QGIS 2.0 the metadata from__init__.py are not accepted anymore and the metadata.txt is required.
Here is an online automated way of creating the basic files (skeleton) of a typical QGIS Python plugin.
Also there is a QGIS plugin called Plugin Builder that creates plugin template from QGIS and doesn’t requireinternet connection. This is the recommended option, as it produces 2.0 compatible sources.
Aviso: If you plan to upload the plugin to the Repositório oficial de complementos python you must checkthat your plugin follows some additional rules, required for plugin Validação
13.2 Conteúdo do complemento
Here you can find information and examples about what to add in each of the files in the file structure describedabove.
62 Chapter 13. Desenvolvimento de Complementos Python

PyQGIS developer cookbook, Versão 2.14
13.2.1 Plugin metadados
First, plugin manager needs to retrieve some basic information about the plugin such as its name, description etc.File metadata.txt is the right place to put this information.
Importante: Todos os metadados devem estar codificados em UTF-8.
Nomemetada-dos
re-querida
Notas
Nome Ver-dadeiro
a short string containing the name of the plugin
qgisMini-mumVer-sion
Ver-dadeiro
dotted notation of minimum QGIS version
qgisMaxi-mumVer-sion
Falso versão QGIS máxima com notação pontilhada
Descrição Ver-dadeiro
texto pequeno que descreve o complemento, HTML não é permitido
sobre Ver-dadeiro
texto longo que descreve o complemento em detalhes, HTML não é permitido
Versão Ver-dadeiro
caracteres curtos com a versão com notação pontilhada
Autor Ver-dadeiro
nome do autor
email Ver-dadeiro
email of the author, not shown in the QGIS plugin manager or in the website unless bya registered logged in user, so only visible to other plugin authors and plugin websiteadministrators
changelog Falso string, can be multiline, no HTML allowedexperimen-tal
Falso valor booleano, True ou False
de-saprovado
Falso valor booleano,‘True‘ ou False‘, aplica-se a todo o plugin e não apenas para a versãocarregada
etiquetas Falso lista separada por vírgulas, espaços são permitidos dentro das etiquetas individuaispáginainicial
Falso uma URL válida apontando para a página inicial do seu plugin
Repositório Ver-dadeiro
uma URL válida para repositório do código fonte
rastreador Falso uma URL válida para o reporte de chamadas e errosÍcone Falso a file name or a relative path (relative to the base folder of the plugin’s compressed
package) of a web friendly image (PNG, JPEG)Categoria Falso one of Raster, Vector, Database and Web
By default, plugins are placed in the Plugins menu (we will see in the next section how to add a menu entry foryour plugin) but they can also be placed the into Raster, Vector, Database and Web menus.
A corresponding “category” metadata entry exists to specify that, so the plugin can be classified accordingly. Thismetadata entry is used as tip for users and tells them where (in which menu) the plugin can be found. Allowedvalues for “category” are: Vector, Raster, Database or Web. For example, if your plugin will be available fromRaster menu, add this to metadata.txt
category=Raster
Nota: If qgisMaximumVersion is empty, it will be automatically set to the major version plus .99 when uploadedto the Repositório oficial de complementos python.
Um exemplo para este metadata.txt
13.2. Conteúdo do complemento 63
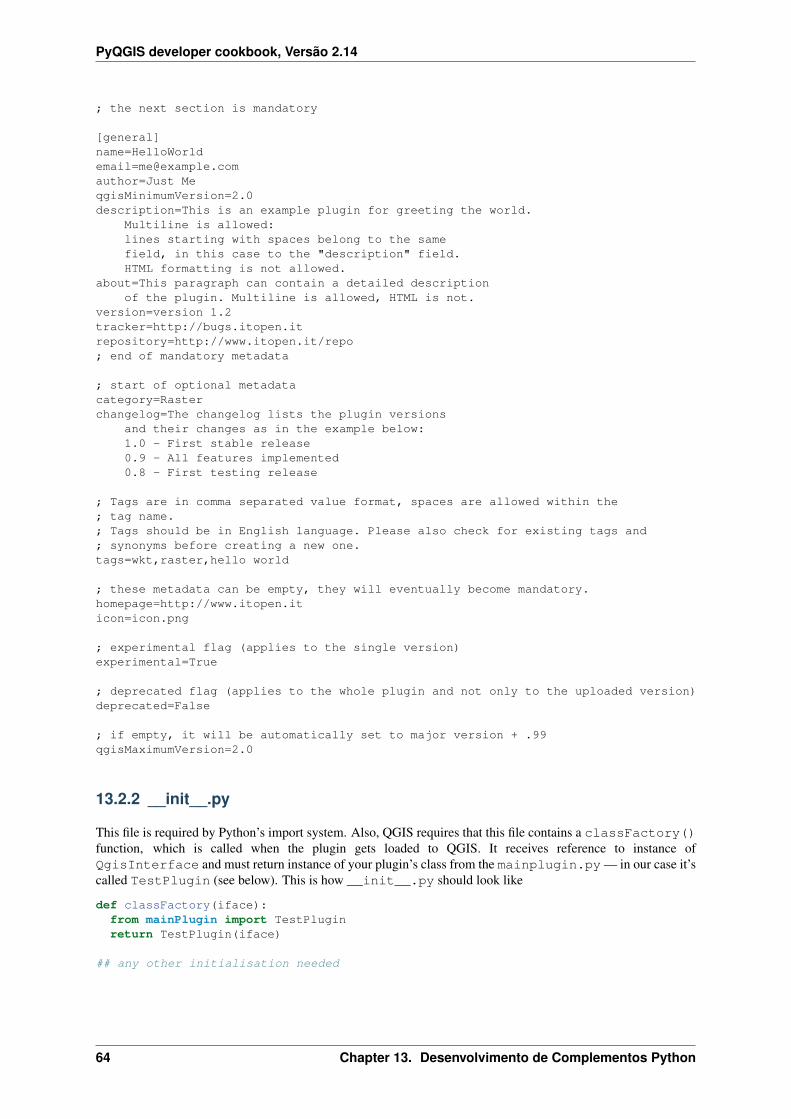
PyQGIS developer cookbook, Versão 2.14
; the next section is mandatory
[general][email protected]=Just MeqgisMinimumVersion=2.0description=This is an example plugin for greeting the world.
Multiline is allowed:lines starting with spaces belong to the samefield, in this case to the "description" field.HTML formatting is not allowed.
about=This paragraph can contain a detailed descriptionof the plugin. Multiline is allowed, HTML is not.
version=version 1.2tracker=http://bugs.itopen.itrepository=http://www.itopen.it/repo; end of mandatory metadata
; start of optional metadatacategory=Rasterchangelog=The changelog lists the plugin versions
and their changes as in the example below:1.0 - First stable release0.9 - All features implemented0.8 - First testing release
; Tags are in comma separated value format, spaces are allowed within the; tag name.; Tags should be in English language. Please also check for existing tags and; synonyms before creating a new one.tags=wkt,raster,hello world
; these metadata can be empty, they will eventually become mandatory.homepage=http://www.itopen.iticon=icon.png
; experimental flag (applies to the single version)experimental=True
; deprecated flag (applies to the whole plugin and not only to the uploaded version)deprecated=False
; if empty, it will be automatically set to major version + .99qgisMaximumVersion=2.0
13.2.2 __init__.py
This file is required by Python’s import system. Also, QGIS requires that this file contains a classFactory()function, which is called when the plugin gets loaded to QGIS. It receives reference to instance ofQgisInterface and must return instance of your plugin’s class from the mainplugin.py — in our case it’scalled TestPlugin (see below). This is how __init__.py should look like
def classFactory(iface):from mainPlugin import TestPluginreturn TestPlugin(iface)
## any other initialisation needed
64 Chapter 13. Desenvolvimento de Complementos Python

PyQGIS developer cookbook, Versão 2.14
13.2.3 mainPlugin.py
This is where the magic happens and this is how magic looks like: (e.g. mainPlugin.py)
from PyQt4.QtCore import *from PyQt4.QtGui import *from qgis.core import *
# initialize Qt resources from file resources.pyimport resources
class TestPlugin:
def __init__(self, iface):# save reference to the QGIS interfaceself.iface = iface
def initGui(self):# create action that will start plugin configurationself.action = QAction(QIcon(":/plugins/testplug/icon.png"), "Test plugin", self.iface.mainWindow())self.action.setObjectName("testAction")self.action.setWhatsThis("Configuration for test plugin")self.action.setStatusTip("This is status tip")QObject.connect(self.action, SIGNAL("triggered()"), self.run)
# add toolbar button and menu itemself.iface.addToolBarIcon(self.action)self.iface.addPluginToMenu("&Test plugins", self.action)
# connect to signal renderComplete which is emitted when canvas# rendering is doneQObject.connect(self.iface.mapCanvas(), SIGNAL("renderComplete(QPainter *)"), self.renderTest)
def unload(self):# remove the plugin menu item and iconself.iface.removePluginMenu("&Test plugins", self.action)self.iface.removeToolBarIcon(self.action)
# disconnect form signal of the canvasQObject.disconnect(self.iface.mapCanvas(), SIGNAL("renderComplete(QPainter *)"), self.renderTest)
def run(self):# create and show a configuration dialog or something similarprint "TestPlugin: run called!"
def renderTest(self, painter):# use painter for drawing to map canvasprint "TestPlugin: renderTest called!"
The only plugin functions that must exist in the main plugin source file (e.g. mainPlugin.py) are:
• __init__ –> Dá acesso à interface QGIS
• initGui() –> chamada quando o complemento é carregado
• unload()‘ –> chamada quando o complemento é descarregado
You can see that in the above example, the addPluginToMenu() is used. This will add the correspondingmenu action to the Plugins menu. Alternative methods exist to add the action to a different menu. Here is a list ofthose methods:
• addPluginToRasterMenu()
• addPluginToVectorMenu()
• addPluginToDatabaseMenu()
13.2. Conteúdo do complemento 65

PyQGIS developer cookbook, Versão 2.14
• addPluginToWebMenu()
All of them have the same syntax as the addPluginToMenu() method.
Adding your plugin menu to one of those predefined method is recommended to keep consistency in how pluginentries are organized. However, you can add your custom menu group directly to the menu bar, as the next exampledemonstrates:
def initGui(self):self.menu = QMenu(self.iface.mainWindow())self.menu.setObjectName("testMenu")self.menu.setTitle("MyMenu")
self.action = QAction(QIcon(":/plugins/testplug/icon.png"), "Test plugin", self.iface.mainWindow())self.action.setObjectName("testAction")self.action.setWhatsThis("Configuration for test plugin")self.action.setStatusTip("This is status tip")QObject.connect(self.action, SIGNAL("triggered()"), self.run)self.menu.addAction(self.action)
menuBar = self.iface.mainWindow().menuBar()menuBar.insertMenu(self.iface.firstRightStandardMenu().menuAction(), self.menu)
def unload(self):self.menu.deleteLater()
Don’t forget to set QAction and QMenu objectName to a name specific to your plugin so that it can becustomized.
13.2.4 Arquivo de Recursos
You can see that in initGui() we’ve used an icon from the resource file (called resources.qrc in our case)
<RCC><qresource prefix="/plugins/testplug" >
<file>icon.png</file></qresource>
</RCC>
It is good to use a prefix that will not collide with other plugins or any parts of QGIS, otherwise you might getresources you did not want. Now you just need to generate a Python file that will contain the resources. It’s donewith pyrcc4 command:
pyrcc4 -o resources.py resources.qrc
Nota: In Windows environments, attempting to run the pyrcc4 from Command Prompt or Powershell willprobably result in the error “Windows cannot access the specified device, path, or file [...]”. The easiest solutionis probably to use the OSGeo4W Shell but if you are comfortable modifying the PATH environment variableor specifiying the path to the executable explicitly you should be able to find it at <Your QGIS InstallDirectory>\bin\pyrcc4.exe.
E isso é tudo... nada complicado :)
If you’ve done everything correctly you should be able to find and load your plugin in the plugin manager and seea message in console when toolbar icon or appropriate menu item is selected.
When working on a real plugin it’s wise to write the plugin in another (working) directory and create a makefilewhich will generate UI + resource files and install the plugin to your QGIS installation.
66 Chapter 13. Desenvolvimento de Complementos Python

PyQGIS developer cookbook, Versão 2.14
13.3 Documentação
The documentation for the plugin can be written as HTML help files. The qgis.utils module provides afunction, showPluginHelp() which will open the help file browser, in the same way as other QGIS help.
The showPluginHelp() function looks for help files in the same directory as the calling module. It willlook for, in turn, index-ll_cc.html, index-ll.html, index-en.html, index-en_us.html andindex.html, displaying whichever it finds first. Here ll_cc is the QGIS locale. This allows multiple transla-tions of the documentation to be included with the plugin.
The showPluginHelp() function can also take parameters packageName, which identifies a specific pluginfor which the help will be displayed, filename, which can replace “index” in the names of files being searched,and section, which is the name of an html anchor tag in the document on which the browser will be positioned.
13.4 Tradução
With a few steps you can set up the environment for the plugin localization so that depending on the locale settingsof your computer the plugin will be loaded in different languages.
13.4.1 Software requirements
The easiest way to create and manage all the translation files is to install Qt Linguist. In a Linux like environmentyou can install it typing:
sudo apt-get install qt4-dev-tools
13.4.2 Files and directory
When you create the plugin you will find the i18n folder within the main plugin directory.
All the translation files have to be within this directory.
.pro file
First you should create a .pro file, that is a project file that can be managed by Qt Linguist.
In this .pro file you have to specify all the files and forms you want to translate. This file is used to set up thelocalization files and variables. An example of the pro file is:
FORMS = ../ui/*
SOURCES = ../your_plugin.py
TRANSLATIONS = your_plugin_it.ts
In this particular case all your UIs are placed in the ../ui folder and you want to translate all of them.
Furthermore, the your_plugin.py file is the file that calls all the menu and sub-menus of your plugin in theQGIS toolbar and you want to translate them all.
Finally with the TRANSLATIONS variable you can specify the translation languages you want.
Aviso: Be sure to name the ts file like your_plugin_ + language + .ts otherwise the languageloading will fail! Use 2 letters shortcut for the language (it for Italian, de for German, etc...)
13.3. Documentação 67
PyQGIS developer cookbook, Versão 2.14
.ts file
Once you have created the .pro you are ready to generate the .ts file(s) of the language(s) of your plugin.
Open a terminal, go to your_plugin/i18n directory and type:
lupdate your_plugin.pro
you should see the your_plugin_language.ts file(s).
Open the .ts file with Qt Linguist and start to translate.
.qm file
When you finish to translate your plugin (if some strings are not completed the source language for those stringswill be used) you have to create the .qm file (the compiled .ts file that will be used by QGIS).
Just open a terminal cd in your_plugin/i18n directory and type:
lrelease your_plugin.ts
now, in the i18n directory you will see the your_plugin.qm file(s).
13.4.3 Carregar o complemento
In order to see the translation of your plugin just open QGIS, change the language (Settings → Options → Lan-guage) and restart QGIS.
You should see your plugin in the correct language.
Aviso: If you change something in your plugin (new UIs, new menu, etc..) you have to generate again theupdate version of both .ts and .qm file, so run again the command of above.
68 Chapter 13. Desenvolvimento de Complementos Python

CHAPTER 14
Configurações de IDE para escrita e depuração de plugins
• Uma nota na configuração IDE para Windows• Depuração usando Eclipse e PyDev
– Instalação– Preparando QGIS– Configurando Eclipse– Configurando o depurador– Fazendo eclipse entender a API
• Depuração usando PDB
Embora cada programador tem seu editor de Texto/IDE preferido, aqui estão algumas recomendações para con-figurar o IDE populares para escrever e depurar plugins QGIS Python.
14.1 Uma nota na configuração IDE para Windows
No Linux não é necessária configuração adicional para desenvolver complementos. Se você estiver utilizandoWindows, certifique-se de possuir as mesmas configurações de ambiente e utilizar as mesmas bibliotecas e inter-pretador utilizados pelo QGIS. A forma mais rápida de fazer isso, é modificar o arquivo em lote de inicializaçãodo QGIS.
Se você utilizou o instalador OSGeo4W, o arquivo de inicialização pode ser encontrado dentro da pasta bin dodiretório de instalação do OSGeo4W. Procure por algo como C:\OSGeo4W\bin\qgis-unstable.bat.
Para usar Pyscripter IDE, eis o que tem de fazer:
• Faça uma cópia do arquivo qgis-unstable.bat e renomeie para pyscripter.bat.
• Abra-o em um editor. E remova a última linha, a que inicia o QGIS.
• Adicione uma linha que aponte para o seu executável Pyscripter e adicione o argumento de linha de comandoque define a versão do Phyton a ser utilizada (2.7 no caso do QGIS >= 2.0).
• Além disso, adicione o argumento de que aponta para a pasta onde PyScripter encontrará a dll Python usadopelo QGIS, você pode encontrá-la na pasta de arquivos binários da instalação OSGeoW
@echo offSET OSGEO4W_ROOT=C:\OSGeo4Wcall "%OSGEO4W_ROOT%"\bin\o4w_env.batcall "%OSGEO4W_ROOT%"\bin\gdal16.bat@echo offpath %PATH%;%GISBASE%\binStart C:\pyscripter\pyscripter.exe --python25 --pythondllpath=C:\OSGeo4W\bin
Agora, quando você clicar duas vezes neste arquivo de lote, vai iniciar PyScripter, com o caminho correto.
69
PyQGIS developer cookbook, Versão 2.14
Mais popular que o Pyscripter, o Eclipse é uma escolha comum entre os desenvolvedores. Nas seções seguintes,nós iremos explicar como configurá-lo para desenvolver e testar complementos. No Windows, para preparar oambiente para a utilização do Eclipse, você também precisará criar um arquivo em lote para iniciá-lo.
Para criar o arquivo em lote, siga os passos a seguir:
• Localize a pasta onde está o arquivo qgis_core.dll. Normalmente ele pode ser encontrado emC:\OSGeo4W\apps\qgis\bin, mas se você compilou seu próprio QGIS, o arquivo estará na sua pastade compilação em output/bin/RelWithDebInfo.
• Localize seu executável eclipse.exe.
• Crie o seguinte script e use para iniciar eclipse quando estiver desenvolvendo plugins QGIS.
call "C:\OSGeo4W\bin\o4w_env.bat"set PATH=%PATH%;C:\path\to\your\qgis_core.dll\parent\folderC:\path\to\your\eclipse.exe
14.2 Depuração usando Eclipse e PyDev
14.2.1 Instalação
Para usar Eclipse, certifique-se que tem instalado o seguinte:
• Eclipse
• Aptana Eclipse Plugin ou PyDev
• QGIS 2.x
14.2.2 Preparando QGIS
É preciso fazer uma preparação no próprio QGIS. Existem dois complementos necessários: Remote Debug ePlugin reloader.
• Vá para Complementos → Gerenciar e Instalar Complementos...
• Procure por Remote Debug (no memento este complemento ainda é experimental, portanto você precisahabilitar a exibição de complementos experimentais em Opções no menu à esquerda caso ele não apareça). Instale ele.
• Procurar por Plugin reloader e instalá-lo. Isso permitirá que você recarregue um plugin em vez de ter quefechar e reiniciar QGIS para ter o plugin recarregado.
14.2.3 Configurando Eclipse
Em Eclipse, crie um novo projeto. Você pode selecionar*General Project* e vincular suas fontes reais mais tarde,por isso realmente não importa onde você coloca este projeto.
Agora clique com o botão direito no seu novo projeto e selecione New → Folder.
Click [Advanced] and choose Link to alternate location (Linked Folder). In case you already have sources youwant to debug, choose these. In case you don’t, create a folder as it was already explained.
Agora, na visão Project Explorer, sua árvore de origem aparece e você pode começar a trabalhar com o código.Você já tem destaque de sintaxe e todas as outras ferramentas IDE disponíveis.
70 Chapter 14. Configurações de IDE para escrita e depuração de plugins

PyQGIS developer cookbook, Versão 2.14
Figure 14.1: Projeto Eclipse
14.2. Depuração usando Eclipse e PyDev 71
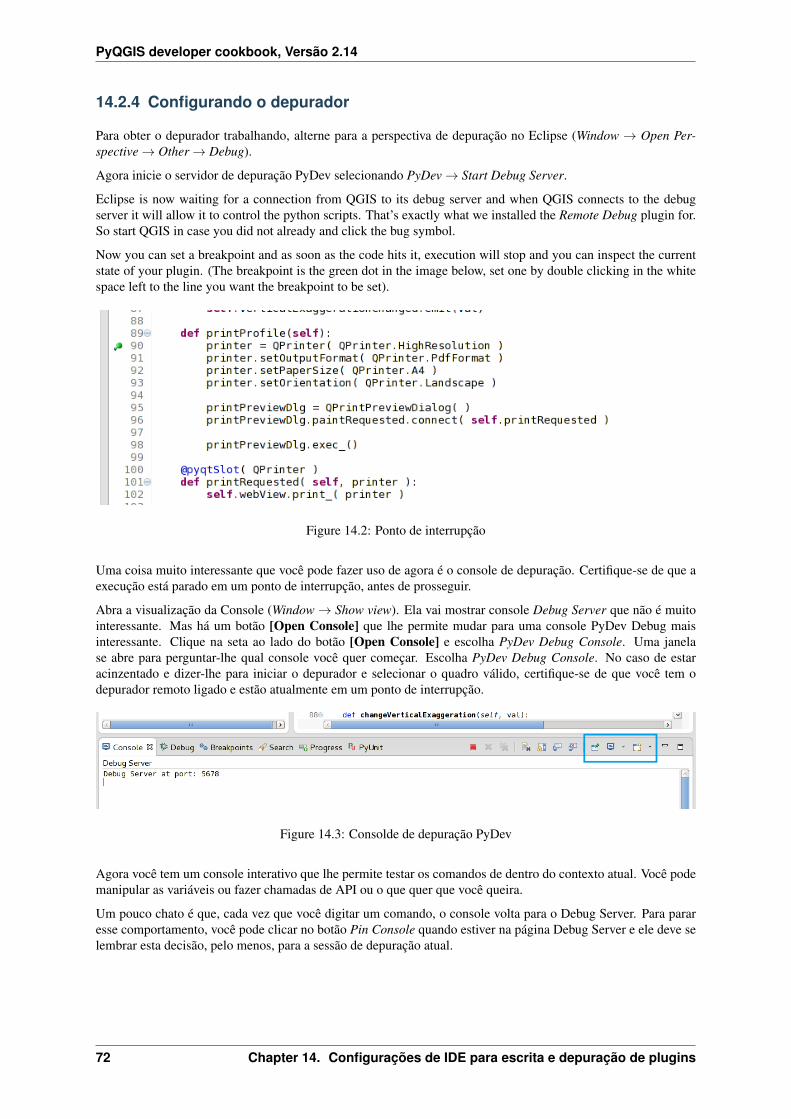
PyQGIS developer cookbook, Versão 2.14
14.2.4 Configurando o depurador
Para obter o depurador trabalhando, alterne para a perspectiva de depuração no Eclipse (Window → Open Per-spective → Other → Debug).
Agora inicie o servidor de depuração PyDev selecionando PyDev → Start Debug Server.
Eclipse is now waiting for a connection from QGIS to its debug server and when QGIS connects to the debugserver it will allow it to control the python scripts. That’s exactly what we installed the Remote Debug plugin for.So start QGIS in case you did not already and click the bug symbol.
Now you can set a breakpoint and as soon as the code hits it, execution will stop and you can inspect the currentstate of your plugin. (The breakpoint is the green dot in the image below, set one by double clicking in the whitespace left to the line you want the breakpoint to be set).
Figure 14.2: Ponto de interrupção
Uma coisa muito interessante que você pode fazer uso de agora é o console de depuração. Certifique-se de que aexecução está parado em um ponto de interrupção, antes de prosseguir.
Abra a visualização da Console (Window → Show view). Ela vai mostrar console Debug Server que não é muitointeressante. Mas há um botão [Open Console] que lhe permite mudar para uma console PyDev Debug maisinteressante. Clique na seta ao lado do botão [Open Console] e escolha PyDev Debug Console. Uma janelase abre para perguntar-lhe qual console você quer começar. Escolha PyDev Debug Console. No caso de estaracinzentado e dizer-lhe para iniciar o depurador e selecionar o quadro válido, certifique-se de que você tem odepurador remoto ligado e estão atualmente em um ponto de interrupção.
Figure 14.3: Consolde de depuração PyDev
Agora você tem um console interativo que lhe permite testar os comandos de dentro do contexto atual. Você podemanipular as variáveis ou fazer chamadas de API ou o que quer que você queira.
Um pouco chato é que, cada vez que você digitar um comando, o console volta para o Debug Server. Para pararesse comportamento, você pode clicar no botão Pin Console quando estiver na página Debug Server e ele deve selembrar esta decisão, pelo menos, para a sessão de depuração atual.
72 Chapter 14. Configurações de IDE para escrita e depuração de plugins
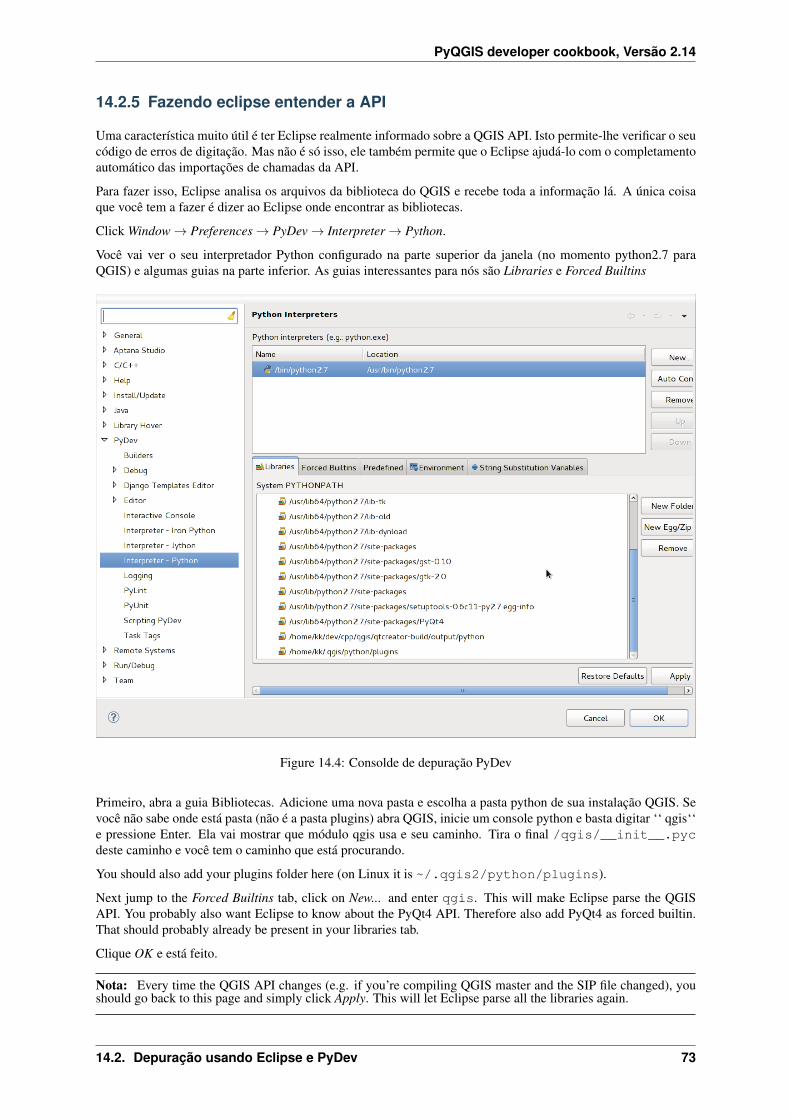
PyQGIS developer cookbook, Versão 2.14
14.2.5 Fazendo eclipse entender a API
Uma característica muito útil é ter Eclipse realmente informado sobre a QGIS API. Isto permite-lhe verificar o seucódigo de erros de digitação. Mas não é só isso, ele também permite que o Eclipse ajudá-lo com o completamentoautomático das importações de chamadas da API.
Para fazer isso, Eclipse analisa os arquivos da biblioteca do QGIS e recebe toda a informação lá. A única coisaque você tem a fazer é dizer ao Eclipse onde encontrar as bibliotecas.
Click Window → Preferences → PyDev → Interpreter → Python.
Você vai ver o seu interpretador Python configurado na parte superior da janela (no momento python2.7 paraQGIS) e algumas guias na parte inferior. As guias interessantes para nós são Libraries e Forced Builtins
Figure 14.4: Consolde de depuração PyDev
Primeiro, abra a guia Bibliotecas. Adicione uma nova pasta e escolha a pasta python de sua instalação QGIS. Sevocê não sabe onde está pasta (não é a pasta plugins) abra QGIS, inicie um console python e basta digitar ‘‘ qgis‘‘e pressione Enter. Ela vai mostrar que módulo qgis usa e seu caminho. Tira o final /qgis/__init__.pycdeste caminho e você tem o caminho que está procurando.
You should also add your plugins folder here (on Linux it is ~/.qgis2/python/plugins).
Next jump to the Forced Builtins tab, click on New... and enter qgis. This will make Eclipse parse the QGISAPI. You probably also want Eclipse to know about the PyQt4 API. Therefore also add PyQt4 as forced builtin.That should probably already be present in your libraries tab.
Clique OK e está feito.
Nota: Every time the QGIS API changes (e.g. if you’re compiling QGIS master and the SIP file changed), youshould go back to this page and simply click Apply. This will let Eclipse parse all the libraries again.
14.2. Depuração usando Eclipse e PyDev 73

PyQGIS developer cookbook, Versão 2.14
Para outra configuração possível do Eclipse para trabalhar com plugins QGIS Python, verifque este link<http://linfiniti.com/2011/12/remote-debugging-qgis-python-plugins-with-pydev>‘_
14.3 Depuração usando PDB
Se você não usar um IDE como o Eclipse, você pode depurar usando PDB, seguindo estes passos.
Primeiro adicione este código no local onde você gostaria de depurar
# Use pdb for debuggingimport pdb# These lines allow you to set a breakpoint in the apppyqtRemoveInputHook()pdb.set_trace()
Em seguida, execute QGIS a partir da linha de comando.
No Linux faça:
$ ./Qgis
On Max OS X faça:
$ /Applications/Qgis.app/Contents/MacOS/Qgis
E quando o aplicativo atingir o seu ponto de interrupção você pode digitar no console!
TODO: Adicione informação de testes
74 Chapter 14. Configurações de IDE para escrita e depuração de plugins
CHAPTER 15
Usando Camadas de Plugins
Se o seu plugin usa seus próprios métodos para tornar uma camada de mapa, escrever o seu próprio tipo de camadacom base em QgsPluginLayer pode ser a melhor maneira de implementar isso.
A FAZER: Verifique a exatidão e elabore bons casos de uso para QgsPluginLayer, ...
15.1 Subclasses QgsPluginLayer
Abaixo está um exemplo de uma implementação mínima QgsPluginLayer. É um trecho de exemplo do pluginWatermark
class WatermarkPluginLayer(QgsPluginLayer):
LAYER_TYPE="watermark"
def __init__(self):QgsPluginLayer.__init__(self, WatermarkPluginLayer.LAYER_TYPE, "Watermark plugin layer")self.setValid(True)
def draw(self, rendererContext):image = QImage("myimage.png")painter = rendererContext.painter()painter.save()painter.drawImage(10, 10, image)painter.restore()return True
Os métodos para ler e escrever informações específicas para o arquivo de projeto também podem ser adicionados
def readXml(self, node):pass
def writeXml(self, node, doc):pass
Ao carregar um projeto que contém uma tal camada , uma classe de fábrica é necessária
class WatermarkPluginLayerType(QgsPluginLayerType):
def __init__(self):QgsPluginLayerType.__init__(self, WatermarkPluginLayer.LAYER_TYPE)
def createLayer(self):return WatermarkPluginLayer()
Você também pode adicionar código para exibir informações personalizadas nas propriedades da camada
75
PyQGIS developer cookbook, Versão 2.14
def showLayerProperties(self, layer):pass
76 Chapter 15. Usando Camadas de Plugins

CHAPTER 16
Compatibilidade com versões anteriores do QGIS
16.1 menu Complementos
Se você colocar o plugin de itens do menu em um dos novos menus (Raster, Vector, Database or Web‘), vocêdeve modificar o código das funções : func: initGUI () e:unload(). Uma vez que estes novos menus estãodisponíveis somente no QGIS 2,0 e maior, o primeiro passo é verificar se a versão do QGIS em execução temtodas as funções necessárias. Se os novos menus estão disponíveis, vamos colocar nosso plugin neste menu, casocontrário, vamos usar o velho: Plugins. Aqui está um exemplo para menu Raster
def initGui(self):# create action that will start plugin configurationself.action = QAction(QIcon(":/plugins/testplug/icon.png"), "Test plugin", self.iface.mainWindow())self.action.setWhatsThis("Configuration for test plugin")self.action.setStatusTip("This is status tip")QObject.connect(self.action, SIGNAL("triggered()"), self.run)
# check if Raster menu availableif hasattr(self.iface, "addPluginToRasterMenu"):# Raster menu and toolbar availableself.iface.addRasterToolBarIcon(self.action)self.iface.addPluginToRasterMenu("&Test plugins", self.action)
else:# there is no Raster menu, place plugin under Plugins menu as usualself.iface.addToolBarIcon(self.action)self.iface.addPluginToMenu("&Test plugins", self.action)
# connect to signal renderComplete which is emitted when canvas rendering is doneQObject.connect(self.iface.mapCanvas(), SIGNAL("renderComplete(QPainter *)"), self.renderTest)
def unload(self):# check if Raster menu available and remove our buttons from appropriate# menu and toolbarif hasattr(self.iface, "addPluginToRasterMenu"):self.iface.removePluginRasterMenu("&Test plugins", self.action)self.iface.removeRasterToolBarIcon(self.action)
else:self.iface.removePluginMenu("&Test plugins", self.action)self.iface.removeToolBarIcon(self.action)
# disconnect from signal of the canvasQObject.disconnect(self.iface.mapCanvas(), SIGNAL("renderComplete(QPainter *)"), self.renderTest)
77
PyQGIS developer cookbook, Versão 2.14
78 Chapter 16. Compatibilidade com versões anteriores do QGIS

CHAPTER 17
Liberando seu complemento
• Metadados e nome• Código e ajuda• Repositório oficial de complementos python
– Permissões– Gerenciamento de confiança– Validação– Estrutura dos complementos
Uma vez que o seu complemento estiver pronto e você achar que o complemento pode ser útil para algumaspessoas, não hesite em enviá-lo para Repositório oficial de complementos python. Nessa página você pode en-contrar também pacotes de orientações sobre como preparar o complemento para funcionar bem com o instaladorde complementos. Ou no caso de você gostaria de criar o seu próprio repositório de complementos, criando umarquivo XML simples que irá listar os complementos e seus metadados, para exemplos, ver outros repositórios decomplementos.
Por favor tenha um cuidado especial com estas sugestões
17.1 Metadados e nome
• evitar o uso de um nome muito semelhante ao de complementos existentes
• Se seu complemento tem a funcionalda semelhante a de um complemento já existente, por favor expliqueas diferenças n campo Sobre, então o usuário saberá qual usar sem a necessidade de intalá-lo e testar.
• evitar repetir “plugin” no nome do complemento
• use o campo de descriçao em metadados para a descrição de 1 linha, e no campo Sobre para instruções maisdetalhadas
• Adicione um repositório de código, um rastreador de erros, e uma página inicial; isso vai melhorar muitoa possibilidade de colaboração, e pode ser feito muito facilmente com uma das infra-estruturas disponíveisna web (GitHub, GitLab, Bitbucket, etc.)
• Escolha etiquetas com cuidado, evite as não informativas (por exemplo vetor) e prefira as usualmente usadapelos outros (veja o website de complementos)
• Adicione um ícone próprio, não deixe o padrão; veja a interface QGIS por sugestão de estilos para usar
17.2 Código e ajuda
• não adicione arquivos gerados (ui_*.py, resources_rc.py, generated help files. . . ) coisas inúteis (por exem-plo. .gitignore) no repositório
79

PyQGIS developer cookbook, Versão 2.14
• Adicione o complemento no menu apropriado (Vector, Raster, Web, Database)
• quando apropriado (complements realizando análises), considere acrescentar o complemento como umasub=complemento do quadro de processamento: isso vai permitir que os usuários executem em lote, paraintegrá-lo em fluxos de trabalho mais complexos, e vai livrá-lo do fardo de projetar uma interface
• Adicione no mínimo uma pequena documentação, se for útil para teste e entendimento, dados de exemplo
17.3 Repositório oficial de complementos python
Você pode encontrar o repositório oficial de complementos python emt http://plugins.qgis.org/.
Para usar o repositório oficial, deve obter uma ID OSGEO do portal web OSGEO.
Depois de carregado o seu complemento será aprovado por um membro da equipe e você será notificado.
TODO: Insira um link para o documento de governança.
17.3.1 Permissões
Estas regras foram implementadas no repositório oficial de complementos:
• todos os usuários registrados podem adicionar um novo plugin
• A equipe de usuários podem aprovar ou reprovar todas as versões do plugin
• Os usuários que têm permissão especial plugins.can_approve automaticamente têm suas versões de extensãoaprovado
• usuários que têm a permissão especial plugins.can_approve pode aprovar versões carregadas por outros,enquanto eles estão na lista do proprietários de complementos
• um complemento específico pode ser apagado e editado apenas pela equipe de usuários e pelos proprietáriosdo complemento
• se um usuário sem permissão plugins.can_approve carrega uma nova versão, a versão do plugin é automati-camente não aprovado.
17.3.2 Gerenciamento de confiança
Os membros da equipe podem conceder permissão para criadores de complementos selecionado definindo per-missão plugins.can_approve através da aplicação front-end.
A visão de detalhes do complemento oferece links diretos para conceder permissão para o criador do complementoou o proprietários do complemento.
17.3.3 Validação
Metadados do complemento são automaticamente importados e validados a partir do pacote compactado quandoo complemento é carregado.
Aqui estão algumas regras de validação que você deve estar ciente quando desejar fazer o upload de um comple-mento no repositório oficial:
1. o nome de sua pasta principal contendo seu complementeo deve conter apenas caracteres ASCII (A-Z ea-z), números e os caracteres underscore (_) e menos (-), e também não pode iniciar com um número.
2. metadata.txt é necessário
3. todos metadados requeridos e que devem estar presentes estão listados em metadata table
4. o campo versão metadados deve ser exclusivo
80 Chapter 17. Liberando seu complemento

PyQGIS developer cookbook, Versão 2.14
17.3.4 Estrutura dos complementos
Seguindo as regras de validação, o pacote compactado (.zip) de seu plugin deve ter uma estrutura específicapara ser validado como um plugin funcional. Como o plugin será descompactado dentro da pasta de plugins deusuários ele deve ter seu próprio diretório dentro do arquivo .zip para não interfirir em outros plugins. Arquivosobrigatórios: metadata.txt e __init__.py. Seria melhor se tivesse um README e também um íconerepresentando o plugin (resources.qrc). A seguir, um exemplo de como um plugin.zip deve se parecer.
plugin.zippluginfolder/|-- i18n| |-- translation_file_de.ts|-- img| |-- icon.png| ‘-- iconsource.svg|-- __init__.py|-- Makefile|-- metadata.txt|-- more_code.py|-- main_code.py|-- README|-- resources.qrc|-- resources_rc.py‘-- ui_Qt_user_interface_file.ui
17.3. Repositório oficial de complementos python 81
PyQGIS developer cookbook, Versão 2.14
82 Chapter 17. Liberando seu complemento
CHAPTER 18
Fragmentos de código
• Cómo llamar a un método por un atajo de teclado• Como alternar camadas• Cómo acceder a la tabla de atributos de los objetos espaciales seleccionados
Esta sección cuenta con fragmentos de código para facilitar el desarrollo de complementos.
18.1 Cómo llamar a un método por un atajo de teclado
No complemento adicione initGui()
self.keyAction = QAction("Test Plugin", self.iface.mainWindow())self.iface.registerMainWindowAction(self.keyAction, "F7") # action1 triggered by F7 keyself.iface.addPluginToMenu("&Test plugins", self.keyAction)QObject.connect(self.keyAction, SIGNAL("triggered()"),self.keyActionF7)
Para unload() adicione
self.iface.unregisterMainWindowAction(self.keyAction)
O metódo que ~e chamado quando F7 é pressionada
def keyActionF7(self):QMessageBox.information(self.iface.mainWindow(),"Ok", "You pressed F7")
18.2 Como alternar camadas
Desde QGIS 2.4 há uma nova estrutura de camada de API que permite o acesso direto à estrutura de camada nalegenda. Aqui está um exemplo de como alternar a visibilidade da camada ativa
root = QgsProject.instance().layerTreeRoot()node = root.findLayer(iface.activeLayer().id())new_state = Qt.Checked if node.isVisible() == Qt.Unchecked else Qt.Uncheckednode.setVisible(new_state)
83
PyQGIS developer cookbook, Versão 2.14
18.3 Cómo acceder a la tabla de atributos de los objetos espa-ciales seleccionados
def changeValue(self, value):layer = self.iface.activeLayer()if(layer):nF = layer.selectedFeatureCount()if (nF > 0):
layer.startEditing()ob = layer.selectedFeaturesIds()b = QVariant(value)if (nF > 1):
for i in ob:layer.changeAttributeValue(int(i), 1, b) # 1 being the second column
else:layer.changeAttributeValue(int(ob[0]), 1, b) # 1 being the second column
layer.commitChanges()else:
QMessageBox.critical(self.iface.mainWindow(), "Error", "Please select at least one feature from current layer")else:QMessageBox.critical(self.iface.mainWindow(), "Error", "Please select a layer")
Este metódo requer um parâmetro (o novo valor para o campo de atributo da característica(s) selecionada) e podeser chamado por
self.changeValue(50)
84 Chapter 18. Fragmentos de código
CHAPTER 19
Escrevendo um complemento de processamento
• Criando um complemente que adiciona um provedor de algoritmo• Criando um plugin que contém um conjunto de scripts de processamento
Depending on the kind of plugin that you are going to develop, it might be better option to add its functionalityas a Processing algorithm (or a set of them). That would provide a better integration within QGIS, additionalfunctionality (since it can be run in the components of Processing, such as the modeler or the batch processinginterface), and a quicker development time (since Processing will take of a large part of the work).
Este documento descreve como criar um novo complemento que adicionar sua funcionalidade como um algoritmode processamento.
Há dois mecanismos principais para fazer isso:
• Criando um complemento que adiciona um provedor de algoritmo: Estas opções são mais complexas, masprovém maior flexibilidade
• Criando um plugin que contém um conjunto de scripts de processamento: na solução mais simples, você sóprecisa de um conjunto de arquivos de scripts de processamento.
19.1 Criando um complemente que adiciona um provedor de algo-ritmo
Para criar um provedor de algoritmo, siga estes passos:
• Instale o complemento Plugin Builder
• Crie um novo complemento usando o Plugin Builder. Quando o Plugin Builder perguntar qual modelo usar,selecione “Processing provider”.
• The created plugin contains a provider with a single algorithm. Both the provider file and the algorithmfile are fully commented and contain information about how to modify the provider and add additionalalgorithms. Refer to them for more information.
19.2 Criando um plugin que contém um conjunto de scripts de pro-cessamento
Para criar um conjunto de scripts de processamento, siga estes passos:
• Crie seus script como descrito no manual PyGIS. Todos os scripts que você deseja adicionar devem serdisponíveis na caixa de Processamento.
85

PyQGIS developer cookbook, Versão 2.14
• In the Scripts/Tools group in the Processing toolbox, double-click on the Create script collection pluginitem. You will see a window where you should select the scripts to add to the plugin (from the set ofavailable ones in the toolbox), and some additional information needed for the plugin metadata.
• Clique em OK e o complemento será criado.
• You can add additional scripts to the plugin by adding scripts python files to the scripts folder in the resultingplugin folder.
86 Chapter 19. Escrevendo um complemento de processamento

CHAPTER 20
Biblioteca de análise de rede
• Informação Geral• Elaborando um gráfico• Análise de Gráficos
– Encontrando os caminhos mais curtos– Areas of availability
Starting from revision ee19294562 (QGIS >= 1.8) the new network analysis library was added to the QGIS coreanalysis library. The library:
• criar gráfico matemático para dado geográfico (camadas vetor polígono)
• implements basic methods from graph theory (currently only Dijkstra’s algorithm)
The network analysis library was created by exporting basic functions from the RoadGraph core plugin and nowyou can use it’s methods in plugins or directly from the Python console.
20.1 Informação Geral
Resumidamente, um caso típico pode ser descrito assim:
1. criar gráfico para geodata (camada vetorial polígono usual)
2. rodar análise gráfica
3. usar resultados das análises (por exemplo, visualizá-los)
20.2 Elaborando um gráfico
A primeira coisa que você deve fazer — é preparar os dados de entrada, que é converter uma camada vetor em umgráfico. Todas as próximas ações irão usar este gráfico e não a camada.
As a source we can use any polyline vector layer. Nodes of the polylines become graph vertexes, and segments ofthe polylines are graph edges. If several nodes have the same coordinates then they are the same graph vertex. Sotwo lines that have a common node become connected to each other.
Additionally, during graph creation it is possible to “fix” (“tie”) to the input vector layer any number of additionalpoints. For each additional point a match will be found — the closest graph vertex or closest graph edge. In thelatter case the edge will be split and a new vertex added.
Vector layer attributes and length of an edge can be used as the properties of an edge.
Converting from a vector layer to the graph is done using the Builder programming pattern. A graph is constructedusing a so-called Director. There is only one Director for now: QgsLineVectorLayerDirector. The director setsthe basic settings that will be used to construct a graph from a line vector layer, used by the builder to create the
87

PyQGIS developer cookbook, Versão 2.14
graph. Currently, as in the case with the director, only one builder exists: QgsGraphBuilder, that creates QgsGraphobjects. You may want to implement your own builders that will build a graphs compatible with such libraries asBGL or NetworkX.
To calculate edge properties the programming pattern strategy is used. For now only QgsDistanceArcProperterstrategy is available, that takes into account the length of the route. You can implement your own strategy thatwill use all necessary parameters. For example, RoadGraph plugin uses a strategy that computes travel time usingedge length and speed value from attributes.
It’s time to dive into the process.
First of all, to use this library we should import the networkanalysis module
from qgis.networkanalysis import *
Then some examples for creating a director
# don’t use information about road direction from layer attributes,# all roads are treated as two-waydirector = QgsLineVectorLayerDirector(vLayer, -1, ’’, ’’, ’’, 3)
# use field with index 5 as source of information about road direction.# one-way roads with direct direction have attribute value "yes",# one-way roads with reverse direction have the value "1", and accordingly# bidirectional roads have "no". By default roads are treated as two-way.# This scheme can be used with OpenStreetMap datadirector = QgsLineVectorLayerDirector(vLayer, 5, ’yes’, ’1’, ’no’, 3)
To construct a director we should pass a vector layer, that will be used as the source for the graph structure andinformation about allowed movement on each road segment (one-way or bidirectional movement, direct or reversedirection). The call looks like this
director = QgsLineVectorLayerDirector(vl, directionFieldId,directDirectionValue,reverseDirectionValue,bothDirectionValue,defaultDirection)
Aqui segue uma lista de todos os significados dos parâmetros:
• vl — vector layer used to build the graph
• directionFieldId — index of the attribute table field, where information about roads direction isstored. If -1, then don’t use this info at all. An integer.
• directDirectionValue — field value for roads with direct direction (moving from first line point tolast one). A string.
• reverseDirectionValue — field value for roads with reverse direction (moving from last line pointto first one). A string.
• bothDirectionValue — field value for bidirectional roads (for such roads we can move from firstpoint to last and from last to first). A string.
• defaultDirection — default road direction. This value will be used for those roads where fielddirectionFieldId is not set or has some value different from any of the three values specified above.An integer. 1 indicates direct direction, 2 indicates reverse direction, and 3 indicates both directions.
It is necessary then to create a strategy for calculating edge properties
properter = QgsDistanceArcProperter()
And tell the director about this strategy
director.addProperter(properter)
88 Chapter 20. Biblioteca de análise de rede

PyQGIS developer cookbook, Versão 2.14
Now we can use the builder, which will create the graph. The QgsGraphBuilder class constructor takes severalarguments:
• src — sistema de referência de coordenadas para uso. Argumento prioritário.
• otfAtivado — uso ou não da reprojeção “voo livre”. Por padrão consta: Verdadeiro (use OTF).
• tolerânciaTopológica — tolerância topológica. Valor padrão é 0.
• elipsóideID — elipsóide usado. Por padrão “WGS84”.
# only CRS is set, all other values are defaultsbuilder = QgsGraphBuilder(myCRS)
Também podemos definir vários pontos, que serão usados na análise. Por exemplo
startPoint = QgsPoint(82.7112, 55.1672)endPoint = QgsPoint(83.1879, 54.7079)
Now all is in place so we can build the graph and “tie” these points to it
tiedPoints = director.makeGraph(builder, [startPoint, endPoint])
Building the graph can take some time (which depends on the number of features in a layer and layer size).tiedPoints is a list with coordinates of “tied” points. When the build operation is finished we can get thegraph and use it for the analysis
graph = builder.graph()
With the next code we can get the vertex indexes of our points
startId = graph.findVertex(tiedPoints[0])endId = graph.findVertex(tiedPoints[1])
20.3 Análise de Gráficos
Networks analysis is used to find answers to two questions: which vertexes are connected and how to find ashortest path. To solve these problems the network analysis library provides Dijkstra’s algorithm.
Dijkstra’s algorithm finds the shortest route from one of the vertexes of the graph to all the others and the valuesof the optimization parameters. The results can be represented as a shortest path tree.
The shortest path tree is a directed weighted graph (or more precisely — tree) with the following properties:
• only one vertex has no incoming edges — the root of the tree
• todos os outros vértices têm apenas uma borda chegando
• if vertex B is reachable from vertex A, then the path from A to B is the single available path and it is optimal(shortest) on this graph
To get the shortest path tree use the methods shortestTree() and dijkstra() of QgsGraphAnalyzer class.It is recommended to use method dijkstra() because it works faster and uses memory more efficiently.
The shortestTree() method is useful when you want to walk around the shortest path tree. It always createsa new graph object (QgsGraph) and accepts three variables:
• fonte — gráfico de entrada
• startVertexIdx — index of the point on the tree (the root of the tree)
• criterionNum — number of edge property to use (started from 0).
tree = QgsGraphAnalyzer.shortestTree(graph, startId, 0)
20.3. Análise de Gráficos 89
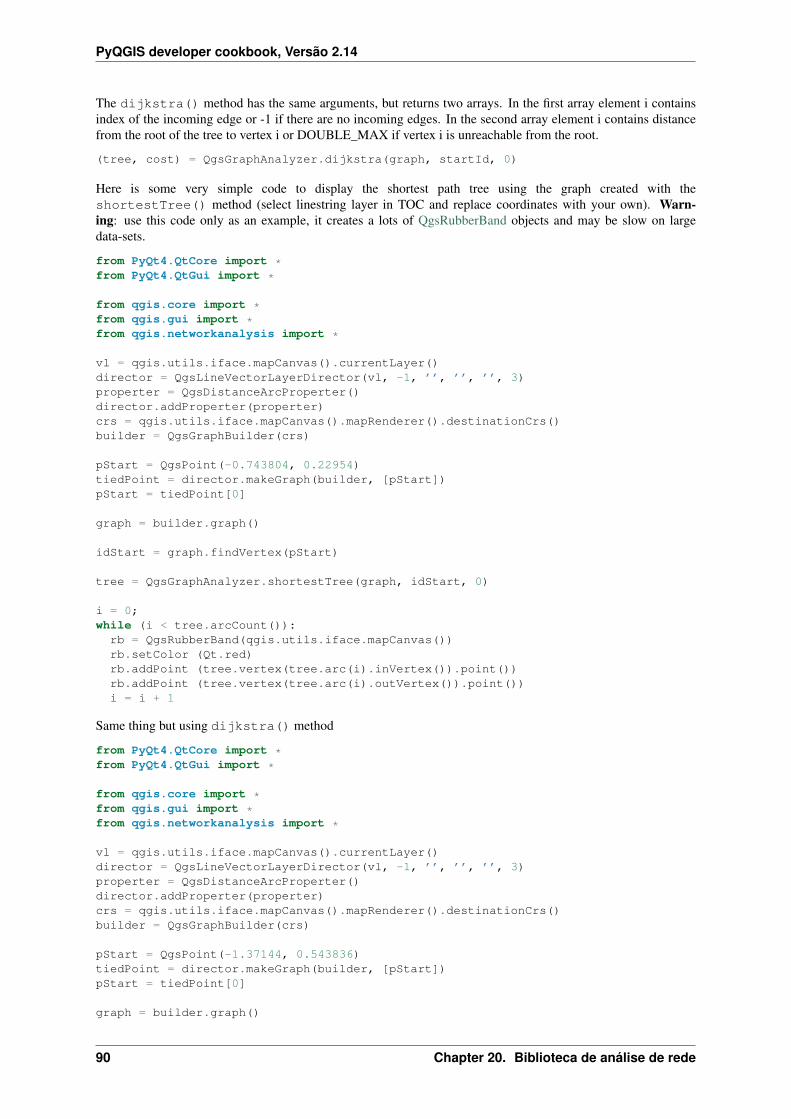
PyQGIS developer cookbook, Versão 2.14
The dijkstra() method has the same arguments, but returns two arrays. In the first array element i containsindex of the incoming edge or -1 if there are no incoming edges. In the second array element i contains distancefrom the root of the tree to vertex i or DOUBLE_MAX if vertex i is unreachable from the root.
(tree, cost) = QgsGraphAnalyzer.dijkstra(graph, startId, 0)
Here is some very simple code to display the shortest path tree using the graph created with theshortestTree() method (select linestring layer in TOC and replace coordinates with your own). Warn-ing: use this code only as an example, it creates a lots of QgsRubberBand objects and may be slow on largedata-sets.
from PyQt4.QtCore import *from PyQt4.QtGui import *
from qgis.core import *from qgis.gui import *from qgis.networkanalysis import *
vl = qgis.utils.iface.mapCanvas().currentLayer()director = QgsLineVectorLayerDirector(vl, -1, ’’, ’’, ’’, 3)properter = QgsDistanceArcProperter()director.addProperter(properter)crs = qgis.utils.iface.mapCanvas().mapRenderer().destinationCrs()builder = QgsGraphBuilder(crs)
pStart = QgsPoint(-0.743804, 0.22954)tiedPoint = director.makeGraph(builder, [pStart])pStart = tiedPoint[0]
graph = builder.graph()
idStart = graph.findVertex(pStart)
tree = QgsGraphAnalyzer.shortestTree(graph, idStart, 0)
i = 0;while (i < tree.arcCount()):
rb = QgsRubberBand(qgis.utils.iface.mapCanvas())rb.setColor (Qt.red)rb.addPoint (tree.vertex(tree.arc(i).inVertex()).point())rb.addPoint (tree.vertex(tree.arc(i).outVertex()).point())i = i + 1
Same thing but using dijkstra() method
from PyQt4.QtCore import *from PyQt4.QtGui import *
from qgis.core import *from qgis.gui import *from qgis.networkanalysis import *
vl = qgis.utils.iface.mapCanvas().currentLayer()director = QgsLineVectorLayerDirector(vl, -1, ’’, ’’, ’’, 3)properter = QgsDistanceArcProperter()director.addProperter(properter)crs = qgis.utils.iface.mapCanvas().mapRenderer().destinationCrs()builder = QgsGraphBuilder(crs)
pStart = QgsPoint(-1.37144, 0.543836)tiedPoint = director.makeGraph(builder, [pStart])pStart = tiedPoint[0]
graph = builder.graph()
90 Chapter 20. Biblioteca de análise de rede
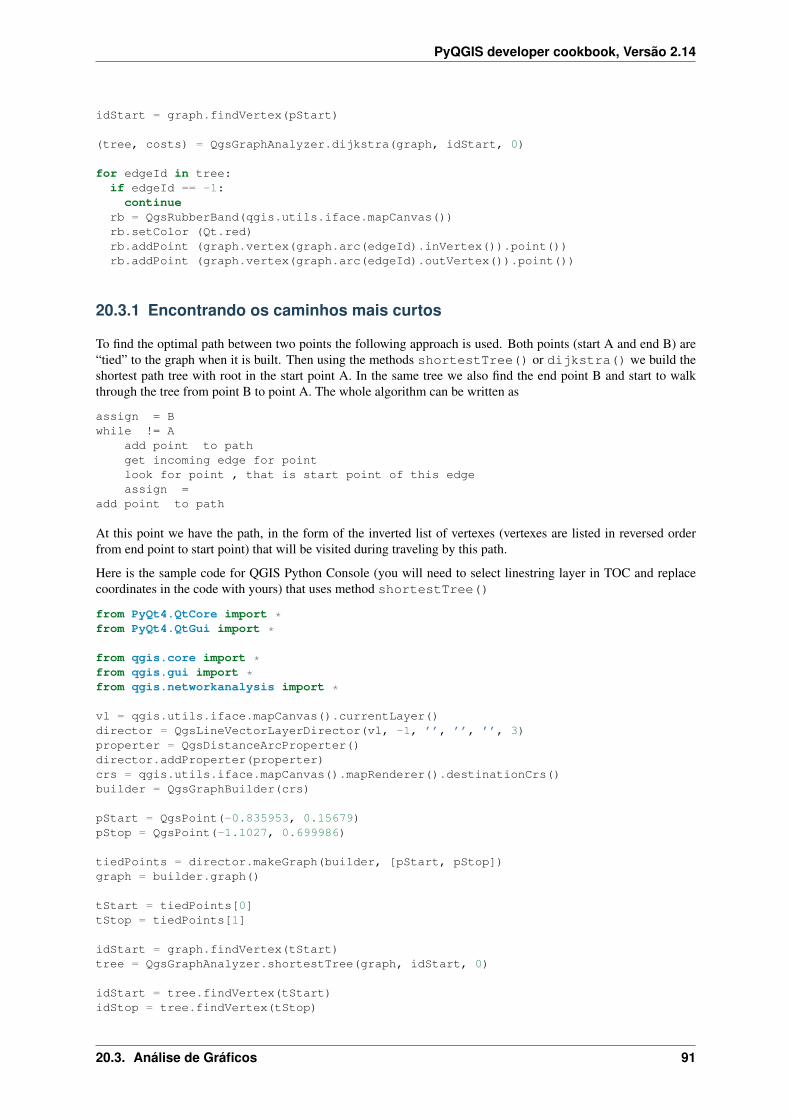
PyQGIS developer cookbook, Versão 2.14
idStart = graph.findVertex(pStart)
(tree, costs) = QgsGraphAnalyzer.dijkstra(graph, idStart, 0)
for edgeId in tree:if edgeId == -1:continue
rb = QgsRubberBand(qgis.utils.iface.mapCanvas())rb.setColor (Qt.red)rb.addPoint (graph.vertex(graph.arc(edgeId).inVertex()).point())rb.addPoint (graph.vertex(graph.arc(edgeId).outVertex()).point())
20.3.1 Encontrando os caminhos mais curtos
To find the optimal path between two points the following approach is used. Both points (start A and end B) are“tied” to the graph when it is built. Then using the methods shortestTree() or dijkstra() we build theshortest path tree with root in the start point A. In the same tree we also find the end point B and start to walkthrough the tree from point B to point A. The whole algorithm can be written as
assign = Bwhile != A
add point to pathget incoming edge for pointlook for point , that is start point of this edgeassign =
add point to path
At this point we have the path, in the form of the inverted list of vertexes (vertexes are listed in reversed orderfrom end point to start point) that will be visited during traveling by this path.
Here is the sample code for QGIS Python Console (you will need to select linestring layer in TOC and replacecoordinates in the code with yours) that uses method shortestTree()
from PyQt4.QtCore import *from PyQt4.QtGui import *
from qgis.core import *from qgis.gui import *from qgis.networkanalysis import *
vl = qgis.utils.iface.mapCanvas().currentLayer()director = QgsLineVectorLayerDirector(vl, -1, ’’, ’’, ’’, 3)properter = QgsDistanceArcProperter()director.addProperter(properter)crs = qgis.utils.iface.mapCanvas().mapRenderer().destinationCrs()builder = QgsGraphBuilder(crs)
pStart = QgsPoint(-0.835953, 0.15679)pStop = QgsPoint(-1.1027, 0.699986)
tiedPoints = director.makeGraph(builder, [pStart, pStop])graph = builder.graph()
tStart = tiedPoints[0]tStop = tiedPoints[1]
idStart = graph.findVertex(tStart)tree = QgsGraphAnalyzer.shortestTree(graph, idStart, 0)
idStart = tree.findVertex(tStart)idStop = tree.findVertex(tStop)
20.3. Análise de Gráficos 91

PyQGIS developer cookbook, Versão 2.14
if idStop == -1:print "Path not found"
else:p = []while (idStart != idStop):l = tree.vertex(idStop).inArc()if len(l) == 0:
breake = tree.arc(l[0])p.insert(0, tree.vertex(e.inVertex()).point())idStop = e.outVertex()
p.insert(0, tStart)rb = QgsRubberBand(qgis.utils.iface.mapCanvas())rb.setColor(Qt.red)
for pnt in p:rb.addPoint(pnt)
And here is the same sample but using dijkstra() method
from PyQt4.QtCore import *from PyQt4.QtGui import *
from qgis.core import *from qgis.gui import *from qgis.networkanalysis import *
vl = qgis.utils.iface.mapCanvas().currentLayer()director = QgsLineVectorLayerDirector(vl, -1, ’’, ’’, ’’, 3)properter = QgsDistanceArcProperter()director.addProperter(properter)crs = qgis.utils.iface.mapCanvas().mapRenderer().destinationCrs()builder = QgsGraphBuilder(crs)
pStart = QgsPoint(-0.835953, 0.15679)pStop = QgsPoint(-1.1027, 0.699986)
tiedPoints = director.makeGraph(builder, [pStart, pStop])graph = builder.graph()
tStart = tiedPoints[0]tStop = tiedPoints[1]
idStart = graph.findVertex(tStart)idStop = graph.findVertex(tStop)
(tree, cost) = QgsGraphAnalyzer.dijkstra(graph, idStart, 0)
if tree[idStop] == -1:print "Path not found"
else:p = []curPos = idStopwhile curPos != idStart:p.append(graph.vertex(graph.arc(tree[curPos]).inVertex()).point())curPos = graph.arc(tree[curPos]).outVertex();
p.append(tStart)
rb = QgsRubberBand(qgis.utils.iface.mapCanvas())rb.setColor(Qt.red)
92 Chapter 20. Biblioteca de análise de rede

PyQGIS developer cookbook, Versão 2.14
for pnt in p:rb.addPoint(pnt)
20.3.2 Areas of availability
The area of availability for vertex A is the subset of graph vertexes that are accessible from vertex A and the costof the paths from A to these vertexes are not greater that some value.
More clearly this can be shown with the following example: “There is a fire station. Which parts of city can afire truck reach in 5 minutes? 10 minutes? 15 minutes?”. Answers to these questions are fire station’s areas ofavailability.
To find the areas of availability we can use method dijkstra() of the QgsGraphAnalyzer class. It isenough to compare the elements of the cost array with a predefined value. If cost[i] is less than or equal to apredefined value, then vertex i is inside the area of availability, otherwise it is outside.
A more difficult problem is to get the borders of the area of availability. The bottom border is the set of vertexesthat are still accessible, and the top border is the set of vertexes that are not accessible. In fact this is simple: itis the availability border based on the edges of the shortest path tree for which the source vertex of the edge isaccessible and the target vertex of the edge is not.
Aqui está um exemplo
from PyQt4.QtCore import *from PyQt4.QtGui import *
from qgis.core import *from qgis.gui import *from qgis.networkanalysis import *
vl = qgis.utils.iface.mapCanvas().currentLayer()director = QgsLineVectorLayerDirector(vl, -1, ’’, ’’, ’’, 3)properter = QgsDistanceArcProperter()director.addProperter(properter)crs = qgis.utils.iface.mapCanvas().mapRenderer().destinationCrs()builder = QgsGraphBuilder(crs)
pStart = QgsPoint(65.5462, 57.1509)delta = qgis.utils.iface.mapCanvas().getCoordinateTransform().mapUnitsPerPixel() * 1
rb = QgsRubberBand(qgis.utils.iface.mapCanvas(), True)rb.setColor(Qt.green)rb.addPoint(QgsPoint(pStart.x() - delta, pStart.y() - delta))rb.addPoint(QgsPoint(pStart.x() + delta, pStart.y() - delta))rb.addPoint(QgsPoint(pStart.x() + delta, pStart.y() + delta))rb.addPoint(QgsPoint(pStart.x() - delta, pStart.y() + delta))
tiedPoints = director.makeGraph(builder, [pStart])graph = builder.graph()tStart = tiedPoints[0]
idStart = graph.findVertex(tStart)
(tree, cost) = QgsGraphAnalyzer.dijkstra(graph, idStart, 0)
upperBound = []r = 2000.0i = 0while i < len(cost):
if cost[i] > r and tree[i] != -1:outVertexId = graph.arc(tree [i]).outVertex()if cost[outVertexId] < r:
20.3. Análise de Gráficos 93

PyQGIS developer cookbook, Versão 2.14
upperBound.append(i)i = i + 1
for i in upperBound:centerPoint = graph.vertex(i).point()rb = QgsRubberBand(qgis.utils.iface.mapCanvas(), True)rb.setColor(Qt.red)rb.addPoint(QgsPoint(centerPoint.x() - delta, centerPoint.y() - delta))rb.addPoint(QgsPoint(centerPoint.x() + delta, centerPoint.y() - delta))rb.addPoint(QgsPoint(centerPoint.x() + delta, centerPoint.y() + delta))rb.addPoint(QgsPoint(centerPoint.x() - delta, centerPoint.y() + delta))
94 Chapter 20. Biblioteca de análise de rede

CHAPTER 21
Complementos de servidores Python do QGIS
• Server Filter Plugins architecture– requestReady– sendResponse– responseComplete
• Raising exception from a plugin• Writing a server plugin
– Plugin files– __init__.py– HelloServer.py– Modifying the input– Modifying or replacing the output
• Access control plugin– Plugin files– __init__.py– AccessControl.py– layerFilterExpression– layerFilterSubsetString– layerPermissions– authorizedLayerAttributes– allowToEdit– cacheKey
Python plugins can also run on QGIS Server (see: label_qgisserver): by using the server interface(QgsServerInterface) a Python plugin running on the server can alter the behavior of existing core ser-vices (WMS, WFS etc.).
With the server filter interface (QgsServerFilter) we can change the input parameters, change the generatedoutput or even by providing new services.
With the access control interface (QgsAccessControlFilter) we can apply some access restriction perrequests.
21.1 Server Filter Plugins architecture
Server python plugins are loaded once when the FCGI application starts. They register one or moreQgsServerFilter (from this point, you might find useful a quick look to the server plugins API docs). Eachfilter should implement at least one of three callbacks:
• requestReady()
• responseComplete()
• sendResponse()
95

PyQGIS developer cookbook, Versão 2.14
All filters have access to the request/response object (QgsRequestHandler) and can manipulate all its prop-erties (input/output) and raise exceptions (while in a quite particular way as we’ll see below).
Here is a pseudo code showing a typical server session and when the filter’s callbacks are called:
• Get the incoming request
– create GET/POST/SOAP request handler
– pass request to an instance of QgsServerInterface
– call plugins requestReady() filters
– if there is not a response
* if SERVICE is WMS/WFS/WCS
· criar servidor WMS/WFS/WCS
call server’s executeRequest() and possibily call sendResponse() pluginfilters when streaming output or store the byte stream output and content type inthe request handler
* call plugins responseComplete() filters
– call plugins sendResponse() filters
– request handler output the response
The following paragraphs describe the available callbacks in details.
21.1.1 requestReady
This is called when the request is ready: incoming URL and data have been parsed and before entering the coreservices (WMS, WFS etc.) switch, this is the point where you can manipulate the input and perform actions like:
• authentication/authorization
• redirects
• add/remove certain parameters (typenames for example)
• raise exceptions
You could even substitute a core service completely by changing SERVICE parameter and hence bypassing thecore service completely (not that this make much sense though).
21.1.2 sendResponse
This is called whenever output is sent to FCGI stdout (and from there, to the client), this is normally done af-ter core services have finished their process and after responseComplete hook was called, but in a few casesXML can become so huge that a streaming XML implementation was needed (WFS GetFeature is one ofthem), in this case, sendResponse() is called multiple times before the response is complete (and beforeresponseComplete() is called). The obvious consequence is that sendResponse() is normally calledonce but might be exceptionally called multiple times and in that case (and only in that case) it is also calledbefore responseComplete().
sendResponse() is the best place for direct manipulation of core service’s output and whileresponseComplete() is typically also an option, sendResponse() is the only viable option in case ofstreaming services.
96 Chapter 21. Complementos de servidores Python do QGIS
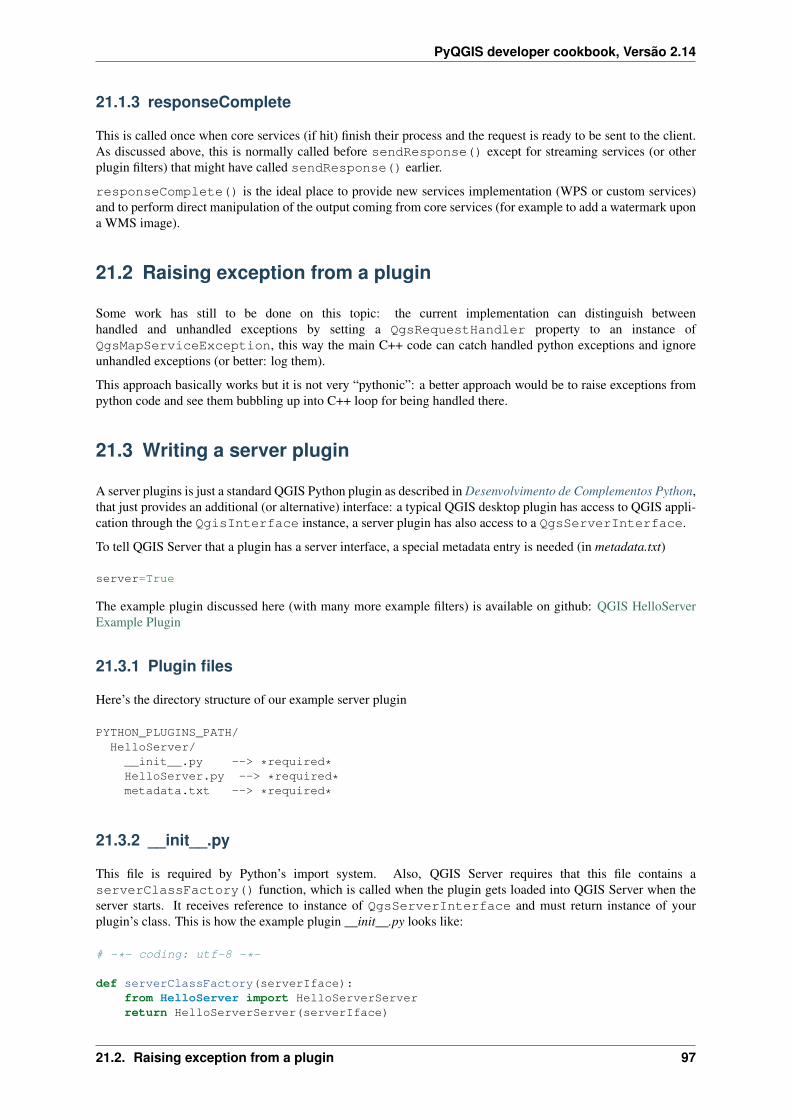
PyQGIS developer cookbook, Versão 2.14
21.1.3 responseComplete
This is called once when core services (if hit) finish their process and the request is ready to be sent to the client.As discussed above, this is normally called before sendResponse() except for streaming services (or otherplugin filters) that might have called sendResponse() earlier.
responseComplete() is the ideal place to provide new services implementation (WPS or custom services)and to perform direct manipulation of the output coming from core services (for example to add a watermark upona WMS image).
21.2 Raising exception from a plugin
Some work has still to be done on this topic: the current implementation can distinguish betweenhandled and unhandled exceptions by setting a QgsRequestHandler property to an instance ofQgsMapServiceException, this way the main C++ code can catch handled python exceptions and ignoreunhandled exceptions (or better: log them).
This approach basically works but it is not very “pythonic”: a better approach would be to raise exceptions frompython code and see them bubbling up into C++ loop for being handled there.
21.3 Writing a server plugin
A server plugins is just a standard QGIS Python plugin as described in Desenvolvimento de Complementos Python,that just provides an additional (or alternative) interface: a typical QGIS desktop plugin has access to QGIS appli-cation through the QgisInterface instance, a server plugin has also access to a QgsServerInterface.
To tell QGIS Server that a plugin has a server interface, a special metadata entry is needed (in metadata.txt)
server=True
The example plugin discussed here (with many more example filters) is available on github: QGIS HelloServerExample Plugin
21.3.1 Plugin files
Here’s the directory structure of our example server plugin
PYTHON_PLUGINS_PATH/HelloServer/__init__.py --> *required*HelloServer.py --> *required*metadata.txt --> *required*
21.3.2 __init__.py
This file is required by Python’s import system. Also, QGIS Server requires that this file contains aserverClassFactory() function, which is called when the plugin gets loaded into QGIS Server when theserver starts. It receives reference to instance of QgsServerInterface and must return instance of yourplugin’s class. This is how the example plugin __init__.py looks like:
# -*- coding: utf-8 -*-
def serverClassFactory(serverIface):from HelloServer import HelloServerServerreturn HelloServerServer(serverIface)
21.2. Raising exception from a plugin 97
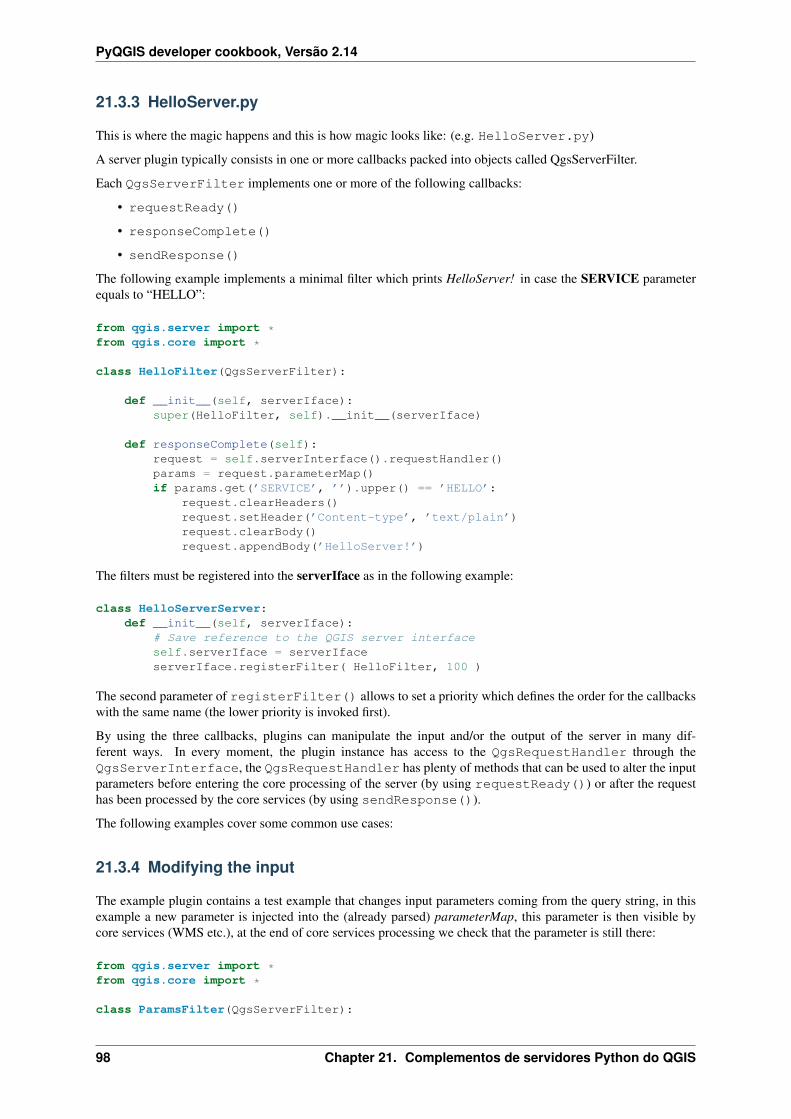
PyQGIS developer cookbook, Versão 2.14
21.3.3 HelloServer.py
This is where the magic happens and this is how magic looks like: (e.g. HelloServer.py)
A server plugin typically consists in one or more callbacks packed into objects called QgsServerFilter.
Each QgsServerFilter implements one or more of the following callbacks:
• requestReady()
• responseComplete()
• sendResponse()
The following example implements a minimal filter which prints HelloServer! in case the SERVICE parameterequals to “HELLO”:
from qgis.server import *from qgis.core import *
class HelloFilter(QgsServerFilter):
def __init__(self, serverIface):super(HelloFilter, self).__init__(serverIface)
def responseComplete(self):request = self.serverInterface().requestHandler()params = request.parameterMap()if params.get(’SERVICE’, ’’).upper() == ’HELLO’:
request.clearHeaders()request.setHeader(’Content-type’, ’text/plain’)request.clearBody()request.appendBody(’HelloServer!’)
The filters must be registered into the serverIface as in the following example:
class HelloServerServer:def __init__(self, serverIface):
# Save reference to the QGIS server interfaceself.serverIface = serverIfaceserverIface.registerFilter( HelloFilter, 100 )
The second parameter of registerFilter() allows to set a priority which defines the order for the callbackswith the same name (the lower priority is invoked first).
By using the three callbacks, plugins can manipulate the input and/or the output of the server in many dif-ferent ways. In every moment, the plugin instance has access to the QgsRequestHandler through theQgsServerInterface, the QgsRequestHandler has plenty of methods that can be used to alter the inputparameters before entering the core processing of the server (by using requestReady()) or after the requesthas been processed by the core services (by using sendResponse()).
The following examples cover some common use cases:
21.3.4 Modifying the input
The example plugin contains a test example that changes input parameters coming from the query string, in thisexample a new parameter is injected into the (already parsed) parameterMap, this parameter is then visible bycore services (WMS etc.), at the end of core services processing we check that the parameter is still there:
from qgis.server import *from qgis.core import *
class ParamsFilter(QgsServerFilter):
98 Chapter 21. Complementos de servidores Python do QGIS
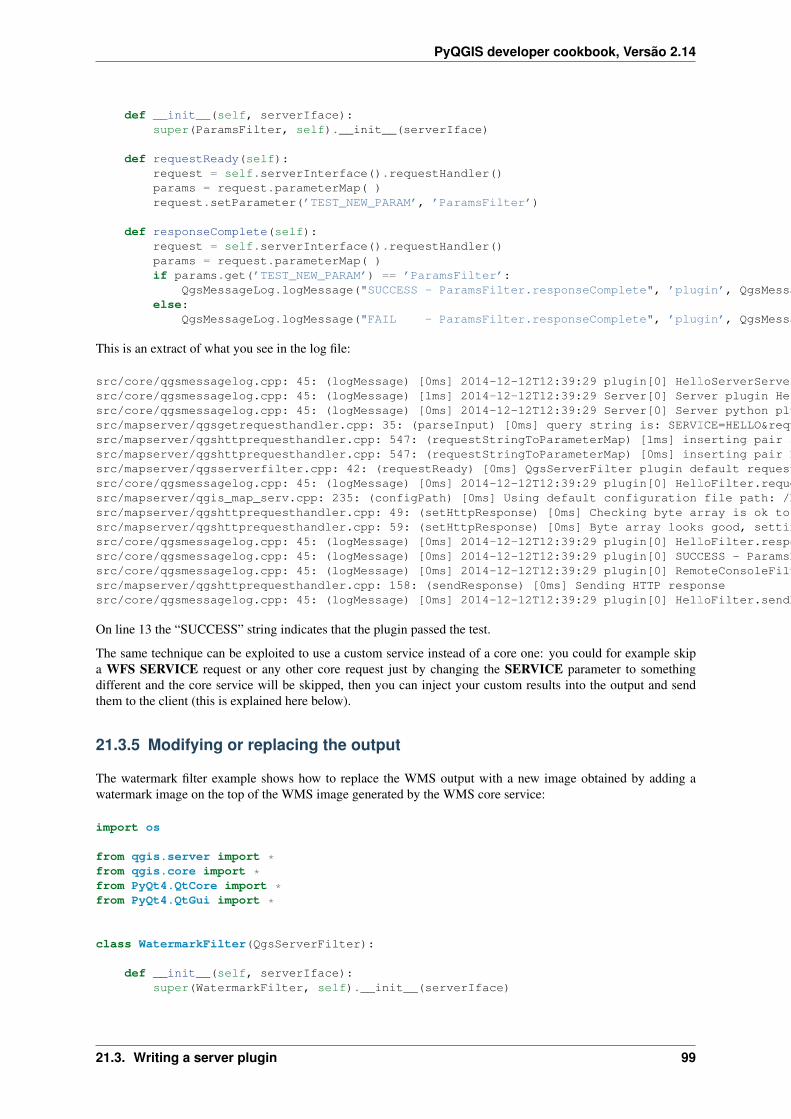
PyQGIS developer cookbook, Versão 2.14
def __init__(self, serverIface):super(ParamsFilter, self).__init__(serverIface)
def requestReady(self):request = self.serverInterface().requestHandler()params = request.parameterMap( )request.setParameter(’TEST_NEW_PARAM’, ’ParamsFilter’)
def responseComplete(self):request = self.serverInterface().requestHandler()params = request.parameterMap( )if params.get(’TEST_NEW_PARAM’) == ’ParamsFilter’:
QgsMessageLog.logMessage("SUCCESS - ParamsFilter.responseComplete", ’plugin’, QgsMessageLog.INFO)else:
QgsMessageLog.logMessage("FAIL - ParamsFilter.responseComplete", ’plugin’, QgsMessageLog.CRITICAL)
This is an extract of what you see in the log file:
src/core/qgsmessagelog.cpp: 45: (logMessage) [0ms] 2014-12-12T12:39:29 plugin[0] HelloServerServer - loading filter ParamsFiltersrc/core/qgsmessagelog.cpp: 45: (logMessage) [1ms] 2014-12-12T12:39:29 Server[0] Server plugin HelloServer loaded!src/core/qgsmessagelog.cpp: 45: (logMessage) [0ms] 2014-12-12T12:39:29 Server[0] Server python plugins loadedsrc/mapserver/qgsgetrequesthandler.cpp: 35: (parseInput) [0ms] query string is: SERVICE=HELLO&request=GetOutputsrc/mapserver/qgshttprequesthandler.cpp: 547: (requestStringToParameterMap) [1ms] inserting pair SERVICE // HELLO into the parameter mapsrc/mapserver/qgshttprequesthandler.cpp: 547: (requestStringToParameterMap) [0ms] inserting pair REQUEST // GetOutput into the parameter mapsrc/mapserver/qgsserverfilter.cpp: 42: (requestReady) [0ms] QgsServerFilter plugin default requestReady calledsrc/core/qgsmessagelog.cpp: 45: (logMessage) [0ms] 2014-12-12T12:39:29 plugin[0] HelloFilter.requestReadysrc/mapserver/qgis_map_serv.cpp: 235: (configPath) [0ms] Using default configuration file path: /home/xxx/apps/bin/admin.sldsrc/mapserver/qgshttprequesthandler.cpp: 49: (setHttpResponse) [0ms] Checking byte array is ok to set...src/mapserver/qgshttprequesthandler.cpp: 59: (setHttpResponse) [0ms] Byte array looks good, setting response...src/core/qgsmessagelog.cpp: 45: (logMessage) [0ms] 2014-12-12T12:39:29 plugin[0] HelloFilter.responseCompletesrc/core/qgsmessagelog.cpp: 45: (logMessage) [0ms] 2014-12-12T12:39:29 plugin[0] SUCCESS - ParamsFilter.responseCompletesrc/core/qgsmessagelog.cpp: 45: (logMessage) [0ms] 2014-12-12T12:39:29 plugin[0] RemoteConsoleFilter.responseCompletesrc/mapserver/qgshttprequesthandler.cpp: 158: (sendResponse) [0ms] Sending HTTP responsesrc/core/qgsmessagelog.cpp: 45: (logMessage) [0ms] 2014-12-12T12:39:29 plugin[0] HelloFilter.sendResponse
On line 13 the “SUCCESS” string indicates that the plugin passed the test.
The same technique can be exploited to use a custom service instead of a core one: you could for example skipa WFS SERVICE request or any other core request just by changing the SERVICE parameter to somethingdifferent and the core service will be skipped, then you can inject your custom results into the output and sendthem to the client (this is explained here below).
21.3.5 Modifying or replacing the output
The watermark filter example shows how to replace the WMS output with a new image obtained by adding awatermark image on the top of the WMS image generated by the WMS core service:
import os
from qgis.server import *from qgis.core import *from PyQt4.QtCore import *from PyQt4.QtGui import *
class WatermarkFilter(QgsServerFilter):
def __init__(self, serverIface):super(WatermarkFilter, self).__init__(serverIface)
21.3. Writing a server plugin 99

PyQGIS developer cookbook, Versão 2.14
def responseComplete(self):request = self.serverInterface().requestHandler()params = request.parameterMap( )# Do some checksif (request.parameter(’SERVICE’).upper() == ’WMS’ \
and request.parameter(’REQUEST’).upper() == ’GETMAP’ \and not request.exceptionRaised() ):
QgsMessageLog.logMessage("WatermarkFilter.responseComplete: image ready %s" % request.infoFormat(), ’plugin’, QgsMessageLog.INFO)# Get the imageimg = QImage()img.loadFromData(request.body())# Adds the watermarkwatermark = QImage(os.path.join(os.path.dirname(__file__), ’media/watermark.png’))p = QPainter(img)p.drawImage(QRect( 20, 20, 40, 40), watermark)p.end()ba = QByteArray()buffer = QBuffer(ba)buffer.open(QIODevice.WriteOnly)img.save(buffer, "PNG")# Set the bodyrequest.clearBody()request.appendBody(ba)
In this example the SERVICE parameter value is checked and if the incoming request is a WMS GETMAP andno exceptions have been set by a previously executed plugin or by the core service (WMS in this case), the WMSgenerated image is retrieved from the output buffer and the watermark image is added. The final step is to clear theoutput buffer and replace it with the newly generated image. Please note that in a real-world situation we shouldalso check for the requested image type instead of returning PNG in any case.
21.4 Access control plugin
21.4.1 Plugin files
Here’s the directory structure of our example server plugin:
PYTHON_PLUGINS_PATH/MyAccessControl/__init__.py --> *required*AccessControl.py --> *required*metadata.txt --> *required*
21.4.2 __init__.py
This file is required by Python’s import system. As for all QGIS server plugins, this file contains aserverClassFactory() function, which is called when the plugin gets loaded into QGIS Server when theserver starts. It receives reference to instance of QgsServerInterface and must return instance of yourplugin’s class. This is how the example plugin __init__.py looks like:
# -*- coding: utf-8 -*-
def serverClassFactory(serverIface):from MyAccessControl.AccessControl import AccessControlreturn AccessControl(serverIface)
100 Chapter 21. Complementos de servidores Python do QGIS

PyQGIS developer cookbook, Versão 2.14
21.4.3 AccessControl.py
class AccessControl(QgsAccessControlFilter):
def __init__(self, server_iface):super(QgsAccessControlFilter, self).__init__(server_iface)
def layerFilterExpression(self, layer):""" Return an additional expression filter """return super(QgsAccessControlFilter, self).layerFilterExpression(layer)
def layerFilterSubsetString(self, layer):""" Return an additional subset string (typically SQL) filter """return super(QgsAccessControlFilter, self).layerFilterSubsetString(layer)
def layerPermissions(self, layer):""" Return the layer rights """return super(QgsAccessControlFilter, self).layerPermissions(layer)
def authorizedLayerAttributes(self, layer, attributes):""" Return the authorised layer attributes """return super(QgsAccessControlFilter, self).authorizedLayerAttributes(layer, attributes)
def allowToEdit(self, layer, feature):""" Are we authorise to modify the following geometry """return super(QgsAccessControlFilter, self).allowToEdit(layer, feature)
def cacheKey(self):return super(QgsAccessControlFilter, self).cacheKey()
This example gives a full access for everybody.
It’s the role of the plugin to know who is logged on.
On all those methods we have the layer on argument to be able to customise the restriction per layer.
21.4.4 layerFilterExpression
Used to add an Expression to limit the results, e.g.:
def layerFilterExpression(self, layer):return "$role = ’user’"
To limit on feature where the attribute role is equals to “user”.
21.4.5 layerFilterSubsetString
Same than the previous but use the SubsetString (executed in the database)
def layerFilterSubsetString(self, layer):return "role = ’user’"
To limit on feature where the attribute role is equals to “user”.
21.4.6 layerPermissions
Limit the access to the layer.
Return an object of type QgsAccessControlFilter.LayerPermissions, who has the properties:
21.4. Access control plugin 101

PyQGIS developer cookbook, Versão 2.14
• canRead to see him in the GetCapabilities and have read access.
• canInsert to be able to insert a new feature.
• canUpdate to be able to update a feature.
• candelete to be able to delete a feature.
Exemplo:
def layerPermissions(self, layer):rights = QgsAccessControlFilter.LayerPermissions()rights.canRead = Truerights.canRead = rights.canInsert = rights.canUpdate = rights.canDelete = Falsereturn rights
To limit everything on read only access.
21.4.7 authorizedLayerAttributes
Used to limit the visibility of a specific subset of attribute.
The argument attribute return the current set of visible attributes.
Exemplo:
def authorizedLayerAttributes(self, layer, attributes):return [a for a in attributes if a != "role"]
To hide the ‘role’ attribute.
21.4.8 allowToEdit
This is used to limit the editing on a subset of features.
It is used in the WFS-Transaction protocol.
Exemplo:
def allowToEdit(self, layer, feature):return feature.attribute(’role’) == ’user’
To be able to edit only feature that has the attribute role with the value user.
21.4.9 cacheKey
QGIS server maintain a cache of the capabilities then to have a cache per role you can return the role in thismethod. Or return None to completely disable the cache.
102 Chapter 21. Complementos de servidores Python do QGIS

Índice
Índice espacialusando, 22
ambientePYQGIS_STARTUP, 2
API, 1aplicativos personalizados
executando, 4arquivos GPX
carregando, 10atributos
Camadas vetoriais Feições, 17Atualizando
camadas raster, 15
calculando valores, 50camada de simbolos
criando tipos customizados, 29trabalhando com, 28
camadas de plugin, 74subclasses QgsPluginLayer, 75
camadas de texto delimitadocarregando, 10
camadas matriciaiscarregando, 10
camadas OGRcarregando, 9
camadas PostGIScarregando, 9
camadas rasterAtualizando, 15consultando, 15detalhes, 13renderer, 13usando, 12
camadas SpatiaLitecarregando, 10
Camadas vetoriaisEdição, 20escrevendo, 23Feições atributos, 17Iteração Feições, 18seleção Feições, 17simbologia, 25
camadas vetoriais
carregando, 9carregando
arquivos GPX, 10camadas de texto delimitado, 10camadas matriciais, 10camadas OGR, 9camadas PostGIS, 9camadas SpatiaLite, 10camadas vetoriais, 9geometrias MySQL, 10matriz WMS, 11projects, 7
Complementosarquivo de recurso, 66desenvolvimento, 59documentação, 66escrevendo, 62escrevendo o código, 62implementação de ajuda, 66liberando, 74metadata.txt, 62, 64testes, 74trechos de código, 67
complementos, 79alternar capas, 83atributos de acesso das feições selecionadas, 83llamar método con atajos, 83metadata.txt, 97repositório oficial de complementos python, 80
configuraçõesarmazenamento, 53camada do mapa, 56global, 55leitura, 53projeto, 55
ConsolePython, 2
consultandocamadas raster, 15
custom applications; standalone scriptsPython, 3
executandoaplicativos personalizados, 4
expressões, 50
103

PyQGIS developer cookbook, Versão 2.14
Análise, 52avaliação, 52
Feiçõesatributos, Camadas vetoriais, 17Camadas vetoriais Iteração, 18Camadas vetoriais seleção, 17
filtrando, 50
geometriaconstrução, 35manipulação, 33para acesso, 35predicados e operações, 36
geometrias MySQLcarregando, 10
impressão do mapa, 46Iteração
Feições, Camadas vetoriais, 18
mapa na tela, 40arquitetura, 41Bandas raster, 43Costimizar ferramentas do mapa, 44Desenhar itens da tela do mapa, 45Ferramentas de mapa, 42Incorporando, 41Marcadores de vértice, 43
matriz WMScarregando, 11
Metadados, 64metadados, 97metadata.txt, 64, 97
personalizarRenderização, 31
projeções, 40projects
carregando, 7provedor de memória, 24PYQGIS_STARTUP
ambiente, 2Python
Complementos, 3Console, 2custom applications; standalone scripts, 3Desenvolvendo complementos, 59developing server plugins, 94startup, 1startup.py, 2
rastersbanda simples, 14Multi banda, 14
registro de camada de mapa, 11adicionando uma camada, 11
Renderizaçãopersonalizar, 31
renderização do mapa, 46simples, 47
renderizador de simbologia caracterizada, 27renderizados de símbolos graduados, 27renderizando simbolo individual, 26resources.qrc, 66
Símbolostrabalhando com, 28
saídaimagem raster, 49PDF, 50usando o compositor de mapas, 48
seleçãoFeições, Camadas vetoriais, 17
server pluginsdeveloping, 94metadata.txt, 97
simbologiaAntigo, 33renderiados de símbolos categorizados, 27renderizados de símbolos graduados, 27renderizando simbolo individual, 26
Sistemas de Referencia de Coordenadas, 39startup
Python, 1startup.py
Python, 2
104 Índice