pyrolysis and combustion kinetics of refuse derived fuel ... · pyrolysis and combustion kinetics...
TRANSCRIPT

Pyrolysis and Combustion Kinetics of Refuse Derived Fuel and Ash Characterization
Andrii Tomasik
Thesis to obtain the Master of Science Degree in
Energy Engineering and Management
Supervisors: Prof. João Carlos Moura Bordado
Prof. Francisco Manuel da Silva Lemos
Prof. Mário Manuel Gonçalves da Costa
Dr hab. inż. Karol Sztekler, Pf. AGH
Examination Committee
Chairperson: Prof. Maria de Fátima Grilo da Costa Montemor
Supervisor: Prof. Francisco Manuel da Silva Lemos
Member of the Committee: Dra. Sandrina Batista Pereira
March 2017

1

2
Contents Acknowledgments ......................................................................................................................................... 4
List of tables .................................................................................................................................................. 5
List of figures ................................................................................................................................................. 6
List of abbreviations ...................................................................................................................................... 7
Abstract ......................................................................................................................................................... 8
Resumo ......................................................................................................................................................... 9
1. Introduction ........................................................................................................................................ 10
1.1. Motivation ........................................................................................................................................ 10
1.2. Objectives......................................................................................................................................... 10
1.3. Organization of the thesis ................................................................................................................ 11
2. Literature review ................................................................................................................................. 12
2.1. Waste incineration technology ........................................................................................................ 12
2.2. Air pollution control on waste-to-energy plants ............................................................................. 13
2.2.1. Nitrogen oxides ......................................................................................................................... 14
2.2.2. Dioxins and furans ..................................................................................................................... 14
2.2.3. Acid gases .................................................................................................................................. 15
2.2.4. Particulate ................................................................................................................................. 15
2.3. Type of waste and methods of treatment ....................................................................................... 16
2.4. RDF use in thermal processes .......................................................................................................... 17
2.5. RDF classification ............................................................................................................................. 19
2.6. Combustion of RDF .......................................................................................................................... 20
2.7. RDF pyrolysis .................................................................................................................................... 21
2.8. Properties of ash .............................................................................................................................. 23
2.8.1. Bottom ash ................................................................................................................................ 23
2.8.2. Fly ash ....................................................................................................................................... 25
2.9. Treatment of MSWI residues ........................................................................................................... 26
2.10. Industrial applications of MSWI ash .............................................................................................. 26
2.10.1 Use as fertilizers ....................................................................................................................... 26
2.10.2. Cement and concrete production ........................................................................................... 27
2.10.3. Road pavement ....................................................................................................................... 28
2.10.4. Zeolite production ................................................................................................................... 29
2.10.5. Glass and ceramics production ............................................................................................... 30

3
2.10.6. Stabilizing agent ...................................................................................................................... 31
2.10.7. Adsorbents .............................................................................................................................. 31
3. Materials and methods ....................................................................................................................... 34
3.1. TGA/DSC ........................................................................................................................................... 34
3.2. Fuel analysis ..................................................................................................................................... 34
3.3. Pyrolysis ........................................................................................................................................... 36
3.4. Combustion ...................................................................................................................................... 37
3.5. Kinetic model ................................................................................................................................... 38
3.6. Ash samples studied ........................................................................................................................ 40
3.7. SEM and EDS .................................................................................................................................... 42
4. Results and discussion ........................................................................................................................ 44
4.1. TGA/DSC results ............................................................................................................................... 44
4.2. Kinetic model results ........................................................................................................................ 45
4.3. Light fraction fly ash ......................................................................................................................... 50
4.4. Heavy fraction fly ash ....................................................................................................................... 54
4.5. RDF ash analysis ............................................................................................................................... 57
4.6. XRD analysis ..................................................................................................................................... 60
4.7. Waste-to-Energy plant fly ash and RDF ash comparison ................................................................. 63
5. Conclusions ......................................................................................................................................... 65
5.1. Thermal analysis .............................................................................................................................. 65
5.2. Kinetic modeling .............................................................................................................................. 65
5.3. Fly ash analysis ................................................................................................................................. 66
5.4. Future proposal ................................................................................................................................ 67
References .................................................................................................................................................. 68

4
Acknowledgments
This thesis is based on work conducted within the InnoEnergy Master School, in the MSc programme Clean
Coal Technologies. This program is supported financially by the KIC InnoEnergy. The author also received
financial support from InnoEnergy, which is gratefully acknowledged.
First of all, I would like to express my sincere gratitude to my Portuguese supervisors – Prof. Mario Costa,
Prof. Francisco Lemos and Prof. Joao Bordado for their constant support and priceless pieces of knowledge
that they have been carefully putting into my head. Their doors were always unlocked for my regular visits
as well as the email boxes ready to receive my numerous letters.
I would also like to thank Dr. Karol Sztekler – my AGH supervisor and program coordinator. Hardly could I
find more helpful person during these recent years spent abroad. Dr. Sztekler is a man for whom a word
‘problem’ does not seem to exist and I am cordially grateful to him for tackling my problems connected with
various academic issues whenever I approached him.
I thank the InnoEnergy officials for granting me these magnificent years full of experience, challenges and
discoveries and for opening the doors of opportunities for me.
Further, I like to acknowledge my laboratory friend Mr. Everton Santos for being kind, patient and extremely
helpful while teaching me how to work with the equipment.
My gratitude passes also to all my professors in Krakow and Lisbon for the knowledge and skills that they
have given me and for making my recent years so challenging and meaningful.
I would like to acknowledge my friends both domestic and foreign and my dear sister for their belief, support
and help that they graced me with during our numerous conversations.
Finally, I would love to thank my parents and my beloved one for their selfless and unreserved support as
well as their ability to charge me with motivation to work when I craved it.
Without all these people, the following pages would remain blank.

5
List of tables
Table 1 Composition of flue gas prior to cleaning [4] .................................................................................. 13
Table 2 Pollutants in flue gas prior to treatment [4] .................................................................................... 13
Table 3 Source, annual tonnage, and percent lead and cadmium in combustible MSW fraction [8] ......... 18
Table 4 Typical oxides composition of MSWI bottom ash [22] ................................................................... 24
Table 5 Typical heavy metals composition of MSWI bottom ash [22] ........................................................ 24
Table 6 Selected geotechnical properties of bottom ash [24] ..................................................................... 25
Table 7 Typical oxides content in the MSWI fly ash [22] ............................................................................ 26
Table 8 Typical content of heavy metals in MSWI fly ash [22] ................................................................... 26
Table 10 Applications of MSWI ashes [26]. ................................................................................................ 32
Table 11 RDF composition and properties [39] .......................................................................................... 35
Table 12 Program parameters for TGA experiments .................................................................................. 37
Table 13 The amount of pseudocomponents obtained by the model ......................................................... 45
Table 14 Reaction rate constant and activation energies obtained by the model ...................................... 45
Table 15 Fitting value for different experiments .......................................................................................... 46
Table 16 The elemental composition of light fraction of fly ash - spectrum 1 ............................................. 51
Table 17 The elemental composition of light fraction of fly ash - spectrum 2 ............................................. 51
Table 18 The elemental composition of light fraction of fly ash - spectrum 3 ............................................. 51
Table 19 The elemental composition of light fraction of fly ash - spectrum 4 ............................................. 51
Table 20 The elemental composition of light fraction of fly ash - spectrum 5 ............................................. 51
Table 21 The elemental composition of light fraction of fly ash - spectrum 1 ............................................. 55
Table 22 The elemental composition of light fraction of fly ash - spectrum 2 ............................................. 55
Table 23 The elemental composition of light fraction of fly ash - spectrum 3 ............................................. 55
Table 24 The elemental composition of light fraction of fly ash - spectrum 4 ............................................. 55
Table 25 The elemental composition of light fraction of fly ash - spectrum 5 ............................................. 55
Table 26 The elemental composition of RDF derived ash - spectrum 1 ..................................................... 60
Table 27 The elemental composition of RDF derived ash - spectrum 2 ..................................................... 60
Table 28 The elemental composition of RDF derived ash - spectrum 3 ..................................................... 60
Table 29 The elemental composition of RDF derived ash - spectrum 4 ..................................................... 60
Table 30 The elemental composition of RDF derived ash - spectrum 5 ..................................................... 60
Table 31 Elemental composition comparison of the three studied ash fractions ........................................ 64
Table 32 Reaction rate constant and activation energies obtained by the model ...................................... 66
Table 33 Final comparison of different fly ash’ composition ....................................................................... 66
6
List of figures
Figure 1 An example of two different schemes of RDF preparation [17] .................................................... 20
Figure 5 Traditional road pavement structure [26] ...................................................................................... 29
Figure 7 Simultaneous Thermal Analyzer (STA) 6000 ............................................................................... 34
Figure 6 Studied RDF. 1 – original RDF, 2 – ground sample ..................................................................... 35
Figure 19 Technological diagram of the Waste-to-energy plant in Bydgoszcz (Poland) [49] ..................... 41
Figure 8 TGA curves obtained for RDF combustion at different heating rates ........................................... 44
Figure 9 TGA curves obtained for RDF pyrolysis at different heating rates ............................................... 44
Figure 12 TGA curves from modeling and experimental data for RDF pyrolysis at 5 ⁰C/min heating rate. 47
Figure 13 TGA curves from the model and real data for RDF pyrolysis at 10 ⁰C/min heating rate ............ 47
Figure 14 TGA curves from modeling and experimental data for RDF pyrolysis at 20 ⁰C/min heating rate
.................................................................................................................................................................... 48
Figure 15 TGA curves from modeling and experimental data for RDF combustion at 10 ⁰C/min rate ....... 48
Figure 16 TGA curves from modeling and experimental data for RDF combustion at 5 ⁰C/min heating rate
.................................................................................................................................................................... 49
Figure 17 TGA curves from modeling and experimental data for RDF combustion at 20⁰C/min heating rate
.................................................................................................................................................................... 49
Figure 18 Mass loss rating curves for combustion at the heating rate 5 ⁰C/min ......................................... 50
Figure 20 Light fly ash fraction ‘LFA 1’ with five spectrums chosen for the elemental analysis ................. 51
Figure 21 Light fraction fly ash. Magnification x200 .................................................................................... 52
Figure 22 Light fraction fly ash. Magnification x500 .................................................................................... 53
Figure 23 Light fraction fly ash. Magnification x200 .................................................................................... 53
Figure 24 Light fraction fly ash. Magnification x200 .................................................................................... 54
Figure 25 Heavy fly ash fraction ‘HFA 1’ with five spectrums chosen for the elemental analysis .............. 54
Figure 26 Heavy fraction fly ash. Magnification x200 ................................................................................. 55
Figure 27 Heavy fraction fly ash. Magnification x500 ................................................................................. 56
Figure 28 Heavy fraction fly ash. Magnification x1000 ............................................................................... 56
Figure 29 Heavy fraction fly ash. Magnification x3000 ............................................................................... 57
Figure 30 RDF derived ash. Magnification x200 ......................................................................................... 58
Figure 31 RDF derived ash. Magnification x500 ......................................................................................... 58
Figure 32 RDF derived ash. Magnification x1000 ....................................................................................... 59
Figure 33 RDF derived ash. Magnification x3000 ....................................................................................... 59
Figure 34 Comparison of the light fly ash diffraction pattern with the halite pattern ................................... 62
Figure 35 Comparison of the light fly ash diffraction pattern with the sylvite pattern.................................. 63

7
List of abbreviations
EU - European Union
GRG - Generalized reduced gradient
RDF - Refuse derived fuel
GHG - Greenhouse gases
MSW - Municipal solid waste
CHP - Combined heat and power
APC - Air pollution control
PCDD - Polychlorinated dibenzo-p-dioxins
PCDF - Polychlorinated dibenzofurans
PVC - Polyvinyl chloride
BAT - Best available technique
W-t-E - Waste-to-Energy
PTFE - Polytetrafluoroethylene
CEWEP - Confederation of European Waste-to-Energy Plants
MBT - Mechanical biological treatment
CBR - California Bearing Ratio
MSWI - Municipal solid waste incineration plant
CEC - Cation-exchange capacity
BA - Bottom ash
FA - Fly ash
TGA - Thermogravimetric analysis
DSC - Differential scanning calorimetry
SEM - Scanning electron microscope
EDS - Energy-dispersive X-ray spectroscopy
LDPE - Low-density polyethylene
HDPE - High-density polyethylene
XRD - X-ray powder diffraction

8
Abstract
Municipal solid waste is an inevitable product of human activity. Whatever a person does he or she
produces waste. Trend analysis indicates a constant growth of the quantity of waste at a global scale. With
this, the problem of waste management becomes increasingly more important. Until recent decades
municipal waste was disposed of and stored in landfills. However, this way of treatment introduces
numerous environmental problems and, as a matter of fact, just postpones dealing with the issue. The
situation in waste management started to change rapidly in the mid 70-s when the waste hierarchy concept
was introduced for the first time in The European Union’s Waste Framework Directive. By now, an
impressive progress was already achieved in the waste management sector in the developed countries,
especially the EU members. However, the issue is far from being resolved and more efforts are being taken
nowadays to tackle the waste issue.
Energy recovery from waste is one of the important steps in the waste hierarchy ladder. Waste-to-energy
facilities do not only deal with the waste management issue but, also, contribute in saving fossil fuels and
other natural resources. Taking into account the rise of greenhouse gases (GHG) emissions levels in the
atmosphere due to the extensive use of fossil fuels, it must be conceded, that the energy recovery from
waste is an integral measure to decrease concentration GHG and hence, prevent the global warming.
The present work studies the energy recovery processes from municipal solid waste in the form of refuse
derived fuel (RDF). The Thesis aims at understanding and modeling the RDF combustion and pyrolysis
processes. Thermal Gravimetric Analysis and Differential Scanning Calorimetry were carried out to obtain
the data used for the creation of a kinetic model. The experiments were performed under air for combustion
and nitrogen atmosphere for pyrolysis. For each atmosphere, the behavior of the RDF samples at three
different heating rates were studied. The influence of the heating rate on the apparent kinetic parameters
of the model was discussed.
The characterization and comparison of the fly ash samples from a real waste-to-energy plant and the ash
obtained from the RDF combustion in the laboratory was made. The morphology of the studied material
was analyzed by electron microscopy, whereas elemental and phase composition was studied by energy
dispersive X-ray analysis and X-ray diffraction respectively. The obtained results showed differences in the
morphology and chemical composition of the samples. The discussion on the potential practical use of the
ash was also addressed and possible applications were suggested.
Key words: MSW, RDF, kinetic model, pyrolysis, fly ash

9
Resumo
Os resíduos sólidos urbanos são um produto inevitável resultante da atividade humana. Todas as
atividades dos seres humanos geram resíduos. Uma análise de tendências indica que será de esperar um
crescimento constante da quantidade de resíduos produzidos a uma escala global. Até há poucas décadas
atrás os resíduos urbanos eram enviados e armazenados em aterros. No entanto, esta forma de tratamento
produz um grande número de problemas ambientais e, na realidade, corresponde somente a um
adiamento do problema. A gestão de resíduos começou a mudar mais rapidamente em meados dos anos
70, quando o conceito de hierarquia de gestão de resíduos foi introduzido pela primeira vez na Diretiva-
Quadro sobre Resíduos da União Europeia. Neste momento já foi conseguido um progresso muito
significativo no setor de gestão de resíduos nos países desenvolvidos, em particular nos países membros
da União Europeia. No entanto este assunto está longe de estar resolvido e estão a ser envidados mais
esforços para lidar com o problema dos resíduos.
A recuperação energética a partir de resíduos é um dos degraus mais importantes na escada da hierarquia
de resíduos. As unidades de valorização energética de resíduos não só asseguram uma parte da gestão
de resíduos como também contribui, para a poupança de combustíveis fósseis e outros recursos naturais.
Tendo em conta o crescimento contínuo dos níveis de emissões de gases com efeito de estufa para a
atmosfera devido à utilização extensa de combustíveis fósseis deve reconhecer.se que a recuperação de
energia a partir de resíduos constitui uma medida integral para a diminuição da concentração de gases
com efeito de estufa e, consequentemente evitar o aquecimento global.
Este trabalho pretende estudar os processos de recuperação energética a partir de resíduos sólidos
urbanos na forma de combustíveis derivados de resíduos (CDR). Esta Tese pretende compreender e
modelar os processos de combustão e pirólise de CDR. Foram realizadas estudos por análise
termogravimétrica e Calorimetria Diferencial de Varrimento simultâneos para obter um modelo cinético.
Foram realizadas experiências sob ar no que respeita à combustão e sob atmosfera de azoto para a
pirólise. Para cada uma destas atmosferas for analisado o comportamento de amostras de CDR com três
velocidades de aquecimento diferentes. É ainda discutida a influência da velocidade de aquecimento nos
parâmetros cinéticos aparentes obtidos para o modelo.
Foram caracterizadas e comparadas amostras de cinzas volantes de uma unidade real de valorização
energética de resíduos e das cinzas obtidas pela combustão do CDR no laboratório. Foi estudada a
morfologia do material em estudo através da microscopia eletrónica, enquanto a composição em termos
elementares e de fase presentes foi feita por espectrofotometria de Raios-X por dispersão de energia e
por difração de raios-X respetivamente. Os resultados obtidos mostraram diferenças na morfologia e
composição química destas amostras. Foi ainda discutida a potencial aplicação prática destas cinzas,
sugerindo-se possíveis aplicações.
Palavras-chave: Resíduos Sólidos Urbanos, CDR, modelação cinética, pirólise, fly ash

10
1. Introduction
1.1. Motivation
Municipal solid waste (MSW) is a product that has lost its economic and social value. Thus, a car can
become waste when it gets broken, a book – when it is read, a toy wrapping – when a toy is removed from
it for the future use. Municipal solid waste has a negative value, since money should be spent to remove it
from the place where it was thrown away and people do not want to have degrading waste in front of their
doors.
Currently, it is considered that MSW is still a product or a resource that can be reused. Indeed, zero-waste
concept implies that waste can be used in several lifecycles and/or turned into a valuable resource or
energy for the production of new goods. In such a way the negative value of waste will be minimized to
zero. The zero-waste concept is the base of the circular economy – the industrial economy in which waste
will be eliminated due to reduction, reuse, recycle and recovery of useful material and energy on every
stage of a product’s lifecycle. The circular economy is an official goal of the European Union regarding
material resource management [1].
The waste management includes economic, social and environmental aspect. Smart waste utilization
results in resource, energy and fossil fuels saving and decreases the costs of newly manufactured products.
Energy recovery from the MSW is an integral part of the modern waste management. It helps to recover
useful power and heat from waste and decrease its negative value. It plays an important role in saving fossil
fuel resources, thus, contributing to the decrease of GHG in the atmosphere. Energy recovery from waste
includes a set of different technologies to thermally treat waste.
One of the prospective technologies of the energy recovery from municipal waste is the use of refuse
derived fuel (RDF). RDF is a fuel obtained from combustible fractions of MSW after pre-treatment. It is
shaped as pellets or briquettes in order to increase its physical characteristics. The main environmental
concerns when it comes to RDF combustion are the high concentration of chlorine-containing compounds
in the flue gas and the contaminants present in the fly ash.
1.2. Objectives
The objective of this Master’s Thesis is to the study the kinetics of RDF in two thermal processes –
combustion and pyrolysis. As a result, a kinetic model of RDF combustion and pyrolysis will be developed
and the kinetic parameters determined. The Thesis also deals with the issues connected to the utilization
of the fly ash. Concerning these issues, the chemical and morphological analysis of the ash obtained after
the thermal treatment of RDF will be done. The RDF derived ash will be compared to the fly ash from the
real Waste-to-Energy incineration plant. The recommendations on the future use of the fly ash will be given.

11
1.3. Organization of the thesis
The work consists of 5 chapters. The first chapter ‘Introduction’ includes an overview of general issues
related to MSW and the objective of the work as well as the motivation and the present sub-chapter -
organization of the Thesis. The second chapter includes the literature review of the waste combustion and
pyrolysis technologies, RDF potential as a source of energy as well as the review of the utilization methods
of fly ash. In the third chapter, the materials and methods of RDF pyrolysis and combustion kinetics are
presented including the description of the proposed kinetic model. In the same chapter the methods and
materials description connected to the ash characterization are also reviewed. The third chapter is followed
by the fourth chapter, in which the results of the study are presented. This chapter includes the
thermogravimetric analysis results, kinetic modeling results and the results of the analysis of the fly ash and
the comparison of different types of characterized ash. Finally, in the chapter 7, the conclusions on the
whole work done in the Thesis are presented.

12
2. Literature review
2.1. Waste incineration technology
Incineration of municipal solid waste is an industrial process which aims to reduce waste volume
neutralizing, at the same time, potential hazard of the original material and of the resulting products. In
Europe, the waste incineration sector started to develop rapidly in the mid 90-s. Up to current date, more
than 400 facilities were built or updated. This progress in the technology development was encouraged by
the new strict emission limits introduced in the EU regulations. These stricter limits led to the drastic
improvement in air pollution control systems [2].
The most recent waste incineration technology enables material and energy recovery, which gave the
modern incineration plants its new name – waste-to-energy plant [1].
From the physical point of view incineration of waste is a process of thermal oxidation of any combustible
materials, in particular, carbonaceous material contained in the municipal waste. Municipal solid waste
(MSW) is a heterogeneous material which includes organics, metals, paper, plastics, wood, textiles and
other materials. The amount of water in MSW is considerable and can reach up to 50% in the North and
60% in the South of Europe. In the South, this figure is higher because of more humid climate. During
incineration, the chemical energy contained in the combustible part of the waste is turned into heat [2].
There are several factors that affect fuel properties of municipal waste, namely, composition, water content
and extent of homogeneity. Waste with a high content of wet organic fraction will require more energy since
a process of intense drying will be involved. A high concentration of metals will also decrease the
combustibility of the material. Mixing, separation and some other pre-treatment techniques can make the
material more combustible [2].
Mass burn, is the most widespread technology for incineration and consist of burning unsorted mixed MSW
on the grate of the furnace. The temperatures of the process range from 850 to 1200 ⁰C, being the optimum
around 1100⁰C. The limit of the lower temperature enables to destroy hazardous compounds such as
dioxins and furans that might be formed during the process. The furnace has several burners distributed
along its height in order to guarantee complete combustion. On average, the waste spends 45 to 70 minutes
in the furnace. After the combustible material is burnt, the residues, bottom ashes, are discarded to the
bunker. These ashes can be used after required treatment. In order to guarantee the legislated levels of
NOx emissions, ammonia is pulverized in the furnace when needed [3].
The temperature of the flue gases is maintained within limits of 250 – 300 ⁰C to ensure necessary emission
reduction. The gas is cooled in water-gas heat exchangers, where the energy heat of the flue gases is
transferred to the water that will be supplied to local residential areas, as in conventional thermal power
plants. The steam obtained in the boiler is used in a turbine to produce electricity. The vast majority of
modern incineration plants enable combined heat and power generation (CHP). This has the highest value

13
when the plant is located close or in residential areas or industrial parks. In this case, the plant can be easily
connected to the water network on the early stages of construction. Often production of heat can generate
more money for a certain waste-to-energy plant than the production of electricity [2]. Thus in Bydgoszcz
(Poland), the local waste-to-energy plant generates 14 MW of heat and 3 MW of power.
Air pollution control system is an integral part of waste incineration process. The costs of this stage account
for two-thirds of the overall capital investment of the project. Modern gas cleaning systems underwent a
long process of development encouraged by frequent changes in EU regulations. Nowadays such systems
consist of several stages that fulfill different functions – reduction of particulate matter, of gaseous pollutants
and of heavy metals [4]. Typical stages of flue gas cleaning are a dry or semi-dry scrubber, baghouse filter,
activated carbon reactor. In some cases, electric precipitators and quenchers are applied.
2.2. Air pollution control on waste-to-energy plants
Air pollution control (APC) is a set of integral measures to neutralize the harmful influence of the flue gases.
APC systems can be responsible for 2/3 of the investment capital of a waste-to-energy plant. They have
an impact on the composition of fly ash and emissions released into the atmosphere. The choice of a proper
APC system is a complex task involving an advance decision making [5].
Table 1 and 2 reveals the composition of untreated flue gas and of the pollutants present in the gas. High
concentrations of HCl and the presence of compounds as dioxins and furans makes the process of gas
treatment in waste-to-energy plant more complicated and expensive in comparison with similar processes
in traditional fossil fuel power plants. As result, the limits for gaseous emissions for these plants are much
stricter and are regulated by the DIRECTIVE 2000/76/EC on the incineration of waste [6].
Table 1 Composition of flue gas prior to cleaning [4]
Component % (vol.) wet
CO2 10.8
H2O 16.2
N2 67.0
O2 6.0
Total 100
Table 2 Pollutants in flue gas prior to treatment [4]
Component mg(Nm3)-1
Dust 2500
HCl 1000
HF 10

14
SO2 300
Hg 0.8
NOx 350
CO 50
PCDD, PCDF 5.0
2.2.1. Nitrogen oxides
Oxides of nitrogen also known as NOx can occur in flue gas by two different ways. The first one is a result
of the oxidation of the N contained in the raw waste (NOx fuel) and the second is the fixation of nitrogen
inside a combustion chamber under the effect of high temperature. The factors that affect the formation of
first category NOx are the content of nitrogen in fuel e.g., in the organic fraction, the excess of air and the
primary/secondary air ratio. For the second category factors like temperature, pressure and gas residence
time are crucial in the formation of NOx. Since the control of N in waste is not possible, measures needs to
be taken in order to create favorable air mixing conditions. Another important measure is the recirculation
of the flue gas, which enable the prolongation of the combustion at lower peak temperatures and under a
limited excess of oxygen. The first measure will lower the amount of thermal NOx while the second will
restrict the reaction between N and O, which will not be available for such reaction. Another uniformly
applied measure is the introduction of pulverized ammonia to the boiler. This can help to reduce roughly
20% of NOx [4].
2.2.2. Dioxins and furans
Dioxins and furans are the largest environmental concern when speaking about waste-to-energy
incineration plants. They result from the burning of plastics and some other chlorine contained in the wastes.
In order to prevent the formation of these substances a set of measures can be applied both during and
after combustion. The incineration process itself is optimized to ensure complete combustion. Thus, current
European regulations strictly prescribe that the gases formed in the combustion chamber must be exposed
to a “temperature of 850 °C, as measured near the inner wall or at another representative point of the
combustion chamber as authorized by the competent authority, for two seconds”.
Removal of trace amounts of polychlorinated dibenzo-p-dioxins (PCDD’s) and dibenzofurans (PCDF’s) is
usually done with the help of scrubbing with the addition of activated carbon into the stream. A typical
reactor is a conical or cylindrical vessel equipped with injectors. A mixture of lime and activated carbon is
injected into the vessel forming a dense mist through with the flue gas passes. The result is the removal of
acid gases due to reaction with lime and absorption of dioxins and furans in activated carbon. Additionally,
activated carbon also serves as an absorbent of heavy metals - Cd, Hg, Pb as particularly volatile
substances that tend to pass along the gas duct [4, 7].
15
On the other hand, the use of lime and activated carbon increases the content of particulate matter in the
flue gas, making necessary the use of baghouse filters immediately after the reactor to capture the particles
that have not sedimented on the previous stage. Modern baghouse filters can ensure a particle capture
efficiency of 98.8% [4].
2.2.3. Acid gases
Acidic gases are another important issue for air pollution control process. In a waste incineration process
the most relevant are hydrochloric acid, hydrofluoric acid and sulfuric acid. Regarding HCl formation, 60%
is from the combustion of PVC, 36% from paper materials and 4% derived from leaves and grass. In order
to remove the acid gases some equipments are commonly used: packed, dry and semi-dry scrubbers,
spray towers etc. It is verified that the efficiency of the process are higher for wet methods and lower for
the dry ones. Concerning SO2 removal, the efficiency decreases from 80 – 90% for packed bed scrubbers
and spray tower to 60 - 80% for semi-dry scrubbers and to 50 – 60% for dry scrubbers. Regardless the high
efficiency, wet methods have been losing popularity because they produce liquid effluent that needs to be
treated afterwards. The EU has sent a clear message that the methods involving the use of liquid effluent
will not be considered BAT [4]. Semi-dry techniques are the most preferable ones for the time being.
The understanding of semi-dry technique principles bears crucial importance for the present work since the
reaction products in majority end up in the baghouse filter and, hence, can be found in fly ash later on.
The stream of flue gas at 230⁰C enters the spray absorber. Passing thought profile baffle plates it mixes
with lime hydrate suspension that plays a role of a scrubbing agent. The following reactions occur in the
semi-dry scrubber [4]:
2HCl + Ca(OH)2 = CaCl2 + H2O 2HF + Ca(OH)2 = CaF2 + H2O SO3 + Ca(OH)2 = CaSO4 + H2O SO2 + Ca(OH)2 + 1/2O2 = CaSO4 + H2O
2.2.4. Particulate
The decision-making process regarding the removal of the particulate matter depends strongly on the
required efficiency and the particle size distribution. The shape and size of generated particles is the major
concern when selecting the technology and correspondent equipment. Systems on the wet basis generate
effluent and sludge that must be further treated and dewatered respectively. The baghouse filter is one of
the most spread solutions for W-t-E plants. It ensures 99% overall efficiency and up to 95% efficiency for
the particles of the size of 0.2 microns and smaller. The efficiency depends on the gas temperature,
incoming dust load, condensation point of metals. In order to remove particles from the fabric such methods
as pulse-jet cleaning, shaking and reverse air flow are used. The filter can withstand temperature up to
220⁰C as well as moisture and chemical erosion. Special materials such as PTFE, glass fiber and Ryton

16
enable to do so. The melting point for most metals in the flue gas is above 300⁰C. The filter operating
temperature is 220⁰C suffices to keep metals and chlorides in the solid state. An important advantage of
fabric filter is that they operate passively without requiring power from the grid [4].
2.3. Type of waste and methods of treatment
Waste incineration sector is, usually, divided into the following groups:
1. Mixed municipal waste incineration which is applied mostly to untreated domestic waste from
households. These wastes can also have an insignificant amounts of non-hazardous industrial
waste [7].
2. Pretreated waste incineration – applied to specific collected, sorted and treated municipal or
industrial wastes. The characteristics of such fuel are different from the mixed waste. One of the
most popular forms of pretreated waste is the refused-derived fuel (RDF) which will be discussed
further in this work. [7].
3. Hazardous waste incineration - is incineration of industrial hazardous waste that can have a
negative impact on the environment. Usually these facilities are located near the waste collection
[7].
4. Sewage sludge incineration is used to utilize dried sludge obtained at wastewater treatment
facilities. Sometimes this waste is incinerated along with the first category, yet nevertheless, the
tendency of recent years heads toward sludge incineration on site largely due to additional costs
connected to the transportation [7].
5. Clinical waste incineration – is dedicated to the thermal treatment of waste from hospitals and other
healthcare institutions. This waste requires special treatment because of the possible threat that it
might pose to the environment and human health. Infectious and hazardous microorganisms
present in the waste should be neutralized under special conditions such as high temperature in
isolated chambers [7].
In Europe, 25% of municipal solid waste is treated in incineration facilities reaching 62% in some European
states making it the second waste management technique after recycling [7]. According to CEWEP
(Confederation of European Waste-to-Energy Plants) waste incineration does not confront with recycling,
supplementing it instead. The current market for waste-to-energy technology is based on 88 million tons of
household waste remained after applying reduce, reuse and recycling techniques. In 2014 38 billion kWh
of power and 88 billion kWh of heat were generated providing 17 million and 15 million inhabitants with
respective energy resources. The estimated effect of saving fossil fuels equals 9 – 48 million tonnes
depending on the type of fuel which corresponds to 24 – 48 million tonnes of CO2 [8].
The term waste-to-energy, however, refers not only to incineration plants but also to facilities working on
technologies like gasification and pyrolysis. Pyrolysis is the process of thermal decomposition of waste at
temperatures 400 – 800 ⁰C in an oxygen-free atmosphere. The chemical bonds are being broken under the

17
influence of heat which gives release to gases that are then directed to a combustion chamber. The resulting
product of pyrolysis is the liquid oil-like fuel that can be further refined, combustible gases and char [2].
Gasification in its turn is the process of thermal treatment in low oxidant atmosphere to produce Syngas
which can be used directly as fuel to produce heat and power or in chemical processes such as Fischer-
Tropsch synthesis to produce liquid fuels and/or chemicals. .
In order to increase the value of waste-based fuel, raw MSW can be pre-treated and shaped into a material
with improved physical characteristics. One of the widest spread forms of pre-treated MSW is refuse derived
fuel or simply RDF. RDF is, as a matter of fact, ground, crushed and compressed combustible fractions of
MSW. It is normally used in a form of pellets. RDF has enhanced calorific value and energy density in
comparison with the original waste [1].
2.4. RDF use in thermal processes
Thermal methods of MSW treatment are seen to be significantly more environmentally friendly than the
conventional land filling. Being the most widely spread among them incineration, however, raises concerns
about noxious pollutants such as NOx, SOx, HCl, dioxins, furans and some other gaseous and solid
contaminants. In some studies it is referred that the use of gasification and pyrolysis, instead of traditional
incineration based in combustion, results in lower hazardous emissions, enabling the reduction of
investment costs. This is connected to the fact that these technologies will require air pollution control (APC)
equipment of smaller size because of lowered flue gas flow and decreased temperature of the process.
The APC equipment is the most expensive part of an incineration plant and amounts for up to 65% of the
total capital investment [9].
Pretreatment of MSW is an important measure to increase fuel properties of the material before a thermal
process. It can contribute to the improvement of the combustion stability and normalization of the water
content. One of the most popular ways of MSW pre-treatment is the refuse derived fuel (RDF). In this
treatment, municipal waste is dried, crushed and compressed. The treated material is shaped as pellets,
that gives it quite homogenous composition and increase the energy density, which will reduce
transportation costs, since more energy content is transported in a lower space. Another advantage is the
possibility to control the chlorine and sulfur level by adding special chemical compounds during molding.
The most widely used is Ca(OH)2 [9].
Chlorine in MSW represents the potential source for the formation of HCl and, most important, chlorine-
based toxic organic compounds such as polychlorinated dibenzo-dioxins (PCDDs) and polychlorinated
dibenzofurans (PCDFs). HCl is a hazardous substance responsible for the corrosion at local level, and for
the formation of smog and acid rains that will have a negative impact on the environment. On the
incineration plants, the corrosion caused by HCl is a major issue, there is the need to remove gaseous HCl
from the flue gases before it reaches heat exchanger surface. This can be done by the use of lime as an

18
additive before the baghouse filters. The process of HCl removal is an important measure that helps to
increase the overall efficiency of a power plant [10].
The major source of chlorine-containing compounds in the flue gas of a MSW thermal treatment processes
is polyvinyl chloride (PVC). Thermal decomposition of these plastics releases chlorine that afterwards forms
noxious compounds with other elements. HCl starts to be released at the temperature of 300⁰C. Another
potential source for HCl formation is NaCl, which is presented in significant concentrations in food residues
as kitchen salt. Several authors studied the formation of chloride acid gas and observed that both paper
and some inorganic oxides such as Al2O3 and SiO2 have an impact on the formation of HCl [11, 9].
An interesting observation made by Halonen et al. [12] was that more toxic chlorinated hydrocarbons were
formed when the chlorine in the flue gas was from organic chlorine in comparison to inorganic one. Apart
from that, the operation conditions of the incinerator are also responsible for the difference in the content
of organic chlorine derived and inorganic chlorine derived compounds [12].
Spouting, a hybrid fluid-solid contacting bed, was studied as an operation mode for the incineration of RDF.
It is believed that spout-fluid beds can be extremely efficient for handling sticky solids or agglomerates. The
idea is to use a spouting moving bed to perform, at low temperature, the pyrolysis of RDF with the partial
combustion followed by the combustion of pyrolysis gas at high temperatures using secondary air [19].
The use of RDF in thermal processes can have an important advantage in terms of ashes composition.
Since, MSW streams can be selected prior to the fuel production, the steams with a high content of toxic
substances, namely chlorine and heavy metal can be eliminated. Table 3 reveals the fraction of Pb and Cd
in different MSW steams. Looking to the values presented in the table, it can be conceded, that the removal
of colored plastics from the stream coming to the RDF production, will drastically reduce or even eliminate
the content of these toxic metals in the fly ash. However, the benefits from such measures should be
carefully calculated. An overdone separation of certain fractions can dramatically affect the physical and
chemical properties of the material, which are relevant for the combustion and, hence, make the entire
process economically unfeasible. There is a certain trade-off between the revenue obtained from the energy
generation and the cost of the treatment and use of the fly ash [9].
Table 3 Source, annual tonnage, and percent lead and cadmium in combustible MSW fraction [8]
Source Lead Cadmium
tons % tons %
Plastics 3488 71.0 567 88.0
Pigments 1169 23.8 70 10.9
Rubber and used oil 256 5.2 7 1.1
Totals 4913 100.0 644 100.0

19
2.5. RDF classification
In some EU countries (e.g. Italy) special standards are used for the classification of RDF. The main
parameters defined by the standard in order to classify RDF as fuel are [14, 7]:
- Mean net calorific value - used as an economic parameter, dividing RDF into five classes.
- Chlorine content - technological parameter that has an important role in the definition of measures
needed for the residue treatment
- The mercury content average value - represents an environmental parameter.
For each of the mentioned above parameters, 5 classes with specific limits were created. Using all possible
combinations RDF can be divided in 125 classes. Apart from the main three parameters mentioned, a
number of other important parameters can be determined. Among them, the most relevant are ash content,
moisture, particle size distribution and heavy metal content. These parameters, however, are not regulated
by the common EU standard UNI EN 15359 (2011) and needs to be defined by each member state
individually [15].
It should be noted, that the properties and composition of RDF are site-specific, which means that the
parameters of fuel are highly dependent on the place where MSW was collected and the collection method
itself. Different waste management strategies, applied in the same region, can change RDF category. For
instance, efficient collection of medical thermometers can decrease the content of mercury in the waste,
placing the RDF produced from this waste into a different category. Another example can be garbage
collection in the places where the consumption of kitchen salt is low, which can result in a lower content of
Cl in RDF. The composition and hence classification of RDF is also dependent on mechanical biological
treatment (MBT) facilities. Consequently, RDF classification is an input-driven which the dependence on
the input waste streams is implied. Alternative classifications were suggested by several authors, which
proposed to produce RDF according to the need of the consumer instead of produce fuel with pre-
established parameters that later has to find its market. Another suggested change is relate to a wider
range of calorific values within the classes to make fuel from different classes more universal [14].
The main potential end-users of RDF are power plants, cement kilns, and dedicated incineration plants
predominantly with the grate combustion technology used. The use of RDF for co-combustion with other
fossil fuels in cement production plants seems to be the most appealing option. The reason for this is the
absence of strict fuel parameters for the cement production process. On the other hand, the use of RDF in
the power plants, apart from the fact that is often not feasible, is also limited by very strict requirements
regarding the fuel parameters. Generally, only 1 or 2 class of RDF within each criteria category is suitable
for the process. The use of RDF on the designated waste-to-energy plants can be a promising solution,
especially for the low-quality feedstock. This option, however, is the most vulnerable in terms of public
acceptance. Decision makers have to keep in mind that the choice of a treatment option is highly dependent

20
on the market policies and local waste management strategies as well as the efficiency of their
implementation [14].
2.6. Combustion of RDF
As the prices for traditional MSW treatment shows constant growth, the alternative methods gain popularity.
One of the most promising waste treatment options is the transformation of the combustible fraction of MSW
into RDF with its further thermal decomposition. At the moment, the most widely spread technique applied
to RDF is combustion. The combustion of RDF, as referred before, can be done in cement production
facilities, conventional thermal power plants as well as in designated waste-to-energy plants. RDF can be
burnt individually or in a co-combustion process. Currently, the best option seems to be the co-combustion
in the cement production units [16, 15].
In order to improve RDF combustion, MSW needs to be pre-treated. RDF is produced at mechanical-
biological treatment facilities (MBT) by grinding and mixing selected fractions of MSW such as paper,
cardboard, textiles, rubber, plastics, woody biomass etc. The RDF production diagram is represented on
the Figure 1. In order to comfortably transport RDF and increase its energy content per unit of mass, it is
usually shaped in pellets in automatic pellet presses. The pellets can have various sizes and shapes
depending on the technological parameters required [17].
Figure 1 An example of two different schemes of RDF preparation [17]
When co-combusted with other fuels, RDF can affect the process considerably since its volatile matter
content and ash content is usually different from the ones of coal or petroleum coke. Usually, RDF has
higher volatile content than coal and petroleum coke and consequently lower amount of fixed carbon. This
can have an influence on the co-combustion process kinetics [17].

21
Additionally, due to the high content of volatile inorganic compounds such as Na2O and K2O in RDF ash,
the tendency to have slagging and fouling is high, which will undoubtedly cause problems on the boiler
maintenance [17].
Because of the high content of volatiles in RDF, the co-combustion of RDF with coal can increase CO
formation. This can also be explained by the fact that pellets, before being placed to the combustion
chamber, have low temperature in comparison with the reactor. Incomplete combustion continues until the
temperature of the pellets reaches the mean temperature in a chamber. Pre-heating of pellets before their
disposal to the combustion chamber can solve this problem. It was also observed that smaller pellets tend
to release more volatiles, hence the control of pellets size is also important. Carbon monoxide emissions
are one of the major problems in RDF combustion. The combustion efficiency of solely burnt RDF process
is usually up to 5% lower than for the blends with other fossil fuels [17].
The kinetic characteristics of the combustion process were studied by several authors. They indicated that
the oxygen make the process of RDF combustion very complex in comparison with pyrolysis. The main
concern is the gas-phase reactions between oxygen and volatiles produced by the decomposition of
cellulose at lower temperatures. This phenomena promotes the char combustion on the early stages of the
solid decomposition. The later degradation of char, according to the research, occurred only when the
oxygen is present [11].
2.7. RDF pyrolysis
The use of RDF, in pyrolysis and gasification process presents a number of advantages when compared
with raw MSW. Since the fuel is produced only from the combustible fraction of waste it has much less inert
substances and consequently demonstrates better performance in thermal treating processes. It also has
advantages in transportation and storage due to the higher calorific density.
In spite of currently the main process of thermal treatment of RDF is the combustion in grade-fired
incineration plants, this fuel can be successfully used for pyrolysis and gasification. The positive aspects of
these alternative options are higher electric conversion efficiency and less contaminated residues in both
liquid and solid state. The characteristics of the bottom and fly ash depend on the type of the process.
Bottom ash obtained from RDF pyrolysis and gasification plants have different properties and composition
than the one from the conventional incineration plants and, hence, can find much broader further
applicability in industry. Nowadays, EU countries’ legislation does not distinguish fly ash from different
technologies, prescribing land filling and cement production as possible ways to the ash utilization. However
this can change since numerous studies has already proved the suitability to use RDF pyrolysis ash in other
applications, due, manly to its different composition and leaching behavior [18, 9].
The efficiency of pyrolytic thermal treatment of RDF rests upon the design of complex, expensive large-
scale units. The main, and one of the most expensive, part of such units is pyrolysis reactor. That is why

22
the understanding of pyrolysis of RDF has an utter importance. The improperly built reactor can cause
significant issues for the feasibility of the process and, hence, might cause its owner financial losses. The
understanding of the pyrolysis behavior of RDF is important not only for the construction of pyrolyzers but
also for the modelling and design of the equipment for combustion and gasification, since pyrolysis is an
integral sub-process in these thermal processes [11].
The RDF use in thermal processes is a relatively new topic, hence, there is the need to improve knowledge,
especially as far as process modeling is concerned. However, existing research is enough to verify some
similarities between RDF and biomass pyrolysis. This can be explained by the fact that cellulosic
compounds and lignin are the main structural blocks for both fuels. However, RDF containing a significant
amount of plastics can have some specific features that can considerably affect both the process and its
modeling. The temperature range at which pyrolysis occur is similar for RDF and biomass, yet, the presence
of plastics may strongly affect the yield and composition of products [19].
RDF also do not have the negative features of biomass fuel and, consequently, can be considered to be a
primary fuel for pyrolysis and gasification processes. Two main disadvantages of biomass use are its
expensive price and low concentration in places where it is collected. As MSW has a negative value, RDF
producer can get its feedstock at prices close to zero. Additionally, MSW as a resource for RDF production
is very well concentrated in collection and sorting centers. There is one more specific feature for the use of
RDF in gasification/pyrolysis application. Since the composition of the fuel is highly heterogeneous, it can
narrow the circle of potential users. Cement and steelworks prefer more selective input streams. In such a
way pyrolyzers and gasification can be niche customers for refuse derived fuel [20, 11].
The importance of RDF pyrolysis is also explained with the fact that multiple plastics presented in RDF can
be thermally cracked in order to produce liquid fuels, such as synthetic oil or different petrochemicals. Thus,
RDF pyrolysis can play an important role in substituting fossil fuels and consequently contribute to a fight
against global warming [21].
It would be fair to notice that the presence of chlorine-containing compounds in RDF can result in high
content of HCl in flue gases, making necessary the installation of additional gas cleaning equipment, which
can be a decisive factor for the plant’s viability [9].
Different reactors have been studied for RDF pyrolysis. Among them fluidized and fixed bed reactors, rotary
kilns as well as stationary and moving bed reactors. In a fluidized reactor, the recovery of hydrocarbons
was investigated by numerous scientists. In many cases, promising results were demonstrated. The main
issue of this research, though, is that they primarily are focused on the technological characteristic of the
reactors and lack fundamental basics analysis which is important for understanding the role of particular
species and reactions on the overall process. This Thesis is aimed to fill in the gaps in fundamental basics,
particularly the ones connected to the determining the kinetic parameters for the RDF pyrolysis at low
heating rates [18, 17].

23
In some works it was observed that the kinetic parameters of the RDF pyrosysis depend on several factors
including temperature, heating rate, structure of the material, inert gas used etc. Apart from that the catalytic
role of inorganic compounds should not be neglected. The composition of RDF can also has an influence
on the process kinetics. Thus, the high concentration of plastics can strongly affect the activation energy
[18].
Regarding the analysis of the thermal decomposition of RDF, both kinetic and equilibrium models are
usually used. Equilibrium models are important because they can predict thermodynamic limits, however,
a lot of studies showed their poor performance in terms of matching experimental results. Kinetic models,
in their turn, even though being restricted to a small number of reaction and species, show extremely good
matching in different heating rates [21].
2.8. Properties of ash
Waste-to-Energy technologies are strongly connected with the production of problematic process residues.
These residues mainly come in a form of ash which have to be disposed of to minimize its environmental
impact. Depending on a source and physical properties, one can distinguish several types of ashes.
Differences between the types often determines their further applicability [3].
Ash is a mixture of materials, which were not combusted during incineration process. Ash composition is
affected by the type of waste used in the incineration process and by the combustion conditions. Incomplete
combustion can cause the presence of char inside ash. Mostly, ashes consist of incombustible materials,
mainly mineral ones, like silicates, aluminates and oxides, unoxidized metals, ceramic and glass materials.
In the next chapters a description of the type of ashes is performed [3].
2.8.1. Bottom ash
Bottom ash is a post-combustion residue of the combustion process that can be found bottom of the boiler.
This ash contains non-combustibles, which, during treatment at high temperatures, are softened and melted
to some extent. This type of ash is usually present as larger agglomerates. Bottom ash handling is usually
done by inserting it into water, in order to cool it down, reduce of dust and make it suitable for the further
transportation [22].
As it can be seen in Table 4 and Table 5, in terms of chemical composition, the main constituents of bottom
ash are silicon and calcium oxides. Obviously, all of the values differ depending on time and specific Waste-
to-Energy facility, because of the nature of input material. All of the mentioned compounds are easy to
predict – all of them are non-combustible, present in significant amounts in solid wastes collected [22].

24
Table 4 Typical oxides composition of MSWI bottom ash [22]
Oxide SiO2 Al2O3 CaO Fe2O3 MgO K2O Na2O SO3 P2O5 TiO2
wt% 27,8 9,9 25,9 4 3,3 1,8 3,3 0,5 6,9 2
Table 5 Typical heavy metals composition of MSWI bottom ash [22]
Element Ag As Ba Cd Co Cr Cu Hg Mn Ni Pb Se Zn Sn Sr V
mg/kg 4,1-
14
19-
80
900-
2700
1,4-
40
10-
40
230-
600
900-
4800
0,01-
3
0,7-
1,7
60-
190
1300-
5400
0,6-
8
800-
6200
100-
1300
170-
350
36-
90
Bottom ash is essential composed by fused coarser ash particles. Frequently, these particles are quite
porous and look like volcanic lava. If the bottom ash is competent, it can be used as lightweight aggregate,
an important component to produce concrete blocks. Since the density of some bottom ash is less than half
of conventional aggregate, the concrete blocks will be much lighter and just as strong. On the other hand,
due to the relatively high presence of trace metals, namely lead and cadmium, as well as salt content, it is
a significant concern, if bottom as derived materials should be used as an aggregate substitute material [3].
One of the most common uses for bottom ash is as structural fill. At many construction sites, large quantities
of fill are frequently required to level low places for construction and drainage purposes, build
embankments, fill trenches, backfill foundations, etc. The fill is typically local aggregate or crushed stone,
but bottom ash is also used when available and when its transport is economically viable. Because of
calcium and other salts presence, bottom ashes are susceptible to the cementitious reaction, especially
when it is a part of combined ash, which contains unreacted lime. The presence of high salt content can be
problematic in terms of corrosiveness if in contact with metallic structures and, it can origin a decrease of
binding properties when biomass ash are used as an additive in Portland cement concrete [23, 3].
Regarding the physical properties of bottom ash, Alhassan and Tanko [24] developed geotechnical
properties of MSWI bottom ashes in order to determine its usability as construction materials. Their results
indicated, that bottom ash has very similar properties in terms of specific gravity, permeability and stability
than sand and gravel. California Bearing Ratio (CBR) is showing, that bottom ash can be used as a strong
road sub-base material. All of the parameters checked in Alhassan’s and Tanko’s work shown, that
according to American Association of State Highway and Transportation Officials (AASHTO) regulations,
MSWI bottom ash can be used as a low-cost construction material.

25
Table 6 Selected geotechnical properties of bottom ash [24]
Property Mean value
Specific gravity 2,2
Maximum dry density 1,65
% fine fraction 87,25
% silt fraction 1,5
Permeability (m/s) 6,23 * 10-4
CBR for unsoaked
(soaked) 0,1
penetration
53,50 (27)
2.8.2. Fly ash
Fly ash is a material, which has fine powdery properties. It is composed mainly by non-combustible
inorganic material, but also contains some carbon that is leftover from partially combusted wastes. Although
fly ash particles are generally spherical, it is usual to found also irregular particle. The spherical shape of
fly ash results from the formation of tiny molten droplets as the ash travels through the boiler. Since it is so
fine, removal and collection of fly ash from combustion gases (flue gas) requires specialized equipment
such as electrostatic precipitators or fabric filters [23].
In terms of chemical composition, the main constituents remaining the same as in the bottom ash, being
silicon oxide and calcium the main ones. The significantly lower concentration of iron should be noted. It is
caused by a fact, that the vast majority of ferrous materials remained unburned in a form of large and heavy
pieces of metal and, hence, it remained in the bottom ash [22].
Fly ash has significantly higher concentrations of heavy metals, such mercury and cadmium, than bottom
ash, due to the fact that fly ash has adsorption properties facilitating the adsorption of metal atoms [22, 3].
Tables 7 and 8 reveal the typical composition of fly ash. Because of its nature, fly ash has similar properties
as coal fly ash, what allows to use it as Supplementary Cementitious Material, however, salts presence
blocks off the possibility of direct usage [23].

26
Table 7 Typical oxides content in the MSWI fly ash [22]
Oxide SiO2 Al2O3 CaO Fe2O3 MgO K2O Na2O SO3 P2O5 TiO2
wt% 18,8 12,7 24,3 4 1,6 4,3 5,8 6,4 2,7 1,5
Table 8 Typical content of heavy metals in MSWI fly ash [22]
Element Ag As Ba Cd Co Cr Cu Hg Mn Ni Pb Se Zn Sn Sr V
mg/kg 31-
95
31-
95
920-
1800
250-
-450
29-
69
140-
530
860-
1400
0,8-
7
0,8-
1,7
95-
240
7400-
19000
6,1-
31
19000-
41000
1400-
1900
80-
250
32-
150
2.9. Treatment of MSWI residues
In general, there are three main methods to deal with the residues left from the MSW mass burning process:
- Separation methods
- Solidification and stabilization
- Thermal methods
The treatment strategies can be different depending on the specific goals to be reached and in practice can
overlap each other. Thus, for example, separation, methods in many cases are applied as the first treatment
stage followed by solidification. In all cases however the reduction of the environmental impact is the
primary objective that can comprise of different sub-objectives such as decreasing the concentration of the
contaminants, influencing leaching properties of the treated material or reducing the toxicity of certain
substances [26].
2.10. Industrial applications of MSWI ash
2.10.1 Use as fertilizers
In theory, both bottom and fly ash has with main plants nutrients, namely, N, P and K. The high content of
potassium and phosphorus in bottom ash makes it potentially suitable as a replacement to commercial
fertilizers. The usage of fly ash as a liming agent is also possible due to the considerable amount of lime.
Despite evident benefits that ash can provide to soils, there is a set of restriction regarding commercial
usage of MSWI residues in agriculture. The main obstacle is related to the presence of heavy metals in ash
that, if getting to the food chain, might cause severe environmental issues including health problems for
plants, animals and humans. Toxic heavy metals might get to aquifers through soil by the process of
leaching causing considerable environmental damage. Apart from the heavy metals, the high content of
NaCl and other salts can be responsible for salt stress in numerous agricultural species. For the time being,
more studies are required to prove the applicability of the idea [26].
27
In the research paper written by Rosen, Bierman and Olson the influence of the use of MSWI ash on the
growth of Swiss chard and alfalfa was studied. The researchers attested that a number of favourable
nutrients in the incineration ash was enough to provide substantial growth of the studied plants, comparable
to the one caused by conventional fertilizers. Some problems raised concerns of the scientists, especially,
the high content of molybdenum present in plant tissue as well as absorption of cadmium by plants. These
heavy metals will pose a threat to the health of cattle and poultry if getting inside a digestion system of an
animal. Apart from that, the study refers that the high concentration of soluble salts in the residues can
negatively affect sensible plants [30].
2.10.2. Cement and concrete production
Oxides of Ca, Fe, Si and Al are the main composition blocks of the bottom and fly ash from incineration
plants amounting for up to 65 % of the material composition. These chemical compounds are also the main
ingredients in concrete and cement production. Therefore, the ash are considered to be a perspective
replacement of feedstock in the production of Portland cement – the most widely spread type of cement
worldwide [26].
The cement industry is one of the major contributors to global warming due to the high levels of CO2
emissions. The use of fly ash in cement production can have a positive effect on the reduction of carbon
dioxide release into the atmosphere. The main reaction involving CO2 emission is the decomposition of
calcium carbonate CaCO3 to lime CaO and carbon dioxide. Since the same process in engaged in ash
formation at waste incineration plant, the fly ash are already enriched with lime and hence can substitute a
part of lime used in cement production. However, there are several issues that prevent a full-scale use of
MSWI plants ash in cement industry. One of the most evident is the high concentration of chloride which
will decrease the quality of the final product. Besides, the content of heavy metals that is usually above
norm will surely cause environmental problems as with other industrial applications of the fly ash [25].
Ash pre-treatment techniques as washing and electrochemical process can help to overcome these
problems, reducing chloride and heavy metals amount. But, even after such measures the amount of ash
in the process should be carefully controlled [26].
There are several studies that analyse the hydration of cement clinkers. The content of alkali metals and
the content of heavy metals are two parameters that have opposite influence on the hydration process. The
hydration rate of clinkers that includes ash that was initially washed will be lower than the one without this
ash, since in washed ash the alkali metal content is low. The presence of chloride and sulfates in the ash
induces the ettringite (Ca6Al2(SO4)3(OH)12·26H2O) formation during hydration, which slowing down the
hydration reaction [31].
The material obtained as result of solidification/stabilization processes can also be used as a replacement
for cement. The concentration of residues up to 50% doesn’t have a negative effect on the hardness and

28
strength of the material. The problem of leaching is still here but the leaching rate is in compliance with the
requirements for road construction [26].
The bottom ash, in its turn, can be used in the production of concrete. Researchers indicate that the amount
of gravel to be replaced by bottom ash can harmlessly for durability reach as much as 50 %. However, for
this purpose, the residues must be treated with sodium hydroxide for 15 days. Without this kind of treatment,
the cracks and swelling can occur due to the reaction between Al in ash and cement. Fly ash from waste
incineration process can also be used as light-weight concrete aggregate in the form of pellets. The
resulting product can be successfully used for the construction of isolation walls as it is being done in some
Austrian landfills. Another proved safety usage of waste incineration plant residues is the use of solidified
fly ash in Portland cement mortars. With low leaching rates and high compressive properties, it is a cheap
and effective candidate to replace aggregate in mortars. Some researchers mentioned the possibility of
enhancing the reuse of ash in the concrete industry by using water washing under the specific condition of
pressure equal to 28 N/mm3, the sintering temperature of 1140 ⁰ C for 60 minutes [32].
The leaching is still of the most important concern for the application of residues in cement and concrete
industries. In spite of the fact that numerous researchers proved heavy metals leaching to be insignificant,
yet sudden local leaching may occur in the case of construction damage or heavy weather conditions [27].
In Japan, some successful experiments on using the high quantities of ash in cement clinker were
conducted with the resulting product gaining a name of Ecocement. In this process, the energy from MSWI
plant is used to turn limestone into lime with the follow-up use of the latter in Portland cement production
and later use of bottom and fly ash as feedstock in clinkers production [26].
2.10.3. Road pavement
On Figure 5, the typical layers of road pavement layers are presented. The upper layer consists of
bituminous coating and asphalt and provides contact between car wheels and the road itself and that is
why it should be even and durable. The next layer is called base course and its purpose is to distribute load
evenly. Traditional materials for these layers are cement concrete, granular gravel, ground rock, materials
stabilized with lime. The third layer is a sub-base and is constructed from gravel or materials stabilized with
cement. The last layer called subgrade is normally just evened soil and serves as the foundation for the
road [26].

29
Figure 2 Traditional road pavement structure [26]
The waste incineration plant bottom ash can be, possibly, used as a substitution for the materials used in
base and sub-base layers. In Sweden, an experimental road was built to test the properties of incineration
ash as road construction material. The experiment proved that residues can safely replace granular gravel
in the road’s sub-base layer without releasing into the environment such harmful substances as Co, Fe, Ni,
Mn, Pb as well as nitrate-nitrogen. A similar test was conducted on a specially created road in France where
during 3 years the measurements of leaching were made. The results showed that the content of heavy
metals in the leachate (the contaminated liquid released when the ash is contacted by water) is within the
limits for drinkable water. The conclusion was that the use of MSWI plant residues is totally acceptable in
road construction [4]. In Japan, the ash from local waste-to-energy plants was delivered to a stone
producing factory to use it as material for the production of payment blocs. The study results indicated that
those blocks posed no harm to either environment or human health, which consequently led to their usage
as construction materials for the pavements in Chiba Prefecture park [33].
In some cases, however, leaching of contaminants did evoke environmental concern. The possible solution
in such cases can be the pre-treatment of ash with washing methods to reduce heavy metals concentration.
Mulder in his works reported that in most of the cases, fly ash without pre-treatment did not meet
environmental regulations, whereas ash pretreated before stabilization procedure by washing meets the
strictest European norms [26].
2.10.4. Zeolite production
Zeolites are materials primarily consisted of silica-alumina that have extremely porous structure and are
used as catalysts in numerous chemical processes such as oil cracking or biofuel production as well as
adsorbents and ion-exchangers. Coal-fired power plants fly ash that consists mainly of SiO3 and Al2O3 have
been used as raw material for the production of artificial zeolites for decades. Despite the lower content of
silica and alumina oxides in waste-to-energy incineration plant ashes (up to 24%), some zeolites were

30
successfully produced out of it by the processes of fusion and hydrothermal treatment [26]. Such
parameters as surface area and CEC increased significantly for zeolites made of incineration fly ash in
comparison with the initial material. Regardless the fact that the parameters appeared to be lower than the
ones of commercial zeolites, however, the feasibility of using MSWI residues as raw material for the
production of zeolites was proven. The main drawback was the liquid produced as a sub-product. High
concentration of heavy metals in it indicates a need to further treatment [14].
To increase the quality of zeolites obtained from MSWI plant ash there is the possibility to mix it with ash
from coal-fired power plants, which has a higher percentage of alumina and silica oxides. The property of
synthesized zeolites is highly dependent on the temperature, crystallization time as well as on the
concentration of NaOH. Different zeolites can be synthesized under different conditions. Thus, the
production of Zeolite X requires lower NaOH/ash ratio and reaction temperature whereas synthesis of
Zeolite HS favors higher NaOH/ash ratio and temperature [34].
Chinese authors Fang, Zhang and Feng demonstrated an artificial zeolite made from the mixture of fly
ashes from MSWI plant and coal-fired power plant that showed better absorption capacity, equal 121.97
mg/g, than traditional artificial zeolite made of exclusively coal fly ash. Other studies showed that the
zeolites modified with iron (II) atoms and based on the fly ash demonstrated adsorption properties no worse
than for many commercial adsorbents . In spite of the fact that bottom ash is much more rarely used for the
production of zeolites, still, some successful experiments were performed on the synthesis of zeolites from
that material using alkaline hydrothermal treatment [35].
2.10.5. Glass and ceramics production
The commercial production of glass, glass-ceramics, and ceramic materials drags attention of material
scientists working with MSWI plant residue substances. As fly and bottom ash contain oxides of calcium,
alumina, and silica in high quantities, its use, as a replacement of the clay for the production of ceramics,
is possible even without additional treatment. Some researchers showed that the introduction of 20% of
bottom ash into a body of a ceramic tile has no negative impact on its mineralogical and thermal
characteristics. However, high content of chloride and potentially organic compounds can cause noticeable
problems to tiles if fly ash instead of bottom one is applied. In the same research, the addition of 20% of fly
ash to the tile body resulted in high compressive strength and minor water absorption after sintering at 960
⁰C. Additionally, a number of heavy metals leaching were diminished to 10% of that in initial material. In
terms of durability of tiles though, even 50% amount of ash added during production displays values within
acceptable limits [26].
During vitrification highly toxic substances got encapsulated into glass and, simultaneously dioxins and
furans got entirely decomposed under the influence of temperatures higher than 1300 ⁰ C. The vitrified ash
can have several applications such as road base feedstock, blasting grit, embankments, and pedestrian
sidewalks, in the ceramic tiles production, water permeable blocks etc [23].

31
Glass-ceramics are fine polycrystalline substance obtained in the process of special heat treatment of
glasses with a specific composition. They go through a controlled crystallization process to the low-energy
crystalline state. Such materials can find versatile applications due to the fact that their mechanical and
thermal characteristics are superior in comparison to the ones of parental glass. There were several studies
conducted to determine the compliance of vitrified incinerator fly ash to the production of glass-ceramics.
The appropriateness of using fly ash as raw material for glass-ceramics was proved due to its mechanical
and thermal properties. The reuse of fly ash in the glass-ceramics industry at relatively lower temperatures
was demonstrated with the help of additives. Thus, the process was successfully undergoing at a
temperature of 1200 ⁰ C instead of 1500 ⁰ C which made the technique much less energy consuming and
increased its viability. The obtained glass has less content of heavy metals than the raw material but when
exposed to water, some leaching might occur. This phenomenon undoubtedly shrinks the possible
application field of the products. Park and Heo tested the glass with inclusions of MSWI fly ash and
concluded that a number of heavy metal ions have concentrations in the leachate is below the current
environmental norms [26].
2.10.6. Stabilizing agent
The fly ash have been tested as possible internal coverage layers in landfills. Some results showed that,
the use of ashes in landfills with methane collection can have a positive effect on methane yield, intensifying
bacterial activity and digestion rate. The toxic compounds that are present in ashes do not have significant
adverse impact on anaerobic bacteria.
Additionally, incineration plant residues’ potential as a binder for solidification/ stabilization of sludge was
investigated. Research showed that the mixture in a proportion of 50 % sludge, 45 % fly ash, and 5 %
cement can provide sufficient stabilization effect. The advantages of such co-disposal include considerable
saving of space in landfills and minimization of cement consumption for sludge stabilization [36].
2.10.7. Adsorbents
The need to remove chemicals and heavy metals from waste water require the wide use of materials called
adsorbents. MSWI residues posses adsorption properties and, hence, can be used for waste water
cleaning. However, there is a major problem of such application since with the contact with water the ashes
themselves can generate heavy metals in so-called leachate. These metals can easily get to water
poisoning it and making it unsuitable for follow-up usage. The bottom ash, however, tends to contain much
less heavy metals and consequently can be used as adsorbent [37].
Cation exchange capacity (CEC) is an important parameter to estimate the adsorption potential of material.
CEC is dependent on the particles size of bottom ash. The lower are the particles the higher is CEC and
specific surface of the adsorbent. If the particle size is decreased from 120 to 100 mesh, the CEC will go
up from 8.0 to 24.6 meq/100g [38].

32
Another application of bottom ash adsorbent studied is the removal of dyes from wastewater. The removal
rate reached 98% and can be comparable to the conventional adsorbents. The quality of removal though
is in a close relation to the chemical structure of a certain dye [26].
Bottom ash adsorbents were also investigated in the process of gas purification. The technology was tested
for the purification of landfill gas from hydrogen sulfide, methyl mercaptan, dimethyl sulfide without negative
impact on the methane yield, The sequestration rates of 1 kg of bottom ash for hydrogen sulfide, methyl
mercaptan, dimethyl sulfide are 3.0 g, 44 mg and 86 mg respectively. The likely reason for the first two
gases adsorption is acid-basic reactions involving sulfur mineralization under low solubility metal sulfides
[26].
Fly ash have also been examined as an adsorbing agent for dyes and metallic ions. The main positive
aspect is the material’s neutralizing ability because of a significant amount of lime used in desulfurization
of flue gasses process. Hence this kind of residue can be used to treat contaminated water with enhanced
acidity. It should be noted, that the final pH of the treated water is in the strong dependence on the liquid to
solid ratio [37].
In the table below the most economically viable applications of waste incineration plant residues are listed.
Regardless the application and the technology in almost all cases, the waste material required several
stage pre-treatment to decrease possible harmful effects of the ready-to-use products [26].
Table 9 Applications of MSWI ashes [26].
Type Application Composition% Country
BA Aggregate in concrete
up to 50%
replace up to 15% of
France
BA Aggregate in concrete Slovenia
BA Road base Spain
BA Adsorbent for dyes India
BA Concrete Italy
Mixed Cement clinker up to 50% Portugal
Mixed Cement clinker 44% Japan
Mixed Cement clinker 15% Taiwan
Mixed Cement clinker 1.75% FA 3.5% BA Taiwan

33
Mixed Concrete Spain
FA Concrete 50% France
FA Eco cement 50% Japan
FA Ceramic tile
Binder for stabilizing
China
FA Sludge 45% China
FA Glass ceramic 75% FA, 20% SiO2,
5% MgO, 2% TiO2
Korea
FA Glass ceramic (low
melting temperature)
China
FA Cement clinker replace up to 30% of
raw material
China
FA Blended cement up to 45% UK

34
3. Materials and methods
3.1. TGA/DSC
Thermogravimetric analysis (TGA) is a method to study the kinetics parameters of thermal processes such
as combustion, gasification and pyrolysis. The TGA has proved to be a precise method especially at low
heating rates. The linearization techniques of nonisothermal reactions do not match well with the complex
composition of biomass-contained materials. To overcome this issue, the most popular method to estimate
the biomass thermal degradation kinetic parameters from TGA data, is the nonlinear method of least
squares (LSQ). This method assumes that the process is composed by several reactions [40].
The thermogravimetric tests were done in a Simultaneous Thermal Analyzer (STA) 6000 by PerkinElmer.
The device is equipped with a vertical displacement balance sensor providing weight insensitivity to sample
position as well as know-how sensor to measure both sample and reference temperature directly. The
temperature limit for the device is 1100⁰C. However, in this work the maximum temperature was 800⁰C.
The microscales on which a crucible is placed register the mass loss of the sample. The device can also
collect data on the heat flow change. The temperature is measured in two places. Program temperature is
measured by a thermocouple located on the wall of the combustion chamber whereas the samples
temperature is checked at the bottom of a crucible. The cooling of the sample is performed by cool ambient
gas injected into the combustion chamber. The device is connected to a computer with the TA instrument
softwhere installed. This software enables to store the experiment data. The image of the Simultaneous
Thermal Analyzer (STA) 6000 is presented on the figure below.
Figure 3 Simultaneous Thermal Analyzer (STA) 6000
3.2. Fuel analysis
The RDF for this study was obtained from a waste management company in Lisbon, Portugal. It has a low
calorific value of 25.1 MJ/kg and consists mainly of paper, cardboard, and cloths fraction of MSW with the

35
addition of plastics and wood. The initial fuel was subjected to crushing in the grinding machine in order to
diminish initial particles to the size of 1 mm suitable for thermogravimetric analysis (TGA). The image of the
treated RDF used in the experiments is displayed on figure 6.
Figure 4 Studied RDF. 1 – original RDF, 2 – ground sample
Table 11 shows the composition and properties of RDF used for the current study. RDF has a high volatiles
content of 80 wt%. Won Seo et al. discussed the influence of the volatile matter on the devolatilization for
different alternative fuels [20]. An interesting feature of RDF combustion is the formation of agglomerated
particles. The possible explanation for such formation might be the presence of plastics in RDF that when
melting can originate agglomerates. The properties of RDF are presented in the table below:
Table 10 RDF composition and properties [39]
Parameter Fuel: RDF
Proximate analysis (wt%, as received)
Volatiles 80.2
Fixed carbon 2.8
Moisture 2.6
Ash 14.4
Ultimate analysis (wt%, as received)
Carbon 44
Hydrogen 6.8
Nitrogen 1
Sulfur 0.06
Oxygen 31.14
Heating value
High heating value (MJ/kg) 26.9

36
Low heating value (MJ/kg) 25.1
The proximate analysis of the fuel was estimated using TGA curves, obtained from TGA experiments, which
consist, firstly, in carry out test of RDF pyrolysis to determine the volatile content and moisture content.
After the pyrolysis, what remained in the crucible was the combination of fixed carbon and ash - char.
The amount of water can be found from the following expression [2]:
𝑀 =𝑚𝑠𝑝𝑖𝑛 −𝑚𝑠𝑝
200
𝑚𝑠𝑝𝑖𝑛
∙ 100, [%] (1)
Where 𝑚𝑠𝑖𝑛 is the initial mass of the sample before the pyrolysis experiment and 𝑚𝑠𝑝
200 is the mass of the
sample subjected to pyrolysis at 200 ⁰C.
Knowing the moisture content in the sample, the amount of volatile matter can be easily found from the
following expression [2]:
𝑉𝑀 =𝑚𝑠𝑝𝑖𝑛 −𝑚𝑠𝑝
200 −𝑚𝑠𝑝𝑓𝑖𝑛
𝑚𝑠𝑝𝑖𝑛
∙ 100, [%] (2)
In this expression 𝑚𝑠𝑝𝑓𝑖𝑛
corresponds to the final mass of the sample after pyrolysis.
Finally, to estimate the content of fixed carbon and ash, the char was subjected to combustion tests in the
same TGA. The amount of fixed carbon was found as the difference between total weight of the sample
before combustion and the weight of the ash left after combustion.
An expression for fixed carbon can be written in the following form [2]:
𝐹𝐶 =𝑚𝑠𝑐𝑖𝑛 −𝑚𝑠𝑐
𝑓𝑖𝑛
𝑚𝑠𝑝𝑖𝑛
∙ 100, [%] (3)
Here 𝑚𝑠𝑐𝑖𝑛 and 𝑚𝑠𝑐
𝑓𝑖𝑛 are, respectively, initial and final mass of the sample during the combustion experiment.
Ash content can be determined as:
𝐴𝑠ℎ = 100 − 𝑀 − 𝑉𝑀 − 𝐹𝐶, [%] (4)
3.3. Pyrolysis
The experiments were performed in nitrogen, with a flow of 20 ml/min, at heating rates of 5, 10 and 20
⁰C/min. The samples were spread evenly along the alumina crucible with the diameter of 6 mm. The mass
of the samples ranging from 14.169 to 30.132 mg. For each samples a particular heating program was
created with the main differences being heating rates, ambient gas and the time for which a sample was
held at the highest programmed temperature. For each experiment an initial temperature of 40 ⁰C was

37
chosen. The first stage of each experiment was the even heating of the sample from an initial temperature
to 800⁰C at the previously set heating rate. When program reached the maximum temperature the
isothermal stage followed. At this stage the sample was hold at 800⁰C for 10 minutes in the case of 5 and
10⁰C/min heating rates and for 1 hour in the case of 20⁰C/min rate in order to observe the behaviour in the
isothermal stage.
3.4. Combustion
For the combustion of RDF three TGA experiments were performed with different heating rates - 5, 10 and
20 ⁰C/min. The same aluminum crucible as for pyrolysis was used. The program steps replicated the ones
for pyrolysis. The difference was in the medium gas used for the thermal treatment. In this case it was air.
The maximum temperature of the process was 800⁰C. For lower heating rates the isothermal stage time
equalled 10 minutes whereas for the highest rate the time was increased up to 60 minutes.
In order to analyze ash obtained from the combustion of RDF an additional experiment was carried out
since the amount of ash obtained from TGA was not enough for the SEM/EDS analysis. The ash sample
was burnt in the laboratory furnace at 800⁰C. The average heating rate was 15⁰C/min. The sample was
held at 800⁰C for 30 minutes. The obtained ash has light grey color and the sintered pieces can be
observed. However, when touched it is fell to smaller pieces with some particles forming agglomerates
around 2 mm in diameter and some being separate. In order to compare this ash with the one obtained
from a waste-to-energy plant, it was assumed that all formed ash can be considered fly ash. This
assumption is rested upon the particle size distribution that is close to the one of the industrial fly ash. The
experiment showed the mass loss of 85.36% that corresponds well with the figure obtained from TGA
experiments.
In Table 12, the parameters of each program are illustrated.
Table 11 Program parameters for TGA experiments
Sample name Weight Gas/Type of
reaction
Heating
rate, ⁰C/min
Maximum
temperature, ⁰C
Isothermal
part
longevity,
min
Cooling
rate,
⁰C/min
RDFcomb1 24.52 Air 5 800 10 50
RDFcomb2 14.11 Air 10 800 10 50
RDFcomb3 29.98 Air 20 800 60 50
RDFpyro1 22.40 Nitrogen 5 800 10 50
RDFpyro2 18.75 Nitrogen 10 800 10 50
RDFpyro3 22.19 Nitrogen 20 800 60 50

38
3.5. Kinetic model
The model applied in the current work assumes that the sample consists of a number of pseudocomponents
with initial masses w1, w2, w3, w4. One pseudocomponent represents a set of species that can be described
by the equation with common parameters of activation energy Ea and reaction rate constant k. In reality a
number of species in such complex material as RDF is higher than the one used in the applied model. The
differences in reactivity for every pseudocomponent are described by different values of activation energy.
There is an assumption that all the species go through a first order decay. Choosing of an appropriate
number of species plays an important role in the model precision.
According to the numerous research the kinetic parameters depends on a number of factors including
temperature, pressure, heating rate, ambient gas, mineral part composition etc [11].
In order to obtain the expressions used in the kinetic model a set of assumptions were made: 1) the
decomposition is based on the Arrhenius equation where the constant reaction rate is a function of the
temperature 2) the effect of the interactions between fractions of the material on the reaction rate is
neglected. In this sense, the weight loss rate of a pseudocomponent can be expressed by the following
equation according to the differential rate law for the 1-storder reaction [42]:
𝑑𝑊
𝑑𝑡= −𝑘(𝑇)𝑊 (5)
Where k(T) is the reaction rate constant at temperature T and W is weight of a pseudocomponent at time
t.
Solving this differential equation we obtain:
𝑊𝑖+1 = 𝑊𝑖 +𝑑𝑊
𝑑𝑡∙ (𝑡𝑖+1 − 𝑡𝑖) (6)
Where 𝑊𝑖,𝑗 and 𝑊𝑖,𝑗+1 are the weights of the component i at the current and following moment of time,
respectively. 𝑡𝑗 and 𝑡𝑗+1 are the time of the current and following moment.
Index i is responsible for a number of pseudocomponents and index j for time steps. In the initial moment
of time j=0, 𝑊𝑖,0 equals to the assigned to each pseudocomponent value. For water, cellulose, hemicellulose
and lignin the assigned values are 0.1, 0.3, 0.3 and 0.2 respectively based on the visual analysis of the
TGA curves. The additional fifth component corresponds to fixed ash. The value assigned to this component
is 0.1. The values were chosen based on the literature review of RDF kinetic models [40, 42, 43]. Since the
relative weight is used in the model, the sum of 𝑊𝑖,0 values must equal 1. Time step is a standard for the
TGA analyzer used in the experiments and equals 0.003 second.
According to the Arrhenius relationship [40]:

39
𝑘 = 𝑘0𝑒−𝐸𝑎/𝑅𝑇 (7)
Here k is reaction rate constant, 𝑘0 is the exponential factor, 𝐸𝑎 is the activation energy, R gas constant
which equals 8314 J/mol∙K and T temperature in Kelvins. 𝑘 depends on the temperature of the process.
The dependence of 𝑘0, 𝐸𝑎 and R on the temperature is insignificant and can be neglected [44]. An
alternative parametrization of Arrhenius equation was proposed by several authors in order to minimize
correlation between the equation’s parameters [43, 44]:
𝑘 = 𝑘𝑇𝑟𝑒𝑓 ∙ 𝑒−𝐸𝑎𝑅(1𝑇−
1𝑇𝑟𝑒𝑓
) (8)
Here 𝑘𝑇𝑟𝑒𝑓 a specific reaction rate at the reference temperature 𝑇𝑟𝑒𝑓, which in the present work equals to
573⁰C. If the reference temperature is infinite, then the equation will take the previous form. Thus, one can
understand 𝑘0 as the specific reaction rate at infinite temperature. An important role of the reparametrization
procedure is that it enables to reduce the computation time for the optimization problem. [44].
The reference temperature 𝑇𝑟𝑒𝑓 is widely defined as the mean temperature within the experiment
temperature range. In some studies it is highlighted that the choice of reference temperature can have
tangible influence on the kinetic parameters estimation [44]. This work, however, the decision was made to
choose 𝑇𝑟𝑒𝑓=573⁰C.
The kinetics of RDF fuels were studied using TGA technique at three different heating rates of 5, 10, 20 ⁰C.
A simple kinetic model was applied to simulate both combustion and pyrolysis process, hence the
experiments were performed in two different atmospheres – air and nitrogen consequently. The total
reaction rate is expressed as the summed up rate of four individual components water, cellulose,
hemicellulose and lignin. The addition of the fifth component is needed to describe the residual matter which
in the case of combustion is fixed ash and in the case of pyrolysis is fixed carbon plus fixed ash.
The model was developed in Excel solver. The method chosen for the solving was the GRG Nonlinear
Solving method that uses the Generalized Reduced Gradient method. In fact, the method is a non-linear
extension of the SIMPLEX method. The function to be minimized is the sum of squared errors which is
represented by the difference between the relative weight of a sample during the experiment and the
relative weight calculated in the model.
𝑀𝑖𝑛 𝑂𝐹 =∑∑(𝑤𝑡𝑜𝑡𝑎𝑙 𝑖𝑒 − 𝑤𝑖,𝑗
𝑐 )25
𝑗
𝑛
𝑖
(9)
Where n is the number of time steps in the experiment and 4 corresponds to the four pseudocomponents.
The amount of fixed ash should be equaled the difference between the total related weight of the sample
and the sum of related weights of pseudocomponents. The constraint for the fixed ash content should be
specified as:

40
𝑤5𝑐 = 𝑤𝑎𝑠ℎ
𝑐 = 1 −∑𝑤𝑗𝑐
4
𝑗
(10)
Consequently, the total calculated sample weight can be represented as he sum of the weight of the four
pseudocomponents plus the weight of fixed ash:
𝑤𝑡𝑜𝑡𝑎𝑙𝑐 = 𝑤1
𝑐 +𝑤2𝑐+𝑤3
𝑐 + 𝑤4𝑐 +𝑤𝑎𝑠ℎ
𝑐 (11)
Where 𝑤1𝑐 , 𝑤2
𝑐 , 𝑤3𝑐 𝑎𝑛𝑑 𝑤4
𝑐 corresponds to the relative weights of water, cellulose, hemicellulose and lignin
respectively. The initial values were assigned to each of the pseudocomponents. For water, cellulose,
hemicellulose and lignin the assigned values are 0.1, 0.3, 0.3 and 0.2 respectively.
For the optimization problem the parameters 𝑘0, 𝐸𝑎 and 𝑤𝑖,0𝑐 are the variable parameters to which the initial
values were assigned. The fitting of the curve representing the heating rate of 20⁰C/min is turned out to be
the most problematic one. Consequently, the optimization problem was solve, in the first place, individually
for this heating rates and the results obtained were used as initial values afterwards for the overall
optimization. The weight fraction 𝑤𝑖,4 𝑐 seams to play a key role in the shape of the slope at higher
temperatures. In this regard, the parameter was optimized individually keeping 𝑘0 and 𝐸𝑎 unchanged. The
results obtained for both combustion and pyrolysis model are represented and discussed below.
The comparison of the experimental and modelled curve is done with a help of the following expression
[45]:
𝐹 =
(
1 −√𝑂𝐹𝑛
𝑊𝑚𝑎𝑥𝑒
)
∙ 100%, [%] (12)
Where 𝑊𝑚𝑎𝑥𝑒 is the maximum value of the relative weight obtained from the experimental data.
3.6. Ash samples studied
The samples of fly ash studied in this work were collected at the waste-to-energy plant in Bydgoszcz,
Poland. The plant has a capacity of 180 000 tons of municipal solid waste per year. The fuel is combusted
in the PENSOTTI boiler on the moving grate in the process known as mass burning. The boiler is connected
to the one-stage condensation turbine generating up to 13 MW of electrical power. It is possible though to
use a combined heat and power mode when there is a need to supply heat to the residential district
connected to the waste-to-energy plant.
There are several places along the flue gasses duct where the fly ash can be collected. For this research
two fractions of fly ash were collected. The first one was the ash captured beneath the economizer. This
material has white to sandy color with predominantly ranging from 1 to 400 microns course particles. The

41
second fraction was ash coming from under the baghouse filter. The ash in the second fraction is gray and
very fine. Visually and on touch it resembles cement.
Figure 5 Technological diagram of the Waste-to-energy plant in Bydgoszcz (Poland) [49]
The fly ash samples were collected from the waste-to-energy plant in Bydgoszcz. The principle diagram of
the plant’s operation is presented above. Municipal solid waste is delivered to the facility by 10-ton garbage
trucks that dump trash down to the waste pit (1) or the bunker. From the pit, wastes are placed in the
furnace (2) by two moving cranes. Operators can control the process from the control room located above
the bunker. The furnace is equipped with a moving grate that transfers trash across its bottom part. The
furnace is connected to the boiler (3). In the furnace, the actual combustion of the waste materials occurs.
Each of two furnaces has 18 ammonia pulverizes at the side walls. Their task is to spray ammonia solution
coming from the ammonia silo (4) into the furnace to prevent the formation of NOx. Primary air comes from
the bunker through the air preheater (5) and is supplied to the furnace by numerous air nozzles divided into
5 zones. Burnt down trash falls down to the slag extractor where it is mixed with water and afterward is
transported as slag to the valorization house where the material is dried and subjected to the separation of
fractions. In the meantime, hot flue gasses formed in the furnace go to the boiler where they take part in
the heat exchange with water. The flue gas passage at the end of the boiler should be long enough to
decrease dioxins and furans formation. The gasses then are directed to the conditioning tower or quencher
(7) where they are cooled down before entering the reactor in which the main reaction on the neutralization
heavy metals, dioxins, furans and SOx occurs. The reactants are supplied here from the activated carbon
and lime silos (8). Afterwards, the gasses pass through the massive baghouse filters (9) to get rid of the

42
fine particles. After the filters flue gasses go through the gas/gas exchanger (10) and flow to the scrubber
(11) in which the final cleaning happens. The interesting detail of the plant that scrubber does not carry
much importance in the whole cleaning chain, however its presence was the obligatory condition for
companies to win the initial tender. In the end the cleaned up gasses are let out to the atmosphere through
the 40-meter high stack (12). As far as the water-steam cycle is concerned, steam formed in the boiler goes
to the turbine (13) which has the potential to produce 13 MW of energy. The low potential worked out steam
is directed to the water-cooled condenser (14) which serves as one of the heat exchangers. From the
condenser, it needs to be subjected to the removal of the dissolved gasses. This process occurs in the
deaerator (15). Part of the steam can also be used to heat up the water circulating in the district heating
system (16). Apart from that, the steam/gas heat exchanger (17) is located at the very end of the flue gasses
pass in order to give away the steam as much heat as possible. The most dangerous residues of the
process – fly ash collected at the baghouse filters are treated in the FGT residues system (18) where the
particles are mixed with water and cement and then carried away to a landfill. Another interesting feature
of the technology is the application of the flue gasses recirculation system that is a powerful means to
control the temperature of the combustion process.
3.7. SEM and EDS
The scanning electronic microscope (SEM) allows the analysis of the morphology and chemical
composition of a given sample. In SEM a high energy beam of electrons is used to initiate numerous signals
on the surface of the studied material. The signals bring back to the detector information about the surface
of the material. Then the computer processes the information and transforms it into a form convenient for
the user. The output data includes 2-d pictures of the surface layer as well as material composition. The
magnitude of the technique ranges from x20 to x30000. In this work the magnification of x200, x400, x500,
x750, x1000, x3000, x5000, x10000 was used to analyze fly ash fractions.
The determination of the elemental composition of the studied material is based in the EDS technique. The
essence of this method is to check particular areas on the images taken by the microscope.
The principle of a scanning electronic microscope operation is as follows: electron gun releases a bunch of
electrons that go through the electron lens, so-called 1-th condenser, and scan coils. After the magnification
control is done the beam gets to the specimen’s surface. The reflected from the surface beam reaches a
detector that sends the signal further to the amplifier to increase its intensity. On the final step, the amplifier
sends the enhanced signal to the computer which in its turn transforms it and displays on the screen.
The interaction between the electron beam and the surface encourages the release of the secondary and
backscattered electrons. Some signals coming from the surface can be linked to characteristic x-rays when
energy dispersive x-ray analysis is applied. During these methods, the collisions of incident electrons with
the electrons in discrete shells of sample atoms occur. EDS method is used to determine an elemental
chemical composition and is usually coupled with the SEM technique.

43
The experiments in the present research were carried out in the laboratory located at the IST University in
Lisbon, Portugal. During the study, the JEOL JSM-7001F analytical FEG-SEM with Oxford model INCA 250
PREMIUMEBSD (electron backscatter diffraction) and energy dispersive X-ray spectrometer (EDS) light
elements detector attachments electronic microscope was used. The images were obtained with a help of
PC-SPM software environment. The voltage of electron beam is equaled to 30 kV and the magnification
range x10 – x1000000. The precision of EDS analysis that was used for the research in this paper is around
0.5 % on an atomic weight basis.
For the SEM/EDS characterization of fly ash, two samples of each fraction were analysed. LFA 1 and LFA
2 are two samples of the ash collected after baghouse filters. The abbreviation LFA stands for ‘Light Fraction
Ash’ since ash at baghouse filters is usually lighter than the one collected upstream from baghouse filters.
LFA 1 is an original material taken from the waste-to-energy plant and LFA 2 is an additionally thermally
treated sample. Respectively, HFA 1 and HFA 2 stands for ‘Heavy Fly Ash’ following the same logic: fly
ash collected on the economizer is the heaviest fraction of fly ash. Once again index 2 indicates thermally
treated sample.

44
4. Results and discussion
4.1. TGA/DSC results
On the Figure 8 and 9 three mass loss curves for pyrolysis and three curves for combustion are
demonstrated respectively. It is easy to notice three main zones of mass loss on every graph.
Figure 6 TGA curves obtained for RDF combustion at different heating rates
Figure 7 TGA curves obtained for RDF pyrolysis at different heating rates
The first zone occurs from the initial temperature to the sample temperature of 200⁰C. It should be noted,
as well, that sample temperature differs from the program temperature, thus, when a sample reaches 200⁰C
the program temperature is already about 213⁰C. The second zone is characterized by a very sharp mass
loss and temperature range 200 – 360⁰C. The mass loss in this zone can be explained by the decomposition

45
of cellulose – the main component of paper and cardboard and hemicellulose that contains in woody
biomass. The next zone temperature range is 360 - 490⁰C. In this zone decomposition of cellulose keeps
going coupled with the vast lignin decomposition. In the final zone that starts approximately at 490⁰C and
undergoes up to the maximum temperature of 800⁰C the lignin decomposition still occurs accompanied by
massive devolatilization of charcoal [9].
4.2. Kinetic model results
The results obtained by the model demonstrated sufficient agreement with the mass loss curves based
upon the experimental data. Consequently, the practical applicability of the model is proved for low heating
rates. As far as higher heating rates are concerned, the additional research should be done for RDF
material. The advantage of the proposed model is that it does not require the knowledge of the exact
chemical composition of studied material.
In the Table 13 and 14 amount of pseudocomponents obtained by the model as well as reaction rate
constant and activation energies are presented. The values of activation energy and rate constant for each
component obtained for the combustion model fit pretty well when applied to the pyrolysis model.
Consequently final pyrolysis parameters do not differ much. The moisture content is proved to be the same
for every sample. The volatile matter however, depending on the heat rate varies considerably for different
pyrolysis experiments reaching 84.7% for 20⁰C/min heating rate. Consequently, the concentration of
charcoal is also different for each sample. The amount of fixed ash is roughly the same for each sample
and shows independence on the operation conditions.
Table 12 The amount of pseudocomponents obtained by the model
Process Hemicellulose
%
Cellulose % Lignin
%
Fixed ash
%
Moisture
%
Volatile
matter
%
Pyrolysis 34.08 32.02 10.35 19.04* 4.51 76.45
Combustion 34.38 22.77 25.39 10.93 2.53 -
*(including fixed carbon)
The activation energies and reaction rate constants are displayed in the table below
Table 13 Reaction rate constant and activation energies obtained by the model
Water Hemicellulose Cellulose Lignin Fifth element
Pyrolysis
𝐸𝑎, cal/mol∙K 2526.25 23753.18 41241.17 28880.10 7327.18
𝑘0, min-1 0.25039 0.13086 0.00013 0.000005 0.000099
Combustion

46
𝐸𝑎, cal/mol∙K 14573.23 27407.90 30974.20 5011.12 -
𝑘0, min-1 1884.51 0.3791 0.0014 0.0138 -
The following table reveals the fitting value calculated for every heating rate. Generally fitting for combustion
looks better than for pyrolysis. Reaching its maximum at 5 ⁰C/min heating rate.
Table 14 Fitting value for different experiments
Heating rate, ⁰C/min Type of experiment Fitting, %
5 pyrolysis 95.37
10 pyrolysis 93.91
20 pyrolysis 94.23
5 combustion 97.62
10 combustion 96.87
20 combustion 97.04
In Figure 9, 10 and 11 represent the comparison between the mass loss experimental curves and the model
curves for RDF pyrolysis at three heating rates of 5, 10 and 20 ⁰C/min is presented. The decision was made
not to apply individual optimization for each heating rate. Instead, one curve that describes the process with
maximum precision for all heating rates was obtained. The importance of this decision links to the practical
applicability of the model. Since the obtained results are aimed at designing of RDF incinerators and
pyrolysis reactors, it is important to ensure adequate behavior in the wide range of heating rates. The model
shows very good fitting for 5 and 10 ⁰C/min, however, for the rate of 20 ⁰C/min turned out to be problematic.
In order to guarantee satisfactory fitting for the highest rate, the optimization of the parameters for this rate
was carried out individually. Then the results obtained for the highest rate were used as initial values for
the overall optimization. Additional decision, that improved results for pyrolysis, was the introduction of the
5-th reaction. This reaction can be explained with a fact that some part of lignin does not decompose directly
but instead is carbonized.
The plastic fraction can also influence on the shape of the curve in the high temperatures range. Even
though the exact MSW fractions contribution in the studied material is not known, it is reasonable to assume
that some plastics are present. The amount of plastics for industrially produced RDF according to Won
Seoa can reach 30.8%. The temperature range for the decomposition of stable plastics are 450 – 500
⁰C/min [20].
The studied material revealed curious behavior in the isothermal part. At the heating rate of 20⁰C/min
additional mass loss amount for 11% on the initial sample mass basis was detected. This phenomena can
be explained by the belated devolatilization of charcoal obtained during late stages of the process, for

47
example, stable plastics decomposition. Works of other authors prove that the average mass loss for RDF
during isothermal stage is greater than for traditional fuels. The difference between coal and RDF in
isothermal zone is around 38% [20]. Numerous studies confirmed that high devolatilization yield and,
consequently, decreased char yield is observed at higher pyrolysis heating rates [46, 47]. Apart from that
devolatilization yield is virtually always higher if it comes to isothermal conditions in comparison to non-
isothermal [20].
Figure 8 TGA curves from modeling and experimental data for RDF pyrolysis at 5 ⁰C/min heating rate
Figure 9 TGA curves from the model and real data for RDF pyrolysis at 10 ⁰C/min heating rate

48
Figure 10 TGA curves from modeling and experimental data for RDF pyrolysis at 20 ⁰C/min heating rate
The results for the combustion process at the heating rates of 5, 10 and 20 ⁰C/min are represented on the
figures 12, 13 and 14 respectively. The model showed generally good fittings especially in the moisture
evaporation and cellulose decomposition zone. As in the case of pyrolysis the most problematic heating
rate appeared to be 20 ⁰C/min. The problems however appeared in the 3-d zone within temperature range
380 – 500 ⁰C. This zone is responsible for the thermal decomposition of lignin and plastic compounds.
However, the presence of plastics is not confirmed experimentally, since no distinctive endothermic reaction
in the plastic melting temperature range was observed. The best fitting was obtained when the initial values
for the overall optimization got based on the optimized values received for the individual optimization of the
highest heating rate. For the 5 ⁰C/min the curve fitting equals 97.62 %. The model still can be subjected to
additional adjusting especially in the middle temperature range.
Figure 11 TGA curves from modeling and experimental data for RDF combustion at 10 ⁰C/min rate

49
Figure 12 TGA curves from modeling and experimental data for RDF combustion at 5 ⁰C/min heating rate
Figure 13 TGA curves from modeling and experimental data for RDF combustion at 20⁰C/min heating rate
In Figure 15 the mass loss rate at the heating rate 5 ⁰C/min is illustrated. It can be observed that water
vaporization in the model occurs only until 120 ⁰C which is not totally correct, since in reality according to
Senneca this process continues even at 200 ⁰C [48]. The second peak responsible for the decomposition
of cellulosic materials occurs in the range of 174 – 340 ⁰C. This value corresponds to the ones referred in
the literature [48, 20]. The third peak is in the range of 290 – 470 ⁰C and it is assumed that represents the
decomposition of cellulose as well as some plastics. Sorum at al. indicates in his work temperatures for
decomposition of some plastics, namely PVC at 470 ⁰C, LDPE at 472 ⁰C and HDPE at 479 ⁰C. Since the
cellulose decomposition stops at around 400 ⁰C, it is reasonable to assume that plastic were present in the
RDF. Purple curve on the graph is responsible for lignin decomposition. Here one can observe typical range
for some lignin-contained materials. Thus for agricultural residues, for example, thermal degradation lasts
until 600 ⁰C and even higher [44].

50
Figure 14 Mass loss rating curves for combustion at the heating rate 5 ⁰C/min
4.3. Light fraction fly ash
For each sample, five regions (spectrums) were examined. The regions were chosen on the basis of
morphological differences. The images below show the regions chosen for each sample. The elemental
composition for each spectrum is presented in the tables below an image. The main elements detected for
all samples are O, Na, Mg, Al, Si, P, S, Cl, K and Ca with Ti, Fe and Zn being trace elements. The
morphology of particles appeared to be versatile: from fine amorphous powder to large spherical and cubic
particles often partially covered with ‘hairy’ deposits.
On figure 20 magnified image of ‘LFA 1’ sample is presented with five spectrums from which elemental
composition was checked. Oxygen is the most widely represented component reaching up to 65.42 % of
atomic weight for the spectrum 2. In fly ash oxygen is an integral part of oxides formed during the fly ash
formation such as Al2O3, MgO, SiO2, CaO, P2O5, K2O, N2O, Fe2O3, TiO2, SO2 and some other [26].
Na and Cl are present in considerable amounts often appearing as cubic particles of sodium chloride. This
compound is formed due to the treatment of exhaust gases with caustic soda which reacts with the Cl
present in the gases and fly ash as a result of plastics thermal decomposition. Al and Si content ranges
from 1.07 to 1.42 and 1.93 to 2.82 respectively and are much lower than in bottom ash. A considerable
amount of sulfur was detected as a result of desulfurization stage of air pollution control system located
upstream. Sulfur is mostly present as part of certain minerals and usually poses a limited threat. The
average content of potassium is 5.14 % reaching 9.43 % in the spectrum 3. Another highly represented
element is Ca, which occurs in such minerals as gehlenite, calcite, hydrogrossular and hydrated calcium
phosphate [50, 3]. The average concentration of calcium in ‘LFA 1’ sample is 8.69 %. The EDS analysis
did not show any trace heavy metals which in this particular case means that their content is lower than 0.1
– 1 %. It can be observed that particle size for this sample is versatile. Some particles are as large as 30

51
microns with the largest ones being silica calcium minerals with a significant amount of sulfur up to 13.66
%.
Figure 15 Light fly ash fraction ‘LFA 1’ with five spectrums chosen for the elemental analysis
Table 15 The elemental composition of light fraction of fly ash - spectrum 1
Table 16 The elemental composition of light fraction of fly ash - spectrum 2
Table 17 The elemental composition of light fraction of fly ash - spectrum 3
Table 18 The elemental composition of light fraction of fly ash - spectrum 4
Table 19 The elemental composition of light fraction of fly ash - spectrum 5
LFA1' / Spectrum 1 O Na Mg Al Si P S Cl K Ca Ti Fe Cations Anions Error
Atomic weight, % 40.37 14.9 1.42 2.52 5.28 24.86 8.46 2.19 73.76 105.6 -17.752
LFA1' / Spectrum 2 O Na Mg Al Si P S Cl K Ca Ti Fe Cations Anions Error
Atomic weight, % 65.43 3.1 8.83 2.84 19.8 45.56 139.69 -50.812
LFA1' / Spectrum 3 O Na Mg Al Si P S Cl K Ca Ti Fe Cations Anions Error
Atomic weight, % 43.98 12.3 1.37 2.82 3.43 23.06 9.43 3.63 64.94 111.02 -26.188
LFA1' / Spectrum 4 O Na Mg Al Si P S Cl K Ca Ti Fe Cations Anions Error
Atomic weight, % 52.11 3.86 1.07 1.93 13.7 7.74 2.68 16.9 133.31 111.96 8.7047
LFA1' / Spectrum 5 O Na Mg Al Si P S Cl K Ca Ti Fe Cations Anions Error
Atomic weight, % 40.39 23.3 4.8 28.38 2.3 0.87 56.11 109.16 -32.099

52
The morphology of the particles in the light fly ash fraction sample was studied by the images obtained in
the electronic microscope. Pictures 21, 22 , 23 and 24 displays ‘LFA1’ sample under different magnifications
– x200, x500, x1000 and x3000 respectively. On the image 4, versatile particles can be seen. On the left-
hand side, there are two prolonged particles reaching 400 microns of length. The surface of particles is
different – the one that is located closer to the left edge is covered with numerous small particles forming
‘fur-like’ surface layer, the other one, located on the right hand side from the first one, has almost smooth
surface. A number of particles have similar spherical shape and size of 10 – 30 microns. A closer look at
them (image 21) reveals hollow inner structure with sharp edges of the holes on the surface. The same can
be clearly detected under magnification of x1000. The last image of the sample exposes some spherical
and cubic particles as small as 5 microns. However, the vast majority of particles here have irregular shapes
and even under such magnification, it is hard to distinguish separate particles since they are mostly glued
to each other.
Figure 16 Light fraction fly ash. Magnification x200

53
Figure 17 Light fraction fly ash. Magnification x500
The EDS analysis showed the high content of sodium and chlorine in cubic particles which indicates that
they are in fact micro crystals of NaCl. The largest particles are proved to be minerals with the considerable
content of Ca. The two possible options might be gehlenite and hydrogrossular [50].
Figure 18 Light fraction fly ash. Magnification x1000

54
Figure 19 Light fraction fly ash. Magnification x3000
4.4. Heavy fraction fly ash
The image 25 and tables 26 – 30 relates to the ‘HFA 1’. The composition of this sample has a number of
differences from the baghouse filter ash discussed above. First of all, more elements are present. Mg, P,
Ti and Fe are present in quantities that allow their easy detection. Generally, the composition matrix of this
fraction is between classical fly ash and bottom ash with elements like aluminum and silicon representing
up to 35 % of the material (for spectrum 1). Silicon is mainly represented by quartz giving this fraction its
sandy color. Aluminum can occur in the form of gehlenite and hydrogrossular [50].
Figure 20 Heavy fly ash fraction ‘HFA 1’ with five spectrums chosen for the elemental analysis

55
Table 20 The elemental composition of light fraction of fly ash - spectrum 1
Table 21 The elemental composition of light fraction of fly ash - spectrum 2
Table 22 The elemental composition of light fraction of fly ash - spectrum 3
Table 23 The elemental composition of light fraction of fly ash - spectrum 4
Table 24 The elemental composition of light fraction of fly ash - spectrum 5
The sizes, shapes and structures of the particles in the studied material vary significantly. The morphology
of the heavy fraction particles is depicted on the images 26 – 29.
Figure 21 Heavy fraction fly ash. Magnification x200
HFA1' / Spectrum 1 O Na Mg Al Si P S Cl K Ca Ti Fe Cations Anions Error
Atomic weight, % 62.17 31.5 3.5 2.8 114.19 124.34 -4.2552
HFA1' / Spectrum 2 O Na Mg Al Si P S Cl K Ca Ti Fe Cations Anions Error
Atomic weight, % 59.03 1.05 1.47 3.6 5.43 1.63 3.09 3.8 1.09 19.8 103.91 121.86 -7.9506
HFA1' / Spectrum 3 O Na Mg Al Si P S Cl K Ca Ti Fe Cations Anions Error
Atomic weight, % 60.5 1.36 5.92 1.46 1.72 7.8 4.02 1.4 15.2 0.59 105.48 125.02 -8.4772
HFA1' / Spectrum 4 O Na Mg Al Si P S Cl K Ca Ti Fe Cations Anions Error
Atomic weight, % 49.47 9.15 3.39 7.45 1.54 6.8 1.48 10 6.89 3.84 117.38 105.74 5.2169
HFA1' / Spectrum 5 O Na Mg Al Si P S Cl K Ca Ti Fe Cations Anions Error
Atomic weight, % 65.31 1.02 0.65 1.3 11.2 1.16 19.4 115.17 131.78 -6.7261

56
Figure 22 Heavy fraction fly ash. Magnification x500
The particles of this fraction are larger than in the case of light fly ash with a significantly smaller
concentration of fine particles less than 1 microns. Some spherical particles are also present. These are
so-called cenospheres that are widely presented in coal-derived fly ash. The vast majority of particles here
forms agglomerates consisting of calcium, aluminum and silicon oxides. On the image 24, the branchy
structures on the surface are clearly recognizable.
Figure 23 Heavy fraction fly ash. Magnification x1000
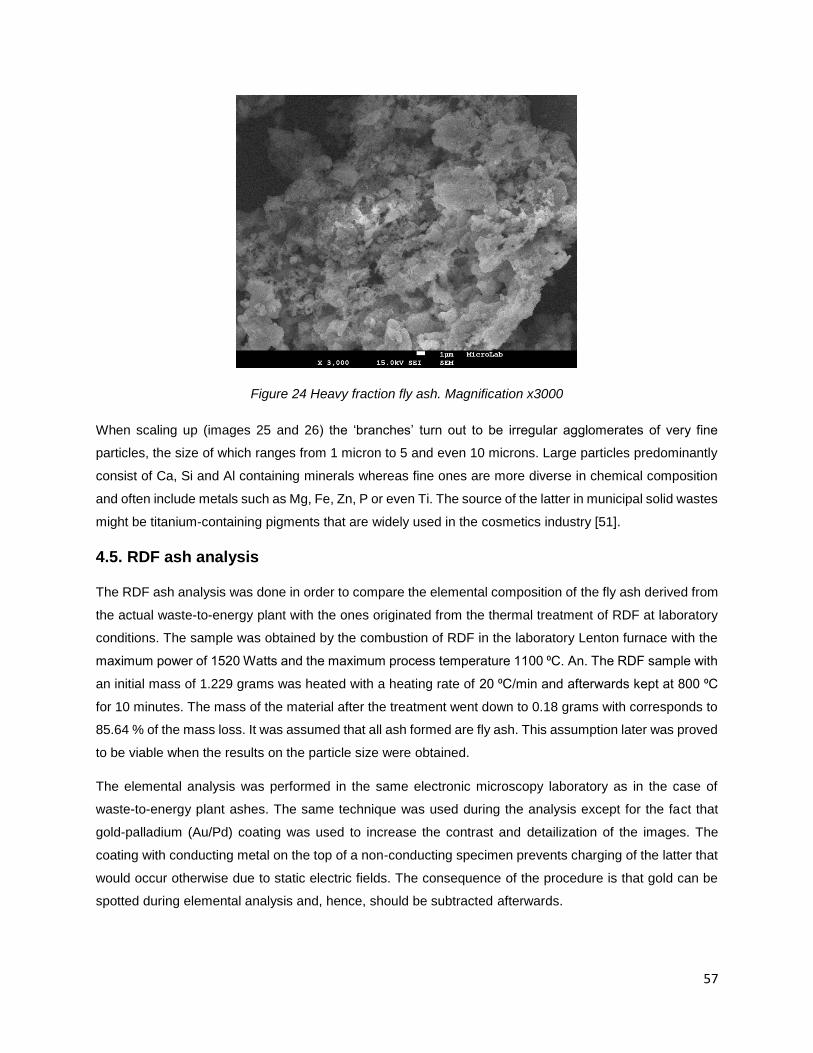
57
Figure 24 Heavy fraction fly ash. Magnification x3000
When scaling up (images 25 and 26) the ‘branches’ turn out to be irregular agglomerates of very fine
particles, the size of which ranges from 1 micron to 5 and even 10 microns. Large particles predominantly
consist of Ca, Si and Al containing minerals whereas fine ones are more diverse in chemical composition
and often include metals such as Mg, Fe, Zn, P or even Ti. The source of the latter in municipal solid wastes
might be titanium-containing pigments that are widely used in the cosmetics industry [51].
4.5. RDF ash analysis
The RDF ash analysis was done in order to compare the elemental composition of the fly ash derived from
the actual waste-to-energy plant with the ones originated from the thermal treatment of RDF at laboratory
conditions. The sample was obtained by the combustion of RDF in the laboratory Lenton furnace with the
maximum power of 1520 Watts and the maximum process temperature 1100 ⁰C. An. The RDF sample with
an initial mass of 1.229 grams was heated with a heating rate of 20 ⁰C/min and afterwards kept at 800 ⁰C
for 10 minutes. The mass of the material after the treatment went down to 0.18 grams with corresponds to
85.64 % of the mass loss. It was assumed that all ash formed are fly ash. This assumption later was proved
to be viable when the results on the particle size were obtained.
The elemental analysis was performed in the same electronic microscopy laboratory as in the case of
waste-to-energy plant ashes. The same technique was used during the analysis except for the fact that
gold-palladium (Au/Pd) coating was used to increase the contrast and detailization of the images. The
coating with conducting metal on the top of a non-conducting specimen prevents charging of the latter that
would occur otherwise due to static electric fields. The consequence of the procedure is that gold can be
spotted during elemental analysis and, hence, should be subtracted afterwards.

58
On the images 27 – 30 one can observe the morphological structure of the RDF derived ash. Generally,
the average size of the particles is smaller than for heavy and light fly ash fractions with the largest ones
reaching 50 – 60 micron. The shape of the particles are closer to light fraction ash, however, some
distinctions are present. Predominantly the particles are of amorphous shape sometimes with sharp edges.
The biggest ones, though, represents agglomerated ‘balls’ of irregular shape. The elemental analysis of the
‘balls’ revealed considerable amounts of Ca (10.15 %), Si (11.17 %) and Al (8.72 %) which give them a
resemblance to some particles presented in heavy fly ash samples.
Figure 25 RDF derived ash. Magnification x200
Figure 26 RDF derived ash. Magnification x500

59
The magnified images of one of such particles is showed below. An interesting detail is a crack that passes
through a half of the particle. On the last image, it is visible that the main particle’s surface is covered with
multiple fine particles with a diameter ranging from 0.5 to 5 microns. The surroundings of the main particle
consist of irregular shaped and sized particles, which elemental composition of which include such
components as P, Mg, S, Fe.
Figure 27 RDF derived ash. Magnification x1000
Figure 28 RDF derived ash. Magnification x3000
In the following tables, the elemental composition of five spectra chosen for elemental analysis is presented.
The most widely represented elements are O, Si, Al, Ca (presented in every spectrum) as well as Na, Mg

60
and K (presented in 4 out of 5 spectra). The presence of chlorine in 3 out of 5 spectra confirms the presence
of plastics in the original material which can have an impact on the kinetics of the combustion and pyrolysis
process of the RDF studied in this work. In the fifth spectrum, the percentage of chlorine exceeded 6%
clearly indicating that some PVC fraction of MSW was used for the RDF. Spectrum 1 demonstrated a large
amount of carbon – 49.76%, which can be a result of the incomplete combustion of RDF that occurred in
the laboratory furnace. Further research is needed, though, to find out if such situation will occur under
combustion in industrial furnaces. Most of the elements presented in the material form oxides with oxygen.
The following oxides were detected in the RDF derived ash: SiO2, Al2O3, CaO, Fe2O3, MgO, K2O, Na2O,
SO3, P2O5. The ion balance analysis exposed that in every spectrum there is a certain disproportion of
cations and anions. The reasons for this phenomena are possibly undetected species or systematic
laboratory measurements errors. In its turn, the main reason for undetected species is their lower
concentration in the studied material that might be beyond the precision limit of the microscope.
Table 25 The elemental composition of RDF derived ash - spectrum 1
Table 26 The elemental composition of RDF derived ash - spectrum 2
Table 27 The elemental composition of RDF derived ash - spectrum 3
Table 28 The elemental composition of RDF derived ash - spectrum 4
Table 29 The elemental composition of RDF derived ash - spectrum 5
4.6. XRD analysis
The samples of heavy and light fly ash were additionally subjected to the x-ray diffraction (XRD) analysis.
The experiments were performed in the Philips PW3020 XRD analyzer. The principle of x-ray diffraction
based on the registering of spherical waves produced when an x-ray strikes an electron. In this case, the
electron is called the scatterer. When such scatterers are arranged in a regular order the waves produced
RDFA' / Spectrum 1 O Na Mg Al Si P S Cl K Ca Ti Fe C Cations Anions Error
Atomic weight, % 32.39 1.8 0.49 4.53 5.15 0.94 4.52 49.76 96.07 64.78 19.45291
RDFA' / Spectrum 2 O Na Mg Al Si P S Cl K Ca Ti Fe C Cations Anions Error
Atomic weight, % 63.97 3.81 8.72 11.2 0.55 1.12 10.2 91.41 128.49 -16.8622
RDFA' / Spectrum 3 O Na Mg Al Si P S Cl K Ca Ti Fe C Cations Anions Error
Atomic weight, % 67.68 6.5 1.05 11.9 0.78 11.5 121.5 135.36 -5.39594
RDFA' / Spectrum 4 O Na Mg Al Si P S Cl K Ca Ti Fe C Cations Anions Error
Atomic weight, % 56.9 1.46 0.59 2.35 18.1 0.69 0.5 17 1.59 88.7 114.49 -12.6926
RDFA' / Spectrum 5 O Na Mg Al Si P S Cl K Ca Ti Fe C Cations Anions Error
Atomic weight, % 58.16 4.6 1.87 3.98 7.28 0.88 1.01 6.36 1.04 13.9 88.926 122.68 -15.9513

61
are also regular. Even though in many directions such waves fade out due to mutual interference, they,
nonetheless, add up in a few particular directions. These directions can be described by the Bragg’s law:
2𝑑 ∙ sin 𝜃 = 𝑛 ∙ 𝜆
Where 𝑑 is distance between two diffracting planes, 𝜃 is an angle between the diffraction plane and a beam,
𝑛 is any integer and 𝜆 is the beam’s wavelength. The directions in which the waves add up are represented
as spots on the diffraction pattern. These spots bear the name reflections. X-rays gained popularity in the
obtaining the diffraction patterns since their wavelength is similar in magnitude to the value of 𝑑 between
the diffracting planes of a crystal.
The diffraction patterns obtained for the studied samples revealed a rather complex composition of the
material. Due to a large number of compounds of versatile chemical composition and structure, the pattern
has multiple peaks frequently badly distinguished from one another. Yet the presence of certain minerals
resulted in a set of highly distinctive peaks. These peaks were chosen for the closer analysis. On the picture
below, the comparison of a diffraction pattern of the light fly ash with the data library pattern for halite is
represented. As one can see the peaks of the material fit very well with the once for halite with a chemical
formula NaCl. The SEM/EDS analysis described above proved the significant presence of Na (average
value 11.48 %) and Cl (average value 18.57 %). The presence of large quantity of halite in the light fly ash
can be explained by the treatment of flue gas with sodium bicarbonate (NaHCO3). This technique has been
gaining popularity during recent years as an alternative to lime-based treatment (e.g. with Ca(OH)2) as
means to for the removal of acidic components. The technique is particularly feasible at waste-to-energy
plants due to their limited size [52]. The technique can also have a set of advantages, including economic
ones, when it comes to the flue gasses from RDF combustion or pyrolysis, since the concentration of
chlorine-contaning plastics might be even higher than for raw MSW.

62
Figure 29 Comparison of the light fly ash diffraction pattern with the halite pattern
On the following picture the diffraction pattern of the same ash sample is compared to the pattern for sylvite
mineral (chemical formula KCl). The mineral’s pattern taken from the X’Pert HighScore software library fits
very well with the distinctive peaks in the studied material’s pattern, thus, proving the presence of potassium
chloride in the light fly ash fraction. The EDS analysis carried out earlier demonstrated the presence of
potassium and chloride in the concentrations of 5.14% and 18.57% respectively. The presence of K in MSW
has an important effect on the capture of Cl in the flue gas. KCl is an integral agricultural product, used for
the production of potassium based fertilizers [3, 26]. Being a part of the fly ash, KCl adds to the ash’s
potential as a fertilizer. This potential, however, is limited by factors described in the chapter ‘Industrial
applications of MSWI ash’.
Following analysis of XRD patterns of light fly ash as well as heavy fly ash fraction was carried out in order
to detect the presence of some minerals mentioned in a number of scientific works [50, 27, 3]. However,
the technique showed poor results. The conclusion was made that for such a versatile substance as waste-
to-energy process fly ash XRD analysis has limited abilities, thus, other techniques should be used for more
precise detection of chemical compounds present in the material. One of the potential candidates can be
X-ray fluorescence analytical technique.

63
Figure 30 Comparison of the light fly ash diffraction pattern with the sylvite pattern
4.7. Waste-to-Energy plant fly ash and RDF ash comparison
The comparison table of the composition of light fly ash, heavy fly ash and RDF ash is presented below. It
is noticeable that the composition of the RDF derived ash has a closer resemblance to the heavy ash
fraction of the MSW incineration plant. The major differences are the lowered content of Cl, increased
content of Si and almost complete absence of Ti and S. On the contrary, the concentration of carbon is
much higher which can be explained by an by an incomplete combustion of the RDF in the laboratory. The
large particles consist almost on unburnt carbon and were detected predominantly in the lower layers of
ash after the experiment. This can be explained by insufficient air supply that occurred due to the fast
formation of an inorganic top layer of ash in the experimental crucible. The possible solution for this problem
can be the pyrolysis of RDF or multiple stage combustion. These topics have a large potential for
investigation in future works. Also, the form of fuel might have a tangible effect on the efficiency of the
combustion process. In the industrial application the fuel is normally used in a form of 2 – 3 cm long pellets,
whereas in the present work it was utilized in form of homogeneous cotton-like material obtained after
grounding the original materials down to 1 mm. An alternative technology for RDF thermal treatment can
be the fluidization.
The low content of sulfur in the RDF residues can be caused by its lower concentration in the original wastes
from which RDF derived. The main sources of sulfur in MSW are paper, plaster board and sludge [53]. It
will be reasonable to assume that the two latter fractions were not present in the RDF analysed. The
insignificant content of phosphorous, in its turn, resulted from the separation of an organic waste fraction
before the RDF formation process. Besides, a number of metals in the RDF ash is rather limited too, with
the concentration of aluminum hardly reaching a half of the concentration of this element in the heavy fly

64
ash fraction. Concentrations of Ti, Fe and Zn are lowered too. The reason for such phenomena is the
removal of a metal fraction from the MSW streams before RDF formation. Based on the literature review,
one can assume that content of heavy metals in RDF ash is also decreased. This can play an important
role in a further utilization of this material and its use in commercial applications. One of the main concerns
is the presence of chlorine [51]. In the RDF assessed on the present study, the concentration of this element
reaches 1.52 %. This is much lower than for heavy and especially light fly ash fractions. However, if RDF
is burnt or pyrolyzed on the industrial scale the amount of chlorine in the fly ash might increase due to a
specific flue gas treatment, such as Na(CO)2 use.
Table 30 Elemental composition comparison of the three studied ash fractions
The advantage of using RDF instead of traditional unsorted MSW in waste-to-energy processes is that the
amount of chlorine in the fuel can be, to some extent, controlled and monitored by portioning, during the
sorting process, amounts of PVC and other plastics that contain this element. One of the interesting
directions for the future research would be the determination of the thermal processes that are the most
suitable for the treatment RDF with high chlorine content, from an economical and environmental point of
view. Due to the decreased content of chlorides and heavy metals – the main environmental contaminants
when it comes to waste incineration fly ash – the ash from RDF can be widely applied in a number of
industrial processes without extensive pre-treatment. This can have highly positive economic value.
Potential use of RDF derived ash in the industry are road construction, cement production as well as the
production of zeolites, adsorbents and ceramics [3, 26].
Residue type O Na Mg Al Si P S Cl K Ca Ti Fe Zn C
Light fly ash 48.46 11.48 0 0.77 1.45 0 5.43 18.57 5.14 8.69 0 0 0 0
Heavy fly ash 59.296 2.31 1.68 8.13 3.88 0.63 4.42 3.16 0.79 13.44 1.50 0.77 0 0
RDF ash 55.82 2.334 1.89 4.126 10.73 0.176 0.36 1.52 0.72 11.41 0 0.32 0 9.952

65
5. Conclusions
5.1. Thermal analysis
Based in TGA experiments the thermal decomposition of RDF samples was studied. The experiments were
conducted at three different heating rates and in different atmospheres. Pyrolysis was performed in nitrogen
atmosphere whereas combustion in air. The mass loss curves, obtained from pyrolysis tests, showed four
distinctive mass loss regions, which represent the thermal moisture evaporation and the thermal
decomposition of main material’s components: cellulose, hemicellulose and lignin. The temperatures range
for the evaporation of water is 20 – 200⁰C, the decomposition of hemicellulose occurs at 200 – 360⁰C,
cellulose decomposes at 360 - 470⁰C whereas lignin from 400 to 800⁰C. The plastics content might have
influence on shape of the curves. High and low density polyethylene decomposes at higher temperatures
of 400 – 500⁰C.
In the case of combustion, it was noticed that evaporation of moisture occurs between ambient temperature
to 200⁰C. The second stage from 200 to 450⁰C is characterized by the release and combustion of volatile
matter as well as the formation of char. During the final stage the thermal degradation of char occurs
accompanied with a considerable mass loss. The content of the ash left after the process amounts for 11
– 13% of the initial mass of the sample.
Interesting observations were made with respect to the heating rate. In the combustion experiment the
complete degradation of the material at the heating rate 5⁰C/min occurred at lower temperature than the
one at 10⁰C/min and 20⁰C/min, whereas for the pyrolysis the difference between 5 and 10⁰C/min was
insignificant. However, at 20⁰C/min, in the pyrolysis process the sample showed an intricate behaviour
when the mass loss was still happening after the sample reached 800⁰C. This phenomena is typical for
RDF, since the RDF devolatilization yield in the isothermal conditions is greater than the one for
conventional fossil fuels, particularly coal.
5.2. Kinetic modeling
The kinetic modeling for the combustion and pyrolysis of the RDF was carried out based on the results
obtained from the thermal analysis. The reaction rate constant k at reference temperature of 573K and
activation energy for each pseudocomponent were obtained. In the case of pyrolysis an additional reaction
were introduced. This reaction was responsible for the carbonization of a part of lignin. The additional
reaction introduction allowed for a slight improvement of the model.
In the table 32, the results obtained for the rate constant and activation energy are presented. The lower
activation energy for moisture in the case of pyrolysis is stipulated by the introduction of the fifth reaction.
The solving algorithm, it seems, sacrificed the first component to reach an optimum solution of the problem.
In both cases the activation energy proved to be higher than for similar models built for agricultural wastes

66
and wooden biomass found in the literature. This can be explained by first impurities present in the RDF
and second by the morphology of the material.
Table 31 Reaction rate constant and activation energies obtained by the model
Parameter Water Hemicellulose Cellulose Lignin Additional reaction
Pyrolysis
𝐸𝑎, cal/mol∙K 2526.25 23753.18 41241.17 28880.10 7327.18
𝑘0, min-1 0.25039 0.13086 0.00013 0.000005 0.000099
Combustion
𝐸𝑎, cal/mol∙K 14573.23 27407.90 30974.20 5011.12 -
𝑘0, min-1 1884.51 0.3791 0.0014 0.0138 -
The fitting error analysis reveals the best result for both processes the model at the lowest heating rates.
The results however were satisfactory with the lowest fitting rate being as high as 93.91% for the pyrolysis
and 96.87% for the combustion.
5.3. Fly ash analysis
The SEM/EDS analysis of two samples of the fly ash taken from a waste-to-energy plant and a sample of
RDF originated ash was carried out. The elemental composition of the samples is presented in the table
below. The results proved that all samples have their own specific features and, hence, the different ways
of further treatment and utilization can be applied to each of them.
Table 32 Final comparison of different fly ash’ composition
The light fly ash fraction is characterized very high content of chlorine. Even though most of it is bounded
with Na in a form of NaCl (mineral halite), some of it still can occur in a form of polychlorinated
dibenzodioxins and dibenzofurans. These compounds represent the main environmental concern for the
waste-to-energy technology. In combination with heavy metals, usually present in this type of ash, dioxins
and furans make the ash inappropriate for the future use. At the moment, fly ash from waste-to-energy
plants is considered to be hazardous product and, hence must be disposed of on a landfill. Amid the
potential ways of treatment vitrification seems to be the most promising since the dioxins will be destroyed
by the high temperature and other hazardous substances will be encapsulated without a possibility to leach
out in the future. The pre-treatment techniques might include water washing. This technology shows good
Residue type O Na Mg Al Si P S Cl K Ca Ti Fe Zn C
Light fly ash 48.46 11.48 0 0.77 1.45 0 5.43 18.57 5.14 8.69 0 0 0 0
Heavy fly ash 59.296 2.31 1.68 8.13 3.88 0.63 4.42 3.16 0.79 13.44 1.50 0.77 0 0
RDF ash 55.82 2.334 1.89 4.126 10.73 0.176 0.36 1.52 0.72 11.41 0 0.32 0 9.952
67
efficiencies for the ashes with high content of soluble salts. The high concentration of soluble salts KCl and
NaCl in the studied ash was confirmed by the XRD analysis.
The heavy fraction fly ash has much lower content of chlorine but much higher content of metals, including
heavy ones. It consists primarily of aluminosilicates with high concentration of calcium-containing minerals.
This make the material potentially suitable for the production of synthetic zeolites and adsorbents and also
used in cement industry. The leaching of heavy metals will be, although, the major issue. Therefore, the
material should be pre-treated first. In the case of heavy fly ash, the most interesting pre-treatment
technology seemingly is electrodialytic recovery of heavy metals. If used in the production of cement, the
product obtained should be carefully monitored with regards to leaching properties.
Finaly, RDF originated ash the highest potential to be used in industrial application due to the low content
of chlorine (1.52%) which can be further decreased if the separation of PVC and chlorine-containing paper
products is done beforehand. The concentration of soluble salts is low, so washing even though being a
cheap pre-treatment option might not prove to be appropriate. The ash can be a potential candidate for
zeolites and cement clinkers production as the content of Si is the highest in comparison with other ashes
studied. Another perspective application is the ash using as a material for a base and subgrade layer in
the road construction. The leaching of heavy metals must be controlled. Decreasing the content of such
toxic heavy metals as Pb and Cd can be realized during the fuel making stage by removing colored plastics
from the MSW streams used for the production of RDF.
5.4. Future proposal
The present work can be elaborated in different direction. As the kinetic modeling is a basis for a reactor
design, it would be interesting to build a reactor based on the model and study the combustion process
characteristics in such a reactor. Another promising direction is to study co-combustion of the studied RDF
with different fossil and non-fossil fuels. An environmental direction can be, first of all, connected to the
studying of hazardous substances such as HCl in the flue gas. As far as the fly ash is concerned, the
research connected to the studying the behavior of the ash in the industrial application (e.g. cement
clinkers) can be done in the future.
68
References
1. C. Ludwig S. Hellweg S. Stucki. (2003). Municipal Solid Waste Management: stratcgies and technologies
for sustainable solutions. Springer-Verlag Berlin Heidelberg GmbH. 164 - 167.
2. Walter R. Niessen. (2002). COMBUSTION AND INCINERATION PROCESSES Third Edition, Revised and
Expanded. Marcel Dekker. 114 - 122.
3. A. John Chandler, T. Taylor Eighmy, Jan Hartlon, Ole Hjelmar, David S. Kosson, Steven E. Sawell, Hans A.
van der Sleet, JiJrgen Vehlow. (1997). Municipal solid waste incineration residues. ELSEVIER SCIENCE B.V.
59 - 73.
4. R. E. RESTER AND R. M. HARRISON. (1994). Waste Incineration and the Environment. The Royal Society
of Chemistry. 60 - 66.
5. Mr. J. Haukohl, Mr. T. Rand, and Mr. U. Marxen. Decision Makers’ Guide to Municipal Solid Waste
Incineration. (1999). International Bank for Reconstruction and Development. 2 - 5.
6. DIRECTIVE 2000/76/EC OF THE EUROPEAN PARLIAMENT AND OF THE COUNCIL of 4 December 2000 on
the incineration of waste. Official Journal of the European Communities, 7 - 20.
7. Edificio Expo. (2006). Integrated Pollution Prevention and Control Reference Document on the Best
Available Techniques for Waste Incineration. European Comission. 4 – 6.
8. Edwin A. Korzun & Howell H. Heck. (1990). Sources and Fates of Lead and Cadmium in Municipal Solid
Waste, Journal of the Air & Waste Management Association, 40:9, 1220-1226
9. Zhiqi Wang, Haitao Huang, Haibin Li, Chuangzhi Wu, and Yong Chen. (2002). HCl Formation from RDF
Pyrolysis and Combustion in a Spouting-Moving Bed Reactor. Energy & Fuels, 16, 608-614.
10. Xiaofen Guo, Zhiqi Wang, Haibin Li, Haitao Huang, Chuangzhi Wu and Yong Chen. (2001). A Study on
Combustion Characteristics and Kinetic Model of Municipal Solid Wastes. Energy & Fuels, 15, 1441-1446.
11. George Skodras, Panagiotis Grammelis, Panagiotis Basinas, Emmanuel Kakaras and George
Sakellaropoulos. (2006). Pyrolysis and Combustion Characteristics of Biomass and Waste-Derived
Feedstock. Ind. Eng. Chem. Res. 45, 3791-3799.
12. Halonen, I.; Tarhanen, J.; Ollikainen, S.; Ruokojarvi, P., Tuppurainen, K.; Ruuskanen, J. Chemosphere.
(1994). FORMATION OF PCDDS AND PCDFS IN MUNICIPAL WASTE INCINERATION 28, 2129-2138.
13. Lisboa, A. C. L.; Watkinson, A. P. Can. J. (1992). Air-Carton Packaging Waste Flow Dynamics in a Conical
Spouted Bed Chem. Eng., 70, 983-990.
14. Maria Chiara Di Lonardo, Maurizio Franzese, Giulia Costa, Renato Gavasci, Francesco Lombardi. (2015).
The application of SRF vs. RDF classification and specifications to the material flows of two mechanical-
biological treatment plants of Rome: Comparison and implications. Waste Management, 1 - 2.
15. UNI EN 15359, 2011. Combustibili solidi secondari – Classificazione e specifiche (in Italian). UNI – Italian
National Agency for Standardization, Milano, Italy. ICS: 75.160.10.
16. Martina Di Gianfilippo , Giulia Costa, Sara Pantini, Elisa Allegrini, Francesco Lombardi,

69
Thomas Fruergaard Astrup. (2015). LCA of management strategies for RDF incineration and gasification
bottom ash based on experimental leaching data. Waste management.
17. A. Sever Akdag, A. Atımtay, F.D. Sanin. (2015). Comparison of fuel value and combustion characteristics
of two different RDF samples. Waste Management, 1 - 6.
18. Kuen-Song Lin, H. Paul Wang, S.-H. Liu, Ni-Bin Chang, Y.-J. Huang, H.-C. Wang. (1999). Pyrolysis kinetics
of refuse-derived fuel. Fuel Processing Technology 60, 103–110.
19. D. Barba, M. Prisciandaro, A. Salladini, G. Mazziotti di CelsoThe. (2011). Gibbs Free Energy Gradient
Method for RDF gasification modelling. Fuel 90, 1402–1407.
20. Myung Won Seo, Sang Done Kim, See Hoon Lee, Jae Goo Lee. (2010). Pyrolysis characteristics of coal
and RDF blends in non-isothermal and isothermal conditions. Journal of Analytical and Applied Pyrolysis
88, 160–167.
21. D. Barba, M. Prisciandaro, A. Salladini, G. Mazziotti di CelsoThe. (2011). Gibbs Free Energy Gradient
Method for RDF gasification modelling. Fuel 90, 1402–1407.
22. E. KALOGIROU, N. THEMELIS, P. SAMARAS, A. KARAGIANNIDIS. Fly Ash Characteristics From Waste-to-
Energy Facilities and Processes For Ash Stabilization Earth Engineering Center , Columbia University, New
York, US. 1 - 9.
23. Gary C. Young. (2010). MUNICIPAL SOLID WASTE TO ENERGY CONVERSION PROCESSES ECONOMIC,
TECHNICAL, AND RENEWABLE COMPARISONS . John Wiley & Sons, Inc., Hoboken, New Jersey, 188 - 202.
24. Xiao, Y.; Harskamp, R.G.; Yang. Y. (2008). Pre-Washing and Vitrification of Fly Ash from a Municipal
Solid Waste Incinerator. In Proceedings of the 2008 Global Symposium on Recycling, Waste Treatment
and Clean Technology, Cancun, Mexico, 12–15 October 2008.
25. Hui, C.W.; Porter, J.; McKay, G.; Cheung, R.; Leung, P. (2002). An integrated plant for municipal solid
waste co-combustion in cement production. J. Solid. Waste. Technol. Manag. 28, 175-181.
26. Charles H. K. Lam, Alvin W. M. Ip, John Patrick Barford and Gordon McKay, (2010), Use of Incineration
MSW Ash: A Review, Sustainability, 2, 1943-1968.
27. T. Sabbasa, A. Polettinib, R. Pomib, T. Astrupc, O. Hjelmard, P. Mostbauera, G. Cappaie, G. Magelf, S.
Salhofera, C. Speiserg, S. Heuss-Assbichlerf, R. Kleinh, P. Lechnera. (2003). Management of municipal solid
waste incineration residues Waste Management, 23, 61–88.
28. Nzihou, A., Sharrock, P., (2002). Calcium phosphate stabilisation of fly ash with chloride extraction.
Waste Manage 22, 235–239.
29. Josef Stubenvoll (TBU),Siegmund Böhmer (UBA) Ilona Szednyj (UBA). (2002). State of the Art for Waste
Incineration Plants. Federal Ministry of Agriculture and Forestry, Environment and Water Management,
Vienna, November. 47 - 50.
30. Rosen, C.J.; Bierman, P.M.; Olson, D. (1994) Swiss chard and alfalfa responses to soils amended with
municipal solid waste incinerator ash: Growth and elemental composition. J. Agric. Food Chem. 42, 1361-
1368.

70
31. Kakali, G.; Parissakis, G. (1995). Investigation of the effect of Zn oxide on the formation of Portland
cement clinker. Cem. Concr. Res. 25, 79-85.
32. Mangialardi, T. (2001). Sintering of MSW fly ash for reuse as a concrete aggregate. J. Hazard. Mater.
87, 225-239.
33. Nishida, K.; Nagayoshi, Y.; Ota, H.; Nagasawa, H. (2001). Melting and stone production using MSW
incinerated ash. Waste Manag. 21, 443-449.
34. Yang, G.C.C.; Yang, T.Y. (1998). Synthesis of zeolites from municipal incinerator fly ash. J. Hazard.
Mater. 62, 75-89.
35. Fan, Y.; Zhang, F.S.; Feng, Y. (2008). An effective adsorbent developed from municipal solid waste and
coal co-combustion ash for As(V) removal from aqueous solution. J. Hazard. Mater. 159, 313-318.
36. Qian, G.; Cao Y.; Chui, P.; Tay, J. (2006). Utilization of MSWI fly ash for stabilization/solidification of
industrial waste sludge. J. Hazard. Mater. 129, 274-281.
37. Ho, Y.S.; McKay, G. (1999). Comparative sorption kinetic studies of dye and aromatic compounds onto
fly ash. J. Environ. Sci. Health Part A: Toxic/Hazard. Subst. Environ. Eng. 34, 1179-1204.
38. Shim, Y.S.; Kim, Y.K.; Kong, S.H.; Rhee, S.W.; Lee, W.K. (2003). The adsorption characteristics of heavy
metals by various particle sizes of MSWI bottom ash. Waste Manag. 23, 851-857.
39. Gongliang Wang, R.B. Silva, J.L.T. Azevedo, S. Martins-Dias, M. Costa. (2014). Evaluation of the
combustion behaviour and ash characteristics of biomass waste derived fuels, pine and coal in a drop tube
furnace. Fuel 117, 809–824.
40. Gabor Varhegyi, Balazs Bobaly, Emma Jakab and Honggang Chen. (2011). Thermogravimetric Study of
Biomass Pyrolysis Kinetics. A Distributed Activation Energy Model with Prediction Tests. Energy Fuels, 25,
24–32.
41. STA 6000 Simultaneous Thermal Analyzer. (2008). PerkinElmer, Inc. 1 – 8.
42. Chao-Hsiung Wu, Ching-Yuan Chang & Jyh-Ping Lin. (1997). Pyrolysis Kinetics of Paper Mixtures in
Municipal Solid Waste. J. Chem. T ech. Biotechnol., 68, 65 - 74.
43. Binlin Dou, Sungjin Lim, Pilsun Kang, Jungho Hwang, Soonho Song, Tae-U Yu and Kyoon-Duk Yoon.
(2007). Kinetic Study in Modeling Pyrolysis of Refuse Plastic Fuel. Energy & Fuels, 21, 1442-1447.
44. Marcio Schwaab, José Carlos Pinto. (2007). Optimum reference temperature for reparameterization
of the Arrhenius equation. Part 1: Problems involving one kinetic constant. Chemical Engineering Science
62, 2750 – 2764.
45. C. A. KOUFOPANOSI, G. MASCHIO, A. LUCCHESI. (1989). Kinetic Modelling of the Pyrolysis of Biomass
and Biomass Components. THE CANADIAN JOURNAL OF CHEMICAL ENGINEERING, VOLUME 67,
FEBRUARY, 1989, 74 - 84.
46. D.K. Park, M.W. Seo, J.H. Goo, S.D. Kim, S.H. Lee, J.G. Lee, B.H. Song, J. (2007). Pyrolysis characteristics
of sawdust and rice husk as biomass resources. Korean Ind. Eng. Chem. 18, 415–423.

71
47. Sung Su Kim , Youn Suk Kang , Hyun Dong Lee , Jae Kwan Kim & Sung Chang Hong. (2012).
Physicochemical properties of chars at different treatment temperatures. Journal of the Air & Waste
Management Association.
48. Osvalda Senneca. (2007). Kinetics of pyrolysis, combustion and gasification of three biomass fuels.
Fuel Processing Technology 88, 87–97.
49. TM.E. S.p.A. - Termomeccanica Ecologia. (2015). Waste to energy plant Bydgoszcz – Poland.
http://www.tme.termomeccanica.com/en/energy_and_waste/waste_treatment_plants.html.
50. Nabajyoti Saikia, Shigeru Kato, Toshinori Kojima. (2007). Production of cement clinkers from municipal
solid waste incineration (MSWI) fly ash. Waste Management 27, 1178–1189.
51. Domenico Venezia, Samuel Joshi, Michael Van Brunt, Andrew Szurgot. (2010). ENERGY-FROM-WASTE
AND DIOXIN EMISSION CONTROL: IS THERE A ROLE FOR PVC SEPARATION? Proceedings of the 18th Annual
North American Waste-to-Energy Conference NAWTEC18, 2 - 7.
52. 1. Environment Agency. (2013). Pollution inventory reporting – incineration activities guidance note.
Environment Agency. 5 - 6.
53. Dr. Peter Quicker, Martin Rotheut, Yves Noel, Marc Schulten, and Uwe Athmann. (2014). Treating WTE
Plant Flue Gases with Sodium Bicarbonate.