pyrolysis oil and upgrading sot - pacific northwest … inl has made significant advances in...
TRANSCRIPT
PNNL-22133
Prepared for the U.S. Department of Energy under Contract DE-AC05-76RL01830
Production of Gasoline and Diesel from Biomass via Fast Pyrolysis, Hydrotreating and Hydrocracking: 2011 State of Technology and Projections to 2017 SB Jones JL Male February 2012
PNNL-22133
Production of Gasoline and Diesel from Biomass via Fast Pyrolysis, Hydrotreating and Hydrocracking: 2011 State of Technology and Projections to 2017
SB Jones
JL Male
February 2012
Prepared for
the U.S. Department of Energy
under Contract DE-AC05-76RL01830
Pacific Northwest National Laboratory
Richland, Washington 99352

iii
Contents
1.0 Introduction ................................................................................................................................ 1
2.0 State of Technology for FY2011 ................................................................................................ 3
2.1 Feedstock and Feedstock Preparation ................................................................................ 3
2.2 Fast Pyrolysis ..................................................................................................................... 5
2.3 Upgrading ........................................................................................................................... 5
2.4 Hydrocracking .................................................................................................................... 7
2.5 Hydrogen Generation ......................................................................................................... 8
3.0 Progression to $2.32/gallon Minimum Fuel Selling Price (MFSP) in 2017 ............................... 9
4.0 Concluding Remarks ................................................................................................................ 13
5.0 References ................................................................................................................................ 14
Figures
Figure 1. Block Diagram – 2017 Projection Design Case ................................................................. 1
Figure 2. Block Diagram – 2011 SOT Case ...................................................................................... 3
Figure 3. Block Diagram – Original Design Case Pyrolysis Section................................................. 3
Figure 4. Block Diagram – Updated Design Case Pyrolysis Section ................................................ 4
Tables
Table 1. Pyrolysis Oil Characterization ............................................................................................. 5
Table 2. Stable Hydrocarbon Oil Production ..................................................................................... 6
Table 3. SOT Standalone Plant ........................................................................................................ 10

1
1.0 Introduction
In February 2009, the Pacific Northwest National Laboratory (PNNL) and the National Renewable
Energy Laboratory (NREL) produced a report detailing the process design and economic analysis for the
thermochemical conversion of biomass (wood) into gasoline and diesel (Jones et al 2009). The purpose
of the design report is to establish a research goal benchmark case for renewable fuels production in the
2017 timeframe. Annual technical and cost targets have been established and documented in the DOE
Biomass Program’s Multi-Year Program Plan. Progress towards the 2017 goals are assessed annually.
The purpose of this report is to document the review of the 2011 state of technology (SOT) and any
revisions to the projections to 2017 as reported in the November 2011 Biomass Multi-Year Program Plan
(DOE 2011).
This is a conceptual process design for converting biomass into fuels that achieves key technical targets in
a specified year, assuming nth plant modeled capital and operating costs, and is calculated in constant
2007 dollars.
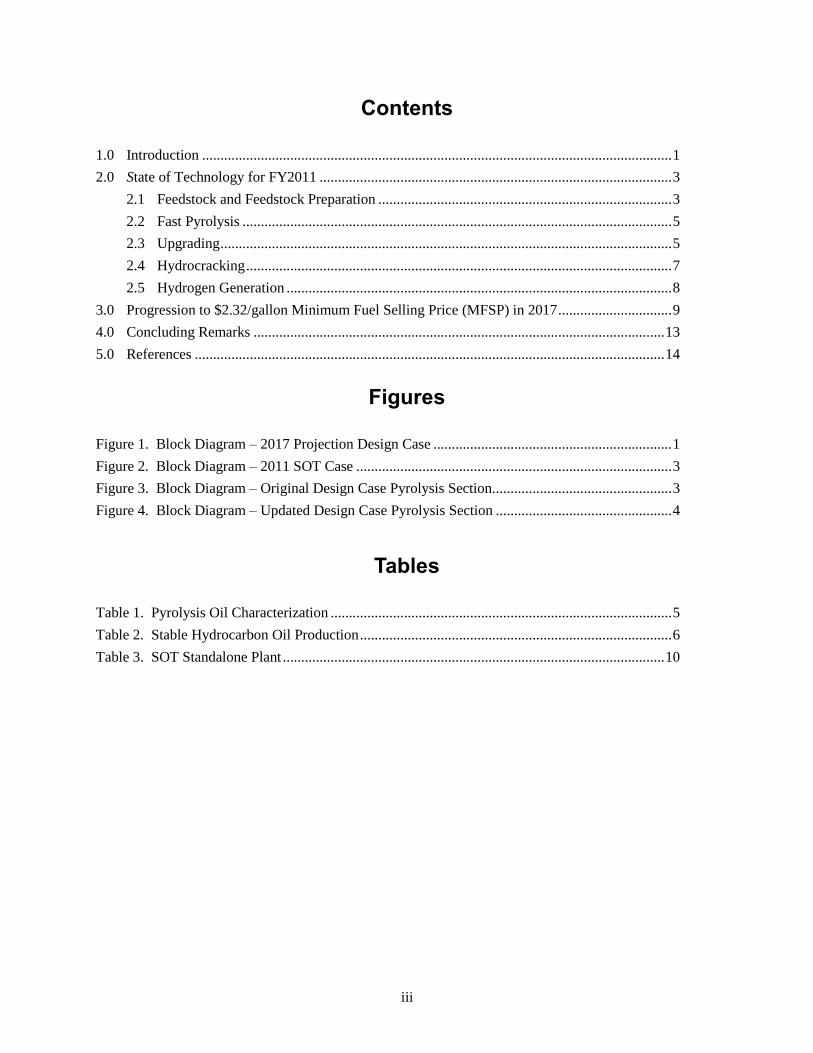
As shown in Figure 1, the original 2017 design case flowsheet (Jones et al 2009) involves several process
steps:
Feedstock drying and size reduction (note that the figure shows the original design case flowsheet
as modeled in 2009– updates to this flowsheet are discussed in Section 2)
Conversion of wood into bio-oil via fast pyrolysis
Upgrading the fast pyrolysis oil to a stable hydrocarbon oil by two-stage hydrotreating to remove
oxygen
Distillation of the stable hydrocarbon oil into gasoline and diesel products
Hydrocracking the heavier- than- diesel fraction (‘heavies”) into additional gasoline and diesel.
Figure 1. 2017 Projection Design Case Block Flow Diagram
Drying and
Size
Reduction
Fast
Pyrolysis
Off -gas2-step
Hydrotreating
Product
Separation
Gasoline
Heavies
Supplemental
Natural Gas
Ash
Exhaust
Vent
Steam
ReformingHydrogen
Stable
Oil
Wastewater
Combustion
Exhaust
Combustion
Exhaust
Hydrocracking
and Product
Separation
Hydrogen
Gasoline
Diesel
Fast
Pyrolysis
Oil Diesel

2
The purpose of the state of technology is to serve as an annual assessment of the progress toward the
projected 2017 goals. It is based on the best publically available data, in terms of key technical
parameters and nth plant modeled capital and operating costs. Thus it is not a calculation of the current
commercial cost of production for the products for a pioneer plant.
3
2.0 State of Technology for FY2011
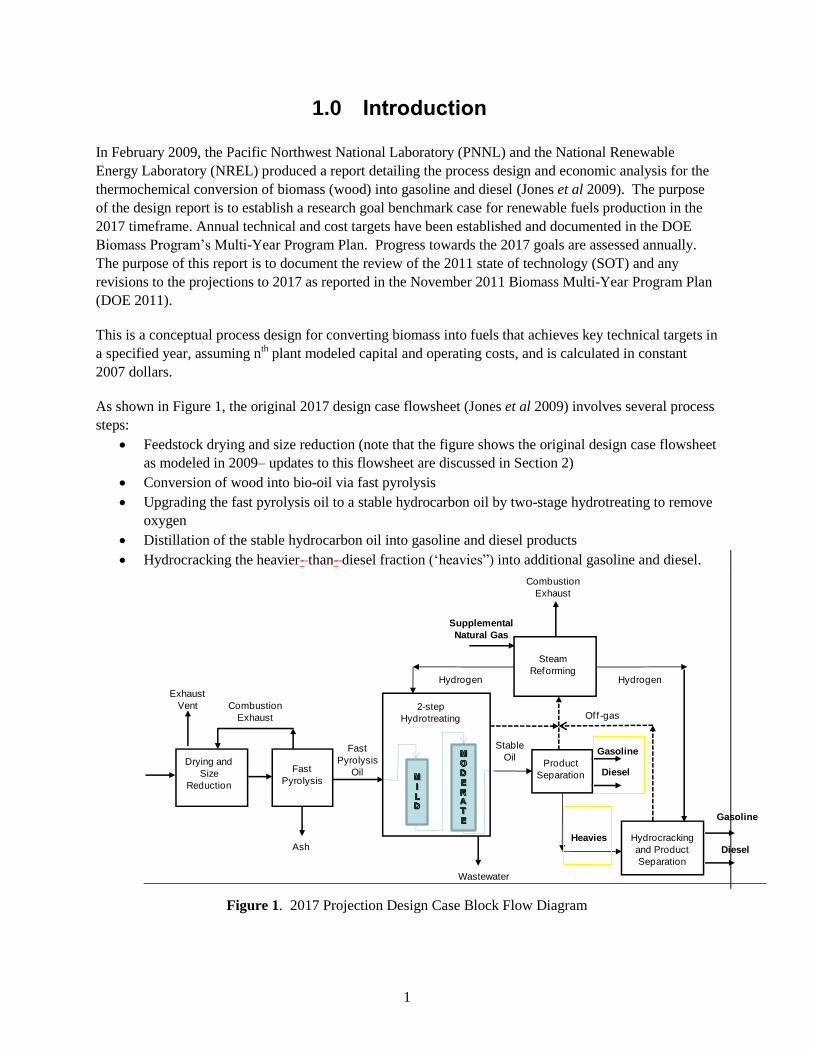
Figure 2 shows the simplified flow for the current state of technology. The diesel and heavier portion of
the stable hydrocarbon oil requires further finishing in a hydrocracker.
Figure 2. Block Diagram – 2011 SOT Case
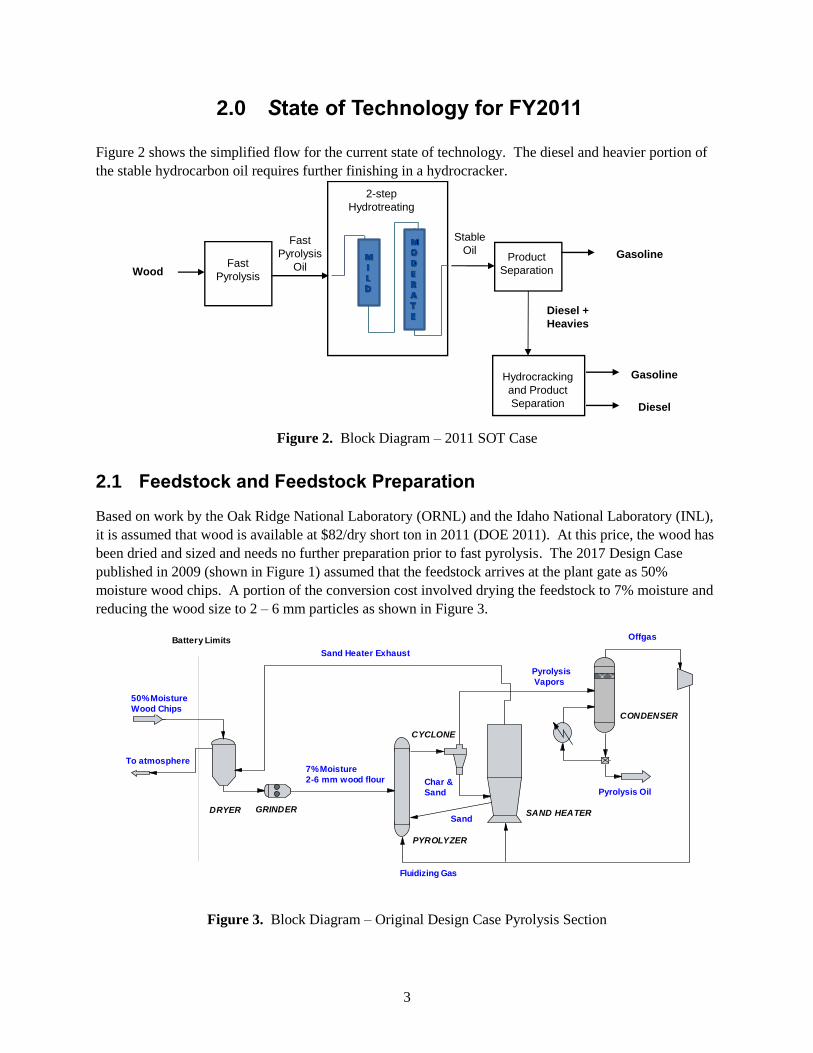
2.1 Feedstock and Feedstock Preparation
Based on work by the Oak Ridge National Laboratory (ORNL) and the Idaho National Laboratory (INL),
it is assumed that wood is available at $82/dry short ton in 2011 (DOE 2011). At this price, the wood has
been dried and sized and needs no further preparation prior to fast pyrolysis. The 2017 Design Case
published in 2009 (shown in Figure 1) assumed that the feedstock arrives at the plant gate as 50%
moisture wood chips. A portion of the conversion cost involved drying the feedstock to 7% moisture and
reducing the wood size to 2 – 6 mm particles as shown in Figure 3.
Figure 3. Block Diagram – Original Design Case Pyrolysis Section
Fast
PyrolysisWood
2-step
Hydrotreating
Product
Separation
Gasoline
Diesel +
Heavies
Stable
Oil
Hydrocracking
and Product
Separation
Gasoline
Diesel
Fast
Pyrolysis
Oil
50% Moisture
Wood Chips
Battery Limits
7% Moisture
2-6 mm wood flour
DRYER GRINDER
PYROLYZER
CYCLONE
SAND HEATER
CONDENSER
Pyrolysis Oil
Offgas
Sand
Char &
Sand
Pyrolysis
Vapors
Sand Heater Exhaust
To atmosphere
Fluidizing Gas
4
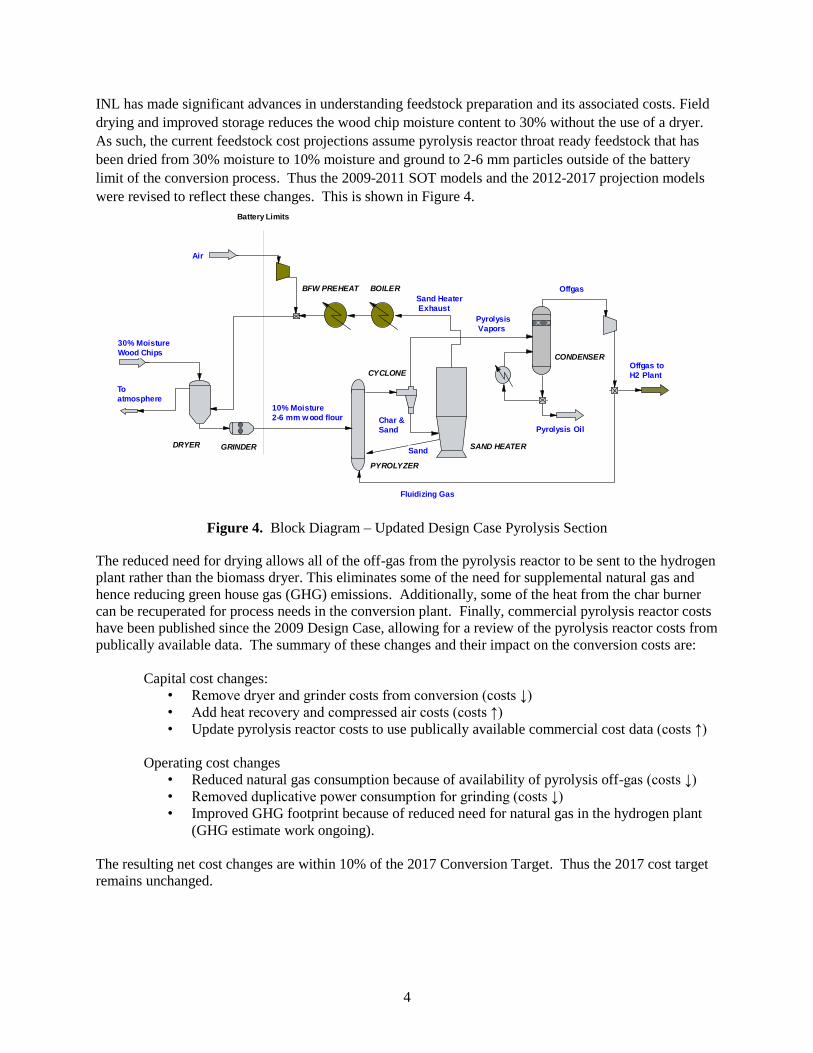
INL has made significant advances in understanding feedstock preparation and its associated costs. Field
drying and improved storage reduces the wood chip moisture content to 30% without the use of a dryer.
As such, the current feedstock cost projections assume pyrolysis reactor throat ready feedstock that has
been dried from 30% moisture to 10% moisture and ground to 2-6 mm particles outside of the battery
limit of the conversion process. Thus the 2009-2011 SOT models and the 2012-2017 projection models
were revised to reflect these changes. This is shown in Figure 4.
Figure 4. Block Diagram – Updated Design Case Pyrolysis Section
The reduced need for drying allows all of the off-gas from the pyrolysis reactor to be sent to the hydrogen
plant rather than the biomass dryer. This eliminates some of the need for supplemental natural gas and
hence reducing green house gas (GHG) emissions. Additionally, some of the heat from the char burner
can be recuperated for process needs in the conversion plant. Finally, commercial pyrolysis reactor costs
have been published since the 2009 Design Case, allowing for a review of the pyrolysis reactor costs from
publically available data. The summary of these changes and their impact on the conversion costs are:
Capital cost changes:
• Remove dryer and grinder costs from conversion (costs ↓)
• Add heat recovery and compressed air costs (costs ↑)
• Update pyrolysis reactor costs to use publically available commercial cost data (costs ↑)
Operating cost changes
• Reduced natural gas consumption because of availability of pyrolysis off-gas (costs ↓)
• Removed duplicative power consumption for grinding (costs ↓)
• Improved GHG footprint because of reduced need for natural gas in the hydrogen plant
(GHG estimate work ongoing).
The resulting net cost changes are within 10% of the 2017 Conversion Target. Thus the 2017 cost target
remains unchanged.
30% Moisture
Wood Chips
Battery Limits
10% Moisture
2-6 mm w ood flour
PYROLYZER
Pyrolysis Oil
Offgas
Sand
Char &
Sand
Pyrolysis
Vapors
Sand Heater
Exhaust
To
atmosphere
Air
DRYER GRINDER SAND HEATER
CONDENSER
Fluidizing Gas
Offgas to
H2 Plant
BOILERBFW PREHEAT
CYCLONE
5
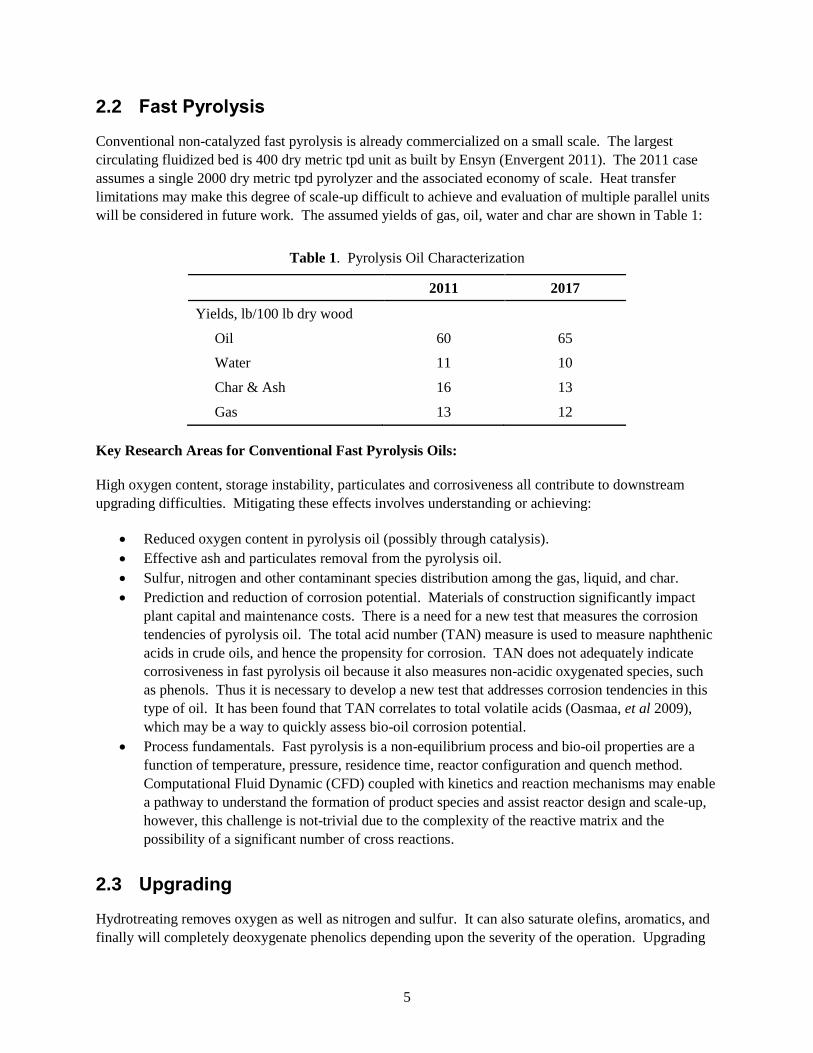
2.2 Fast Pyrolysis
Conventional non-catalyzed fast pyrolysis is already commercialized on a small scale. The largest
circulating fluidized bed is 400 dry metric tpd unit as built by Ensyn (Envergent 2011). The 2011 case
assumes a single 2000 dry metric tpd pyrolyzer and the associated economy of scale. Heat transfer
limitations may make this degree of scale-up difficult to achieve and evaluation of multiple parallel units
will be considered in future work. The assumed yields of gas, oil, water and char are shown in Table 1:
Table 1. Pyrolysis Oil Characterization
2011 2017
Yields, lb/100 lb dry wood
Oil 60 65
Water 11 10
Char & Ash 16 13
Gas 13 12
Key Research Areas for Conventional Fast Pyrolysis Oils:
High oxygen content, storage instability, particulates and corrosiveness all contribute to downstream
upgrading difficulties. Mitigating these effects involves understanding or achieving:
Reduced oxygen content in pyrolysis oil (possibly through catalysis).
Effective ash and particulates removal from the pyrolysis oil.
Sulfur, nitrogen and other contaminant species distribution among the gas, liquid, and char.
Prediction and reduction of corrosion potential. Materials of construction significantly impact
plant capital and maintenance costs. There is a need for a new test that measures the corrosion
tendencies of pyrolysis oil. The total acid number (TAN) measure is used to measure naphthenic
acids in crude oils, and hence the propensity for corrosion. TAN does not adequately indicate
corrosiveness in fast pyrolysis oil because it also measures non-acidic oxygenated species, such
as phenols. Thus it is necessary to develop a new test that addresses corrosion tendencies in this
type of oil. It has been found that TAN correlates to total volatile acids (Oasmaa, et al 2009),
which may be a way to quickly assess bio-oil corrosion potential.
Process fundamentals. Fast pyrolysis is a non-equilibrium process and bio-oil properties are a
function of temperature, pressure, residence time, reactor configuration and quench method.
Computational Fluid Dynamic (CFD) coupled with kinetics and reaction mechanisms may enable
a pathway to understand the formation of product species and assist reactor design and scale-up,
however, this challenge is not-trivial due to the complexity of the reactive matrix and the
possibility of a significant number of cross reactions.
2.3 Upgrading
Hydrotreating removes oxygen as well as nitrogen and sulfur. It can also saturate olefins, aromatics, and
finally will completely deoxygenate phenolics depending upon the severity of the operation. Upgrading
6
fast pyrolysis oil to stable hydrocarbon oil occurs in two steps. The first reactor step uses mild
hydrotreating conditions to remove some of the oxygen and prevents secondary reactions (such as
polymerization) that lead to catalyst deactivation. The second reactor operates at greater severity than the
first; it uses higher temperatures and/or lower space velocities to achieve low levels of oxygen (<1 wt %).
One of the advantages of the upgrading process is that it can be tailored to meet different ratios of
gasoline, jet and diesel. For example, UOP proposed a combined hydrotreating/hydrocracking reactor
that produces 15% lights, 30% gasoline and 8% diesel range boiling material. The gasoline has good
octane, while the diesel has low cetane due to high aromatics content (Holmgren 2008). Alternatively,
Veba Oel employed severe hydrotreating without hydrocracking to produce a 99% deoxygenated product
that is approximately 40% naphtha, 40% diesel and 20% heavy material and contains less than 0.5%
oxygen. The diesel boiling range has good cetane (>40) but the lighter material in the naphtha range has
low octane (Elliott 2007). Current research performed by PNNL and NREL studied the properties of
various boiling point cuts from bio-oil that were hydrotreated to different oxygen levels (Christensen et al
2011). The octane value of the naphtha cut decreased with decreasing levels of residual oxygen. Cetane
was not measured for the middle distillates cut, however, this cut at low oxygen levels (<0.4 wt%)
appears to be a very good candidate for jet fuel production. The product distribution for the low oxygen
product was approximately 44% for lights plus naphtha, 43% for distillates and 13% for gasoil. The
process chosen for the design case is assumed to balance the gasoline and diesel range products. The
state of technology is such that good gasoline range octane and good diesel range cetane are not
simultaneously produced without additional hydrotreating of the diesel and higher boiling range material.
Future techno-economic assessments might investigate maximization of products in the diesel and jet
boiling ranges, in response to market drivers and gradual shifts toward electrification.
Upgrading in the 2011 SOT case is based on laboratory generated data and reflects the short period of
time before the catalyst must be completely replaced. Parallel reactors are used to meet the 90% stream
factor. Reactor end-of-run occurs when the reactor pressure drop rises substantially and/or the catalyst
activity declines. At that point the reactor is taken off-line, while the standby reactor is brought into
service. A portion of the offline reactor’s catalyst is replaced with fresh catalyst and a portion discarded.
Catalyst disposal is required until an effective means of regenerating carbon- based catalysts is found. To
date, at best, the original charge of catalyst will last approximately one month before it is completely
replaced.
Product quality is obviously important. Gasoline range octane is preserved, but the diesel exhibits poor
cetane due to under-hydrogenation. Thus, the diesel and heavier boiling range material requires further
hydrotreating. A possible alternate product is the stable hydrocarbon oil itself, which could be sold as a
fuel oil substitute for bioenergy. Further examination of the value proposition in this application is
currently beyond the scope of this SOT.
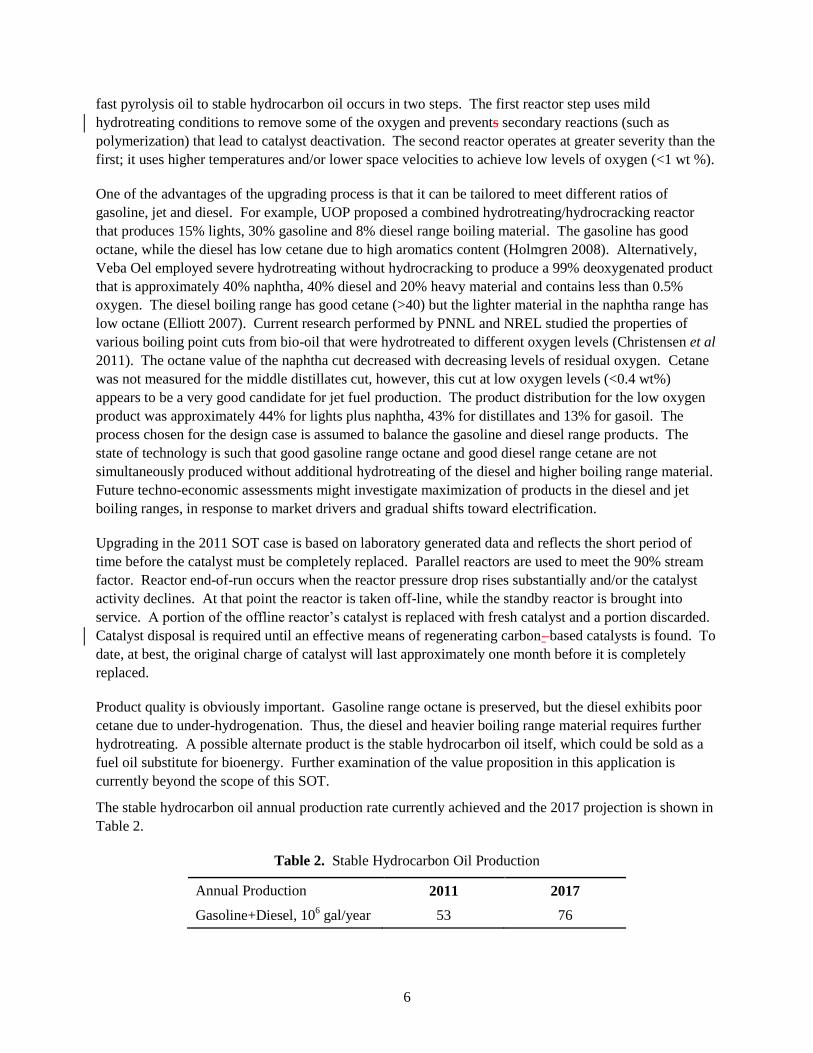
The stable hydrocarbon oil annual production rate currently achieved and the 2017 projection is shown in
Table 2.
Table 2. Stable Hydrocarbon Oil Production
Annual Production 2011 2017
Gasoline+Diesel, 106 gal/year 53 76
7
Key Research Areas for Upgrading Conventional Fast Pyrolysis Oils:
Upgrading pyrolysis oil to infrastructure compatible fuels can take many routes (Elliott 2007). Recent
studies have begun to look at the details of these routes (Elliot et al 2009, Venderbosch et al 2009,
Christensen et al 2011). The key research areas for conventional fast pyrolysis oil upgrading are catalyst
life, efficient usage of hydrogen, and product quality. This involves understanding:
How upgrading conditions affect product quality, e.g. temperature, pressure, space velocity,
hydrogen partial pressure at the reactor outlet.
The effect of catalyst type and support affect product quality and yield, e.g. conventional
hydrotreating catalysts versus palladium or ruthenium, alumina supports versus carbon.
The effective concentration of hydrogen on the surface of the catalyst.
Catalyst deactivation mechanisms, which likely are a combination of coke formation, catalyst
sintering, and catalyst poisoning or occlusion.
Reaction kinetics to allow improved reactor design and potential reduction in capital expenditure
together with control of competing mechanisms in order to improve selectivity towards desired
products.
There is also a significant need for detailed data regarding the characteristics of the stable hydrocarbon
oil. In particular:
Boiling point curves, density, heating value, and ultimate analysis for the stable hydrocarbon oil
product and each product cut from the hydrocarbon oil (lights, naphtha, jet, diesel, gasoil).
Cetane and octane values for the naphtha and diesel cuts.
Yields for each product cut.
Relative reaction rates of different functional groups within the bio-oil as it relates to the catalyst,
the reactants and on the reactor surface.
Compound types (e.g., % oxygenates, aromatics, naphthenes, olefins and saturates) within each of
the product cuts.
2.4 Hydrocracking
Hydrocracking creates smaller chain components from larger ones and saturates alkenes and aromatics. It
also removes any remaining oxygenates, such as the phenolic type groups which appears to be the most
difficult oxygenate type to remove (Christensen et al 2011). The 2011 SOT case requires that all of the
diesel and heavier boiling range product be finished in a hydrocracker. This treatment cracks the heavier-
than-diesel components back to the diesel range and removes residual olefins, aromatics and oxygenates.
Key Hydrocracking Research Areas:
Standalone hydrocracking is not currently a part of the core research work. However, meeting diesel
range properties and yield requires the understanding of:
The extent of additional hydrotreating needed to improve diesel properties to acceptable levels
(aromatic content of less than 25% and cetane index of at least 40).
The operational ability to adjust yields between the naphtha, jet and diesel boiling ranges.
8
2.5 Hydrogen Generation
Off-gas from the fast pyrolysis section, the upgrading reactors and the hydrocracker, supplemented with
natural gas, is sent to a steam reformer to generate the hydrogen used in the upgrading reactors. As
natural gas is not renewable, an alternative means of hydrogen generation may be desirable if
economically viable. For example, renewable hydrogen could be produced by reforming a portion of the
whole fast pyrolysis oil or a fractionated portion of the oil. This option was not considered in the 2017
design case, but will be included in a future update.
Key Hydrogen Generation Research Areas:
Hydrogen generation from natural gas is well established and easily the least expensive form of hydrogen
production. However, steam reforming of whole or fractionated pyrolysis oil is being researched by
NREL under the Hydrogen Program. Catalyst life and performance are the key issues (Czernik 2007).
9
3.0 Progression to $2.32/gallon Minimum Fuel Selling Price (MFSP) in 2017
It is possible to meet individual targets separately, such as good gasoline octane, or low hydrogen
consumption or low oxygen content. However, the research challenges are to simultaneously make good
quality gasoline and diesel blendstocks, while balancing hydrogen consumption with yield, and
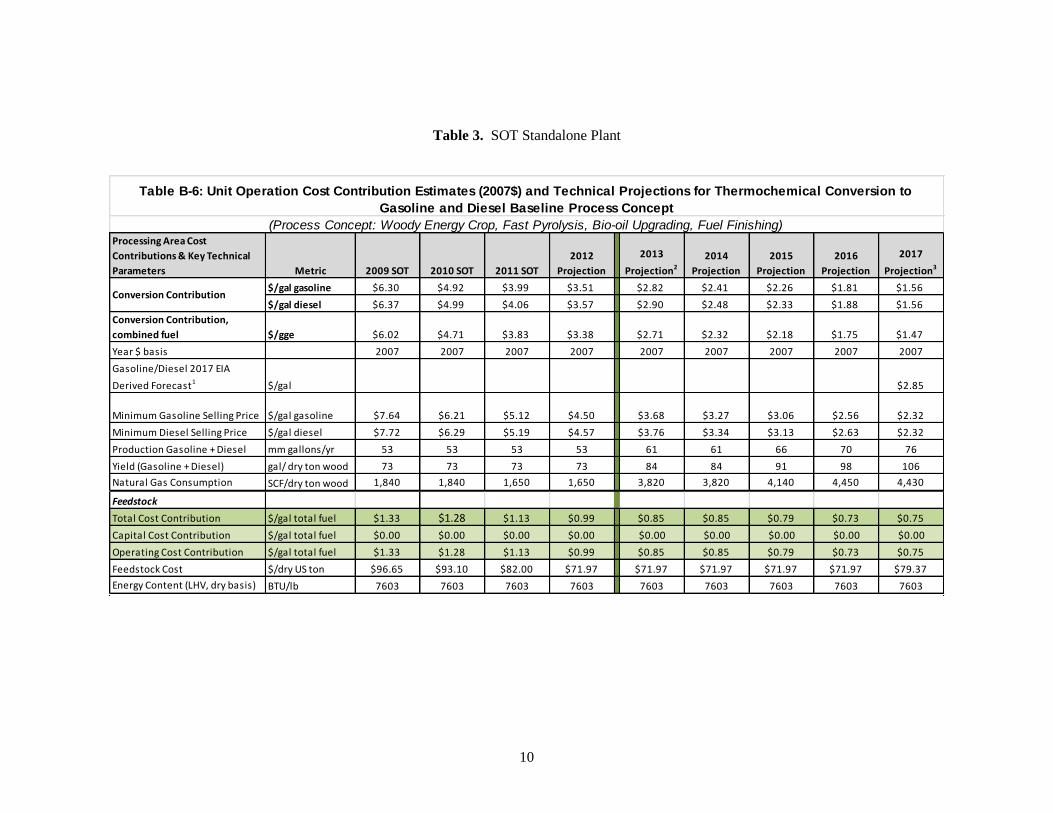
maximizing upgrading catalyst life. Table 3 shows the MFSP for the 2011 SOT and the progression to
the 2017 design case. All costs are in 2007 constant dollars.
Previous design cases for ethanol were able to report costs on an individual product basis, i.e., the
minimum ethanol selling price (MESP). Since the pyrolysis case produces two products (possibly three if
a jet fuel cut is made), there is a need to determine a minimum selling price for each fuel. The
methodology to produce separate cost breakouts for gasoline and diesel was achieved in two steps:
calculating the minimum selling price for the combined volumes of gasoline and diesel, then separating
the capital and operating costs that are specific to each fuel. The production process for both gasoline and
diesel in the 2011 SOT are the same all the way up through the two upgrading reactors and initial product
separation. After that, the gasoline cut is essentially finished, but the diesel cut needs additional
hydrotreating and the heavier than diesel cut requires hydrocracking. Thus the cost for additional diesel
upgrading is assigned only to the diesel fraction. As the technology improves, the diesel fraction will
need less and less additional upgrading and the cost of producing gasoline and diesel should approach one
another. This improvement effect is reflected in the 2017 production costs being the same for both
products.
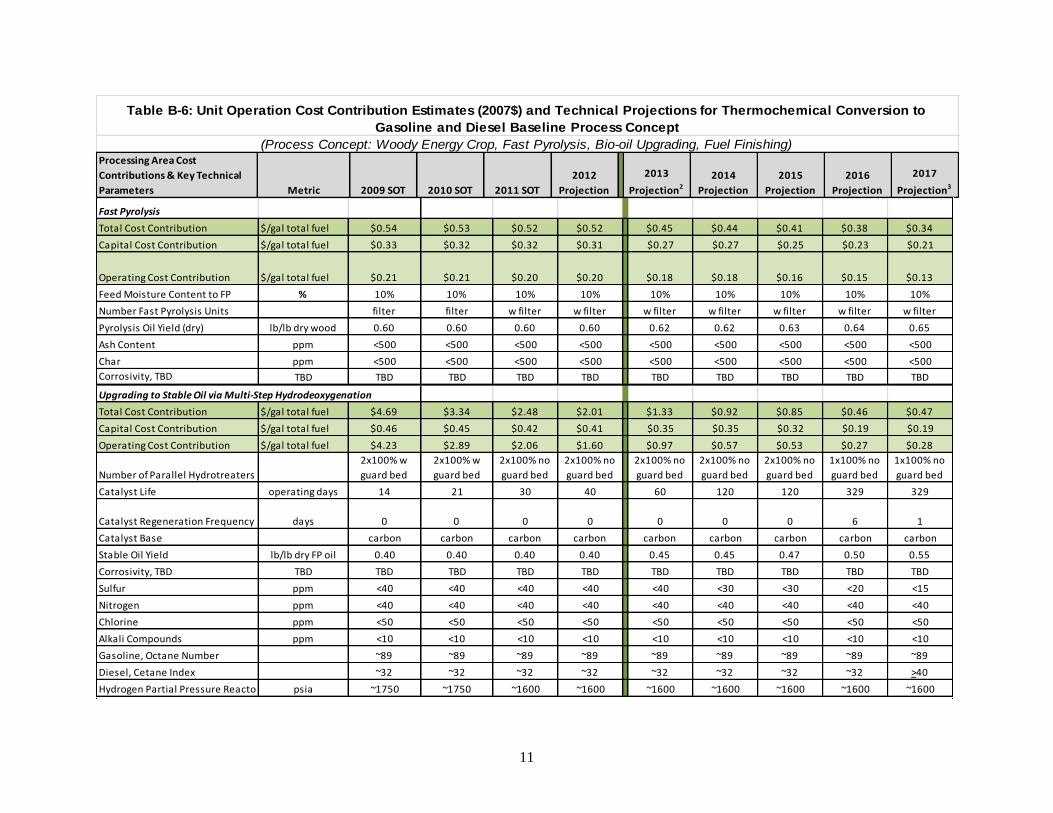
Table 3 shows the research targets needed to advance from the current SOT to the 2017 goal. In the early
years, the focus is on improving the upgrading catalyst life. This is reflected in the high cost of fuel
production – a result of additional spare equipment needed to mitigate the effects of significant catalyst
makeup. In later years, the focus shifts to increasing the product yield.
In addition to the research advances expected from the core pyrolysis and upgrading work, there are
several new projects resulting from solicitations that are expected to provide technology breakthroughs.
Two examples are the National Advanced Biofuels Consortium (NABC 2010) and the pyrolysis and
upgrading solicitation awards (DOE 2010). There is other research funded by other agencies and
departments of DOE. These projects are exploring variations/alternatives to fast pyrolysis to generate
bio-oil that is subsequently upgraded to a hydrocarbon. Examples of these are catalytic pyrolysis (in both
the liquid phase and/or the vapor phase), hydrothermal liquefaction, and hydro-pyrolysis. These
pathways produce different quality bio-oils and may require different, possibly less severe, upgrading to
hydrocarbon oil than that described in the conventional fast pyrolysis and upgrading design case. Thus,
the heavy, dark green vertical line separating the years 2012 and 2013 indicates the provision to reassess
the goals in Table 3 with respect to findings from the NABC and the upgrading solicitation. It is expected
that a new design case will be published as a result.
10
Table 3. SOT Standalone Plant
Processing Area Cost
Contributions & Key Technical
Parameters Metric 2009 SOT 2010 SOT 2011 SOT
2012
Projection
2013
Projection2
2014
Projection
2015
Projection
2016
Projection
2017
Projection3
$/gal gasoline $6.30 $4.92 $3.99 $3.51 $2.82 $2.41 $2.26 $1.81 $1.56
$/gal diesel $6.37 $4.99 $4.06 $3.57 $2.90 $2.48 $2.33 $1.88 $1.56
Conversion Contribution,
combined fuel $/gge $6.02 $4.71 $3.83 $3.38 $2.71 $2.32 $2.18 $1.75 $1.47
Year $ basis 2007 2007 2007 2007 2007 2007 2007 2007 2007
Gasoline/Diesel 2017 EIA
Derived Forecast1 $/gal $2.85
Minimum Gasoline Selling Price $/gal gasoline $7.64 $6.21 $5.12 $4.50 $3.68 $3.27 $3.06 $2.56 $2.32
Minimum Diesel Selling Price $/gal diesel $7.72 $6.29 $5.19 $4.57 $3.76 $3.34 $3.13 $2.63 $2.32
Production Gasoline + Diesel mm gallons/yr 53 53 53 53 61 61 66 70 76
Yield (Gasoline + Diesel) gal/ dry ton wood 73 73 73 73 84 84 91 98 106
Natural Gas Consumption SCF/dry ton wood 1,840 1,840 1,650 1,650 3,820 3,820 4,140 4,450 4,430
Feedstock
Total Cost Contribution $/gal total fuel $1.33 $1.28 $1.13 $0.99 $0.85 $0.85 $0.79 $0.73 $0.75
Capital Cost Contribution $/gal total fuel $0.00 $0.00 $0.00 $0.00 $0.00 $0.00 $0.00 $0.00 $0.00
Operating Cost Contribution $/gal total fuel $1.33 $1.28 $1.13 $0.99 $0.85 $0.85 $0.79 $0.73 $0.75
Feedstock Cost $/dry US ton $96.65 $93.10 $82.00 $71.97 $71.97 $71.97 $71.97 $71.97 $79.37
Energy Content (LHV, dry basis) BTU/lb 7603 7603 7603 7603 7603 7603 7603 7603 7603
Table B-6: Unit Operation Cost Contribution Estimates (2007$) and Technical Projections for Thermochemical Conversion to
Gasoline and Diesel Baseline Process Concept
(Process Concept: Woody Energy Crop, Fast Pyrolysis, Bio-oil Upgrading, Fuel Finishing)
Conversion Contribution
11
Processing Area Cost
Contributions & Key Technical
Parameters Metric 2009 SOT 2010 SOT 2011 SOT
2012
Projection
2013
Projection2
2014
Projection
2015
Projection
2016
Projection
2017
Projection3
$/gal gasoline $6.30 $4.92 $3.99 $3.51 $2.82 $2.41 $2.26 $1.81 $1.56
$/gal diesel $6.37 $4.99 $4.06 $3.57 $2.90 $2.48 $2.33 $1.88 $1.56
Conversion Contribution,
combined fuel $/gge $6.02 $4.71 $3.83 $3.38 $2.71 $2.32 $2.18 $1.75 $1.47
Year $ basis 2007 2007 2007 2007 2007 2007 2007 2007 2007
Gasoline/Diesel 2017 EIA
Derived Forecast1 $/gal $2.85
Minimum Gasoline Selling Price $/gal gasoline $7.64 $6.21 $5.12 $4.50 $3.68 $3.27 $3.06 $2.56 $2.32
Minimum Diesel Selling Price $/gal diesel $7.72 $6.29 $5.19 $4.57 $3.76 $3.34 $3.13 $2.63 $2.32
Production Gasoline + Diesel mm gallons/yr 53 53 53 53 61 61 66 70 76
Yield (Gasoline + Diesel) gal/ dry ton wood 73 73 73 73 84 84 91 98 106
Natural Gas Consumption SCF/dry ton wood 1,840 1,840 1,650 1,650 3,820 3,820 4,140 4,450 4,430
Feedstock
Total Cost Contribution $/gal total fuel $1.33 $1.28 $1.13 $0.99 $0.85 $0.85 $0.79 $0.73 $0.75
Capital Cost Contribution $/gal total fuel $0.00 $0.00 $0.00 $0.00 $0.00 $0.00 $0.00 $0.00 $0.00
Operating Cost Contribution $/gal total fuel $1.33 $1.28 $1.13 $0.99 $0.85 $0.85 $0.79 $0.73 $0.75
Feedstock Cost $/dry US ton $96.65 $93.10 $82.00 $71.97 $71.97 $71.97 $71.97 $71.97 $79.37
Energy Content (LHV, dry basis) BTU/lb 7603 7603 7603 7603 7603 7603 7603 7603 7603
Table B-6: Unit Operation Cost Contribution Estimates (2007$) and Technical Projections for Thermochemical Conversion to
Gasoline and Diesel Baseline Process Concept
(Process Concept: Woody Energy Crop, Fast Pyrolysis, Bio-oil Upgrading, Fuel Finishing)
Conversion ContributionFast Pyrolysis
Total Cost Contribution $/gal total fuel $0.54 $0.53 $0.52 $0.52 $0.45 $0.44 $0.41 $0.38 $0.34
Capital Cost Contribution $/gal total fuel $0.33 $0.32 $0.32 $0.31 $0.27 $0.27 $0.25 $0.23 $0.21
Operating Cost Contribution $/gal total fuel $0.21 $0.21 $0.20 $0.20 $0.18 $0.18 $0.16 $0.15 $0.13
Feed Moisture Content to FP % 10% 10% 10% 10% 10% 10% 10% 10% 10%
Number Fast Pyrolysis Units
1x2000 tpd no
filter
1x2000 tpd no
filter
1x2000 tpd
w filter
1x2000 tpd
w filter
1x2000 tpd
w filter
1x2000 tpd
w filter
1x2000 tpd
w filter
1x2000 tpd
w filter
1x2000 tpd
w filter
Pyrolysis Oil Yield (dry) lb/lb dry wood 0.60 0.60 0.60 0.60 0.62 0.62 0.63 0.64 0.65
Ash Content ppm <500 <500 <500 <500 <500 <500 <500 <500 <500
Char ppm <500 <500 <500 <500 <500 <500 <500 <500 <500
Corrosivity, TBD TBD TBD TBD TBD TBD TBD TBD TBD TBD TBD
Upgrading to Stable Oil via Multi-Step Hydrodeoxygenation
Total Cost Contribution $/gal total fuel $4.69 $3.34 $2.48 $2.01 $1.33 $0.92 $0.85 $0.46 $0.47
Capital Cost Contribution $/gal total fuel $0.46 $0.45 $0.42 $0.41 $0.35 $0.35 $0.32 $0.19 $0.19
Operating Cost Contribution $/gal total fuel $4.23 $2.89 $2.06 $1.60 $0.97 $0.57 $0.53 $0.27 $0.28
Number of Parallel Hydrotreaters
2x100% w
guard bed
2x100% w
guard bed
2x100% no
guard bed
2x100% no
guard bed
2x100% no
guard bed
2x100% no
guard bed
2x100% no
guard bed
1x100% no
guard bed
1x100% no
guard bed
Catalyst Life operating days 14 21 30 40 60 120 120 329 329
Catalyst Regeneration Frequency days 0 0 0 0 0 0 0 6 1
Catalyst Base carbon carbon carbon carbon carbon carbon carbon carbon carbon
Stable Oil Yield lb/lb dry FP oil 0.40 0.40 0.40 0.40 0.45 0.45 0.47 0.50 0.55
Corrosivity, TBD TBD TBD TBD TBD TBD TBD TBD TBD TBD TBD
Sulfur ppm <40 <40 <40 <40 <40 <30 <30 <20 <15
Nitrogen ppm <40 <40 <40 <40 <40 <40 <40 <40 <40
Chlorine ppm <50 <50 <50 <50 <50 <50 <50 <50 <50
Alkali Compounds ppm <10 <10 <10 <10 <10 <10 <10 <10 <10
Gasoline, Octane Number ~89 ~89 ~89 ~89 ~89 ~89 ~89 ~89 ~89
Diesel, Cetane Index ~32 ~32 ~32 ~32 ~32 ~32 ~32 ~32 >40
Hydrogen Partial Pressure Reactor psia ~1750 ~1750 ~1600 ~1600 ~1600 ~1600 ~1600 ~1600 ~1600

12
Processing Area Cost
Contributions & Key Technical
Parameters Metric 2009 SOT 2010 SOT 2011 SOT
2012
Projection
2013
Projection2
2014
Projection
2015
Projection
2016
Projection
2017
Projection3
$/gal gasoline $6.30 $4.92 $3.99 $3.51 $2.82 $2.41 $2.26 $1.81 $1.56
$/gal diesel $6.37 $4.99 $4.06 $3.57 $2.90 $2.48 $2.33 $1.88 $1.56
Conversion Contribution,
combined fuel $/gge $6.02 $4.71 $3.83 $3.38 $2.71 $2.32 $2.18 $1.75 $1.47
Year $ basis 2007 2007 2007 2007 2007 2007 2007 2007 2007
Gasoline/Diesel 2017 EIA
Derived Forecast1 $/gal $2.85
Minimum Gasoline Selling Price $/gal gasoline $7.64 $6.21 $5.12 $4.50 $3.68 $3.27 $3.06 $2.56 $2.32
Minimum Diesel Selling Price $/gal diesel $7.72 $6.29 $5.19 $4.57 $3.76 $3.34 $3.13 $2.63 $2.32
Production Gasoline + Diesel mm gallons/yr 53 53 53 53 61 61 66 70 76
Yield (Gasoline + Diesel) gal/ dry ton wood 73 73 73 73 84 84 91 98 106
Natural Gas Consumption SCF/dry ton wood 1,840 1,840 1,650 1,650 3,820 3,820 4,140 4,450 4,430
Feedstock
Total Cost Contribution $/gal total fuel $1.33 $1.28 $1.13 $0.99 $0.85 $0.85 $0.79 $0.73 $0.75
Capital Cost Contribution $/gal total fuel $0.00 $0.00 $0.00 $0.00 $0.00 $0.00 $0.00 $0.00 $0.00
Operating Cost Contribution $/gal total fuel $1.33 $1.28 $1.13 $0.99 $0.85 $0.85 $0.79 $0.73 $0.75
Feedstock Cost $/dry US ton $96.65 $93.10 $82.00 $71.97 $71.97 $71.97 $71.97 $71.97 $79.37
Energy Content (LHV, dry basis) BTU/lb 7603 7603 7603 7603 7603 7603 7603 7603 7603
Table B-6: Unit Operation Cost Contribution Estimates (2007$) and Technical Projections for Thermochemical Conversion to
Gasoline and Diesel Baseline Process Concept
(Process Concept: Woody Energy Crop, Fast Pyrolysis, Bio-oil Upgrading, Fuel Finishing)
Conversion ContributionFuel Finishing to Gasoline and Diesel via Hydrocracking and Distillation
Total Cost Contribution $/gal total fuel $0.30 $0.30 $0.29 $0.29 $0.27 $0.26 $0.25 $0.25 $0.11
Capital Cost Contribution $/gal total fuel $0.22 $0.21 $0.21 $0.21 $0.19 $0.19 $0.19 $0.18 $0.07
Operating Cost Contribution $/gal total fuel $0.09 $0.09 $0.08 $0.08 $0.07 $0.07 $0.07 $0.06 $0.05
Extent of Hydrocracking/treating
diesel and
heavier
diesel and
heavier
diesel and
heavier
diesel and
heavier
diesel and
heavier
diesel and
heavier
diesel and
heavier
diesel and
heavier
heavier than
diesel
Balance of Plant: Hydrogen Generation & OSBL
Total Cost Contribution $/gal total fuel $0.82 $0.81 $0.75 $0.74 $0.82 $0.82 $0.78 $0.75 $0.65
Capital Cost Contribution $/gal total fuel $0.43 $0.41 $0.39 $0.38 $0.33 $0.33 $0.30 $0.28 $0.23
Operating Cost Contribution $/gal total fuel $0.39 $0.39 $0.36 $0.36 $0.49 $0.49 $0.48 $0.47 $0.41
Models: Case References2009 SOT-
1011
2010 SOT-
1011
2011 SOT-
10112012 P-1011 2013 P-1011 2014 P-1011 2015 P-1011 2016 P-1011
2017 Design
1011
Note: The table may contain very small (< $0.01) rounding errors due to the difference betw een the w ay that Microsoft Excel™ displays and calculates rounded values.1EIA, “Annual Energy Outlook 2009" Post ARRA April 2009, Table 112, U.S., ,” Table 112, U.S., April 2009, http://w w w .eia.doe.gov/oiaf/archive/aeo09/supplement/suptab_112.xls2The demarcation line betw een 2012 and 2013 indicates the design case update planned to incorporate f indings from the NABC, the stabilization call, and future upgrading w ork3"Production of Gasoline and Diesel from Biomass Via Fast Pyrolysis, Hydrotreating and Hydrocracking: A Design Case", PNNL-18284, February 2009
13
4.0 Concluding Remarks
In order to be on a trajectory to a modeled nth plant $2.32/ gallon of fuel in 2017 (feedstock cost of $79.37
/dry U.S. ton, 2007$) a modeled Minimum Gasoline Selling Price of $5.12/gallon of gasoline or
Minimum Diesel Selling Price of $5.19/gallon of diesel was experimentally determined in 2011.
Technically this was attained through bench scale experimental demonstration to show a combined
gasoline and diesel blend stock yield of 73 gallons/dry U.S. ton and a catalyst replacement lifetime of 30
operating days.
The further research needed to achieve the 2017 goal of $2.32/gal fuel (2007$) is summarized as follows:
Improve the quality and consistency of bio-oil.
Develop the means to extend the life of the pyrolysis oil upgrading catalysts, for example,
through improved filtering, refinement of catalyst design, and optimized upgrading conditions.
Develop a better understanding of reactor limitations and opportunities by developing predictive
pyrolysis-oil production models and upgrading the reactor models to replace the stoichiometric
models used in the design case study.
Conduct catalyst deactivation studies to understand the mechanisms responsible for short
upgrading catalyst life.
Determine stable oil and product fuel specifications for oil refinery acceptance and how to
maximize cuts or blends of upgraded fuels to balance production in existing refineries.
Incorporation of the new concepts generated by the core work, NABC, Integrated Bio
Refineries (IBRs) and upgrading solicitation work into economic assessments of future cases for
biomass pyrolysis should be the next stage of analysis. Advanced pyrolysis processes may
include:
New reactor system engineering involving improved heat transfer mechanisms and catalyst
maintenance.
Pyrolysis including in-situ catalysis and vapor phase catalysis with or without the presence of
externally added hydrogen.
Post pyrolysis processing to improve product bio-oil properties.
Post-process separations and subsequent treatment to produce improved products.
Greater effective hydrogen concentration on the surface of the upgrading catalyst.
Higher efficiency integrated systems with improved heat utilization.
14
5.0 References
Christensen, et al, “Analysis of Oxygenated Compounds in Hydrotreated Biomass Fast Pyrolysis Oil
Distillate Fractions” Energy & Fuels, 25 (2011) 5462-5471
Czernik, S, R. Evans, and R. French, “Hydrogen from Biomass-Production by Steam Reforming of
Biomass Pyrolysis Oil” Catalysis Today,129 (2007) 265-268
U.S. Department of Energy. 2011. Biomass Multi-Year Program Plan. Office of the Biomass Program,
Energy Efficiency and Renewable Energy, U.S. Department of Energy, Washington D.C.
U.S. Department of Energy. 2010. Advanced Biofuels Technology Development
http://www1.eere.energy.gov/biomass/news_detail.html?news_id=16311
Envergent 2011. http://www.envergenttech.com
Elliott, DC. 2007. “Historical Developments in Hydroprocessing Bio-oil.” Energy & Fuels 21:1792-1815.
Elliott, D.C., T.R. Hart, G.G. Neuenschwander, L.J. Rotness, A.L. Zacher, 2009. “Catalytic
Hydroprocessing of Biomass Fast Pyrolysis Bio-Oil to Produce Hydrocarbon Products”, Environmental
Progress & Sustainable Energy, 28(3): 441-449
Holmgren, J., R. Marinangeli, P. Nair, D. Elliott, R. Bain, 2008. “Consider Upgrading Pyrolysis Oils into
Renewable Fuels” Hydrocarbon Processing, September 2008, pp 95-103
National Advance Biofuels Consortium, NABC 2010 www.nabcprojects.org
Jones S.B., C. Valkenburg, C.W. Walton, D.C. Elliott, J.E. Holladay, D.J. Stevens, C. Kinchin, and S.
Czernik. 2009. “Production of Gasoline and Diesel from Biomass via Fast Pyrolysis, Hydrotreating and
Hydrocracking: A Design Case “. PNNL-18284 Rev. 1, Pacific Northwest National Laboratory, Richland,
WA.
Oasmaa, A., D.C. Elliott, S. Muller, 2009. “Quality Control in Fast Pyrolysis Bio-Oil Production and Use”
Environmental Progress & Sustainable Energy, 28(3): 404-409
Venderbosch, R.H. , A. Ardiyanti, J. Wildschut, A. Oasmaa, H.J. Heeres, “Insights in the Hydroprocessing
of Biomass Derived Pyrolysis Oils” July 2009, BioCoup Project Paper, BTG Biomass Technology Group
B.V. http://www.btgworld.com/index.php?id=172&rid=52&r=references