q 4 o d 2014 q q q q - frontex | european union...
TRANSCRIPT

Q2Q1Q3 Q4
FRAN QuarterlyQuarter 4 • October–December 2014


1 of 24
FRAN QuarterlyQuarter 4 • October–December 2014

2 of 24
Frontex official publications fall into four main categories: risk analysis, training, operations and research, each marked with a distinct graphic identifier. Risk analysis publications bear a triangular symbol formed by an arrow drawing a triangle, with a dot at the centre. Metaphorically, the arrow represents the cyclical nature of risk analysis processes and its orientation towards an appropriate operational response. The triangle is a symbol of ideal proportions and knowledge, reflecting the pursuit of factual exactness, truth and exhaustive analysis. The dot at the centre represents the intelligence factor and the focal point where information from diverse sources converges to be processed, systematised and shared as analytical products. Thus, Frontex risk analysis is meant to be at the centre and to form a reliable basis for its operational activities.
European Agency for the Management of Operational Cooperation at the External Borders of the Member States of the European Union
Plac Europejski 6 00-844 Warsaw, PolandT +48 22 205 95 00 F +48 22 205 95 01 [email protected] www.frontex.europa.eu
Warsaw, April 2015 Risk Analysis Unit Frontex reference number: 3864/2015
OPOCE Catalogue number TT-AF-14-005-EN-N ISSN 2363-0566
© Frontex, 2015 All rights reserved. Reproduction is authorised provided the source is acknowledged.
DISCLAIMERSThis is a Frontex staff working document. This publication or its contents do not imply the expression of any opinion whatsoever on the part of Frontex concerning the legal status of any country, territory or city or its authorities, or concerning the delimitation of its frontiers or boundaries. All charts included in this report are the sole property of Frontex and any unauthorised use is prohibited..
ACKNOWLEDGMENTSThe FRAN Quarterly has been prepared by the Frontex Risk Analysis Unit. During the course of developing this product, many colleagues at Frontex and outside contributed to it and their assistance is hereby acknowledged with gratitude.

3 of 24
Table of contentsExecutive summary #5
1. Introduction #7
2. Methodology #8
3. Summary of FRAN indicators #10
4. Statistical annex #11
Frontex · FRAN Quarterly · q4 2014
4 of 24
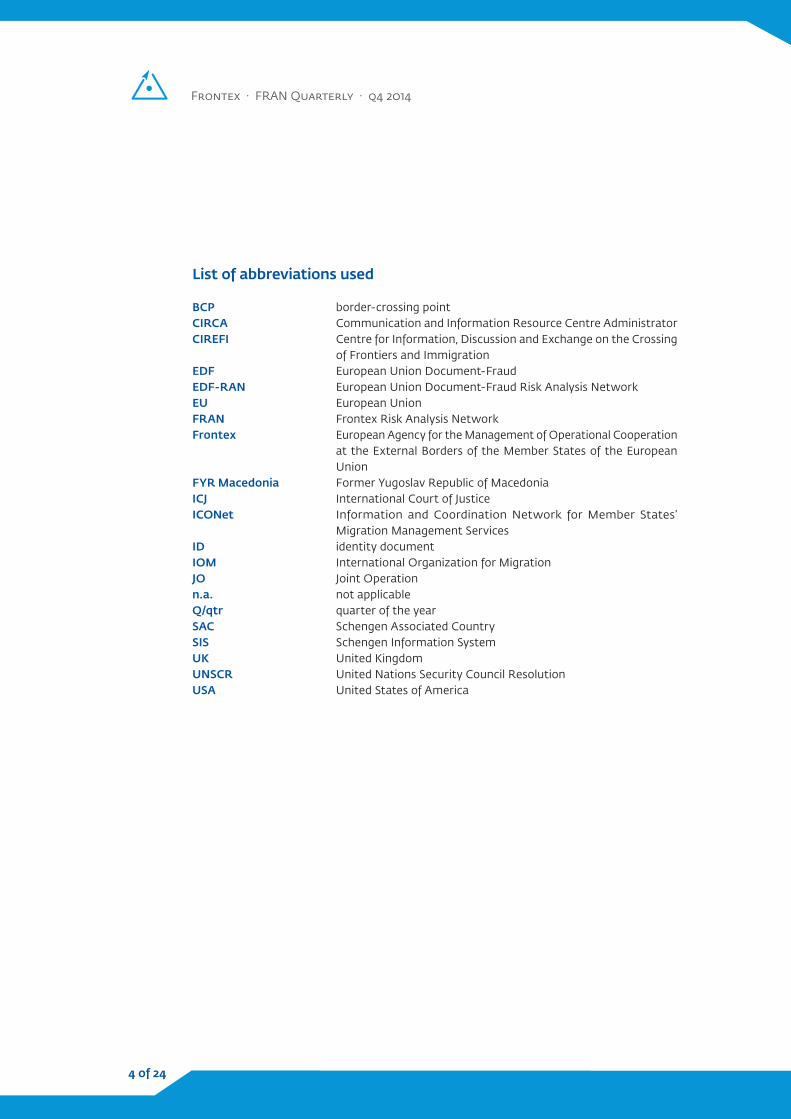
List of abbreviations used
BCP border-crossing pointEDF European Union Document-FraudEDF-RAN European Union Document-Fraud Risk Analysis NetworkEU European Union FRAN Frontex Risk Analysis NetworkFrontex European Agency for the Management of Operational Cooperation at the External Borders of the
Member States of the European UnionFYR Macedonia Former Yugoslav Republic of MacedoniaICJ International Court of JusticeID identity documentJO Joint Operationn.a. not applicableQ/qtr quarter of the yearSIS Schengen Information System UK United KingdomUNSCR United Nations Security Council ResolutionSAC Schengen Associated CountryUSA United States of AmericaIOM International Organization for MigrationICONet Information and Coordination Network for Member States’ Migration Management ServicesCIRCA Communication and Information Resource Centre AdministratorCIREFI Centre for Information, Discussion and Exchange on the Crossing of Frontiers and Immigration
List of abbreviations used
BCP border-crossing pointCIRCA Communication and Information Resource Centre AdministratorCIREFI Centre for Information, Discussion and Exchange on the Crossing
of Frontiers and ImmigrationEDF European Union Document-FraudEDF-RAN European Union Document-Fraud Risk Analysis NetworkEU European Union FRAN Frontex Risk Analysis NetworkFrontex European Agency for the Management of Operational Cooperation
at the External Borders of the Member States of the European Union
FYR Macedonia Former Yugoslav Republic of MacedoniaICJ International Court of JusticeICONet Information and Coordination Network for Member States’
Migration Management ServicesID identity documentIOM International Organization for MigrationJO Joint Operationn.a. not applicableQ/qtr quarter of the yearSAC Schengen Associated CountrySIS Schengen Information System UK United KingdomUNSCR United Nations Security Council ResolutionUSA United States of America

5 of 24
In the fourth quarter of 2014 indicators of ir-regular migration and asylum exchanged un-der the Frontex Risk Analysis Network (FRAN) changed only slightly compared the third quar-ter of 2014. Winter months tend to be marked by substantially lower migration pressure at the external borders, but in Q4 2014 detections of illegal border-crossings and illegal stay dropped less significantly and did not fall to the levels of previous winter seasons. In effect, these two indicators proved the highest out of all fourth quarters since FRAN data collection began in 2007. Compared to the same period in 2013, detections at the external borders increased by more than 160%.
While the migratory pressure at the EU’s external borders in general has not relaxed much, its distribution among particular border sections has been shifting. For instance, far more detections were reported at the West-ern Balkan route. By contrast, on the Central Mediterranean route, the number of irregular migrants detected in Q4 proved lower than the peak of Q3 2014, as the rough weather conditions at sea led to fewer migrant boats attempting the dangerous crossing.
In line with seasonal reductions in the Cen-tral Mediterranean, a lower number of irreg-ular migrants from African countries arrived in the EU in the fourth quarter. Especially Er-itreans and sub-Saharans were reported in markedly lower numbers. Syrian migrants continued to be the most reported national-ity in the Central Mediterranean, accounting for almost one-third of all detections at this border section. Their most common depar-ture countries were Libya and Turkey.
In contrast to the usual winter decline at the blue border, there was a marked increase in
the number of migrants arriving in the Cen-tral Mediterranean from Turkey over the last few months of 2014. This surge was directly related to the use of cargo ships to facilitate mainly Syrian migrants and asylum seekers. Between October and December 2014 eleven cargo ships carrying more than 4 500 mi-grants departed with the intention to reach Italy mainly from the area around Mersin in Turkey.
The border between Hungary and Serbia along the Western Balkan route has seen an unprecedented growth in irregular migra-tion since September 2014. Of over 25 000 irregular migrants reported on this route in Q4, more than 60% originated from Kosovo.* Syrian and, to a lesser extent, Palestinian and Iraqi migrants involved in secondary move-ments having initially entered the EU from Turkey added to the pressure at the Hun-garian border. In December 2014, Kosovo* citizens were for the first time the migrants most commonly detected illegally crossing the external border of the EU/Schengen area. This peak in migration from Kosovo* is four times higher than in Q2 2013, when a change in the asylum policy of Hungary introduced to harmonise it with EU standards led to a spike in migration from the Western Balkans.
Irregular migration from Kosovo* to the EU has been fuelled by the dire economic situa-tion in the country and widespread rumours among the Kosovo* population, e.g. the belief that France’s decision to remove Kosovo* from the national list of safe countries would al-legedly make it easier to obtain asylum there. Other rumours claimed that pregnant women would immediately receive asylum in Europe, or that Germany would generally issue work permits to Kosovo* citizens.
* This designation is without prejudice to positions on status, and is in line with UNSCR 1244 and the ICJ Opinion on the Kosovo declaration of independence.
Executive summary

Frontex · FRAN Quarterly · q4 2014
6 of 24
Other factors encouraging movement of Ko-sovo* citizens towards the EU are linked to cheap international bus connections from Ko-sovo* and to the recent introduction of addi-tional crossing points from Kosovo* that can be crossed with an ID card, which further fa-cilitates their travel through Serbia.
On the Eastern Mediterranean route, de-tections decreased by one-third since the comparably high summer peak of Q3 2014. While this reduction was mainly reported from the Eastern Aegean Sea, detections at the Bulgarian land border with Turkey also decreased. At this border section, however, significantly more clandestine entries to the EU/Schengen area were reported. During the reporting period, the Bulgarian author-ities reported twelve times as many detec-tions of attempted clandestine entry as one year ago, and twice as many as during the previous quarter. This increase was also con-nected to additional operational and techni-cal measures implemented along the green border between Bulgaria and Turkey.
On the Western Mediterranean route, which leads across the southern Spanish coast as well as the land borders of Ceuta and Melilla, the number of detections of illegal migra-tion from Morocco decreased by 40% since the seasonal peak reported in Q3 2014. The total numbers of detections of illegal bor-der-crossing in this region are at a similar level as one year ago, but in contrast to Q4 2013, around two-thirds were reported from the maritime border in spite of the adverse conditions. Additional measures at the land border of the Spanish exclaves of Ceuta and Melilla significantly reduced the number of illegal entries across the fence.
As regards illegal stay, in Q4 2014 Mem-ber States reported more detections than in any previous fourth quarter so far. Com-
pared to Q3 2014, the level of detections was only slightly lower during the reporting pe-riod. Most detections were not only made in the western and northern European desti-nation countries of irregular migration, but also along the transit routes across the EU, including in countries such as Spain, Aus-tria, and Bulgaria. Detections of illegal stay thus reflect the current complex picture of irregular migration to the EU in terms of en-try points, secondary routes and intended destinations.
With 2 500 reported detections of document fraud in Q4 2014, slightly more cases were reported on entry to the EU/Schengen area from third countries than during the previ-ous quarter. However, the level of detections is similar to one year ago.
At the air borders, Istanbul Atatürk Interna-tional Airport in Turkey remained the third-country embarkation airport most reported for detections of fraudulent documents. The increase of almost 50% compared to Q3 2014 points to a significant risk at the EU’s air bor-ders and marks a return to the relatively high figures recorded in the second half of 2013. Almost one third of the cases of document fraud on the routes from Istanbul involved Syrian nationals travelling on fraudulent Al-gerian, Bulgarian or French passports.
By the same token, the number of fraudu-lent document cases reported on intra-EU/SAC movements showed a slight increase compared to Q3 2014. The most significant growth of over 100% was related to Albanian nationals, who were detected in the highest numbers since the beginning of EDF data collection. Most of these cases were related to Albanian nationals on flights from Italy, France, Greece, and Germany to the UK and Ireland, predominantly using fraudulent Ital-ian, Greek and Romanian ID cards.
* This designation is without prejudice to
positions on status, and is in line with UNSCR 1244
and the ICJ Opinion on the Kosovo declaration of
independence.

7 of 24
FRAN Quarterly reports are prepared by the Frontex Risk Analysis Unit and provide a reg-ular overview of irregular migration at the EU external borders, based on the irregular-migration data exchanged among Member State border-control authorities within the cooperative framework of the Frontex Risk Analysis Network (FRAN) and its subsidiary, the European Union Document-Fraud Risk Analysis Network (EDF-RAN).
The main purpose of the FRAN Quarterlies is to provide:1. feedback to the FRAN community in the
context of information exchange;2. a periodic update to the situational pic-
ture of irregular migration at the EU level; and
3. material for constructive discussion on re-porting protocols and related trends and patterns.
This report is intended to simultaneously serve two objectives: first, to provide a clear summary of the situation at the external bor-der of the EU, and second, to serve as an ar-chive for future reference and comparative analyses. Consistent with standard archival techniques, some information is repeated among sections to serve as context.
Harmonising complex, multi-source migra-tion data among Frontex and Member States is an ongoing process. Therefore, some of the more detailed data and trends in this report should be interpreted with caution
and, where possible, cross-referenced with information from other sources. The statis-tics should be understood in the context of the different levels of passenger flows pass-ing through different border sections, the activities undertaken by Member State bor-der-control authorities to secure different border sections, and widespread variation in reporting and data-collection practices.
FRAN members, Member State risk analysis experts and border-control authorities are considered the primary customers of these reports. In addition to the discussions tak-ing place during FRAN meetings, Member State experts are invited and actively en-couraged to examine and comment upon the data and analyses presented here. De-spite all efforts of the Frontex Risk Analysis Unit and Member State experts involved in data exchange and analyses, it is conceiva-ble that minor errors will occur in these re-ports due to very challenging timelines, and the growing volume and complexity of data and other information exchanged within the FRAN community.
Due to the simultaneous release of the Annual Risk Analysis 2015 presenting a com-prehensive analysis of the situation in the whole of 2014, the current FRAN Quarterly (Q4 2014) is a short issue containing the sta-tistics and only a general overview of the developments in the reviewed period (see Executive summary).
1. Introduction
Frontex · FRAN Quarterly · q4 2014
8 of 24
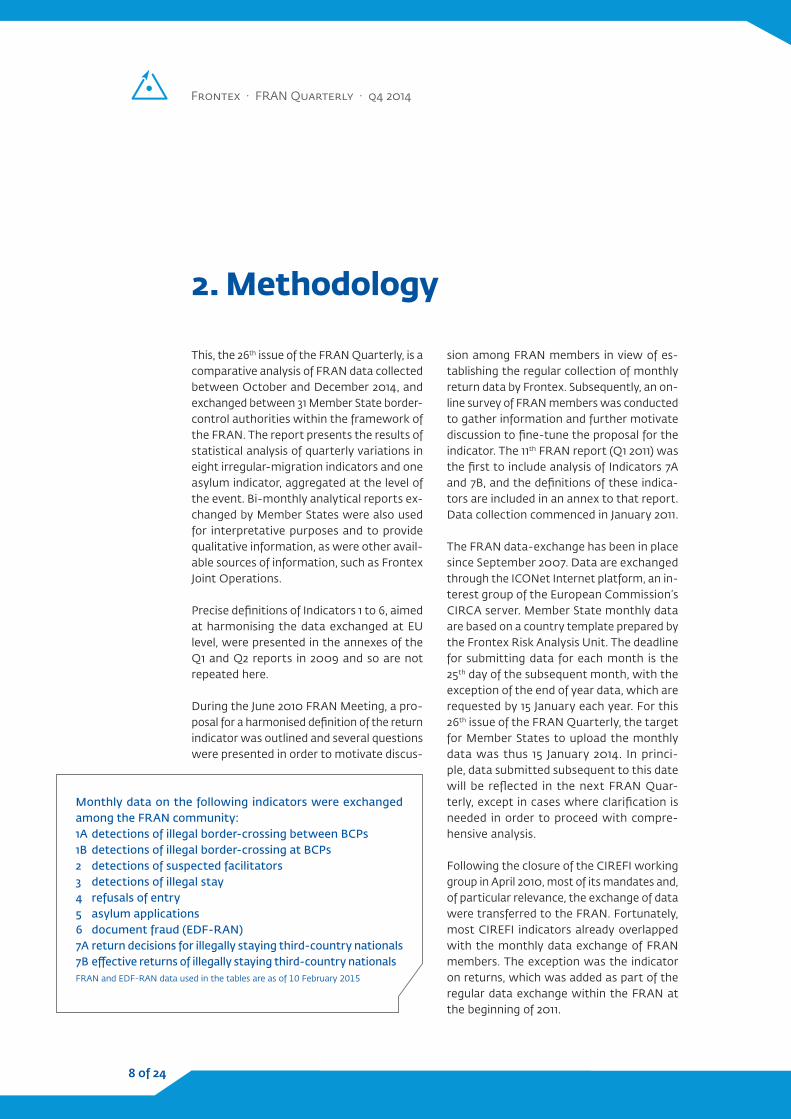
This, the 26th issue of the FRAN Quarterly, is a comparative analysis of FRAN data collected between October and December 2014, and exchanged between 31 Member State border-control authorities within the framework of the FRAN. The report presents the results of statistical analysis of quarterly variations in eight irregular-migration indicators and one asylum indicator, aggregated at the level of the event. Bi-monthly analytical reports ex-changed by Member States were also used for interpretative purposes and to provide qualitative information, as were other avail-able sources of information, such as Frontex Joint Operations.
Precise definitions of Indicators 1 to 6, aimed at harmonising the data exchanged at EU level, were presented in the annexes of the Q1 and Q2 reports in 2009 and so are not repeated here.
During the June 2010 FRAN Meeting, a pro-posal for a harmonised definition of the return indicator was outlined and several questions were presented in order to motivate discus-
sion among FRAN members in view of es-tablishing the regular collection of monthly return data by Frontex. Subsequently, an on-line survey of FRAN members was conducted to gather information and further motivate discussion to fine-tune the proposal for the indicator. The 11th FRAN report (Q1 2011) was the first to include analysis of Indicators 7A and 7B, and the definitions of these indica-tors are included in an annex to that report. Data collection commenced in January 2011.
The FRAN data-exchange has been in place since September 2007. Data are exchanged through the ICONet Internet platform, an in-terest group of the European Commission’s CIRCA server. Member State monthly data are based on a country template prepared by the Frontex Risk Analysis Unit. The deadline for submitting data for each month is the 25th day of the subsequent month, with the exception of the end of year data, which are requested by 15 January each year. For this 26th issue of the FRAN Quarterly, the target for Member States to upload the monthly data was thus 15 January 2014. In princi-ple, data submitted subsequent to this date will be reflected in the next FRAN Quar-terly, except in cases where clarification is needed in order to proceed with compre-hensive analysis.
Following the closure of the CIREFI working group in April 2010, most of its mandates and, of particular relevance, the exchange of data were transferred to the FRAN. Fortunately, most CIREFI indicators already overlapped with the monthly data exchange of FRAN members. The exception was the indicator on returns, which was added as part of the regular data exchange within the FRAN at the beginning of 2011.
2. Methodology
Monthly data on the following indicators were exchanged among the FRAN community:1A detections of illegal border-crossing between BCPs1B detections of illegal border-crossing at BCPs2 detections of suspected facilitators3 detections of illegal stay4 refusals of entry5 asylum applications6 document fraud (EDF-RAN)7A return decisions for illegally staying third-country nationals7B effective returns of illegally staying third-country nationalsFRAN and EDF-RAN data used in the tables are as of 10 February 2015

9 of 24
In January 2012, the European Union Doc-ument-Fraud Risk Analysis Network (EDF-RAN) was formed as a specialist fo-rum to oversee the exchange and analyses of detections of document fraud to illegally cross the external borders, and on all inter-national flights. Data were backdated and joined with those exchanged under a pilot Tailored Risk Analysis released in 2011.
The EDF-RAN data are checked for inconsist-encies, and corrections are made to reported totals to bring them in line with reported breakdowns. Corrections are also made to any three-letter nationality codes not pre-sent in the reference ISO list of national-ity codes.*
External borders refer to the borders be-tween Member States and third countries. The borders between the Schengen Associ-ated Countries (Norway, Iceland and Switzer-land) and third countries are also considered as external borders. The borders between the Schengen Associated Countries and Schen-gen Member States are considered as inter-nal borders. For the indicators on detections of facilitators, illegal stay and asylum, statis-tics are also reported for detections at the land borders between the Schengen Member States and Schengen candidates (Bulgaria, Cyprus, Croatia and Romania) or non-Schen-gen Member States (the UK, Ireland), so that a total for EU Member States and Schen-gen Associated Countries as a whole can
be presented. It was not possible to make this distinction for air and sea borders be-cause Member States do not habitually dif-ferentiate between extra-EU and intra-EU air and sea connections but tend to aggre-gate data for all arrivals.
When data are examined at the level of third-country nationalities, a large percentage usually falls under the category ‘Other (not specified)’ or ‘Unknown’. It is expected that the percentage reported under these cate-gories will decrease with time as Member States improve the quality and speed of their identification, data collection and reporting practices; nationalities are often reported as ‘Unknown’ if an individual’s nationality cannot be established before reports are submitted.
Acknowledgements
The Frontex Risk Analysis Unit would like to express its gratitude to all FRAN and EDF-RAN members and their associates in Member State statistical, migration and doc-ument-fraud units who collect, aggregate and exchange monthly data, and to the an-alysts who compile the bi-monthly analyt-ical reports, on which many of the detailed analyses presented here are based.
We are also grateful to Member State rep-resentatives who responded to requests for additional information on key topics and emerging trends.
* http://www.iso.org

Frontex · FRAN Quarterly · q4 2014
10 of 24
3. Summary of FRAN indicators
0
20
40
60
80
100
120
Q1 Q2 Q3 Q4 Q1 Q2 Q3 Q4 Q1 Q2 Q3 Q4 Q1 Q2 Q3 Q4 2011 2012 2013 2014
70
80
90
100
110
120
130
Q1 Q2 Q3 Q4 Q1 Q2 Q3 Q4 Q1 Q2 Q3 Q4 Q1 Q2 Q3 Q4 2011 2012 2013 2014
40
60
80
100
120
140
160
180
Q1 Q2 Q3 Q4 Q1 Q2 Q3 Q4 Q1 Q2 Q3 Q4 Q1 Q2 Q3 Q4 2011 2012 2013 2014
1.0 1.2 1.4 1.6 1.8 2.0 2.2 2.4 2.6 2.8 3.0
Q1 Q2 Q3 Q4 Q1 Q2 Q3 Q4 Q1 Q2 Q3 Q4 Q1 Q2 Q3 Q4 2011 2012 2013 2014
22
24
26
28
30
32
34
36
38
Q1 Q2 Q3 Q4 Q1 Q2 Q3 Q4 Q1 Q2 Q3 Q4 Q1 Q2 Q3 Q4 2011 2012 2013 2014
32
34
36
38
40
42
44
Q1 Q2 Q3 Q4 Q1 Q2 Q3 Q4 Q1 Q2 Q3 Q4 Q1 Q2 Q3 Q4 2011 2012 2013 2014
1A Illegal entries between BCPs 2 Facilitators
3 Illegal stay 4 Refusals of entry
5 Applications for asylum 7B E�ective returns
Figure 1. Evolution of FRAN indicatorsDetections reported by Member States, thousands of persons
Line sections in lighter blue mark changes between third and fourth quarters
Source: FRAN data as of 10 February 2015

11 of 24
LEGEND
Symbols and abbreviations: n.a. not applicable : data not available
Source: FRAN and EDF-RAN data as of 10 February 2015, unless otherwise indicated
Note: ‘Member States’ in the tables refer to FRAN Member States, including both 28 EU Member States and three Schengen Associated Countries
4. Statistical annex

Frontex · FRAN Quarterly · q4 2014
12 of 24
Annex Table 1. Illegal border-crossing between BCPsDetections reported by border type and nationality at the external borders
2014 Q42013 2014 % change on per cent
of totalQ3 Q4 Q1 Q2 Q3 Q4 year ago prev. Qtr
All Borders
Syria 11 917 9 597 4 771 14 090 37 894 22 414 134 -41 28Kosovo* 926 387 507 689 3 304 17 569 4 440 432 22Afghanistan 2 675 3 845 2 054 2 916 7 854 9 308 142 19 12Albania 2 094 2 630 1 505 2 239 2 372 3 207 22 35 4Gambia 844 1 332 1 340 2 134 2 684 2 572 93 -4.2 3.2Unspecified sub-Saharan nationals 0 0 619 11 093 12 139 2 490 n.a. -79 3.1
Palestine 609 996 172 882 3 953 2 395 140 -39 3Somalia 2 978 699 1 297 1 906 2 282 2 191 213 -4 2.7Nigeria 2 161 880 631 2 054 3 847 2 183 148 -43 2.7Senegal 628 741 848 803 1 088 2 050 177 88 2.6Others 17 957 8 942 8 294 30 061 35 101 13 730 54 -61 17
Total All Borders 42 789 30 049 22 038 68 867 112 518 80 109 167 -29 100
Land Borders
Kosovo* 926 387 507 689 3 304 17 569 4440 432 52Syria 3 148 3 902 1 373 1 599 4 330 5 169 32 19 15Afghanistan 708 2 713 1 362 1 062 2 181 4 840 78 122 14Albania 2 052 2 581 1 470 2 221 2 370 3 207 24 35 9.5Iraq 188 86 41 80 292 526 512 80 1.6Palestine 193 232 29 92 361 502 116 39 1.5Pakistan 1 057 239 71 89 107 288 21 169 0.8Bangladesh 296 124 31 27 78 175 41 124 0.5Georgia 92 73 48 56 53 103 41 94 0.3Serbia 61 57 80 63 118 95 67 -19 0.3Others 4 481 2 992 2 140 1 734 1 392 1 414 -53 1.6 4.2
Total Land Border 13 202 13 386 7 152 7 712 14 586 33 888 153 132 100
Sea Borders
Syria 8 769 5 695 3 398 12 491 33 564 17 245 203 -49 37Afghanistan 1 967 1 132 692 1 854 5 673 4 468 295 -21 9.7Gambia 824 1 314 1 328 2 101 2 655 2 558 95 -3.7 5.5Unspecified sub-Saharan nationals 0 0 619 11 093 12 139 2 490 n.a. -79 5.4
Somalia 2 807 547 1 223 1 827 2 242 2 148 293 -4.2 4.6Nigeria 1 863 792 609 1 989 3 780 2 112 167 -44 4.6Senegal 522 668 839 803 1 084 2 043 206 88 4.4Eritrea 6 619 2 433 1 774 16 941 13 637 1 971 -19 -86 4.3Palestine 416 764 143 790 3 592 1 893 148 -47 4.1Mali 881 734 1 909 3 831 2 580 1 469 100 -43 3.2Others 4 919 2 584 2 352 7 435 16 986 7 824 203 -54 17
Total Sea Border 29 587 16 663 14 886 61 155 97 932 46 221 177 -53 100
* This designation is without prejudice to positions on status, and is in line with UNSCR 1244 and the ICJ Opinion on the Kosovo declaration of independence

13 of 24
Annex Table 2. Clandestine entries at BCPsDetections reported by border type and top ten nationalities
2014 Q4
2013 2014 % change onper cent of totalQ3 Q4 Q1 Q2 Q3 Q4 year ago prev. Qtr
Place of Detection
Land 56 208 301 589 949 1 133 445 19 98Sea 3 12 10 35 16 19 58 19 1.6
Top Ten Nationalities
Syria 24 112 79 250 247 515 360 109 45Afghanistan 13 33 35 138 411 438 1 227 6.6 38Iraq 2 0 4 6 5 70 n.a. 1 300 6.1Pakistan 0 13 10 9 12 32 146 167 2.8Algeria 1 4 9 52 41 18 350 -56 1.6Myanmar 0 2 2 25 39 17 750 -56 1.5Guinea 0 3 10 17 25 14 367 -44 1.2Albania 0 0 4 0 0 9 n.a. n.a. 0.8Iran 0 1 4 4 17 8 700 -53 0.7Somalia 0 0 11 2 8 6 n.a. -25 0.5Others 19 52 143 121 160 25 -52 -84 2.2
Total 59 220 311 624 965 1 152 424 19 100

Frontex · FRAN Quarterly · q4 2014
14 of 24
Annex Table 3. FacilitatorsDetections reported by place of detection and top ten nationalities
2014 Q4
2013 2014 % change onper cent of totalQ3 Q4 Q1 Q2 Q3 Q4 year ago prev. Qtr
Place of DetectionInland 1 298 1 281 1 178 1 932 1 742 1 976 54 13.0 72Land 191 177 227 215 465 307 73 -34 11Land Intra-EU 158 203 249 170 195 197 -3 1 7.1Sea 115 78 144 155 177 109 40 -38 3.9Air 54 72 95 79 77 88 22 14 3.2Not specified 81 99 125 90 157 85 -14 -46 3.1
Top Ten NationalitiesMorocco 105 95 91 222 334 312 228 -6.6 11Not specified 200 183 85 147 212 237 30 12 8.6Albania 86 72 87 96 94 136 89.0 45 4.9Syria 70 49 62 100 109 127 159 17 4.6Italy 187 129 137 134 99 117 -9.3 18 4.2Spain 41 72 117 167 110 116 61 5.5 4.2France 59 71 100 115 99 103 45 4 3.7China 51 145 37 81 69 98 -32 42 3.5Turkey 64 53 72 99 135 90 70 -33 3.3Egypt 233 91 51 99 112 90 -1.1 -20 3.3Others 801 950 1 179 1 381 1 440 1 336 41 -7.2 48
Total 1 897 1 910 2 018 2 641 2 813 2 762 45 -1.8 100
Annex Table 4. Illegal stayDetections reported by place of detection and top ten nationalities
2014 Q42013 2014 % change on per cent
of totalQ3 Q4 Q1 Q2 Q3 Q4 year ago prev. Qtr
Place of Detection
Inland 76 059 78 748 74 930 88 901 111 411 108 265 37 -2.8 87Air 8 329 7 608 6 998 6 931 10 199 9 661 27 -5.3 7.8Land 4 786 4 052 2 779 3 192 5 207 4 167 2.8 -20 3.3Not specified 4 13 32 726 530 1 084 8238 105 0.9Land Intra-EU 985 1 300 960 921 1 028 1 020 -22 -0.8 0.8Sea 236 319 123 139 276 140 -56.0 -49 0.1
Top Ten Nationalities
Syria 8 206 10 698 11 159 14 771 25 924 22 869 114 -12 18Afghanistan 4 113 4 603 4 866 3 741 6 141 8 645 88 41 6.9Kosovo* 1 611 1 453 1 327 1 134 1 471 6 968 380 374.0 5.6Morocco 6 600 6 230 6 123 6 082 6 595 6 529 4.8 -1 5.2Eritrea 3 290 3 357 2 220 12 072 13 677 6 508 94 -52 5.2Albania 4 057 4 770 4 483 4 688 4 733 6 379 34 35 5.1Not specified 6 531 5 977 4 261 6 135 8 400 5 665 -5.2 -33 4.6Ukraine 3 400 3 322 2 828 3 456 5 029 5 431 63 8.0 4.4Algeria 3 430 3 631 3 591 3 006 3 154 3 242 -11 2.8 2.6Iraq 1 446 1 415 1 333 1 402 2 038 3 004 112.0 47 2.4Others 47 793 46 702 45 423 44 451 51 665 49 161 5.3 -4.8 40
Total 90 477 92 158 87 614 100 938 128 827 124 401 35 -3.4 100
* This designation is without prejudice to positions on status, and is in line with UNSCR 1244 and the ICJ Opinion on the Kosovo declaration of independence

15 of 24
Annex Table 5. Refusals of entryRefusals reported by border type and nationality at the external borders
2014 Q42013 2014 % change on per cent
of totalQ3 Q4 Q1 Q2 Q3 Q4 year ago prev. Qtr
All BordersUkraine 4 424 4 109 3 176 3 854 5 201 4 578 11 -12 15Albania 3 225 2 855 2 978 3 343 3 028 3 650 28 21 12Russian Federation 5 993 3 110 2 076 2 534 3 351 2 815 -9.5 -16 9Serbia 2 105 2 449 2 151 2 075 2 154 2 277 -7 5.7 7.3Georgia 1 777 1 672 803 961 1 223 2 113 26 73 6.7Belarus 1 102 1 279 1 117 1 191 1 470 1 394 9 -5.2 4.4Bosnia and Herzegovina 1 348 1 111 1 027 944 1 060 979 -12 -7.6 3.1Morocco 1 506 1 187 1 392 1 063 1 122 862 -27 -23 2.7Algeria 446 591 643 753 623 711 20 14 2.3Turkey 1 187 686 645 597 1 137 669 -2.5 -41 2.1Others 10 584 10 477 9 249 9 820 10 773 11 305 7.9 4.9 36
Total All Borders 33 697 29 526 25 257 27 135 31 142 31 353 6.2 0.7 100Land BordersUkraine 4 159 3 835 2 997 3 481 4 842 4 253 11 -12 24Russian Federation 5 255 2 635 1 718 2 048 2 818 2 429 -7.8 -14 14Serbia 1 923 2 284 1 933 1 852 1 978 2 105 -7.8 6.4 12Georgia 1 701 1 563 701 860 1 141 2 014 29 77 11Albania 1 919 1 535 1 443 1 883 1 782 1 897 24 6.5 11Belarus 1 042 1 243 1 088 1 158 1 405 1 358 9.3 -3.3 7.6Bosnia and Herzegovina 1 304 1 071 986 912 1 014 931 -13 -8.2 5.2Morocco 1 114 852 1 012 697 735 531 -38 -28 3Armenia 372 421 184 127 252 457 8.6 81 2.6FYR Macedonia 441 406 435 399 466 407 0.2 -13 2.3Others 1 688 1 002 786 958 1 786 1 442 44 -19 8.1
Total Land Border 20 918 16 847 13 283 14 375 18 219 17 824 5.8 -2.2 100Air BordersAlbania 735 953 1 012 923 710 1 115 17 57 9Algeria 427 578 624 724 602 692 20 15 5.6Brazil 542 600 602 606 439 628 4.7 43 5.1USA 682 541 549 609 622 527 -2.6 -15 4.3Not specified 395 548 445 375 326 522 -4.7 60 4.2Nigeria 414 513 351 389 420 493 -3.9 17 4China 311 226 226 291 472 433 92 -8.3 3.5Russian Federation 572 446 331 415 467 375 -16 -20 3India 206 205 200 260 364 357 74 -1.9 2.9Ukraine 228 256 175 315 330 299 17 -9.4 2.4Others 6 481 6 916 6 444 6 611 6 713 6 909 -0.1 2.9 56
Total Air Border 10 993 11 782 10 959 11 518 11 465 12 350 4.8 7.7 100Sea BordersAlbania 571 367 523 537 536 638 74 19 54Morocco 154 89 153 145 172 101 13 -41 8.6Tunisia 33 31 33 25 35 43 39 23 3.6Syria 60 15 12 27 53 41 173 -23 3.5Not specified 58 31 36 26 36 28 -9.7 -22 2.4Ukraine 37 18 4 58 29 26 44 -10 2.2India 28 19 14 13 34 22 16 -35 1.9Algeria 16 12 14 23 18 17 42 -5.6 1.4FYR Macedonia 19 7 16 10 13 16 129 23 1.4Iraq 16 15 7 21 26 16 6.7 -38 1.4Others 794 293 203 357 506 231 -21 -54 20
Total Sea Border 1 786 897 1 015 1 242 1 458 1 179 31 -19 100

Frontex · FRAN Quarterly · q4 2014
16 of 24
Annex Table 6. Refusals of entryRefusals of entry at the external borders reported by reasons for refusal and top ten nationalities
Refused persons
Total
2014 Q4 – Reasons for refusals of entry (see description below) Total Reasons
A B C D E F G H I n.a.
Top Ten Nationalities
Ukraine 4 578 29 28 1 403 4 1 612 459 350 220 14 465 4 584Albania 3 650 30 29 50 2 866 149 708 1 473 63 309 3 679Russian Federation 2 815 25 7 2 058 8 217 89 82 44 173 134 2 837Serbia 2 277 31 8 81 1 633 603 341 503 71 11 2 283Georgia 2 113 4 2 1 986 6 82 2 14 20 3 3 2 122Belarus 1 394 37 0 724 0 173 88 90 50 88 152 1 402Bosnia and Herzegovina 979 176 0 15 0 34 23 365 330 26 11 980Morocco 862 218 28 179 28 96 1 44 188 84 20 886Algeria 711 11 11 83 5 318 2 254 2 2 25 713Turkey 669 31 2 396 10 97 57 26 24 7 27 677Others 11 305 662 430 2 764 223 2 586 424 695 516 163 3 107 11 570
Total 31 353 1 254 545 9 739 287 6 714 1 897 2 969 3 370 694 4 264 31 733
Descriptions of the reasons for refusal of entry:A has no valid travel document(s);B has a false/counterfeit/forged travel document;C has no valid visa or residence permit;D has a false/counterfeit/forged visa or residence permit;E has no appropriate documentation justifying the purpose and conditions of stay;F has already stayed for three months during a six months period on the territory of the Member States of the EU;G does not have sufficient means of subsistence in relation to the period and form of stay, or the means to return to the country of origin or transit;H is a person for whom an alert has been issued for the purposes of refusing entry in the SIS or in the national register;I is considered to be a threat for public policy, internal security, public health or the international relations of one or more Member States of the EU.

17 of 24
Annex Table 7. Refusals of entryRefusals of entry at the external borders by reasons for refusal
2014 Q42013 2014 % change on per cent
of total Highest shareQ3 Q4 Q1 Q2 Q3 Q4 year ago prev. Qtr
All Borders NationalityC) No valid visa 13 419 9 313 6 754 8 173 10 175 9 739 4.6 -4.3 31 Russian Federation (21%)E) No justification 6 712 6 700 5 720 6 145 5 988 6 714 0.2 12 21 Ukraine (24%)Reason not available 3 313 3 449 2 730 3 291 4 487 4 264 24 -5 13 Ukraine (11%)H) Alert issued 2 689 2 202 2 904 3 106 3 302 3 370 53 2.1 11 Albania (44%)G) No subsistence 3 089 3 108 2 574 2 789 2 538 2 969 -4.5 17 9.4 Albania (24%)F) Over 3-month stay 1 130 1 827 1 806 1 575 1 941 1 897 3.8 -2.3 6 Serbia (32%)A) No valid document 2 506 1 897 1 669 1 657 1 753 1 254 -34 -28 4 Morocco (17%)I) Threat 695 528 662 749 648 694 31 7.1 2.2 Russian Federation (25%)B) False document 696 606 548 563 396 545 -10 38 1.7 Not specified (19%)D) False visa 326 571 295 303 254 287 -50 13 0.9 Morocco (9.8%)
Total All Borders 34 575 30 201 25 662 28 351 31 482 31 733 5.1 0.8 100Land Borders NationalityC) No valid visa 10 704 7 130 4 763 5 437 7 490 7 505 5.3 0.2 42 Georgia (26%)E) No justification 3 556 3 073 2 184 2 431 3 030 3 043 -1 0.4 17 Ukraine (50%)H) Alert issued 1 828 1 396 1 972 2 184 2 434 2 504 79 2.9 14 Albania (42%)G) No subsistence 2 297 2 069 1 643 1 783 1 554 1 614 -22 3.9 9 Albania (25%)F) Over 3-month stay 824 1 538 1 258 1 211 1 578 1 519 -1.2 -3.7 8.5 Serbia (38%)Reason not available 243 251 7 185 665 570 127 -14 3.2 Ukraine (63%)A) No valid document 1 517 1 061 958 838 921 558 -47 -39 3.1 Morocco (37%)I) Threat 308 282 393 366 423 433 54 2.4 2.4 Russian Federation (35%)B) False document 171 111 133 101 97 62 -44 -36 0.3 Ukraine (42%)D) False visa 57 246 49 43 44 40 -84 -9.1 0.2 Morocco (15%)
Total Land Border 21 505 17 157 13 360 14 579 18 236 17 848 4 -2.1 100Air Borders NationalityReason not available 2 932 3 075 2 605 2 912 3 617 3 507 14 -3 28 United States (13%)E) No justification 2 859 3 466 3 320 3 447 2 674 3 444 -0.6 29 27 Albania (13%)C) No valid visa 2 288 2 030 1 889 2 554 2 457 2 129 4.9 -13 17 Russian Federation (8.3%)G) No subsistence 718 973 811 861 860 1 117 15 30 8.8 Algeria (23%)H) Alert issued 536 596 623 707 599 627 5.2 4.7 4.9 Albania (37%)A) No valid document 581 698 612 658 582 591 -15 1.5 4.7 Not specified (30%)B) False document 492 491 401 453 279 467 -4.9 67 3.7 Not specified (20%)F) Over 3-month stay 281 260 486 353 349 377 45 8 3 Turkey (11%)I) Threat 356 228 246 353 185 230 0.9 24 1.8 Suriname (17%)D) False visa 235 311 220 233 184 217 -30 18 1.7 Senegal (8.8%)
Total Air Border 11 278 12 128 11 213 12 531 11 786 12 706 4.8 7.8 100Sea Borders NationalityH) Alert issued 325 209 259 215 269 239 14 -11 20 Albania (75%)G) No subsistence 74 66 119 145 124 238 261 92 20 Albania (84%)E) No justification 297 161 209 267 284 227 41 -20 19 Albania (71%)Reason not available 138 123 118 194 205 187 52 -8.8 16 Albania (36%)A) No valid document 408 138 99 161 250 105 -24 -58 8.9 Syria (11%)C) No valid visa 427 150 95 182 228 105 -30 -54 8.9 Tunisia (18%)I) Threat 31 18 23 30 40 31 72 -23 2.6 Albania (84%)D) False visa 34 14 23 27 26 30 114 15 2.5 Syria (47%)B) False document 33 4 10 9 20 16 300 -20 1.4 Not specified (44%)F) Over 3-month stay 25 29 62 11 14 1 -97 -93 0.1 Turkey (100%)
Total Sea Border 1 792 912 1 017 1 241 1 460 1 179 29 -19 100

Frontex · FRAN Quarterly · q4 2014
18 of 24
Annex Table 8. Applications for asylumApplications for international protection reported by top ten nationalities
2014 Q42013 2014 % change on per cent
of totalQ3 Q4 Q1 Q2 Q3 Q4 year ago prev. Qtr
Top Ten Nationalities
Syria 13 963 19 852 18 001 22 259 40 752 40 240 103 -1.3 22Kosovo* 3 548 2 347 2 093 1 839 5 473 24 066 925 340 13Afghanistan 5 679 7 131 7 994 6 708 10 347 14 611 105 41 8.1Not specified 5 674 6 289 3 737 5 988 9 658 9 621 53 -0.4 5.3Eritrea 6 631 7 029 3 747 14 020 18 900 8 372 19 -56 4.6Serbia 4 509 5 739 4 151 3 109 6 309 7 132 24 13 3.9Nigeria 2 672 2 224 3 094 4 617 5 401 5 783 160 7.1 3.2Iraq 2 681 2 605 2 671 2 719 5 271 5 501 111 4.4 3Pakistan 4 551 3 399 4 331 4 116 5 097 5 386 58 5.7 3Ukraine 218 200 799 2 104 4 372 5 098 2449 17 2.8Others 47 081 42 967 43 323 45 850 52 490 54 905 28.0 4.6 30
Total 97 207 99 782 93 941 113 329 164 070 180 715 81 10 100
* This designation is without prejudice to positions on status, and is in line with UNSCR 1244 and the ICJ Opinion on the Kosovo declaration of independence
Annex Table 9. Document fraudFraudulent documents detected at BCPs reported by FRAN Members by border type and top ten nationalities
2014 Q42013 2014 % change on
per cent of total Highest shareQ3 Q4 Q1 Q2 Q3 Q4 year ago prev.
Qtr
Border Type Nationality Claimed
Air 1 674 1 794 1 677 1 548 1 523 1 729 -3.6 14 69 Syria (13%)Land 531 531 432 607 749 696 31 -7.1 28 Morocco (25%)Sea 219 133 110 127 114 74 -44 -35 3 Syria (35%)Not specified 9 0 0 31 2 1 n.a. -50 0 UK (100%)
Top Ten Nationalities Claimed Nationality of Document
Syria 237 361 243 449 348 407 13 17 16 Spain (39%)Not specified 334 235 163 181 163 235 0 44 9.4 France (51%)Morocco 229 184 143 120 282 222 21 -21 8.9 Spain (83%)Iraq 46 37 62 32 87 157 324 80 6.3 Italy (32%)Albania 223 207 190 133 115 136 -34 18 5.4 Greece (42%)Nigeria 111 160 141 137 106 132 -18 25 5.3 UK (37%)Ukraine 159 143 109 132 160 118 -17 -26 4.7 Poland (70%)Iran 66 68 57 56 75 75 10 0 3 Austria (43%)Senegal 58 61 54 66 43 71 16 65 2.8 Spain (72%)Turkey 62 44 97 24 110 63 43 -43 2.5 Spain (46%)Others 908 958 960 983 899 884 -7.7 -1.7 35 Spain (23%)
Total 2 433 2 458 2 219 2 313 2 388 2 500 1.7 4.7 100

19 of 24
Annex Table 10. Document fraudFalse documents detected at BCPs reported by type of document and type of fraud
2014 Q42013 2014 % change on
per cent of total Highest shareQ3 Q4 Q1 Q2 Q3 Q4 year ago prev. Qtr
Document Type Nationality of DocumentPassports 1 267 1 228 1 120 1 269 1 233 1 331 8.4 7.9 46 Morocco (13%)Forged 498 545 474 481 529 571 4.8 7.9 43 Algeria (6.1%)Authentic 468 367 357 456 449 424 16 -5.6 32 Morocco (35%)Counterfeit 171 186 157 182 144 180 -3 25 14 Israel (39%)No more details 112 105 115 137 79 127 21 61 10 France (13%)Stolen blank 18 24 17 12 32 29 21 -9.4 2.2 Italy (31%)Pseudo 0 1 0 1 0 0 -100 n.a. 0
ID cards 265 303 285 359 340 430 42 26 15 Spain (22%)Counterfeit 87 103 109 122 126 158 53 25 37 Greece (18%)Authentic 107 115 103 145 142 123 7.0 -13 29 Spain (62%)No more details 29 17 10 17 16 59 247 269 14 Not specified (34%)Forged 30 44 42 41 30 44 0 47 10 Italy (43%)Stolen blank 12 23 20 34 25 43 87 72 10 Italy (100%)Pseudo 0 1 1 0 1 3 200 200 0.7 Italy (100%)
Visa 464 446 354 373 440 449 0.7 2.0 16 France (29%)Counterfeit 208 169 172 194 236 234 38 -0.8 52 France (42%)Authentic 149 191 118 119 150 160 -16 6.7 36 Poland (56%)Forged 65 44 42 40 38 34 -23 -11 7.6 Italy (44%)No more details 31 35 19 18 10 20 -43 100 4.5 Not specified (40%)Stolen blank 11 7 3 2 6 1 -86 -83 0 Greece (100%)Residence permits 404 477 384 365 380 377 -21 -0.8 13 Spain (18%)Counterfeit 144 201 166 178 165 161 -20 -2.4 43 Spain (18%)Authentic 128 99 112 102 110 82 -17 -25 22 Spain (37%)Forged 37 67 28 19 26 48 -28 85 13 Italy (44%)Stolen blank 69 68 67 35 42 45 -34 7.1 12 Greece (69%)No more details 25 42 11 30 36 41 -2.4 14 11 France (29%)Pseudo 1 0 0 1 1 0 n.a. -100 0
Stamps 368 288 281 289 255 222 -23 -13 7.7 Greece (32%)Counterfeit 298 250 228 199 190 167 -33 -12 75 Greece (38%)Forged 61 36 49 75 60 44 22 -27 20 Poland (18%)No more details 9 2 4 15 5 11 450 120 5.0 France (27%)Other 42 50 50 61 63 59 18.0 -6 2.1 Italy (29%)Counterfeit 25 27 31 37 46 33 22 -28 56 Italy (42%)Authentic 11 16 13 11 10 11 -31 10 19 Spain (36%)No more details 2 0 0 5 0 10 n.a. n.a. 17 Not specified (80%)Forged 3 3 4 4 6 4 33 -33 6.8 United States (25%)Pseudo 0 4 2 4 0 1 -75 n.a. 1.7 Maldives (100%)Stolen blank 1 0 0 0 1 0 n.a. -100 0
Total 2 810 2 792 2 474 2 716 2 711 2 868 5.8 2.7
Frontex · FRAN Quarterly · q4 2014
20 of 24
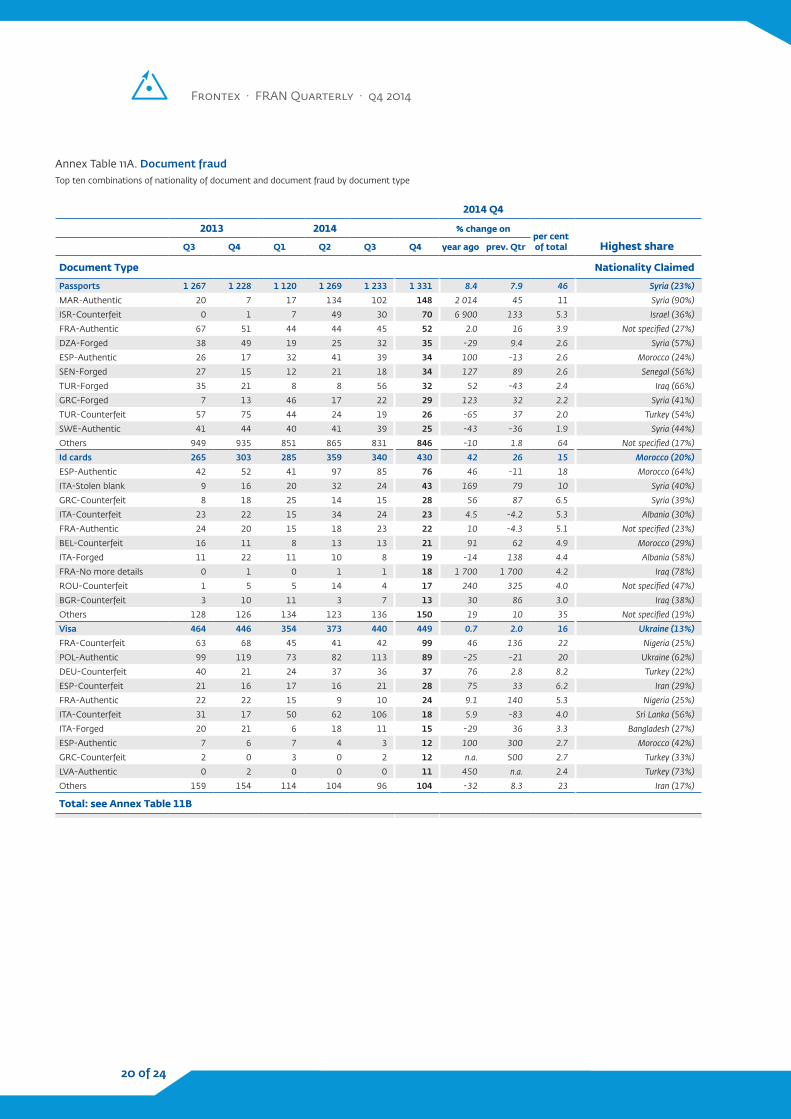
Annex Table 11A. Document fraudTop ten combinations of nationality of document and document fraud by document type
2014 Q4
2013 2014 % change onper cent of total Highest shareQ3 Q4 Q1 Q2 Q3 Q4 year ago prev. Qtr
Document Type Nationality Claimed
Passports 1 267 1 228 1 120 1 269 1 233 1 331 8.4 7.9 46 Syria (23%)MAR-Authentic 20 7 17 134 102 148 2 014 45 11 Syria (90%)ISR-Counterfeit 0 1 7 49 30 70 6 900 133 5.3 Israel (36%)FRA-Authentic 67 51 44 44 45 52 2.0 16 3.9 Not specified (27%)DZA-Forged 38 49 19 25 32 35 -29 9.4 2.6 Syria (57%)ESP-Authentic 26 17 32 41 39 34 100 -13 2.6 Morocco (24%)SEN-Forged 27 15 12 21 18 34 127 89 2.6 Senegal (56%)TUR-Forged 35 21 8 8 56 32 52 -43 2.4 Iraq (66%)GRC-Forged 7 13 46 17 22 29 123 32 2.2 Syria (41%)TUR-Counterfeit 57 75 44 24 19 26 -65 37 2.0 Turkey (54%)SWE-Authentic 41 44 40 41 39 25 -43 -36 1.9 Syria (44%)Others 949 935 851 865 831 846 -10 1.8 64 Not specified (17%)Id cards 265 303 285 359 340 430 42 26 15 Morocco (20%)ESP-Authentic 42 52 41 97 85 76 46 -11 18 Morocco (64%)ITA-Stolen blank 9 16 20 32 24 43 169 79 10 Syria (40%)GRC-Counterfeit 8 18 25 14 15 28 56 87 6.5 Syria (39%)ITA-Counterfeit 23 22 15 34 24 23 4.5 -4.2 5.3 Albania (30%)FRA-Authentic 24 20 15 18 23 22 10 -4.3 5.1 Not specified (23%)BEL-Counterfeit 16 11 8 13 13 21 91 62 4.9 Morocco (29%)ITA-Forged 11 22 11 10 8 19 -14 138 4.4 Albania (58%)FRA-No more details 0 1 0 1 1 18 1 700 1 700 4.2 Iraq (78%)ROU-Counterfeit 1 5 5 14 4 17 240 325 4.0 Not specified (47%)BGR-Counterfeit 3 10 11 3 7 13 30 86 3.0 Iraq (38%)Others 128 126 134 123 136 150 19 10 35 Not specified (19%)Visa 464 446 354 373 440 449 0.7 2.0 16 Ukraine (13%)FRA-Counterfeit 63 68 45 41 42 99 46 136 22 Nigeria (25%)POL-Authentic 99 119 73 82 113 89 -25 -21 20 Ukraine (62%)DEU-Counterfeit 40 21 24 37 36 37 76 2.8 8.2 Turkey (22%)ESP-Counterfeit 21 16 17 16 21 28 75 33 6.2 Iran (29%)FRA-Authentic 22 22 15 9 10 24 9.1 140 5.3 Nigeria (25%)ITA-Counterfeit 31 17 50 62 106 18 5.9 -83 4.0 Sri Lanka (56%)ITA-Forged 20 21 6 18 11 15 -29 36 3.3 Bangladesh (27%)ESP-Authentic 7 6 7 4 3 12 100 300 2.7 Morocco (42%)GRC-Counterfeit 2 0 3 0 2 12 n.a. 500 2.7 Turkey (33%)LVA-Authentic 0 2 0 0 0 11 450 n.a. 2.4 Turkey (73%)Others 159 154 114 104 96 104 -32 8.3 23 Iran (17%)
Total: see Annex Table 11B

21 of 24
2014 Q4
2013 2014 % change onper cent of total Highest shareQ3 Q4 Q1 Q2 Q3 Q4 year ago prev. Qtr
Document Type Nationality Claimed
Residence permits 404 477 384 365 380 377 -21 -0.8 13 Morocco (19%)GRC-Stolen blank 50 58 47 10 25 31 -47 24 8.2 Syria (52%)ESP-Authentic 43 29 28 19 33 30 3.4 -9.1 8.0 Morocco (40%)ESP-Counterfeit 14 49 39 35 45 29 -41 -36 7.7 Morocco (38%)BEL-Counterfeit 19 23 22 10 20 25 8.7 25 6.6 Morocco (28%)ITA-Counterfeit 32 34 29 40 20 24 -29 20 6.4 Morocco (21%)FRA-Authentic 58 35 40 38 34 23 -34 -32 6.1 Not specified (65%)ITA-Forged 5 12 8 3 6 21 75 250 5.6 Morocco (38%)CYP-Counterfeit 0 6 0 1 5 15 150 200 4.0 Ghana (47%)GRC-Counterfeit 20 34 44 26 30 12 -65 -60 3.2 Pakistan (25%)FRA-Counterfeit 20 15 5 18 21 12 -20 -43 3.2 Tunisia (33%)Others 143 182 122 165 141 155 -15 10 41 Morocco (15%)Stamps 368 288 281 289 255 222 -23 -13 7.7 Albania (27%)GRC-Counterfeit 159 131 106 92 60 64 -51 6.7 29 Albania (84%)POL-Counterfeit 30 19 16 18 18 16 -16 -11 7.2 Ukraine (100%)ESP-Counterfeit 9 7 7 8 5 14 100 180 6.3 Dominican Republic (21%)FRA-Counterfeit 24 9 9 12 12 11 22 -8.3 5.0 Iran (18%)ITA-Counterfeit 13 13 13 6 13 10 -23 -23 4.5 Sri Lanka (40%)DEU-Counterfeit 3 6 6 7 1 10 67 900 4.5 Armenia (20%)ISR-Counterfeit 0 0 2 0 0 9 n.a. n.a. 4.1 Israel (100%)POL-Forged 13 4 5 4 8 8 100 0 3.6 Ukraine (88%)HUN-Forged 9 3 7 12 13 6 100 -54 2.7 Serbia (67%)HUN-Counterfeit 9 2 10 8 12 5 150 -58 2.3 Ukraine (40%)Others 99 94 100 122 113 69 -27 -39 31 Ukraine (23%)Other 42 50 50 61 63 59 18 -6.3 2.1 Morocco (15%)ITA-Counterfeit 16 12 10 9 25 14 17 -44 24 Morocco (21%)FALSE-COUNTER-No more details 0 0 0 0 0 7 n.a. n.a. 12 Not specified (71%)
ESP-Authentic 0 0 0 0 0 4 n.a. n.a. 6.8 Morocco (50%)GRC-Counterfeit 0 0 4 2 2 3 n.a. 50 5.1 Morocco (67%)ROU-Counterfeit 0 0 0 0 0 3 n.a. n.a. 5.1 Albania (33%)ITA-Authentic 9 16 3 8 8 3 -81 -63 5.1 Bangladesh (67%)GTM-Counterfeit 0 0 0 0 0 2 n.a. n.a. 3.4 Colombia (50%)BGR-Counterfeit 0 4 1 0 1 2 -50 100 3.4 Morocco (50%)Unknown-Authentic 0 0 0 0 0 2 n.a. n.a. 3.4 Not specified (100%)POL-No more details 0 0 0 0 0 2 n.a. n.a. 3.4 Ukraine (100%)Others 17 18 32 42 27 17 -5.6 -37 29 Nigeria (12%)
Total 2 810 2 792 2 474 2 716 2 711 2 868 5.8 2.7
Annex Table 11B. Document fraudTop ten combinations of nationality of document and document fraud by document type

Frontex · FRAN Quarterly · q4 2014
22 of 24
Annex Table 12. Return decisions issuedDecisions issued by top ten nationalities
2014 Q42013 2014 % change on per cent
of totalQ3 Q4 Q1 Q2 Q3 Q4 year ago prev. Qtr
Top Ten Nationalities
Syria 3 555 5 476 6 118 5 312 8 399 6 654 22 -21 11Albania 4 528 5 029 4 574 5 086 5 228 6 398 27 22 10Morocco 2 802 3 003 4 621 5 185 5 412 4 567 52 -16 7.4Afghanistan 2 592 2 218 2 585 1 883 3 552 3 837 73 8 6.2Ukraine 2 587 2 376 1 817 2 280 3 181 3 829 61 20 6.2Pakistan 3 973 3 837 3 919 3 449 3 239 3 108 -19 -4 5India 2 182 2 485 2 581 2 591 1 820 1 864 -25 2.4 3Algeria 1 888 2 100 2 342 1 836 1 878 1 730 -18 -7.9 2.8Nigeria 2 032 1 945 2 042 1 822 1 658 1 614 -17 -2.7 2.6Brazil 781 1 024 1 253 1 098 1 003 1 270 24 27 2.1Others 30 772 28 214 32 734 29 951 29 796 26 887 -4.7 -9.8 44
Total 57 692 57 707 64 586 60 493 65 166 61 758 7 -5.2 100
Please note the nationality of returned migrants does not necessarily correspond to the country of return.
Annex Table 13. Effective returnsDecisions issued by top ten nationalities
2014 Q42013 2014 % change on
per cent of totalQ3 Q4 Q1 Q2 Q3 Q4 year ago prev.
Qtr
Top Ten Nationalities
Albania 4 845 6 330 4 514 6 225 6 639 9 064 43 37 21Ukraine 2 224 2 098 1 419 1 929 2 814 3 420 63 22 8Morocco 1 657 1 584 1 822 2 228 2 281 2 264 43 -0.7 5.3Pakistan 2 829 3 122 2 798 2 427 2 132 2 252 -28 5.6 5.3India 2 224 2 080 2 140 2 211 1 601 1 657 -20 3.5 3.9Serbia 1 643 1 465 1 636 1 701 1 442 1 464 -0.1 1.5 3.4Russian Federation 2 410 2 331 1 838 1 692 1 775 1 347 -42 -24 3.2Kosovo* 1 734 1 268 1 147 1 129 1 126 1 342 5.8 19 3.1Nigeria 1 292 1 293 1 168 1 085 1 042 1 054 -18 1.2 2.5Syria 208 439 474 436 632 953 117 51 2.2Others 20 074 18 607 18 788 20 228 18 088 17 885 -3.9 -1.1 42
Total 41 140 40 617 37 744 41 291 39 572 42 702 5.1 7.9 100
* This designation is without prejudice to positions on status, and is in line with UNSCR 1244 and the ICJ Opinion on the Kosovo declaration of independence
Please note the nationality of returned migrants does not necessarily correspond to the country of return.

23 of 24
Annex Table 14. Effective returns by type of returnPeople effectively returned to third countries by type of return and top ten nationalities
2014 Q42013 2014 % change on per
cent of totalQ3 Q4 Q1 Q2 Q3 Q4 year ago prev.
Qtr
Type of Return
Forced 22 157 23 262 15 139 18 616 17 860 17 785 -24 -0.4 42Enforced by Member State 20 026 20 662 12 055 13 156 12 823 12 384 -40 -3.4 70Not specified 1 865 1 957 2 802 4 698 4 667 4 847 148 3.9 27Enforced by Joint Operation 266 643 282 762 370 554 -14 50 3.1
Voluntary 17 119 15 347 16 333 16 375 15 243 15 945 3.9 4.6 37Others 8 480 8 302 9 629 10 046 8 778 9 035 8.8 2.9 57Not specified 3 928 3 245 3 436 3 703 3 836 4 108 27 7.1 26IOM-assisted 4 711 3 800 3 268 2 626 2 629 2 802 -26 6.6 18
Not specified 1 864 2 008 6 272 6 300 6 469 8 972 347 39 21
Total 41 140 40 617 37 744 41 291 39 572 42 702 5.1 7.9 100
TEN TOP NATIONALITIESForced
Morocco 726 724 994 2 021 2 070 2 073 186 0.1 12Albania 4 524 5 917 1 410 1 559 1 514 1 823 -69 20 10.0Serbia 815 828 635 1 051 697 781 -5.7 12 4.4Kosovo* 903 625 577 699 683 749 20 9.7 4.2Pakistan 1 763 2 233 689 801 711 741 -67 4.2 4.2Algeria 696 686 699 829 565 718 4.7 27 4.0Tunisia 823 752 680 802 873 693 -7.8 -21 3.9Nigeria 652 702 627 594 647 620 -12 -4.2 3.5India 795 646 516 654 570 574 -11 0.7 3.2Syria 185 390 305 277 388 534 37 38 3.0Others 10 275 9 759 8 007 9 329 9 142 8 479 -13 -7.3 48
Total Forced Returns 22 157 23 262 15 139 18 616 17 860 17 785 -24 -0.4 100
Voluntary
Ukraine 1 806 1 667 1 130 1 541 2 453 2 998 80 22 19Russian Federation 1 997 1 911 1 367 1 223 1 356 1 072 -44 -21 6.7India 1 424 1 428 1 554 1 517 999 1 041 -27 4.2 6.5Pakistan 1 057 852 1 145 890 788 684 -20 -13 4.3Serbia 817 629 987 637 731 665 5.7 -9 4.2Albania 303 373 430 439 521 623 67 20 3.9Kosovo* 831 643 569 430 443 593 -7.8 34 3.7Syria 23 49 111 149 214 419 755 96 2.6Nigeria 605 541 489 478 383 417 -23 8.9 2.6China 577 643 811 783 443 354 -45 -20 2.2Others 7 679 6 611 7 740 8 288 6 912 7 079 7.1 2.4 44
Total Voluntary Returns 17 119 15 347 16 333 16 375 15 243 15 945 3.9 4.6 100
* This designation is without prejudice to positions on status, and is in line with UNSCR 1244 and the ICJ Opinion on the Kosovo declaration of independence.
Please note the nationality of returned migrants does not necessarily correspond to the country of return.

Frontex · FRAN Quarterly · q4 2014
24 of 24
Sources and Methods
For the data concerning detections at the ex-ternal borders, some of the border types are not applicable to all FRAN Member States. This pertains to data on all FRAN indicators since the data are provided disaggregated by border type. The definitions of detections at land borders are therefore not applica-ble (excluding borders with non-Schengen principalities) for Belgium, the Czech Re-public, Denmark, France, Germany, Iceland, Ireland, Italy, Luxembourg, Malta, the Neth-erlands, Portugal, Sweden, Switzerland and the UK. For Cyprus, the land border refers to the Green Line demarcation with the area not under the effective control of the gov-ernment of the Republic of Cyprus. For sea borders, the definitions are not applicable for land-locked Member States including Austria, the Czech Republic, Hungary, Luxembourg, Slovakia and Switzerland.
In addition, data on detections of illegal bor-der-crossing at land, air and sea BCPs (1B) are not available for Iceland, Ireland and Spain and in Greece (these detections are included in the data for Indicator 1A). Data for Nor-way only includes detections of illegal bor-der-crossing at land and sea BCPs (1B), not between BCPs (1A).
Data on detections of illegal border-cross-ing between sea BCPs (1A) are not availa-ble for Ireland.
Data on apprehension (FRAN Indicator 2) of facilitators is not available for Ireland. For It-aly, the data are not disaggregated by border type, but are reported as total apprehensions (not specified). Data for Italy and Norway also include the facilitation of illegal stay and work. For Romania, the data include land intra-EU detections on exit at the border with Hungary.
For the data concerning detections of illegal stay (FRAN Indicator 3), data on detections at exit are not available for Denmark, Ireland, Italy, Spain and the UK.
Data on refusals of entry (FRAN Indicator 4) at the external EU borders are not disaggre-gated by reason of refusal for Ireland and the UK. Refusals of entry at the Spanish land borders at Ceuta and Melilla (without the is-suance of a refusal form) are reported sepa-rately and are not included in the presented FRAN data.
The data on applications for international protection (FRAN Indicator 5) are not dis-aggregated by place of application (type of border on entry or inland applications) for Austria, the Czech Republic and Slovenia. For these countries, only the total number of applications is reported. For France, only asylum applications at the external borders are reported, not inland applications. For the UK, data reported for applications at air BCPs also include applications at sea BCPs.
The data on return decisions issued (FRAN Indicator 7A) are not available for Ireland, France, The Netherlands and Sweden. The data on effective returns (FRAN Indicator 7B) are not available for Ireland. In addition, the data of effective returns are not disaggre-gated by return operation (voluntary and forced) for Spain. The data on voluntary ef-fective returns (FRAN Indicator 7A) are not disaggregated by type of return operation (IOM assisted and others) for Belgium, Czech Republic, Finland and the Netherlands. The data on forced effective returns (FRAN Indi-cator 7A) are not disaggregated by type of re-turn operation (enforced by Member Stated and by Joint Operations) for Belgium, Finland, Iceland and the Netherlands.


European Agency for the Management of Operational Cooperation at the External Borders of the Member States of the European Union
Plac Europejski 6 00-844 Warsaw, Poland
T +48 22 205 95 00 F +48 22 205 95 01
[email protected] www.frontex.europa.eu
For Public Release
Risk Analysis Unit
Reference number: 3864/2015
TT-AF-14-005-EN-N ISSN 2363-0566
Warsaw, April 2015