q1 2016/17 corporate risk register - moorfields eye hospital 15... · 2019-02-07 · for patient...
TRANSCRIPT
Q1 2016/17 Corporate Risk Register
Report to Trust Board
1 September 2016
Report title Q1 2016/17 update of the Corporate Risk Register
(CRR) and BAF
Report from Ian Tombleson
Prepared by Ian Tombleson
State impact on CQC domain
(if applicable)
All
State impact on corporate
priorities
Impacts the whole trust with impacts on specific priorities as highlighted
Reference documents that are
not attached (e.g. previous
reports or appendices)
Brief Summary of Report
The management executive has undertaken the Q1 2016/17 update of the Corporate Risk
Register (CRR) and BAF. This has also been reviewed by the Trust Management Board.
Action Required
Trust Board is requested to consider the summary paper and CRR and BAF, noting the
increasing risk profile and discuss/comment.
Further work is required on the Board Assurance Framework (highlighting risks to specific
corporate priorities) and ensuring that mitigating actions are clearly identified and described.
Item 15
Q1 2016/17 update of Corporate Risk Register (CRR) and BAF
1. Introduction
This review is for Q1 2016/17.
The CRR forms part of the BAF (the BAF is a combination of documents which provides
assurance to delivering the organisation’s strategic priorities, see appendix A below). The
overall management of risk is governed through the Trust’s risk management strategy and
policy.
The full CRR is attached at Appendix C. An easy read CRR guide is included at Appendix B.
Each risk has a unique reference. Trust Board should note that an internal review of the risk
process and the results of an internal audit review continue to be used to improve risk
management and the process of risk escalation. There will be further development of the
presentation and reporting of risks linked to reviewing the performance assessment
framework. The organisation will commence a project for an electronic risk management
system in the Autumn.
2. Analysis
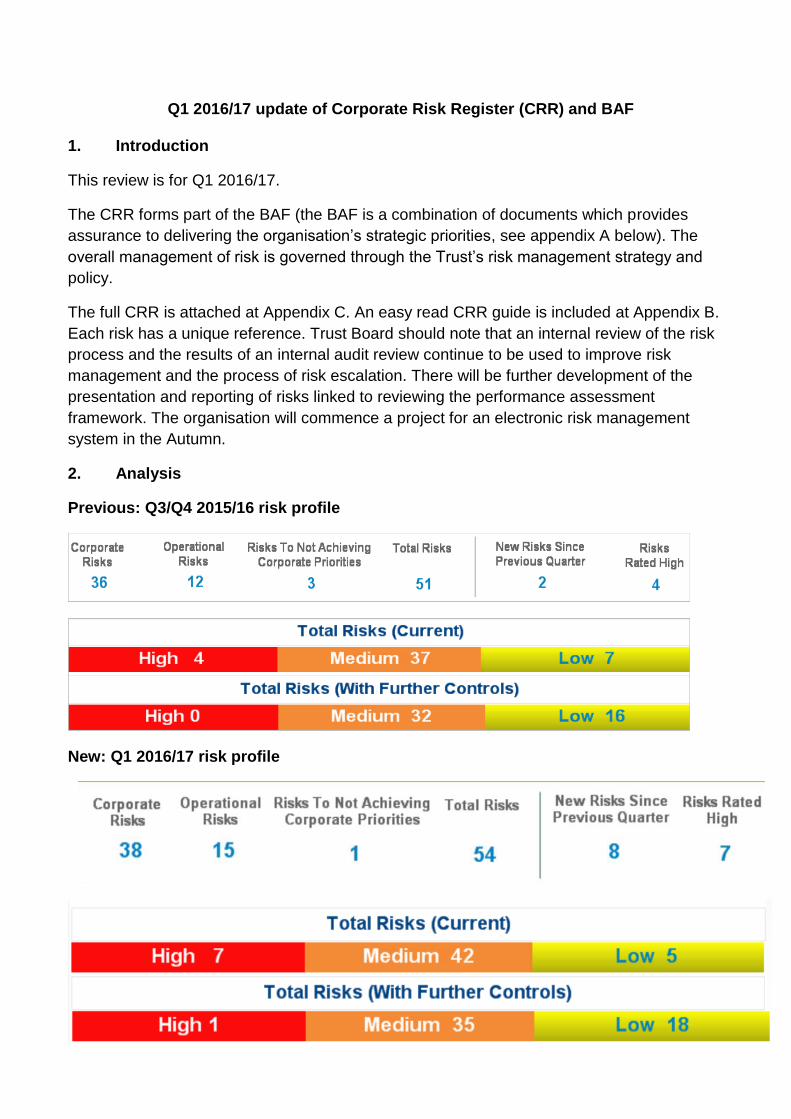
Previous: Q3/Q4 2015/16 risk profile
New: Q1 2016/17 risk profile

Headline comparison between review periods:
Number of red risk is up, now 7 (4 the previous period) Overall number of risks is up, now 54 (51 the previous period) Number of new risks is up, now 8 (2 the previous period)
Overall the organisational risk profile is increasing with more red risks, more amber risks and
more risks overall. We would expect this with continuing increasing financial pressure on the
NHS and the current organisational and NHS-wide challenges. The distribution of risk
scores and levels is illustrated further in the diagrams below linked to themed areas within
the organisation and also to risk leads.
Moorfields’ risks spread widely across the business as would be expected for an
organisation of Moorfields scale and complexity. The most serious risks are described below.
Organisational Red risks
The seven red risks are:
C7 - Potential for major IT system failure C11 - Failure to address significant patient experience concerns C13 - Inability to maintain a financial surplus (Increased to red) C22 - Failure to be awarded BRC money following bid C30 - Inability to produce viable electronic patient record (New) O2 - Need to relocate medical records away from City Road (New) O15 - Image data warehouse failure

Further details of the red risks are set out below:
Note: For risks C22, O2 and O15 the ratings are 5x3=15, 4x4=16 and 4x4=16 respectively.
The CRR (Appendix C) explains on-going and further mitigations. The risk reference directs
readers to specific risks.
In terms of other risks, most middle (amber) rated risks link to operations, which is
expected. Others cluster into key areas of quality, commercial, strategy/major
programmes, political and operations of the network.

(Note: Circle sizes are proportional to the number of risks)
The charts above and below illustrate the distribution of risks by senior owner .

3. Recommendations
Trust Board is requested to consider the summary paper and CRR and BAF (following trust
policy) noting the increasing risk profile and comment/discuss.
Further work is required on the Board Assurance Framework (highlighting risks to specific
corporate priorities) and ensuring that mitigating actions are clearly identified and described.
Ian Tombleson Director of Corporate Governance 21 August 2016

Appendix A
RISK SCORING MATRIX
Table 1 Consequence scores
Consequence score (severity levels) and examples of descriptors
1 2 3 4 5
Domains Negligible Minor Moderate Major Catastrophic
Impact on the safety of patients, staff or public (physical/psychological harm)
Minimal injury requiring no/minimal intervention or treatment. No time off work
Minor injury or illness, requiring minor intervention Requiring time off work for >3 days Increase in length of hospital stay by 1-3 days
Moderate injury requiring professional intervention Requiring time off work for 4-14 days Increase in length of hospital stay by 4-15 days RIDDOR/agency reportable incident An event which impacts on a small number of patients
Major injury leading to long-term incapacity/disability Requiring time off work for >14 days Increase in length of hospital stay by >15 days Mismanagement of patient care with long-term effects
Incident leading to death Multiple permanent injuries or irreversible health effects An event which impacts on a large number of patients
Quality/complaints/audit Peripheral element of treatment or service suboptimal Informal complaint/inquiry
Overall treatment or service suboptimal Formal complaint (stage 1) Local resolution Single failure to meet internal standards Minor implications for patient safety if unresolved Reduced performance rating if unresolved
Treatment or service has significantly reduced effectiveness Formal complaint (stage 2) complaint Local resolution (with potential to go to independent review) Repeated failure to meet internal standards Major patient safety implications if findings are not acted on
Non-compliance with national standards with significant risk to patients if unresolved Multiple complaints/ independent review Low performance rating Critical report
Totally unacceptable level or quality of treatment/service Gross failure of patient safety if findings not acted on Inquest/ombudsman inquiry Gross failure to meet national standards
Human resources/ organisational development/staffing/ competence
Short-term low staffing level that temporarily reduces service quality (< 1 day)
Low staffing level that reduces the service quality
Late delivery of key objective/ service due to lack of staff Unsafe staffing level or competence (>1 day) Low staff morale Poor staff attendance for mandatory/key training
Uncertain delivery of key objective/service due to lack of staff Unsafe staffing level or competence (>5 days) Loss of key staff Very low staff morale No staff attending mandatory/ key training
Non-delivery of key objective/service due to lack of staff Ongoing unsafe staffing levels or competence Loss of several key staff No staff attending mandatory training /key training on an ongoing basis
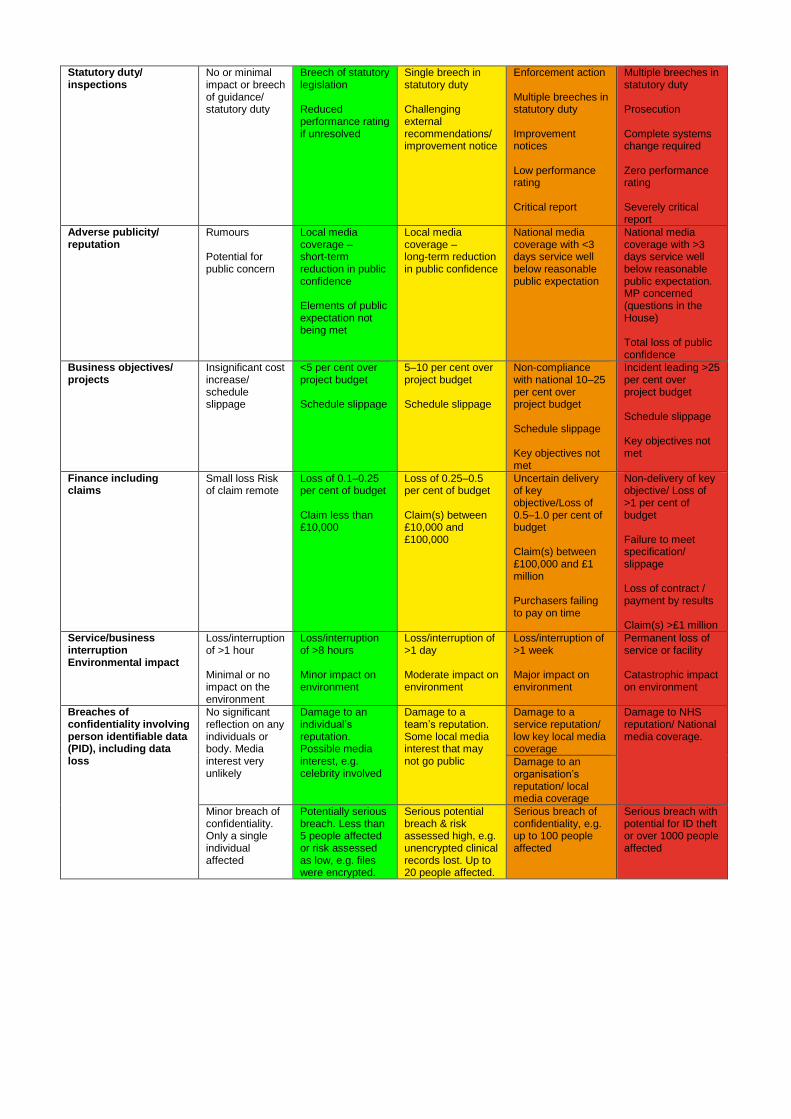
Statutory duty/ inspections
No or minimal impact or breech of guidance/ statutory duty
Breech of statutory legislation Reduced performance rating if unresolved
Single breech in statutory duty Challenging external recommendations/ improvement notice
Enforcement action Multiple breeches in statutory duty Improvement notices Low performance rating Critical report
Multiple breeches in statutory duty Prosecution Complete systems change required Zero performance rating Severely critical report
Adverse publicity/ reputation
Rumours
Potential for public concern
Local media coverage – short-term reduction in public confidence Elements of public expectation not being met
Local media coverage – long-term reduction in public confidence
National media coverage with <3 days service well below reasonable public expectation
National media coverage with >3 days service well below reasonable public expectation. MP concerned (questions in the House) Total loss of public confidence
Business objectives/ projects
Insignificant cost increase/ schedule slippage
<5 per cent over project budget Schedule slippage
5–10 per cent over project budget Schedule slippage
Non-compliance with national 10–25 per cent over project budget Schedule slippage Key objectives not met
Incident leading >25 per cent over project budget Schedule slippage Key objectives not met
Finance including claims
Small loss Risk of claim remote
Loss of 0.1–0.25 per cent of budget Claim less than £10,000
Loss of 0.25–0.5 per cent of budget Claim(s) between £10,000 and £100,000
Uncertain delivery of key objective/Loss of 0.5–1.0 per cent of budget Claim(s) between £100,000 and £1 million Purchasers failing to pay on time
Non-delivery of key objective/ Loss of >1 per cent of budget Failure to meet specification/ slippage Loss of contract / payment by results Claim(s) >£1 million
Service/business interruption Environmental impact
Loss/interruption of >1 hour Minimal or no impact on the environment
Loss/interruption of >8 hours Minor impact on environment
Loss/interruption of >1 day Moderate impact on environment
Loss/interruption of >1 week Major impact on environment
Permanent loss of service or facility Catastrophic impact on environment
Breaches of confidentiality involving person identifiable data (PID), including data loss
No significant reflection on any individuals or body. Media interest very unlikely
Damage to an individual’s reputation. Possible media interest, e.g. celebrity involved
Damage to a team’s reputation. Some local media interest that may not go public
Damage to a service reputation/ low key local media coverage
Damage to NHS reputation/ National media coverage.
Damage to an organisation’s reputation/ local media coverage
Minor breach of confidentiality. Only a single individual affected
Potentially serious breach. Less than 5 people affected or risk assessed as low, e.g. files were encrypted.
Serious potential breach & risk assessed high, e.g. unencrypted clinical records lost. Up to 20 people affected.
Serious breach of confidentiality, e.g. up to 100 people affected
Serious breach with potential for ID theft or over 1000 people affected

9
Table 2 Likelihood score (L)
What is the likelihood of the consequence occurring?
The frequency-based score is appropriate in most circumstances and is easier to identify. It should
be used whenever it is possible to identify a frequency of occurrence.
Likelihood score 1 2 3 4 5
Descriptor Rare Unlikely Possible Likely Almost certain
Frequency How often might it/does it happen
This will probably never happen/recur
Do not expect it to happen/recur but it is possible it may do so
Might happen or recur occasionally
Will probably happen/recur but it is not a persisting issue
Will undoubtedly happen/recur,possibly frequently
Table 3 Risk rating = consequence x likelihood ( C x L )
Consequence scores (C)
Likelihood scores (L)
1 2 3 4 5
Rare Unlikely Possible Likely Almost certain
5 Catastrophic 5 10 15 20 25
4 Major 4 8 12 16 20
3 Moderate 3 6 9 12 15
2 Minor 2 4 6 8 10
1 Negligible 1 2 3 4 5
For grading risk, the scores obtained from the risk matrix are assigned grades as follows
1 - 3 LOW risk 4 - 6 MODERATE risk
8 - 12 HIGH risk
15 - 25 Very HIGH risk
Instructions for use
1. Define the risk(s) explicitly in terms of the adverse consequence(s) that might arise from the risk.
2. Use table 1 to determine the consequence score(s) (C) for the potential adverse outcome(s) relevant to the risk being evaluated.
3. Use table 2 to determine the likelihood score(s) (L) for those adverse outcomes. If possible, score the likelihood by assigning a predicted frequency of occurrence of the adverse outcome. If this is not possible, assign a probability to the adverse outcome occurring within a given time frame, such as the lifetime of a project or a patient care episode. If it is not possible to determine a numerical probability then use the probability descriptions to determine the most appropriate score.
3. Calculate the risk rating by multiplying the consequence score by the likelihood score:
C (consequence) x L (likelihood) = R (risk score)

10
1. Identify the level at which the risk will be managed in the organisation, assign
priorities for remedial action, and determine whether risks are to be accepted on
the basis of the colour bandings and risk ratings, and the organisation’s risk
management system. Include the risk in the organisation risk register at the
appropriate level.
Board assurance framework
There has been wide interpretation of what a Board Assurance Framework (BAF) is
across the NHS and there is a high degree of local interpretation. Following extensive
discussions between the Audit Committee and Man Exec the BAF was agreed as a
combination of documents providing assurance to delivering the organisation’s strategic
priorities. The key components being:
The Corporate risk register (including assurance levels)
Status reports of progress with the trust’s corporate priorities (which reflects
progress with the strategy year on year)
Risk profiles set against progress with the strategy, when a progress overview of
against the key workstreams of the strategy is available.
A review of the BAF is due and will be considered in line with the timing of the strategy
refresh.
11
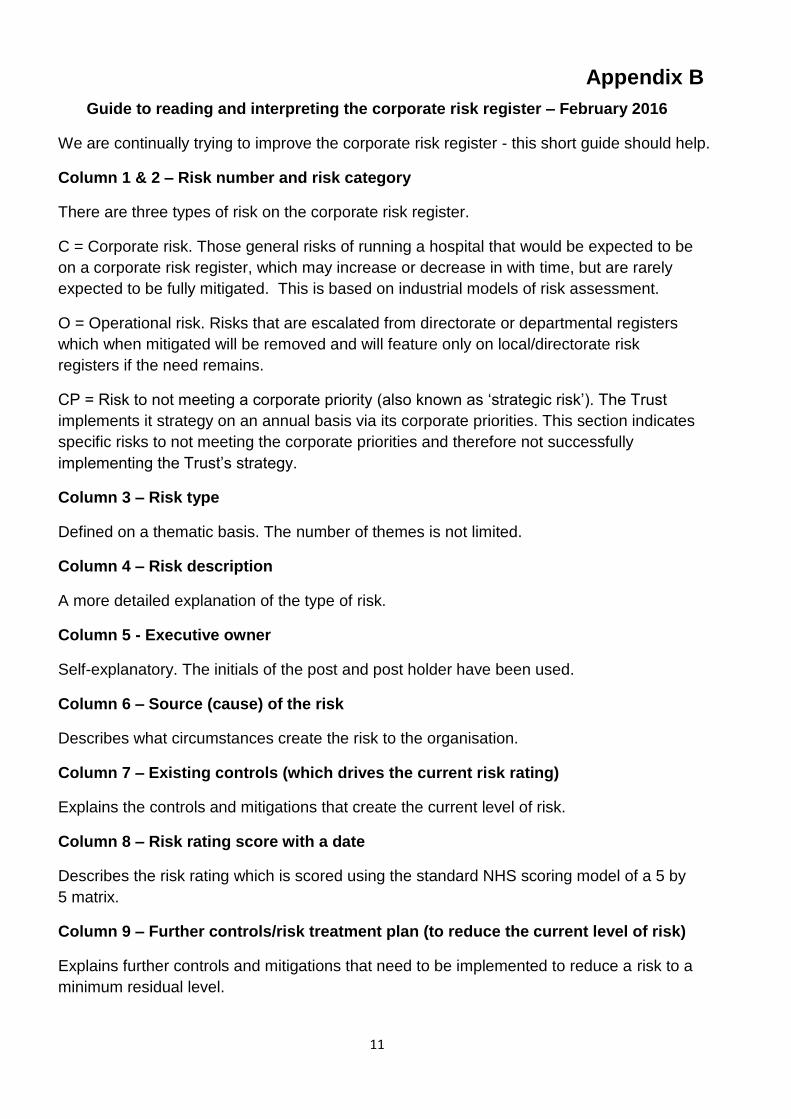
Appendix B
Guide to reading and interpreting the corporate risk register – February 2016
We are continually trying to improve the corporate risk register - this short guide should help.
Column 1 & 2 – Risk number and risk category
There are three types of risk on the corporate risk register.
C = Corporate risk. Those general risks of running a hospital that would be expected to be
on a corporate risk register, which may increase or decrease in with time, but are rarely
expected to be fully mitigated. This is based on industrial models of risk assessment.
O = Operational risk. Risks that are escalated from directorate or departmental registers
which when mitigated will be removed and will feature only on local/directorate risk
registers if the need remains.
CP = Risk to not meeting a corporate priority (also known as ‘strategic risk’). The Trust
implements it strategy on an annual basis via its corporate priorities. This section indicates
specific risks to not meeting the corporate priorities and therefore not successfully
implementing the Trust’s strategy.
Column 3 – Risk type
Defined on a thematic basis. The number of themes is not limited.
Column 4 – Risk description
A more detailed explanation of the type of risk.
Column 5 - Executive owner
Self-explanatory. The initials of the post and post holder have been used.
Column 6 – Source (cause) of the risk
Describes what circumstances create the risk to the organisation.
Column 7 – Existing controls (which drives the current risk rating)
Explains the controls and mitigations that create the current level of risk.
Column 8 – Risk rating score with a date
Describes the risk rating which is scored using the standard NHS scoring model of a 5 by
5 matrix.
Column 9 – Further controls/risk treatment plan (to reduce the current level of risk)
Explains further controls and mitigations that need to be implemented to reduce a risk to a
minimum residual level.
12
Column 10 – Residual risk rating score
Describes the residual risk rating scored using the standard NHS scoring model of a 5 by
5 matrix.
Column 11 & 12 – Date of most recent review and date of next review
Self-explanatory.
Columns 13, 14, 15 - Trend previous, trend current, trend next
Shows the trend from the previous review, the current review and through to the next
review.
Column 16 – Assurance provider
Committees or groups that provide assurance about risk mitigation.
Column 17 - Board Assurance level
There are 3 levels. Level 1 = assurance provided by management only. Level 2 =
assurance following review by a Board committee or the Board. Level 3 = assurance
provided following an internal audit, external review or other similar process.