q1 2018 philips reports q1 sales of eur 3.9 billion, with 5% … · 2018-04-23 · quarterly report...
TRANSCRIPT
Philips reports Q1 sales of EUR 3.9 billion, with 5% comparable sales growth;net income from continuing operations of EUR 94 million, and Adjusted EBITAmargin increased 130 basis points to 8.7%
Amsterdam, April 23, 2018
First-quarter highlights
• Sales in the quarter were EUR 3.9 billion, with comparable sales growth of 5%• Comparable order intake increased 10% compared to Q1 2017• Net income from continuing operations was EUR 94 million, which includes higher restructuring
and acquisition-related charges and bond redemption costs of EUR 52 million, compared to EUR128 million in Q1 2017
• Adjusted EBITA margin improved by 130 basis points to 8.7% of sales, compared to 7.4% of sales inQ1 2017
• Operating cash inflow totaled EUR 92 million
Frans van Houten, CEO:
“While there is more work to be done, 2018 started well, with 10% comparable order intake growth, 5% comparable sales growth anda 130 basis point improvement in operational profitability. Good traction of new products and solutions introduced last yearcontributed to 9% comparable sales growth in the Diagnosis & Treatment businesses. Across our markets, we continue to see strongcustomer interest in our innovations, as demonstrated by the mid-teens order intake growth in the Diagnosis & Treatmentbusinesses. In the quarter, we continued to make good progress with our productivity programs and took action to further reduceour interest expenses.
We strengthened our position as a health technology leader with our innovative, integrated solutions as our strategy in Image-Guided Therapy is delivering results, evidenced by the robust order growth of the new Azurion platform and the continued stronggrowth in the device business, built on the Volcano and Spectranetics acquisitions. Furthermore, we signed 8 long-term strategicpartnership agreements across the US, Europe and the Middle East. For example, in the UK, Philips signed an 11-year agreementwith Wye Valley NHS Trust to transform radiology services across its sites. Philips will deliver its latest diagnostic imaging systemsand advanced informatics, while also providing on-site collaboration and staff training to meet the agreed goals. Additionally in theNetherlands, Philips signed a 15-year partnership with ZorgSaam Hospital, comprising imaging and image-guided therapy systems,healthcare informatics and a range of services to advance the diagnosis and treatment of patients.
Looking ahead, we reiterate our targets for the 2017–2020 period of 4-6% comparable sales growth and an average annual 100basis points improvement in Adjusted EBITA margin.”
Business segmentsIn the first quarter, all business segments continued to deliver operational improvements and increased profitability.
In the Diagnosis & Treatment businesses, comparable order intake grew by 15%, driven by double-digit growth across all businesses.Comparable sales increased by 9%, with strong growth in Diagnostic Imaging, Ultrasound and Image-Guided Therapy. The AdjustedEBITA margin was 140 basis points higher than in the same period last year, mainly due to growth and improved mix.
In the Personal Health businesses, comparable sales growth was 4%, reflecting high-single-digit growth in Sleep & Respiratory Careand mid-single-digit growth in Personal Care. Lower demand in the Air purification market in China impacted the comparable salesgrowth of the Personal Health businesses by 150 basis points. Overall, the Adjusted EBITA margin increased by 30 basis points.
Q1 2018Quarterly report

In the Connected Care & Health Informatics businesses, comparable order intake increased by 1%. Comparable sales growth was flatyear-on-year and included double-digit growth in Healthcare Informatics. The Adjusted EBITA margin improved by 180 basis points,mainly due to operational improvements.
Philips’ ongoing focus on innovation resulted in the following highlights in the quarter:
• As part of Philips’ new introductions to drive growth in Diagnostic Imaging, the company launched the Ingenia Elition, a new 3.0TMRI solution which offers superb image quality while performing exams up to 50% faster. In the US, Philips received FDA 510(k)clearance to market ProxiDiagnost N90, its latest digital X-ray system designed for low dose, high image quality and fastworkflows.
• The expansion of the Ultrasound business beyond its core strength in cardiac ultrasound into attractive adjacencies continues tobe successful. For example, the new OB/GYN ultrasound innovations that Philips introduced in 2017 for its EPIQ and Affinitiultrasound systems drove the strong double-digit growth in comparable order intake for the business in the quarter.
• Leveraging its expertise in cardiology, Philips provided the University of Ottawa Heart Institute, the largest heart center in Canada,with image-guided therapy and patient monitoring solutions. Also in Canada, Philips provided image-guided therapy solutions toRoyal Victoria Regional Health Centre.
• Philips’ Image-Guided Therapy Devices continued its strong momentum, supported by a growing amount of clinical data. Therecent results of the DEFINE FLAIR trial demonstrated that an iFR-guided strategy reduces costs, improves patient comfortcompared to an FFR-guided strategy, and delivers consistent patient outcomes.
• To expand its leadership in patient monitoring solutions, Philips launched FocusPoint, a web-based operational performancemanagement application for its patient monitoring solutions. The application aggregates, processes and stores statistical andalert information, which are presented on a dashboard for optimal management of the technology.
• Highlighting Philips’ leadership in Healthcare Informatics, IntelliSpace Portal, Philips’ advanced data integration, visualization andanalysis platform, has been named 2018 Category Leader in the Advanced Visualization category in the 2018 Best in KLAS:Software & Services report.
• In line with Philips’ focus on innovations, the company launched the new Philips Sonicare ProtectiveClean power toothbrush inNorth America, with further roll-out planned in the coming quarters. Furthermore, Philips introduced the Philips OneBlade Face +Body, its latest innovation in male grooming technology, in the US, UK, France and Canada.
• Building on the success of Philips’ integrated Dream Family, the company introduced the DreamWear Full Face mask, the thirdoption available for its award-winning DreamWear mask system. Helping drive clinical education in its growth geographies,Philips opened South-East Asia’s first Sleep and Respiratory Education Center in Singapore to train healthcare professionals fromacross the region to better diagnose and treat sleep and respiratory disorders.
Cost savings
In the first quarter, procurement savings amounted to EUR 50 million. Overhead and other productivity programs resulted in savingsof EUR 51 million. Philips continues to target annual savings of EUR 400 million in 2018.
Capital structure
In the first quarter Philips completed a further EUR 350 million of the EUR 1.5 billion share buyback program, which was initiated inthe third quarter of 2017 for capital reduction purposes. Details about the transactions can be found here.
As part of the plan to reduce interest expenses and extend maturities, on March 27, 2018, Philips started the redemption of theoutstanding 3.750% Notes due 2022 with an aggregate principal amount of USD 1.0 billion. The transaction will be completed onApril 26, 2018 and resulted in a charge in the first quarter of 2018 of EUR 29 million, reflected in the Financial income and expensesline on the income statement. The resulting cash outflow on this transaction is expected to be approximately EUR 840 million,excluding accrued interest, in the second quarter of 2018.
Regulatory update
Philips continues to make progress in line with the terms of the consent decree, which is primarily focused on the defibrillatormanufacturing in the US; this included inspections by independent auditors and resumption of shipments of its FRx and FR3 AEDs tomarkets outside of the US.
Quarterly report 2018 - Q1 2

Conference call and audio webcast
Frans van Houten, CEO, and Abhijit Bhattacharya, CFO, will host a conference call for investors and analysts at 10:00 am CET todayto discuss the results. A live audio webcast of the conference call will be available on the Philips Investor Relations website and canbe accessed here.

4 Quarterly report Q1 2018
Philips performance
Key data in millions of EUR unless otherwise stated
Q1 2017 Q1 2018
Sales 4,035 3,942
Nominal sales growth 5% (2)%
Comparable sales growth* 3% 5%
Income from operations 243 201
as a % of sales 6.0% 5.1%
Financial expenses, net (50) (80)
Investments in associates, net of income taxes (2) -
Income tax expense (63) (28)
Income from continuing operations 128 94
Discontinued operations, net of income taxes 131 30
Net income1) 259 124
Net income attributable to shareholders per commonshare (in EUR) - diluted 0.25 0.13
EBITA* 304 263
as a % of sales 7.5% 6.7%
Adjusted EBITA* 298 344
as a % of sales 7.4% 8.7%
Adjusted EBITDA* 463 512
as a % of sales 11.5% 13.0%
1) Q1 2017 includes operating results of Lighting and the combined Lumileds andAutomotive businesses, which have subsequently been deconsolidated.
• Comparable sales growth was 5%, reflecting high-single-digitgrowth in the Diagnosis & Treatment businesses and mid-single-digit growth in the Personal Health businesses, whilethe Connected Care & Health Informatics businesses remainedflat year-on-year.
• Comparable order intake* showed 10% growth, reflectingdouble-digit growth in the Diagnosis & Treatment businessesand low-single-digit growth in the Connected Care & HealthInformatics businesses.
• EBITA decreased by EUR 41 million and the margin decreasedby 80 basis points compared to Q1 2017, mainly due to higherrestructuring and acquisition-related charges; in addition, Q12017 included a gain on the sale of real estate assets.
• Adjusted EBITA improved by EUR 46 million and the marginimproved by 130 basis points compared to Q1 2017, mainly dueto growth and operational improvements.
• Restructuring and acquisition-related charges amounted toEUR 64 million, compared to EUR 24 million in Q1 2017. EBITAin Q1 2018 also included EUR 20 million of charges related tothe consent decree primarily focused on the defibrillatormanufacturing in the US. Q1 2017 EBITA also included EUR 12million of charges related to the separation of the Lightingbusiness, EUR 17 million of charges related to quality andregulatory actions, and a EUR 59 million net gain from the saleof real estate assets.
• Adjusted EBITDA improved by EUR 49 million and the marginincreased by 150 basis points compared to Q1 2017.
• Net financial expenses increased by EUR 30 million year-on-year, mainly due to a EUR 29 million charge related to bondsto be redeemed in Q2 2018.
• Income taxes decreased by EUR 35 million, driven by lowertaxable income, mainly due to a gain from the sale of realestate assets in Q1 2017 and a release of tax provisions.
• Discontinued operations included a EUR 23 million positiveimpact related to the fair market value of the remaining interestin Philips Lighting and a net gain of EUR 8 million related to thefinal settlement with regard to the combined Lumileds andAutomotive businesses. In Q1 2017, Discontinued operationsincluded the operating results of Lighting and the combinedLumileds and Automotive businesses of EUR 67 million andEUR 65 million respectively, prior to their deconsolidationduring the course of 2017.
• Net income decreased by EUR 135 million compared to Q1 2017,due to lower income from discontinued operations, higherrestructuring and acquisition-related charges and higher netfinancial expenses, as well as the effect of the Q1 2017 gain onthe sale of real estate assets, partly offset by improvements inoperational performance and lower income taxes.
* Non-IFRS financial measure. Refer to Reconciliation of non-IFRS information, of this document.

Quarterly report Q1 2018 5
Sales per geographic cluster in millions of EUR unless otherwise stated
% change
Q1 2017 Q1 2018 nominal comparable*
Western Europe 844 853 1% 0%
North America 1,491 1,384 (7)% 2%
Other maturegeographies 428 449 5% 14%
Total maturegeographies 2,763 2,686 (3)% 3%
Growth geographies 1,272 1,256 (1)% 9%
Philips Group 4,035 3,942 (2)% 5%
• Sales in growth geographies increased by 9% on a comparablebasis, driven by Middle East & Turkey, India and Latin America.In mature geographies, sales increased by 3% on a comparablebasis, reflecting double-digit growth in other maturegeographies and low-single-digit growth in North America,while Western Europe remained flat year-on-year.
• Comparable order intake* in growth geographies showeddouble-digit growth, driven by Latin America, India and China.In mature geographies, comparable order intake showed mid-single-digit growth, reflecting mid-single-digit growth in NorthAmerica and Western Europe and a low-single-digit decline inother mature geographies.
Cash balance in millions of EUR
Q1 2017 Q1 2018
Beginning cash balance 2,334 1,939
Free cash flows* 254 (47)
Net cash provided by operating activities 300 92
Net capital expenditures (46) (139)
Net cash used for other investing activities (100) (87)
Treasury shares transactions (57) (357)
Changes in debt (260) 39
Other cash flow items (29) (26)
Sale of shares of Philips Lighting, net 523
Net cash flows from discontinued operations 65 519
Ending cash balance 2,731 1,982
• Net cash flows from operating activities decreased by EUR 208million, mainly due to working capital outflow in the quarter,driven by a low working capital position at the end of Q4 2017.Net capital expenditures in Q1 2017 included higher proceedsfrom the sale of real estate assets.
• Treasury share transactions in Q1 2018 mainly included theshare buyback program for capital reduction purposes and theshare repurchase program for the Long Term Incentive andemployee stock purchase plans.
• Sale of shares of Philips Lighting in Q1 2017 included netproceeds of EUR 523 million prior to deconsolidation.
• Net cash flows from discontinued operations in Q1 2018 reflectsnet proceeds of EUR 519 million related to the sale of sharesof Philips Lighting.
Composition of net debt to group equity*in millions of EUR unless otherwise stated
December 31, 2017 March 31, 2018
Long-term debt 4,044 3,242
Short-term debt 672 1,435
Total debt 4,715 4,677
Cash and cash equivalents 1,939 1,982
Net debt 2,776 2,695
Shareholders’ equity 11,999 11,586
Non-controlling interests 24 22
Group equity 12,023 11,608
Net debt : group equity ratio 19:81 19:81
• Net debt to group equity ratio remained stable in Q1 2018.
* Non-IFRS financial measure. Refer to Reconciliation of non-IFRS information, of this document.

6 Quarterly report Q1 2018
Performance per segment
Personal Health businessesKey data in millions of EUR unless otherwise stated
Q1 2017 Q1 2018
Sales 1,719 1,640
Sales growth
Nominal sales growth 7% (5)%
Comparable sales growth* 5% 4%
Income from operations 231 225
as a % of sales 13.4% 13.7%
EBITA* 266 257
as a % of sales 15.5% 15.7%
Adjusted EBITA* 268 260
as a % of sales 15.6% 15.9%
Adjusted EBITDA* 325 317
as a % of sales 18.9% 19.3%
• Comparable sales growth was 4% and reflected high-single-digit growth in Sleep & Respiratory Care, mid-single-digitgrowth in Personal Care, and low-single-digit growth in Health& Wellness and Domestic Appliances.
• Comparable sales in growth geographies showed high-single-digit growth, reflecting double-digit growth in Central &Eastern Europe and Middle East & Turkey, and low-single-digitgrowth in China resulting from lower demand for Airpurification.
• Mature geographies were in line with Q1 2017, reflecting mid-single-digit growth in other mature geographies, offset by alow-single-digit decline in Western Europe and North America.
• EBITA decreased by EUR 9 million, while the margin improvedby 20 basis points compared to Q1 2017.
• Adjusted EBITA decreased by EUR 8 million, while the marginimproved by 30 basis points year-on-year, mainly due tooperational improvements.
• Restructuring and acquisition-related charges amounted toEUR 3 million, compared to EUR 2 million in Q1 2017. In Q2 2018,restructuring and acquisition-related charges are expected tobe negligible.
• Adjusted EBITDA decreased by EUR 8 million, while the marginimproved by 40 basis points compared to Q1 2017.
Diagnosis & Treatment businessesKey data in millions of EUR unless otherwise stated
Q1 2017 Q1 2018
Sales 1,491 1,530
Sales growth
Nominal sales growth 5% 3%
Comparable sales growth* 2% 9%
Income from operations 43 27
as a % of sales 2.9% 1.8%
EBITA* 52 43
as a % of sales 3.5% 2.8%
Adjusted EBITA* 63 85
as a % of sales 4.2% 5.6%
Adjusted EBITDA* 106 131
as a % of sales 7.1% 8.6%
• Comparable sales growth was 9%, driven by double-digitgrowth in Ultrasound and Image-Guided Therapy, and mid-single-digit growth in Diagnostic Imaging.
• Comparable sales in growth geographies showed double-digitgrowth, reflecting double-digit growth in China. Maturegeographies recorded high-single-digit growth, reflectingdouble-digit growth in other mature geographies, high-single-digit growth in North America and low-single-digit growth inWestern Europe.
• EBITA decreased by EUR 9 million and the margin declined by70 basis points compared to Q1 2017, mainly due to higherrestructuring and acquisition-related charges.
• Adjusted EBITA increased by EUR 22 million and the marginimproved by 140 basis points year-on-year, mainly due tohigher growth and improved mix.
• Restructuring and acquisition-related charges were EUR 42million, mainly due to the manufacturing footprintrationalization and post-merger integration costs, comparedto EUR 11 million in Q1 2017. In Q2 2018, restructuring andacquisition-related charges are expected to totalapproximately EUR 25 million.
• Adjusted EBITDA increased by EUR 25 million and the marginincreased by 150 basis points compared to Q1 2017.
* Non-IFRS financial measure. Refer to Reconciliation of non-IFRS information, of this document.

Quarterly report Q1 2018 7
Connected Care & Health Informatics businessesKey data in millions of EUR unless otherwise stated
Q1 2017 Q1 2018
Sales 732 663
Sales growth
Nominal sales growth 5% (9)%
Comparable sales growth* 1% 0%
Income from operations (12) 1
as a % of sales (1.6)% 0.2%
EBITA* 0 12
as a % of sales 0.0% 1.8%
Adjusted EBITA* 26 36
as a % of sales 3.6% 5.4%
Adjusted EBITDA* 57 64
as a % of sales 7.8% 9.7%
• Comparable sales growth was flat year-on-year. TherapeuticCare1 reflected a low-single-digit decline, which includes theimpact of the consent decree on our defibrillatormanufacturing in the US.
• Comparable sales in growth geographies showed low-single-digit growth, reflecting double-digit growth in Latin Americaand India, partly offset by a double-digit decline in Africa.Mature geographies were in line with Q1 2017, with double-digitgrowth in other mature geographies offset by a low-single-digit decline in North America and a mid-single-digit declinein Western Europe.
• EBITA increased by EUR 12 million and the margin increased by180 basis points compared to Q1 2017.
• Adjusted EBITA increased by EUR 10 million and the marginimproved by 180 basis points year-on-year, mainly due tooperational improvements.
• Restructuring and acquisition-related charges were EUR 6million. EBITA in Q1 2018 also included EUR 20 million ofcharges related to the consent decree focused primarily on thedefibrillator manufacturing in the US. In Q2 2018, restructuringand acquisition-related charges are expected to totalapproximately EUR 20 million. Charges related to the consentdecree are expected to total approximately EUR 20 million inQ2 2018.
• Adjusted EBITDA improved by EUR 7 million and the marginincreased by 190 basis points compared to Q1 2017.
Other2
Key data in millions of EUR
Q1 2017 Q1 2018
Sales 92 109
Income from operations (18) (52)
EBITA* (13) (50)
Adjusted EBITA* (58) (37)
IP Royalties 50 44
Innovation (54) (46)
Central costs (32) (35)
Legacy Items (20) 4
Other (2) (3)
Adjusted EBITDA* (26) -
• Sales increased by EUR 17 million, mainly due to licenseincome from Lighting being reported as third-party salesfollowing deconsolidation as of the end of November 2017.
• Income from operations and EBITA decreased by EUR 34million and EUR 37 million respectively, reflecting higherrestructuring and acquisition-related charges and a EUR 59million gain on the sale of real estate assets in Q1 2017.
• Adjusted EBITA improved by EUR 21 million, mainly due tolower Legacy cost as Q1 2017 included stranded costs relatedto the combined Lumileds and Automotive businesses.
• Restructuring and acquisition-related charges amounted toEUR 13 million, compared to EUR 3 million in Q1 2017. In Q22018, restructuring and acquisition-related charges areexpected to total approximately EUR 5 million.
• Adjusted EBITDA improved by EUR 26 million compared to Q12017.
1 Effective 2018, Patient Care & Monitoring Solutions transitioned into two focused business groups - Monitoring & Analytics and Therapeutic Care.2 Other comprises HealthTech Other and Legacy Items.* Non-IFRS financial measure. Refer to Reconciliation of non-IFRS information, of this document.
8 Quarterly report Q1 2018
Forward-looking statements and other important information
Forward-looking statementsThis document and the related oral presentation, includingresponses to questions following the presentation, containcertain forward-looking statements with respect to the financialcondition, results of operations and business of Philips andcertain of the plans and objectives of Philips with respect to theseitems. Examples of forward-looking statements includestatements made about the strategy, estimates of sales growth,future Adjusted EBITA, future developments in Philips’ organicbusiness and the completion of acquisitions and divestments. Bytheir nature, these statements involve risk and uncertaintybecause they relate to future events and circumstances and thereare many factors that could cause actual results anddevelopments to differ materially from those expressed orimplied by these statements.
These factors include but are not limited to: global economic andbusiness conditions; political instability, including developmentswithin the European Union, with adverse impact on financialmarkets; the successful implementation of Philips’ strategy andthe ability to realize the benefits of this strategy; the ability todevelop and market new products; changes in legislation; legalclaims; changes in currency exchange rates and interest rates;future changes in tax rates and regulations, including trade tariffs;pension costs and actuarial assumptions; changes in rawmaterials prices; changes in employee costs; the ability toidentify and complete successful acquisitions, and to integratethose acquisitions into the business, the ability to successfullyexit certain businesses or restructure the operations; the rate oftechnological changes; cyber-attacks, breaches ofcybersecurity; political, economic and other developments incountries where Philips operates; industry consolidation andcompetition; and the state of international capital markets asthey may affect the timing and nature of the disposal by Philipsof its remaining interests in Philips Lighting. As a result, Philips’actual future results may differ materially from the plans, goalsand expectations set forth in such forward-looking statements.For a discussion of factors that could cause future results to differfrom such forward-looking statements, see the Riskmanagement chapter included in the Annual Report 2017.
Third-party market share dataStatements regarding market share, including those regardingPhilips’ competitive position, contained in this document arebased on outside sources such as research institutes, industryand dealer panels in combination with management estimates.Where information is not yet available to Philips, thosestatements may also be based on estimates and projectionsprepared by outside sources or management. Rankings arebased on sales unless otherwise stated.
Use of non-IFRS informationIn presenting and discussing the Philips Group‘s financialposition, operating results and cash flows, management usescertain non-IFRS financial measures. These non-IFRS financialmeasures should not be viewed in isolation as alternatives to theequivalent IFRS measures and should be used in conjunctionwith the most directly comparable IFRS measures. Non-IFRSfinancial measures do not have standardized meaning under
IFRS and therefore may not be comparable to similar measurespresented by other issuers. A reconciliation of these non-IFRSmeasures to the most directly comparable IFRS measures iscontained in this document. Further information on non-IFRSmeasures can be found in the Annual Report 2017. As the PhilipsGroup is applying IFRS as its Generally Accepted AccountingPrinciples (GAAP) we have changed the term non-GAAPinformation into non-IFRS information.
Use of fair value informationIn presenting the Philips Group’s financial position, fair values areused for the measurement of various items in accordance withthe applicable accounting standards. These fair values are basedon market prices, where available, and are obtained from sourcesthat are deemed to be reliable. Readers are cautioned that thesevalues are subject to changes over time and are only valid at thebalance sheet date. When quoted prices or observable marketdata are not readily available, fair values are estimated usingappropriate valuation models and unobservable inputs. Such fairvalue estimates require management to make significantassumptions with respect to future developments, which areinherently uncertain and may therefore deviate from actualdevelopments. Critical assumptions used are disclosed in theAnnual Report 2017. In certain cases independent valuations areobtained to support management’s determination of fair values.
PresentationAll amounts are in millions of euros unless otherwise stated. Dueto rounding, amounts may not add up precisely to totalsprovided. All reported data is unaudited. Financial reporting is inaccordance with the accounting policies as stated in the AnnualReport 2017, unless otherwise stated.
We have further simplified our Q1 and Q3 reporting by excludingthe balance sheet as it is not required to be disclosed. In our semi-annual and annual report we will continue to present thisstatement. Net debt to group equity information is provided inthe Philips performance section of this document. Additionallywe have combined HealthTech Other and Legacy Items intoOther in this report.
Market Abuse RegulationThis press release contains inside information within the meaningof Article 7(1) of the EU Market Abuse Regulation.

Quarterly report Q1 2018 9
Condensed consolidated statements of income
Condensed consolidated statements of income in millions of EUR unless otherwise stated
Q1
2017 2018
Sales 4,035 3,942
Cost of sales (2,258) (2,156)
Gross margin 1,777 1,785
Selling expenses (1,024) (1,041)
General and administrative expenses (151) (130)
Research and development expenses (431) (433)
Other business income 74 27
Other business expenses (3) (7)
Income from operations 243 201
Financial income 23 13
Financial expenses (73) (93)
Investments in associates, net of income taxes (2) -
Income before taxes 191 122
Income taxes expense (63) (28)
Income from continuing operations 128 94
Discontinued operations, net of income taxes 131 30
Net income 259 124
Attribution of net income
Net income attributable to Koninklijke Philips N.V. shareholders 232 125
Net income attributable to Non-controlling interests 27 (1)
Earnings per common share
Weighted average number of common shares outstanding (after deduction of treasury shares) during the period (in thousands):
- basic 921,917 921,790
- diluted 937,102 939,822
Net income attributable to Koninklijke Philips N.V. shareholders:
- basic 0.25 0.14
- diluted 0.25 0.13
Amounts may not add up due to rounding.
10 Quarterly report Q1 2018
Reconciliation of non-IFRS information
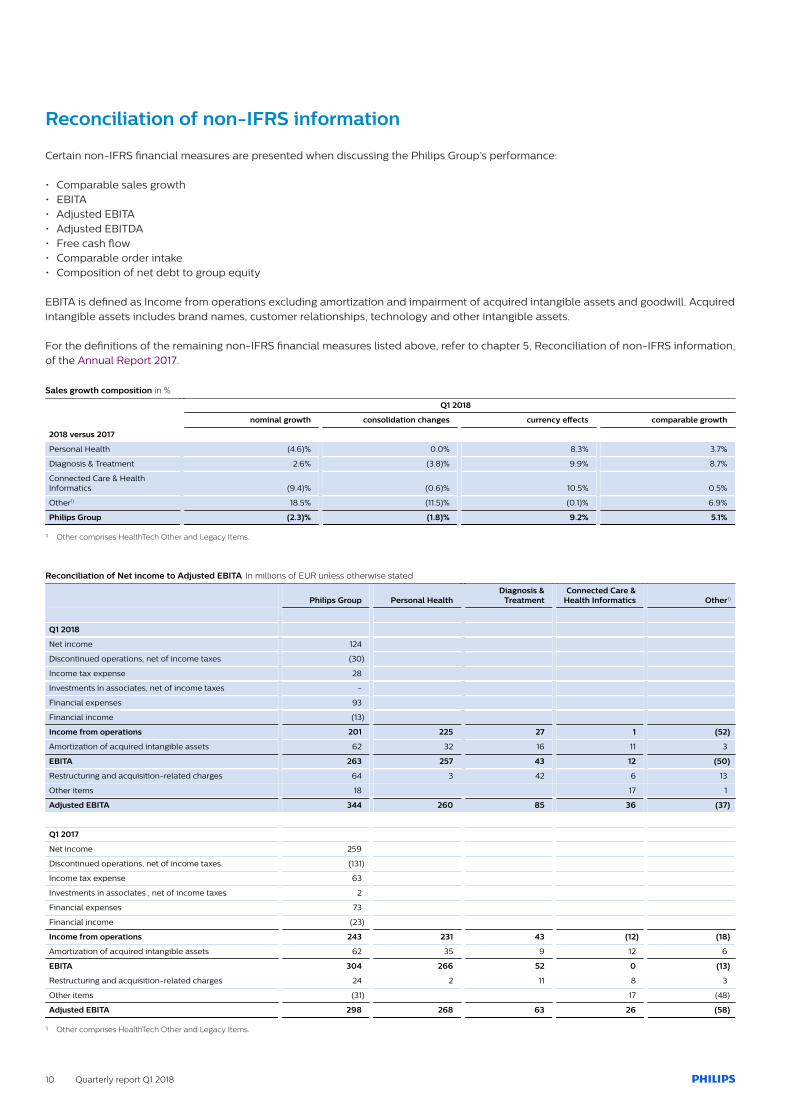
Certain non-IFRS financial measures are presented when discussing the Philips Group’s performance:
• Comparable sales growth• EBITA• Adjusted EBITA• Adjusted EBITDA• Free cash flow• Comparable order intake• Composition of net debt to group equity
EBITA is defined as Income from operations excluding amortization and impairment of acquired intangible assets and goodwill. Acquiredintangible assets includes brand names, customer relationships, technology and other intangible assets.
For the definitions of the remaining non-IFRS financial measures listed above, refer to chapter 5, Reconciliation of non-IFRS information,of the Annual Report 2017.
Sales growth composition in %
Q1 2018
nominal growth consolidation changes currency effects comparable growth
2018 versus 2017
Personal Health (4.6)% 0.0% 8.3% 3.7%
Diagnosis & Treatment 2.6% (3.8)% 9.9% 8.7%
Connected Care & HealthInformatics (9.4)% (0.6)% 10.5% 0.5%
Other1) 18.5% (11.5)% (0.1)% 6.9%
Philips Group (2.3)% (1.8)% 9.2% 5.1%
1) Other comprises HealthTech Other and Legacy Items.
Reconciliation of Net income to Adjusted EBITA In millions of EUR unless otherwise stated
Philips Group Personal Health Diagnosis &
Treatment Connected Care &
Health Informatics Other1)
Q1 2018
Net income 124
Discontinued operations, net of income taxes (30)
Income tax expense 28
Investments in associates, net of income taxes -
Financial expenses 93
Financial income (13)
Income from operations 201 225 27 1 (52)
Amortization of acquired intangible assets 62 32 16 11 3
EBITA 263 257 43 12 (50)
Restructuring and acquisition-related charges 64 3 42 6 13
Other items 18 17 1
Adjusted EBITA 344 260 85 36 (37)
Q1 2017
Net income 259
Discontinued operations, net of income taxes (131)
Income tax expense 63
Investments in associates , net of income taxes 2
Financial expenses 73
Financial income (23)
Income from operations 243 231 43 (12) (18)
Amortization of acquired intangible assets 62 35 9 12 6
EBITA 304 266 52 0 (13)
Restructuring and acquisition-related charges 24 2 11 8 3
Other items (31) 17 (48)
Adjusted EBITA 298 268 63 26 (58)
1) Other comprises HealthTech Other and Legacy Items.

Quarterly report Q1 2018 11
Net income to Adjusted EBITDA In millions of EUR unless otherwise stated
Philips Group Personal Health Diagnosis &
Treatment Connected Care &
Health Informatics Other1)
Q1 2018
Net income 124
Discontinued operations, net of income taxes (30)
Income tax expense 28
Investment in associates, net of income taxes -
Financial expenses 93
Financial income (13)
Income from operations 201 225 27 1 (52)
Depreciation, amortization and impairments of fixed assets 231 90 63 40 39
Restructuring and acquisition-related charges 64 3 42 6 13
Other items 18 17 1
Adding back impairment of fixed assets included inrestructuring and acquisition-related charges and otheritems (2) (1) -
Adjusted EBITDA 512 317 131 64 -
1) Other comprises HealthTech Other and Legacy Items
Net income to Adjusted EBITDA In millions of EUR unless otherwise stated
Philips Group Personal Health Diagnosis &
Treatment Connected Care &
Health Informatics Other1)
Q1 2017
Net income 259
Discontinued operations, net of income taxes (131)
Income tax expense 63
Investment in associates, net of income taxes 2
Financial expenses 73
Financial income (23)
Income from operations 243 231 43 (12) (18)
Depreciation, amortization and impairments of fixed assets 228 92 53 45 38
Restructuring and acquisition-related charges 24 2 11 8 3
Other items (31) 17 (48)
Adding back of impairment of fixed assets included inrestructuring and acquisition-related charges and otheritems (2) (1) (1)
Adjusted EBITDA 463 325 106 57 (26)
1) Other comprises HealthTech Other and Legacy Items.
Composition of free cash flow in millions of EUR
January to March
2017 2018
Net cash provided by operating activities 300 92
Net capital expenditures: (46) (139)
Purchase of intangible assets (19) (21)
Expenditures on development assets (76) (67)
Capital expenditures on property, plant and equipment (80) (81)
Proceeds from sale of property, plant and equipment 129 31
Free cash flows 254 (47)

12 Quarterly report Q1 2018
Philips statisticsin millions of EUR unless otherwise stated
2017 2018
Q1 Q2 Q3 Q4 Q1 Q2 Q3 Q4
Sales 4,035 4,294 4,148 5,303 3,942
Comparable sales growth* 3% 4% 4% 5% 5%
Gross margin 1,777 1,925 1,916 2,563 1,785
as a % of sales 44.0% 44.8% 46.2% 48.3% 45.3%
Selling expenses (1,024) (1,091) (1,046) (1,236) (1,041)
as a % of sales (25.4)% (25.4)% (25.2)% (23.3)% (26.4)%
G&A expenses (151) (146) (134) (146) (130)
as a % of sales (3.7)% (3.4)% (3.2)% (2.8)% (3.3)%
R&D expenses (431) (421) (451) (461) (433)
as a % of sales (10.7)% (9.8)% (10.9)% (8.7)% (11.0)%
Income from operations 243 252 299 723 201
as a % of sales 6.0% 5.9% 7.2% 13.6% 5.1%
Net income 259 289 423 899 124
Net income - shareholders per common sharein EUR - diluted 0.25 0.27 0.33 0.91 0.13
EBITA* 304 329 364 790 263
as a % of sales 7.5% 7.7% 8.8% 14.9% 6.7%
Adjusted EBITA* 298 439 532 884 344
as a % of sales 7.4% 10.2% 12.8% 16.7% 8.7%
Adjusted EBITDA* 463 611 686 1,072 512
as a % of sales 11.5% 14.2% 16.5% 20.2% 13.0%
2017 2018
January- March
January- June
January- September
January- December
January- March
January-June
January- September
January- December
Sales 4,035 8,329 12,477 17,780 3,942
Comparable sales growth* 3% 3% 4% 4% 5%
Gross margin 1,777 3,703 5,618 8,181 1,785
as a % of sales 44.0% 44.5% 45.0% 46.0% 45.3%
Selling expenses (1,024) (2,115) (3,162) (4,398) (1,041)
as a % of sales (25.4)% (25.4)% (25.3)% (24.7)% (26.4)%
G&A expenses (151) (297) (431) (577) (130)
as a % of sales (3.7)% (3.6)% (3.5)% (3.2)% (3.3)%
R&D expenses (431) (852) (1,303) (1,764) (433)
as a % sales (10.7)% (10.2)% (10.4)% (9.9)% (11.0)%
Income from operations 243 495 794 1,517 201
as a % of sales 6.0% 5.9% 6.4% 8.5% 5.1%
Net income 259 548 971 1,870 124
Net income - shareholders per common sharein EUR - diluted 0.25 0.51 0.85 1.75 0.13
EBITA* 304 634 997 1,787 263
as a % of sales 7.5% 7.6% 8.0% 10.1% 6.7%
Adjusted EBITA* 298 737 1,269 2,153 344
as a % of sales 7.4% 8.8% 10.2% 12.1% 8.7%
Adjusted EBITDA* 463 1,074 1,759 2,832 512
as a % of sales 11.5% 12.9% 14.1% 15.9% 13.0%
Number of common shares outstanding (afterdeduction of treasury shares) at the end ofperiod (in thousands) 920,276 937,045 936,861 926,192 914,826
Shareholders’ equity per common share in EUR 13.74 13.01 12.12 12.96 12.66
Net debt : group equity ratio* 16:84 5:95 23:77 19:81 19:81
Total employees of continuing operations1) 70,430 71,477 73,324 73,951 73,845
1) Includes third-party workers.
* Non-IFRS financial measure. Refer to Reconciliation of non-IFRS information, of this document.

http://www.philips.com/investorrelations© 2018 Koninklijke Philips N.V. All rights reserved.