q1 2020 earnings conference call - investor relations
TRANSCRIPT

Q1 2020 Earnings Conference Call
April 23, 2020
Safe Harbor DisclosureStatements in this presentation other than historical data and information constitute forward-looking statements within the meaning of Section 27A of the Securities Act of 1933 as amended and Section 21E of the Securities Exchange Act of 1934, as amended, including, but not limited to, statements regarding (i) Q1 2020 renewal rate expectations, (ii) Domain Name Base increase expectations, and (iii) our full year 2020 financial guidance for Revenue; Domain Name Base Growth; Operating Margin; Interest Expense and Non-Operating Income, net; Capital Expenditures; and Effective Tax Rate. These statements are based on current expectations and assumptions and involve risks and uncertainties that could cause our actual results to differ materially from those stated or implied by such forward-looking statements. The potential risks and uncertainties include, among others, the effects of the COVID-19 pandemic; risks arising from the agreements governing our business; new or existing governmental laws and regulations in the U.S. or other applicable foreign jurisdictions; system interruptions, security breaches, attacks on the internet by hackers, viruses, or intentional acts of vandalism; the uncertainty of the impact of changes to the multi-stakeholder model of internet governance; risks arising from our operation of two root zone servers and our performance of the Root Zone Maintainer functions; changes in internet practices and behavior and the adoption of substitute technologies; the success or failure of the evolution of our markets; the highly competitive business environment in which we operate; whether we can maintain strong relationships with registrars and their resellers to maintain their marketing focus on our products and services; the possibility of system interruptions or failures; challenging global economic conditions; economic, legal and political risk associated with our international operations; our ability to protect and enforce our rights to our intellectual property and ensure that we do not infringe on others’ intellectual property; the outcome of legal or other challenges resulting from our activities or the activities of registrars or registrants, or litigation generally; the impact of our new strategic initiatives, including our IDN gTLDs; whether we can retain and motivate our senior management and key employees; and the impact of unfavorable tax rules and regulations. More information about potential factors that could affect our business and financial results is included in our filings with the SEC, including in our Annual Report on Form 10-K for the year ended December 31, 2019, Quarterly Reports on Form 10-Q and Current Reports on Form 8-K. Verisign undertakes no obligation to update any of the forward-looking statements after the date of this presentation.
2
IntroductionBusiness HighlightsFinancial Performance / GuidanceClosing / Q&A / Appendix
Agenda
3
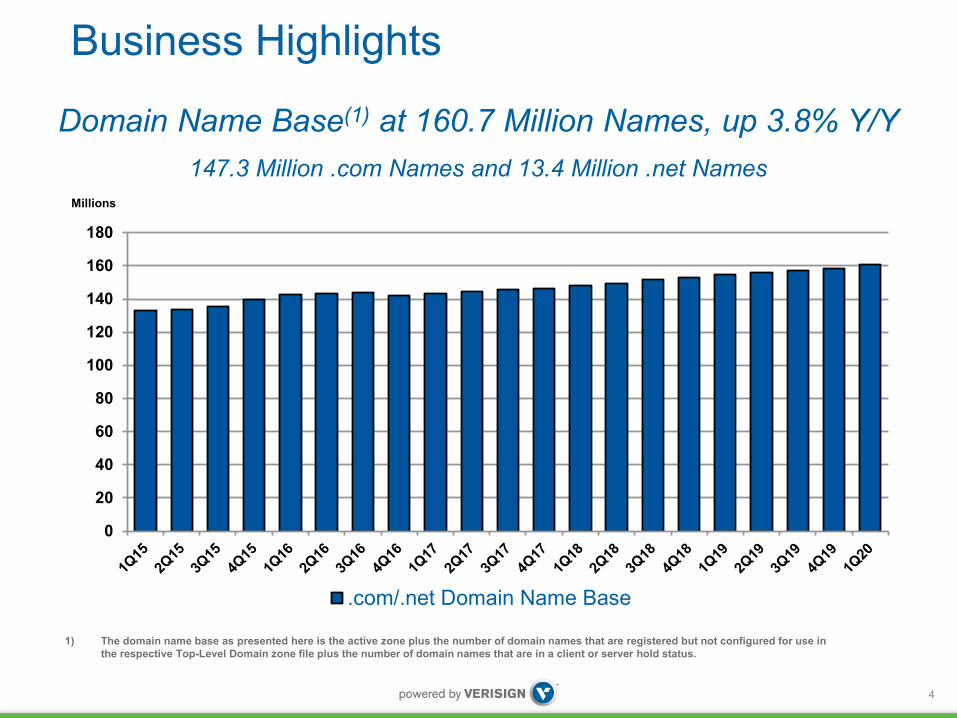
Domain Name Base(1) at 160.7 Million Names, up 3.8% Y/Y147.3 Million .com Names and 13.4 Million .net Names
0
20
40
60
80
100
120
140
160
180
.com/.net Domain Name Base
1) The domain name base as presented here is the active zone plus the number of domain names that are registered but not configured for use in the respective Top-Level Domain zone file plus the number of domain names that are in a client or server hold status.
Millions
Business Highlights
4
Business Highlights
Millions
Q4
New Name Registrations
.com/.net New Name Registrations
Renewal Rate (1)
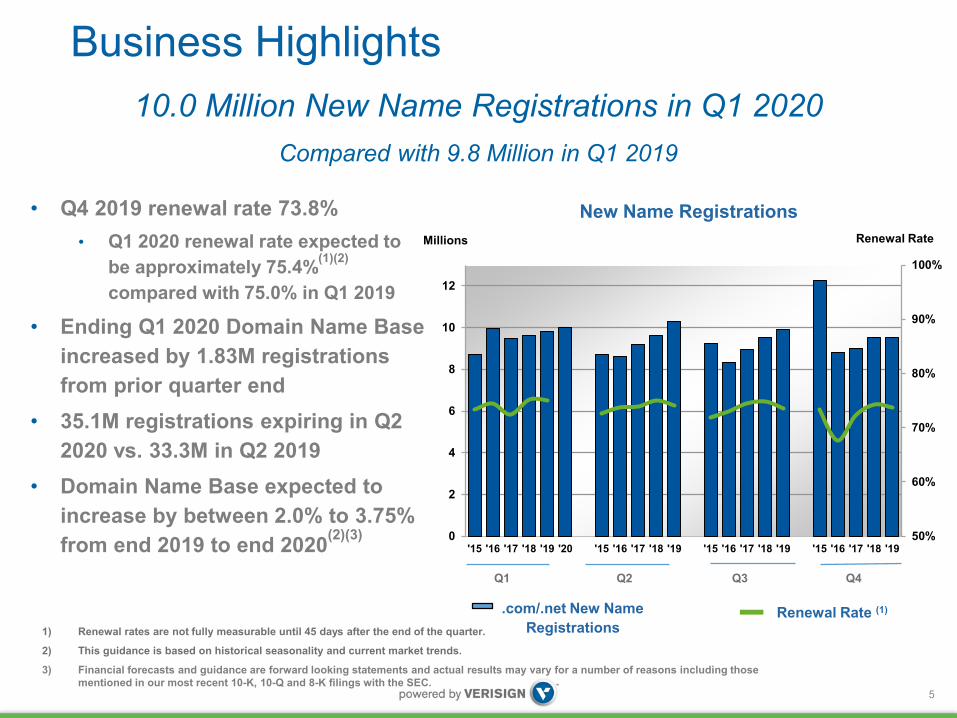
1) Renewal rates are not fully measurable until 45 days after the end of the quarter.
2) This guidance is based on historical seasonality and current market trends.
3) Financial forecasts and guidance are forward looking statements and actual results may vary for a number of reasons including those mentioned in our most recent 10-K, 10-Q and 8-K filings with the SEC.
Q3Q2Q1
• Q4 2019 renewal rate 73.8%• Q1 2020 renewal rate expected to
be approximately 75.4%(1)(2)
compared with 75.0% in Q1 2019
• Ending Q1 2020 Domain Name Base increased by 1.83M registrations from prior quarter end
• 35.1M registrations expiring in Q2 2020 vs. 33.3M in Q2 2019
• Domain Name Base expected to increase by between 2.0% to 3.75% from end 2019 to end 2020(2)(3)
10.0 Million New Name Registrations in Q1 2020Compared with 9.8 Million in Q1 2019
Renewal Rate
5
50%
60%
70%
80%
90%
100%
0
2
4
6
8
10
12
'15 '16 '17 '18 '19 '20 '15 '16 '17 '18 '19 '15 '16 '17 '18 '19 '15 '16 '17 '18 '19
0%
10%
20%
30%
40%
50%
60%
70%
80%
90%
100%
100
125
150
175
200
225
250
275
300
325
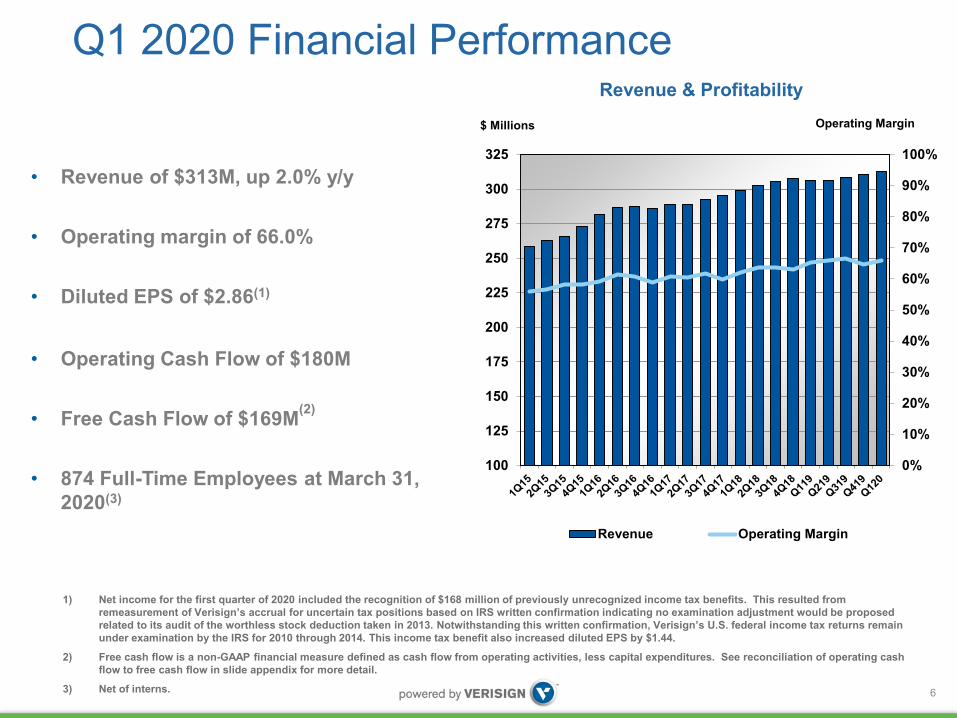
Revenue Operating Margin
$ Millions
Revenue & ProfitabilityOperating Margin
• Revenue of $313M, up 2.0% y/y
• Operating margin of 66.0%
• Diluted EPS of $2.86(1)
• Operating Cash Flow of $180M
• Free Cash Flow of $169M(2)
• 874 Full-Time Employees at March 31, 2020(3)
1) Net income for the first quarter of 2020 included the recognition of $168 million of previously unrecognized income tax benefits. This resulted from remeasurement of Verisign’s accrual for uncertain tax positions based on IRS written confirmation indicating no examination adjustment would be proposed related to its audit of the worthless stock deduction taken in 2013. Notwithstanding this written confirmation, Verisign’s U.S. federal income tax returns remain under examination by the IRS for 2010 through 2014. This income tax benefit also increased diluted EPS by $1.44.
2) Free cash flow is a non-GAAP financial measure defined as cash flow from operating activities, less capital expenditures. See reconciliation of operating cash flow to free cash flow in slide appendix for more detail.
3) Net of interns.
Q1 2020 Financial Performance
6
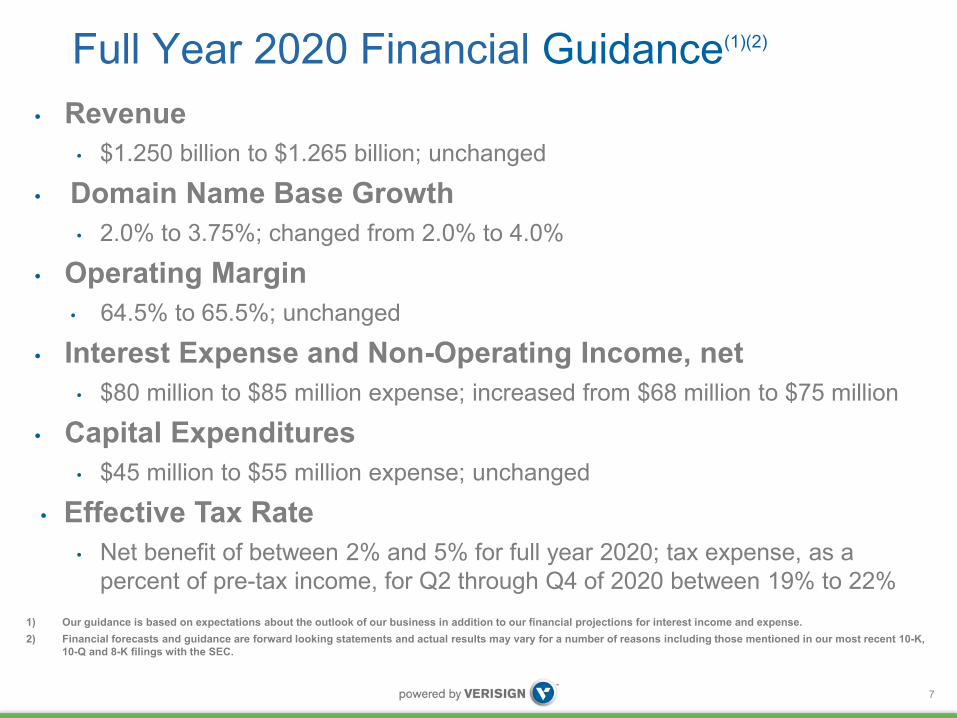
• Revenue• $1.250 billion to $1.265 billion; unchanged
• Domain Name Base Growth• 2.0% to 3.75%; changed from 2.0% to 4.0%
• Operating Margin• 64.5% to 65.5%; unchanged
• Interest Expense and Non-Operating Income, net• $80 million to $85 million expense; increased from $68 million to $75 million
• Capital Expenditures• $45 million to $55 million expense; unchanged
• Effective Tax Rate• Net benefit of between 2% and 5% for full year 2020; tax expense, as a
percent of pre-tax income, for Q2 through Q4 of 2020 between 19% to 22%1) Our guidance is based on expectations about the outlook of our business in addition to our financial projections for interest income and expense. 2) Financial forecasts and guidance are forward looking statements and actual results may vary for a number of reasons including those mentioned in our most recent 10-K,
10-Q and 8-K filings with the SEC.
Full Year 2020 Financial Guidance(1)(2)
7
Q&AAppendix
8
Non-GAAP Financial Measures
9
Verisign provides quarterly and annual financial statements that are prepared in accordance with generally accepted accounting principles (GAAP). Along with this information, management typically discloses and discusses certain non-GAAP financial measures on investor conference calls and related events. The non-GAAP financial measures included in this presentation are Adjusted EBITDA and free cash flow.
Adjusted EBITDA is a non-GAAP financial measure and is calculated in accordance with the terms of the indentures governing Verisign’s senior notes. Adjusted EBITDA refers to net income before interest, taxes, depreciation and amortization, stock-based compensation, unrealized gain / loss on hedging agreements, and gain on sale of business.
Free cash flow is a non-GAAP financial measure defined as cash flow from operating activities, less capital expenditures.
Management believes that these non-GAAP financial measures supplement the GAAP financial measures by providing investors with additional information that allows them to have a clearer picture of Verisign’s operations and financial performance and the comparability of Verisign’s operating results from period to period. The presentation of these non-GAAP financial measures is not meant to be considered in isolation nor as a substitute for financial measures prepared in accordance with GAAP.
The tables herein include a reconciliation of the non-GAAP financial measures to the comparable financial measures reported in accordance with GAAP for the given periods.
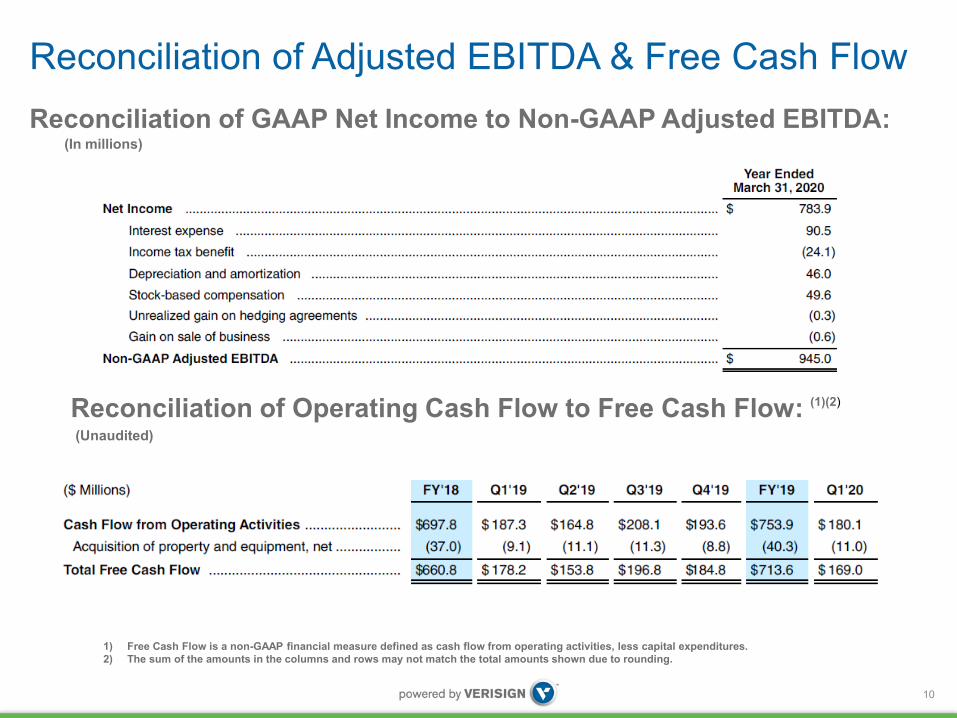
Reconciliation of Adjusted EBITDA & Free Cash FlowReconciliation of GAAP Net Income to Non-GAAP Adjusted EBITDA:
10
Reconciliation of Operating Cash Flow to Free Cash Flow: (1)(2)
1) Free Cash Flow is a non-GAAP financial measure defined as cash flow from operating activities, less capital expenditures. 2) The sum of the amounts in the columns and rows may not match the total amounts shown due to rounding.
(In millions)
(Unaudited)
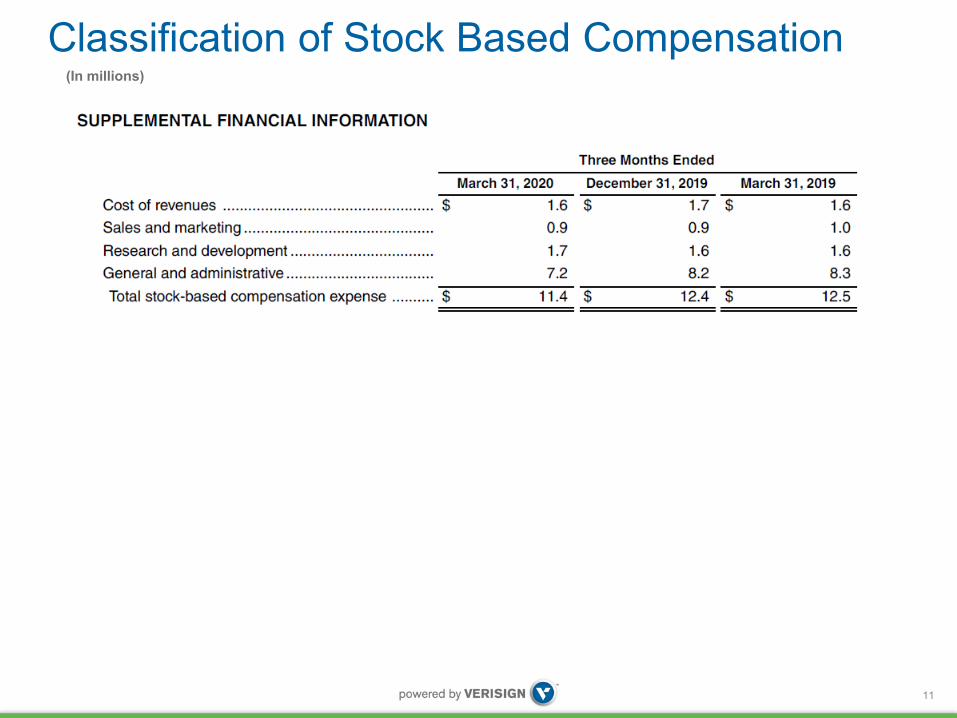
Classification of Stock Based Compensation
11
(In millions)

© 2020 VeriSign, Inc. All rights reserved. VERISIGN and other trademarks, service marks, and designs are registered or unregistered trademarks of VeriSign, Inc. and its subsidiaries in the United States and in foreign countries. All other trademarks are property of their respective owners.