q1 - startseite - indus holding ag this experience and expertise, i am convinced that i can provide...
TRANSCRIPT

q1Interim Report First Quarter 2012
INDUS Sets Ambitious Goals for 2012
• Sales and earnings position according to plan, EBIT margin reaches 9.2 % at beginning of year
• Second best quarter after Q1 2011 in past five years
• Sales and earnings forecast confirmed for full year 2012

1
Key Figures
INDUS Holding AG
–1.7 % +5.2 %
K
Automotive Components/Engineering
Construction/Infrastructure
EUR millions Q1 2012 Q1 2011
Sales 260.9 255.6
EBITDA 34.7 37.3
EBIT 24.1 27.4
EBT 18.4 23.0
Net result for the period (allocable to INDUS shareholders) 11.3 15.4
Operating cash flow –32.6 –8.3
Cash flow from operating activities –38.3 –14.2
Cash flow from investing activities –13.6 –8.4
Cash flow from financing activities 36.0 2.2
Cash and cash equivalents 107.1 76.7
Earnings per share (in EUR) 0.51 0.76
Cash flow per share (in EUR) –1.72 –0.70
Employees (number as of March 31) 6,885 6,505
Investments (number as of March 31) 39 39
EUR millions March 31, 2012 Dec. 31, 2011
Total assets 1,083.5 1,040.2
Equity 391.8 382.1
Net debt 363.2 311.2
Equity ratio (in %) 36.2 36.7
Total sales in Q1:EUR 260.9 million

1
2 Letter to the Shareholders 4 Transfer of Leadership 6 Questions for Rudolf Weichert
7 News from the Group
8 INDUS on the Capital Market
10 Interim Management Report 19 Consolidated Interim Financial Statements as of March 31, 2012
32 Contact and Financial Calendar
+0.7 % +0.5 % +2.1 %
Contents C
Engineering Medical Engineering/Life Science
Metal/Metal Processing
pR
OFI
LEINDUS is the leading specialist in the field of sustainable investment in German small and medium-sized companies. We mainly acquire owner-managed companies and support their business development entrepreneurially with a long-term orientation. Our subsidiaries are charac-terized in particular by their strong positions in specific niche markets. Our goal is to achieve lasting value appreciation for our portfolio that is both healthy and measured. We do this by main-taining a diversified investment structure and a corporate policy geared toward stable yields.
All of our decisions are guided by the long-term development of each and every company. We give our companies reliable perspectives and allow them entrepreneurial scope for action.
In 2011, our Group’s workforce of around 6,700 generated sales of EUR 1,105 million and EBIT of approximately EUR 112 million.

2 3
LEttErTO ThE ShAREhOLDERS L
Ladies and Gentlemen,
2011 was a record year for INDUS. But how do the prospects look for
INDUS in 2012? At the end of April, we were cautiously optimistic in
our outlook for the current fiscal year. Even now we remain confident
about the full year and wish to build on the successful 2011 fiscal
year. We believe that the special boom enjoyed by German industry is
now being followed by a return to normal. Our economy is strong,
but it cannot entirely detach itself from the global economic situation.
In addition, the European debt crisis still has not been resolved.
however, the dynamic remains good primarily in the newly indus tri-
alizing countries and in Germany as well. Although we do not
currently see the onset of a recession, we are planning carefully.
Never theless, we have set ambitious goals for ourselves in 2012:
INDUS should produce a double-digit EBIT margin in the current
year, though this target may appear challenging in this environment.
Economic momentum is still good, also in Germany. Trend: >

3
Sh
ar
eh
old
er
S
I
nte
rIm
FIn
an
cIa
l r
ep
or
t
helmut Ruwisch Jürgen Abromeit Dr. Wolfgang höper Dr. Johannes Schmidt
Results in the first quarter of 2012 confirm our assessment: the economy remains stable for the most part, but at a more subdued level and with varying dynamism in individual sectors. We already perceived this slowdown in the fourth quarter of 2011. These business conditions continued into January and February. Business activity then picked up pleasingly in March as incoming orders surged. In the first quarter of 2012, our Group generated sales of EUR 260.9 million, slightly above the level of the corresponding quarter in 2011. In terms of earnings, we did not match the level of the extraordinarily good first quarter of 2011. The earnings situation continued as expected with an EBIT margin of 9.2 %, the same as in the fourth quarter of 2011.
We are pleased with current quarterly earnings as we achieved a good result with an EBIT of EUR 24.1 million. The course of business is consistent with the budget plan. The somewhat weaker earnings situation is primarily the result of higher personnel expenses. As early as the beginning of the year, INDUS began to exploit opportunities intensively to pass on prices to customers and introduced targeted cost optimization measures.
Dear shareholders, on the occasion of the upcoming Annual Shareholders’ Meeting on July 3 in Cologne, to which we cordially invite you once again, our Chairman of the Board of Management, helmut Ruwisch, will retire and hand over his office to his successor, Jürgen Abromeit. Following the start-up phase engineered by our founder Dr. Kill, Mr. Ruwisch has had a substantial impact on the development of INDUS over the past ten years.
Bergisch Gladbach, Germany, May 2012
Yours,The Board of Management
Given the performance in Q1, we are optimistic that we will reach our goals for 2012. Trend: >

4 5
At the 2012 Annual Shareholders’ Meeting,
Jürgen Abromeit will assume the chairmanship
of the Board of Management from helmut
Ruwisch. In view of this change in leadership,
the question poses itself: What does this mean
for the future of INDUS?
Another important element of a successful transfer of authority is choosing the right time. A good time is when tasks have been successfully accomplished.
INDUS will remain on track in the future, building on its very strong foundation. In the current phase of major market volatility, the Group will focus increas-ingly on strengthening its resilience and thus the potential of its portfolio companies. A concurrent goal is to expand the portfolio through targeted acquisitions, particularly in industry segments offering promising growth opportunities.
The INDUS business model is based on taking entrepreneurial advantage of the SME strengths of individual portfolio companies
in order to continue to grow – under the stable umbrella of a financially strong holding. INDUS was launched with this business model in 1986. And this model will stand the test of time when the Group is under new management.
ThE INDUS MoDEl WIll STAND ThE TEST of TIME
trANSFErOF LEADERShIp t

5
the successful assumption of authority requires knowledge of the company along with the determination to undertake new initiatives, while preserving the company’s strengths.
ThE INDUS MoDEl WIll STAND ThE TEST of TIME
Without abandoning its solid foundation, INDUS will – while always keeping in mind key balance sheet metrics – augment its growth efforts. The growth is to be achieved in part from the existing portfolio, but also through targeted acquisitions. One of the Group’s strengths is the diversity and scope of its portfolio. So that the Group’s range of activities keeps pace with the times, the holding will intensify its external growth and under-take acquisitions in the industrial sectors of the future, such as medical engineering, life science, environment, mobility, energy, infrastructure, or logistics. At the same time, the portfolio companies remain opera-tionally independent, as INDUS continues to view its executives at the managing director level as “local entrepreneurs.” This has been and remains one of the strengths of INDUS.
INDUS’s start-up phase was characterized by very dynamic growth in the first few years. The successful initial public offering in 1995 facilitated additional growth and accelerated the expansion and refinement of the portfolio. Years of expansion were followed by a consolidation phase. The pace of growth seen in the start-up years then naturally slowed. Operational tasks, the portfolio optimization and the establishment of a robust financial structure for the future received increased attention. The result today is a strong portfolio consisting of 39 companies with solid performance, an outstanding equity base, and com-fortable, stable financing.
Some 26 years after its founding, INDUS is on the verge of a managerial change. A change that is oriented toward continuity. INDUS is and remains a serious financial investor in the SME sector that assumes responsibility for the lifetime achievements of company founders in order to ensure their success over the long term. But as it is always the case when new leaders take over the helm, new points of emphasis will be set as well:

6 7
Mr. Weichert, why did you decide on INDUS in particular?I was raised in a family of entrepreneurs. In additi-on, successful corporate development has always guided my actions in my career until now in auditing and consulting. What impressed me about INDUS were the concept of sustainably developing portfolio companies, the quality of the portfolio, and the pro-fessionalism of the corporate management. I was similarly impressed by the corporate culture. INDUS both promotes and demands entrepreneurial thought and action at all levels and offers portfolio
companies the greatest possible entrepreneurial freedom.
What will you focus on in your new role?As a former auditor and tax consultant, my main area of expertise of course lies in such areas as accounting and taxes. I will also continue to work on GRC-topics (Governance Risk Compliance), which more and more are moving into focus. In addition, I will serve as a responsible managing director for 11 portfolio companies in the future. As a result of my activities until now, I have a profound understanding of an extremely wide range of industrial markets and sectors. I believe that I can therefore properly assess their idiosyncrasies as well as the opportunities and risks of various business models. Based on this experience and expertise, I am convinced that I can provide important impetus to the further development of the INDUS portfolio.
What goal have you set for yourself for the near future?The portfolio companies and the persons acting on their behalf are the heart of INDUS. I would like to get to know all of them personally as soon as possible. At the moment, I am already visiting subsidiaries and am becoming acquainted with our internal procedures and processes. The short-term goal for the coming weeks is the seamless transfer of authority in the Board of Management.
prior to joining the INDUS Board of Management, Rudolf Weichert, 49, was
partner at the Düsseldorf office of the auditing firm KpMG for nine years, of which
he spent three years in Detroit/USA, supervising companies in the automotive,
mechanical and plant engineering, and multi metal trading industries. The
business studies graduate worked for a total of nearly 20 years for KpMG, mainly based in Düsseldorf/Germany, where he
primarily handled accounts in the industrial sector. Further branch emphasis of his
work were the sectors Biotechnology/Life Science as well as Renewable Energy.
qUEStIoNS FOR RUDOLF WEIChERT q
Rudolf Weichert joins the Board of Management of INDUS holding AG. > June 1, 2012

7
Sh
ar
eh
old
er
S
I
nte
rIm
FIn
an
cIa
l r
ep
or
t
NEWS FROM ThE GROUp N
> June 1, 2012
ASS Invests four Million EuroThe specialist for robotic hands is building a new production facility and corporate headquar-
ters. Since the leased premises in Overath have become too small for the growing company, a new facility is being constructed near German Federal Motorway 4. ASS is the technology leader for robotic hands, grippers, and automation equipment. For almost 30 years, approximately 80 employees in Germany and the US have de-veloped intelligent solutions in the areas of automation and robotics.
Köster & Co. Gmbh Celebrates 60 Years In 1952, Bruno Köster founded Köster & Co. Gmbh and began to produce welding studs for the power plant and shipbuilding industries. Almost 30 years later, his son and successor Detlef Köster exported
the world’s first compact welding stud machines under the KÖCO brand. During the 1990s, KÖCO expanded in Europe. It branched out into the US in 1991 and China in 1998. Today, the products are used in more than 60 countries. Since 2008, KÖCO has been part of INDUS holding AG. The KÖCO brand stands for safety and innova-tion in the areas of welding studs and connector technology in manifold applications.
S.M.A. Subsidiary Recognized as Supplier of the Year at VWThe Backnang-based automotive supplier S.M.A. Engineering South Africa Ltd. received an award from VW at the annual Supplier Awards. Every year the Wolfsburg company honors excep-
tional commitment on the part of its suppliers. S.M.A. Metalltechnik develops and produces air conditioning, heating, cooling, and lubricant lines for vehicles. The company operates plants in Backnang, halle, and East London (South Africa).
ofa Receives Design AwardCompression stockings are used for venous diseases and certainly do not stand for couture. But the enhancements that Bamberg-based specialty company Ofa applied to its
“Memory” product line has earned outstanding ratings. The stockings are available in 12 stylish colors. They are gentle to the skin, creatively packaged, and also come with an innovative aloe vera skin care solution. For the jurors of the red dot design museum in Essen, it was worthy of an award this year. The red dot design award is an internationally recognized design competition that is sponsored by the Design Zentrum Nordrhein - Westfalen.

8 9
INDUSON ThE CApITAL MARKET C
Performance Slightly Better than SDAX The INDUS share closed the first quarter of 2012 at EUR 23.15, approximately 23 % above the closing price in 2011. Accordingly, the share performed slightly better than the SDAX benchmark index as well as the DAX leading index, which rose during the same period by 17 % and 18 % respectively. In the joint SDAX and MDAX ranking list as of the reporting date of March 31, INDUS took 55th place for free market capitalization and 71st place for stock exchange turnover (rank as of Dec. 31, 2011: 58 and 67).
Dividend Increase to EUR 1.00 per ShareThe Board of Management and the Supervisory Board proposed to the Annual Share-holders’ Meeting that a dividend payment of EUR 1.00 per share be made for the 2011 fiscal year. We thus remain committed to our ambitious dividend policy of paying out approximately EUR 22.2 million to our shareholders. Consequently, the company intends to distribute some 50 % of corporate earnings to shareholders. Based on the closing price for 2011, the INDUS share offers a high dividend yield of 5.3 %. Maintaining the existing dividend policy will ensure that the interests of all shareholders as well as of the company and its creditors continue to be respected, with the goal of remaining on a stable and sustainable growth path.
> proposed dividend of EUr 1.00 per share> Increase of 11% from the previous year > high dividend yield of > 5.3 %
overview of the INDUS Share
Q1 2012 Full year 2011
peak price in EUR 23.72 24.90
Lowest price in EUR 19.59 16.85
Closing price (at cut-off date) in EUR 23.15 18.86
Average daily turnover in number of shares 29,129 40,168
Number of shares 22,227,737 22,227,737 *
Market capitalization in EUR million 514.57 419.22
*per Dec. 31, 2011

9
Sh
ar
eh
old
er
S
I
nte
rIm
FIn
an
cIa
l r
ep
or
t
2002 2003 2004 2005 2006 2007 2008 2009 2010 2011
1.15 1.18 1.18 1.20 1.20 1.20
6.7
%
5.8
%
5.4
%
4.1
%
4.1
% 4.9
%
6.0
%
4.1
%
5.3
%
4.2
%
0.800.90
0.50
EUR
1.6
1.2
0.8
0.4
0
4
5
6
7
8
1.00
> 5.3 %
0,9
1,0
1,1
1,2
1,3
Index
130
120
110
100
90
INDUS Share price in EUR
■ SDAX ■ INDUS
Performance of the INDUS Share
Dividend per Share with Dividend Yield 2002 to 2011
JANUARY FEBRUARY MARCh
24
22
20
18

1110 11
INtErIM MANAGEMENT REpORT M
Business Performance of the INDUS Group in First quarter of 2012After a rather subdued fourth quarter of 2011, the business situation remained unchanged at the start of 2012, but improved noticeably in February and March. Accordingly, sales rose slightly in the first quarter to EUR 260.9 million, or 2 % above the corresponding quarter of the previous year. Earnings before interest and taxes (EBIT) did not reach the record level of Q1 2011, but stood at a satisfactory level of EUR 24.1 million, as expected. Material costs declined slightly despite somewhat higher sales, while higher personnel expenses had an adverse impact on earnings.
Consolidated Statement of Income
EUR millions Q1 2012 Q1 2011
Sales 260.9 255.6
Other operating income 4.1 3.8
Own work capitalized 0.9 0.3
Change in inventories 13.1 14.8
Cost of materials –133.6 –134.5
personnel expenses –75.5 –68.9
Depreciation and amortization –10.7 –9.9
Other operating expenses –35.2 –33.9
Other financial result 0.04 0.05
Operating result (EBIT) 24.1 27.4
Net interest –5.6 –4.4
Earnings before taxes 18.4 23.0
Taxes –7.2 –7.4
Income from discontinued operations 0 0
Earnings after taxes 11.3 15.5
of which allocable to non-controlling shareholders 0 –0.1
of which allocable to INDUS shareholders 11.3 15.4
> Sales + 2 %> EBIT of EUr 24.1 Million > Very good EBIT margin of 9.2 %

11
Sh
ar
eh
old
er
S
i
nte
rim
fin
an
cia
l r
ep
or
t
11
Earnings Position: Total Sales in Q1 Already at EUR 260.9 Million, operating Result of EUR 24.1 MillionOverall, INDUS holding AG’s business developed satisfactorily in the first quarter of 2012. Given higher demand, particularly in March, sales rose again slightly. In the first three months, the segment companies generated sales that were around EUR 5.3 million higher than in the same period of the previous year. INDUS holding AG’s Group sales reached EUR 260.9 million in the first three months (previous year Q1: EUR 255.6 million). Despite a slightly higher orders situation, the cost of materials remained stable at EUR 133.6 million (previous year Q1: EUR 134.5 million). The cost of materials ratio of 51.2 % (previous year Q1: 52.6 %) stood at a slightly lower level than in the previous year. The subsiding growth dynamic of the past two quarters had a somewhat price- stabilizing effect here. At the same time, personnel expenses rose significantly, going from EUR 68.9 million to EUR 75.5 million. The higher personnel expenses ratio of 28.9 % (previous year Q1: 27.0 %) reflected the delayed impact of the rapid buildup of personnel due to the strong orders situation in 2010 and 2011. Other operational expenses rose slightly from EUR 33.9 million in the first quarter 2011 to EUR 35.2 million in Q1 2012.
Earnings before interest, taxes, depreciation, and amortization (EBITDA) of EUR 34.7 million fell short of the record result in Q1 2011 with EUR 37.3 million. At EUR 10.7 million, write-downs were slightly higher than in the comparison period (previous year Q1: EUR 9.9 million). The operating result before interest and taxes (EBIT) of EUR 24.1 million as of March 31, 2012 was approximately EUR 3.3 million lower than in the comparison period of 2011 (previous year Q1: EUR 27.4 million). The EBIT margin of 9.2 % (previous year Q1: 10.7 %) was above the long-term average and in budget. It immediately reached the level of the recovery year of 2010 (EBIT margin in Q1 2010: 9.4 %).
Interest expenses came to EUR 5.8 million, or EUR 1.2 million above the previous year’s figure of EUR 4.6 mil-lion, primarily due to valuation effects. Interest income of EUR 0.2 million (previous year Q1: EUR 0.1 million) remained at the low level in evidence since the financial crisis. Earnings before taxes (EBT) fell from EUR 23.0 million in the first quarter 2011 to EUR 18.4 million in Q1 2012.
Group tax expenses of EUR 7.2 million nearly reached the same level as in the last year’s first quarter (Q1 2011: EUR 7.4 million). Excluding non-controlling interests, the result for the period of EUR 11.3 million declined by about EUR 4.1 million from the corresponding period of the previous year (Q1 2011: EUR 15.4 million). This corresponds to earnings per share of EUR 0.51 (previous year Q1: EUR 0.76).
> Good earnings position at beginning of year despite muted start

1312 13
Segment report
Course of Business in the Segments
INDUS holding AG’s investment portfolio is structured in five segments: Construction/Infrastructure, Auto-motive Components/Engineering, Engineering, Medical Engineering/Life Science, and Metal/Metal processing. The investment portfolio encompassed 39 operating units as of March 31, 2012.
INDUS Construction/Infrastructure Segment
In the first quarter, segment sales of EUR 46.4 million were slightly below the extraordinarily good level of EUR 47.2 million seen in 2011. As a result, the portfolio companies achieved a very good result despite the fierce onset of winter in February. Due to the short winter period the segment companies universally decided to main-tain their employee levels, with a corresponding effect on personnel expenses. Earnings before interest and taxes (EBIT) totaled EUR 3.4 million (previous year Q1: EUR 4.1 million). The EBIT margin of 7.3 %, which was above the long-term average, was particularly good in view of the traditionally weak first quarter for the construction sector.
EUR millions Q1 2012 Q1 2011 Change
Sales 46.4 47.2 –1.7 %
EBIT 3.4 4.1 –17.1 %
EBIT margin in % 7.3 8.7 –1.4 % pts.
Depreciation/amortization 1.2 1.2 0 %
Capital expenditure 1.8 1.4 +28.6 %
INDUS Automotive Components/Engineering Segment
Sales in the Automotive Components/Engineering segment rose again by about 5 % from the previous quarter. The reason was the unabatedly strong orders situation, which as early as the fourth quarter of 2011 caused the segment companies not to schedule Christmas vacations for the most part. Although sales of EUR 84.4 million grew in the first three months of the year from the comparison period (previous year Q1: EUR 80.2 million), earn-ings before interest and taxes (EBIT) of EUR 5.4 million experienced below-trend development and fell short of the previous year’s level of EUR 6.4 million. The high number of term and contract employees required by many call-off orders and correspondingly higher personnel costs from high working time accounts had an adverse impact on earnings. The EBIT margin reached 6.4 %.
> Construction/Infrastructure: Good earnings situation in a usually weak Q1
> Automotive Components/Engineering: Sales increase; higher personnel costs reduce earnings

13
Sh
ar
eh
old
er
S
i
nte
rim
fin
an
cia
l r
ep
or
t
13
EUR millions Q1 2012 Q1 2011 Change
Sales 84.4 80.2 +5.2 %
EBIT 5.4 6.4 –15.6 %
EBIT margin in % 6.4 8.0 –1.6 % pts.
Depreciation/amortization 5.4 5.0 + 8 %
Capital expenditure 6.1 4.5 + 35.6 %
INDUS Engineering Segment
The companies in the Engineering segment generated nearly the same level of sales in the first three months of 2012 as in the previous year’s quarter. Segment sales of EUR 30.6 million were almost 1 % higher than EUR 30.4 million in the previous year. Current incoming orders and order backlog indicate that business in the late-cyclical Engineering segment can be expected to remain stable over the course of 2012. Earnings before interest and taxes decreased from EUR 3.7 million to EUR 3.4 million, while the EBIT margin is currently a very good 11.1 % (previous year Q1: 12.2 %).
EUR millions Q1 2012 Q1 2011 Change
Sales 30.6 30.4 +0.7 %
EBIT 3.4 3.7 –8.1 %
EBIT margin in % 11.1 12.2 –1.1 % pts.
Depreciation/amortization 0.7 0.5 +40.0 %
Capital expenditure 0.8 0.4 +100 %
INDUS Medical Engineering/Life Science Segment
The INDUS Group’s Medical Engineering/Life Science segment is maintaining the stability seen in previous quarters. Sales grew constantly and steadily, reaching EUR 22.0 million in the first quarter 2012 (previous year Q1: EUR 21.9 million). Earnings before interest and taxes (EBIT) of EUR 4.0 million were well above the previous year with EUR 3.5 million. The EBIT margin in the first quarter of 2012 reached an extraordinarily good 18.2 % (previous year Q1: 16.0 %).
> Engineering: Stable earnings position with good EBIt margin of 11.1 %
> Medical Engineering/Life Science: EBIt margin of over 18 %

1514 15
EUR millions Q1 2012 Q1 2011 Change
Sales 22.0 21.9 + 0.5 %
EBIT 4.0 3.5 +14.3 %
EBIT margin in % 18.2 16.0 2.2 % pts.
Depreciation/amortization 0.6 0.7 –14.3 %
Capital expenditure 0.8 0.5 +60 %
INDUS Metal/Metal Processing Segment
In line with the strong orders situation in the automotive industry, the INDUS Metal/Metal processing segment experienced strong growth at the beginning of 2012. Sales in the first three months of 2012 of EUR 77.4 million rose from EUR 75.8 million in the first quarter of the previous year, or by about 2 %. however, earnings before interest and taxes (EBIT) suffered from high raw material prices and additional personnel costs, reaching EUR 8.8 million or about 18 % lower than in the previous year. This segment displayed a very good earnings position compared to the levels achieved in the first quarters of recent years. The EBIT margin of 11.4 % (previ-ous year Q1: 14.1 %) surpassed the figure of 11.0 % in 2010.
EUR millions Q1 2012 Q1 2011 Change
Sales 77.4 75.8 + 2.1 %
EBIT 8.8 10.7 –17.8 %
EBIT margin in % 11.4 14.1 –2.7 % pts.
Depreciation/amortization 2.6 2.4 +8.3 %
Capital expenditure 3.7 1.4 +164 %
Employees
In line with the orders situation, the INDUS Group companies expanded employment in 2010 and 2011, particu-larly building up flexible capacity. At the end of the first quarter 2012, the segment companies had an average of 6,885 employees (as of December 31, 2011: 6,733 employees). This reflects the delayed impact already mentioned. Already at the turn of the year the companies had begun to use their flexibility to adjust the personnel expenses ratio to the accustomed level in a timely manner.
> Metal/Metal processing: Slight sales growth of 2.1 %, double-digit EBIT margin at long-term high

15
Sh
ar
eh
old
er
S
i
nte
rim
fin
an
cia
l r
ep
or
t
15
Financial and Assets Position Statement of Cash flows (Key figures)
EUR millions Q1 2012 Q1 2011
Operating cash flow –32.6 –8.3
Interest –5.7 –5.9
Cash flow from operating activities –38.3 –14.2
Cash outflow from investments –13.6 –8.4
Cash flow from investing activities –13.6 –8.4
Cash inflows from the assumption of debt 62.7 41.6
Cash outflows from the repayment of debt –26.7 –39.3
Cash flow from financing activities 36.0 2.2
Net cash change in financial facilities –15.9 –20.4
Changes in cash and cash equivalents caused by currency exchange rates –0.2 0.2
Cash and cash equivalents at the beginning of the period 123.1 96.8
Cash and cash equivalents at the end of the period 107.1 76.7
Statement of Cash flows: high liquidity of About EUR 107 Million at Beginning of YearBased on earnings after taxes of EUR 11.3 million (previous year Q1: EUR 15.5 million), operating cash flow in the first quarter amounted to EUR –32.6 million, driven in part by a combination of a slight increase in accounts receivables and in inventories, as well as a reduction of liabilites. As a result, operating cash flow was significantly below the previous year’s value of EUR –8.3 million. The cost of interest paid fell in the first three months of 2012 to EUR 5.8 million (previous year Q1: EUR 6.0 million), slightly improving the cash flow from operating activities, which amounted to EUR –38.3 million (previous year Q1: EUR –14.2 million). Cash flow from investing activities increased from EUR –8.4 million in the first quarter of 2011 to currently EUR –13.6 million, due to higher capital expenditure for property, plant, and equipment. Cash flow from financing activities increased significantly, from EUR 2.2 million to EUR 36.0 million. This was primarily attributable to an increase in new borrowings, including a new ABS program established at the beginning of the year, and higher redemptions compared to the previous year’s period. Accordingly, cash and cash equivalents reached the high level of EUR 107.1 million as of March 31, 2012 (previous year Q1: EUR 76.7 million).

16 17
Consolidated Statement of financial Position (Key figures)
EUR millions March 31, 2012 Dec. 31, 2011
ASSETS
Noncurrent assets 577.1 575.3
property, plant, and equipment 573.1 570.0
Accounts receivable 4.0 5.3
Current assets 506.4 464.8
Cash and cash equivalents 107.1 123.1
Accounts receivable 163.8 118.9
Inventories 235.5 222.8
total assets 1,083.5 1,040.2
EQUITY AND LIABILITIES
Noncurrent liabilities 767.9 755.2
Equity 391.8 382.1
Liabilities 376.1 373.1
thereof provisions 18.9 18.5
thereof current liabilities and income taxes 357.2 354.6
Current liabilities 315.6 285.0
thereof provisions 48.8 47.0
thereof liabilities 266.8 238.0
total equity and liabilities 1,083.5 1,040.2
Statement of financial Position: Equity Ratio Stable at 36 %The total assets of INDUS holding AG, which amounted to EUR 1,083.5 million as of March 31, 2012 (Dec. 31, 2011: EUR 1,040.2 million), again grew slightly, reflecting the good performance of the economy. Cash and cash equivalents fell slightly from EUR 123.1 million to EUR 107.1 million, but still remain at a high level. Accounts receivable and inventories increased again by about EUR 58 million due to the good orders situation. The Group’s equity of EUR 391.8 million climbed again from the end of 2011 (Dec. 31, 2011: EUR 382.1 million). As a result, the equity ratio remained high at 36.2 % (Dec. 31, 2011: 36.7 %). The Group’s net debt amounted to EUR 363.2 mil-lion (Dec. 31, 2011: EUR 311.2 million).

17
Sh
ar
eh
old
er
S
i
nte
rim
fin
an
cia
l r
ep
or
t
opportunities and risks
INDUS holding AG and its portfolio companies are exposed to a multiplicity of risks as a result of their interna-tional activities. Entrepreneurial action is inextricably linked with risk-taking. At the same time, this enables the company to seize new opportunities and thereby safeguard and strengthen the position on the market occupied by its portfolio companies. The company operates an efficient risk management system for the early detection, comprehensive analysis, and systematic handling of risks.
The structuring of the risk management system and the significance of particular risks are discussed in detail in the 2011 annual report on pages 54 to 62. It is stated there that the company does not view itself as subject to any risks that could endanger its continued existence as a going concern. The annual report for INDUS holding AG can be downloaded free of charge at www.indus.de.
Events after the reporting Date
On April 20, the Supervisory Board and Board of Management of INDUS holding AG declared in an ad-hoc announcement that Chairman of the Board of Management helmut Ruwisch would transfer the chairmanship to his successor Jürgen Abromeit, effective July 3. Mr. Abromeit has been a member of the INDUS Board of Management since 2008, where he has been primarily responsible for corporate acquisitions and equity holdings management. previously, he served for ten years as Finance Director, Managing Director, and finally as Executive Manager of the steel and engineering division he established for the steel company Georgsmarienhütte (GMh). In addition, Dr. Wolfgang höper will be retiring at his own request. his successor is Rudolf Weichert, who will join the Board of Management with effect from June 1, 2012. previously, Rudolf Weichert was partner for nine years at the Düsseldorf office of the auditing firm KpMG.
> Opportunities from global economic growth > Risks from the debt crisis; inflationary tendencies in Asia

18 19
outlook
In the first two months of 2012, business developed as expected, in line with the previous quarter of 2011. however, March indicated an increase in momentum. In subsequent months, the Board of Management expects this momentum to continue: worldwide economic growth should continue over the remainder of 2012, although the German economy will presumably not be able to develop the level of growth seen in 2011. Uncertainties in the financial markets are dampening prospects for growth.
A positive impetus is expected from the newly industrializing countries. As far as sales are concerned, we want to keep up last year’s good performance in the current fiscal year, but the current collective bargaining rounds will have an adverse impact. Given these circumstances, the 10 % EBIT margin target we have set ourselves seems quite ambitious.
> INDUS confirms outlook

19
Sh
ar
eh
old
er
S
i
nte
rim
fin
an
cia
l r
ep
or
t
CoNSoLIDAtED INTERIM FINANCIAL STATEMENTS F
20 Consolidated Statement of Income 20 Statement of Income and Accumulated Earnings
21 Consolidated Statement of Financial position 22 Consolidated Statement of Cash Flows
23 Consolidated Statement of Equity
24 Notes to the Consolidated Financial Statements
Contents
> Total assets rise slightly to EUr 1.08 billion> Equity ratio remains high at 36.2 %> high liquidity of EUr 107.1 million

20 21
EUR ’000 Notes Q1 2012 Q1 2011
Sales 260,918 255,636
Other operating income 4,109 3,753
Own work capitalized 939 297
Change in inventories 13,066 14,847
Cost of materials (2) –133,618 –134,468
personnel expenses (3) –75,469 –68,936
Depreciation and amortization (4) –10,659 –9,855
Other operating expenses (5) –35,248 –33,904
Income from shares accounted for using the equity method 0 0
Other financial result 42 52
Operating result (EBIT) 24,080 27,422
Interest income 164 123
Interest expenses –5,802 –4,570
Net interest (6) –5,638 –4,447
Earnings before taxes 18,442 22,975
Taxes (7) –7,150 –7,429
Income from discontinued operations 0 0
Earnings after taxes 11,292 15,546
of which allocable to non-controlling shareholders 1 –173
of which allocable to INDUS shareholders 11,293 15,373
Basic earnings per share in EUR (1) 0.51 0.76
Consolidated Statement of Income
EUR ’000 Q1 2012 Q1 2011
Earnings after taxes 11,292 15,546
Currency translation adjustment –574 320
Change in the market values of derivative financial instruments –1,258 797
Netting of deferred taxes 199 –126
Income and expenses recognized directly in equity –1,633 991
Total income and expenses recognized in equity 9,659 16,537
of which allocable to non-controlling shareholders –1 174
of which allocable to INDUS shareholders 9,660 16,363
Statement of Income and Accumulated Earnings
21
Sh
ar
eh
old
er
S
i
nte
rim
fin
an
cia
l r
ep
or
t
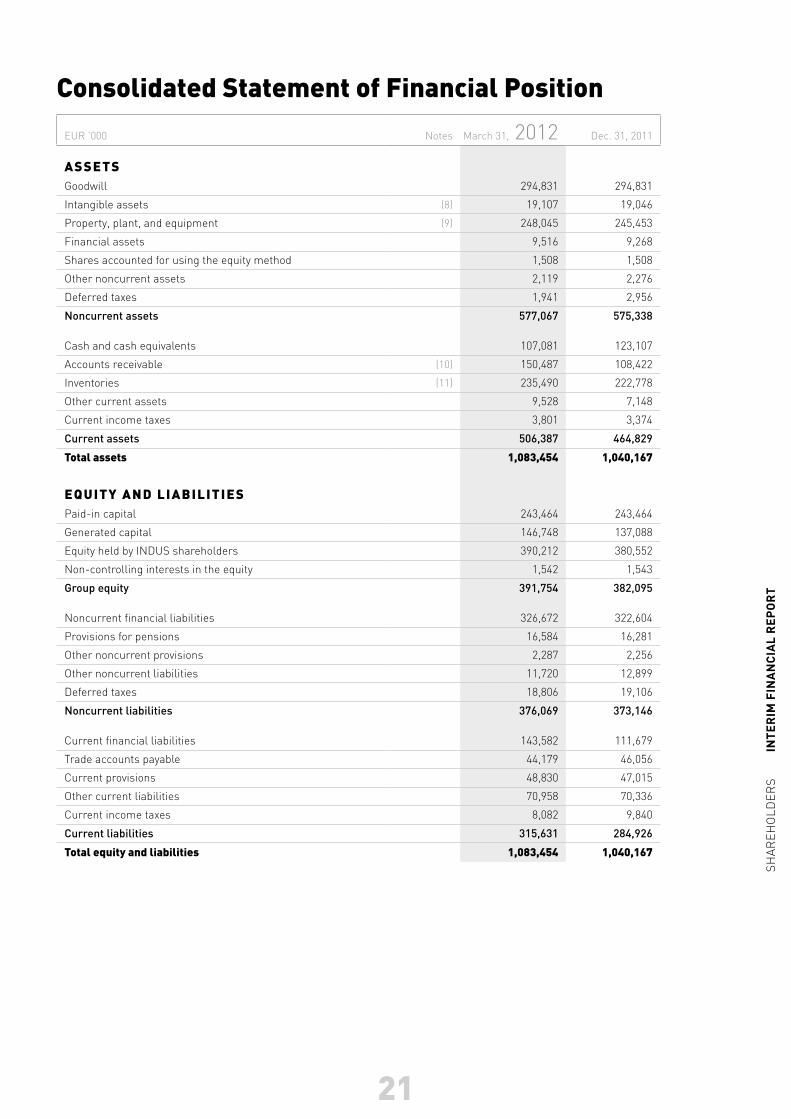
Consolidated Statement of Financial Position
EUR ’000 Notes March 31, 2012 Dec. 31, 2011
ASSEtSGoodwill 294,831 294,831
Intangible assets (8) 19,107 19,046
property, plant, and equipment (9) 248,045 245,453
Financial assets 9,516 9,268
Shares accounted for using the equity method 1,508 1,508
Other noncurrent assets 2,119 2,276
Deferred taxes 1,941 2,956
Noncurrent assets 577,067 575,338
Cash and cash equivalents 107,081 123,107
Accounts receivable (10) 150,487 108,422
Inventories (11) 235,490 222,778
Other current assets 9,528 7,148
Current income taxes 3,801 3,374
Current assets 506,387 464,829
total assets 1,083,454 1,040,167
EqUItY AND LIABILItIES paid-in capital 243,464 243,464
Generated capital 146,748 137,088
Equity held by INDUS shareholders 390,212 380,552
Non-controlling interests in the equity 1,542 1,543
Group equity 391,754 382,095
Noncurrent financial liabilities 326,672 322,604
provisions for pensions 16,584 16,281
Other noncurrent provisions 2,287 2,256
Other noncurrent liabilities 11,720 12,899
Deferred taxes 18,806 19,106
Noncurrent liabilities 376,069 373,146
Current financial liabilities 143,582 111,679
Trade accounts payable 44,179 46,056
Current provisions 48,830 47,015
Other current liabilities 70,958 70,336
Current income taxes 8,082 9,840
Current liabilities 315,631 284,926
total equity and liabilities 1,083,454 1,040,167

22 23
Consolidated Statement of Cash Flows
EUR ’000 Q1 2012 Q1 2011
Income after taxes generated by continuing operations 11,292 15,546Depreciation/Write-ups of noncurrent assets (excluding deferred taxes) 10,659 9,855Taxes 7,150 7,429Net interest 5,638 4,447Other non-cash transactions –907 –727Changes in provisions 2,149 –742Increase (-)/decrease (+) in inventories, trade accounts receivable and other assets not allocable to investing or financing activities –56,412 –52,101Increase (+)/decrease (-) in trade accounts payable and other liabilities not allocable to investing or financing activities –3,761 14,572Income taxes received/paid –8,441 –6,628Dividends received 0 0Operating cash flow –32,633 –8,349
Interest paid –5,805 –5,997Interest received 164 123Cash flow from operating activities –38,274 –14,223
Cash outflow from investments in property, plant, and equipment and intangible assets –13,312 –8,189 financial assets –289 –251Cash inflow from the disposal of other assets 41 35Cash flow from investing activities –13,560 –8,405
Cash inflows from the assumption of debt 62,696 41,559Cash outflows from the repayment of debt –26,725 –39,339Cash flow from financing activities 35,971 2,220
Net cash change in financial facilities –15,863 –20,408Changes in cash and cash equivalents caused by currency exchange rates –163 220Cash and cash equivalents at the beginning of the period 123,107 96,840Cash and cash equivalents at the end of the period 107,081 76,652

23
Sh
ar
eh
old
er
S
i
nte
rim
fin
an
cia
l r
ep
or
t
Consolidated Statement of EquityJan. 1 – March 31, 2012
EUR ’000
Opening balance
Jan. 1, 2012Dividend payment
Recognised income
and expenses
Closing balance
March 31, 2012
q1 2012
Subscribed capital 57,792 0 0 57,792
Capital reserve 185,672 0 0 185,672
Paid-in capital 243,464 0 0 243,464
Accumulated earnings 144,202 0 11,293 155,495
Currency translation reserve –1,278 0 –574 –1,852
Reserve for the marked-to-market valuation of financial instruments –5,836 0 –1,059 –6,895
Capital generated 137,088 0 9,660 146,748
Equity held by INDUS shareholders 380,552 0 9,660 390,212
Interests allocable to non-controlling shareholders 1,543 0 –1 1,542
Group equity 382,095 0 9,659 391,754
Jan. 1 – March 31, 2011
EUR ’000
Opening balance
Jan. 1, 2011Dividend payment
Recognised income
and expenses
Closing balance
March 31, 2011
q1 2011
Subscribed capital 52,538 0 0 52,538
Capital reserve 153,791 0 0 153,791
Paid-in capital 206,329 0 0 206,329
Accumulated earnings 106,969 0 15,373 122,342
Currency translation reserve –1,332 0 320 –1,012
Reserve for the marked-to-market valuation of financial instruments –4,153 0 671 –3,482
Capital generated 101,484 0 16,364 117,848
Equity held by INDUS shareholders 307,813 0 16,364 324,177
Interests allocable to non-controlling shareholders 1,676 0 173 1,849
Group equity 309,489 0 16,537 326,026
Reserves for currency translation and for the marked-to-market valuation of financial instruments include unrealized gains and losses. The change in reserves for the marked-to-market valuation of financial instruments is based exclusively on ongoing changes in marked-to-market valuation. There were no effects resulting from reclassification.
Interests held by non-controlling shareholders essentially consist of the non-controlling interests in the limited liability companies WEIGAND Bau Gmbh and SELZER Automotiva do Brasil. Interests held by non-controlling shareholders in limited partnerships and limited liability companies for which the economic ownership of the corresponding non-controlling interests had already been passed on under reciprocal option agreements and corporations consolidated according to the full goodwill method as a consequence of certain option contracts are shown under other liabilities. This relates in particular to SELZER Fertigungstechnik Gmbh & Co. KG, helmut RÜBSAMEN Gmbh & Co. KG and hAKAMA AG.

24 25
Notes to the Consolidated Financial Statements
General Information
INDUS holding AG, based in Bergisch Gladbach, Germany, entered in the Cologne commercial register (hRB 46360), prepared its consolidated financial statements for the first quarter of 2012 in accordance with Inter-national Financial Reporting Standards (IFRS) and the interpretation of such by the International Financial Reporting Interpretations Committee (IFRIC) as endorsed by the European Union. The consolidated financial statements are prepared in euros (EUR). Unless otherwise indicated, all amounts are stated in thousands of euros (EUR ‘000).
These interim financial statements are prepared in accordance with IAS 34 in condensed form. The interim report has not been audited and was not subject to a perusal or review by an auditor.
New obligatory standards are reported on separately in the section “Changes in Accounting Guidelines.” Other-wise, the same accounting methods are applied as in the consolidated financial statements for the 2011 fiscal year. They are described there in detail. Since these quarterly financial statements do not provide the compre-hensive information of the annual financial statements, these financial statements should be considered within the context of the last annual financial statements.
In the Board of Management’s view, this quarterly report includes all of the usual ongoing adjustments that are necessary for an appropriate presentation of the Group’s net assets, financial, and earnings position. The results achieved in the first quarter of fiscal year 2012 do not necessarily predict future business performance.
The preparation of consolidated financial statements is influenced by accounting and valuation principles and requires assumptions and estimates to be made which have an impact on the recognized value of the assets, liabilities, and contingent liabilities, as well as on income and expenses. When estimates are made regarding the future, actual values may deviate from the estimates. If the original basis for the estimates changes, the statement of the relevant items is adjusted through profit and loss.
Changes in Accounting Guidelines
All obligatory accounting standards in effect as of the 2012 fiscal year have been implemented in these interim financial statements. The guidelines to be applied for the first time have no material impact on the presentation of the net assets, financial, and earnings position.

25
Sh
ar
eh
old
er
S
i
nte
rim
fin
an
cia
l r
ep
or
t
Scope of Consolidation
In the consolidated financial statements, all subsidiary companies are fully consolidated if INDUS holding AG has the direct or indirect possibility of influencing the companies’ financial and business policy for the benefit of the INDUS Group. Associated companies for which the financial and business policy can be significantly influenced are consolidated using the equity method. Companies purchased during the course of the fiscal year are consolidated as of the date on which control over their finance and business policy is transferred. Compa-nies which are sold are no longer included in the scope of consolidation as from the date on which the business is transferred. After the date on which the decision is made to divest the company in question, they are classified as “held for sale”.
Business Combinations in Accordance with IFrS 3
No new portfolio companies were acquired or consolidated for the first time in either the current fiscal year or in the first quarter of the previous year.
Disposals in Accordance with IFrS 5
No portfolio companies were sold or classified as held for sale in either the first quarter of the current fiscal year or the previous year.
Earnings per share
[1] Earnings per share
EUR ’000 Q1 2012 Q1 2011
Earnings attributable to INDUS shareholders 11,293 15,373
Earnings attributable to discontinued operations 0 0
Earnings attributable to continuing operations 11,293 15,373
Shares in circulation (thousands) 22,228 20,207
Earnings per share, continuing operations (in EUR) 0.51 0.76
Earnings per share, discontinued operations (in EUR) 0.00 0.00
According to IAS 33, earnings per share are based on earnings after taxes from continuing operations. Earnings per share are calculated by dividing earnings from continuing operations by the average annual number of out-standing shares.
In the event of the authorized capital being utilized, dilutions will arise in the future.

26 27
Notes to the Statement of Income
[2] Cost of materials
EUR ’000 Q1 2012 Q1 2011
Raw materials and goods for resale –116,951 –118,983
purchased services –16,667 –15,485
total –133,618 –134,468
[3] Personnel expenses
EUR ’000 Q1 2012 Q1 2011
Wages and salaries –64,018 –58,114
Social security and pensions –11,451 –10,822
total –75,469 –68,936
[4] Depreciation, amortization, write-downs, impairment losses
EUR ’000 Q1 2012 Q1 2011
Depreciation of property, plant, and equipment and intangible assets –9,769 –9,040
Scheduled amortization of value-added within the Group –890 –815
total –10,659 –9,855
[5] other operating expenses
EUR ’000 Q1 2012 Q1 2011
Operating expenses –12,534 –11,722
Selling expenses –13,199 –12,360
Administrative expenses –6,728 –6,859
Other expenses –2,787 –2,963
total –35,248 –33,904

27
Sh
ar
eh
old
er
S
i
nte
rim
fin
an
cia
l r
ep
or
t
[6] Net interest
EUR ’000 Q1 2012 Q1 2011
Interest and similar income 164 123
Interest and similar expenses –5,569 –5,156
Interest from operations –5,405 –5,033
IFRS interest: market value of interest-rate swaps –13 626
IFRS interest: non-controlling interests –220 –40
IFRS interest –233 586
total –5,638 –4,447
[7] Income taxes
Income tax expense is calculated for the interim financial statements based on the assumptions of current tax planning.
Notes to Selected Statement of Financial Position Items
[8] Intangible assets
EUR ’000 March 31, 2012 Dec. 31, 2011
Capitalized development costs 9,099 9,320
property rights, concessions, and other intangible assets 10,008 9,726
total 19,107 19,046
[9] Property, plant, and equipment
EUR ’000 March 31, 2012 Dec. 31, 2011
Land and buildings 122,869 121,737
plant and machinery 82,451 85,377
Other equipment, factory and office equipment 30,617 29,734
Advance payments and plant under construction 12,108 8,605
total 248,045 245,453

28 29
[10] Accounts receivable
EUR ’000 March 31, 2012 Dec. 31, 2011
Accounts receivable from customers 143,248 101,573
Future accounts receivable from customer-specific construction contracts 7,239 6,397
Accounts receivable from associated companies 0 452
total 150,487 108,422
[11] Inventories
EUR ’000 March 31, 2012 Dec. 31, 2011
Raw materials and supplies 83,758 83,076
Unfinished goods 74,889 67,770
Finished goods and goods for resale 73,966 69,668
prepayments to third parties for inventories 2,877 2,264
total 235,490 222,778
Segment reporting
The classification of the segments corresponds to the current status of internal reporting. The information relates to the continuing activities.
The companies are allocated to the segments on the basis of their selling markets insofar as the bulk of their product range is sold in that market environment (Automotive Components/Engineering, Medical Engineering/Life Science). Otherwise they are classified by common features in their production structure (Construction and Infrastructure, Engineering, Metal/Metal processing). The reconciliations contain the figures of the holding company, non-operational units not allocated to any segment, and consolidations.
The central control variable for the segments is operating earnings (EBIT) as defined in the consolidated finan-cial statements. The segment information has been ascertained in compliance with the reporting and valuation methods that were applied during the preparation of the consolidated financial statements.

29
Sh
ar
eh
old
er
S
i
nte
rim
fin
an
cia
l r
ep
or
t
Segment reporting in accordance with IFRS 8Q1 2012EUR ’000
Construc-tion/Infra-structure
Automotive Components/
Engineering Engine ering
Medical Engineering/Life Science
Metal/Metal
processingTotal
segmentsRecon-
ciliation
Consoli-dated
financial statements
External sales 46,423 84,439 30,550 22,035 77,448 260,895 23 260,918
Internal sales 1,983 8,661 1,830 548 7,223 20,245 –20,245 0
Sales 48,406 93,100 32,380 22,583 84,671 281,140 –20,222 260,918
Segment earnings (EBIt) 3,426 5,361 3,359 3,961 8,831 24,938 –858 24,080
Earnings from equity valuation
Depreciation/Amortization –1,223 –5,446 –688 –628 –2,574 –10,559 –100 –10,659
of which scheduled deprecia-tion for wear and tear from first-time consolidation –95 –566 –137 –14 –78 –890 0 –890
of which unscheduled depreci-ation for wear and tear from first-time consolidation 0 0 0 0 0 0 0 0
Capital expenditure 1,806 6,128 832 845 3,692 13,303 81 13,384
of which company acquisitions 0 0 0 0 0 0 0 0
Shares accounted for using the equity method 1,508 0 0 0 0 1,508 0 1,508
Additional information: EBITDA 4,649 10,807 4,047 4,589 11,405 35,497 –758 34,739
Additional information: Goodwill 100,246 68,180 50,985 43,485 31,935 294,831 0 294,831
Segment reporting in accordance with IFRS 8Q1 2011EUR ’000
Construc-tion/Infra-structure
Automotive Components/
Engineering Engine ering
Medical Engineering/Life Science
Metal/Metal
processingTotal
segmentsRecon-
ciliation
Consoli-dated
financial statements
External sales 47,240 80,241 30,406 21,949 75,826 255,662 –26 255,636
Internal sales 1,505 6,263 1,873 457 5,059 15,157 –15,157 0
Sales 48,745 86,504 32,279 22,406 80,885 270,819 –15,183 255,636
Segment earnings (EBIt) 4,107 6,385 3,669 3,505 10,747 28,413 –991 27,422
Earnings from equity valuation 0 0 0 0 0 0 0 0
Depreciation/Amortization –1,195 –5,024 –467 –658 –2,411 –9,755 –100 –9,855
of which scheduled depre-ciation for wear and tear from first-time consolidation –114 –602 –8 –13 –78 –815 0 –815
of which unscheduled depre-ciation for wear and tear from first-time consolidation 0 0 0 0 0 0 0 0
Capital expenditure 1,412 4,491 361 451 1,425 8,140 14 8,154
of which company acquisitions 0 0 0 0 0 0 0 0
Shares accounted for using the equity method 1,324 0 0 0 0 1,324 0 1,324
Additional information: EBITDA 5,302 11,409 4,136 4,163 13,158 38,168 –891 37,277
Additional information: Goodwill 100,246 69,638 44,269 43,485 31,935 289,573 0 289,573

30 31
The following table reconciles the total operating results of segment reporting with the calculation of consoli-dated earnings before tax.
Reconciliation
EUR ’000 Q1 2012 Q1 2011
Segment earnings (EBIT) 24,938 28,413
Areas not allocated, incl. holding company –946 –1,024
Consolidations 88 33
Net interest –5,638 –4,447
Earnings before taxes 18,442 22,975
Reporting by Region
Q1 2012EUR ’000 Group Germany Abroad
External Sales 260,918 136,081 124,837
Noncurrent assets less deferred taxes and financial instruments 563,491 484,642 78,849
Q1 2011EUR ’000 Group Germany Abroad
External Sales 255,636 133,523 122,113
Noncurrent assets less deferred taxes and financial instruments 550,726 482,841 67,885
The regionalization of sales is based on the selling markets. The further classification of the diverse foreign activities by country is not expedient as no country outside of Germany accounts for 10 % of Group sales.
Noncurrent assets, less deferred taxes and financial instruments, are based on the domiciles of the respective companies. Further differentiation is not expedient as the majority of the companies are domiciled in Germany.
Due to INDUS’s diversification policy there were no individual product or service groups and no individual customers that accounted for more than 10 % of sales.

31
Sh
ar
eh
old
er
S
i
nte
rim
fin
an
cia
l r
ep
or
t
Related Party DisclosuresRelated party disclosures primarily involve the ongoing remuneration of members of management in key posi-tions, the Board of Management, and the Supervisory Board. Furthermore, there are consulting contracts and rental or leasing contracts with non-controlling shareholders or members of their families, and business rela-tions with associated companies.
Events after the Quarterly Reporting DateAfter the end of the first quarter of 2012 there were no significant events.
Bergisch Gladbach, Germany, May 2012
The Board of Management
helmut Ruwisch Jürgen Abromeit Dr. Wolfgang höper Dr. Johannes Schmidt

32
July 3, 2012 Annual shareholders‘ meeting 2012, 10.30 a.m., Cologne/Trade Fair
July 4, 2012 Dividend distribution
August 30, 2012 Interim report on h1 2012
November 13, 2012 German Equity Forum, Frankfurt/Main
November 29, 2012 Interim report on the first three quarters, 2012
Contact
INDUS holding AGKölner Straße 3251429 Bergisch Gladbachpostfach 10 03 5351403 Bergisch Gladbachphone: +49 (0)2204/40 00-0Fax: +49 (0)2204/40 00-20Internet: www.indus.deE-mail: [email protected]
Responsible member in the Management Board:Jürgen Abromeit
Contact Public Relations & Investor Relations:Regina Wolterphone: +49 (0)2204/40 00-70Fax: +49 (0)2204/40 00-20E-mail: [email protected]
Publisher:INDUS holding AG, Bergisch Gladbach
Concept/Design:Berichtsmanufaktur Gmbh, hamburg
Photos:Catrin Moritz, EssenINDUS Group
Financial Calendar

This interim report is also available in German. Only the German version of the interim report is legally binding.
Disclaimer:This interim report contains forward-looking statements based on assumptions and estimates made by the Board of Management of INDUS holding AG. Although the Board of Management is of the opinion that these assumptions and estimates are accurate, they are subject to certain risks and uncertainty. Actual future results may deviate substantially from these assumptions and estimates due to a variety of factors. These factors include changes in the general econo-mic situation, the business, economic and competitive situation, foreign exchange and interest rates, and the legal setting. INDUS holding AG shall not be held liable for the future development and actual future results being in line with the assumptions and estimates included in this interim report. Assumptions and estimates made in this interim report will not be updated.

q1www.indus.de