q1fy17/18 earnings announcement - lenovostatic.lenovo.com/ww/lenovo/pdf/lenovo...
TRANSCRIPT

2017 Lenovo Internal. All rights reserved.
Aug 17, 2017 – New York Aug 18, 2017 – Hong Kong
Q1FY17/18 Earnings Announcement
2
Forward Looking Statement
This presentation contains “forward-looking statements” which are statements that refer to expectations and plans for
the future and include, without limitation, statements regarding Lenovo’s future results of operations, financial condition
or business prospects as well as other statements based on projections, estimates and assumptions. In some cases,
these statements can be identified by terms such as "expect," "intend," "plan," "believe," "estimate," "may," "will,"
"should" and comparable words (including the negative of such words). These forward-looking statements, reflect the
current expectations and plans of the directors and management of Lenovo, which may not materialize or may change.
Many risks, uncertainties and other factors, some of which are unpredictable and beyond Lenovo’s control, could affect
the matters discussed in these forward-looking statements. These factors include, without limitation, economic and
business conditions globally and in the countries where we operate, Lenovo’s ability to predict and respond quickly to
market developments, consumer demand, pricing trends and competition; changes in applicable laws and regulations
(including applicable tax and tariff rates). Any variance from the expectations or plans on which these forward-looking
statements are based could cause Lenovo’s actual results or actions to differ materially from those expressed or
implied in these statements. These forward-looking statements are not guarantees of future performance and you are
cautioned not to place undue reliance on these statements. Lenovo undertakes no obligation to update any forward-
looking statements in this presentation, whether as a result of new information or any subsequent change, development
or event. All forward-looking statements in this presentation are qualified by reference to this paragraph.

2017 Lenovo Internal. All rights reserved.
Yuanqing Yang Chairman & CEO
Aug 17, 2017 – New York Aug 18, 2017 – Hong Kong
4
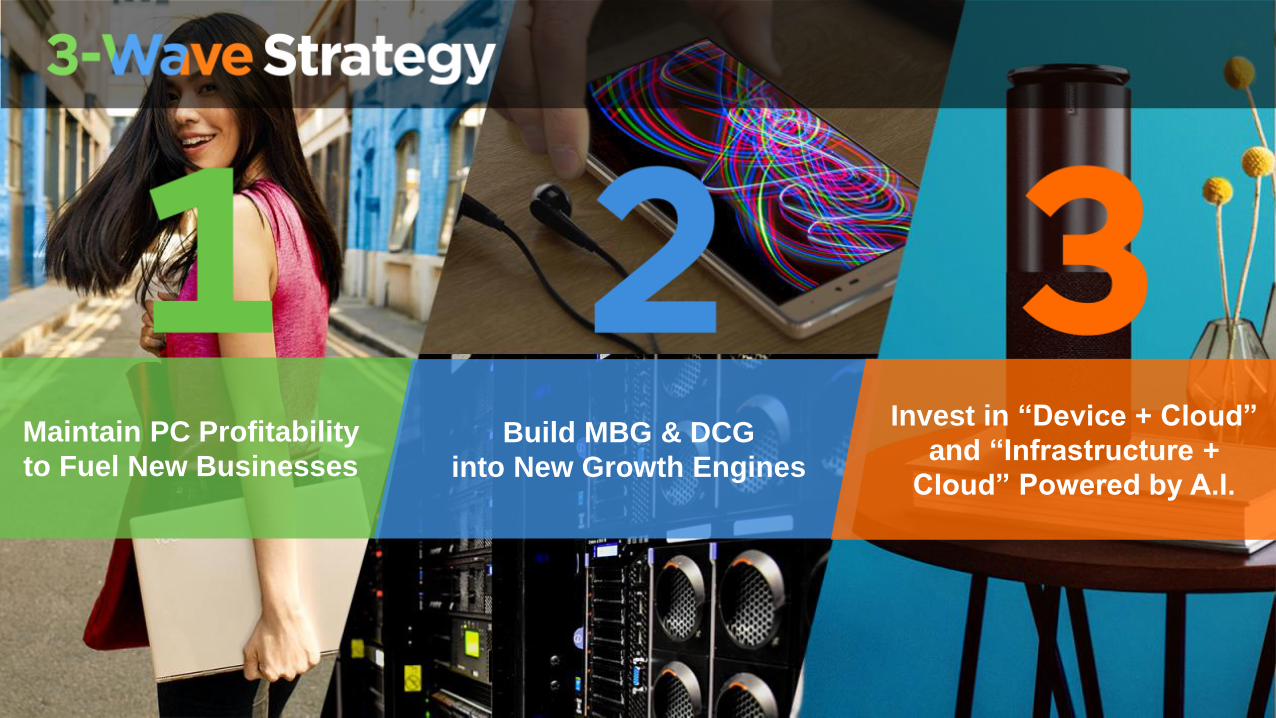
Maintain PC Profitability
to Fuel New Businesses Build MBG & DCG
into New Growth Engines
Invest in “Device + Cloud”
and “Infrastructure +
Cloud” Powered by A.I.
5 2017 Lenovo. All rights reserved.
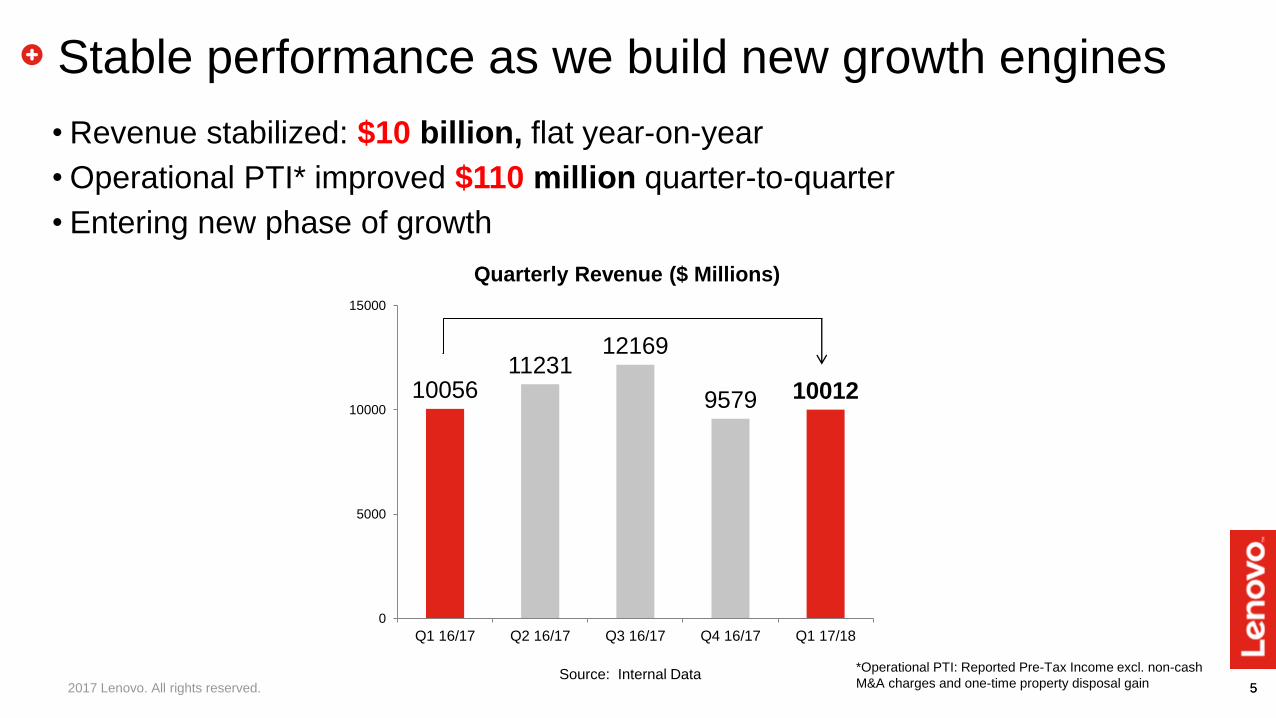
Stable performance as we build new growth engines
5 Source: Internal Data
• Revenue stabilized: $10 billion, flat year-on-year
• Operational PTI* improved $110 million quarter-to-quarter
• Entering new phase of growth
Quarterly Revenue ($ Millions)
10056 11231
12169
9579 10012
0
5000
10000
15000
Q1 16/17 Q2 16/17 Q3 16/17 Q4 16/17 Q1 17/18
*Operational PTI: Reported Pre-Tax Income excl. non-cash
M&A charges and one-time property disposal gain
6
480
490
500
510
520
530
540
550
Q1 16/17 Q2 16/17 Q3 16/17 Q4 16/17 Q1 17/18
2017 Lenovo. All rights reserved.
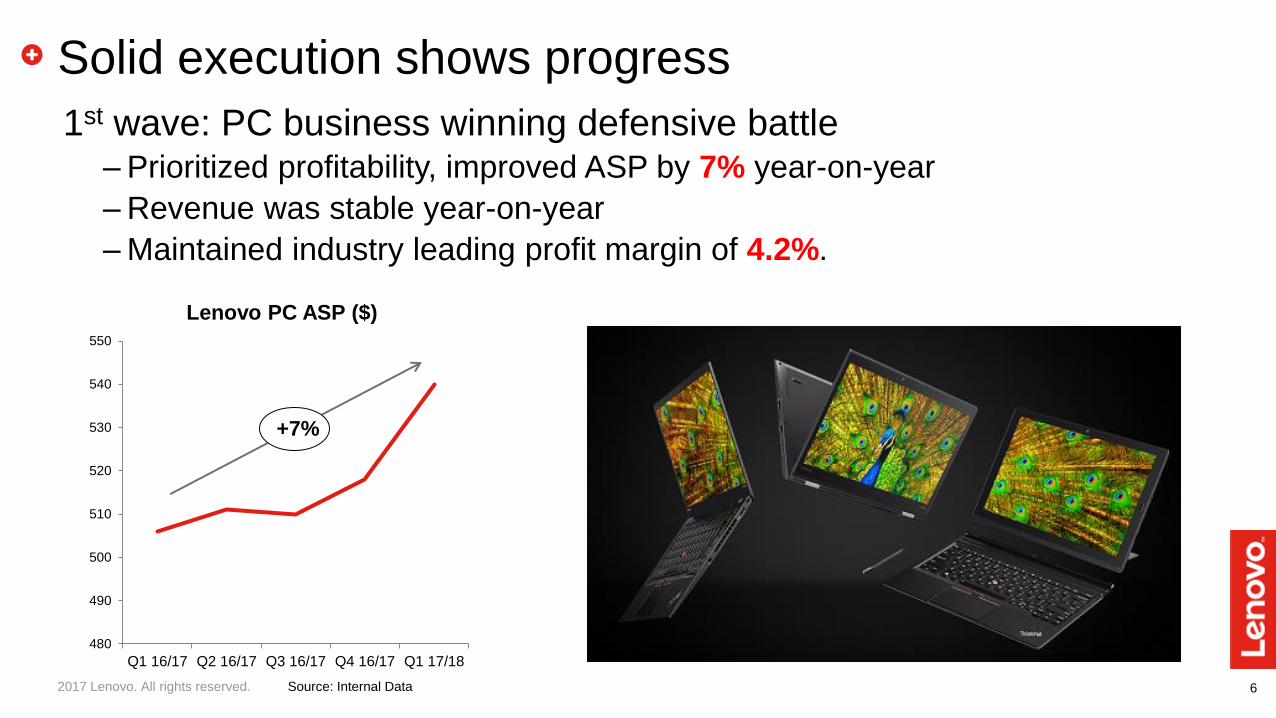
Solid execution shows progress
1st wave: PC business winning defensive battle – Prioritized profitability, improved ASP by 7% year-on-year
– Revenue was stable year-on-year
– Maintained industry leading profit margin of 4.2%.
Source: Internal Data
Lenovo PC ASP ($)
+7%
7 2017 Lenovo. All rights reserved.
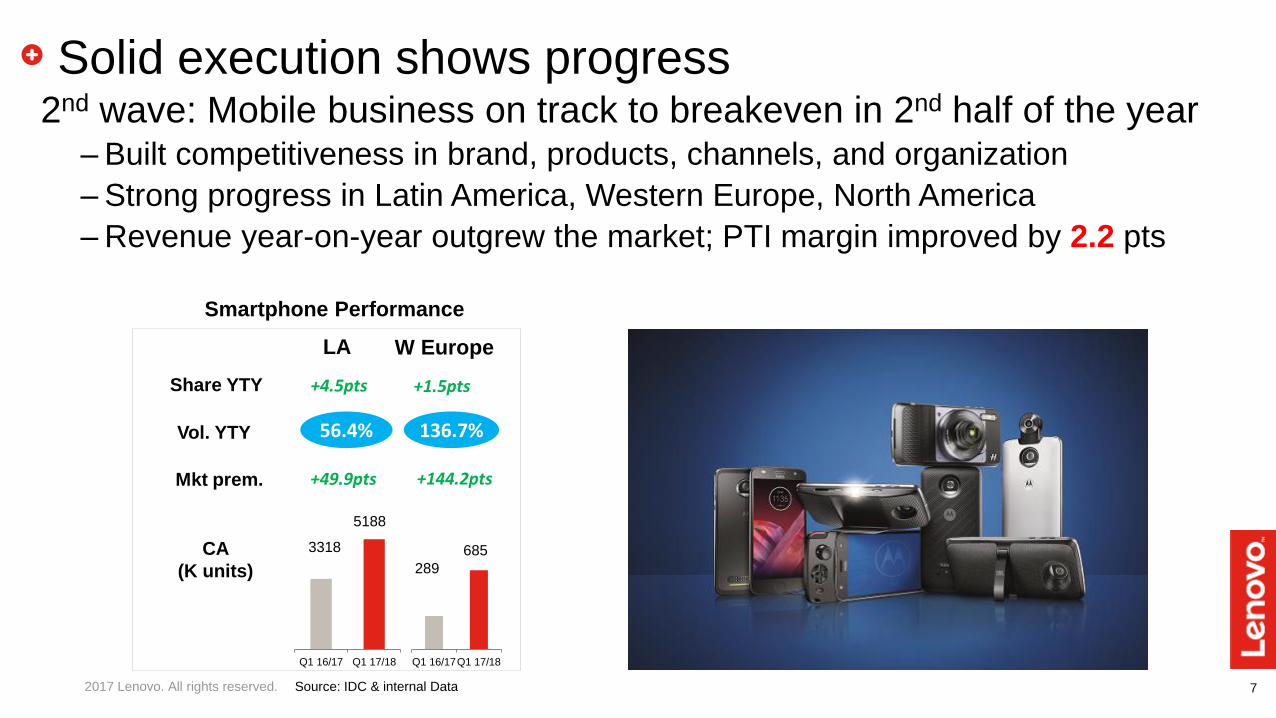
2nd wave: Mobile business on track to breakeven in 2nd half of the year – Built competitiveness in brand, products, channels, and organization
– Strong progress in Latin America, Western Europe, North America
– Revenue year-on-year outgrew the market; PTI margin improved by 2.2 pts
Source: IDC & internal Data
+49.9pts
5188
3318
LA
685
289
W Europe
+144.2pts
CA
(K units)
Vol. YTY
Q1 16/17Q1 17/18
Smartphone Performance
Q1 16/17 Q1 17/18
Solid execution shows progress
+4.5pts +1.5pts Share YTY
Mkt prem.
56.4% 136.7%
8
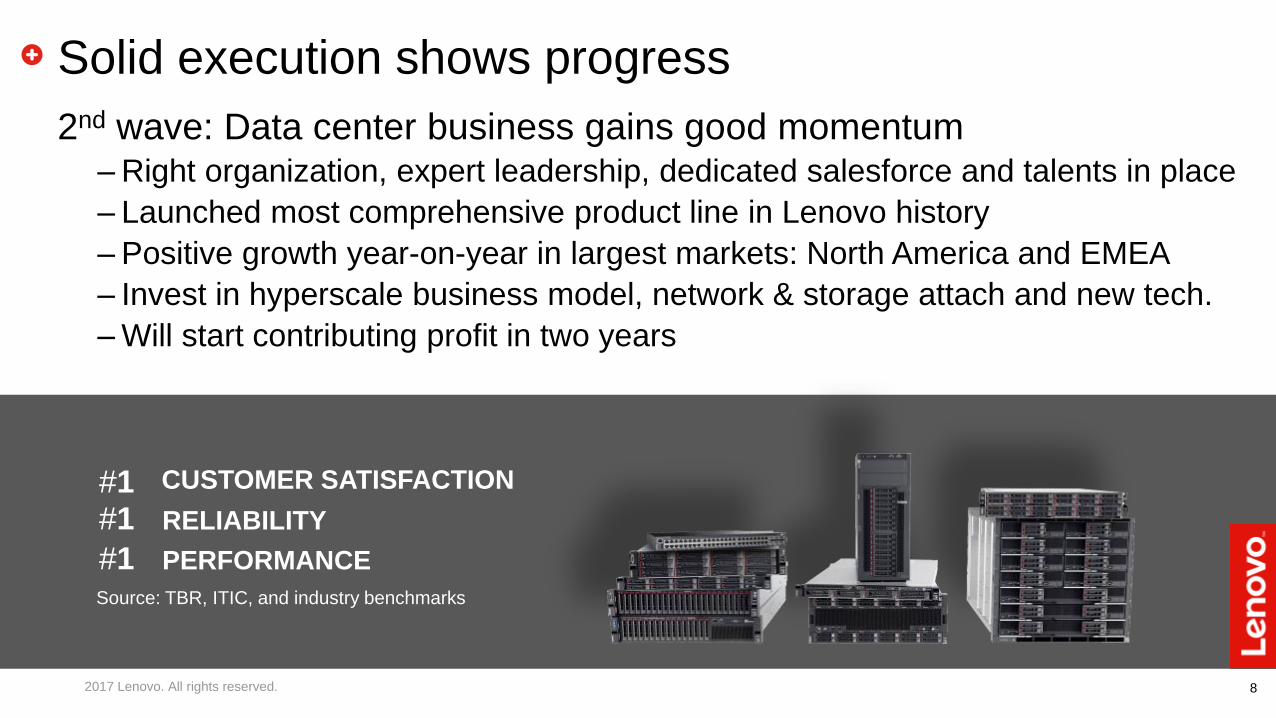
2nd wave: Data center business gains good momentum – Right organization, expert leadership, dedicated salesforce and talents in place
– Launched most comprehensive product line in Lenovo history
– Positive growth year-on-year in largest markets: North America and EMEA
– Invest in hyperscale business model, network & storage attach and new tech.
– Will start contributing profit in two years
#1 CUSTOMER SATISFACTION
#1 RELIABILITY
#1 PERFORMANCE
Solid execution shows progress
2017 Lenovo. All rights reserved.
Source: TBR, ITIC, and industry benchmarks
9 2017 Lenovo. All rights reserved.
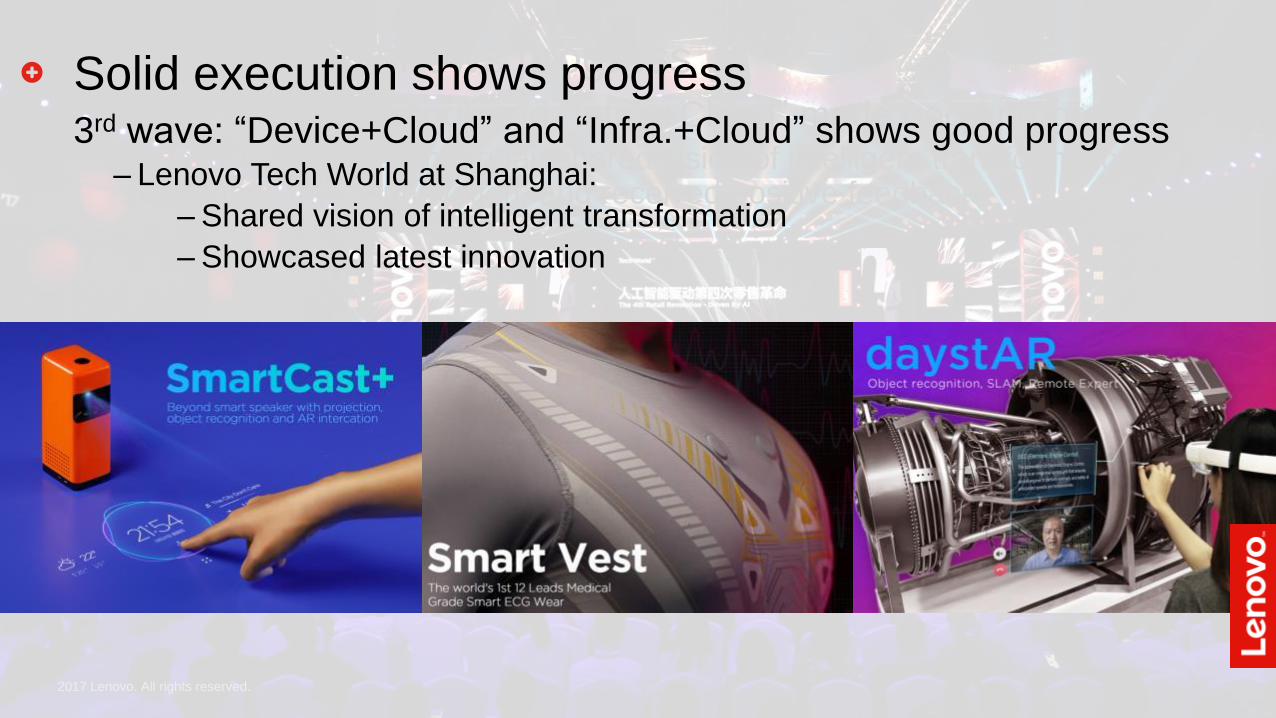
3rd wave: “Device+Cloud” and “Infra.+Cloud” made good progress – Lenovo Tech World Shanghai: shared vision of intelligent transformation,
showcased latest innovation, and received positive feedback
Solid execution shows progress Solid execution shows progress 3rd wave: “Device+Cloud” and “Infra.+Cloud” shows good progress
– Lenovo Tech World at Shanghai:
– Shared vision of intelligent transformation
– Showcased latest innovation
10
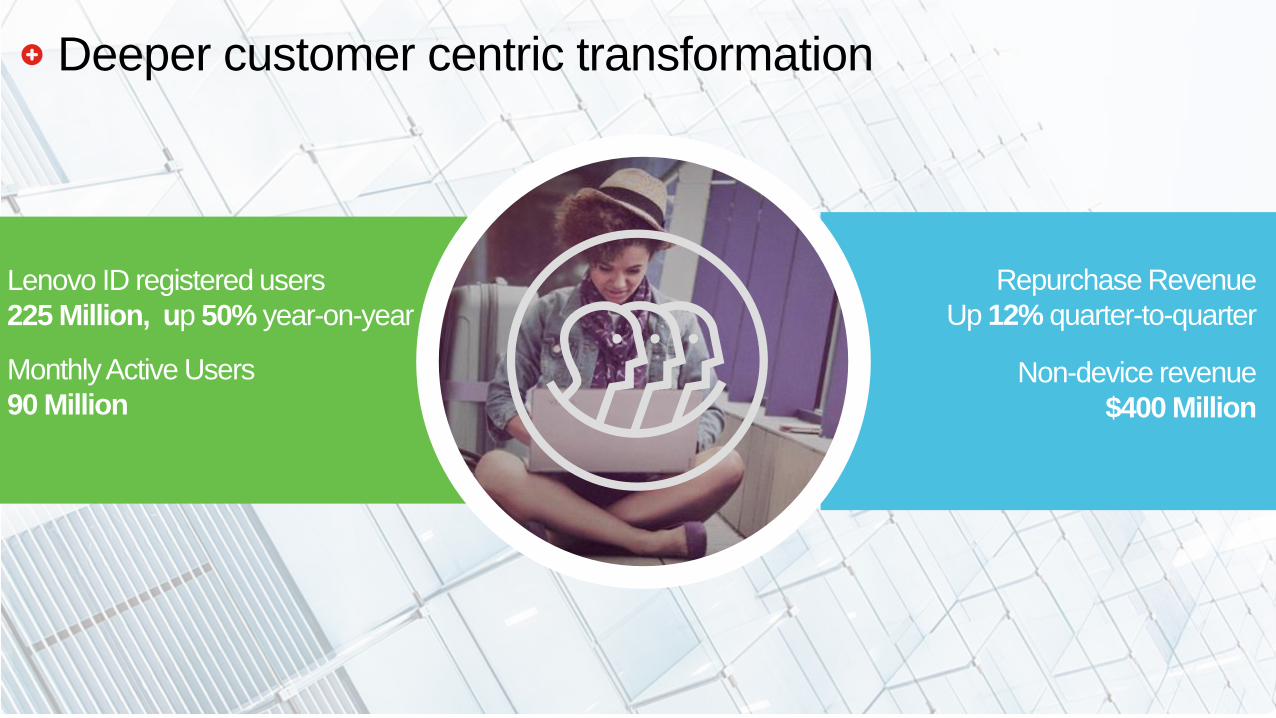
Deeper customer centric transformation
Lenovo ID registered users
225 Million, up 50% year-on-year
Monthly Active Users
90 Million
Repurchase Revenue
Up 12% quarter-to-quarter
Non-device revenue
$400 Million
11 2017 Lenovo. All rights reserved.
Looking forward
2017 Lenovo. All rights reserved.
•Approaching the turning point
•As the new profit engines gain speed, results will follow

2017 Lenovo Internal. All rights reserved.
Wong Wai Ming Chief Financial Officer
Aug 17, 2017 – New York Aug 18, 2017 – Hong Kong
13
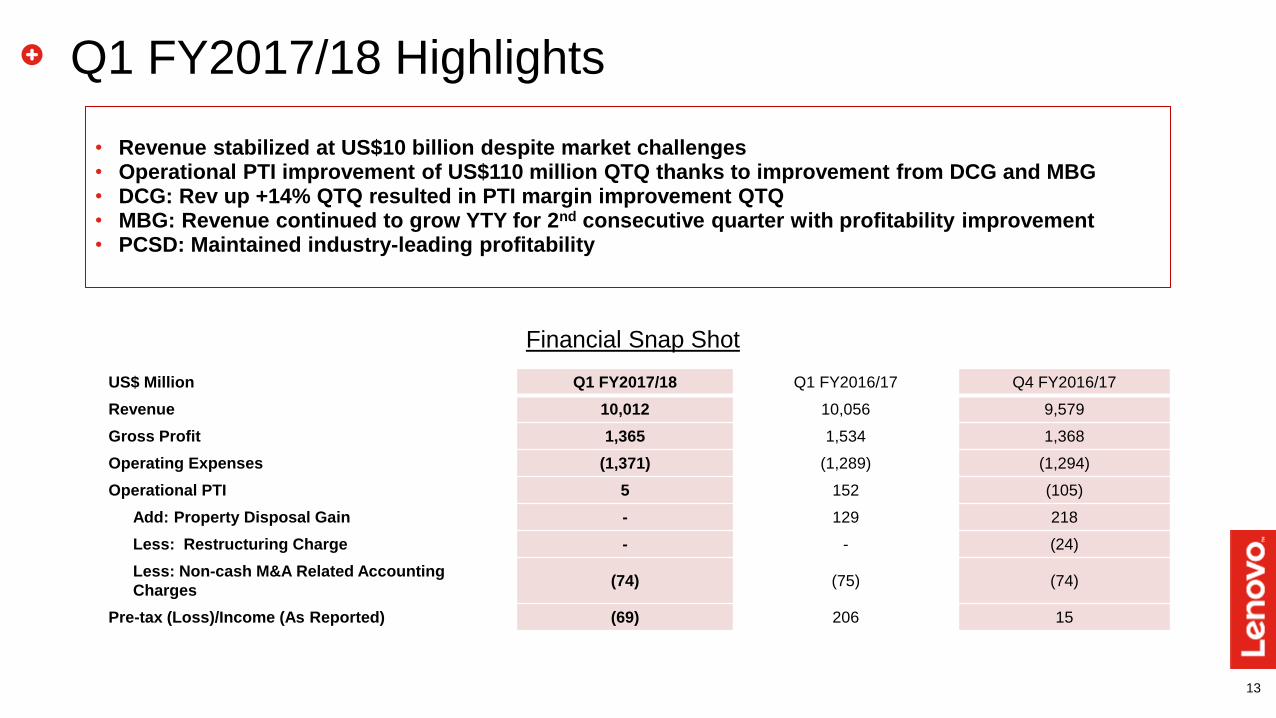
Q1 FY2017/18 Highlights
US$ Million Q1 FY2017/18 Q1 FY2016/17 Q4 FY2016/17
Revenue 10,012 10,056 9,579
Gross Profit 1,365 1,534 1,368
Operating Expenses (1,371) (1,289) (1,294)
Operational PTI 5 152 (105)
Add: Property Disposal Gain - 129 218
Less: Restructuring Charge - - (24)
Less: Non-cash M&A Related Accounting
Charges (74) (75) (74)
Pre-tax (Loss)/Income (As Reported) (69) 206 15
• Revenue stabilized at US$10 billion despite market challenges • Operational PTI improvement of US$110 million QTQ thanks to improvement from DCG and MBG • DCG: Rev up +14% QTQ resulted in PTI margin improvement QTQ • MBG: Revenue continued to grow YTY for 2nd consecutive quarter with profitability improvement • PCSD: Maintained industry-leading profitability
Financial Snap Shot
14 2017 Lenovo Internal. All rights reserved.
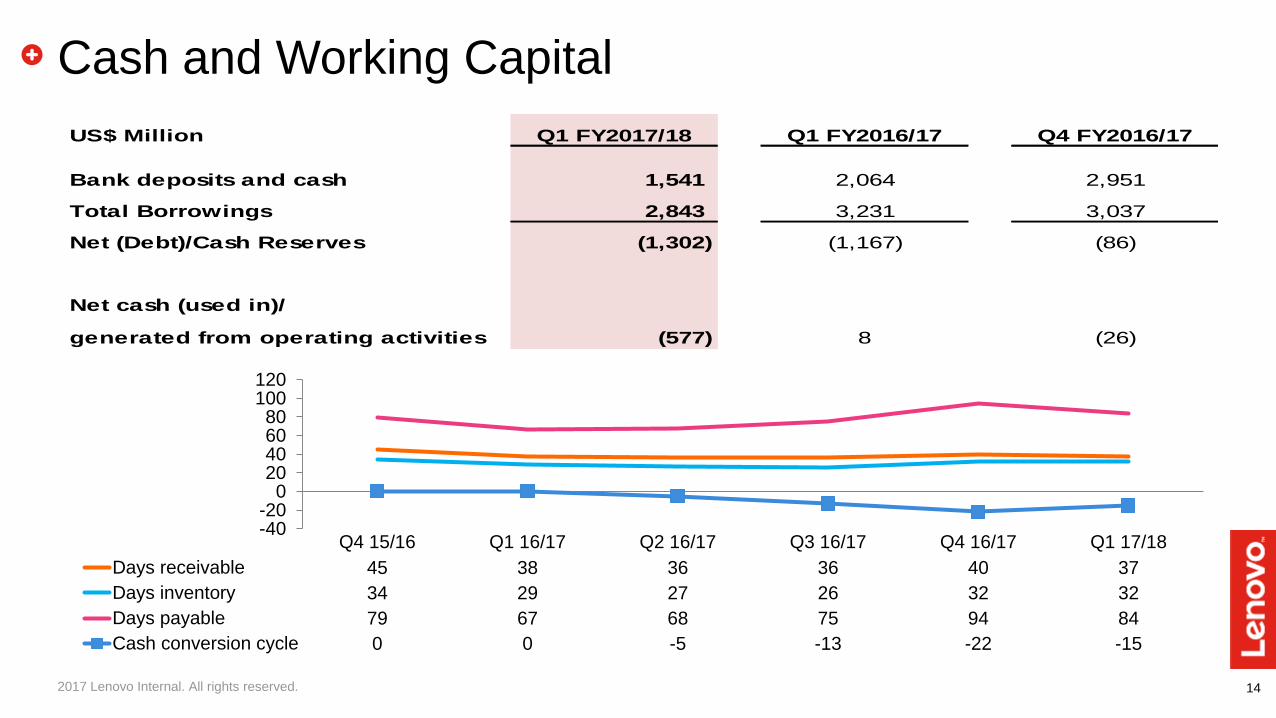
Cash and Working Capital
Q4 15/16 Q1 16/17 Q2 16/17 Q3 16/17 Q4 16/17 Q1 17/18
Days receivable 45 38 36 36 40 37
Days inventory 34 29 27 26 32 32
Days payable 79 67 68 75 94 84
Cash conversion cycle 0 0 -5 -13 -22 -15
-40-20
020406080
100120
US$ Million Q1 FY2017/18 Q1 FY2016/17 Q4 FY2016/17
Bank deposits and cash 1,541 2,064 2,951
Total Borrowings 2,843 3,231 3,037
Net (Debt)/Cash Reserves (1,302) (1,167) (86)
Net cash (used in)/
generated from operating activities (577) 8 (26)
15 2017 Lenovo Internal. All rights reserved.
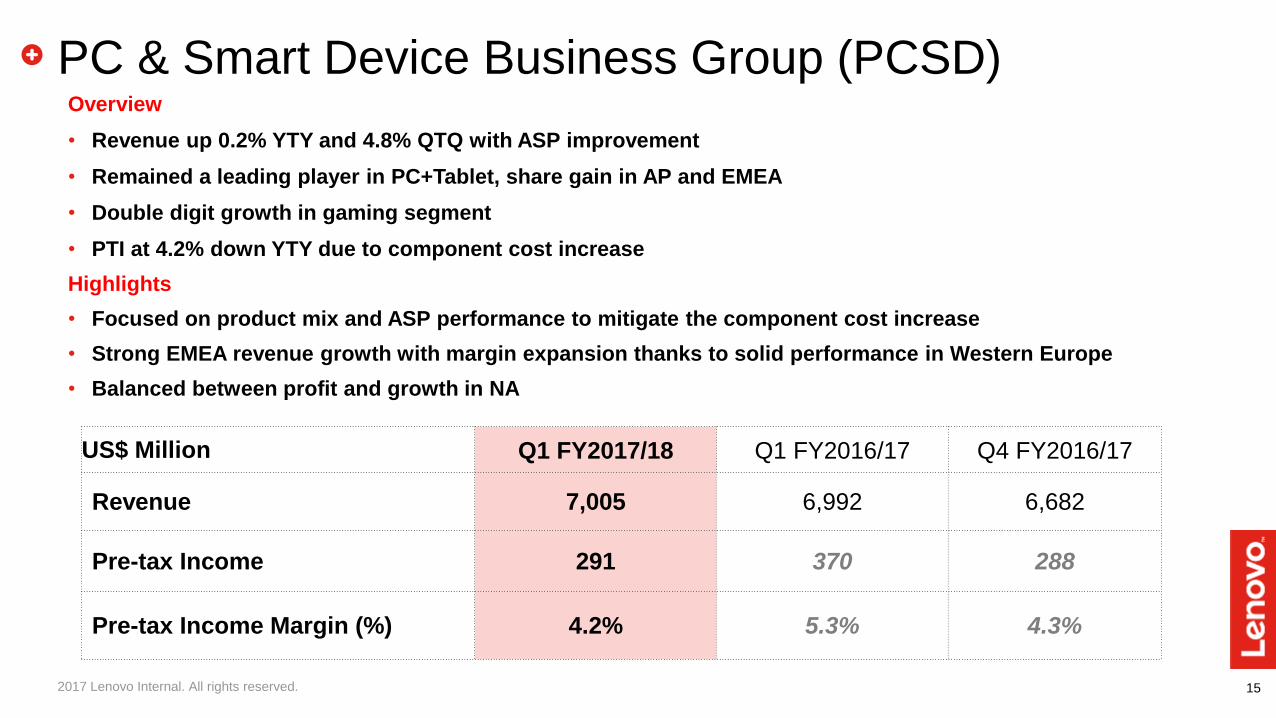
PC & Smart Device Business Group (PCSD)
Overview
• Revenue up 0.2% YTY and 4.8% QTQ with ASP improvement
• Remained a leading player in PC+Tablet, share gain in AP and EMEA
• Double digit growth in gaming segment
• PTI at 4.2% down YTY due to component cost increase
Highlights
• Focused on product mix and ASP performance to mitigate the component cost increase
• Strong EMEA revenue growth with margin expansion thanks to solid performance in Western Europe
• Balanced between profit and growth in NA
US$ Million Q1 FY2017/18 Q1 FY2016/17 Q4 FY2016/17
Revenue 7,005 6,992 6,682
Pre-tax Income 291 370 288
Pre-tax Income Margin (%) 4.2% 5.3% 4.3%
16 2017 Lenovo Internal. All rights reserved.
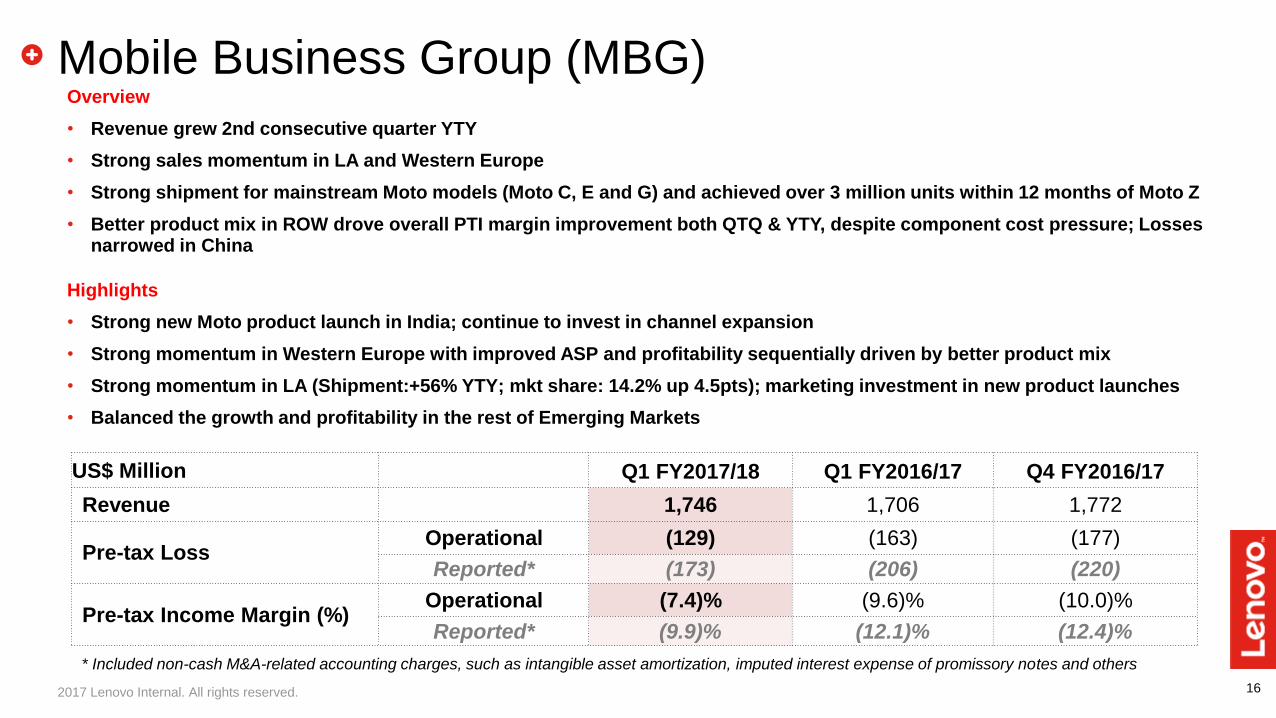
Mobile Business Group (MBG)
Overview
• Revenue grew 2nd consecutive quarter YTY
• Strong sales momentum in LA and Western Europe
• Strong shipment for mainstream Moto models (Moto C, E and G) and achieved over 3 million units within 12 months of Moto Z
• Better product mix in ROW drove overall PTI margin improvement both QTQ & YTY, despite component cost pressure; Losses narrowed in China
Highlights
• Strong new Moto product launch in India; continue to invest in channel expansion
• Strong momentum in Western Europe with improved ASP and profitability sequentially driven by better product mix
• Strong momentum in LA (Shipment:+56% YTY; mkt share: 14.2% up 4.5pts); marketing investment in new product launches
• Balanced the growth and profitability in the rest of Emerging Markets
* Included non-cash M&A-related accounting charges, such as intangible asset amortization, imputed interest expense of promissory notes and others
US$ Million Q1 FY2017/18 Q1 FY2016/17 Q4 FY2016/17
Revenue 1,746 1,706 1,772
Pre-tax Loss Operational (129) (163) (177)
Reported* (173) (206) (220)
Pre-tax Income Margin (%) Operational (7.4)% (9.6)% (10.0)%
Reported* (9.9)% (12.1)% (12.4)%

17 2017 Lenovo Internal. All rights reserved.
Data Center Business Group (DCG) Overview
• Transformation on track
• Signs of stabilization: Revenue +14% QTQ; driven by growth returning in NA & EMEA while PTI margin improved QTQ
• Continued strong performance in Global Account & HPC
• Continued component cost increase impacted overall margin
Highlights
• Installed the largest supercomputer in the world on next generation Intel platform at Barcelona supercomputer center
• Launched the largest product portfolio in its history with comprehensive offerings to address a wider range of market opportunities
• Continued to transition its business model to balance between growth and profitability
• On-going transformation with investments in channel and sales capabilities
* Included non-cash M&A-related accounting charges, such as intangible asset amortization, imputed interest expense of promissory notes and others
US$ Million Q1 FY2017/18 Q1 FY2016/17 Q4 FY2016/17
Revenue 971 1,087 850
Pre-tax Loss Operational (114) (31) (110)
Reported* (144) (64) (141)
Pre-tax Income Margin (%) Operational (11.7)% (2.9)% (13.0)%
Reported* (14.9)% (5.9)% (16.6)%

Appendix
- Financial Summary
- Condensed Consolidated Income Statement
- Condensed Consolidated Balance Sheet
- Condensed Consolidated Cash Flow Statement
- Q1FY18 Performance by Geography
19
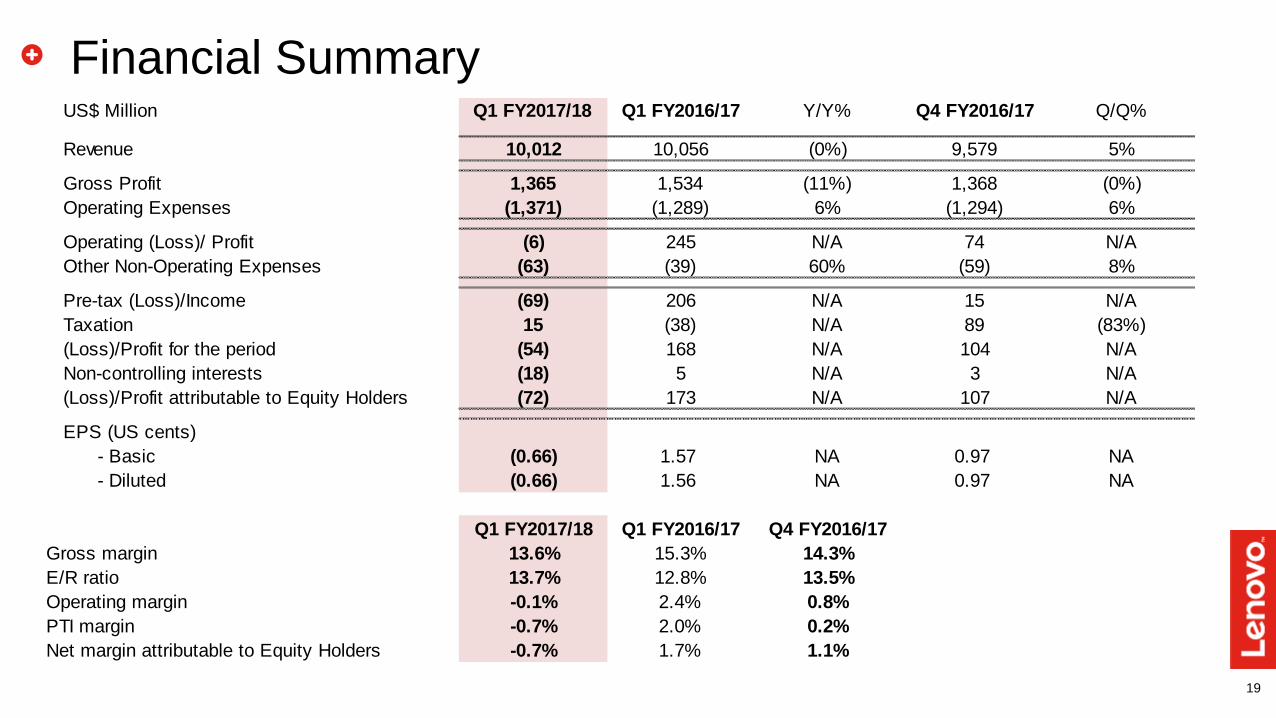
Financial Summary US$ Million Q1 FY2017/18 Q1 FY2016/17 Y/Y% Q4 FY2016/17 Q/Q%
Revenue 10,012 10,056 (0%) 9,579 5%
Gross Profit 1,365 1,534 (11%) 1,368 (0%)
Operating Expenses (1,371) (1,289) 6% (1,294) 6%
Operating (Loss)/ Profit (6) 245 N/A 74 N/A
Other Non-Operating Expenses (63) (39) 60% (59) 8%
Pre-tax (Loss)/Income (69) 206 N/A 15 N/A
Taxation 15 (38) N/A 89 (83%)
(Loss)/Profit for the period (54) 168 N/A 104 N/A
Non-controlling interests (18) 5 N/A 3 N/A
(Loss)/Profit attributable to Equity Holders (72) 173 N/A 107 N/A
EPS (US cents)
- Basic (0.66) 1.57 NA 0.97 NA
- Diluted (0.66) 1.56 NA 0.97 NA
Q1 FY2017/18 Q1 FY2016/17 Q4 FY2016/17
Gross margin 13.6% 15.3% 14.3%
E/R ratio 13.7% 12.8% 13.5%
Operating margin -0.1% 2.4% 0.8%
PTI margin -0.7% 2.0% 0.2%
Net margin attributable to Equity Holders -0.7% 1.7% 1.1%

20
Condensed Consolidated Income Statement US$ Million Q1 FY2017/18 Q1 FY2016/17
Revenue 10,012 10,056
Cost of sales (8,647) (8,522)
Gross profit 1,365 1,534
Selling and distribution expenses (665) (589)
Administrative expenses (460) (458)
Research and development expenses (292) (356)
Other operating income - net 46 114
Operating (loss)/profit (6) 245
Finance income 9 6
Finance costs (72) (55)
Share of profit of associated companies and joint ventures - 10
Profit/(loss) before taxation (69) 206
Taxation 15 (38)
(Loss)/Profit for the period (54) 168
(Loss)/Profit attributable to:
Equity holders of the company (72) 173
Perpetual securities holders 13 -
Other non-controlling interests 5 (5)
(Loss)/Earnings per share (US cents)
- Basic (0.66) 1.57
- Diluted (0.66) 1.56
21
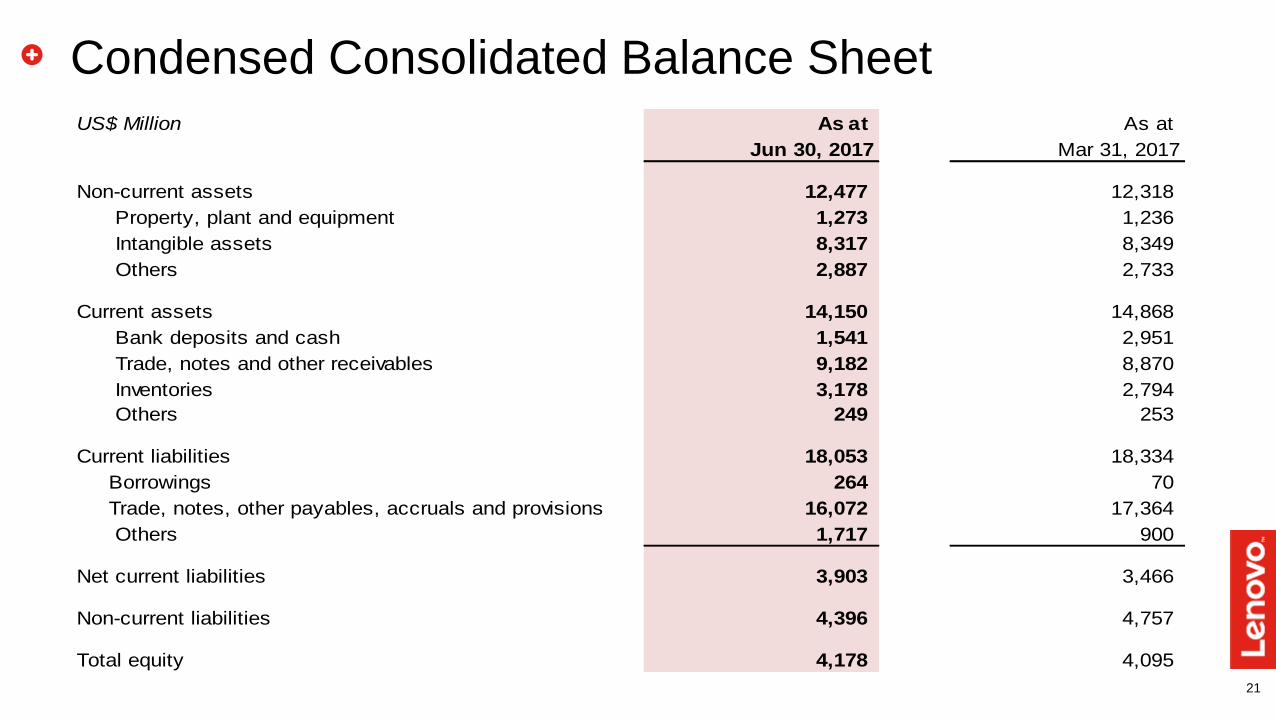
Condensed Consolidated Balance Sheet
US$ Million As at As at
Jun 30, 2017 Mar 31, 2017
Non-current assets 12,477 12,318
Property, plant and equipment 1,273 1,236
Intangible assets 8,317 8,349
Others 2,887 2,733
Current assets 14,150 14,868
Bank deposits and cash 1,541 2,951
Trade, notes and other receivables 9,182 8,870
Inventories 3,178 2,794
Others 249 253
Current liabilities 18,053 18,334
Borrowings 264 70
Trade, notes, other payables, accruals and provisions 16,072 17,364
Others 1,717 900
Net current liabilities 3,903 3,466
Non-current liabilities 4,396 4,757
Total equity 4,178 4,095
22
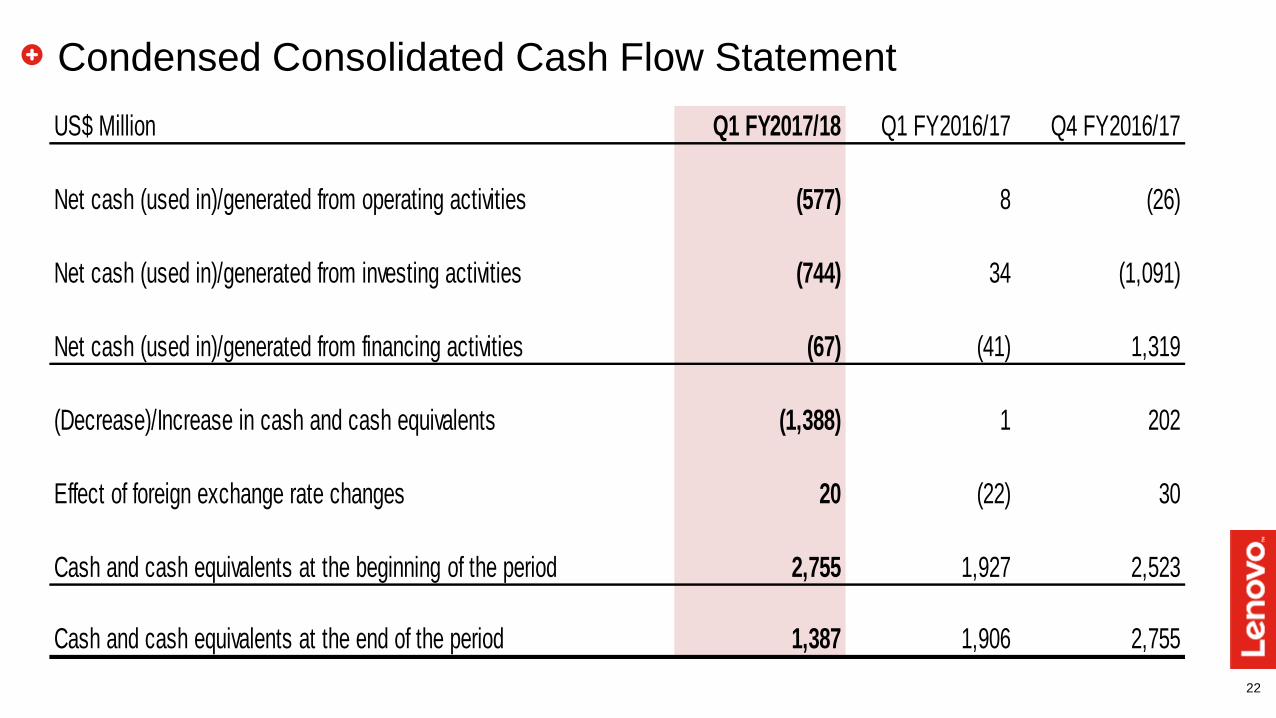
Condensed Consolidated Cash Flow Statement
US$ Million Q1 FY2017/18 Q1 FY2016/17 Q4 FY2016/17
Net cash (used in)/generated from operating activities (577) 8 (26)
Net cash (used in)/generated from investing activities (744) 34 (1,091)
Net cash (used in)/generated from financing activities (67) (41) 1,319
(Decrease)/Increase in cash and cash equivalents (1,388) 1 202
Effect of foreign exchange rate changes 20 (22) 30
Cash and cash equivalents at the beginning of the period 2,755 1,927 2,523
Cash and cash equivalents at the end of the period 1,387 1,906 2,755

23
China • PCSD: Focus on product mix and ASP performance to mitigate the
component cost increases • Mobile: Continue to build more efficient foundation
• Data Center: Continue to transition its business model to balance between growth and profitability
AP • PCSD: Gained share in a weak traditional PC market • Mobile: Strong new Moto product launch in India; continue to invest
in channel expansion • Data Center: On-going transformation with investments in channel
and sales capabilities
EMEA • PCSD: Strong revenue growth with margin expansion thanks to solid
performance from Western Europe • Mobile: Better product mix driving higher ASP and profitability
sequentially thanks to strong momentum in Western Europe • Data Center: Revenue growth turned positive showing transformation
efforts working; continue to invest in channel and sales capabilities
AG (Americas) • PCSD: Balance between profit and growth in NA • Mobile: Strong momentum in LA (Shipment:+56% YTY; mkt share:
14.2% up 4.5pts); marketing investment in new product launches • Data Center: Revenue growth turned positive showing transformation
efforts working; continue to invest in channel and sales capabilities
Q1FY18 Performance by Geography
Revenue Segment Pretax Income/ (Loss) Segment Pretax Income Margin US$ Million US$ Million (%)
Q1
FY18 Y/Y Q/Q
Q1
FY18
Q1
FY17
Q4
FY17
Q1
FY18
Q1
FY17
Q4
FY17
China 2,515 (339) 234 83 138 64 3.3% 4.8% 2.8%
AP 1,573 (107) (160) (42) 17 (43) (2.6)% 1.0% (2.5)%
EMEA 2,703 236 79 (41) (49) (120) (1.5)% (2.0)% (4.6)%
AG 3,221 166 280 41 38 60 1.3% 1.3% 2.0%