q2 2012 operating results · the unaudited financial information under roc gaap in this...
TRANSCRIPT

Q2 2012 Operating Results
August 30, 2012
TSE: 2412NYSE: CHT

© 2012 Chunghwa Telecom 2
DisclaimerSTATEMENT REGARDING UNAUDITED FINANCIAL INFORMATION
The unaudited financial information under ROC GAAP in this presentation is preliminary and subject to adjustments and modifications. The audited financial statements and related notes with reconciliation to U.S. GAAP will be included in our annual report on Form 20-F for the year ending December 31, 2010. Adjustments and modifications to the financial statements may be identified during the course of the audit work, which could result in significant differences from this preliminary unaudited financial information.
NOTE CONCERNING FORWARD-LOOKING STATEMENTS
This presentation contains forward-looking statements. These statements constitute “forward-looking” statements within the meaning of Section 27A of the Securities Act of 1933, as amended, and Section 21E of the Securities Exchange Act of 1934, as amended, and as defined in the U.S. Private Securities Litigation Reform Act of 1995. These forward-looking statements can be identified by terminology such as “will,” “expects,” “anticipates,” “future,” “intends,” “plans,” “believes,” “estimates” and similar statements. Statements that are not historical facts, including statements about Chunghwa’s beliefs and expectations, are forward-looking statements. Forward-looking statements involve inherent risks and uncertainties that could cause actual results to differ materially from the forward-looking statements. A number of important factors could cause actual results to differ materially from those contained in any forward-looking statement. Investors are cautioned that actual events and results could differ materially from those statements as a result of a number of factors including, but not limited to the risks outlined in Chunghwa’s filings with the U.S. Securities and Exchange Commission on Forms F-1, F-3, 6-K and 20-F, in each case as amended. The forward-looking statements in this presentation reflect the current belief of Chunghwa as of the date of this presentation and Chunghwa undertakes no obligation to update these forward-looking statements for events or circumstances that occur subsequent to such date, except as required under applicable law.
This presentation is not an offer of securities for sale in the United States. Securities may not be offered or sold in the United States absent registration or an exemption from registration. Any public offering of securities to be made in the United States will be made by means of a prospectus that may be obtained from the issuer or selling security holder and that will contain detailed information about the company and management, as well as financial statements.
SPECIAL NOTE REGARDING NON-GAAP FINANCIAL MEASURES
A body of generally accepted accounting principles is commonly referred to as "GAAP". A non-GAAP financial measure is generally defined by the SEC as one that purports to measure historical or future financial performance, financial position or cash flows but excludes or includes amounts that would not be so adjusted in the most comparable U.S. GAAP measure. We disclose in this report certain non-GAAP financial measures, including EBITDA. EBITDA for any period is defined as consolidated net income (loss) excluding (i) depreciation and amortization, (ii) total net comprehensive financing cost (which is comprised of net interest expense, exchange gain or loss, monetary position gain or loss and other financing costs and derivative transactions), (iii) other expenses, net, (iv) income tax, (v) cumulative effect of change in accounting principle, net of tax and (vi) (income) loss from discontinued operations.
In managing our business we rely on EBITDA as a means of assessing our operating performance. We believe that EBITDA can be useful to facilitate comparisons of operating performance between periods and with other companies because it excludes the effect of (i) depreciation and amortization, which represents a non-cash charge to earnings, (ii) certain financing costs, which are significantly affected by external factors, including interest rates, foreign currency exchange rates and inflation rates, which have little or no bearing on our operating performance, (iii) income tax and tax on assets and statutory employee profit sharing, which is similar to a tax on income and (iv) other expenses or income not related to the operation of the business.
EBITDA is not a measure of financial performance under U.S. GAAP or ROC GAAP. EBITDA should not be considered as an alternate measure of net income or operating income, as determined on a consolidated basis using amounts derived from statements of operations prepared in accordance with U.S. GAAP or ROC GAAP, as an indicator of operating performance or as cash flows from operating activity or as a measure of liquidity. EBITDA has material limitations that impair its value as a measure of a company's overall profitability since it does not address certain ongoing costs of our business that could significantly affect profitability such as financial expenses and income taxes, depreciation, pension plan reserves or capital expenditures and associated charges. These non-GAAP measures are not in accordance with or an alternative for GAAP financial data, the non-GAAP results should be reviewed together with the GAAP results and are not intended to serve as a substitute for results under GAAP, and may be different from non-GAAP measures used by other companies.
© 2012 Chunghwa Telecom 3
Revenue Breakdown
Chunghwa Telecom Overview
Dominant Market Position (a)
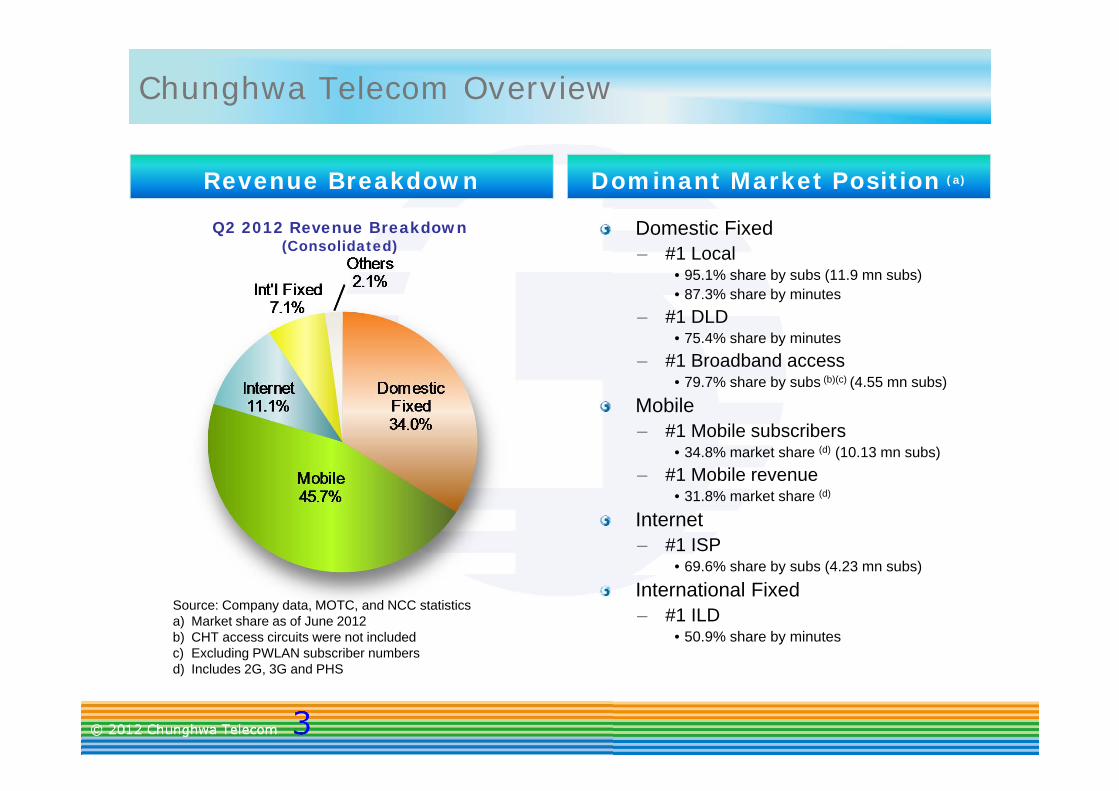
Q2 2012 Revenue Breakdown (Consolidated)
Source: Company data, MOTC, and NCC statisticsa) Market share as of June 2012b) CHT access circuits were not includedc) Excluding PWLAN subscriber numbersd) Includes 2G, 3G and PHS
Domestic Fixed– #1 Local
• 95.1% share by subs (11.9 mn subs) • 87.3% share by minutes
– #1 DLD• 75.4% share by minutes
– #1 Broadband access • 79.7% share by subs (b)(c) (4.55 mn subs)
Mobile– #1 Mobile subscribers
• 34.8% market share (d) (10.13 mn subs)– #1 Mobile revenue
• 31.8% market share (d)
Internet– #1 ISP
• 69.6% share by subs (4.23 mn subs)
International Fixed– #1 ILD
• 50.9% share by minutes

Business Overview
© 2012 Chunghwa Telecom 5
Smartphone – Value Driver for Mobile
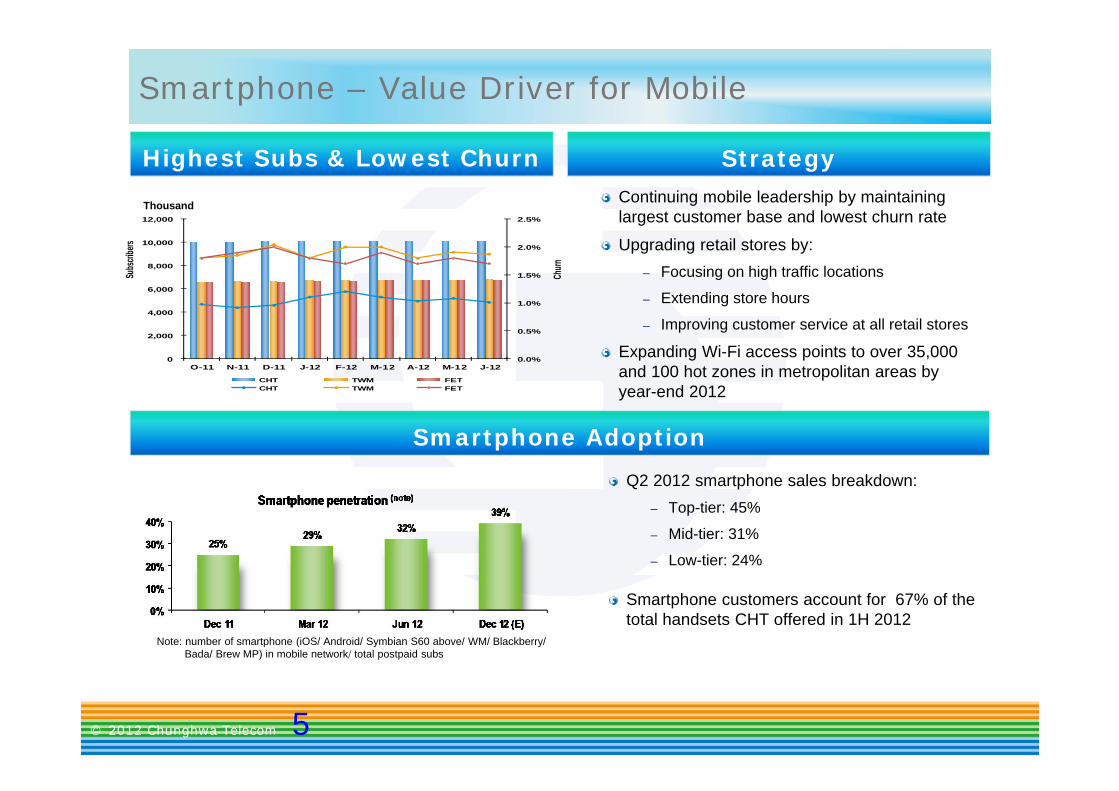
Highest Subs & Lowest Churn StrategyContinuing mobile leadership by maintaining largest customer base and lowest churn rate
Upgrading retail stores by:– Focusing on high traffic locations
– Extending store hours
– Improving customer service at all retail stores
Expanding Wi-Fi access points to over 35,000 and 100 hot zones in metropolitan areas by year-end 2012
Note: number of smartphone (iOS/ Android/ Symbian S60 above/ WM/ Blackberry/ Bada/ Brew MP) in mobile network/ total postpaid subs
0.0%
0.5%
1.0%
1.5%
2.0%
2.5%
0
2,000
4,000
6,000
8,000
10,000
12,000
O-11 N-11 D-11 J-12 F-12 M-12 A-12 M-12 J-12
Churn
Subs
cribe
rs
CHT TWM FETCHT TWM FET
Thousand
Smartphone Adoption
Q2 2012 smartphone sales breakdown:– Top-tier: 45%
– Mid-tier: 31%
– Low-tier: 24%
Smartphone customers account for 67% of the total handsets CHT offered in 1H 2012

© 2012 Chunghwa Telecom 6
2,180 2,335 2,446 2,969 3,362
1,237 1,229 1,230 1,255
1,333 352 353 338
328 341
21.7% 21.6% 22.7%25.8%
27.9%
0%
10%
20%
30%
0
2,000
4,000
6,000
Q2 11 Q3 11 Q4 11 Q1 12 Q2 12
Mob
ile V
AS
Rev
enue
%
VAS
reve
nue
Mobile Internet SMS Others
Growing Mobile Value-added Services
VAS Performance Strategy
Increasing mobile VAS revenue by:
– Offering promotion programs focusing on additional data plan adoption with favorable voice discount
– Targeting students with mobile data promotional packages
– Providing customized and integrated Hami VAS services
NT$ mn
ARPU & Mobile Internet Subs
590 610 589 584 596 747 772 747 750 761
1,270 1,289 1,293 1,200 1,248 1,146 1,320 1,503 1,801 1,998 2,350
1
10
100
1,000
10,000
400
800
1,200
1,600
Q2 11 Q3 11 Q4 11 Q1 12 Q2 12 2012 (E)
Mob
ile In
tern
et S
ubs
AR
PU
Blended ARPU 3G ARPU Smartphone ARPU
NT$
Note: Mobile subs are excluding mobile internet users without internet packages subscription

© 2012 Chunghwa Telecom 7
6,250 6,443 6,061 6,186 6,000
12.7% 12.4% 12.3% 12.0%14.6%
0%
5%
10%
15%
3,000
4,800
6,600
8,400
Q2 11 Q3 11 Q4 11 Q1 12 Q2 12
Internet Revenue
Revenue VAS as % of Internet Revenue
1,771 1,703 1,636 1,269 1,167
3,365 3,305 3,414 3,476 3,611
780 742 741 702 700
0
200
400
600
800
0
2,500
5,000
Q2 11 Q3 11 Q4 11 Q1 12 Q2 12
ARPU NT$Broadband Access Revenue
ADSL Fiber
2,155 2,101 2,001 1,947 1,800
1,974 1,964 1,997 1,923 1,914
343 434 530 682 1,034
0
1,000
2,000
3,000
4,000
5,000
Sep 11 Dec 11 Mar 12 Jun 12 Dec 12 (E)
ADSL Fiber (≦20M) Fiber (≧50M)
Fixed Broadband and Internet Services
Strategy
Fixed Broadband Subs
Thousand
NT$ mn
NT$ mn
Continuing migrating customers to higher speed servicesExpanding fiber broadband customer base Increasing fiber network coverage, promoting high-speed internet Developing cross platform services and increase competitiveness in digital convergencePromoting machine-to-machine devices connection to stimulate the broadband demand
4,472 4,499 4,552 4,7484,528
Note: ARPU includes access and ISP
Performance

© 2012 Chunghwa Telecom 8
93 92 91 91 84
21 41 42 42 55
41.8% 42.0% 42.6% 42.7%44.0%
30%
35%
40%
45%
0
50
100
150
Jun 11 Sep 11 Dec 11 Mar 12 Jun 12
Cha
nnel
Num
bers
SD HD Household Using TV Rate
215 176 144 124 102
451 567 640 710 778
133 133 130145 136
20406080100120140
0
300
600
900
1200
1500
Jun 11 Sep 11 Dec 11 Mar 12 Jun 12 2012
ARPU NT$Total IPTV Subscribers & Package Subscribers
Golden Package Family Package
Subscriber & Usage
Growing Momentum in MOD/ IPTV
Strategy
Thousand
Note: Household Using TV Rate = average daily active subs per quarter / total IPTV subscribers
887 961 1,058 1,091
Strong user demand for 2012 London Olympic
– Subscriber net-adds increased over 50% from
1H2012 average net-adds
– Offering 14 HD channels with multi-screen
capabilities and services
IPTV revenue grew over 33% YoY in Q2 2012
Subscriber market share (CATV+IPTV) YoY grows from 13.6% to 18.4% in Q2 201277.7% of IPTV subscribers sign up additional Packages
– Package subscription rate YoY increase from 75.1% to 77.7%
1,300
1,133
Performance
Enriching content offerings for customers
Introducing new platform to facilitate digital
convergence service offerings
Increasing HD channel selection
Offering multi-screen cloud services

© 2012 Chunghwa Telecom 9
Strengthen cloud computing infrastructure Develop innovative cloud applications for retail customersOpen up the hicloud app mall to independent software vendorsProvide hicloud CaaS, SaaS CRM, hicloud marketplace, and Hami cloud 2012 focus: offer personal, storage, enterprise, tourism, distribution, and healthcare cloud servicesMajor partners: Microsoft, Trend Micro, IBM, Intel, Fujitsu, R&H, Quanta, Inventec, Wistron, Show Chwan, NCP, CISA, ITRI, III
ICT and Cloud Computing Initiatives
ICT Business Strategy Cloud Computing Strategy
Government
Corporate Application
Personal Application
Industry
healthcare, transportation, education, carbon reduction
tourism distribution
private cloudhealthcare
cloud storagepersonal cloud
Expand business scope and focus to include:- ITS, iEN, information security, IMO, call center, IDC,
Cloud Computing, ICT for developers- IOT
Cross-selling capability with existing customersICT YoY revenue grew 25.1% YoY in 1H 2012

Regulatory Update

© 2012 Chunghwa Telecom 11
• NCC submitted the proposal for amendment to Telecom Act to Executive Yuan on July 30, 2012• Major issues regarding competent authority capability to impose to dominant players including:
• Order to adopt business functional separation when necessary• Set service tariff by referencing to the amount of fees charged by global or domestic operators for
similar service• Order to open up duct information and provide co-share services• Order to do accounting separation upon each service provided
Telecom Act Amendment
• GSM 900/1800 license will expire in 2012 and 2013 respectively
• Subject to NCC’s approval, the term of original 2G license would be extended to June 2017. Chunghwa has submitted the application for extension of the license and the application currently is under NCC’s review
• Executive Yuan instructed NCC to release the 4G (technology- neutral) licenses before end of 2013, and related mechanism is still under discussion
2G license Extension & 4G License
Award
• Chunghwa Telecom, TWM and FET were announced as 3G mobile dominant operators by NCC on July 17, 2012
• The major tariff set by dominant operators are subject to competent authority’s prior approval
• The above three operators dominate both 3G and 2G markets
3G Dominant Operator
Regulatory Update

Financials Overview

© 2012 Chunghwa Telecom 13
Financials: Income Statement Highlights
ROC GAAP (Consolidated)
(NT$bn) 1H 2011 1H 2012 Growth Rate Q2 2011 Q2 2012 Growth
Rate
Net Revenues 106.90 109.61 2.5% 54.42 54.19 (0.4%)
Operating Costs and Expenses 77.54 83.83 8.1% 39.01 39.75 1.9%
Income from Operations 29.36 25.78 (12.2%) 15.41 14.44 (6.3%)
Net Income 25.13 20.76 (17.4%) 13.30 11.27 (15.2%)
Net Income Margin (%) 23.51 18.94 24.43 20.80
EBITDA 45.42 41.98 (7.6%) 23.42 22.58 (3.6%)
EBITDA margin (%) 42.49 38.30 43.02 41.67
Note: The calculation of growth rate is based on NT$mn

© 2012 Chunghwa Telecom 14
Financials: Business Segment Revenues
ROC GAAP (Consolidated)
(NT$bn) 1H 2011 1H 2012 Growth Rate Q2 2011 Q2 2012 Growth
Rate
Domestic Fixed 38.98 37.44 (4.0%) 19.78 18.44 (6.8%)
Local 20.59 20.24 (1.7%) 10.77 10.23 (5.0%)
DLD 2.94 1.93 (34.3%) 1.46 0.93 (36.4%)
Broadband Access 10.36 9.52 (8.1%) 5.14 4.78 (7.0%)
Mobile 45.20 50.32 11.3% 22.35 24.74 10.7%
Mobile Voice 27.78 26.16 (5.8%) 13.63 13.04 (4.3%)
Mobile VAS 7.29 9.59 31.5% 3.77 5.04 33.6%
Handset Sales 10.07 14.55 44.5% 4.93 6.65 34.9%
Internet 12.33 12.19 (1.2%) 6.25 6.00 (4.0%)
Internet Services 9.20 8.45 (8.2%) 4.61 4.22 (8.5%)
Internet VAS 1.24 1.30 4.8% 0.67 0.72 7.5%
International Fixed 7.65 7.51 (1.8%) 3.86 3.87 0.2%
ILD 6.35 6.02 (5.2%) 3.22 3.10 (3.7%)
Leased line 0.46 0.57 22.3% 0.22 0.30 35.3%
Others 2.74 2.15 (21.5%) 2.18 1.15 (47.6%)
Total 106.90 109.61 2.5% 54.42 54.19 (0.4%)
Note: The calculation of growth rate is based on NT$mn.

© 2012 Chunghwa Telecom 15
Financials: Costs & Expenses
ROC GAAP (Consolidated)
(NT$bn) 1H 2011 1H 2012 Growth Rate Q2 2011 Q2 2012 Growth
Rate
Operating Costs 62.60 70.09 12.0% 31.35 33.47 6.8%
Operating Expenses 14.94 13.74 (8.1%) 7.66 6.28 (18.1%)
Marketing 11.02 9.93 (10.0%) 5.56 4.33 (22.2%)
General and Administrative 2.22 2.02 (8.9%) 1.23 1.02 (17.2%)
R&D Expense 1.70 1.79 5.2% 0.87 0.93 6.5%
Total 77.54 83.83 8.1% 39.01 39.75 1.9%
Note: The calculation of growth rate is based on NT$mn.

© 2012 Chunghwa Telecom 16
Cash Flow
Note:1. The calculation of growth rate is based on NT$mn. 2. Free cash flow is subtracting Capex from net cash flows from operating activities.
ROC GAAP (Consolidated)
(NT$bn) 1H 2011 1H 2012 Growth Rate Q2 2011 Q2 2012 Growth Rate
Net Cash Flow from Operating Activities 26.00 27.31 5.0% 16.28 14.19 (12.8%)
CAPEX 9.92 14.23 43.4% 5.54 7.54 36.0%
Free Cash Flow 16.08 13.08 (18.6%) 10.74 6.65 (38.0%)
Cash and Cash Equivalent at the end of period
81.46 75.14 (7.8%) 81.46 75.14 (7.8%)

© 2012 Chunghwa Telecom 17
Forecast & Operating Results
ROC GAAP (Parent Company Only)
(NT$bn) H1 2012 2012 (E) Achieving Rate Q2 2012 Q2 2012 (E) Achieving
Rate
Net Revenues 94.36 188.88 50.0% 46.62 46.91 99.4%
Operating Costs and Expenses 70.19 143.75 48.8% 32.92 35.75 92.1%
Income from Operations 24.17 45.13 53.6% 13.70 11.16 122.8%
Net Income 20.76 39.18 53.0% 11.27 9.68 116.4%
EPS 2.68 5.05 1.46 1.25
EBITDA 40.17 77.09 52.1% 21.73 19.10 113.8%
EBITDA margin (%) 42.57 40.81 46.62 40.71
Note: These projections are based on a number of estimates and assumptions and are inherently subject to significant uncertainties and contingencies.

© 2012 Chunghwa Telecom 18
Capital Expenditure
Moderately increase mid-term capital expenditure
– Focus on Fixed and Mobile broadband
Budgeted capex for 2012: NT$33.1 bn
Continue to focus on core businesses for future investments – 2G / 3G / HSPA / HSPA+– FTTx– Wi-Fi– Service Platforms– Cloud computing
Effective and Efficient Capital Expenditure
14.3 16.5 19.3
5.8
8.0
5.3 4.3
6.9
2.1
3.6
1.9 3.7
4.5
1.2
1.3
1.7 1.5
1.6
0.6
1.0
1.4 0.7
0.8
0.2
0.3
12.2% 12.3%
17.3%
9.3%13.0%
-30%
-20%
-10%
0%
10%
20%
0
5
10
15
20
25
30
35
40
2010 2011 2012 (E) 1H 11 1H 12
Cap
ex a
s %
of
Reven
ue
Cap
ex
Domestic Fixed Mobile Internet International Fixed Others
Note: Figures are on consolidated basis, except 2012 expected amount.
NT$ bn
24.6
9.9
14.2
26.9
33.1

Q&A

Reference

© 2012 Chunghwa Telecom 21
• Wireline and wireless tariff reduction starting from April 1, 2010 over 3 years (Please refer
to reference page 22)
Tariff Regulation
• In January 2011, Legislative Yuan resolved that NCC and CHT to propose a single tariff for
island-wide fixed-line phone service, and the single tariff was effective since Jan. 1, 2012
Single-tariff for Fixed-line Calls
Regulatory Development

© 2012 Chunghwa Telecom 22
Tariff Regulations
Target Business Operation Applicable services X factor
Years in effect
Formula: △CPI -X
SMP (Significant Market Power)
Fixed-line
1 IP Peering
4.816% 3
1. The three year tariff reduction plan is applicable from Apr 1, 2010 to Mar 31, 2013 and applied based on the previous year tariff.
2. △CPI for year 2009=-0.87
3. △CPI for year 2010=0.96
4. △CPI for year 2011= 1.42
5. △CPI for year 2012= to be decided
2 Domestic wholesale leased line
3 ADSL circuit
4
Domestic long distance call (excl. Public phone call)
All 2G/3Goperators Mobile
1 Domestic SMS
5% 3
2
Off-net voice call tariffs including(1) Off-net mobile (2) Mobile to fixed calls
3 voice callinterconnection
NCC will modify regulations of wholesale rates of voice call termination on mobile network.

© 2012 Chunghwa Telecom 23
Mobile data usage expect to increase 65%
Base station access bandwidth expect to expand 70%
Mobile backhaul bandwidth expect to expand 73%
High-quality Mobile Network Build-out
2012 (E)
Higher quality to meet customers’ demand
Heterogeneous network to enhance efficiency– 21M HSPA+ base stations to increase to 5,000 by 2012– WiFi– Femtocell

© 2012 Chunghwa Telecom 24
Continuing Broadband Network Construction
Fiber Deployment Plan
Note:
(1) The Coverage rate is based on the household number (8.11mn) as of June 2012
(2) Wireline : Fixed + Internet
FTTx coverage (>=100M) reach 97% by 2016
Increase FTTH construction in order to meet the demand of high speed broadband
1Gbps trial services has reached over 1,000 households– Chunghwa is one of the leading operators that
provides 1Gbps residential broadband service
Fiber construction plan including capex will be reviewed in accordance with market demand