q2 2016 global travel insights - travel’s direct demand …€¦ · · 2017-05-17and tourists...
TRANSCRIPT
SOJERN.COM / [email protected] 3 2
Table of Contents
Global Travel Trends
A Bird’s Eye View
North America: Q2 Search Trends
Latin America: Q2 Search Trends
Europe: Q2 Search Trends
Middle East & Africa: Q2 Search Trends
Asia-Pacific: Q2 Search Trends
Q2 2016 Travel Events
North America: Copa Games
Latin America: Colombia Visa Restrictions Lifted
Europe: Euro Cup Update
Middle East & Africa: Ramadan Update
Asia-Pacific: Golden Week
Looking Forward
North America
Q3 Search Trends
Travel Changes Throughout the Summer
Latin America
Q3 Search Trends
Updated Olympic Outlook
Europe
Q3 Search Trends
City Search Patterns Compared
Middle East & Africa
Q3 Search Trends
Tourism Trends in Middle East & Africa
Asia-Pacific
Q3 Search Trends
Singapore Formula One Grand Prix Preview
Appendix
Glossary
Regional Coverage
Methodology
4
5
6
7
8
9
10
11
12
13
14
16
16
18
19
19
21
22
22
24
25
25
27
28
28
30
31
31
31
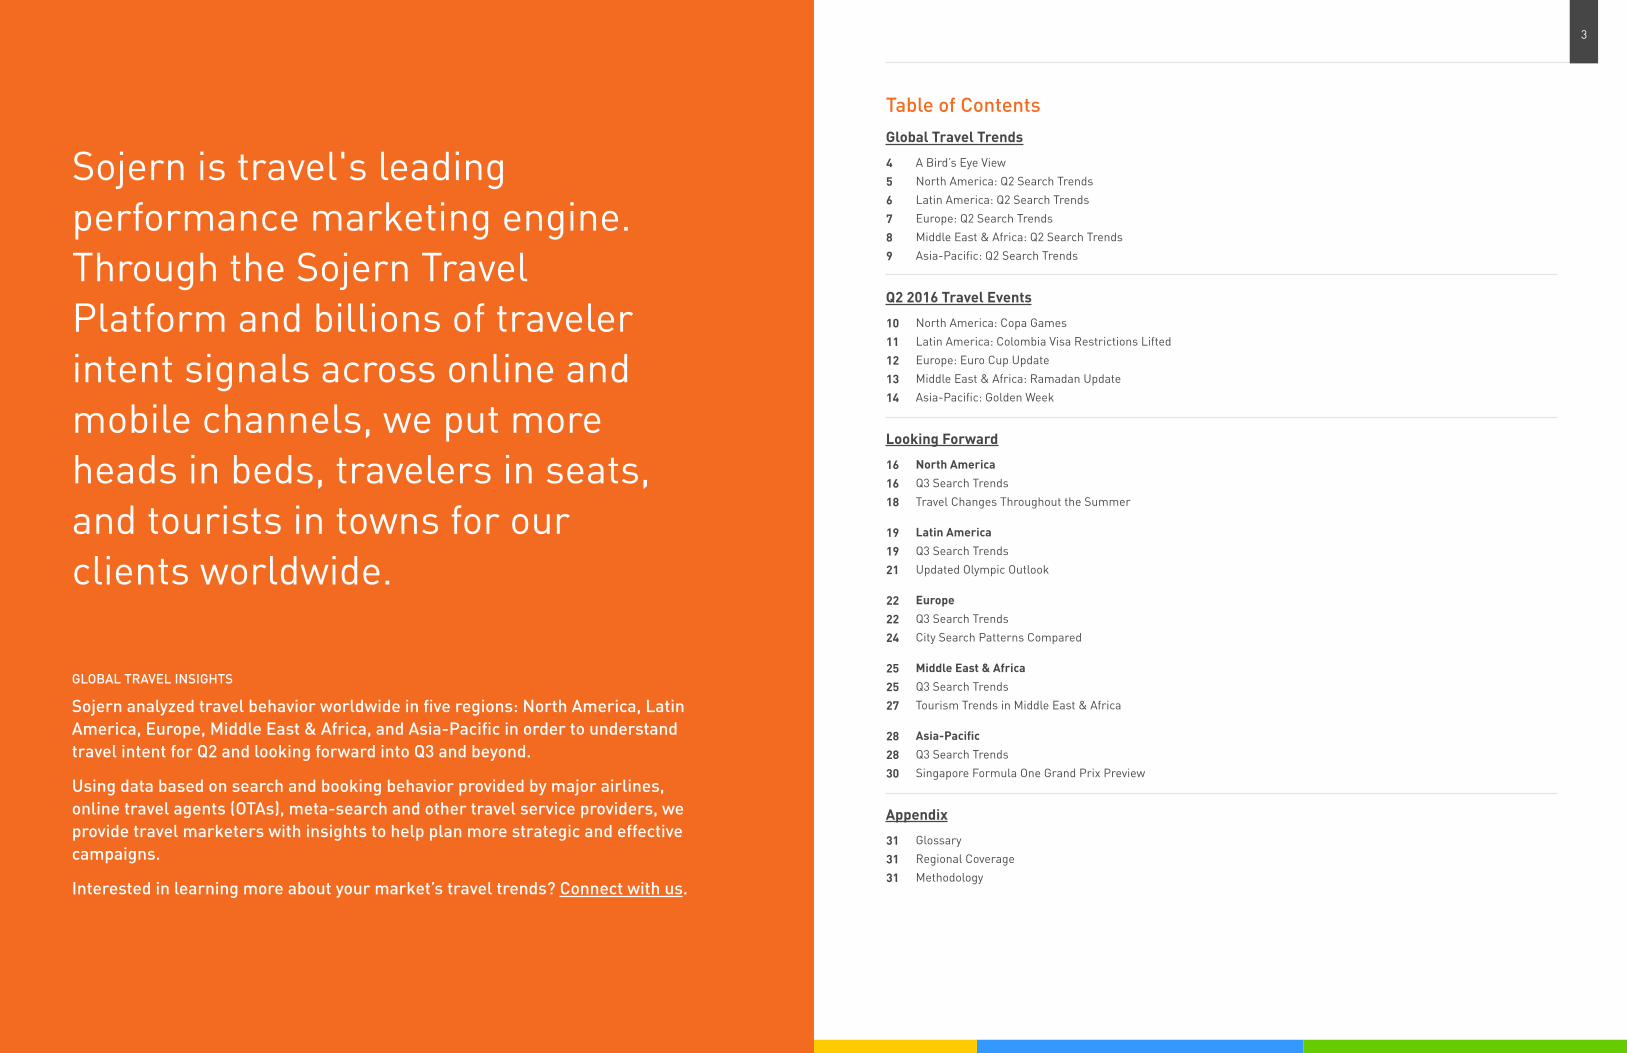
Sojern is travel's leading performance marketing engine. Through the Sojern Travel Platform and billions of traveler intent signals across online and mobile channels, we put more heads in beds, travelers in seats, and tourists in towns for our clients worldwide.
GLOBAL TRAVEL INSIGHTS
Sojern analyzed travel behavior worldwide in five regions: North America, Latin America, Europe, Middle East & Africa, and Asia-Pacific in order to understand travel intent for Q2 and looking forward into Q3 and beyond.
Using data based on search and booking behavior provided by major airlines, online travel agents (OTAs), meta-search and other travel service providers, we provide travel marketers with insights to help plan more strategic and effective campaigns.
Interested in learning more about your market’s travel trends? Connect with us.

SOJERN.COM / [email protected] Q2 2016 GLOBAL TRAVEL INSIGHTS 5 4
Global Travel Trends
A Bird’s Eye View
Top 10 Countries Searched and Booked
France
Germany
Greece
Italy
Mexico
Netherlands
Portugal
Russia
Spain
Thailand
US
UK
Switzerland
SEARCHED BOOKED BOTH
JuneMayApril
SEARCHED BOOKED
Share of Q2 Search and Booking Volumes by Month
34% 34%33% 33% 34% 33%
What were the quarterly outbound search trends for North America?
12+ Days
8 to 11 Days
4 to 7 Days
0 to 3 Days
60+ Days30 to 59 Days22 to 29 Days15 to 21 Days8 to 14 Days0 to 7 Days
New York City
Miami
Las Vegas
Los Angeles
Chicago
Top 5 Destinations Party Size
Lead Time
Trip Duration
43%
32%
11%
14%
23% 33%9% 9%17% 10%
1 TRAVELER
2 TRAVELERS
3+ TRAVELERS74%
18%
8%
SOJERN.COM / [email protected] Q2 2016 GLOBAL TRAVEL INSIGHTS 7 6
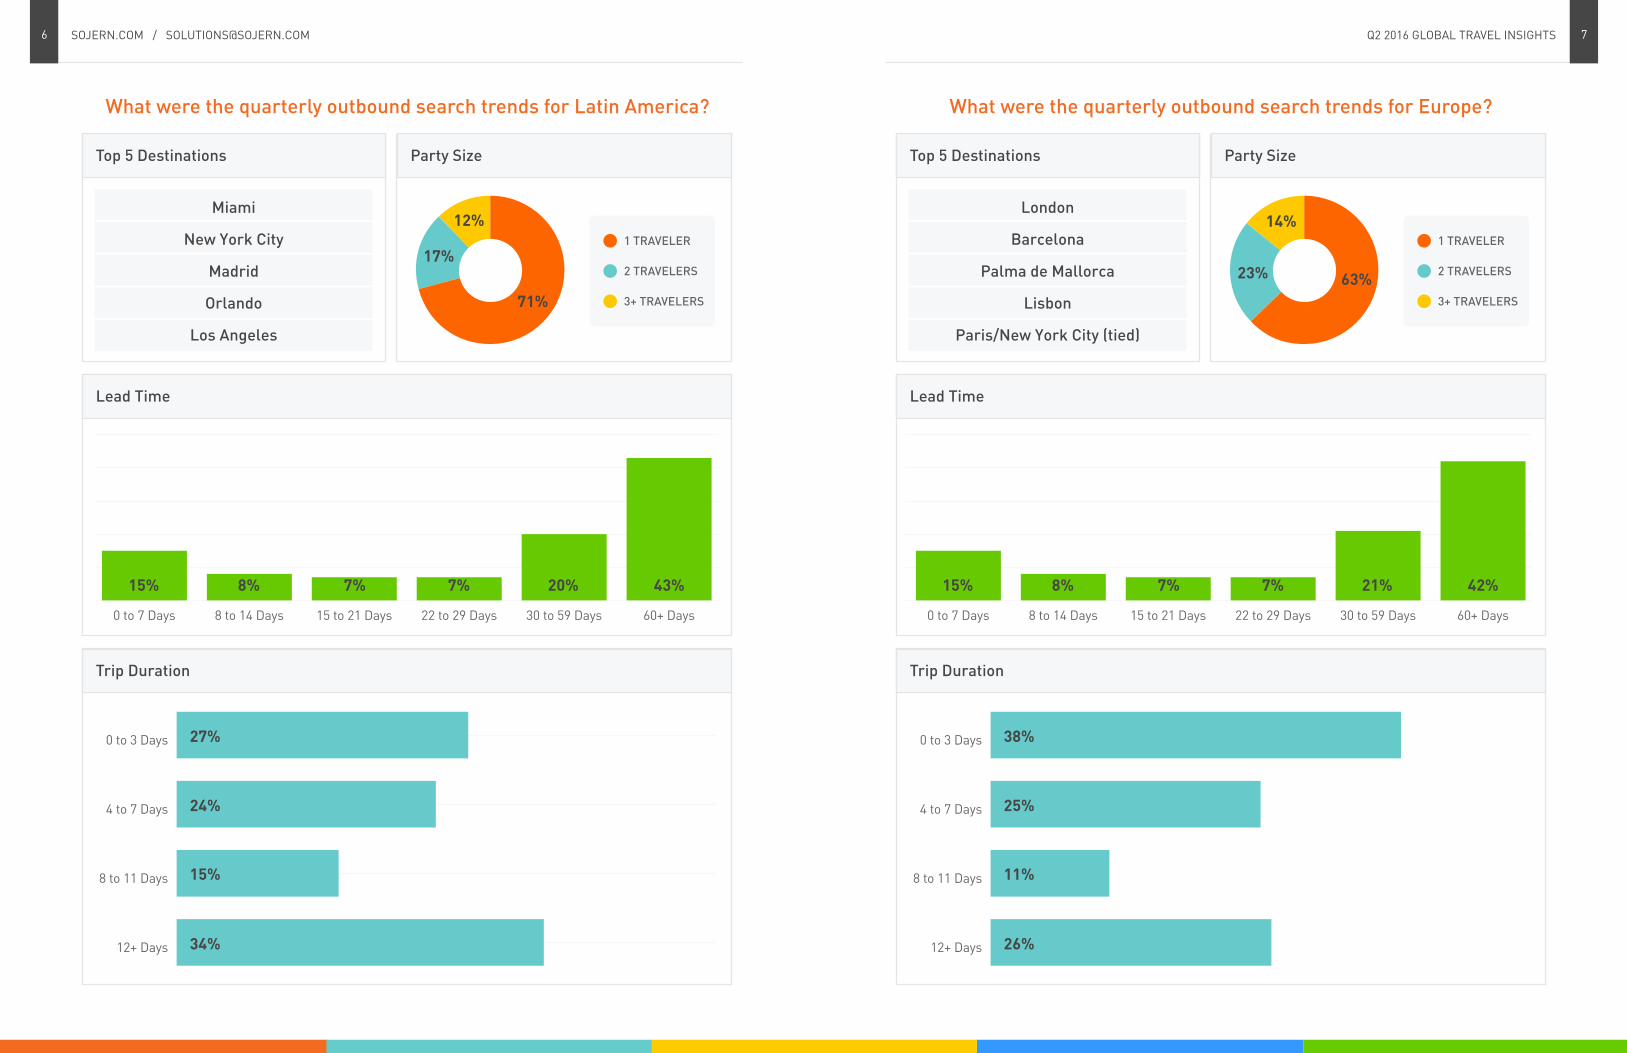
What were the quarterly outbound search trends for Latin America? What were the quarterly outbound search trends for Europe?
60+ Days30 to 59 Days22 to 29 Days15 to 21 Days8 to 14 Days0 to 7 Days
Miami
New York City
Madrid
Orlando
Los Angeles
Top 5 Destinations Party Size
Lead Time
20% 43%7% 7%15% 8%
1 TRAVELER
2 TRAVELERS
3+ TRAVELERS71%
17%
12%
12+ Days
8 to 11 Days
4 to 7 Days
0 to 3 Days
Trip Duration
27%
24%
15%
34%
60+ Days30 to 59 Days22 to 29 Days15 to 21 Days8 to 14 Days0 to 7 Days
London
Barcelona
Palma de Mallorca
Lisbon
Paris/New York City (tied)
Top 5 Destinations Party Size
Lead Time
21% 42%7% 7%15% 8%
1 TRAVELER
2 TRAVELERS
3+ TRAVELERS
63%23%
14%
12+ Days
8 to 11 Days
4 to 7 Days
0 to 3 Days
Trip Duration
38%
25%
11%
26%

SOJERN.COM / [email protected] Q2 2016 GLOBAL TRAVEL INSIGHTS 9 8
What were the quarterly outbound search trends for the Middle East & Africa? What were the quarterly outbound search trends for Asia-Pacific?
60+ Days30 to 59 Days22 to 29 Days15 to 21 Days8 to 14 Days0 to 7 Days
London
New York City
Paris
Istanbul
Dubai
Top 5 Destinations Party Size
Lead Time
20% 36%8% 8%18% 10%
1 TRAVELER
2 TRAVELERS
3+ TRAVELERS72%
14%
13%
12+ Days
8 to 11 Days
4 to 7 Days
0 to 3 Days
Trip Duration
27%
26%
14%
33%
60+ Days30 to 59 Days22 to 29 Days15 to 21 Days8 to 14 Days0 to 7 Days
Bangkok
Tokyo
Singapore
Hong Kong
London
Top 5 Destinations Party Size
Lead Time
19% 44%7% 7%15% 8%
1 TRAVELER
2 TRAVELERS
3+ TRAVELERS68%
19%
12%
12+ Days
8 to 11 Days
4 to 7 Days
0 to 3 Days
Trip Duration
37%
29%
12%
22%

SOJERN.COM / [email protected] Q2 2016 GLOBAL TRAVEL INSIGHTS 11 10
Q2 2016 Travel Events
North America: Copa GamesThe US hosted the Copa America tournament for the first time in the games’ 100 year history on June 3-26. Cities including Seattle, San Francisco, and Orlando played host to soccer teams and fans from all over North and South America.
In our Q1 2016 report, travel intent revealed that Dallas, Chicago, and Boston were the top cities searching to go to the tournament. We’ve updated our look to include top originations booking flights to Copa cities during Q1 and Q2:
Top Origination for Copa Games Q1 Compared to Q2
Rank Top Booked in Q1 Top Booked in Q2 Rank Change
1 San Francisco New York City +1
2 New York City San Francisco -1
3 Chicago Chicago -
4 Dallas Los Angeles +2
5 Miami Miami -
6 Los Angeles Dallas -2
7 Phoenix Phoenix -
8 Philadelphia Philadelphia -
9 Houston Houston -
10 San Diego Washington, DC +
Knowing the origin markets headed to your city is important for any travel marketer, so too is knowing the magnitude of events like Copa for drawing travelers. With host cities seeing a sizeable increase in travelers during the Copa games, travel marketers need to take note and market to event-based travelers.
+29%for Seattle
+28%for Orlando
+131%Increase in the share of
searches for European destinations in May 2016 compared to May 2015
+21%for San Francisco
+42%Year-over-year increase in volume of bookings from
Colombia to Europe
Incremental Increase in Bookings Year-Over-Year During Copa Dates
1 Bendavid, Naftali. (June 10, 2015) “EU Signs Visa Pact With Colombia and Peru.” The Wall Street Journal.
Latin America: Colombia Visa Restrictions LiftedOn December 2, 2015, Colombia and the European Union (EU) signed a short-stay visa agreement. This allows travel between the two geos without the previously required visas.1 The increase in searches from Colombia to the EU was immediate and dramatic:
Lifting these restrictions has an impact on not only Colombian travelers, but also the global travel industry. If you’re a European travel marketer, knowing that you have access to a group who were previously difficult to reach, gives you a direct avenue for finding new customers.The substantial increase in interest to the EU means that there is a new group of in-market travelers who you can message.
If you’re a travel marketer in Latin America, you too have a new, fresh market in European travelers and should start planning accordingly.
0
50
100
150
200
MayAprMarFebJan '16DecNovOctSepAugJulJunMay '15
VISA WAIVER AGREEMENT SIGNED
BOOKINGS TO EUROPE
Indexed Bookings From Colombia to Europe100 = Monthly Average Bookings from May 2015 to May 2016
SOJERN.COM / [email protected] Q2 2016 GLOBAL TRAVEL INSIGHTS 13 12
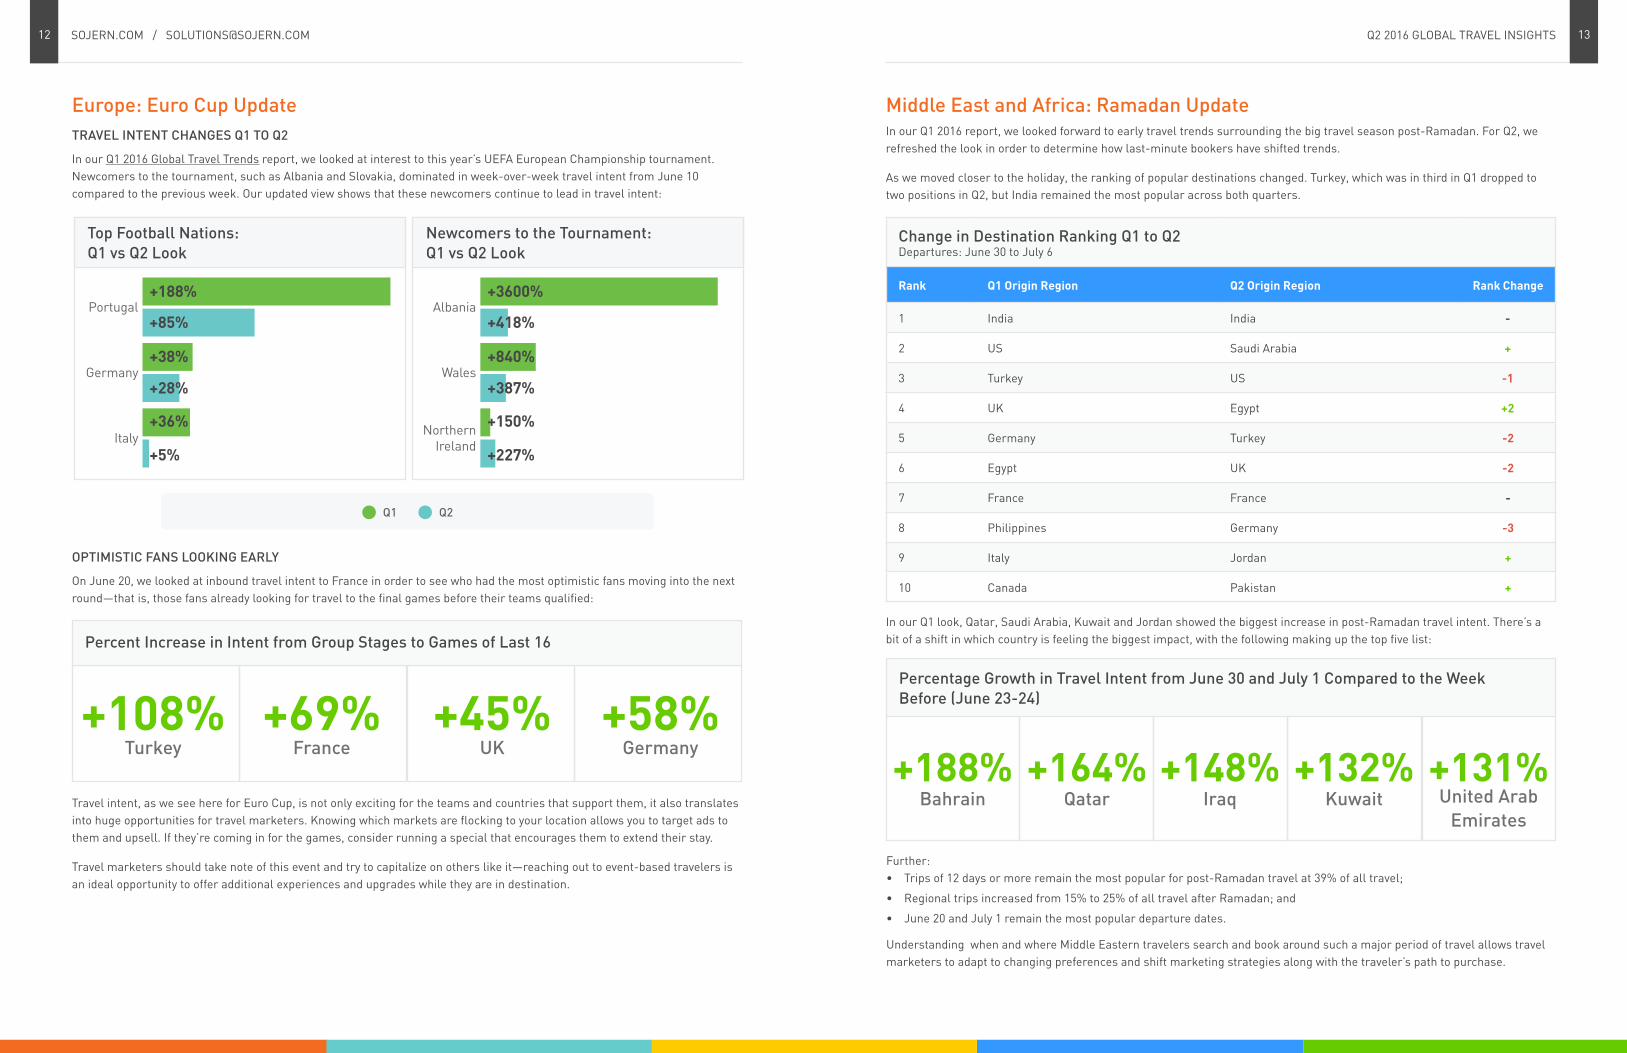
Europe: Euro Cup UpdateTRAVEL INTENT CHANGES Q1 TO Q2
In our Q1 2016 Global Travel Trends report, we looked at interest to this year’s UEFA European Championship tournament. Newcomers to the tournament, such as Albania and Slovakia, dominated in week-over-week travel intent from June 10 compared to the previous week. Our updated view shows that these newcomers continue to lead in travel intent:
Middle East and Africa: Ramadan UpdateIn our Q1 2016 report, we looked forward to early travel trends surrounding the big travel season post-Ramadan. For Q2, we refreshed the look in order to determine how last-minute bookers have shifted trends.
As we moved closer to the holiday, the ranking of popular destinations changed. Turkey, which was in third in Q1 dropped to two positions in Q2, but India remained the most popular across both quarters.
OPTIMISTIC FANS LOOKING EARLY
On June 20, we looked at inbound travel intent to France in order to see who had the most optimistic fans moving into the next round—that is, those fans already looking for travel to the final games before their teams qualified:
In our Q1 look, Qatar, Saudi Arabia, Kuwait and Jordan showed the biggest increase in post-Ramadan travel intent. There’s a bit of a shift in which country is feeling the biggest impact, with the following making up the top five list:
Further:• Trips of 12 days or more remain the most popular for post-Ramadan travel at 39% of all travel;
• Regional trips increased from 15% to 25% of all travel after Ramadan; and
• June 20 and July 1 remain the most popular departure dates.
Understanding when and where Middle Eastern travelers search and book around such a major period of travel allows travel marketers to adapt to changing preferences and shift marketing strategies along with the traveler’s path to purchase.
Change in Destination Ranking Q1 to Q2 Departures: June 30 to July 6
Rank Q1 Origin Region Q2 Origin Region Rank Change
1 India India -
2 US Saudi Arabia +
3 Turkey US -1
4 UK Egypt +2
5 Germany Turkey -2
6 Egypt UK -2
7 France France -
8 Philippines Germany -3
9 Italy Jordan +
10 Canada Pakistan +
Travel intent, as we see here for Euro Cup, is not only exciting for the teams and countries that support them, it also translates into huge opportunities for travel marketers. Knowing which markets are flocking to your location allows you to target ads to them and upsell. If they’re coming in for the games, consider running a special that encourages them to extend their stay.
Travel marketers should take note of this event and try to capitalize on others like it—reaching out to event-based travelers is an ideal opportunity to offer additional experiences and upgrades while they are in destination.
+188%Bahrain
+164%Qatar
+148%Iraq
+132%Kuwait
+131%United Arab
Emirates
Percentage Growth in Travel Intent from June 30 and July 1 Compared to the Week Before (June 23-24)+108%
Turkey+69%
France+45%
UK+58%
Germany
Percent Increase in Intent from Group Stages to Games of Last 16
Italy
Germany
Portugal
Top Football Nations:Q1 vs Q2 Look
Newcomers to the Tournament:Q1 vs Q2 Look
+188%
+85%
+38%
+28%
+36%
+5%
NorthernIreland
Wales
Albania+3600%
+418%
+840%
+387%
+150%
+227%
Q1 Q2
SOJERN.COM / [email protected] Q2 2016 GLOBAL TRAVEL INSIGHTS 15 14
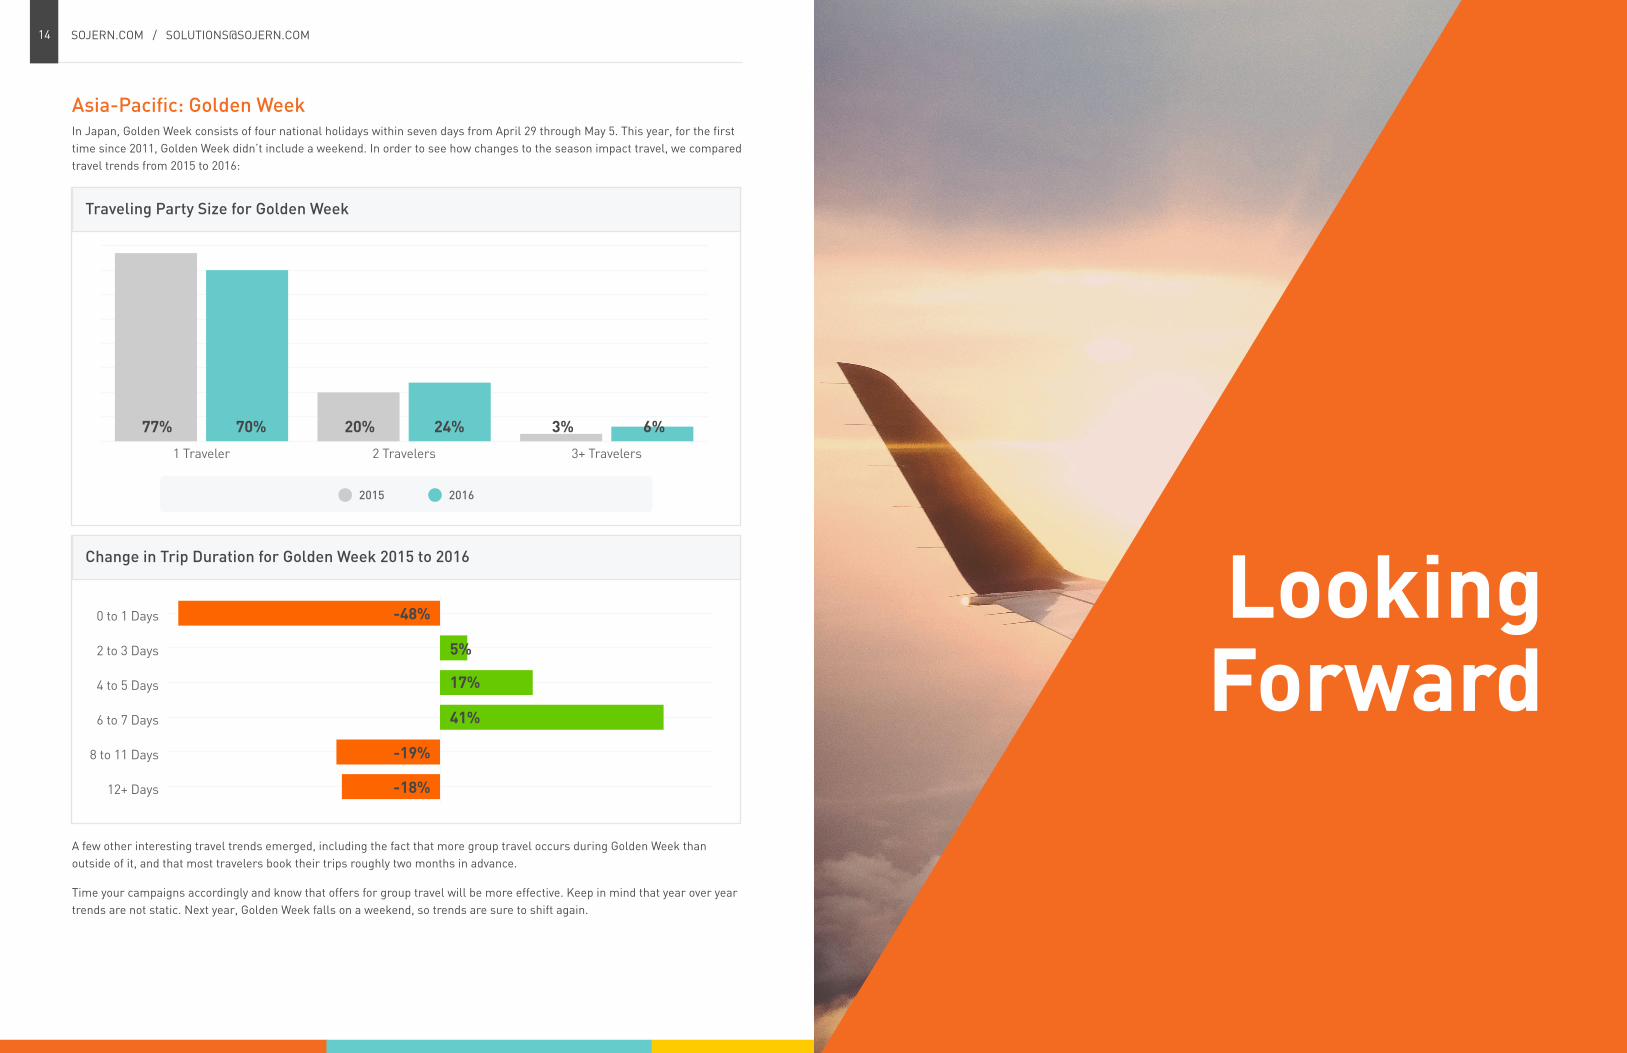
Asia-Pacific: Golden WeekIn Japan, Golden Week consists of four national holidays within seven days from April 29 through May 5. This year, for the first time since 2011, Golden Week didn’t include a weekend. In order to see how changes to the season impact travel, we compared travel trends from 2015 to 2016:
A few other interesting travel trends emerged, including the fact that more group travel occurs during Golden Week than outside of it, and that most travelers book their trips roughly two months in advance.
Time your campaigns accordingly and know that offers for group travel will be more effective. Keep in mind that year over year trends are not static. Next year, Golden Week falls on a weekend, so trends are sure to shift again.
Looking Forward
3+ Travelers2 Travelers1 Traveler
77% 70% 20% 24% 3% 6%
Traveling Party Size for Golden Week
2015 2016
12+ Days
8 to 11 Days
6 to 7 Days
4 to 5 Days
2 to 3 Days
0 to 1 Days
5%
-48%
-19%
-18%
17%
41%
Change in Trip Duration for Golden Week 2015 to 2016
SOJERN.COM / [email protected] Q2 2016 GLOBAL TRAVEL INSIGHTS 17 16
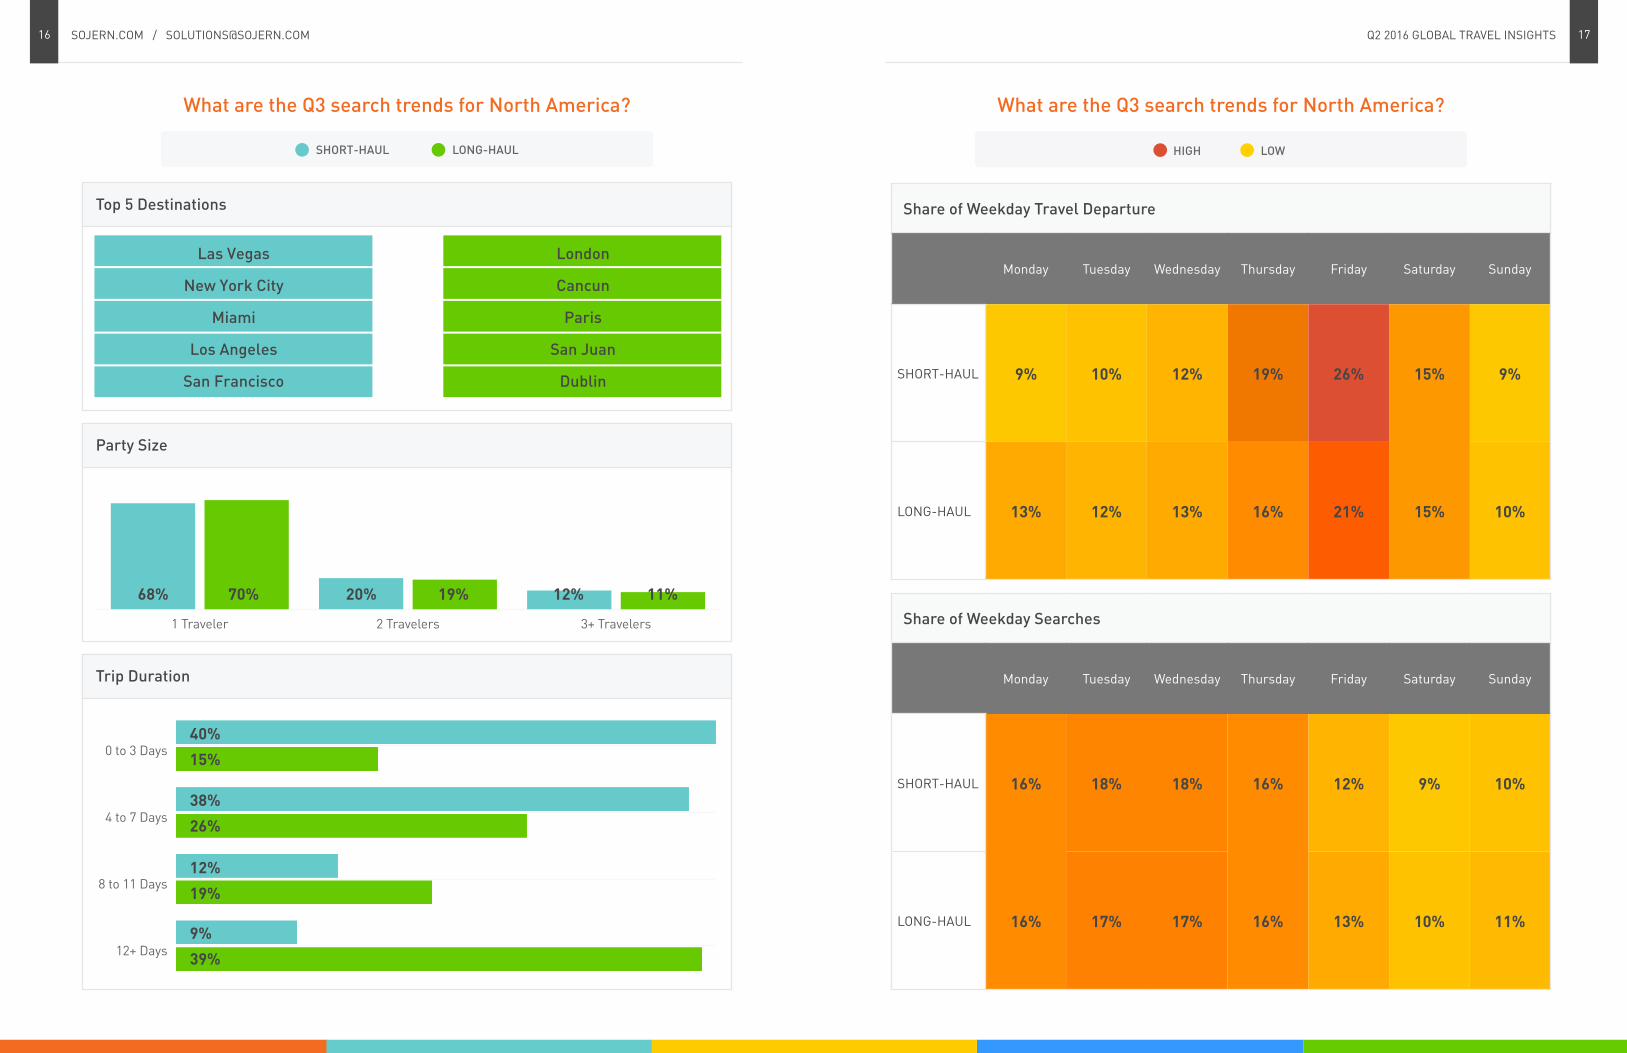
What are the Q3 search trends for North America? What are the Q3 search trends for North America?
Las Vegas
New York City
Miami
Los Angeles
San Francisco
London
Cancun
Paris
San Juan
Dublin
Top 5 Destinations
Party Size
Trip Duration
SHORT-HAUL LONG-HAUL
12+ Days
8 to 11 Days
4 to 7 Days
0 to 3 Days40%
15%
38%
26%
12%
19%
9%
39%
3+ Travelers2 Travelers1 Traveler
12% 11%20% 19%68% 70%
Share of Weekday Travel Departure
Monday Tuesday Wednesday Thursday Friday Saturday Sunday
SHORT-HAUL 9% 10% 12% 19% 26% 15% 9%
LONG-HAUL 13% 12% 13% 16% 21% 15% 10%
Share of Weekday Searches
Monday Tuesday Wednesday Thursday Friday Saturday Sunday
SHORT-HAUL 16% 18% 18% 16% 12% 9% 10%
LONG-HAUL 16% 17% 17% 16% 13% 10% 11%
HIGH LOW
SOJERN.COM / [email protected] Q2 2016 GLOBAL TRAVEL INSIGHTS 19 18
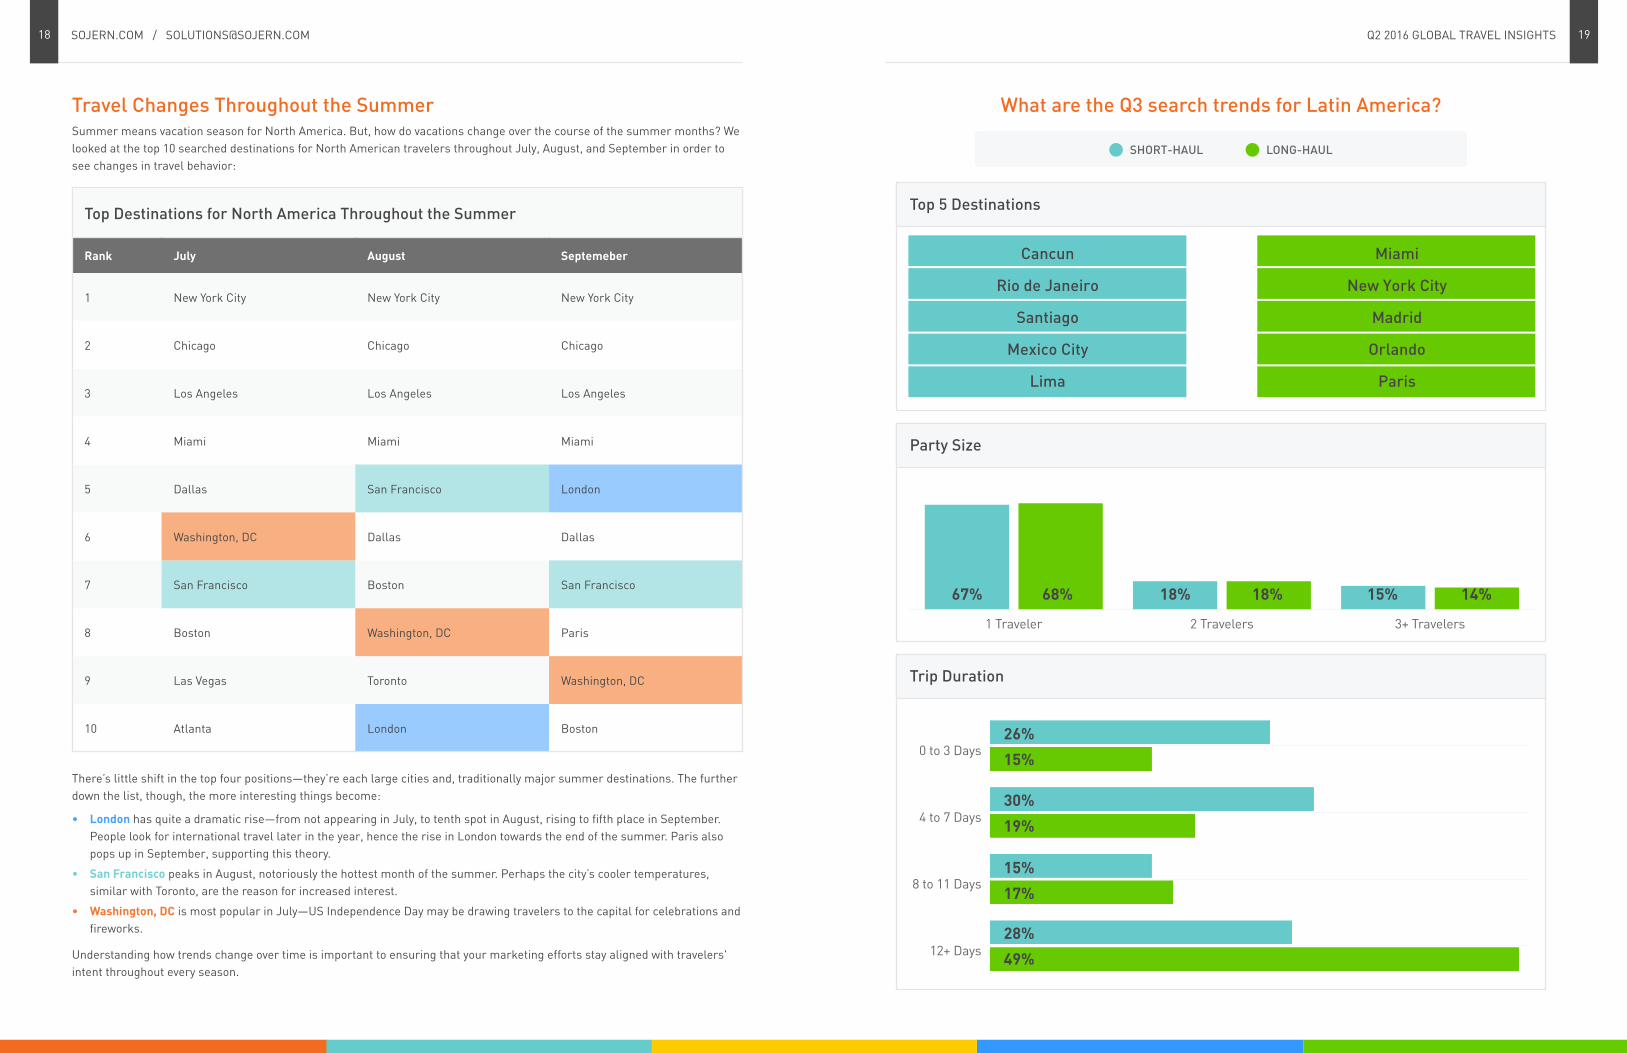
Travel Changes Throughout the SummerSummer means vacation season for North America. But, how do vacations change over the course of the summer months? We looked at the top 10 searched destinations for North American travelers throughout July, August, and September in order to see changes in travel behavior:
Top Destinations for North America Throughout the Summer
Rank July August Septemeber
1 New York City New York City New York City
2 Chicago Chicago Chicago
3 Los Angeles Los Angeles Los Angeles
4 Miami Miami Miami
5 Dallas San Francisco London
6 Washington, DC Dallas Dallas
7 San Francisco Boston San Francisco
8 Boston Washington, DC Paris
9 Las Vegas Toronto Washington, DC
10 Atlanta London Boston
There’s little shift in the top four positions—they’re each large cities and, traditionally major summer destinations. The further down the list, though, the more interesting things become:
• London has quite a dramatic rise—from not appearing in July, to tenth spot in August, rising to fifth place in September. People look for international travel later in the year, hence the rise in London towards the end of the summer. Paris also pops up in September, supporting this theory.
• San Francisco peaks in August, notoriously the hottest month of the summer. Perhaps the city’s cooler temperatures, similar with Toronto, are the reason for increased interest.
• Washington, DC is most popular in July—US Independence Day may be drawing travelers to the capital for celebrations and fireworks.
Understanding how trends change over time is important to ensuring that your marketing efforts stay aligned with travelers' intent throughout every season.
What are the Q3 search trends for Latin America?
Cancun
Rio de Janeiro
Santiago
Mexico City
Lima
Miami
New York City
Madrid
Orlando
Paris
Top 5 Destinations
Party Size
Trip Duration
SHORT-HAUL LONG-HAUL
12+ Days
8 to 11 Days
4 to 7 Days
0 to 3 Days26%
15%
30%
19%
15%
17%
28%
49%
3+ Travelers2 Travelers1 Traveler
15% 14%18% 18%67% 68%
SOJERN.COM / [email protected] Q2 2016 GLOBAL TRAVEL INSIGHTS 21 20
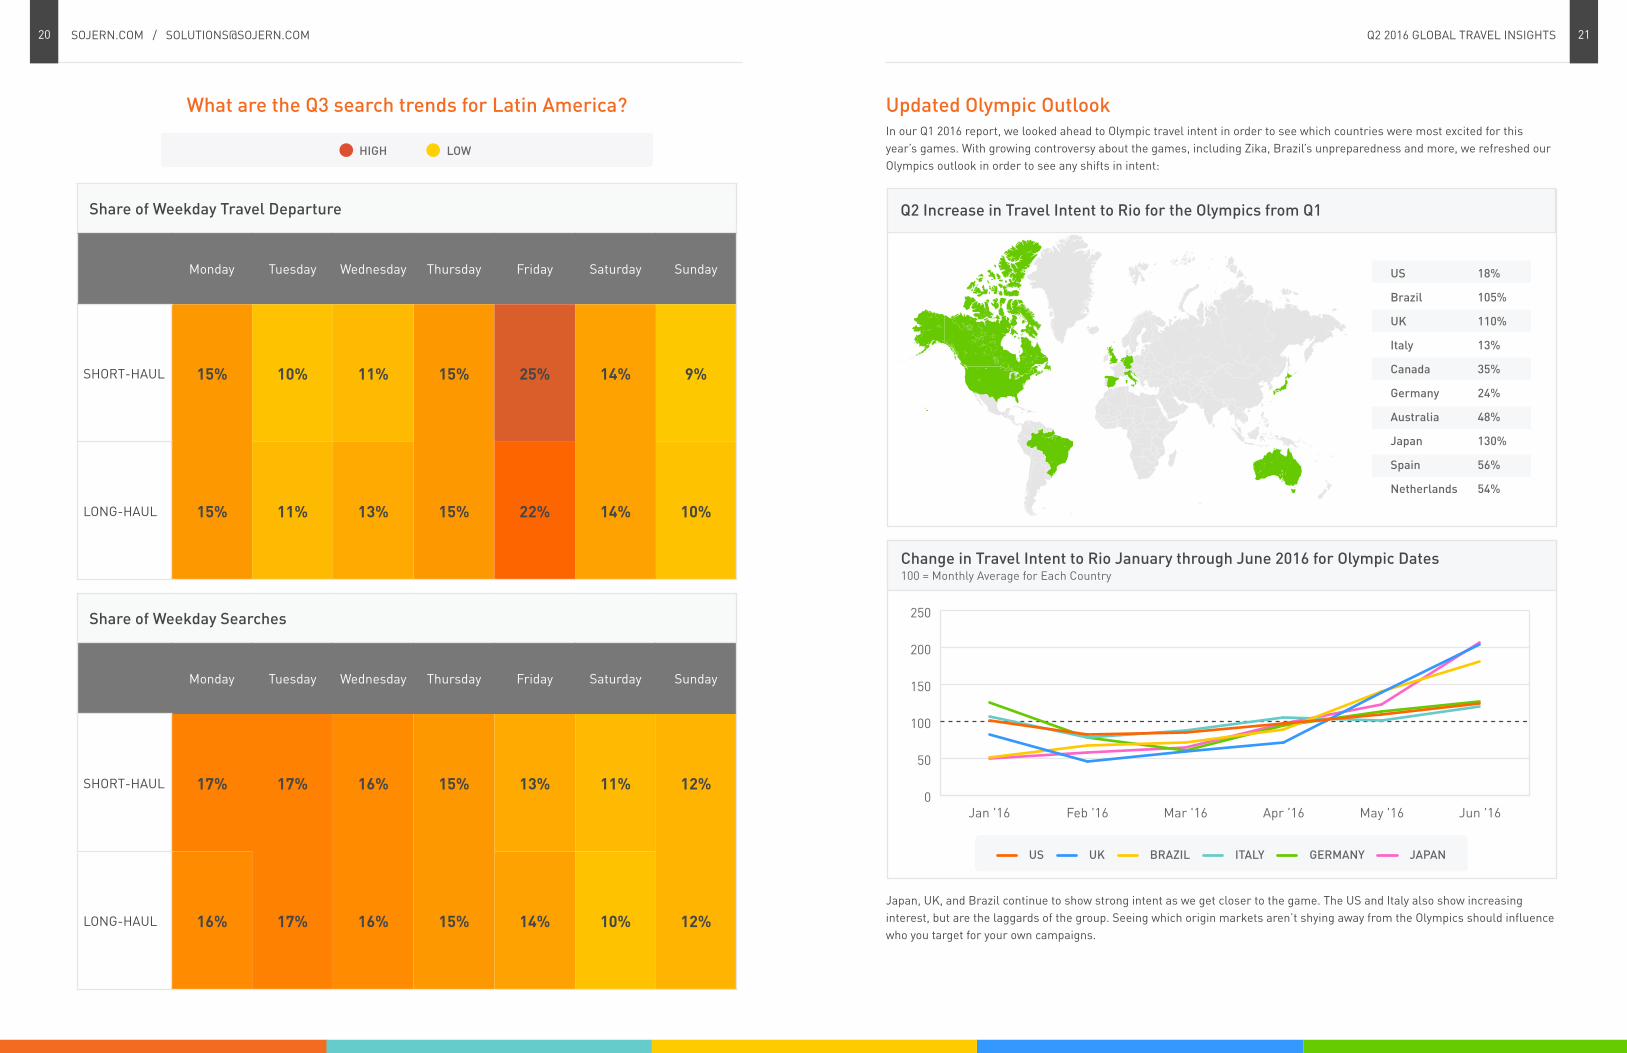
Updated Olympic OutlookIn our Q1 2016 report, we looked ahead to Olympic travel intent in order to see which countries were most excited for this year’s games. With growing controversy about the games, including Zika, Brazil’s unpreparedness and more, we refreshed our Olympics outlook in order to see any shifts in intent:
Japan, UK, and Brazil continue to show strong intent as we get closer to the game. The US and Italy also show increasing interest, but are the laggards of the group. Seeing which origin markets aren’t shying away from the Olympics should influence who you target for your own campaigns.
What are the Q3 search trends for Latin America?
Share of Weekday Travel Departure
Monday Tuesday Wednesday Thursday Friday Saturday Sunday
SHORT-HAUL 15% 10% 11% 15% 25% 14% 9%
LONG-HAUL 15% 11% 13% 15% 22% 14% 10%
Share of Weekday Searches
Monday Tuesday Wednesday Thursday Friday Saturday Sunday
SHORT-HAUL 17% 17% 16% 15% 13% 11% 12%
LONG-HAUL 16% 17% 16% 15% 14% 10% 12%
HIGH LOW
Q2 Increase in Travel Intent to Rio for the Olympics from Q1
US
Brazil
UK
Italy
Canada
Germany
Australia
Japan
Spain
Netherlands
18%
105%
110%
13%
35%
24%
48%
130%
56%
54%
US UK BRAZIL ITALY GERMANY JAPAN
0
50
100
150
200
250
Jun '16May '16Apr '16Mar '16Feb '16Jan '16
Change in Travel Intent to Rio January through June 2016 for Olympic Dates100 = Monthly Average for Each Country

SOJERN.COM / [email protected] Q2 2016 GLOBAL TRAVEL INSIGHTS 23 22
What are the Q3 search trends for Europe?
Palma de Mallorca
Barcelona
London
Ibiza
Malaga
New York City
Bangkok
Los Angeles
Bali
Miami
Top 5 Destinations
Party Size
Trip Duration
SHORT-HAUL LONG-HAUL
12+ Days
8 to 11 Days
4 to 7 Days
0 to 3 Days32%
15%
30%
13%
14%
12%
24%
60%
3+ Travelers2 Travelers1 Traveler
22% 18%26% 23%52% 59%
What are the Q3 search trends for Europe?
Share of Weekday Travel Departure
Monday Tuesday Wednesday Thursday Friday Saturday Sunday
SHORT-HAUL 19% 8% 9% 14% 25% 16% 9%
LONG-HAUL 21% 10% 10% 14% 20% 15% 10%
Share of Weekday Searches
Monday Tuesday Wednesday Thursday Friday Saturday Sunday
SHORT-HAUL 16% 16% 15% 14% 12% 11% 15%
LONG-HAUL 16% 16% 15% 14% 12% 12% 16%
HIGH LOW

SOJERN.COM / [email protected] Q2 2016 GLOBAL TRAVEL INSIGHTS 25 24
City Search Patterns Compared: UK Spotlight Not all cities within the same country plan travel in the exact same way, but often travel advertisers take country-level approach to their marketing strategies. But this misses the nuances of city and region-specific trends, which are important to reaching the appropriate audience. In order to get more strategic, we looked at a city-level comparison of searches and bookings from the UK, one of the biggest outbound summer travel groups in Europe:
London dominates for single travelers, followed by Edinburgh. Couple travel is biggest in Liverpool, and family travel (three or more) is most frequent in Birmingham. Understanding how each city travels, including popularity of party sizes, allows you to target your campaigns accordingly—promoting more family deals to the Birmingham audience, for instance.
DEPARTURE DAYS
The biggest day of departure across the UK is Friday—in London, for instance, 25% of departures take place then. As the UK is only a couple hours away from other European hubs, weekend city breaks are commonplace. Offering specials for these departures dates, or add-ons nearer to when people are leaving, are two great ways to make the most out of these timing trends.
LEAD TIME
Looking very generally at lead times, London and Birmingham stand out with tendencies towards last-minute travel, with 14% of their lead times fewer than seven days. A high population of business travelers in these big cities, coupled with a high propensity for city breaks, may be responsible for these standouts.
Knowing your strongest markets, and where you are weaker, can help make sure your marketing efforts are strategically diversified.
What are the Q3 search trends for Middle East & Africa?
Cairo
Dubai
Amman
Tel Aviv
Beirut
New York City
London
Istanbul
Paris
Bangkok
Top 5 Destinations
Party Size
Trip Duration
SHORT-HAUL LONG-HAUL
12+ Days
8 to 11 Days
4 to 7 Days
0 to 3 Days19%
15%
22%
22%
13%
17%
46%
46%
3+ Travelers2 Travelers1 Traveler
18% 21%11% 15%71% 64%
16%London
17%Birmingham
22%Liverpool
21%Glasgow
Percentage of Travelers Looking to Destinations in Spain
DESTINATIONS
Spain remains the most popular destination for UK travelers, but to varying degrees:
Searching and Booking with Departures Until End of 2016
1 TRAVELER 2 TRAVELERS 3+ TRAVELERS
0
20
40
60
80
100
OtherEdinburghLiverpoolGlasgowManchesterBirminghamLondon
64% 54% 54% 53% 51% 58% 53%
SOJERN.COM / [email protected] Q2 2016 GLOBAL TRAVEL INSIGHTS 27 26
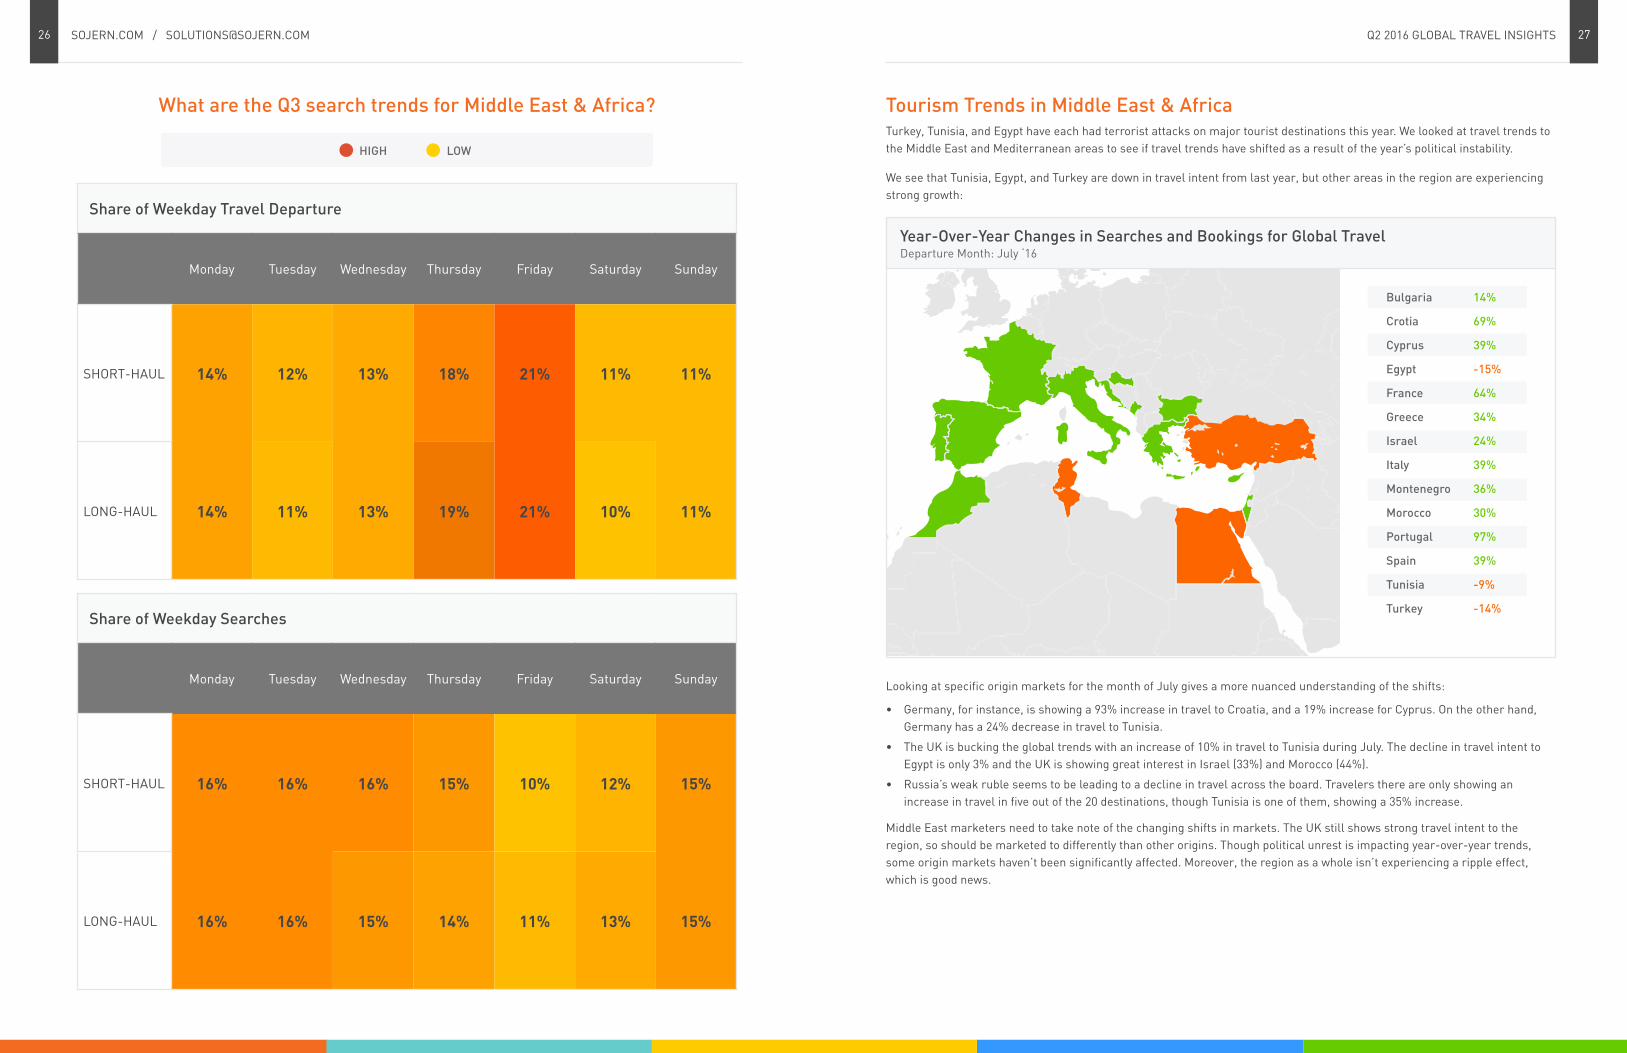
Tourism Trends in Middle East & AfricaTurkey, Tunisia, and Egypt have each had terrorist attacks on major tourist destinations this year. We looked at travel trends to the Middle East and Mediterranean areas to see if travel trends have shifted as a result of the year’s political instability.
We see that Tunisia, Egypt, and Turkey are down in travel intent from last year, but other areas in the region are experiencing strong growth:
Looking at specific origin markets for the month of July gives a more nuanced understanding of the shifts:
• Germany, for instance, is showing a 93% increase in travel to Croatia, and a 19% increase for Cyprus. On the other hand, Germany has a 24% decrease in travel to Tunisia.
• The UK is bucking the global trends with an increase of 10% in travel to Tunisia during July. The decline in travel intent to Egypt is only 3% and the UK is showing great interest in Israel (33%) and Morocco (44%).
• Russia’s weak ruble seems to be leading to a decline in travel across the board. Travelers there are only showing an increase in travel in five out of the 20 destinations, though Tunisia is one of them, showing a 35% increase.
Middle East marketers need to take note of the changing shifts in markets. The UK still shows strong travel intent to the region, so should be marketed to differently than other origins. Though political unrest is impacting year-over-year trends, some origin markets haven’t been significantly affected. Moreover, the region as a whole isn’t experiencing a ripple effect, which is good news.
What are the Q3 search trends for Middle East & Africa?
Share of Weekday Travel Departure
Monday Tuesday Wednesday Thursday Friday Saturday Sunday
SHORT-HAUL 14% 12% 13% 18% 21% 11% 11%
LONG-HAUL 14% 11% 13% 19% 21% 10% 11%
Share of Weekday Searches
Monday Tuesday Wednesday Thursday Friday Saturday Sunday
SHORT-HAUL 16% 16% 16% 15% 10% 12% 15%
LONG-HAUL 16% 16% 15% 14% 11% 13% 15%
HIGH LOW
Bulgaria
Crotia
Cyprus
Egypt
France
Greece
Israel
Italy
Montenegro
Morocco
Portugal
Spain
Tunisia
Turkey
14%
69%
39%
-15%
64%
34%
24%
39%
36%
30%
97%
39%
-9%
-14%
Year-Over-Year Changes in Searches and Bookings for Global TravelDeparture Month: July ‘16
SOJERN.COM / [email protected] Q2 2016 GLOBAL TRAVEL INSIGHTS 29 28
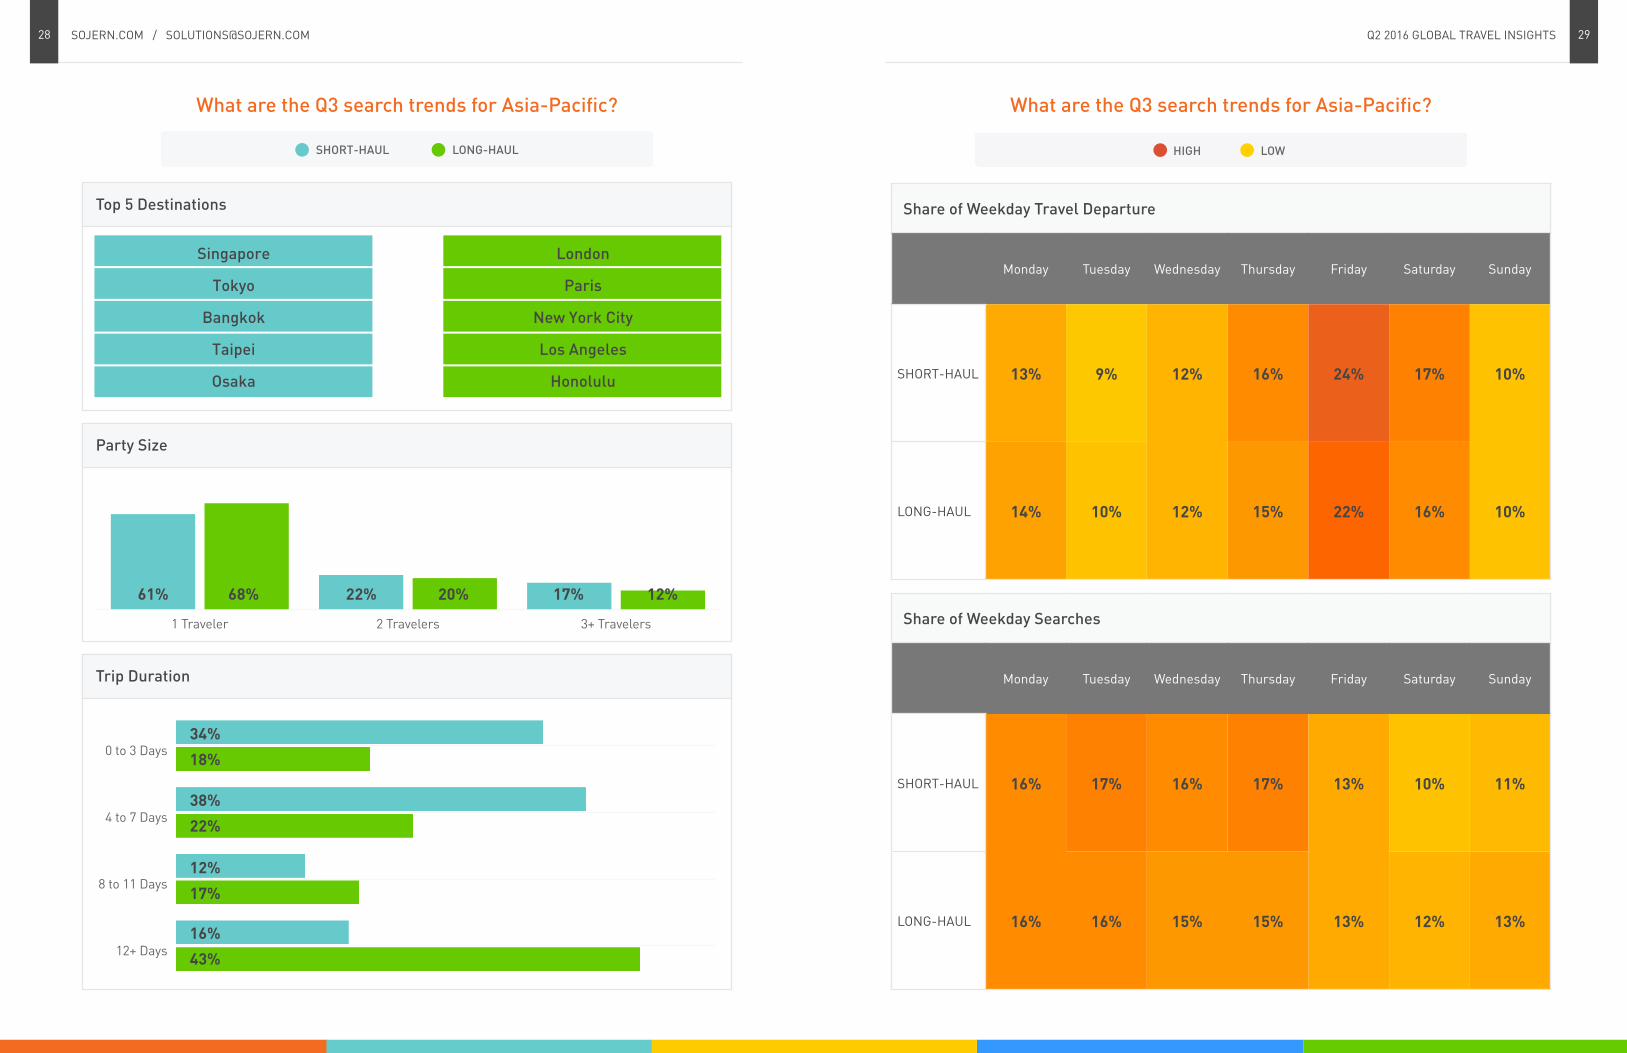
What are the Q3 search trends for Asia-Pacific?
Singapore
Tokyo
Bangkok
Taipei
Osaka
London
Paris
New York City
Los Angeles
Honolulu
Top 5 Destinations
Party Size
Trip Duration
SHORT-HAUL LONG-HAUL
12+ Days
8 to 11 Days
4 to 7 Days
0 to 3 Days34%
18%
38%
22%
12%
17%
16%
43%
3+ Travelers2 Travelers1 Traveler
17% 12%22% 20%61% 68%
What are the Q3 search trends for Asia-Pacific?
Share of Weekday Travel Departure
Monday Tuesday Wednesday Thursday Friday Saturday Sunday
SHORT-HAUL 13% 9% 12% 16% 24% 17% 10%
LONG-HAUL 14% 10% 12% 15% 22% 16% 10%
Share of Weekday Searches
Monday Tuesday Wednesday Thursday Friday Saturday Sunday
SHORT-HAUL 16% 17% 16% 17% 13% 10% 11%
LONG-HAUL 16% 16% 15% 15% 13% 12% 13%
HIGH LOW

SOJERN.COM / [email protected] Q2 2016 GLOBAL TRAVEL INSIGHTS 31 30
Singapore Formula One Grand Prix PreviewThe Singapore Grand Prix runs September 16-18 and an estimated 40,000 international tourists will pour into Singapore for the event.2 In order to preview travel for the Grand Prix, we compared travel trends from the week of the race with the previous week. We see an increase in travel intent to Singapore during the event for most regions:
Additional changes to Singapore travel trends include:
• A decline in Middle Eastern travelers of 63%. The Islamic Festival of Sacrifice (Eid al-Adha) occurs in early September this year and many Middle Eastern travelers are headed to Singapore then. The decrease in intent for the Grand Prix is only because there were so many travelers visiting earlier.
• Although typically Singapore weekend travelers arrive on Friday and Saturday, for the Grand Prix, the most popular date of arrival is Thursday.
• Trip duration also changes with travelers looking for more 4-5 day trips, perhaps to see the race and the qualifying:
Marketing to Grand Prix tourists means knowing how their behavior differs. Consider offering more ‘5th night free’ deals in order to capitalize on travelers looking for a long weekend. Also, knowing that the UK is your biggest international destination market means honing in your ad spend to the region.
Appendix
Glossary Lead Time (Search or Booking): The length of time between a search or booking and departure date.
Last-Minute Booker: A traveler that books a trip with seven days or less to travel.
Short-Haul & Long-Haul Trip: Short-haul is usually regional, while long-haul is usually inter-regional.
Regional CoverageSojern breaks down the world into regions and subregions as shown in the map below. Regions are shown with a colored background and subregions with a white background.
MethodologySojern’s quarterly insights reports are based on the rigorous analysis of more than a billion traveler intent data points, obtained through Sojern’s unique partnerships with some of the world’s most renowned travel brands. Our analysis is based on airport level data which is then aggregated to countries and regions. All of the insights are based on very specific data sets as provided by Sojern's data partners. Sojern’s data is rounded to the nearest whole number for readability and therefore not all charts and graphs will add up to 100%. Sojern never shares or distributes personally identifiable information (PII) such as names, emails, or addresses. The data provided is not a complete view of all global traveler information, as different data sources provide additional views of traveler behavior.
Caribbean
South America
Oceania
Southeast Asia
East Asia
South Asia
Middle East
North America
Europe
Central America
Latin America
Asia-Pacific
Eastern Europe
Central Asia
Sub-Saharan Africa
North Africa
Middle East & Africa
Western Europe
+19%Western Europe
+104%East Asia
+46%Oceania
+41%UK
Comparison of Travel Intent for the Week Leading Up to the Singapore Grand Prix to the Week Before
Change in Trip Duration Race Week vs Week Before
12+ Days
8 to 11 Days
6 to 7 Days
4 to 5 Days
2 to 3 Days
0 to 1 Days
-38%
-32%
-13%
65%
34%
-12%
2 Balfour, Andrew. (July 19, 2015).“Race Facts—Singapore Grand Prix.” F1 Destinations.

SAN FRANCISCO 118 2nd St., 3rd Floor San Francisco, CA 94105
NEW YORK240 West 35th Street, Suite 500New York, NY 10001
OMAHA810 S. 169th St. Omaha, NE 68118
LONDON18 Soho SquareLondon, W1D 3QL
SINGAPORE
#42-01Six Battery RoadSingapore 049909
DUBAI37th Floor, Jumeirah Business Centre 2Unit 3702-25 JLT, Dubai, UAE
SIGN UP FOR MORE INSIGHTS
www.sojern.com/mailing-list/