q2 2018 investor meeting - marel · earnings per share favorable development in earnings per share...
TRANSCRIPT

Smarter processing
July 26, 2018
Q2 2018
Investor meeting
1

2
Chief Financial Officer
LINDA JONSDOTTIR
Chief Executive Officer
ARNI ODDUR THORDARSON

• Record revenues of
EUR 297m in 2Q18, up
22% YoY
• Adjusted EBIT result
from operations was
EUR 43m, up 20% YoY
• EBIT* margin was
14.6%
• Orders received were
good across all sectors
and geographies, up 7%
YoY
• Strong order book
provides good
foundation for future
quarters
STRONG ORGANIC GROWTH AND SOLID PERFORMANCE
Revenues were a record EUR 297m in 2Q18 and the adjusted EBIT margin was 14.6%.
EBIT was EUR 43m, up 20% year-on-year.
HIGHLIGHTS
3
ORDERS RECEIVED ORDER BOOK
EUR
297mEUR
43m
EUR
291mEUR
523m
REVENUES ADJUSTED EBIT*
2Q17
244297
2Q18
4336
2Q182Q17
291
2Q17
273
2Q18
523
419
2Q17 2Q18
* Operating income adjusted for amortization of acquisition-related
(in)tangible assets (PPA)

BALANCED REVENUE MIX
Focus on the three industries creates an overall balanced product mix
and counterbalances fluctuations in operations
POULTRY MEAT FISH
• Strong order intake and improved
operational results, still below long-term
targets
• Continued investments in innovation
and standardization have delivered
good order intake and better margins
• Marel is now a full-line supplier to the
meat processing industry
• Agreement to acquire MAJA, a German
food processing equipment manufacturer,
to accelerate market penetration
• Strong quarter with robust order intake,
strong volume and solid operational
performance
• Good market conditions and strong
competitive position
15% of revenues
8.5% EBIT margin
32% of revenues
12.8% EBIT* margin52% of revenues
17.4% EBIT margin
* Operating income adjusted for amortization of acquisition-related
(in)tangible assets (PPA)
All financial numbers relate to the 2018 Condensed Consolidated
Interim Financial Statements. Other segments account for 1% of the
revenues.
Marel is reaping the benefits of a steady
flow of innovative products with standard
blocks and full line offering
Focus going forward on
increased standardization
and modularization
Focus on full-line offering for
wild whitefish, farmed salmon and
farmed whitefish
44

• At quarter-end, the
order book was 46%
of trailing twelve
months revenues
• Greenfields and
projects with long lead
times constitute the
vast majority of the
order book
• Standard equipment
and spare parts run
with shorter cycles
than larger projects
• Maintenance, spare
parts and services,
represent over a third
of revenues
ORDERS RECEIVED
Orders received in Q2 2018 amounted to EUR 291 million,
compared to revenues of EUR 297 million
5
0
50
100
150
200
250
300
350
Q1 Q2 Q3 Q4 Q1 Q2 Q3 Q4 Q1 Q2 Q3 Q4 Q1 Q2 Q3 Q4 Q1 Q2
2014 2015 2016 2017 2018
Revenues (EUR m) Orders received (EUR m)
REVENUES AND ORDERS RECEIVED
EUR m

LINDA JONSDOTTIR
SOLID
OPERATIONAL
PERFORMANCEChief Financial Officer

• Adjusted EBIT was
EUR 43m, up 20% YoY
• Stable EBIT margin
of 14.6% in 2Q18 and
14.9% in 1H18
• Improved flexibility with
more scalable operations
following ‘Simpler,
Smarter, Faster‘ and
strategic investments in
innovation and
infrastructure
• Ongoing and continued
investment in future
platform to serve
customers’ needs better
and sustain competitive
edge
FIRM STEPS TAKEN TO IMPROVE PROFITABILITY
Strong revenue growth with a stable and healthy
profit margin of around 15% EBIT
0%
3%
6%
9%
12%
15%
18%
21%
24%
0
5
10
15
20
25
30
35
40
45
Q1 Q2 Q3 Q4 Q1 Q2 Q3 Q4 Q1 Q2 Q3 Q4 Q1 Q2
2015 2016 (Q1 pro forma) 2017 2018
EU
R m
illio
ns
EBIT EBIT as % of revenues
Adjusted EBIT FY15:
12.2%
Pro forma EBIT FY16: 14.6%Consolidated: 14.4%
Note: Operating income adjusted for amortization of acquisition-related intangible assets (PPA) in 2016-2018. 2015 EBIT adjusted for refocusing cost and acquisition costs.
Adjusted EBIT FY17:
15.2%
7
Adjusted EBIT 1H18:
14.9%

INCOME STATEMENT: Q2 2018
Gross profit was EUR 115.0m or 38.8% of revenues and
net result was EUR 29.5 million, or 9.9% of revenues
8
In EUR million unless stated otherwise Q2 2018 Of revenues Q2 2017 Of revenues Change
Revenues 296.7 244.0 +22%
Cost of sales (181.7) (147.6) +23%
Gross profit 115.0 38.8% 96.4 39.5% +19%
Selling and marketing expenses (33.5) 11.3% (29.1) 11.9% +15%
Research and development expenses (16.7) 5.6% (14.2) 5.8% +18%
General and administrative expenses (21.6) 7.3% (17.2) 7.1% +26%
Adjusted result from operations 43.2 14.6% 35.9 14.7% +20%
Amortization of acquisition-related (in)tangible assets (2.3) (6.3) -63%
Result from operations 40.9 13.8% 29.6 12.1% +38%
Net finance costs (3.1) (6.7) -54%
Result before income tax 37.8 22.9 +65%
Income tax (8.3) (4.3) +93%
Net result 29.5 9.9% 18.6 7.6% +59%

ORDER BOOK
Strong order book of EUR 523m, projects are well distributed geographically
9
HIGHLIGHTS ORDER BOOK
EUR m
Order bookat end of
2017
472
Order bookat end of Q2 2018
523
IFRS adjustment+16m
Net increasein Q1 2018
41
Order intakein Q2 2018
291
Revenues (booked off)
297
• Order book at quarter-
end was EUR 523m
• IFRS adjustment on
opening balance was
EUR 16m and delay of
revenues in 1H18 was
EUR 4m
• Strong order book
provides good
foundation for future
quarters

• Marel continues to
invest in its
manufacturing and
innovation facilities and
improving the working
environment across the
company
• Lease assets were
added to the balance
sheet in 1Q18 in relation
to IFRS16
• Working capital items
impacted by higher
volumes
• Overall working capital
is decreasing compared
to YE17, primarily
caused by down
payments on projects
In EUR million 30/6 2018 31/12 2017 Change
Property, plant and equipment 153.5 144.7 +6%
Right of use assets 30.8 - -
Goodwill 640.3 643.9 -1%
Intangible assets (excluding goodwill) 258.5 262.7 -2%
Trade and other receivables 3.2 4.0 -20%
Derivative financial instruments 2.0 0.9 +122%
Deferred income tax assets 9.6 4.4 +118%
Non-current assets 1,097.9 1,060.6 +4%
Inventories 132.9 124.4 +7%
Contract assets 30.0 48.2 -38%
Trade receivables 136.0 128.9 +6%
Other receivables and prepayments 56.4 46.6 +21%
Cash and cash equivalents 27.9 31.9 -13%
Current assets 383.2 380.0 +1%
TOTAL ASSETS 1,481.1 1,440.6 +3%
BALANCE SHEET: ASSETS
Q2 2018 Condensed Consolidated Interim Financial Statements
HIGHLIGHTS ASSETS
10

• Borrowings decreased
due to strong cash flow
• Leverage was x1.8,
down from x2.0 in 1Q18
• Lease liability was
added to the balance
sheet in 1Q18 in relation
to IFRS16
• Contract liabilities
(Production contracts)
reflect down payments
from customers on
projects that will be
produced
BALANCE SHEET: EQUITY AND LIABILITIES
Q2 2018 Condensed Consolidated Interim Financial Statements
HIGHLIGHTS EQUITY AND LIABILITIES
In EUR million 30/6 2018 31/12 2017 Change
Group equity 536.1 541.9 -1%
Borrowings 363.2 370.5 -2%
Lease liability 24.3 0.2 -
Deferred income tax liabilities 63.5 61.3 +4%
Provisions 7.7 8.6 -10%
Other liabilities 3.5 3.6 -3%
Derivative financial instruments 1.9 2.7 -30%
Non-current liabilities 464.1 446.9 +4%
Contract liabilities 227.4 209.6 +8%
Trade and other payables 197.7 195.9 +1%
Current income tax liabilities 15.6 11.0 +42%
Borrowings 23.9 26.2 -9%
Lease liability 7.0 - -
Provisions 9.3 9.1 +2%
Current liabilities 480.9 451.8 +6%
Total liabilities 945.0 898.7 +5%
TOTAL EQUITY AND LIABILITIES 1,481.1 1,440.6 +3% 11

• Strong free cash flow at
similar levels as last
quarter
• Strong order intake
results in working capital
improvements
• Good cash conversion
despite focus on
investments to grow the
business
STRONG CASH FLOW
Strong cash flow enabled continued investment in infrastructure and the overall platform,
free cash flow in Q2 2018 amounted to EUR 35 million
12
CASH FLOW
EUR m
Operatingactivities(before interest & tax)
56.4
Free cash flow
34.8
Netfinance
cost
1.7
Dividends paid
2.9Decrease in net debt
27.5
Tax
9.0
Investingactivities
12.6Otheritems*
3,7
Sale of treasury shares
1.0
* Currency effect, change in
capitalized finance charges and
payments lease liabilities.

• In 2018 a dividend
equivalent to 30% of
2017 net results was
paid to shareholders
• Dividends or share buy-
backs are targeted at
20-40% of the net result
• The Board of Directors
has authorized
management to
purchase own shares for
nominal value of 20
million, thereof 10
million have been
executed
EARNINGS PER SHARE
Favorable development in Earnings per Share (EPS) over recent quarters,
management expects EPS to grow faster than revenues
EARNINGS PER SHARE (EPS)
Trailing twelve months, euro cents
14.83
+34%
+21%
+29%
2Q18
16.52
1Q18
13.70
2Q174Q16
11.18
1Q17
10.59
8.51
3Q15 1Q16
12.05
6.92
4Q17
8.86
11.65
8.13
4Q15
7.93
2Q15 3Q162Q16 3Q17
6.19
1.601.17
2Q14 3Q14
1.701.78
1Q15
3.58
1Q14 4Q14

KEY FIGURES QOQ
Quarterly comparison of the Condensed Consolidated Interim Financial results
REVENUES
EUR m
ORDERS RECEIVED
EUR m
ORDER BOOK
EUR m
14
ADJUSTED EBIT MARGIN
%
FREE CASH FLOW
EUR m
LEVERAGE
Net debt/EBITDA
297288295
247244
2Q17 1Q18
+22%
2Q184Q173Q17
2Q17
15.215.2
1Q18
14.6
4Q17
14.715.7
2Q183Q17
291329
282296273
2Q18
+7%
1Q184Q172Q17 3Q17
2Q18
34.8
4Q17
34.9
3Q17
36.8
2Q17
34.3
1Q18
54.7
523529472468
419
3Q172Q17 1Q184Q17
+25%
2Q18
4Q17 1Q18
2.0
2Q17
1.9 2.02.2
3Q17 2Q18
1.8

ARNI ODDUR THORDARSON
BUSINESS
& OUTLOOKChief Executive Officer

GOOD QUALITY OF EARNINGS
Strong track record of a well diversified revenue structure across
business segments and geographies
REVENUES BY INDUSTRY
%
REVENUES BY GEOGRAPHY
%
REVENUES BY BUSINESS MIX
%
25%
46%
29%
2Q18
North-America
Rest of the world
Europe
16
2Q18
15%
1%
32%
52%
1/3
1/3
1/3
31%
38%
2Q18
31%
Modernization and
standard equipment
Maintenance
Service and repairs
Greenfield and projects
EUR
297m
Poultry
Other
Fish
Meat
16

SUCCESSFUL LARGE GREENFIELD PROJECTS
Costco and Leroy are great examples of how Marel is transforming food processing
in partnership with its customers
• Next generation plant for salmon
processing
• Almost fully automated
• Plant up and running from May 2018
• Good project execution
• Training via virtual reality
“Part of our process will be
to get everything to talk to
each other, and Innova has
that technology.”
“Anything we can do with
Marel to improve technology
here in the US, we certainly
want to partner with them.”
Why don’t we
become your
European plant in the
US?
17

• In partnership with our
customers, we are
transforming the way
food is processed
• We have a dedicated
team of 5,500
employees
• We are rolling out
innovative products
every year
• We put emphasis on
good co-operation with
suppliers
PASSIONATE TO SERVE CUSTOMER NEEDS
Marel’s ambitious growth target is derived from a comprehensive value chain, where each
component must excel in the process of delivering products and services to a satisfied customer
18
Innovation
Lead to Order
EngineeringManufacturing/ Procurement
Delivery and Installation
Maintenance
Customer
needs
… and deliver the right
quality at the right time
to customers and
shareholders

Think global, act local.

Think local, act global.
GLOBAL MARKETS
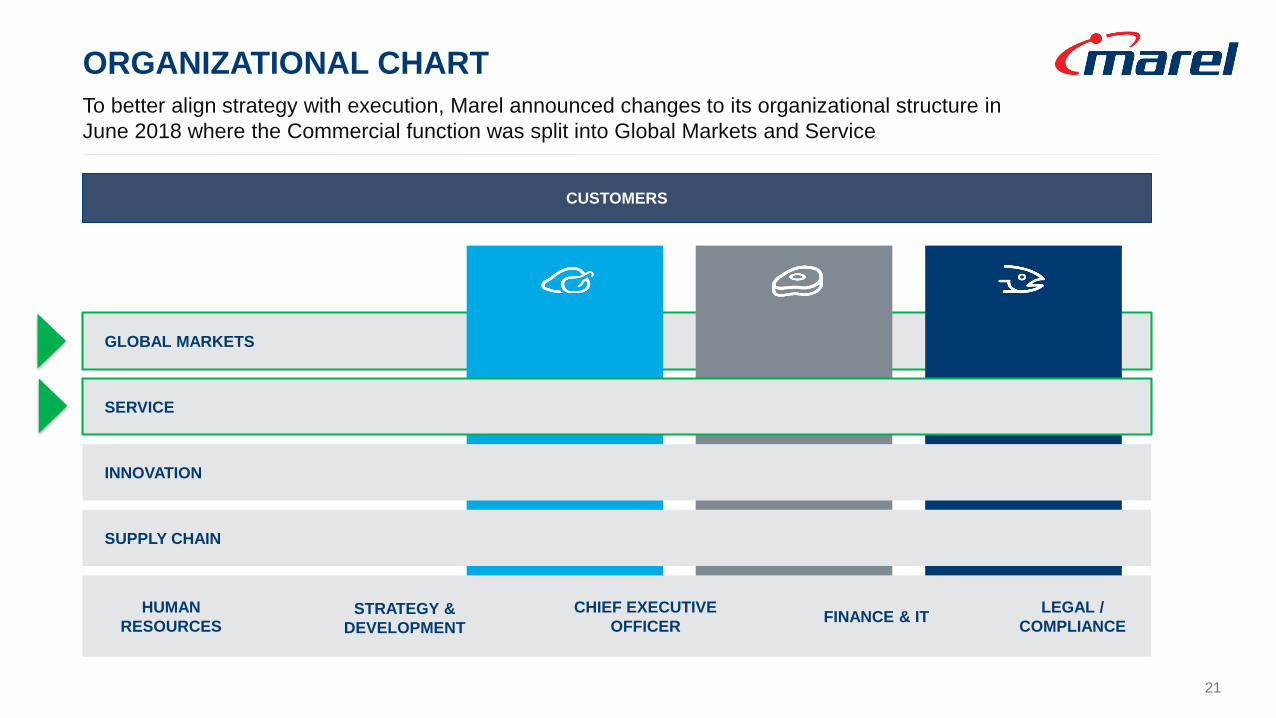
ORGANIZATIONAL CHART
To better align strategy with execution, Marel announced changes to its organizational structure in
June 2018 where the Commercial function was split into Global Markets and Service
CUSTOMERS
SERVICE
INNOVATION
HUMAN
RESOURCESSTRATEGY &
DEVELOPMENTFINANCE & IT
LEGAL /
COMPLIANCE
CHIEF EXECUTIVE
OFFICER
21
SUPPLY CHAIN

22
Executive Vice President
Global Markets
EINAR EINARSSON
Executive Vice President
Service
ULRIKA LINDBERG
Ulrika Lindberg is Marel's
Executive Vice President of
Service. She has extensive
managerial experience in senior
sales and services positions at
large international
organizations.
Before joining Marel she was
the Vice President of Global
Service at Alfa Laval and has
held various management
positions worldwide for Alfa
Laval and Tetra Pak.
Einar Einarsson is Marel's
Executive Vice President of
Global Markets. Einar has
managed Marel’s sales and
service operations in North
America since he became
President of Marel Inc. in the
US in 2003.
Under Einar’s leadership in the
US, Marel has made significant
progress in successfully
engaging with customers and
expanding the North America
operations. Prior to his US
posting, he held several
positions within Marel.

• MAJA’s innovative product offering and
solid market position complements
Marel’s commitment to innovation and
extensive global presence
• Specializes in skinning, ice machines
and portioning with main focus on the
meat market
• A family-owned company, founded in
1955 and based in Kehl-Goldscheuer,
Germany
• Managed by second generation
owners, Joachim Schill and Reinhard
Schill, that will stay with the business
• With MAJA on board, Marel can
continue to increase scale to better
serve customer needs and drive
innovation
MAJA, A GERMAN FOOD PROCESSING MANUFACTURER
Agreement to acquire Maja is in line with Marel’s strategic objective to be a full-line supplier of advanced food
processing solutions & standard equipment, and accelerate market penetration through acquisitions
23
2017 revenues
~EUR 30m
High quality
manufacturing site in
Germany
~200 Employees
Long-standing
relationship with
Sulmaq in Brazil
Innovative
company culture
Well managed
business with
experienced
employees
Ice Makers
Portioning
Skinning

4Q17 AGM 1Q18
ALTERNATIVE LISTING
As part of Marel’s ambitious growth strategy, STJ Advisors have been engaged to evaluate potential
listing alternatives to further advance its global vision and drive continued shareholder returns
LISTING IN REYKJAVIK
CONTINUED 1 CROSS LISTING
OR DUAL LISTING2 DELISTING IN ICELAND
AND RELISTING ON AN
INTERNATIONAL EXCHANGE3No change to current set up where
Marel is listed on Nasdaq Iceland
Listing on Nasdaq Iceland continued and a
second listing added internationally
In the process, the form and constitution of
shares is expected to remain the same
Marel announced it was in the process
of engaging an independent
international advisor to evaluate
potential listing alternatives
Marel announced it has engaged STJ Advisors, a
leading independent capital markets advisory firm
STJ are assessing possible listing alternatives from various
perspectives, e.g. valuation, peer group positioning, analyst
coverage, index inclusion, and expected supply demand.
2Q18 3Q18
Execution phase expected to take 6-12 months
24
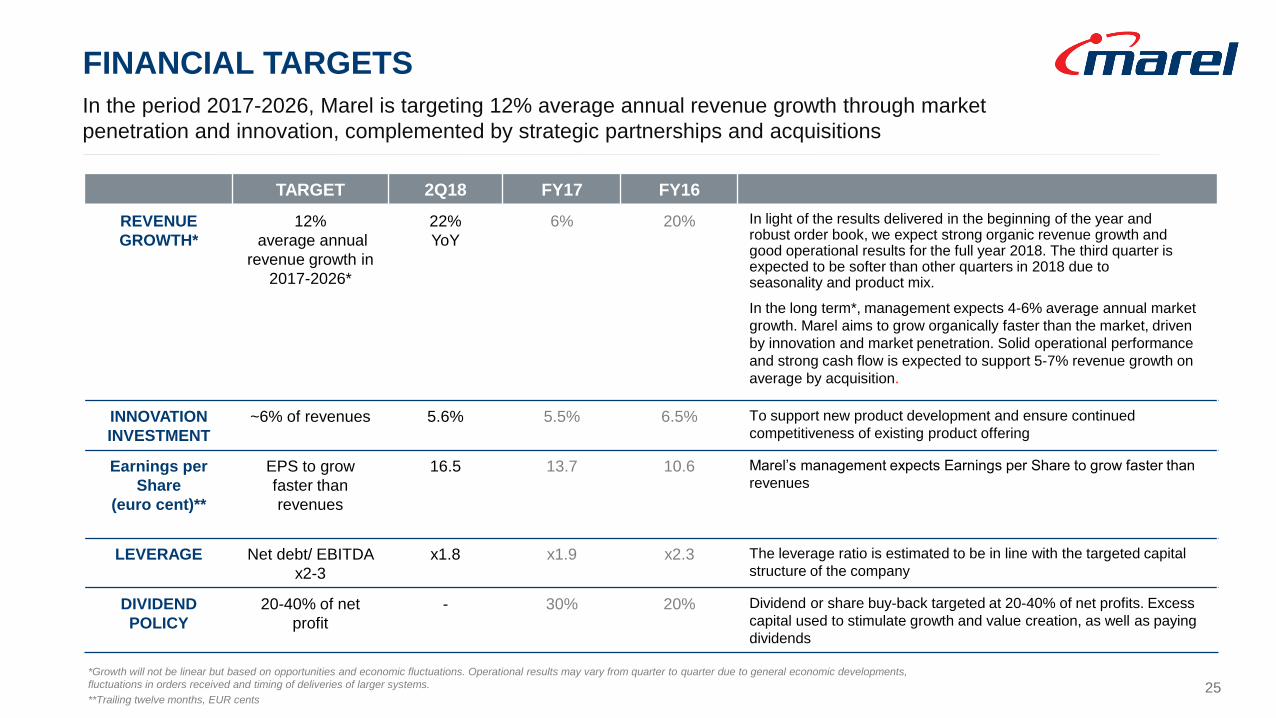
FINANCIAL TARGETS
In the period 2017-2026, Marel is targeting 12% average annual revenue growth through market
penetration and innovation, complemented by strategic partnerships and acquisitions
*Growth will not be linear but based on opportunities and economic fluctuations. Operational results may vary from quarter to quarter due to general economic developments,
fluctuations in orders received and timing of deliveries of larger systems.
**Trailing twelve months, EUR cents
TARGET 2Q18 FY17 FY16
REVENUE
GROWTH*
12%
average annual
revenue growth in
2017-2026*
22%
YoY
6% 20% In light of the results delivered in the beginning of the year and robust order book, we expect strong organic revenue growth and good operational results for the full year 2018. The third quarter is expected to be softer than other quarters in 2018 due to seasonality and product mix.
In the long term*, management expects 4-6% average annual market
growth. Marel aims to grow organically faster than the market, driven
by innovation and market penetration. Solid operational performance
and strong cash flow is expected to support 5-7% revenue growth on
average by acquisition.
INNOVATION
INVESTMENT
~6% of revenues 5.6% 5.5% 6.5% To support new product development and ensure continued
competitiveness of existing product offering
Earnings per
Share
(euro cent)**
EPS to grow
faster than
revenues
16.5 13.7 10.6 Marel’s management expects Earnings per Share to grow faster than
revenues
LEVERAGE Net debt/ EBITDA
x2-3
x1.8 x1.9 x2.3 The leverage ratio is estimated to be in line with the targeted capital
structure of the company
DIVIDEND
POLICY
20-40% of net
profit
- 30% 20% Dividend or share buy-back targeted at 20-40% of net profits. Excess
capital used to stimulate growth and value creation, as well as paying
dividends
25

Q&A
LINDA JONSDOTTIR
CFO
ÁRNI ODDUR THORDARSON
CEO

THANK YOU
27