q2 financial presentation 2012 dof asadof.no/files/pdf/dof...
TRANSCRIPT

Q2 Financial Presentation 2012
DOF ASA
DOF ASA - Q2 Presentation 2012
Agenda
Summary
Recent highlights
Overview group
Financials
DOF Subsea update
Outlook

DOF ASA – Q2 Presentation 2012
Several new contracts/renewals in DOF Subsea and in DOF Supply. A strong subsea market is expected to continue. The DOF group is limited exposed to a weak spot market in the
North Sea. Several new contracts renewal under discussion. Remaining newbuilding program close to fully financed.
“All time high” Ebitda of NOK 742 million (NOK 495 million) and
NOK 945 million including gain from sale of assets. Pre tax profit of NOK 333 million adjusted for unrealized currency
gain, and derivatives.
Summary
3
DOF ASA – Q2 Presentation 2012
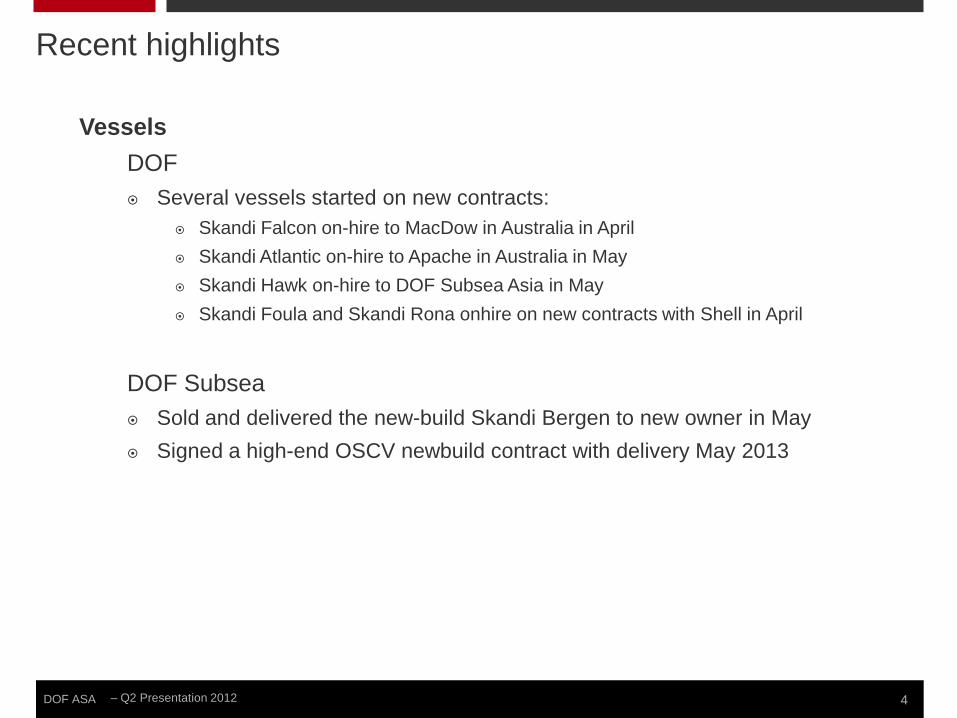
Recent highlights Vessels
DOF Several vessels started on new contracts:
Skandi Falcon on-hire to MacDow in Australia in April Skandi Atlantic on-hire to Apache in Australia in May Skandi Hawk on-hire to DOF Subsea Asia in May Skandi Foula and Skandi Rona onhire on new contracts with Shell in April
DOF Subsea Sold and delivered the new-build Skandi Bergen to new owner in May Signed a high-end OSCV newbuild contract with delivery May 2013
4

DOF ASA – Q2 Presentation 2012
Contracts New contract on Skandi Skansen with Subsea 7 Subsea 7 exercised option – firm period until July 2013 New contract on Skandi Carla with Fugro, firm until summer 2017 New contract on Skandi Caledonia with MOG, firm until Oct 2015 Subsea 7 exercised 1 year option on Skandi Seven New contract on Skandi Atlantic with Apache Energy Limited, Australia,
900 days from May 12 New 3+ 3 yrs contract on Skandi Constructor with Helix Well Ops 1 yr extension on Skandi Salvador with Chevron Brazil 2 yrs extension on Skandi Chieftain with Petrobras Various project contracts in DOF Subsea
Recent highlights
5

DOF ASA – Q2 Presentation 2012
DOF ASA
Norskan Ltda Modern fleet 17 AHTS’s 6 PSV’s 2 CSV’s
DOF Subsea Holding Ship owning company Modern fleet 3 AHTS’s 17 PSV’s 4 CSV
DOF Subsea Modern fleet & Equipment 22 CSV/ROV vessels 52 ROV’s Leading Subsea Contractor
DOF Installer 3 state of the art installation CSV vessels
Company overview
6

DOF ASA – Q2 Presentation 2012
PSV AHTS ROV/OCSV/DSV/ Total fleetNo. of vessels SEISMIC VESSELSDOF ASA 17 3 4 24
NORSKAN OFFSHORE 6 12 2 20
DOF SUBSEA AS 0 0 22 22
DOF INSTALLER ASA 0 0 3 3
AKER DOF DEEPWATER AS 0 5 0 5
Total fleet 23 20 31 74
Contract coverage 12* 97 % 83 % 89 % 93 %Contract coverage 13* 74 % 67 % 73 % 73 %
The fleet market segment
7
*Not including options

DOF ASA – Q2 Presentation 2012
Angola
GEOGRAPHICAL FOCUS AREAS
Perth Rio de Janeiro
Buenos Aires
Singapore
Houston St. Johns
Aberdeen
Austevoll
Cairo
Brunei
Macae
Jakarta
Manila
Moscow Bergen
32
0
25
8
1
GEOGRAPHICAL FOCUS AREAS
Melbourne
Darwin
Global player
8

DOF ASA – Q2 Presentation 2012 9
DOF group has solid cash flow visibility over the next 3-5 years
By 30 June 2012 the total back-log (incl. options) was approx NOK 38.8 bn Firm contract counts for NOK 18,6 bn Options count for NOK 20,1 bn
Note: Includes extension options on long-term contracts.
Backlog development DOF Group
38 789
35 237
29 783
25 004
20 916
17 388
14 365 11 815
7 838 6 873
-
5 000
10 000
15 000
20 000
25 000
30 000
35 000
40 000
45 000
2012 2013 2014 2015 2016 2017 2018 2019 2020 2021
Backlog DOF Group

DOF ASA – Q2 Presentation 2012
Update on remaining newbuilding program
Vessel Yard Delivery Type Contract Financing
Skandi Iguazu
STX Brazil Aug 12 AHTS, 325 t BP 8 yrs Petrobras Funding Secured from FMM / BNDES
Skandi Nova STX Norway Sept 12 MRV 05 7 yrs ConocoPhillips N Funding secured from Eksportkreditt, DNB & ABN Ambro
Skandi Marøy STX Norway Oct 12 MRV 05 7 yrs ConocoPhillips N Funding secured from Eksportkreditt, DNB & ABN Amro
Skandi Hugen STX Norway Nov 12 MRV 05 ROV 7 yrs ConocoPhillips N Funding secured from Eksportkreditt, GIEK and SPV
Skandi Urca STX Brazil May 13 AHTS 8 yrs Petrobras Funding secured BNDES. In progress to secure 20% GIEK secured funding
Skandi Bergen (DOF Subsea)
STX Norway May 13 CSV Uncommitted In progress with various banks for funding (CIRR secured)
Skandi Angra STX Brazil Aug 13 AHTS 8 yrs Petrobras Funding secured BNDES. In progress to secure 20% GIEK secured funding
Skandi Paraty STX Brazil Feb 14 AHTS Uncommitted Funding secured BNDES. In progress to secure 20% GIEK secured funding
10

DOF ASA - Q2 Presentation 2012
Financials

DOF ASA – Q2 Presentation 2012
Average utilization Subsea fleet (95 %) Good utilization of the project fleet Geoholm partly off-hire due to transit and yard stay before a contract Skandi Singapore partly off-hire due to yard stay in June High activity from Survey and positioning
Average utilization Supply fleet (DOF 98 %, Norskan 91 %) Good performance from the vessels in the North Sea Two vessels has operated in the spot market, good utilization in April/May and
variable in June Higher utilization for the Brazilian CSV fleet compared to previous quarters Three vessels started on new contracts in Q2
Capex & sales in 2nd quarter The new-build, Skandi Bergen, was delivered from the yard in May and sold to a
new owner. The gain from the sale was NOK 203 millions
Finance Refinancing of one loan in Q2 A strong USD has resulted in high unrealized currency losses in Q2
Financial/Operational highlights Q2 2012
12
DOF ASA – Q2 Presentation 2012
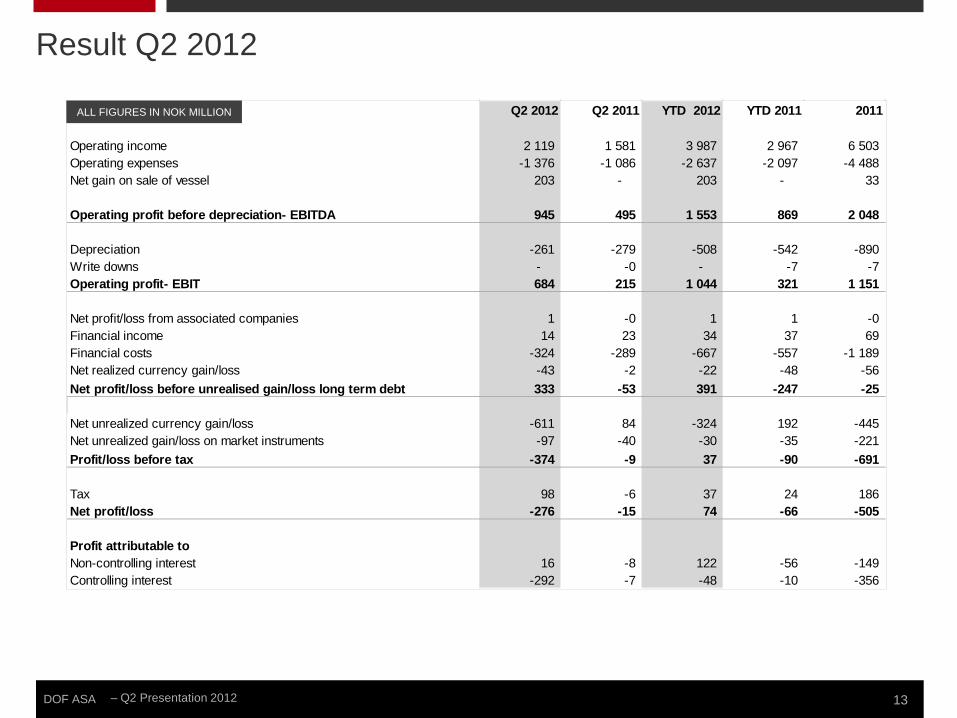
All figures in NOK million Q2 2012 Q2 2011 YTD 2012 YTD 2011 2011
Operating income 2 119 1 581 3 987 2 967 6 503 Operating expenses -1 376 -1 086 -2 637 -2 097 -4 488 Net gain on sale of vessel 203 - 203 - 33
Operating profit before depreciation- EBITDA 945 495 1 553 869 2 048
Depreciation -261 -279 -508 -542 -890 Write downs - -0 - -7 -7 Operating profit- EBIT 684 215 1 044 321 1 151
Net profit/loss from associated companies 1 -0 1 1 -0 Financial income 14 23 34 37 69 Financial costs -324 -289 -667 -557 -1 189 Net realized currency gain/loss -43 -2 -22 -48 -56 Net profit/loss before unrealised gain/loss long term debt 333 -53 391 -247 -25
Net unrealized currency gain/loss -611 84 -324 192 -445 Net unrealized gain/loss on market instruments -97 -40 -30 -35 -221 Profit/loss before tax -374 -9 37 -90 -691
Tax 98 -6 37 24 186 Net profit/loss -276 -15 74 -66 -505
Profit attributable toNon-controlling interest 16 -8 122 -56 -149 Controlling interest -292 -7 -48 -10 -356
ALL FIGURES IN NOK MILLION
Result Q2 2012
13
DOF ASA – Q2 Presentation 2012
ALL FIGURES IN NOK MILLION
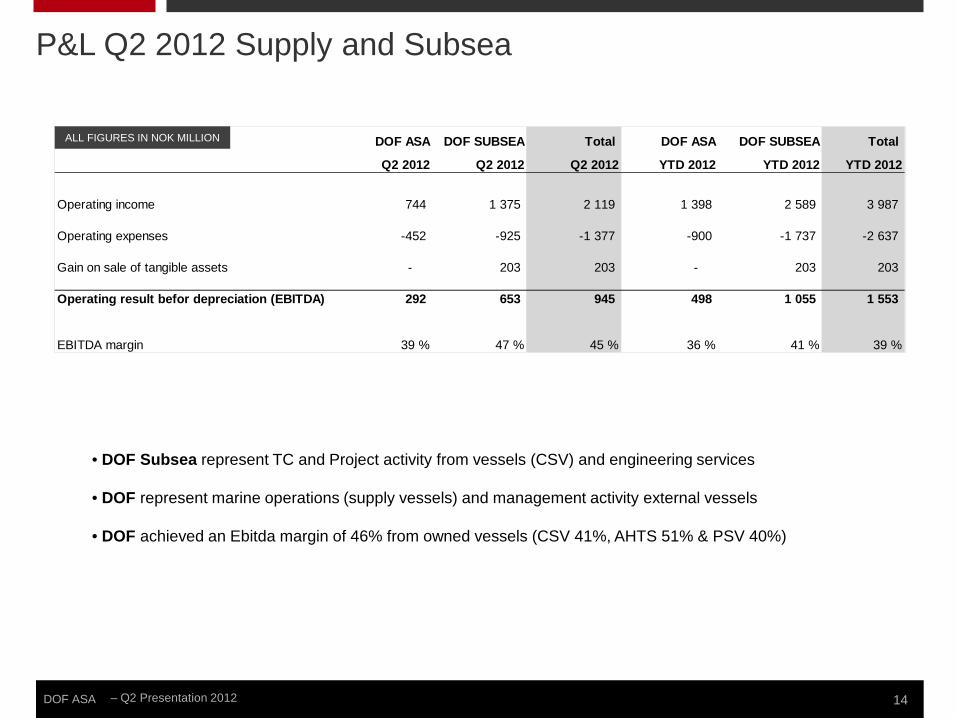
• DOF Subsea represent TC and Project activity from vessels (CSV) and engineering services
• DOF represent marine operations (supply vessels) and management activity external vessels
• DOF achieved an Ebitda margin of 46% from owned vessels (CSV 41%, AHTS 51% & PSV 40%)
14
DOF ASA DOF SUBSEA Total DOF ASA DOF SUBSEA Total
Q2 2012 Q2 2012 Q2 2012 YTD 2012 YTD 2012 YTD 2012
Operating income 744 1 375 2 119 1 398 2 589 3 987
Operating expenses -452 -925 -1 377 -900 -1 737 -2 637
Gain on sale of tangible assets - 203 203 - 203 203
Operating result befor depreciation (EBITDA) 292 653 945 498 1 055 1 553
EBITDA margin 39 % 47 % 45 % 36 % 41 % 39 %
P&L Q2 2012 Supply and Subsea

DOF ASA – Q2 Presentation 2012
ALL FIGURES IN NOK MILLION
EBITDA (MNOK)
Q2 2012 Q2 2011
PSV 92 78
AHTS 155 97
CSV 699 320
Total 945 495
•Installer vessels included in the CSV segment •Three vessels in the CSV segment are owned by DOF
Results – business segments
15
10 %
16 %
74 %
EBITDA Q2 2012
16 %
19 % 65 %
EBITDA Q2 2011

DOF ASA – Q2 Presentation 2012
ALL FIGURES IN NOK MILLION
ALL FIGURES IN NOK MILLION
Financial results Q2 2012
16
Financial items Q2 2012 Q2 2011 YTD 2012 YTD 2011 2011Share of loss profit from associated 1 -0 1 1 -0
Interest reveneue 13 23 35 37 68
Interest costs -300 -257 -625 -506 -1 078
Realized currency gain/loss long debt 0 1 26 -6 -13
Realized currency gain/loss on derivatives -21 2 -31 24 62
Realized operational currency gain/loss (-) -73 -5 -68 -66 -105
Other financial expenses -23 -73 -43 -90 -115
Total financial items -402 -310 -705 -606 -1 180
Unrealized profit/loss on currencies and derivativesUnrealized currency gain/loss -559 84 -272 192 -445
Unrealized gain/loss on derivatives -97 2 -30 4 -218
Total unrealized profit/loss on currencies and derivatives -656 86 -303 196 -663
Total financial items -1 058 -224 -1 008 -410 -1 843

DOF ASA – Q2 Presentation 2012
0 %
5 %
10 %
15 %
20 %
25 %
30 %
35 %
40 %
45 %
50 %
-
500
1 000
1 500
2 000
2 500
Q2 2009 Q3 2009 Q4 2009 Q1 2010 Q2 2010 Q3 2010 Q4 2010 Q1 2011 Q2 2011 Q3 2011 Q4 2011 Q1 2012 Q2 2012 1 083 1 012 1 181 1 129 1 506 1 237 1 574 1 386 1 581 1 674 1 862 1 868 2 119
333 267 315 338 470 433 453 375 495 561 581 607 742 31 % 26 % 27 % 30 % 31 % 35 % 29 % 27 % 31 % 34 % 31 % 32 % 35 %
17 041 17 058 17 827 19 299 20 069 20 904 22 423 23 191 23 832 24 772 26 641 27 418 26 942 4 068 3 845 3 957 3 540 3 545 4 317 4 629 4 163 3 993 4 113 4 187 4 203 4 394
21 109 20 903 21 784 22 839 23 614 25 221 27 052 27 354 27 825 28 885 30 828 31 621 31 336 6 411 6 892 6 809 6 791 6 525 6 645 6 728 6 617 6 618 6 439 6 669 6 906 6 490
11 929 11 630 11 973 12 343 11 539 13 662 16 931 17 036 17 626 18 660 20 012 20 449 20 667 2 769 2 381 3 002 3 705 5 550 4 914 3 393 3 701 3 581 3 785 4 147 4 266 4 179
21 109 20 903 21 784 22 839 23 614 25 221 27 052 27 354 27 825 28 884 30 828 31 621 31 336
Operating revenue EBITDA EBITDA margin
MN
OK
Operating revenue EBITDA EBITDA margin Non-current assets Current assets Total Assets Equity Non-current debt Current debt Total Equity and Debts
17
Historical EBITDA excl sales

DOF ASA – Q2 Presentation 2012
Amounts in NOK million 30.06.2012 30.06.2011 31.12.2011
ASSETSIntangible assets 564 482 611Vessel and other tangible assets 24 877 20 626 24 281Newbuildings 1 153 2 334 1 406Financial assets 347 390 343Non-currents assets 26 942 23 832 26 641
Receivables 2 392 2 161 2 147Cash and cash equivalents 2 002 1 831 2 040Current assets 4 393 3 992 4 187
Total assets 31 336 27 825 30 828
EQUITY AND LIABILITIESSubscribted equity 1 452 860 1 452Retained equity 2 332 3 074 2 585Non-controlling equity 2 707 2 684 2 633Equity 6 490 6 618 6 669
Provisions for commitments 522 428 489Other non-current liabilities 20 145 17 198 19 523Non-current liabilities 20 666 17 626 20 013
Debt to credit institutions 1 997 1 902 2 251Other current liabilities 2 182 1 678 1 895Current liabilities 4 179 3 580 4 146
Total equity and liabilities 31 336 27 825 30 828
ALL FIGURES IN NOK MILLION
Balance Q2 2012
18
DOF ASA – Q2 Presentation 2012
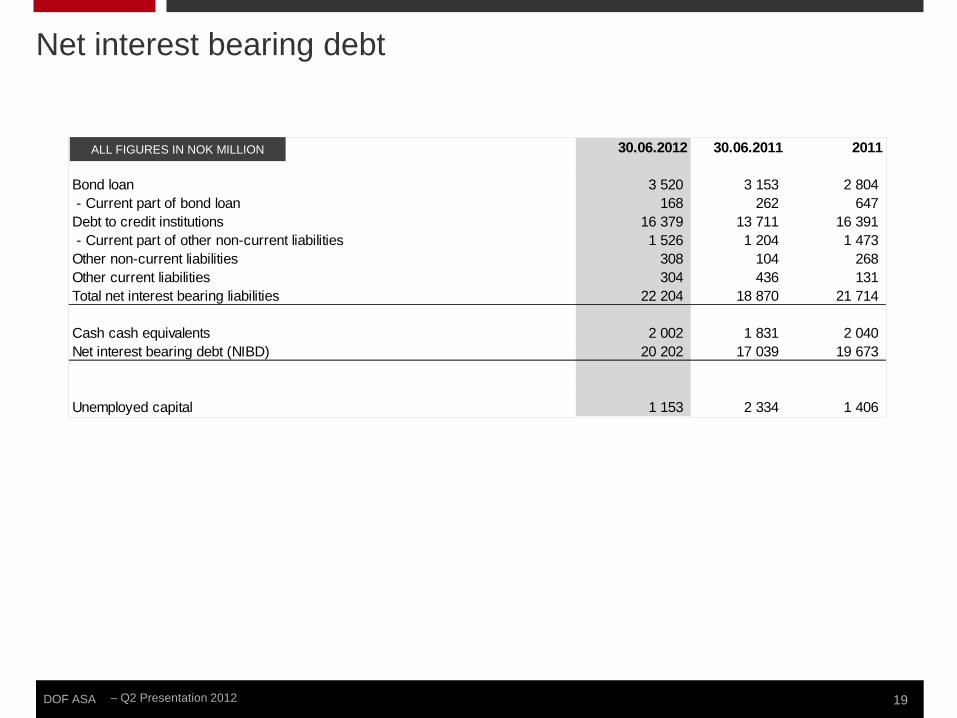
All amounts in NOK million 30.06.2012 30.06.2011 2011
Bond loan 3 520 3 153 2 804 - Current part of bond loan 168 262 647 Debt to credit institutions 16 379 13 711 16 391 - Current part of other non-current liabilities 1 526 1 204 1 473 Other non-current liabilities 308 104 268 Other current liabilities 304 436 131 Total net interest bearing liabilities 22 204 18 870 21 714
Cash cash equivalents 2 002 1 831 2 040 Net interest bearing debt (NIBD) 20 202 17 039 19 673
Unemployed capital 1 153 2 334 1 406
ALL FIGURES IN NOK MILLION
19
Net interest bearing debt

DOF ASA – Q2 Presentation 2012
Key figures Q2 2012
20
Q2 2012 Q2 2011 YTD 2012 YTD 2011 2011FINANCIAL RESULTEBITDA margin ex net gain on sale of vessel 35 % 31 % 34 % 29 % 31 %EBITDA margin 45 % 31 % 39 % 29 % 31 %EBIT margin 32 % 14 % 26 % 11 % 18 %Cashflow per share 1) 5,35 2,49 8,09 3,32 9,03 Profit per share ex. non-controlling interest 2) -2,63 -0,07 -0,43 -0,11 -3,69 Profit per share ex. unrealized loss/gain and taxes 3) 3,00 -0,58 3,52 -2,71 -0,26
BALANCEReturn on net capital 1 % -1 % -8 %Equity ratio 21 % 24 % 22 %Value adjusted equity 40 % 43 % 44 %Capex 1 646 1 957 5 367 Net interest bearing debt (MNOK) 20 202 17 039 19 673 Net interest bearing debt ex. unemployed capital (MNOK) 19 049 14 705 18 268
No of shares 111 051 348 91 037 975 111 051 348 91 037 975 96 464 574 Outstanding number of shares 111 051 348 91 037 975 111 051 348 91 037 975 111 051 348 *) Diluted number of share is the same as number of shares
1) Pre-tax result + depreciation and write downs +/- unrealized gain/loss on currencies +/- net changes in fair value of financial instruments/average no of shares.
2) Net profit excl. non controlling interest/average no of shares
3) Net profit excl.unrealized currency gain/loss on debt and market instruments and taxes/average no of shares

DOF ASA – Q2 Presentation 2012 21
DOF Supply
DOF Subsea
DOFSUB 03 PRO - NOK 500 million - Maturity July 2012 - Net NOK 168 million
DOFSUB 04 - NOK 750 million - Maturity April 2014
- Net NOK 601 million
DOFSUB 05 - NOK 750 million - Maturity April 2016
DOFSUB 06 - NOK 700 million - Maturity Oct 2015 - Net NOK 500 million
DOF 07 - NOK 950 million - Maturity July 2013 - Net NOK 410 million
DOF 08 - NOK 600 million - Maturity Dec 2015
DOF 09 - NOK 700 million - Maturity Feb 2017
Debt maturity profile
168 -
601 500 750
-
645 946 918
718 544
3 543
- -
308
1 362
1 004
- -
500
1 000
1 500
2 000
2 500
3 000
3 500
4 000
2012E 2013E 2014E 2015E 2016E After
Bond Loan Bank Debt Balloons
409,5
600 700
281
624 630 484
333 296
2185
260
1 107
816
306
-
500
1 000
1 500
2 000
2 500
2012 2013 2014 2015 2016 2017 After
Bond Loan Bank debt Balloons

DOF ASA – Q2 Presentation 2012
-
2 000
4 000
6 000
8 000
10 000
12 000
14 000
16 000
18 000
20 000
2006 2007 2008 2009 2010 2011 2012 2013 Value year end 11 112 16 606 18 474 14 025 11 654 6 892 3 090 - Value delivered - 1 550 2 550 4 450 6 238 6 631 4 378 3 090
Valu
e N
ewbu
ilds
(MN
OK
)
DOF and DOF Subsea – Value newbuild fleet
The total Order book from 2006 til 2013 and onwards is NOK 28.5 billion and 44 vessels 23 vessels are Subsea vessels with a value of NOK 18.0 billion 21 vessels are PSVs and AHTSs with a value of NOK 10.5 billion
22
DOF ASA – Q2 Presentation 2012
-
100
200
300
400
500
600
700
800
MNOK
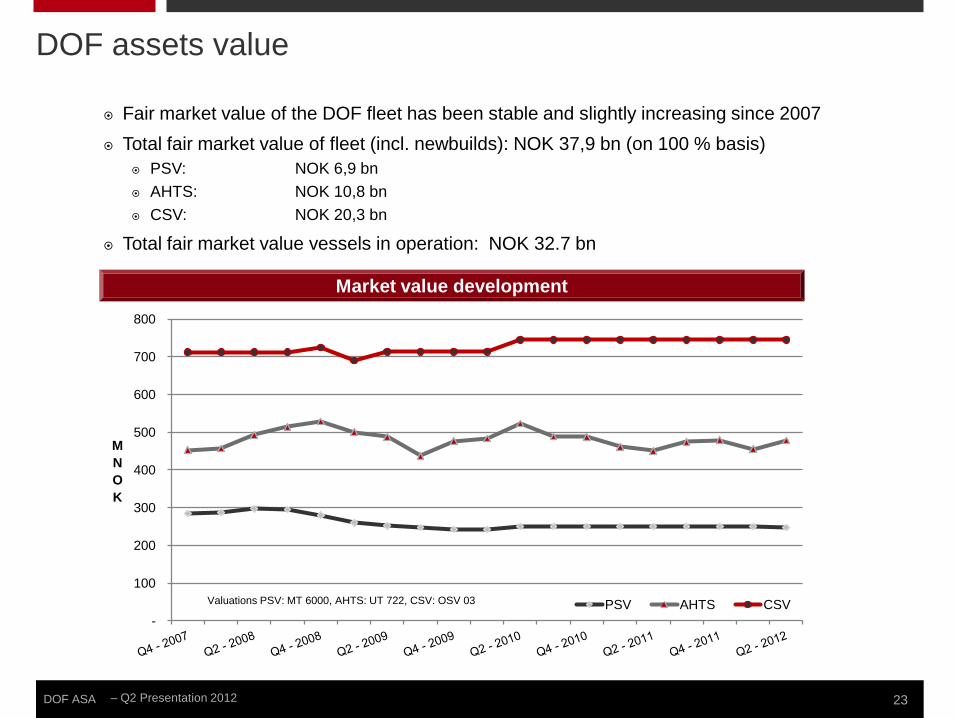
Valuations PSV: MT 6000, AHTS: UT 722, CSV: OSV 03 PSV AHTS CSV
Fair market value of the DOF fleet has been stable and slightly increasing since 2007 Total fair market value of fleet (incl. newbuilds): NOK 37,9 bn (on 100 % basis)
PSV: NOK 6,9 bn AHTS: NOK 10,8 bn CSV: NOK 20,3 bn
Total fair market value vessels in operation: NOK 32.7 bn
DOF assets value
Market value development
23

DOF ASA – Q2 Presentation 2012
0 %
20 %
40 %
60 %
80 %
100 %
120 %
57 % 62 % 62 % 59 % 53 % 46 %
43 % 38 % 38 % 41 % 47 % 54 %
Debt Equity
Gearing forecast – summary Total Fleet Market value
Vessels MNOK 12,946
Newbuilds (a) MNOK 4,522
Total Fleet MNOK 17,470
Note: Vessel values as of 30 June 2012 (a) Newbuilds to be delivered in 2012 & 2013
* The figures reflects amortization and balloon payments on debt drawn as pr 30 June 2012
Combined market value DOF Supply fleet including newbuild is NOK 17.5 billion
New-building program to be completed in 2014
Asset-level gearing on the existing fleet is 57%, decreasing to 46% in 2016
Significant gearing reduction forecasted upon completion of the current newbuild program
24
DOF Supply – Asset coverage

DOF ASA – Q2 Presentation 2012
Combined market value DOF Subsea’s fleet is NOK 16,5 billion
Asset-level gearing on the existing fleet is 56%, decreasing to 43% in 2014 Provides a significant equity cushion on top of the existing vessel-level
financing Significant gearing reduction forecasted upon completion of the current
newbuild program
Gearing forecast – summary Total Fleet Market value*
Vessels NOK 16,476
Other Equipment (a) NOK 1,378
Total Fleet NOK 17,854
Note: Vessel values as pr 30 June 2012 (a) Includes ROVs, AUV, diving systems, other equipment * Mill. NOK
* The figure reflects amortization and balloon payments on debt drawn as pr 30 June 2012
25
0 %
20 %
40 %
60 %
80 %
100 %
120 %
2012E 2013E 2014E 2015E 2016E
56 % 51 % 43 % 31 % 21 %
44 % 49 % 57 % 69 % 79 %
Fleet Level Gearing Market Value Cushion Debt Equity
DOF Subsea Group AS – Asset coverage

- Q2 Presentation 2012 DOF ASA
Contract Coverage

DOF ASA – Q2 Presentation 2012
FIRM CONTRACTS UNDER CONSTRUCTION OPTIONAL PERIOD
DOF – Contract coverage
27
A M J J A S O N D J F M A M J J A S O N D J F M A M J J A S O N D J F M A M J J A S O N D J F M A M J J A S O N D
Skandi Falcon 1 1 1 1 1 1 1 1 1 1 1 1 1 1 1 1 1 2 2
Skandi Marstein 1 1 1 1 1 1 1 1 1 1 2 2 2 2 2 2 2 2 2 2 2 2 2 2 2 2 2 2 2 2 2 2 2 2 2 2 2 2 2 2 2 2 2 2 2 2 2 2 2 2 2 2 2 2 2 2
Skandi Foula 1 1 1 1 1 1 1 1 1 1 1 1 1 1 1 1 1 1 1 1 1 1 1 1 1 1 1 1 1 1 1 1 1 1 1 1 1 1 1 1 1 1 1 1 1 1 1 1 1 1 1 1 1 1 1 1 1
Skandi Rona 1 1 1 1 1 1 1 1 1 1 1 1 1 1 1 1 1 1 1 1 1 1 1 1 1 1 1 1 1 1 1 1 1 1 1 1 1 1 1 1 1 1 1 1 1 1 1 1 1 1 1 1 1 1 1 1 1
Skandi Buchan 1 1 1 1 1 1 1 1 1 1 1 1 1 1 1 1 1 1 2 2 2 2 2 2 2 2 2 2 2 2 2 2 2 2 2 2 2 2 2 2 2 2
Skandi Sotra 1 1 1 1 1 1 1 2 2Skandi Caledonia 1 1 1 1 1 1 1 1 1 1 1 1 1 1 1 1 1 1 1 1 1 1 1 1 1 1 1 1 1 1 1 1 1 1 1 1 1 1 1 1 1 1Skandi Barra 1 1 1 1 1 1 1 1 1 1 1 1 1 1 1 1 1 2 2 2 2 2 2 2 2 2 2 2 2 2 2 2 2 2 2 2 2 2 2 2 2
Skandi Texel 1 1 1 1 1 1 1 1 1 1 1 1 1 1 1 2 2 2 2 2 2 2 2 2 2 2 2 2 2 2 2 2 2 2 2 2 2 2 2 2 2 2 2 2 2 2 2 2 2 2 2
Skandi Mongstad 1 1 1 1 1 1 1 1 1 1 1 1 1 1 1 1 1 1 1 1 1 1 1 1 1 1 1 1 1 1 1 1 1 1 1 1 1 1 1 1 1 1 1 1 1 1 1 1 1 1 1 1 1 2 2 2 2
Skandi Flora 1 1 1 1 1 1 1 1 1 1 1 1 1 1 1 1 1 1 1 1 1 1 1 2 2 2 2 2 2 2 2 2 2 2 2 2 2 2 2 2 2 2 2 2 2 2 2 2 2 2 2 2 2 2 2 2 2
Skandi Gamma 1 1 1 1 1 1 1 1 1 1 1 1 1 1 1 1 1 1 1 1 1 1 1 1 1 1 1 1 1 1 1 1 1 1 1 1 1 1 1 1 1 1 1 1 1 1 1 1 2 2 2 2 2 2 2 2 2
Skandi Waveney 1 1 1 1 1 1 1 1 1 1 2 2 2 2 2 2 2 2 2 2 2 2 2 2 2 2 2 2 2 2 2 2 2 2
Skandi Feistein 1 1 1 1 1 1 1 1 1 1 1 1 1 1 1 1 1 1 1 1 1 1 1 1 1 1 1 1 1 1 1 1 1 1 1 1 1 1 1 1 1 1 1 1 1 1 1 1 1 1 1 1 1 1 1 1 1
Skandi Kvitsøy 3 1 1 1 1 1 1 1 1 1 1 1 1 1 1 1 1 1 1 1 1 1 1 1 1 1 1 1 1 1 1 1 1 1 1 1 1 1 1 1 1 1 1 1 1 1 1 1 1 1 1 1 1 1 1 1 1
Skandi Nova 3 3 3 3 3 3 3 1 1 1 1 1 1 1 1 1 1 1 1 1 1 1 1 1 1 1 1 1 1 1 1 1 1 1 1 1 1 1 1 1 1 1 1 1 1 1 1 1 1 1 1 1 1 1 1 1 1
Skandi Marøy 3 3 3 3 3 3 3 3 1 1 1 1 1 1 1 1 1 1 1 1 1 1 1 1 1 1 1 1 1 1 1 1 1 1 1 1 1 1 1 1 1 1 1 1 1 1 1 1 1 1 1 1 1 1 1 1 1
Skandi Hugen 3 3 3 3 3 3 3 3 3 1 1 1 1 1 1 1 1 1 1 1 1 1 1 1 1 1 1 1 1 1 1 1 1 1 1 1 1 1 1 1 1 1 1 1 1 1 1 1 1 1 1 1 1 1 1 1 1
Skandi Stord 1 1 1 1 1 1 1 1 1
Skandi Admiral 1 1 1 1 1 1 1 1 1 1 1 1 1 1 1 1 1 1 1 1 1 1 1 1 1 1 1 1 1 1
Skandi Vega 1 1 1 1 1 1 1 1 1 1 1 1 1 1 1 1 1 1 1 1 1 1 1 1 1 1 1 1 1 1 1 1 1 1 1 1 1 2 2 2 2 2 2 2 2 2 2 2 2 2 2 2 2 2 2 2 2
Skandi Fjord 1 1 1 1 1 1 1 1 1 1 1 1 1 1 1 1 1 1 1 1 1 1 1 1 1 1 1 1 1 1 2 2 2 2 2 2 2 2 2 2 2 2 2 2 2 2 2 2 2 2 2 2 2 2 2 2 2
Skandi Olympia 1 1 1 1 1 1 1 1 1 1 1 1 1 1 1 1 1 1 1 1 1 1 1 1 2 2 2 2 2 2 2 2 2 2 2 2
Skandi Hawk 3 3 1 1 1 1 1 1 1 1 1 1 1 1 2 2 2 2 2 2 2 2 2 2 2 2 0 0 0 0 0 0 0
Skandi Commander 1 1 1 1 1 1 1 1 1 1 1 1 1 1 1 1 1 1 1 1 1 1 1 1 1 1 1 1 1 1 1 1 1 1 1 1 1 1
DOF Supply
PSV
AH
TSC
SV
20162012 2013 2014 2015

DOF ASA – Q2 Presentation 2012
A M J J A S O N D J F M A M J J A S O N D J F M A M J J A S O N D J F M A M J J A S O N D J F M A M J J A S O N D
Skandi Peregrino 1 1 1 1 1 1 1 1 1 2 2 2 2 2 2 2 2 2 2 2 2 2 2 2 2 2 2 2 2 2 2 2 2 2 2 2 2 2 2 2 2 2 2 2 2Skandi Emerald 0
Skandi Saigon
Skandi Pacific 1 1 1 1 1
Skandi Atlantic 1 1 1 1 1 1 1 1 1 1 1 1 1 1 1 1 1 1 1 1 1 1 1 1 1 1 1 1 1 1 1
2012 2013 2014 2015 2016
AH
TS
Aker DOF Deepwater
SPOT
SPOT
SPOT
Aker DOF Deepwater – Contract coverage
28
FIRM CONTRACTS UNDER CONSTRUCTION OPTIONAL PERIOD

DOF ASA – Q2 Presentation 2012
Norskan – Contract coverage
29
FIRM CONTRACTS UNDER CONSTRUCTION OPTIONAL PERIOD
A M J J A S O N D J F M A M J J A S O N D J F M A M J J A S O N D J F M A M J J A S O N D J F M A M J J A S O N D
Skandi Leblon 1 1 1 1 1 1 1 1 1 1 1 1 1 1 1 1 1 1 1 1 1 1 1 1 1 1 1 1 1 1 1 1 1 1 1 1 1 1 1 1 1 2 2 2 2 2 2 2 2 2 2 2 2 2 2 2 2
Skandi Flamengo 1 1 1 1 1 1 1 1 1 1 1 1 1 1 1 1 1 1 1 1 1 1 1 1 1 1 1 1 1 1 1 1 1 1 1 1 1 1 1 1 1 1 1 1 2 2 2 2 2 2 2 2 2 2 2 2 2
Skandi Yare 1 1 1 1 1 1 1 1
Skandi Stolmen 1 1 1 1 1 1 1 1 1 1 1 1 2 2 2 2 2 2 2 2 2 2 2 2 2 2 2 2 2 2 2 2 2 2 2 2 2 2 2 2 2 2 2 2 2 2 2 2
Skandi Captain 1 1 1 1 1 1 1 1 1 1 1 1 1 1 1 2 2 2 2 2 2 2 2 2 2 2 2 2 2 2 2 2 2 2 2 2 2 2 2 2 2 2 2 2 2 2 2 2 2 2
Skandi Copacabana 1 1 1 1 1 1 1 1 1 1 1 1 1 1 1 1 2 2 2 2 2 2 2 2 2 2 2 2 2 2 2 2 2 2 2Skandi Botafogo 1 1 1 1 1 1 1 1 1 1 1 1 1 1 1 1 1 1 2 2 2 2 2 2 2 2 2 2 2 2 2 2 2 2 2 2 2 2 2 2 2 2Skandi Rio 1 1 1 1 1 1 1 1 1 1 1 1 1 1 1 1 2 2 2 2
Skandi Fluminense 1 1 1 1 1 1 1 1 1 1 1 1 1 1 1 1 1 1 1 1 1 2 2 2 2 2 0 0 0 0 0 0
Skandi Giant 1 1 1 1 1 1 1 1 1 1 1 1 1 1 1 1 1 1 1 1 1 1 1 1 1 1 1 1 1 1 2 2 2 2 2 2 2 2 2 2 2 2 2 2 2 2 2 2 2 2 2 2 2 2 2 2 2
Skandi Møgster 1 1 1 1 1 1 1 1 1 1 1 1 1 1 1 1 1 1 1 1 1 1 1 1 2 2 2 2 2 2 2 2 2 2 2 2Skandi Ipanema 1 1 1 1 1 2 2 2 2 2 2 2 2 2 2 2 2 2 2 2 2 2 2 2 2 2 2 0 0 0 0
Skandi Amazonas 1 1 1 1 1 1 1 1 1 1 1 1 1 1 1 1 1 1 1 1 1 1 1 1 1 1 1 1 1 1 1 1 1 1 1 1 1 1 1 1 1 1 1 1 1 1 1 1 1 1 1 1 1 1 1 1 1
Skandi Iguacu 3 3 3 3 3 1 1 1 1 1 1 1 1 1 1 1 1 1 1 1 1 1 1 1 1 1 1 1 1 1 1 1 1 1 1 1 1 1 1 1 1 1 1 1 1 1 1 1 1 1 1 1 1 1 1 1 1
Skandi Angra 3 3 3 3 3 3 3 3 3 3 3 3 3 3 3 3 3 1 1 1 1 1 1 1 1 1 1 1 1 1 1 1 1 1 1 1 1 1 1 1 1 1 1 1 1 1 1 1 1 1 1 1 1 1 1 1 1
Skandi Urca 3 3 3 3 3 3 3 3 3 3 3 3 3 3 3 1 1 1 1 1 1 1 1 1 1 1 1 1 1 1 1 1 1 1 1 1 1 1 1 1 1 1 1 1 1 1 1 1 1 1 1 1 1 1 1 1 1
Skandi Paraty 3 3 3 3 3 3 3 3 3 3 3 3 3 3 3 3 3 3 3 3 3 3 3 0 0 0 0 0 0 0 0 0 0 0 0 0 0 0 0 0 0 0 0 0 0
Skandi Chieftain 1 1 1 1 1 1 1 1 1 1 1 1 1 1 1 1 1 1 1 1 1 1 1 1 1 1 1
Skandi Hav 1 1 1 1 1 1 1 1 1 1 1 1 1 1 1 1 1 1 1 1 1 1 1 1 1 1 1 1 1 1 1 2 2 2 2 2 2 2 2 2 2 2 2 2 2 2 2 2 2 2 2 2 2 2 2 2 2
2015 20162012 2013 2014
CS
VP
SV
AH
TS
Norskan

DOF ASA – Q2 Presentation 2012 30
FIRM CONTRACTS UNDER CONSTRUCTION OPTIONAL PERIOD * TC from DOF
A M J J A S O N D J F M A M J J A S O N D J F M A M J J A S O N D J F M A M J J A S O N D J F M A M J J A S O N D
1 1 1 1 1 1 1 1 1 1 1 1 1 1 1 1 1 1 1 1 1 1 1 1 1 1 1 1 1 1 1 1 1 1 1 1 1 1 1 1 1 1 1 1 1 1 1 1 2 2 2 2 2 2 2 2 2
Ocean Protector 1 1 1 1 1 1 1 1 1 1 1 1 1 1 1 1 1 1 1 1 1 1 1 1 1 1 1 1 1 1 2 2 2 2 2 2 2 2 2 2 2 2 2 2 2 2 2 2 2 2 2 2 2 2
Skandi Seven 1 1 1 1 1 1 1 1 1 1 1 1 1 1 1 1 1 1 1 1 1 1 1 1 2 2 2 2 2 2 2 2 2 2 2 2 2 2 2 2 2 2 2 2 2 2 2 2 2 2 2 2 2 2 2 2 2Skandi Salvadore 1 1 1 1 1 1 1 1 1 1 1 1 1 1 1 1 1 1Skandi Vitoria 1 1 1 1 1 1 1 1 1 1 1 1 1 1 1 1 1 1 1 2 2 2 2 2 2 2 2 2 2 2 2 2 2 2 2 2 2 2 2 2 2 2 2 2 2 2 2 2 2 2 2 2 2 2 2 2 2
Skandi Aker 1 1 1 1 1 1 1 1 1 1 1 1 1 1 1 1 1 1 1 1 1 1 1 1 1 1 1 1 1 1 1 1 1 1 2 2 2 2 2 2 2 2 2 2 2 2 2 2 2 2 2 2 2 2 2 2 2
Skandi Santos 1 1 1 1 1 1 1 1 1 1 1 1 1 1 1 1 1 1 1 1 1 1 1 1 1 1 1 1 1 1 1 1 1 1 2 2 2 2 2 2 2 2 2 2 2 2 2 2 2 2 2 2 2 2 2 2 2
Skandi Patagonia 1 1 1 1 1 1 1 1 1 1 1 1 1 1 1 1 1 1 1 1 1 1 1 1 1 1 1 1 1 1 1 1 1 1 1 1 1 1 1 1 1 1 1 1 1 1 1 1 1 1 1 1 1 1 1 1 1Skandi Carla 1 1 1 1 1 1 1 1 1 1 1 1 1 1 1 1 1 1 1 1 1 1 1 1 1 1 1 1 1 1 1 1 1 1 1 1 1 1 1 1 1 1 1 1 1 1 1 1 1 1 1 1 1 1 1 1 1Skandi Neptune 1 1 1 1 1 1 1 1 1 1 1 1 1 1 1 1 1 1 1 1 1 1 1 1 2 2 2 2 2 2 2 2 2 2 2 2 2 2 2 2 2 2 2 2 2 2 2 2 2 2 2 2 2 2 2 2 2
Skandi Achiever 1 1 1 1 1 1 1 1 1 1 1 1 1 1 1 1 1 1 1 1 1 1 1 1 1 1 1 1 1 1 1 1 1 1 1 1 1 1 1 1 1 2 2 2 2 2 2 2 2 2 2 2 2 2 2 2 2
Skandi Acergy 1 1 1 1 1 1 1 1 1 1 1 1 1 1 1 1 1 1 1 1 1 1 1 1 1 1 1 1 1 1 1 1 1 1 1 1 1 1 1 1 1 1 1 1 1 1 1 1 1 1 1 1 1 2 2 2 2
Skandi Arctic 1 1 1 1 1 1 1 1 1 1 1 1 1 1 1 1 1 1 1 1 1 1 1 1 1 1 1 1 1 1 1 1 1 1 1 1 1 1 1 1 1 1 1 1 1 1 1 1 1 1 1 1 1 1 1 1 1Skandi Niteroi 1 1 1 1 1 1 1 1 1 1 1 1 1 1 1 1 1 1 1 1 1 1 1 1 1 1 1 1 1 1 1 1 1 1 1 1 1 1 1 1 1 1 2 2 2 2 2 2 2 2 2 2 2 2 2 2 2
1 1 1 1 1 1 1 1 1 1 1 1 1 1 1 1 1 1 1 1 1 1 1 1 1 1 1 1 1 1 1 1 1 1 1 1 1 1 1 1 1 1 1 1 1 1 1 1 1 1 1 1 1 1 1 1 1Skandi Skansen 1 1 1 1 1 1 1 1 1 1 1 1 1 1 1 2 2 2 1 1 1 2 2 2 1 1 1 2 2 2 2 2 2 2 2 2
Skandi Inspector 1 1 1 1 1 1 1 1 1 1 1 1 2 2 2 2 2 2 2 2 2 2 2 2 2 2 2 2 2 2 2 2 2 2 2 2Skandi Constructor 1 1 1 1 1 1 1 0 0 0 0 0 1 1 1 1 1 1 1 1 1 1 1 1 1 1 1 1 1 1 1 1 1 1 1 1 1 1 1 1 1 1 1 1 1 1 1 1 2 2 2 2 2 2 2 2 2
Skandi Singapore 1 1 1 1 1 1 1Skandi Hercules 1 1 1 1 1 1 1 1 1Skandi Skolten 1 1 1 1 1 1 1 1 1 1Skandi Hawk* 1 1 1 1 1 1
1 1 1 0 11 1 1 1 1 1 1 2 2 2 20 1 1 1 1 1 1 1
NB 776 3 3 3 3 3 3 3 3 3 3 3 3 2 2 2 2 2 2 2 2 2 2 2 2 0 0 0 0 0 0 0 0 0 0 0 0 0 0 0 0 0 0 0
2012 2013 2014 2015 2016
Geograph
Geobay
CS
V
Geoholm
Geosea
DOF Subsea
Geosund
DOF Subsea – Contract coverage (vessels)

DOF ASA - Q2 Presentation 2012
DOF Subsea

DOF ASA – Q2 Presentation 2012
Fleet One of the largest subsea vessel owners in the world Operates a fleet of 25 vessels with a total market value of NOK16.5
billion Operates 52 ROVs, including 5 newbuilds
Global organization
Head office in Bergen Regional offices in Australia, Singapore, Norway, UK, Angola, US,
Canada and Brazil
Total of 2,332 employees Subsea employees: 1,332 Of which offshore engineers and project staff: 900 Marine crew: 1,000
32
Norway Brazil Canada US UK Asia Pacific Angola
233 316 36 62 313 354 18 * As pr 30th June 2012
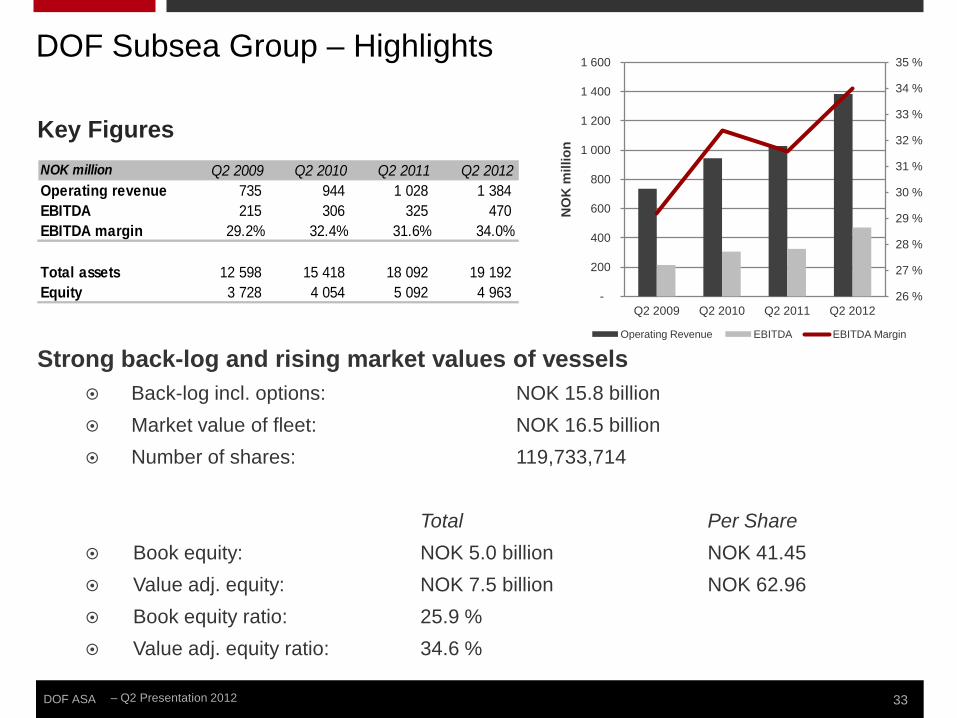
DOF Subsea Group – Highlights
DOF ASA – Q2 Presentation 2012 33
Strong back-log and rising market values of vessels Back-log incl. options: NOK 15.8 billion Market value of fleet: NOK 16.5 billion Number of shares: 119,733,714
Total Per Share
Book equity: NOK 5.0 billion NOK 41.45 Value adj. equity: NOK 7.5 billion NOK 62.96 Book equity ratio: 25.9 % Value adj. equity ratio: 34.6 %
Key Figures
26 %
27 %
28 %
29 %
30 %
31 %
32 %
33 %
34 %
35 %
-
200
400
600
800
1 000
1 200
1 400
1 600
Q2 2009 Q2 2010 Q2 2011 Q2 2012
NO
K m
illio
n
Operating Revenue EBITDA EBITDA Margin
NOK million Q2 2009 Q2 2010 Q2 2011 Q2 2012Operating revenue 735 944 1 028 1 384 EBITDA 215 306 325 470 EBITDA margin 29.2% 32.4% 31.6% 34.0%
Total assets 12 598 15 418 18 092 19 192 Equity 3 728 4 054 5 092 4 963
DOF Subsea Group – Highlights

DOF ASA – Q2 Presentation 2012
GEOGRAPHICAL FOCUS AREAS
Rio de Janeiro (316)
Buenos Aires
Singapore (91)
Houston (62) St. Johns (36)
Aberdeen (313)
Bergen (233)
Cairo
Brunei
Macae Jakarta (3)
Manila
Angola (18)
St. Petersburg
Perth (255)
34
(5)
Global player – DOF Subsea

DOF ASA – Q2 Presentation 2012 35
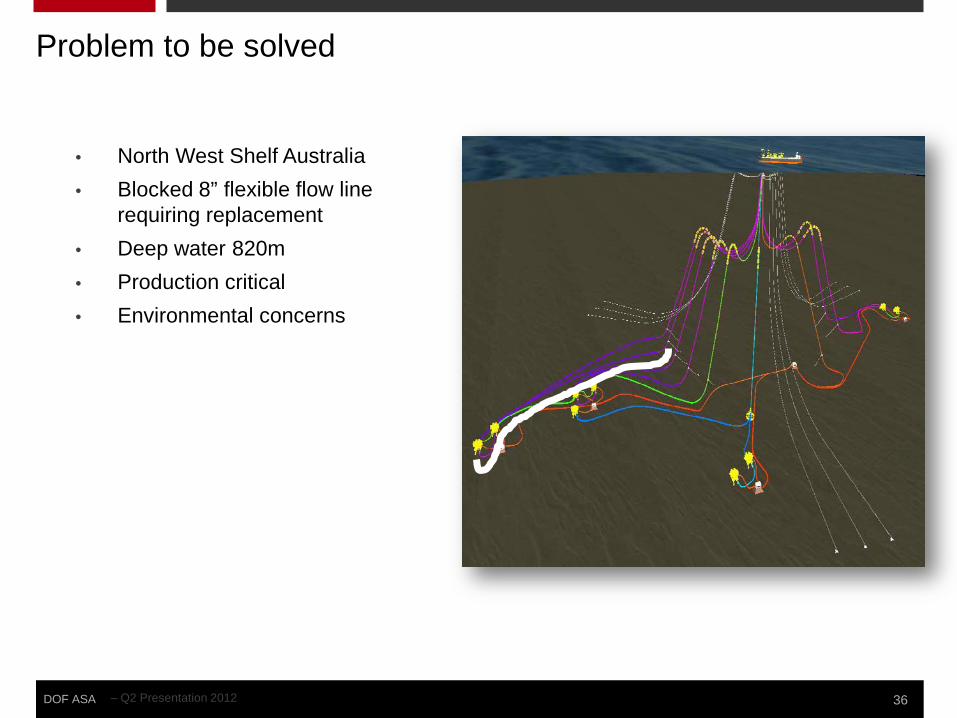
BHP Billiton Stybarrow H4, Remediation Project
DOF ASA – Q2 Presentation 2012
• North West Shelf Australia • Blocked 8” flexible flow line
requiring replacement • Deep water 820m • Production critical • Environmental concerns
36
Problem to be solved

DOF ASA – Q2 Presentation 2012
• Project Management and Engineering • Design and build a Horizontal Lay
System • Transport and installation of 8” flexible • Disconnect existing 8’ flexible • Install new flow line and jumpers • Testing and commissioning • Permanently abandon existing flow line
37
Scope of work

DOF ASA – Q2 Presentation 2012 38
Period Description 8th July 2011 Commenced pre engineering
6th September 2011 Contract award
10th November 2011 Offshore mobilisation
28th December 2011 Project complete and demobilised
Schedule

DOF ASA – Q2 Presentation 2012 39
Marine Spread – Skandi Hercules

DOF ASA - Q2 Presentation 2012
Outlook

DOF ASA – Q2 Presentation 2012 41
Substantial subsea growth announced
Supply side
Newbuilding program within all subsectors limited
Old fleet
Financing constraints
Demand side
Surface to subsea activity increasing
Subsea CAPEX to double by 2014
Increased tendering for equipment
Backlog
“We expect a strong market in all regions”

DOF ASA – Q2 Presentation 2012 42
PSV and AHTS
Demand side
High oil price
Increased E & P spending
Increased deepwater spending
Increased infrastructure spending
Strongest growth in Brazil, West Africa and Asia Pacific
Increased focus on newer, larger and more advanced vessels
Supply side
AHTS (larger than 15,000 BHP)
Newbuilding program is limited
Financing constraints

DOF ASA – Q2 Presentation 2012 43
PSV and AHTS
Supply side
PSV (larger than 3,000 dwt)
Large newbuilding program
Financing constraints, but to a lower degree due to lower CAPEX.
We expect the AHTS market to turn in the favour of owners, with good rates and high utilisation in the spot market and higher rates on term charters.
We are uncertain about the future balance in the PSV market.

DOF ASA – Q2 Presentation 2012
“We expect Q3 to be in line with Q2 or better.” ”We repeat our 2012 guidance”
44
Short term outlook

Thank you
Presented by Mons Aase - CEO Hilde Drønen - CFO

DOF ASA – Q2 Presentation 2012
DISCLAIMER
This presentation by DOF ASA designed to provide a high level overview of aspects of the operations of the DOF ASA Group. The material set out in the presentation is current as at 23 Aug, 2012. This presentation contains forward-looking statements relating to operations of the DOF ASA Group that are based on management’s own current expectations, estimates and projections about matters relevant to DOF ASA‘s future financial performance. Words such as “likely”, “aims”, “looking forward”, “potential”, “anticipates”, “expects”, “predicts”, “plans”, “targets”, “believes” and “estimates” and similar expressions are intended to identify forward-looking statements. References in the presentation to assumptions, estimates and outcomes and forward-looking statements about assumptions, estimates and outcomes, which are based on internal business data and external sources, are uncertain given the nature of the industry, business risks, and other factors. Also, they may be affected by internal and external factors that may have a material effect on future business performance and results. No assurance or guarantee is, or should be taken to be, given in relation to the future business performance or results of the DOF ASA Group or the likelihood that the assumptions, estimates or outcomes will be achieved. While management has taken every effort to ensure the accuracy of the material in the presentation, the presentation is provided for information only. DOF ASA , its officers and management exclude and disclaim any liability in respect of anything done in reliance on the presentation. All forward-looking statements made in this presentation are based on information presently available to management and DOF ASA assumes no obligation to update any forward looking- statements. Nothing in this presentation constitutes investment advice and this presentation shall not constitute an offer to sell or the solicitation of any offer to buy any securities or otherwise engage in any investment activity. You should make your own enquiries and take your own advice (including financial and legal advice) before making an investment in the company's shares or in making a decision to hold or sell your shares.
46