q2 fy18 noteholder presentation - selecta.com58aaf9d2-926b-40a5-9812... · 2 this presentation is...
TRANSCRIPT
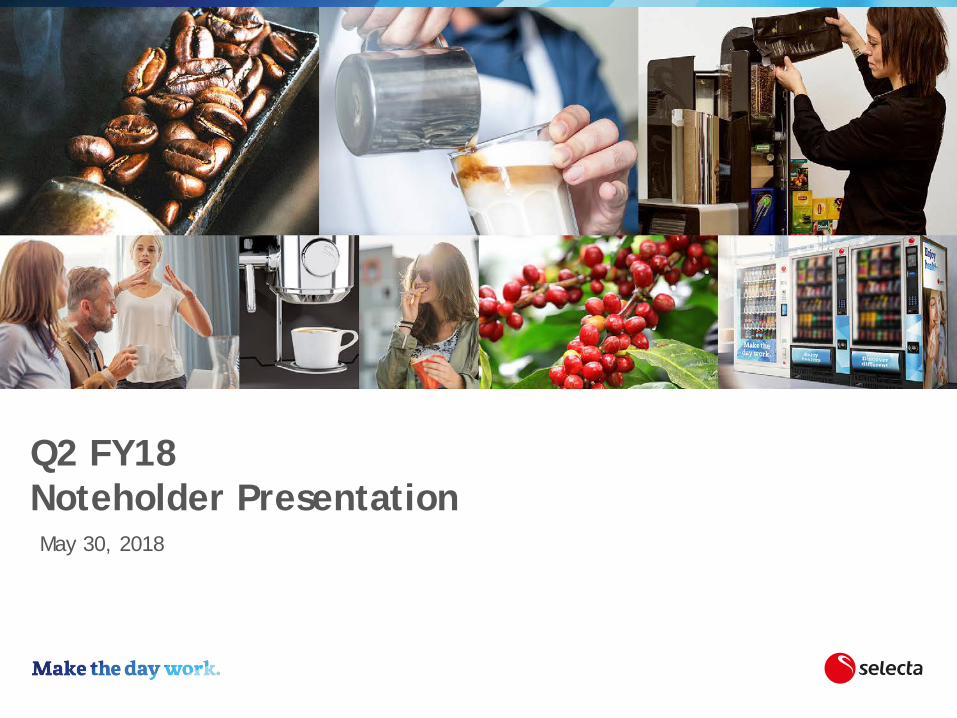
Q2 FY18Noteholder PresentationMay 30, 2018
2
THIS PRESENTATION IS NOT AN OFFER OR SOLICITATION OF AN OFFER TO BUY ORSELL SECURITIES IN THE UNITED STATES OF AMERICA OR IN ANY OTHERJURISDICTION. IT IS PROVIDED AS INFORMATION ONLY
This presentation is furnished only for the use of the intended recipient, and may not berelied upon for the purposes of entering into any transaction. By attending this presentation,you agree to be bound by these restrictions. Any failure to comply with these restrictions mayconstitute a violation of applicable securities laws.
Certain information herein (including market data and statistical information) has beenobtained from various sources. We do not represent that it is complete or accurate. Allprojections, valuations and statistical analyses are provided to assist the recipient in theevaluation of the matters described herein. They may be based on subjective assessments andassumptions and may use one among alternative methodologies that produce different resultsand to the extent that they are based on historical information, they should not be reliedupon as an accurate prediction of future performance.
This presentation may include forward-looking statements that reflect our intentions, beliefsor current expectations. Forward-looking statements involve all matters that are not historicalby using the words “may”, “will”, “would”, “should”, “expect”, “intend”, “estimate”,“anticipate”, “believe”, and similar expressions or their negatives. Such statements are madeon the basis of assumptions and expectations that we currently believe are reasonable, butcould prove to be wrong. This presentation does not constitute an offer or an agreement, or asolicitation of an offer or an agreement, to enter into any transaction (including for theprovision of any services) and does not constitute an offer or invitation to subscribe for orpurchase any securities, and nothing contained herein shall form the basis of any contract orcommitment whatsoever.
The information contained herein does not constitute investment, legal, accounting,regulatory, taxation or other advice and the information does not take into account yourinvestment objectives or legal, accounting, regulatory, taxation or financial situation orparticular needs. You are solely responsible for forming your own opinions andconclusions on such matters and the market and for making your own independentassessment of the information herein. You are solely responsible for seeking independentprofessional advice in relation to the information and any action taken on the basis of theinformation. Investors and prospective investors in the securities of the issuer mentionedherein are required to make their own independent investigation and appraisal of thebusiness and financial condition of such issuer and the nature of the securities.
This presentation includes certain financial data that are “non-IFRS financial measures”.These non-IFRS financial measures do not have a standardized meaning prescribed byInternational Financial Reporting Standards and therefore may not be directlycomparable to similarly titled measures presented by other entities, nor should they beconstrued as an alternative to other financial measures determined in accordance withInternational Financial Reporting Standards. Although we believe these non-IFRS financialmeasures provide useful information to users in measuring the financial performance andcondition, of the business, you are cautioned not to place undue reliance on any non-IFRSfinancial measures included in this presentation. This presentation contains certain dataand forward looking statements regarding the economy, the markets and the industry inwhich we operate and that were obtained from publicly available information,independent industry publications and other third party data. We have not independentlyverified such data and forward-looking statements and cannot guarantee their accuracyor completeness.
Disclaimer
3
Content1. Company Overview
2. Key Messages
3. Strategic Initiatives
4. Synergies
5. Financial Results– Full Year
4
Content1. Company Overview
2. Key Messages
3. Strategic Initiatives
4. Synergies
5. Financial Results– Full Year
5
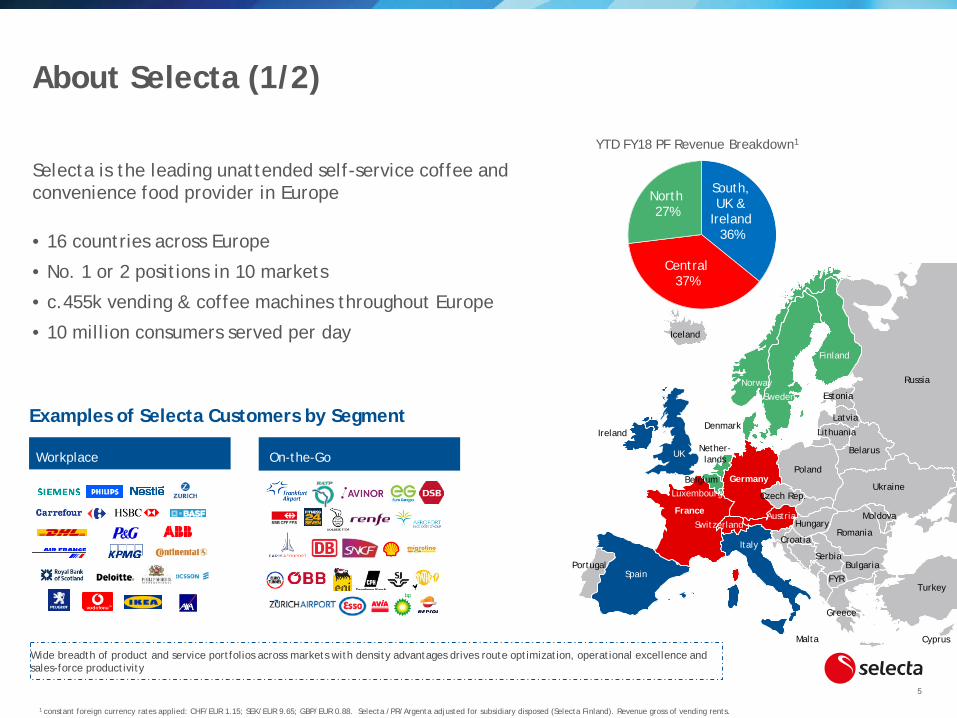
Wide breadth of product and service portfolios across markets with density advantages drives route optimization, operational excellence and sales-force productivity
1 constant foreign currency rates applied: CHF/EUR 1.15; SEK/EUR 9.65; GBP/EUR 0.88. Selecta /PR/Argenta adjusted for subsidiary disposed (Selecta Finland). Revenue gross of vending rents.
Workplace On-the-Go
YTD FY18 PF Revenue Breakdown1
Examples of Selecta Customers by Segment
Selecta is the leading unattended self-service coffee and convenience food provider in Europe
• 16 countries across Europe
• No. 1 or 2 positions in 10 markets
• c.455k vending & coffee machines throughout Europe
• 10 million consumers served per day
About Selecta (1/2)
Russia
Estonia
Latvia
LithuaniaDenmark
Norway
Sweden
Finland
Iceland
Austria
Croatia
Turkey
Romania
Bulgaria
Moldova
Ukraine
Hungary
Czech Rep.
Poland
Belarus
SerbiaItaly
FranceSwitzerland
FYR
Germany
Nether-lands
LuxembourgBelgium
SpainPortugal
Ireland
Greece
CyprusMalta
UK
South, UK &
Ireland36%
Central37%
North27%
6
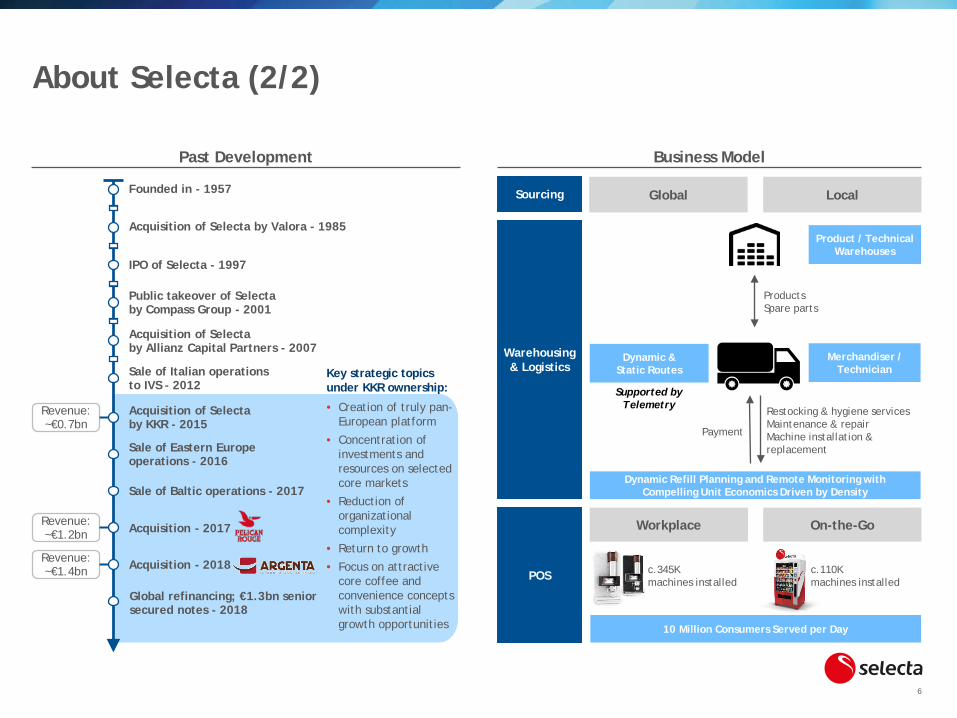
Past Development
ProductsSpare parts
Restocking & hygiene servicesMaintenance & repairMachine installation & replacement
Payment
Global Local
Workplace On-the-Go
c.345Kmachines installed
c.110Kmachines installed
Product / Technical Warehouses
Sourcing
Warehousing & Logistics
POS
Merchandiser / Technician
Supported by Telemetry
Business Model
Key strategic topics under KKR ownership:
• Creation of truly pan-European platform
• Concentration of investments and resources on selected core markets
• Reduction of organizational complexity
• Return to growth
• Focus on attractive core coffee and convenience concepts with substantial growth opportunities
Public takeover of Selecta by Compass Group - 2001
Founded in - 1957
Sale of Italian operations to IVS - 2012
Acquisition of Selecta by Allianz Capital Partners - 2007
Acquisition of Selecta by Valora - 1985
IPO of Selecta - 1997
Sale of Eastern Europeoperations - 2016
Sale of Baltic operations - 2017
Global refinancing; €1.3bn senior secured notes - 2018
Acquisition of Selectaby KKR - 2015
Revenue: ~€0.7bn
Acquisition - 2018Revenue: ~€1.4bn
Acquisition - 2017Revenue: ~€1.2bn
Dynamic & Static Routes
10 Million Consumers Served per Day
Dynamic Refill Planning and Remote Monitoring with Compelling Unit Economics Driven by Density
About Selecta (2/2)
7
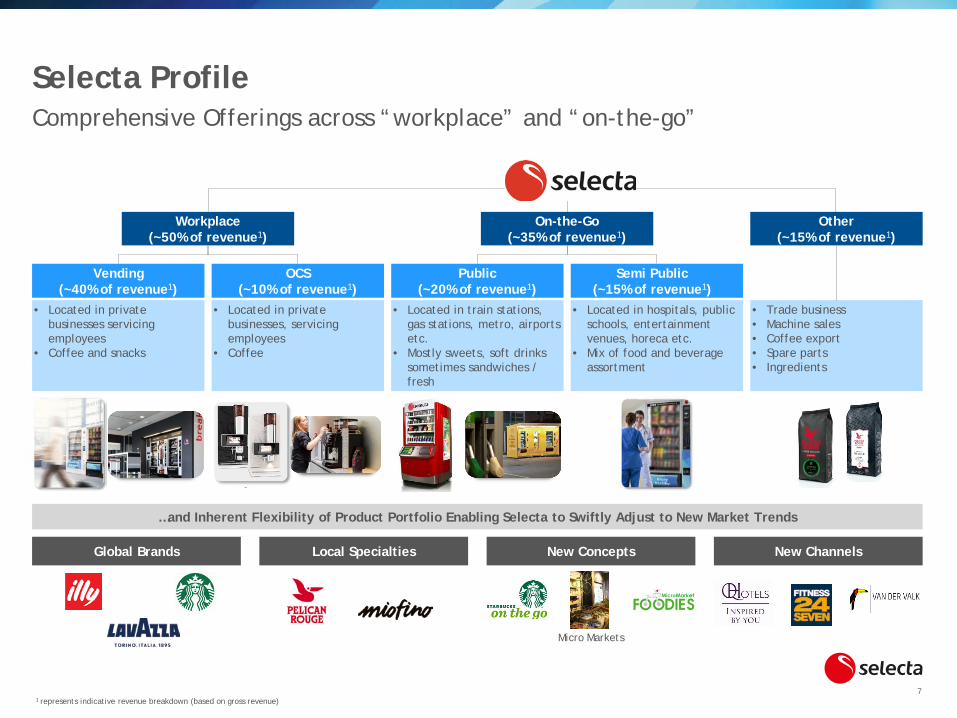
Selecta ProfileComprehensive Offerings across “workplace” and “on-the-go”
1 represents indicative revenue breakdown (based on gross revenue)
Global Brands Local Specialties New Concepts New Channels
…and Inherent Flexibility of Product Portfolio Enabling Selecta to Swiftly Adjust to New Market Trends
Micro Markets
Workplace(~50% of revenue1)
On-the-Go(~35% of revenue1)
Vending(~40% of revenue1)
• Located in private businesses servicing employees
• Coffee and snacks
OCS(~10% of revenue1)
• Located in private businesses, servicing employees
• Coffee
Public(~20% of revenue1)
• Located in train stations, gas stations, metro, airports etc.
• Mostly sweets, soft drinks sometimes sandwiches / fresh
Semi Public(~15% of revenue1)
• Located in hospitals, public schools, entertainment venues, horeca etc.
• Mix of food and beverage assortment
• Trade business• Machine sales• Coffee export• Spare parts• Ingredients
Other(~15% of revenue1)
8
Ambition Values
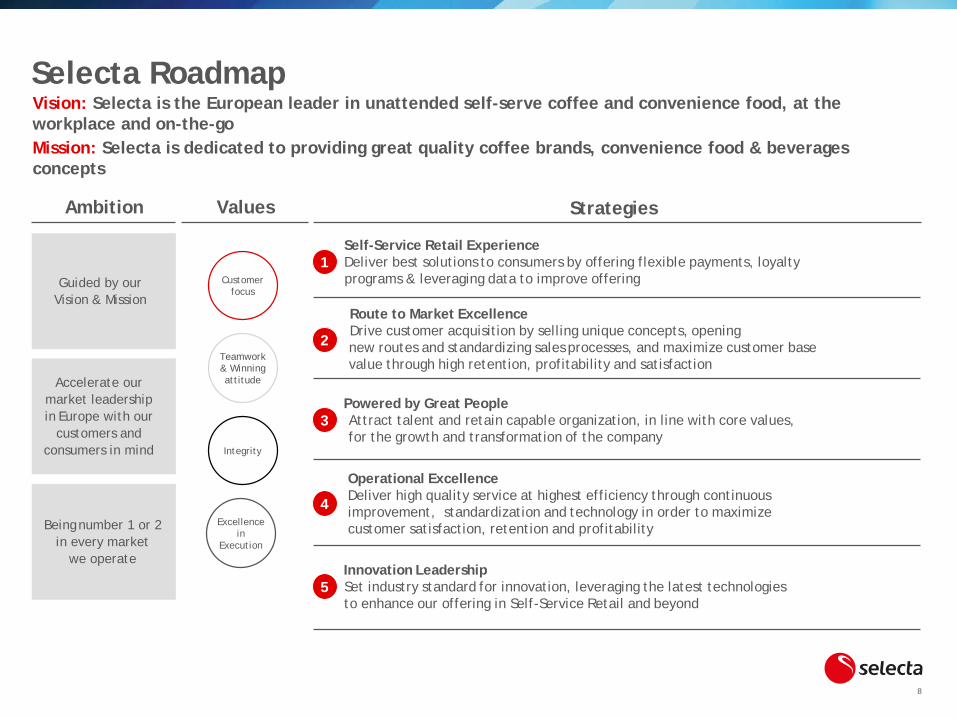
Vision: Selecta is the European leader in unattended self-serve coffee and convenience food, at the workplace and on-the-goMission: Selecta is dedicated to providing great quality coffee brands, convenience food & beverages concepts
Powered by Great PeopleAttract talent and retain capable organization, in line with core values, for the growth and transformation of the company
Operational Excellence Deliver high quality service at highest efficiency through continuous improvement, standardization and technology in order to maximize customer satisfaction, retention and profitability
Self-Service Retail Experience Deliver best solutions to consumers by offering flexible payments, loyalty programs & leveraging data to improve offering
Innovation LeadershipSet industry standard for innovation, leveraging the latest technologies to enhance our offering in Self-Service Retail and beyond
Route to Market Excellence Drive customer acquisition by selling unique concepts, openingnew routes and standardizing sales processes, and maximize customer base value through high retention, profitability and satisfaction
Customer focus
Teamwork & Winning attitude
Excellence in
Execution
Strategies
1
2
3
4
5
Integrity
Guided by our Vision & Mission
Accelerate ourmarket leadership in Europe with our
customers and consumers in mind
Being number 1 or 2 in every market
we operate
Selecta Roadmap
9
Content1. Company Overview
2. Key Messages
3. Strategic Initiatives
4. Synergies
5. Financial Results– Full Year
10
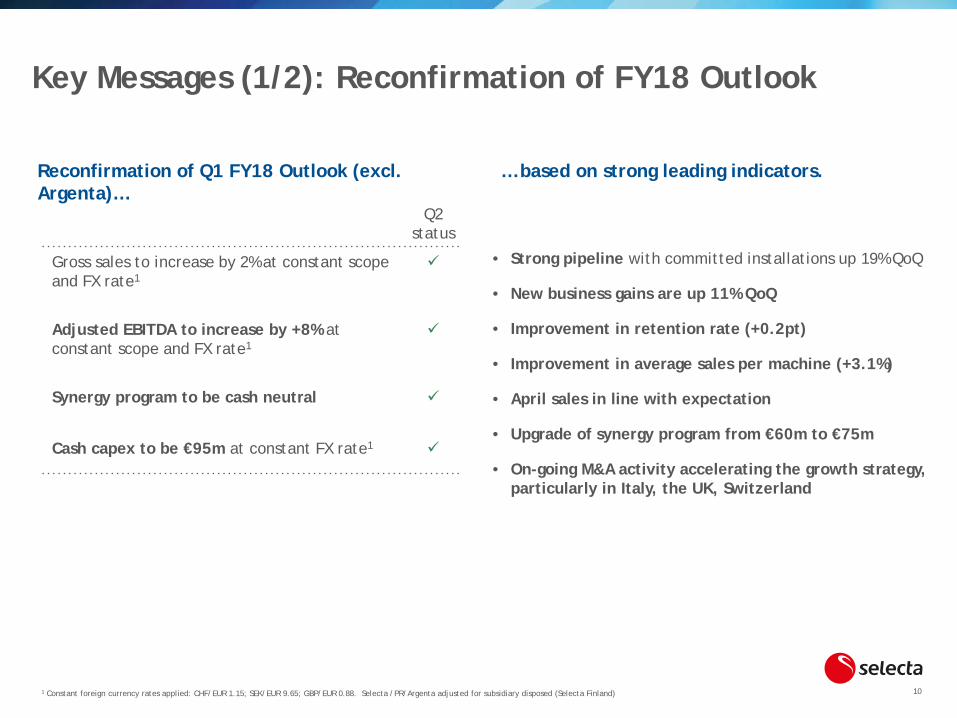
Key Messages (1/2): Reconfirmation of FY18 Outlook
Q2 status
Gross sales to increase by 2% at constant scope and FX rate1
Adjusted EBITDA to increase by +8% at constant scope and FX rate1
Synergy program to be cash neutral
Cash capex to be €95m at constant FX rate1
• Strong pipeline with committed installations up 19% QoQ
• New business gains are up 11% QoQ
• Improvement in retention rate (+0.2pt)
• Improvement in average sales per machine (+3.1%)
• April sales in line with expectation
• Upgrade of synergy program from €60m to €75m
• On-going M&A activity accelerating the growth strategy, particularly in Italy, the UK, Switzerland
Reconfirmation of Q1 FY18 Outlook (excl. Argenta)…
… based on strong leading indicators.
1 Constant foreign currency rates applied: CHF/EUR 1.15; SEK/EUR 9.65; GBP/EUR 0.88. Selecta /PR/Argenta adjusted for subsidiary disposed (Selecta Finland)
11
Key Messages (2/2): Q2 FY18 Performance
1 Constant foreign currency rates applied: CHF/EUR 1.15; SEK/EUR 9.65; GBP/EUR 0.88. Selecta /PR/Argenta adjusted for subsidiary disposed (Selecta Finland)2 Revenue gross of vending fees3 Net capital expenditures is defined as capital expenditures less net book value of disposals of vending equipment4 Adjustments capture one off items relating to synergy costs5 Machines excluded non-revenue generating machines and are averaged over the quarter, days are weighted by turnover per segment across the group
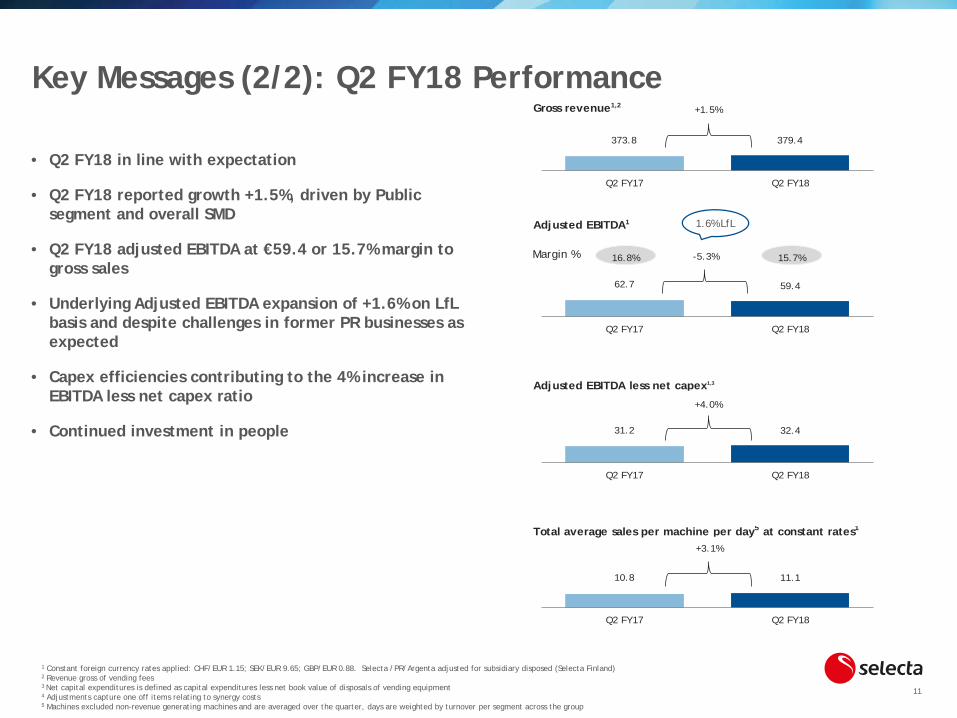
• Q2 FY18 in line with expectation
• Q2 FY18 reported growth +1.5%, driven by Public segment and overall SMD
• Q2 FY18 adjusted EBITDA at €59.4 or 15.7% margin to gross sales
• Underlying Adjusted EBITDA expansion of +1.6% on LfLbasis and despite challenges in former PR businesses as expected
• Capex efficiencies contributing to the 4% increase in EBITDA less net capex ratio
• Continued investment in people
Gross revenue1,2
Adjusted EBITDA1
Margin %
Adjusted EBITDA less net capex1,3
Total average sales per machine per day5 at constant rates1
+4.0%
-5.3%
373.8 379.4
Q2 FY17 Q2 FY18
62.7 59.4
Q2 FY17 Q2 FY18
31.2 32.4
Q2 FY17 Q2 FY18
16.8% 15.7%
+1.5%
10.8 11.1
Q2 FY17 Q2 FY18
+3.1%
1.6% LfL
12
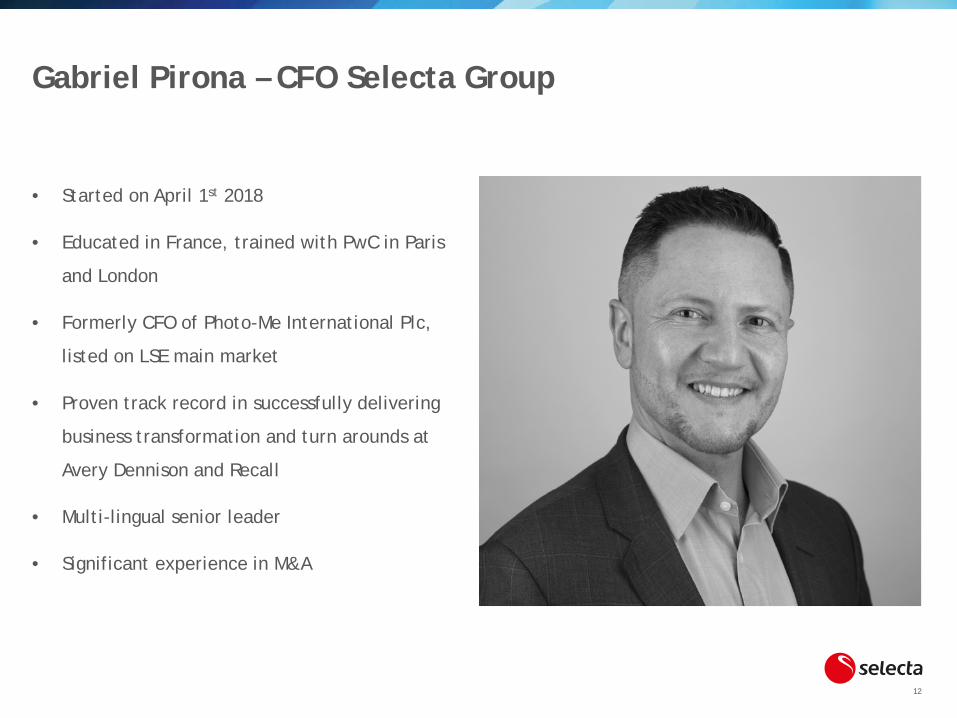
Gabriel Pirona – CFO Selecta Group
• Started on April 1st 2018
• Educated in France, trained with PwC in Paris
and London
• Formerly CFO of Photo-Me International Plc,
listed on LSE main market
• Proven track record in successfully delivering
business transformation and turn arounds at
Avery Dennison and Recall
• Multi-lingual senior leader
• Significant experience in M&A
13
Content1. Company Overview
2. Key Messages
3. Strategic Initiatives
4. Synergies
5. Financial Results– Full Year
14
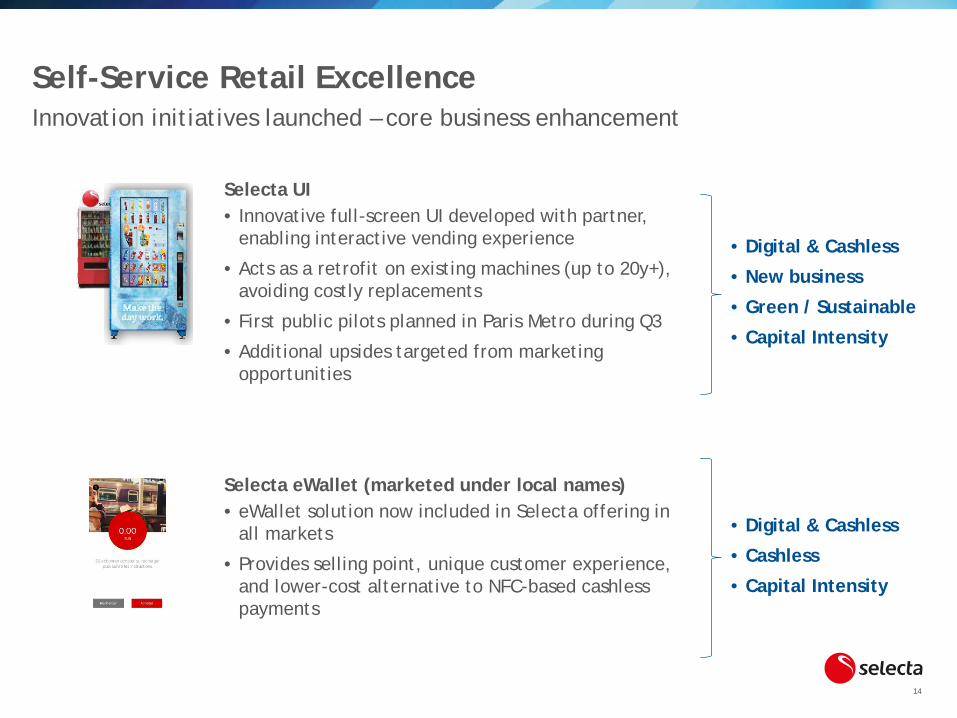
Self-Service Retail ExcellenceInnovation initiatives launched – core business enhancement
Selecta UI • Innovative full-screen UI developed with partner,
enabling interactive vending experience
• Acts as a retrofit on existing machines (up to 20y+), avoiding costly replacements
• First public pilots planned in Paris Metro during Q3
• Additional upsides targeted from marketing opportunities
Selecta eWallet (marketed under local names)• eWallet solution now included in Selecta offering in
all markets
• Provides selling point, unique customer experience, and lower-cost alternative to NFC-based cashless payments
• Digital & Cashless
• New business
• Green / Sustainable
• Capital Intensity
• Digital & Cashless
• Cashless
• Capital Intensity
15
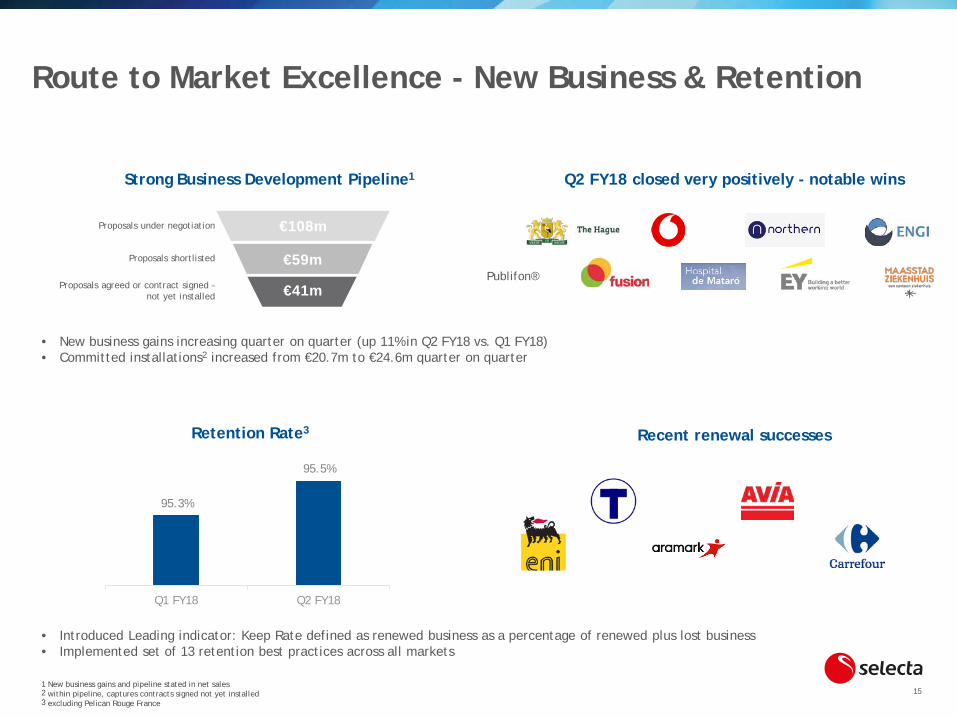
€41m
€108m
€59mPublifon®
Proposals under negotiation
Proposals shortlisted
Proposals agreed or contract signed –not yet installed
Strong Business Development Pipeline1 Q2 FY18 closed very positively - notable wins
Route to Market Excellence - New Business & Retention
Recent renewal successes
1 New business gains and pipeline stated in net sales2 within pipeline, captures contracts signed not yet installed3 excluding Pelican Rouge France
• Introduced Leading indicator: Keep Rate defined as renewed business as a percentage of renewed plus lost business• Implemented set of 13 retention best practices across all markets
• New business gains increasing quarter on quarter (up 11% in Q2 FY18 vs. Q1 FY18) • Committed installations2 increased from €20.7m to €24.6m quarter on quarter
95.3%
95.5%
Q1 FY18 Q2 FY18
Retention Rate3
16
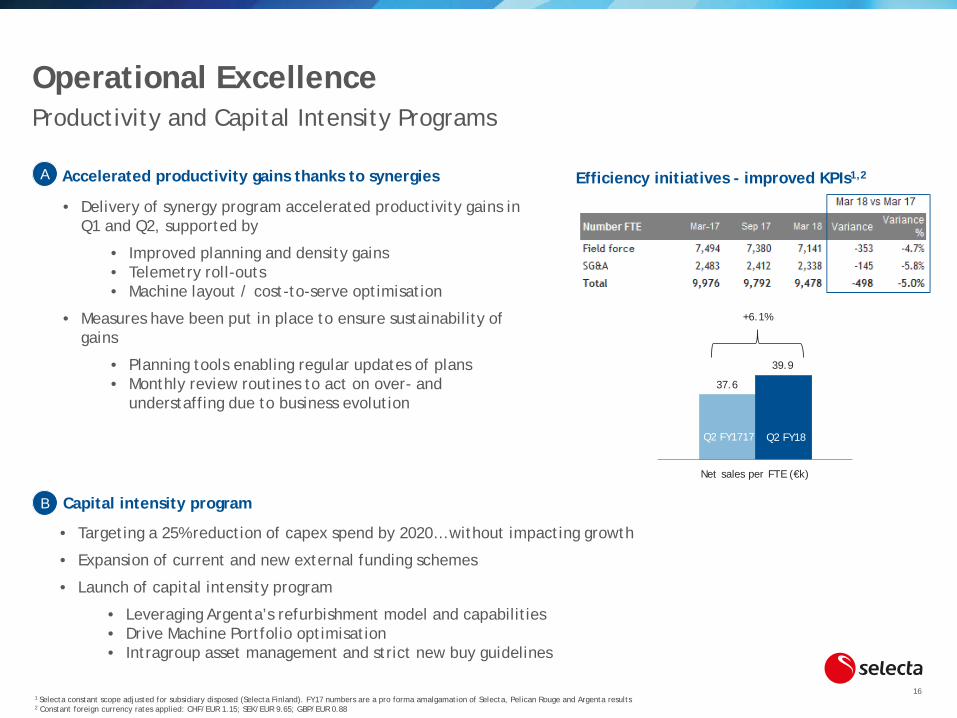
Operational ExcellenceProductivity and Capital Intensity Programs
37.6
39.9
Net sales per FTE (€k)
+6.1%
Q2 FY1717 Q2 FY18
Efficiency initiatives - improved KPIs1,2
1 Selecta constant scope adjusted for subsidiary disposed (Selecta Finland). FY17 numbers are a pro forma amalgamation of Selecta, Pelican Rouge and Argenta results 2 Constant foreign currency rates applied: CHF/EUR 1.15; SEK/EUR 9.65; GBP/EUR 0.88
• Delivery of synergy program accelerated productivity gains in Q1 and Q2, supported by
• Improved planning and density gains• Telemetry roll-outs• Machine layout / cost-to-serve optimisation
• Measures have been put in place to ensure sustainability of gains
• Planning tools enabling regular updates of plans• Monthly review routines to act on over- and
understaffing due to business evolution
Accelerated productivity gains thanks to synergies
Capital intensity program
• Targeting a 25% reduction of capex spend by 2020… without impacting growth
• Expansion of current and new external funding schemes
• Launch of capital intensity program
• Leveraging Argenta’s refurbishment model and capabilities• Drive Machine Portfolio optimisation • Intragroup asset management and strict new buy guidelines
A
B

17
Healthy food and beverages will make your employees smile!
Attract talent with your attractive workspace!
All brought to you by the European leader in unattended self service coffee
and convenience food concepts!
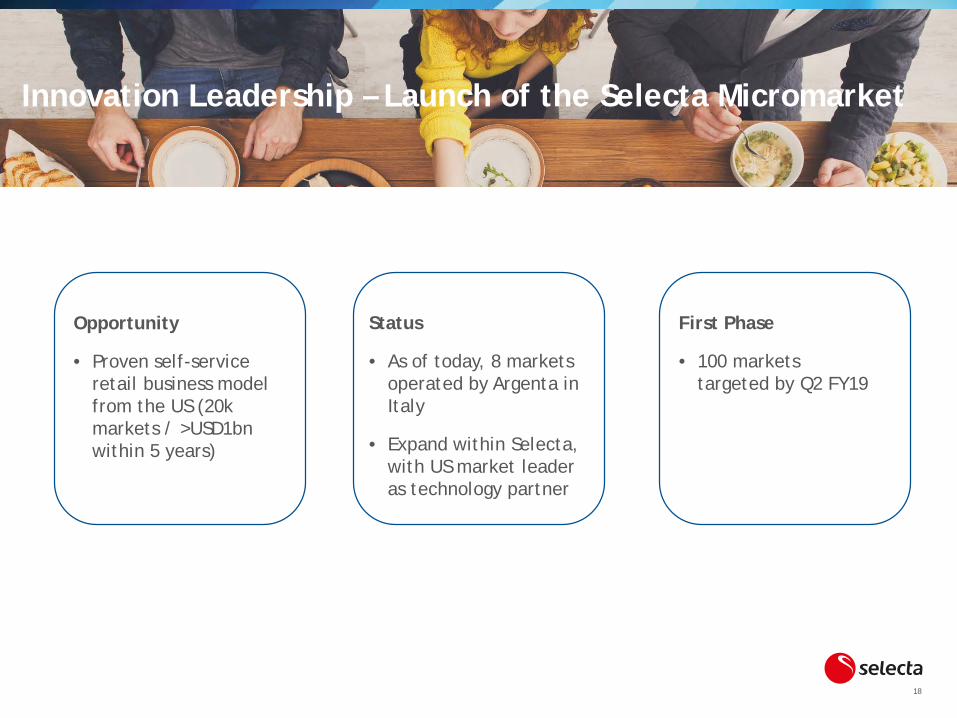
Innovation Leadership – Launch of the Selecta Micromarket
18
Innovation Leadership – Launch of the Selecta Micromarket
Opportunity
• Proven self-service retail business model from the US (20k markets / >USD1bn within 5 years)
Status
• As of today, 8 markets operated by Argenta in Italy
• Expand within Selecta, with US market leader as technology partner
First Phase
• 100 markets targeted by Q2 FY19
19
Content1. Company Overview
2. Key Messages
3. Strategic Initiatives
4. Synergies
5. Financial Results– Full Year
20
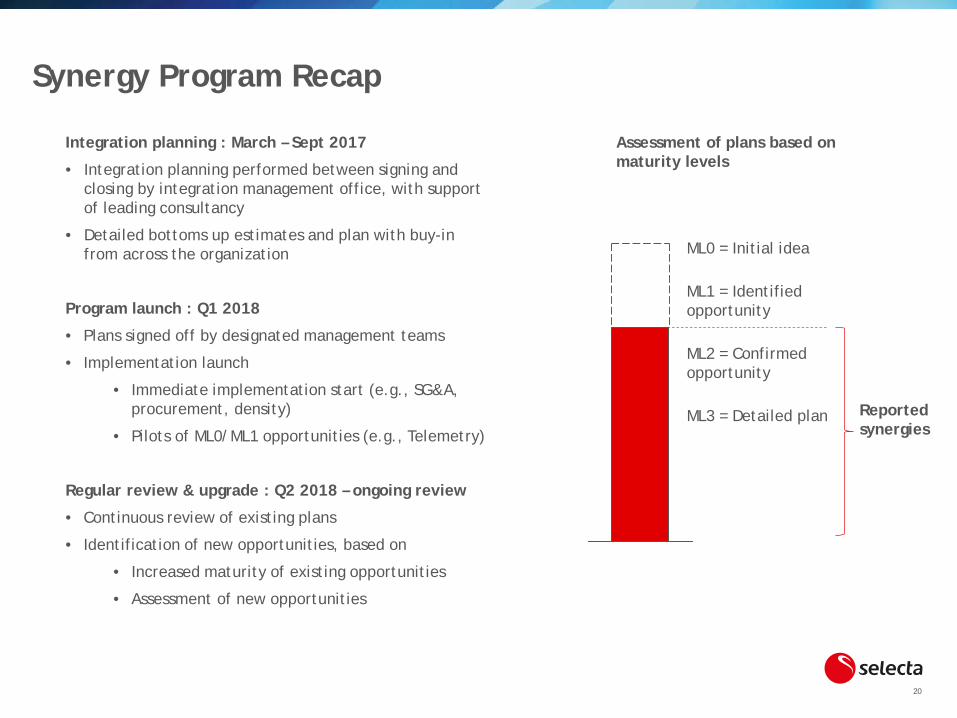
Synergy Program Recap
Integration planning : March – Sept 2017
• Integration planning performed between signing and closing by integration management office, with support of leading consultancy
• Detailed bottoms up estimates and plan with buy-in from across the organization
Program launch : Q1 2018
• Plans signed off by designated management teams
• Implementation launch
• Immediate implementation start (e.g., SG&A, procurement, density)
• Pilots of ML0/ML1 opportunities (e.g., Telemetry)
Regular review & upgrade : Q2 2018 – ongoing review
• Continuous review of existing plans
• Identification of new opportunities, based on
• Increased maturity of existing opportunities
• Assessment of new opportunities
ML0 = Initial idea
ML1 = Identified opportunity
ML2 = Confirmed opportunity
ML3 = Detailed plan
Assessment of plans based on maturity levels
Reported synergies
21
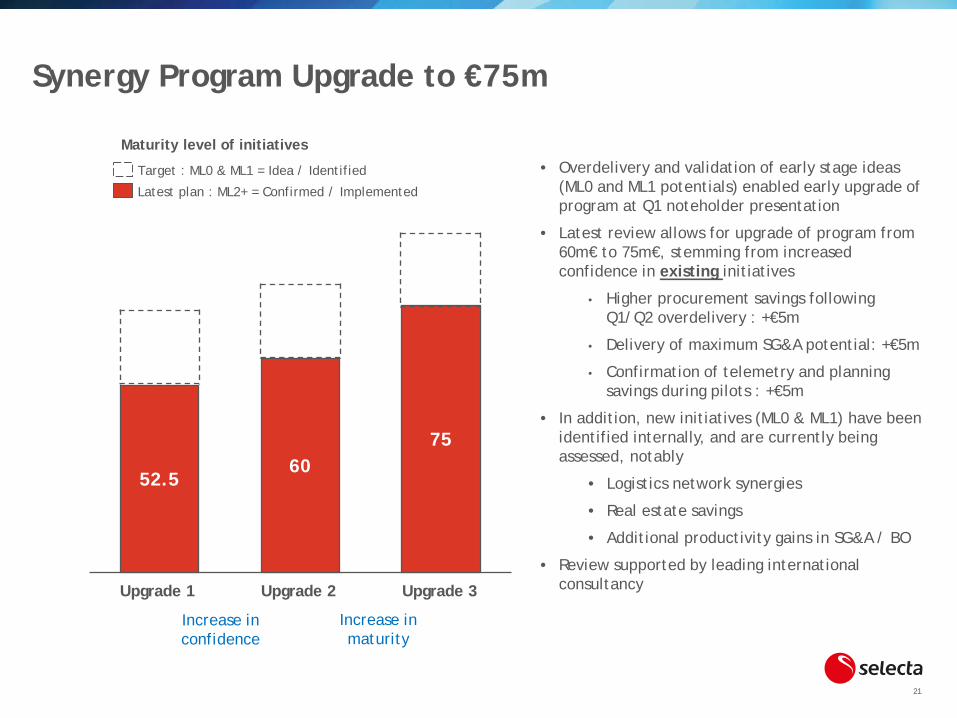
Synergy Program Upgrade to €75m
75.060.0
52.5
Latest plan : ML2+ = Confirmed / Implemented
Target : ML0 & ML1 = Idea / Identified
Maturity level of initiatives
• Overdelivery and validation of early stage ideas (ML0 and ML1 potentials) enabled early upgrade of program at Q1 noteholder presentation
• Latest review allows for upgrade of program from 60m€ to 75m€, stemming from increased confidence in existing initiatives
• Higher procurement savings following Q1/Q2 overdelivery : +€5m
• Delivery of maximum SG&A potential: +€5m
• Confirmation of telemetry and planning savings during pilots : +€5m
• In addition, new initiatives (ML0 & ML1) have been identified internally, and are currently being assessed, notably
• Logistics network synergies
• Real estate savings
• Additional productivity gains in SG&A / BO
• Review supported by leading international consultancyUpgrade 3 Upgrade 2 Upgrade 1
Increase in confidence
Increase in maturity
52.560
75
22
Content1. Company Overview
2. Key Messages
3. Strategic Initiatives
4. Synergies
5. Financial Results– Full Year
231 Selecta constant scope adjusted for subsidiary disposed (Selecta Finland). FY17 numbers are a pro forma amalgamation of Selecta, Pelican Rouge and Argenta results 2 Constant foreign currency rates applied: CHF/EUR 1.15; SEK/EUR 9.65; GBP/EUR 0.88
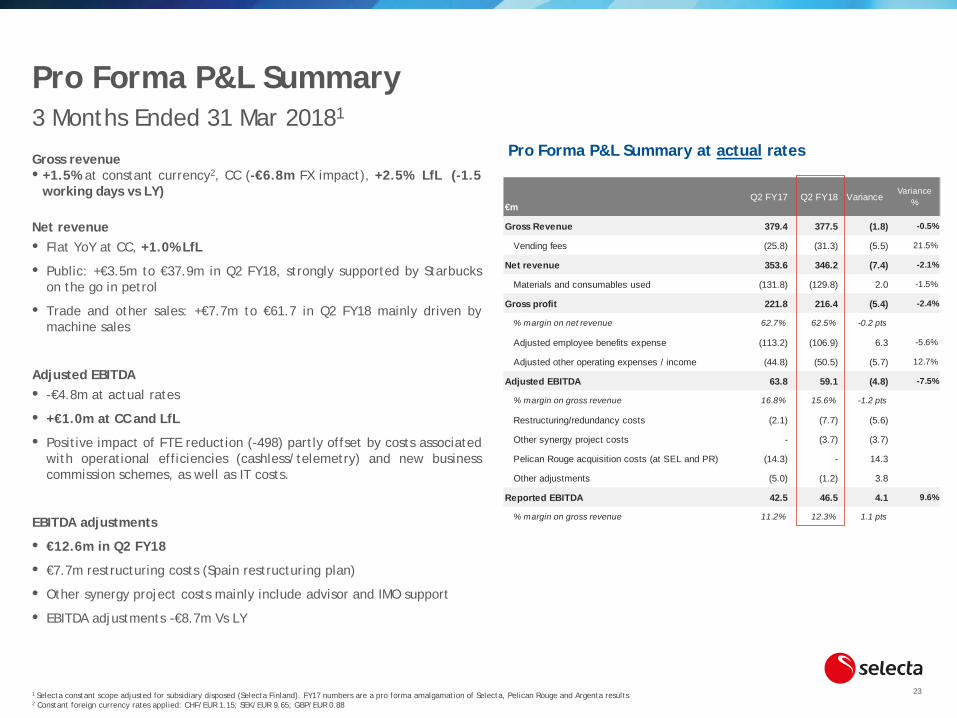
Gross revenue•+1.5% at constant currency2, CC (-€6.8m FX impact), +2.5% LfL (-1.5
working days vs LY)
Net revenue• Flat YoY at CC, +1.0% LfL
• Public: +€3.5m to €37.9m in Q2 FY18, strongly supported by Starbuckson the go in petrol
• Trade and other sales: +€7.7m to €61.7 in Q2 FY18 mainly driven bymachine sales
Adjusted EBITDA• -€4.8m at actual rates
• +€1.0m at CC and LfL
• Positive impact of FTE reduction (-498) partly offset by costs associatedwith operational efficiencies (cashless/telemetry) and new businesscommission schemes, as well as IT costs.
EBITDA adjustments
• €12.6m in Q2 FY18
• €7.7m restructuring costs (Spain restructuring plan)
• Other synergy project costs mainly include advisor and IMO support
• EBITDA adjustments -€8.7m Vs LY
Pro Forma P&L Summary at actual rates
€m
Gross Revenue 379.4 377.5 (1.8) -0.5%
Vending fees (25.8) (31.3) (5.5) 21.5%
Net revenue 353.6 346.2 (7.4) -2.1%
Materials and consumables used (131.8) (129.8) 2.0 -1.5%
Gross profit 221.8 216.4 (5.4) -2.4%
% margin on net revenue 62.7% 62.5% -0.2 pts
Adjusted employee benefits expense (113.2) (106.9) 6.3 -5.6%
Adjusted other operating expenses / income (44.8) (50.5) (5.7) 12.7%
Adjusted EBITDA 63.8 59.1 (4.8) -7.5%
% margin on gross revenue 16.8% 15.6% -1.2 pts
Restructuring/redundancy costs (2.1) (7.7) (5.6)
Other synergy project costs - (3.7) (3.7)
Pelican Rouge acquisition costs (at SEL and PR) (14.3) - 14.3
Other adjustments (5.0) (1.2) 3.8
Reported EBITDA 42.5 46.5 4.1 9.6%
% margin on gross revenue 11.2% 12.3% 1.1 pts
Variance %Q2 FY17 Q2 FY18 Variance
Pro Forma P&L Summary 3 Months Ended 31 Mar 20181
24
Net revenue by region3
1 Selecta constant scope adjusted for subsidiary disposed (Selecta Finland). FY17 numbers are a pro forma amalgamation of Selecta, Pelican Rouge and Argenta results 2 Constant foreign currency rates applied: CHF/EUR 1.15; SEK/EUR 9.65; GBP/EUR 0.883 Revenue net of vending fees
Adjusted EBITDA by region
Net Revenue by region• Flat YoY at constant currency and constant scope basis1
• Growth in Switzerland (+3.0%), Bene (+3.1%), Italy (+0.7%), Spain(+2.1%) and Sweden (+0.4%) offset by decrease in turnaround marketslike France (-7.1%) and the UK (-1.4%)
• South, UK & Ireland: +0.2%, driven by Italy and Spain despite two lessworking days, Spanish strike (-0.9m), offset by the UK undergoingtransformation and impacted by prior year losses at Pelican Rougehaving a full impact this year
• Central: -2.0% reported but -0.8% LfL, dynamic growth in Switzerland(+3.0%) offset by France impacted by the on-going businesstransformation
• North: Net revenue increased by +2.4% driven by trade machine salescompensating private sales volume softness
Adjusted EBITDA by region• -3.3m vs LY at CC, but +€1.0m 1.6% on LfL.
• South, UK & Ireland: strong personnel synergies in the UK offset byhigher overhead costs in Italy (phasing effect of supplier bonusesreceived LY)
• Central: -€3.0m, private sales volume impact mitigated by personnelexpenses savings
• North: -€1.5m mainly due to the transfer pricing adjustmentsbenefitting other regions.
Result by Region @ Constant Rates2
3 Months Ended 31 Mar 20181
25
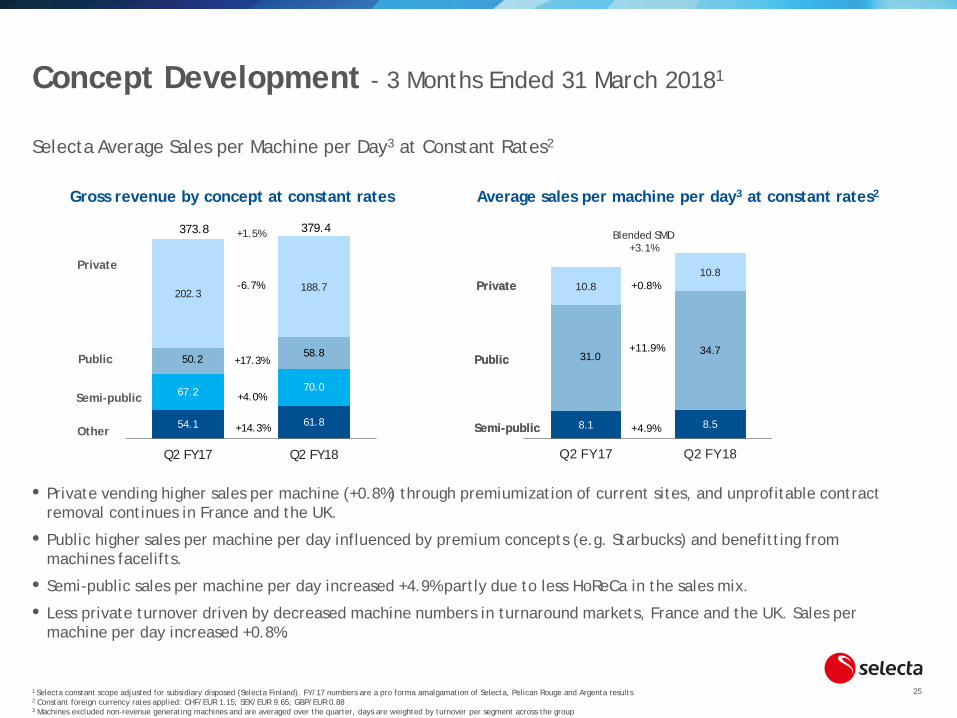
Concept Development - 3 Months Ended 31 March 20181
Average sales per machine per day3 at constant rates2
Selecta Average Sales per Machine per Day3 at Constant Rates2
1 Selecta constant scope adjusted for subsidiary disposed (Selecta Finland). FY/17 numbers are a pro forma amalgamation of Selecta, Pelican Rouge and Argenta results 2 Constant foreign currency rates applied: CHF/EUR 1.15; SEK/EUR 9.65; GBP/EUR 0.883 Machines excluded non-revenue generating machines and are averaged over the quarter, days are weighted by turnover per segment across the group
Gross revenue by concept at constant rates
Blended SMD +3.1%
54.1 61.8
67.2 70.0
50.2 58.8
202.3188.7
Q2 FY17 Q2 FY18
+4.0%
373.8 379.4
+14.3%
+17.3%
-6.7%
Other
Semi-public
Public
Private
+1.5%
8.1 8.5
31.0 34.7
10.810.8
Q2 FY17 Q2 FY18
+4.9%
+11.9%
+0.8%
Semi-public
Public
Private
Semi-public
Public
Private
• Private vending higher sales per machine (+0.8%) through premiumization of current sites, and unprofitable contract removal continues in France and the UK.
• Public higher sales per machine per day influenced by premium concepts (e.g. Starbucks) and benefitting from machines facelifts.
• Semi-public sales per machine per day increased +4.9% partly due to less HoReCa in the sales mix.
• Less private turnover driven by decreased machine numbers in turnaround markets, France and the UK. Sales per machine per day increased +0.8%.
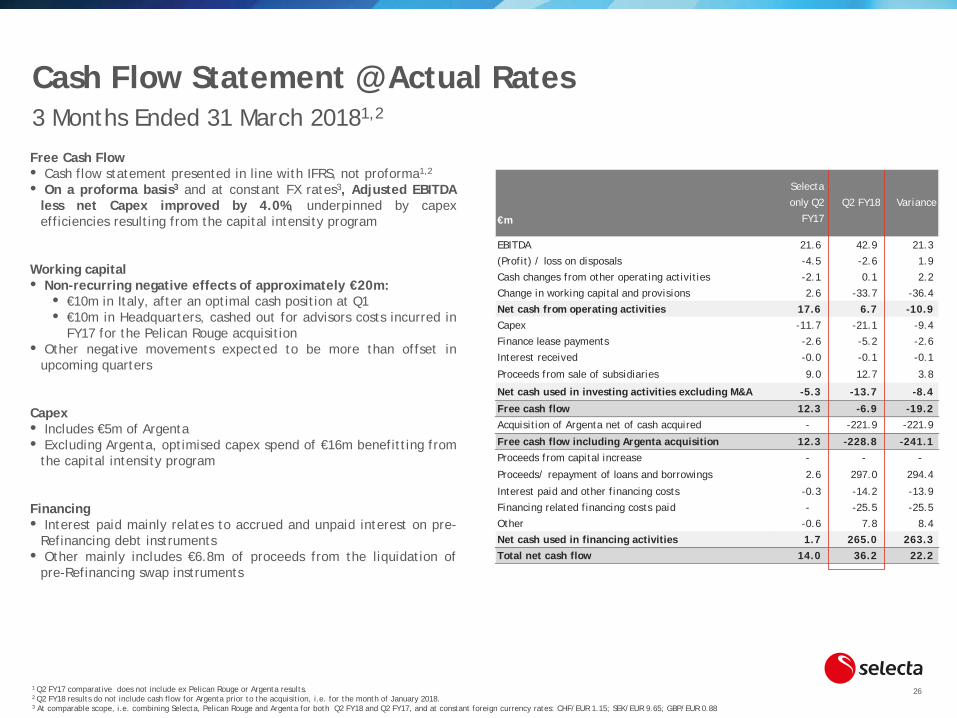
261 Q2 FY17 comparative does not include ex Pelican Rouge or Argenta results. 2 Q2 FY18 results do not include cash flow for Argenta prior to the acquisition, i.e. for the month of January 2018. 3 At comparable scope, i.e. combining Selecta, Pelican Rouge and Argenta for both Q2 FY18 and Q2 FY17, and at constant foreign currency rates: CHF/EUR 1.15; SEK/EUR 9.65; GBP/EUR 0.88
Cash Flow Statement @ Actual Rates 3 Months Ended 31 March 20181,2
Free Cash Flow• Cash flow statement presented in line with IFRS, not proforma1,2
• On a proforma basis3 and at constant FX rates3, Adjusted EBITDAless net Capex improved by 4.0%, underpinned by capexefficiencies resulting from the capital intensity program
Working capital• Non-recurring negative effects of approximately €20m:
• €10m in Italy, after an optimal cash position at Q1• €10m in Headquarters, cashed out for advisors costs incurred in
FY17 for the Pelican Rouge acquisition• Other negative movements expected to be more than offset in
upcoming quarters
Capex• Includes €5m of Argenta• Excluding Argenta, optimised capex spend of €16m benefitting from
the capital intensity program
Financing• Interest paid mainly relates to accrued and unpaid interest on pre-
Refinancing debt instruments• Other mainly includes €6.8m of proceeds from the liquidation of
pre-Refinancing swap instruments
€m
EBITDA 21.6 42.9 21.3
(Profit) / loss on disposals -4.5 -2.6 1.9
Cash changes from other operating activities -2.1 0.1 2.2
Change in working capital and provisions 2.6 -33.7 -36.4
Net cash from operating activities 17.6 6.7 -10.9 Capex -11.7 -21.1 -9.4
Finance lease payments -2.6 -5.2 -2.6
Interest received -0.0 -0.1 -0.1
Proceeds from sale of subsidiaries 9.0 12.7 3.8
Net cash used in investing activities excluding M&A -5.3 -13.7 -8.4
Free cash flow 12.3 -6.9 -19.2 Acquisition of Argenta net of cash acquired - -221.9 -221.9
Free cash flow including Argenta acquisition 12.3 -228.8 -241.1 Proceeds from capital increase - - -
Proceeds/ repayment of loans and borrowings 2.6 297.0 294.4
Interest paid and other financing costs -0.3 -14.2 -13.9
Financing related financing costs paid - -25.5 -25.5
Other -0.6 7.8 8.4
Net cash used in financing activities 1.7 265.0 263.3 Total net cash flow 14.0 36.2 22.2
Selecta
only Q2
FY17
Q2 FY18 Variance
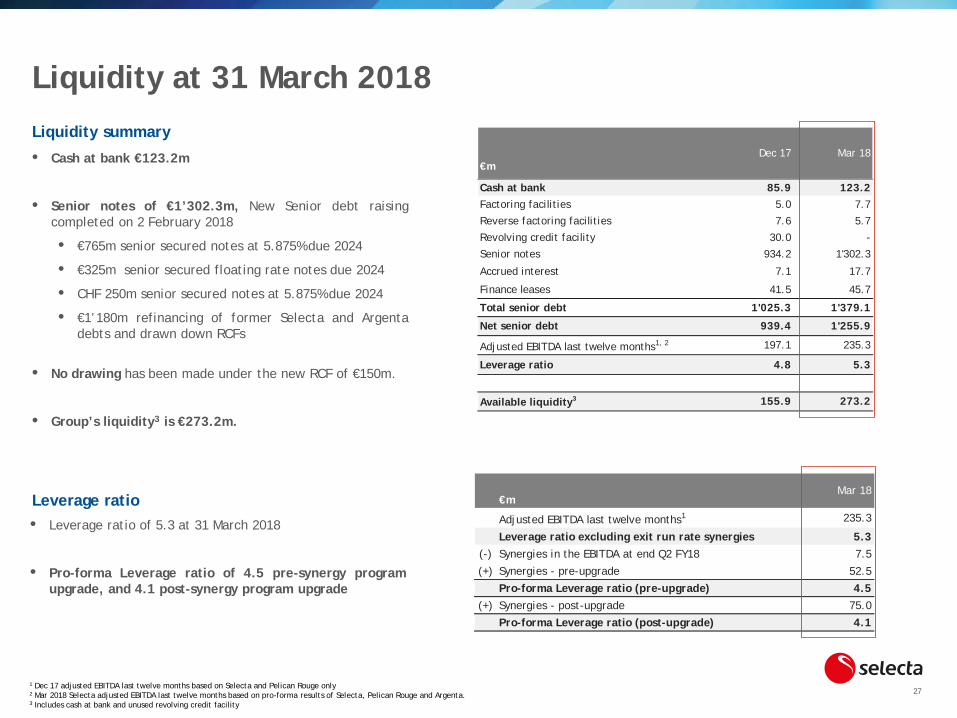
271 Dec 17 adjusted EBITDA last twelve months based on Selecta and Pelican Rouge only2 Mar 2018 Selecta adjusted EBITDA last twelve months based on pro-forma results of Selecta, Pelican Rouge and Argenta.3 Includes cash at bank and unused revolving credit facility
Liquidity at 31 March 2018Liquidity summary
Leverage ratio• Leverage ratio of 5.3 at 31 March 2018
• Pro-forma Leverage ratio of 4.5 pre-synergy programupgrade, and 4.1 post-synergy program upgrade
• Cash at bank €123.2m
• Senior notes of €1’302.3m, New Senior debt raisingcompleted on 2 February 2018
• €765m senior secured notes at 5.875% due 2024
• €325m senior secured floating rate notes due 2024
• CHF 250m senior secured notes at 5.875% due 2024
• €1’180m refinancing of former Selecta and Argentadebts and drawn down RCFs
• No drawing has been made under the new RCF of €150m.
• Group’s liquidity3 is €273.2m.
€m
Cash at bank 85.9 123.2Factoring facilities 5.0 7.7
Reverse factoring facilities 7.6 5.7
Revolving credit facility 30.0 -
Senior notes 934.2 1'302.3
Accrued interest 7.1 17.7
Finance leases 41.5 45.7
Total senior debt 1'025.3 1'379.1
Net senior debt 939.4 1'255.9
Adjusted EBITDA last twelve months1, 2 197.1 235.3
Leverage ratio 4.8 5.3
Available liquidity3 155.9 273.2
Dec 17 Mar 18
€m
Adjusted EBITDA last twelve months1 235.3
Leverage ratio excluding exit run rate synergies 5.3(-) Synergies in the EBITDA at end Q2 FY18 7.5
(+) Synergies - pre-upgrade 52.5
Pro-forma Leverage ratio (pre-upgrade) 4.5(+) Synergies - post-upgrade 75.0
Pro-forma Leverage ratio (post-upgrade) 4.1
Mar 18
28
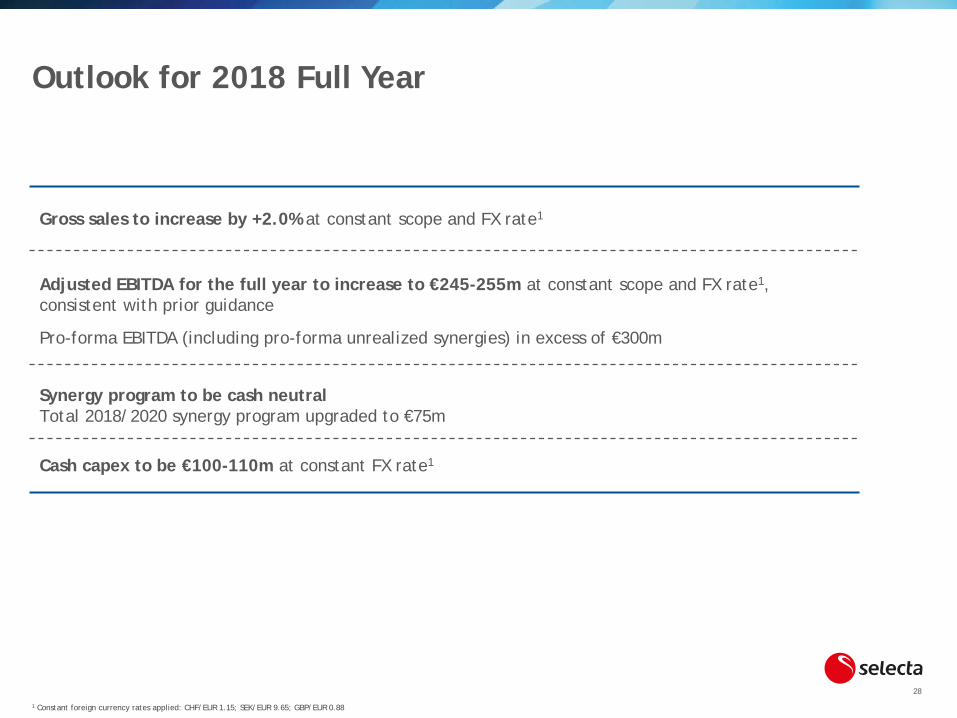
Outlook for 2018 Full Year
1 Constant foreign currency rates applied: CHF/EUR 1.15; SEK/EUR 9.65; GBP/EUR 0.88
Gross sales to increase by +2.0% at constant scope and FX rate1
Adjusted EBITDA for the full year to increase to €245-255m at constant scope and FX rate1, consistent with prior guidance
Pro-forma EBITDA (including pro-forma unrealized synergies) in excess of €300m
Synergy program to be cash neutralTotal 2018/2020 synergy program upgraded to €75m
Cash capex to be €100-110m at constant FX rate1