q2 i h1 2017 hapag-lloyd ag investor report · 4 investor reporti q2 / h1 2017 uasc ltd. and its...
TRANSCRIPT
1 January to 30 June 2017
Q2 I H1 2017
Investor Report
Hapag-Lloyd AG

1) The comparison of figures refers to the prior year period 1.1.-30.6.20162) MFO = Marine Fuel Oil3) MDO = Marine Diesel Oil4) The comparison of figures refers to the balance sheet date 31.12.20165) incl. Restricted Cash booked as other assets: USD 71.6 million as of 30.06.2017, USD 19.7 million as of 31.12.2016
Disclaimer: This half-year financial report contains statements concerning future developments at Hapag-Lloyd. Due to market fluctuations, the development of the competitive situation, world market prices for commodities, and changes in exchange rates and the economic environment, the actual results may differ considerably from these forecasts. Hapag-Lloyd neither intends nor undertakes to update forward-looking statements to adjust them for events or developments which occur after the date of this report. UASC’s Ltd. and its subsidiaries (in the following mentioned as UASC Group as well) have been included in the figures from the date control was transferred on 24 May 2017.The key figures used are therefore only comparable with the previous year to a limited extent.
This report was published on 29 August 2017.
SUMMARY OF HAPAG-LLOYD KEY FIGURES
KEY OPERATING FIGURES 1) Q2 2017 Q2 2016 H1 2017 H1 2016 % Change
Total vessels, of which 219 170 219 170 29%
own vessels 112 70 112 70 60%
leased vessels 8 3 8 3 167%
chartered vessels 99 97 99 97 2%
Aggregate capacity of vessels TTEU 1,557 952 1,557 952 64%
Aggregate container capacity TTEU 2,287 1,513 2,287 1,513 7%
Bunker price (MFO, average for the period) 2) USD/t 300 182 300 180 59%
Bunker price (MDO, average for the period) 3) USD/t 473 375 471 372 27%
Freight rate (average for the period) USD/TEU 1,064 1,019 1,056 1,042 1%
Transport volume TTEU 2,287 1,892 4,221 3,703 14%
Revenue million USD 2,629 2,088 4,900 4,212 16%
Transport expenses million USD 2,130 1,805 4,036 3,561 13%
EBITDA million USD 253 83 393 219 80%
EBIT million USD 93 – 50 97 – 44 n.m.
Group profit / loss million USD 18 – 111 -49 – 158 n.m.
Cash flow from operating activities million USD 174 70 332 226 47%
Investment in property, plant and equipment million USD 78 115 200 220 – 9%
KEY RETURN FIGURES 1)
EBITDA margin (EBITDA / revenue) 9.6% 4.0% 8.0% 5.2% 2.8 ppt
EBIT margin (EBIT / revenue) 3.5% – 2.4% 1.9% – 1.0% 2.9 ppt
KEY BALANCE SHEET FIGURES AS AT 30 JUNE 4)
Balance sheet total million USD 18,024 11,965 18,024 11,965 51%
Equity million USD 6,763 5,342 6,763 5,342 27%
Equity ratio (equity / balance sheet total) 37.5% 44.6% 37.5% 44.6% – 7.1 ppt
Borrowed capital million USD 11,261 6,624 11,261 6,624 70%
KEY FINANCIAL FIGURES AS AT 30 JUNE 4)
Financial debt million USD 8,339 4,415 8,339 4,415 89%
Cash and cash equivalents million USD 860 602 860 602 43%
Net debt (financial debt – cash and cash equivalents) 5) million USD 7,408 3,793 7,408 3,793 95%
Gearing (net debt / equity) 109.5% 71.0% 109.5% 71.0% 38.5 ppt
Liquidity reserve 1,320 802 1,320 802 65%
NUMBER OF EMPLOYEES AS AT 30 JUNE
Employees at sea 1,675 1,498 1,675 1,498 12%
Employees on land 10,910 7,807 10,910 7,807 40%
HAPAG-LLOYD TOTAL 12,585 9,305 12,585 9,305 35%
The UASC Group has been included in Hapag-Lloyd AG’s consolidated financial statements from the date control was transferred on 24 May 2017. The presented figures include the effects of the transaction from this date and can therefore only be compared to the prior year’s figures to a limited extent.
3
Q2 / H1 2017 I INVESTOR REPORT
1. Highlights 5
2. Sector-specific conditions 6
3. Structure of Hapag-Lloyd’s vessel and container fleet 7
4. Group earnings position 8
4.1 Freight rate per trade 8
4.2 Transport volume per trade 9
4.3 Revenue per trade 9
4.4 Consolidated income statement 10
4.5 Transport expenses 11
4.6 Earnings position 13
5. Group net asset position 14
6. Group financial position 16
6.1 Developments in cash and cash equivalents 16
6.2 Financial position 17
7. Events after the balance sheet date 19
8. Revised outlook 19
9. Combined entity 21
10. Financial calendar 2017 26
11. Disclaimer 27
CONTENTS

4
INVESTOR REPORT I Q2 / H1 2017
UASC Ltd. and its subsidiaries (UASC Group) were consolidated on 24 May 2017 and are included in the con-
solidated financial statements of Hapag-Lloyd AG as at 30 June 2017. This enlarged the group of consolidated
subsidiaries from 82 companies to 181 companies. As such, the net asset, financial and earnings position
figures for the first half of 2017 can only be compared with those of previous years to a limited extent. This
pertains to the Group’s net asset and financial position in particular.
Unless stated otherwise, the figures for the first half of 2016 relate to Hapag-Lloyd not including the UASC Group.
The information provided in this Investor Report is based on a calculation of US dollar figures, derived from
the figures published in EUR within the respective Interim or Annual Report of Hapag-Lloyd AG (available via
https://www.hapag-lloyd.com/en/ir/publications/financial-report.html).
The US dollar figures presented herein have not been reviewed by auditors and are supplemental information
to the respective Interim or Annual Report of Hapag-Lloyd AG for capital market participants. The respective
Interim and Annual Reports of Hapag-Lloyd AG remain the prevailing and legally binding documents.
Hapag-Lloyd AG conducts its container shipping business in an international business environment in which
transactions are invoiced mainly in US dollars and payment procedures are handled in US dollars. This relates
not only to operating business transactions, but also to investment activities, an example being the purchase,
chartering and rental of vessels and containers, as well as the corresponding financing of investments.
Therefore, the functional currency of Hapag-Lloyd AG is the US dollar. However, the reporting currency of
Hapag-Lloyd AG is the euro.
For reconciliation to the Interim Report H1 2017, please find below the respective exchange rates:
• Values for Q1 2016 have been converted at the respective Q1 2016 exchange rates
• Values for Q2 2016 have been calculated by subtracting the Q1 2016 figures from the H1 2016 figures
• Values for H1 2016 have been converted at the respective H1 2016 exchange rates
• Values for Q1 2017 have been converted at the respective Q1 2017 exchange rates
• Values for Q2 2017 have been calculated by subtracting the Q1 2017 figures from the H1 2017 figures
• Values for H1 2017 have been converted for Hapag-Lloyd (excl. UASC) at the average exchange rate for
January to June 2017 and for UASC since consolidation 24 May 2017 at the average exchange rate for
June 2017.
This report contains statements concerning future developments at Hapag-Lloyd AG. Due to market fluc-
tuations, the development of the competitive situation, market prices for commodities, and changes in ex -
change rates and the economic environment, the actual results may differ considerably from these forecasts.
Hapag-Lloyd AG neither intends nor undertakes to update forward-looking statements to adjust them for
events or developments, which occur after the date of this report.
IMPORTANT NOTICE
EXCHANGE RATES
Closing rate Average rate
HLAG AG UASC Group
per EUR 30.06.2017 31.03.2017 30.06.2016 H1 2017 June 17 Q1 2017 H1 2016 Q1 2016
US dollars 1.1405 1.0681 1.1146 1.0826 1.1237 1.0651 1.1127 1.103
5
Q2 / H1 2017 I INVESTOR REPORT
1. HIGHLIGHTS
• The merger with UASC was successfully completed on 24 May 2017 and is expected to provide the
following advantages:
o Strengthened market position as one of the top five players of a container shipping industry which
continues to consolidate
o Enhanced market presence in attractive Middle East trade and solid position in all trades
o Efficient and young fleet with a low level of investment needed in the future
o Annual synergies of USD 435 million fully starting in 2019, strong ramp up already in 2018
o Strong partner in THE Alliance
o Strong organic increase in transport volume of 7.3% in H1 2017. UASC added 248 TTEU of transport
volume since first time consolidation
• Following the acquisition of UASC and reflecting the first optimisation of the combined fleet Hapag-Lloyd’s
fleet comprised 219 container ships as at 30 June 2017. The TEU capacity of the entire Hapag-Lloyd fleet
increased to 1,557,013 TEU
• Moderate recovery of freight rate gains continues in Q2 2017. H1 2017 freight rate of 1,068 USD/TEU
exceeds previous year’s level. Including UASC the combined freight rate stands at 1,056 USD/TEU
• Transport expenses (excl. bunker cost) increase less than volume growth as a result of further cost
savings, e.g. by replacing charter agreements by more favourable contracts and benefitting from addi-
tional synergies and savings from cost cutting measures that have now been implemented in full
• UASC integration is well on track with sizeable initial optimisation measures already implemented in the
areas of network and ship systems. Following the completed takeover of UASC’s container shipping
activities, Hapag-Lloyd will not invest in new ship systems in the next few years. The joint fleet should
make it possible to utilise the medium-term expansion opportunities resulting from market growth and to
realise economies of scale in ship operations
• The first-time consolidation of UASC generated one-off income of USD 52.3 million at Hapag-Lloyd. At
the same time, costs for implementing the restructuring of the UASC Group in relation to the operational
integration of UASC’s business activities into Hapag-Lloyd totalled USD 46.0 million
• Clearly positive EBITDA of USD 393.1 million in first six months of 2017 (H1 2016: USD 218.8 million)
• Positive EBIT of USD 96.5 million clearly above previous year’s level (H1 2016: USD – 44.2 million)
• Strong liquidity reserve totalled USD 1.3 billion (as at 30 June 2017)
• Equity ratio decreases to 37.5% due to the substantial increase of the balance sheet total
6
INVESTOR REPORT I Q2 / H1 2017
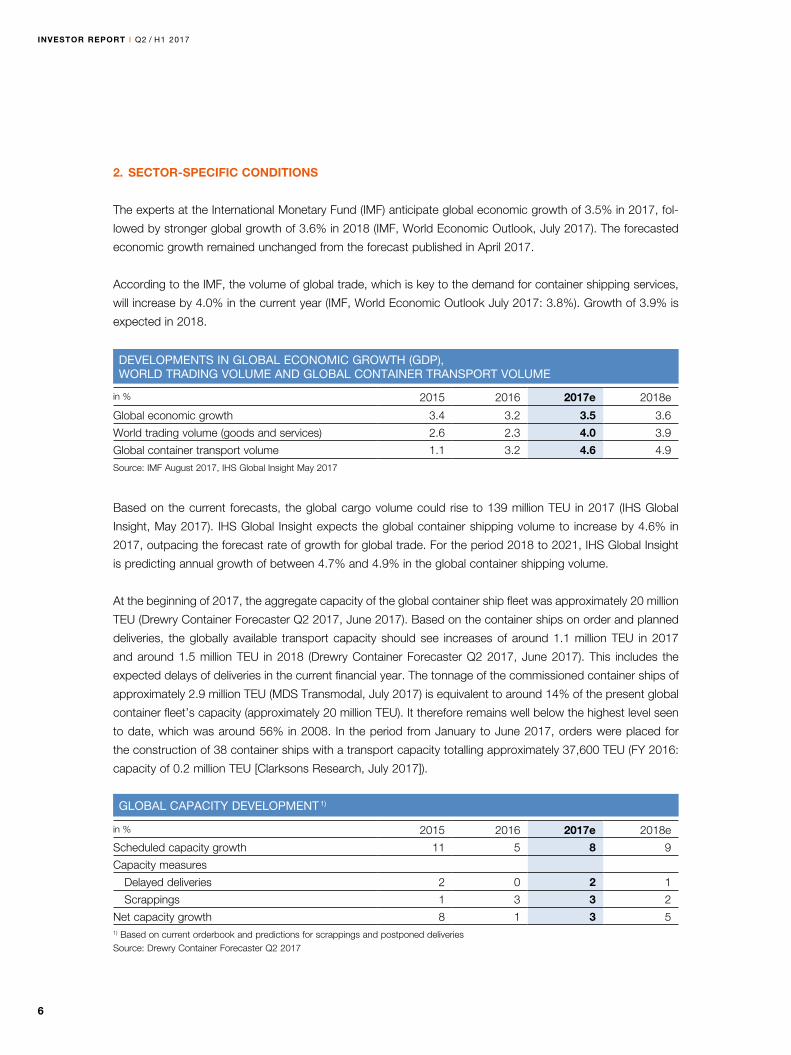
2. SECTOR-SPECIFIC CONDITIONS
The experts at the International Monetary Fund (IMF) anticipate global economic growth of 3.5% in 2017, fol-
lowed by stronger global growth of 3.6% in 2018 (IMF, World Economic Outlook, July 2017). The forecasted
economic growth remained unchanged from the forecast published in April 2017.
According to the IMF, the volume of global trade, which is key to the demand for container shipping services,
will increase by 4.0% in the current year (IMF, World Economic Outlook July 2017: 3.8%). Growth of 3.9% is
expected in 2018.
Based on the current forecasts, the global cargo volume could rise to 139 million TEU in 2017 (IHS Global
Insight, May 2017). IHS Global Insight expects the global container shipping volume to increase by 4.6% in
2017, outpacing the forecast rate of growth for global trade. For the period 2018 to 2021, IHS Global Insight
is predicting annual growth of between 4.7% and 4.9% in the global container shipping volume.
At the beginning of 2017, the aggregate capacity of the global container ship fleet was approximately 20 million
TEU (Drewry Container Forecaster Q2 2017, June 2017). Based on the container ships on order and planned
deliveries, the globally available transport capacity should see increases of around 1.1 million TEU in 2017
and around 1.5 million TEU in 2018 (Drewry Container Forecaster Q2 2017, June 2017). This includes the
expected delays of deliveries in the current financial year. The tonnage of the commissioned container ships of
approximately 2.9 million TEU (MDS Transmodal, July 2017) is equivalent to around 14% of the present global
container fleet’s capacity (approximately 20 million TEU). It therefore remains well below the highest level seen
to date, which was around 56% in 2008. In the period from January to June 2017, orders were placed for
the construction of 38 container ships with a transport capacity totalling approximately 37,600 TEU (FY 2016:
capacity of 0.2 million TEU [Clarksons Research, July 2017]).
DEVELOPMENTS IN GLOBAL ECONOMIC GROWTH (GDP), WORLD TRADING VOLUME AND GLOBAL CONTAINER TRANSPORT VOLUME
in % 2015 2016 2017e 2018e
Global economic growth 3.4 3.2 3.5 3.6
World trading volume (goods and services) 2.6 2.3 4.0 3.9
Global container transport volume 1.1 3.2 4.6 4.9
Source: IMF August 2017, IHS Global Insight May 2017
GLOBAL CAPACITY DEVELOPMENT 1)
in % 2015 2016 2017e 2018e
Scheduled capacity growth 11 5 8 9
Capacity measures
Delayed deliveries 2 0 2 1
Scrappings 1 3 3 2
Net capacity growth 8 1 3 51) Based on current orderbook and predictions for scrappings and postponed deliveries Source: Drewry Container Forecaster Q2 2017
7
Q2 / H1 2017 I INVESTOR REPORT
Based on figures from MDS Transmodal, a total of 70 container ships with a transport capacity of approximately
578,000 TEU were placed into service in the first six months of 2017 (H1 2016: 77 ships with a transport
capacity of approximately 518,000 million TEU). In the future, the actual growth in the global container ship
fleet’s transport capacity is expected to be lower than the projected nominal increase, as old and inefficient
ships are scrapped, deliveries of newbuilds are postponed and slow steaming (reducing the speed at which
services operate) is used. According to Drewry (Container Forecaster Q2 2017), the scrapping of inefficient
ships reached a record high of 659,000 TEU in 2016 (2013: 444,000 TEU). Drewry expects 500,000 TEU to
be scrapped in 2017.
Idle capacity fell to around 0.5 million TEU at the end of June 2017 – approximately 69% lower than the current
record of around 1.6 million TEU recorded in October 2016 (Alphaliner, Weekly Issue 29, July 2017). This re-
duction stemmed from the large number of vessels which were scrapped and the rise in demand for chartered
ships. The majority of idle ships have a capacity of up to 5,100 TEU.
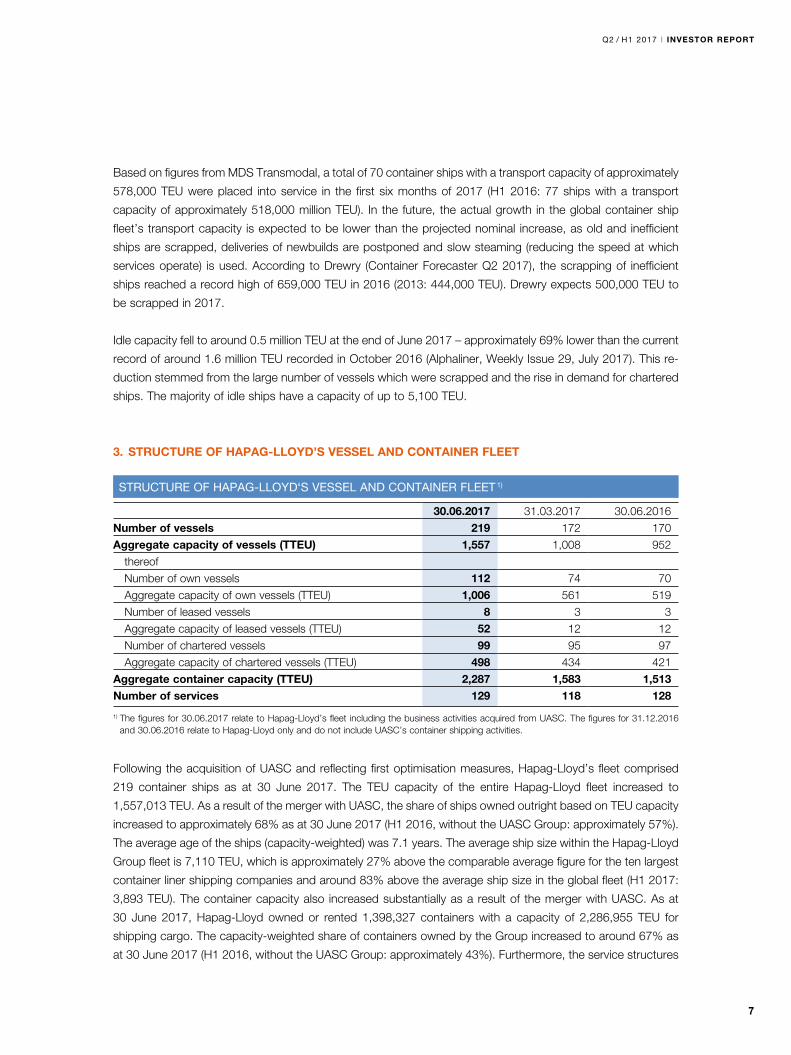
3. STRUCTURE OF HAPAG-LLOYD’S VESSEL AND CONTAINER FLEET
Following the acquisition of UASC and reflecting first optimisation measures, Hapag-Lloyd’s fleet comprised
219 container ships as at 30 June 2017. The TEU capacity of the entire Hapag-Lloyd fleet increased to
1,557,013 TEU. As a result of the merger with UASC, the share of ships owned outright based on TEU capacity
increased to approximately 68% as at 30 June 2017 (H1 2016, without the UASC Group: approximately 57%).
The average age of the ships (capacity-weighted) was 7.1 years. The average ship size within the Hapag-Lloyd
Group fleet is 7,110 TEU, which is approximately 27% above the comparable average figure for the ten largest
container liner shipping companies and around 83% above the average ship size in the global fleet (H1 2017:
3,893 TEU). The container capacity also increased substantially as a result of the merger with UASC. As at
30 June 2017, Hapag-Lloyd owned or rented 1,398,327 containers with a capacity of 2,286,955 TEU for
shipping cargo. The capacity-weighted share of containers owned by the Group increased to around 67% as
at 30 June 2017 (H1 2016, without the UASC Group: approximately 43%). Furthermore, the service structures
STRUCTURE OF HAPAG-LLOYD‘S VESSEL AND CONTAINER FLEET 1)
30.06.2017 31.03.2017 30.06.2016
Number of vessels 219 172 170
Aggregate capacity of vessels (TTEU) 1,557 1,008 952
thereof
Number of own vessels 112 74 70
Aggregate capacity of own vessels (TTEU) 1,006 561 519
Number of leased vessels 8 3 3
Aggregate capacity of leased vessels (TTEU) 52 12 12
Number of chartered vessels 99 95 97
Aggregate capacity of chartered vessels (TTEU) 498 434 421
Aggregate container capacity (TTEU) 2,287 1,583 1,513Number of services 129 118 128
1) The figures for 30.06.2017 relate to Hapag-Lloyd’s fleet including the business activities acquired from UASC. The figures for 31.12.2016 and 30.06.2016 relate to Hapag-Lloyd only and do not include UASC’s container shipping activities.
8
INVESTOR REPORT I Q2 / H1 2017
of both companies have already been merged and the first steps towards optimising the new structures have
taken place. As at 30 June 2017, Hapag-Lloyd (with the UASC Group) now offers over 129 services. Prior to
the merger, Hapag-Lloyd had a global network of 118 services (31 March 2017). UASC offered its customers
a network of 45 services.
In the first half of 2017, Hapag-Lloyd used three chartered ships to reposition empty containers. Together, the
vessels had a capacity of 10,611 TEU. As the ships were not employed in a liner service, they are not included
in the above fleet data.
The final vessel from Hapag-Lloyd’s original order book of five container ships, each with a capacity of 10,500
TEU (incl. 2,100 slots for reefer containers), was delivered in April 2017. One of two ships from UASC’s current
order book with a capacity of 15,000 TEU each will be delivered to Hapag-Lloyd on 27 July 2017. The second
ship will be delivered in the second half of 2017.
4. GROUP EARNINGS POSITION
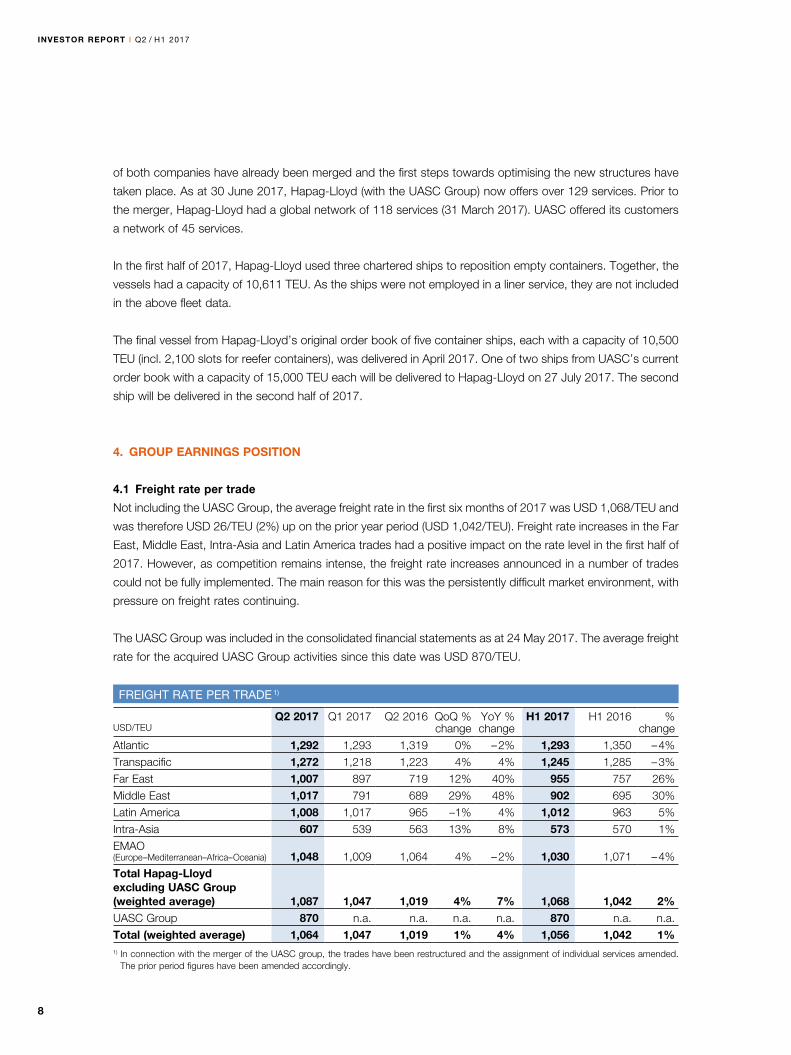
4.1 Freight rate per trade
Not including the UASC Group, the average freight rate in the first six months of 2017 was USD 1,068/TEU and
was therefore USD 26/TEU (2%) up on the prior year period (USD 1,042/TEU). Freight rate increases in the Far
East, Middle East, Intra-Asia and Latin America trades had a positive impact on the rate level in the first half of
2017. However, as competition remains intense, the freight rate increases announced in a number of trades
could not be fully implemented. The main reason for this was the persistently difficult market environment, with
pressure on freight rates continuing.
The UASC Group was included in the consolidated financial statements as at 24 May 2017. The average freight
rate for the acquired UASC Group activities since this date was USD 870/TEU.
FREIGHT RATE PER TRADE 1)
USD/TEU
Q2 2017 Q1 2017 Q2 2016 QoQ % change
YoY % change
H1 2017 H1 2016 % change
Atlantic 1,292 1,293 1,319 0% – 2% 1,293 1,350 – 4%
Transpacific 1,272 1,218 1,223 4% 4% 1,245 1,285 – 3%
Far East 1,007 897 719 12% 40% 955 757 26%
Middle East 1,017 791 689 29% 48% 902 695 30%
Latin America 1,008 1,017 965 –1% 4% 1,012 963 5%
Intra-Asia 607 539 563 13% 8% 573 570 1%
EMAO (Europe–Mediterranean–Africa–Oceania) 1,048 1,009 1,064 4% – 2% 1,030 1,071 – 4%
Total Hapag-Lloyd excluding UASC Group (weighted average) 1,087 1,047 1,019 4% 7% 1,068 1,042 2%UASC Group 870 n.a. n.a. n.a. n.a. 870 n.a. n.a.
Total (weighted average) 1,064 1,047 1,019 1% 4% 1,056 1,042 1%1) In connection with the merger of the UASC group, the trades have been restructured and the assignment of individual services amended.
The prior period figures have been amended accordingly.
9
Q2 / H1 2017 I INVESTOR REPORT
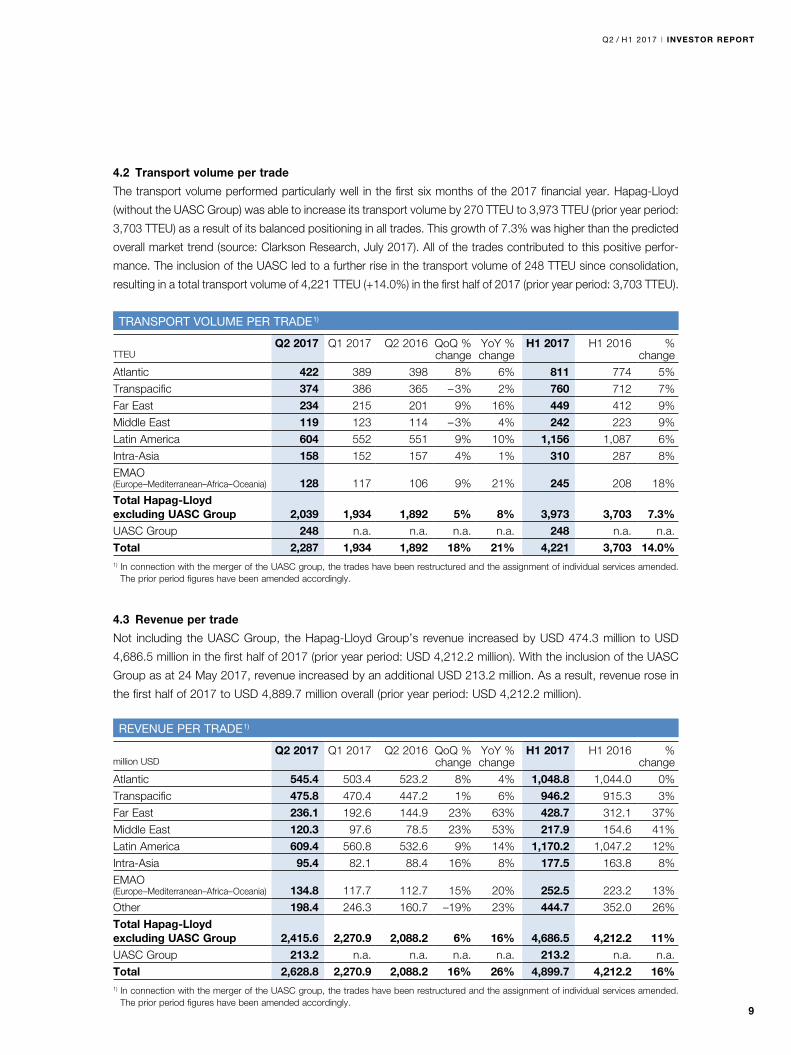
4.2 Transport volume per trade
The transport volume performed particularly well in the first six months of the 2017 financial year. Hapag-Lloyd
(without the UASC Group) was able to increase its transport volume by 270 TTEU to 3,973 TTEU (prior year period:
3,703 TTEU) as a result of its balanced positioning in all trades. This growth of 7.3% was higher than the predicted
overall market trend (source: Clarkson Research, July 2017). All of the trades contributed to this positive perfor-
mance. The inclusion of the UASC led to a further rise in the transport volume of 248 TTEU since consolidation,
resulting in a total transport volume of 4,221 TTEU (+14.0%) in the first half of 2017 (prior year period: 3,703 TTEU).
4.3 Revenue per trade
Not including the UASC Group, the Hapag-Lloyd Group’s revenue increased by USD 474.3 million to USD
4,686.5 million in the first half of 2017 (prior year period: USD 4,212.2 million). With the inclusion of the UASC
Group as at 24 May 2017, revenue increased by an additional USD 213.2 million. As a result, revenue rose in
the first half of 2017 to USD 4,889.7 million overall (prior year period: USD 4,212.2 million).
TRANSPORT VOLUME PER TRADE 1)
TTEU
Q2 2017 Q1 2017 Q2 2016 QoQ % change
YoY % change
H1 2017 H1 2016 % change
Atlantic 422 389 398 8% 6% 811 774 5%
Transpacific 374 386 365 – 3% 2% 760 712 7%
Far East 234 215 201 9% 16% 449 412 9%
Middle East 119 123 114 – 3% 4% 242 223 9%
Latin America 604 552 551 9% 10% 1,156 1,087 6%
Intra-Asia 158 152 157 4% 1% 310 287 8%
EMAO (Europe–Mediterranean–Africa–Oceania) 128 117 106 9% 21% 245 208 18%
Total Hapag-Lloyd excluding UASC Group 2,039 1,934 1,892 5% 8% 3,973 3,703 7.3%UASC Group 248 n.a. n.a. n.a. n.a. 248 n.a. n.a.
Total 2,287 1,934 1,892 18% 21% 4,221 3,703 14.0%1) In connection with the merger of the UASC group, the trades have been restructured and the assignment of individual services amended.
The prior period figures have been amended accordingly.
REVENUE PER TRADE 1)
million USD
Q2 2017 Q1 2017 Q2 2016 QoQ % change
YoY % change
H1 2017 H1 2016 % change
Atlantic 545.4 503.4 523.2 8% 4% 1,048.8 1,044.0 0%
Transpacific 475.8 470.4 447.2 1% 6% 946.2 915.3 3%
Far East 236.1 192.6 144.9 23% 63% 428.7 312.1 37%
Middle East 120.3 97.6 78.5 23% 53% 217.9 154.6 41%
Latin America 609.4 560.8 532.6 9% 14% 1,170.2 1,047.2 12%
Intra-Asia 95.4 82.1 88.4 16% 8% 177.5 163.8 8%
EMAO (Europe–Mediterranean–Africa–Oceania) 134.8 117.7 112.7 15% 20% 252.5 223.2 13%
Other 198.4 246.3 160.7 –19% 23% 444.7 352.0 26%
Total Hapag-Lloyd excluding UASC Group 2,415.6 2,270.9 2,088.2 6% 16% 4,686.5 4,212.2 11%UASC Group 213.2 n.a. n.a. n.a. n.a. 213.2 n.a. n.a.
Total 2,628.8 2,270.9 2,088.2 16% 26% 4,899.7 4,212.2 16%1) In connection with the merger of the UASC group, the trades have been restructured and the assignment of individual services amended.
The prior period figures have been amended accordingly.
10
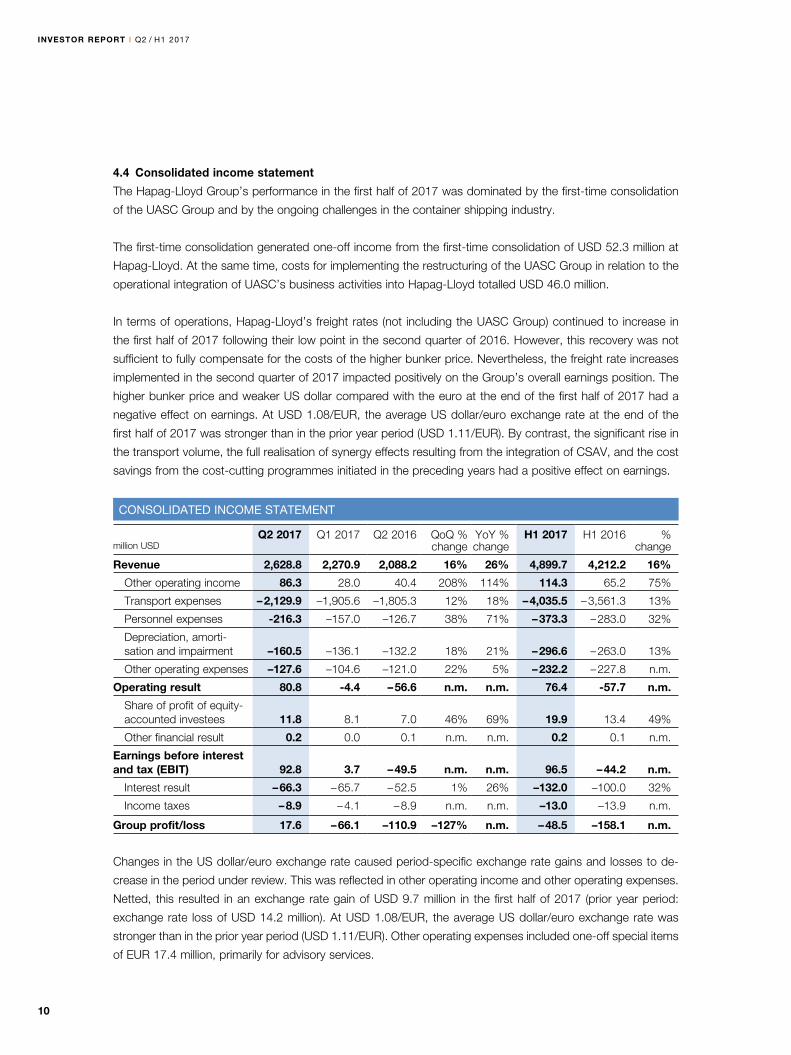
4.4 Consolidated income statement
The Hapag-Lloyd Group’s performance in the first half of 2017 was dominated by the first-time consolidation
of the UASC Group and by the ongoing challenges in the container shipping industry.
The first-time consolidation generated one-off income from the first-time consolidation of USD 52.3 million at
Hapag-Lloyd. At the same time, costs for implementing the restructuring of the UASC Group in relation to the
operational integration of UASC’s business activities into Hapag-Lloyd totalled USD 46.0 million.
In terms of operations, Hapag-Lloyd’s freight rates (not including the UASC Group) continued to increase in
the first half of 2017 following their low point in the second quarter of 2016. However, this recovery was not
sufficient to fully compensate for the costs of the higher bunker price. Nevertheless, the freight rate increases
implemented in the second quarter of 2017 impacted positively on the Group’s overall earnings position. The
higher bunker price and weaker US dollar compared with the euro at the end of the first half of 2017 had a
negative effect on earnings. At USD 1.08/EUR, the average US dollar/euro exchange rate at the end of the
first half of 2017 was stronger than in the prior year period (USD 1.11/EUR). By contrast, the significant rise in
the transport volume, the full realisation of synergy effects resulting from the integration of CSAV, and the cost
savings from the cost-cutting programmes initiated in the preceding years had a positive effect on earnings.
Changes in the US dollar/euro exchange rate caused period-specific exchange rate gains and losses to de-
crease in the period under review. This was reflected in other operating income and other operating expenses.
Netted, this resulted in an exchange rate gain of USD 9.7 million in the first half of 2017 (prior year period:
exchange rate loss of USD 14.2 million). At USD 1.08/EUR, the average US dollar/euro exchange rate was
stronger than in the prior year period (USD 1.11/EUR). Other operating expenses included one-off special items
of EUR 17.4 million, primarily for advisory services.
INVESTOR REPORT I Q2 / H1 2017
CONSOLIDATED INCOME STATEMENT
million USD
Q2 2017 Q1 2017 Q2 2016 QoQ % change
YoY % change
H1 2017 H1 2016 % change
Revenue 2,628.8 2,270.9 2,088.2 16% 26% 4,899.7 4,212.2 16%
Other operating income 86.3 28.0 40.4 208% 114% 114.3 65.2 75%
Transport expenses – 2,129.9 –1,905.6 –1,805.3 12% 18% – 4,035.5 – 3,561.3 13%
Personnel expenses -216.3 –157.0 –126.7 38% 71% – 373.3 – 283.0 32%
Depreciation, amorti- sation and impairment –160.5 –136.1 –132.2 18% 21% – 296.6 – 263.0 13%
Other operating expenses –127.6 –104.6 –121.0 22% 5% – 232.2 – 227.8 n.m.
Operating result 80.8 -4.4 – 56.6 n.m. n.m. 76.4 -57.7 n.m.
Share of profit of equity- accounted investees 11.8 8.1 7.0 46% 69% 19.9 13.4 49%
Other financial result 0.2 0.0 0.1 n.m. n.m. 0.2 0.1 n.m.
Earnings before interest and tax (EBIT) 92.8 3.7 – 49.5 n.m. n.m. 96.5 – 44.2 n.m.
Interest result – 66.3 – 65.7 – 52.5 1% 26% –132.0 –100.0 32%
Income taxes – 8.9 – 4.1 – 8.9 n.m. n.m. –13.0 –13.9 n.m.
Group profit/loss 17.6 – 66.1 –110.9 –127% n.m. – 48.5 –158.1 n.m.
11
Q2 / H1 2017 I INVESTOR REPORT
Personnel expenses rose by USD 90.3 million to USD 373.3 million in the first half of 2017 (prior year
period: USD 283.0 million). The main reason for this increase were the costs incurred for the restructuring of
the UASC Group as part of the operational integration of UASC’s business activities and associated one-off
effects amounting to USD 41.6 million. Furthermore, the first-time inclusion of the personnel costs of the
UASC Group led to an increase in personal expenses. In addition, the exchange rate losses at the balance
sheet date resulting from the valuation of pension provisions in the amount of USD 10.3 million (prior year
period: USD 3.1 million) led to a year-on-year increase in personnel expenses.
Depreciation and amortisation came to USD 296.6 million in the first six months of the 2017 financial year
(prior year period: USD 263.0 million). The year-on-year increase in depreciation and amortisation was primarily
due to depreciation of the acquired newly built ships and containers as well as the first-time inclusion of the
UASC Group.
The Group’s earnings before interest and taxes (EBIT) amounted to USD 96.5 million in the reporting period.
They were therefore well above the corresponding figure in the prior year period of USD -44.2 million. The
Group’s earnings before interest, taxes, depreciation and amortisation (EBITDA) came in at USD 393.1 million
in the first six months of the 2017 financial year (prior year period: USD 218.8 million).
The interest result for the first six months of the 2017 financial year was USD –132.0 million (prior year period:
USD –100.0 million). The change was primarily due to the early redemption of a US dollar bond and a euro
bond. These transactions were associated with one-off effects totalling USD –15.1 million as a result of re-
demption charges, the partial disposal of associated embedded derivatives and other associated transaction
costs. In addition to interest expenses resulting from newly utilised ship and container financing and other
financing agreements, the first-time inclusion of the UASC Group with USD –12.3 million prompted overall
interest expenses to rise. This was counteracted by income of USD 24.7 million (prior year period: USD 10.3
million) from a change in the fair value of the derivatives embedded in the bonds issued.
The Group recorded a loss of USD 48.5 million in the first half of 2017 (prior year period: USD –158.1 million).
4.5 Transport expenses
Transport expenses rose by USD 474.2 million in the first six months of 2017 to USD 4,035.5 million (prior
year period: USD 3,561.3 million). This represents an increase of 13%. This development was particularly
attributable to an increase of USD 268.2 million (84%) in expenses for raw materials, supplies and purchase
goods as a result of the higher bunker price. In the first half of 2017, the average bunker consumption price
for Hapag-Lloyd was USD 312 per tonne, up USD 114 per tonne on the figure for the prior year period. From
the 2017 financial year onwards, the average bunker consumption price used by Hapag-Lloyd is a combined
figure for marine fuel oil (MFO) and marine diesel oil (MDO). The previous year’s figure has been restated
accordingly. The cost of purchased services has risen disproportionately by USD 206.0 million (6%) against
the growth of transport volumes. This increase is a reflection of the significant 14.0% rise in transport volumes
and, in particular, the initial inclusion of the UASC Group. Both the integration of UASC’s fleet and lower charter
rates enabled Hapag-Lloyd to enter into more favourable agreements in place of existing charter contracts.
As such, chartering, lease and container rentals fell by USD 129.7 million to USD 496.4 million (prior year
period: USD 626.1 million). Transport expenses were also down thanks to the full achievement of synergy
12
INVESTOR REPORT I Q2 / H1 2017
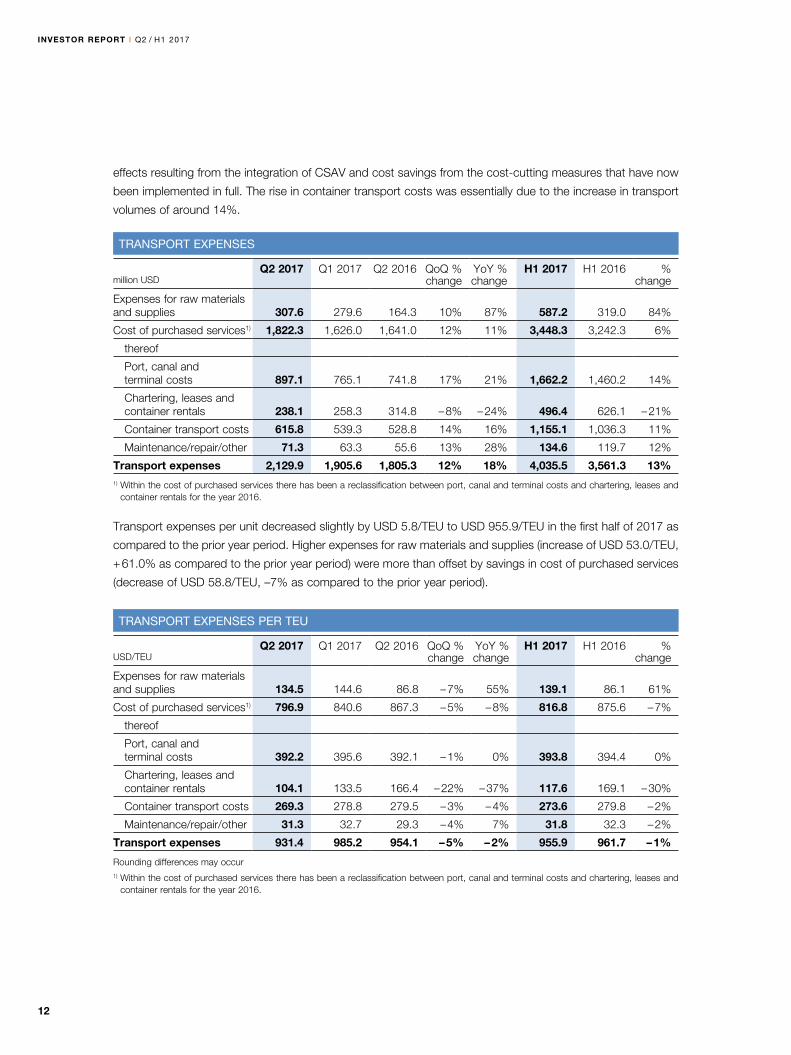
effects resulting from the integration of CSAV and cost savings from the cost-cutting measures that have now
been implemented in full. The rise in container transport costs was essentially due to the increase in transport
volumes of around 14%.
Transport expenses per unit decreased slightly by USD 5.8/TEU to USD 955.9/TEU in the first half of 2017 as
compared to the prior year period. Higher expenses for raw materials and supplies (increase of USD 53.0/TEU,
+ 61.0% as compared to the prior year period) were more than offset by savings in cost of purchased services
(decrease of USD 58.8/TEU, –7% as compared to the prior year period).
TRANSPORT EXPENSES
million USD
Q2 2017 Q1 2017 Q2 2016 QoQ % change
YoY % change
H1 2017 H1 2016 % change
Expenses for raw materials and supplies 307.6 279.6 164.3 10% 87% 587.2 319.0 84%
Cost of purchased services1) 1,822.3 1,626.0 1,641.0 12% 11% 3,448.3 3,242.3 6%
thereof
Port, canal and terminal costs 897.1 765.1 741.8 17% 21% 1,662.2 1,460.2 14%
Chartering, leases and container rentals 238.1 258.3 314.8 – 8% – 24% 496.4 626.1 – 21%
Container transport costs 615.8 539.3 528.8 14% 16% 1,155.1 1,036.3 11%
Maintenance/repair/other 71.3 63.3 55.6 13% 28% 134.6 119.7 12%
Transport expenses 2,129.9 1,905.6 1,805.3 12% 18% 4,035.5 3,561.3 13%1) Within the cost of purchased services there has been a reclassification between port, canal and terminal costs and chartering, leases and
container rentals for the year 2016.
TRANSPORT EXPENSES PER TEU
USD/TEU
Q2 2017 Q1 2017 Q2 2016 QoQ % change
YoY % change
H1 2017 H1 2016 % change
Expenses for raw materials and supplies 134.5 144.6 86.8 – 7% 55% 139.1 86.1 61%
Cost of purchased services1) 796.9 840.6 867.3 – 5% – 8% 816.8 875.6 – 7%
thereof
Port, canal and terminal costs 392.2 395.6 392.1 – 1% 0% 393.8 394.4 0%
Chartering, leases and container rentals 104.1 133.5 166.4 – 22% – 37% 117.6 169.1 – 30%
Container transport costs 269.3 278.8 279.5 – 3% – 4% 273.6 279.8 – 2%
Maintenance/repair/other 31.3 32.7 29.3 – 4% 7% 31.8 32.3 – 2%
Transport expenses 931.4 985.2 954.1 – 5% – 2% 955.9 961.7 – 1%
Rounding differences may occur1) Within the cost of purchased services there has been a reclassification between port, canal and terminal costs and chartering, leases and
container rentals for the year 2016.
13
Q2 / H1 2017 I INVESTOR REPORT
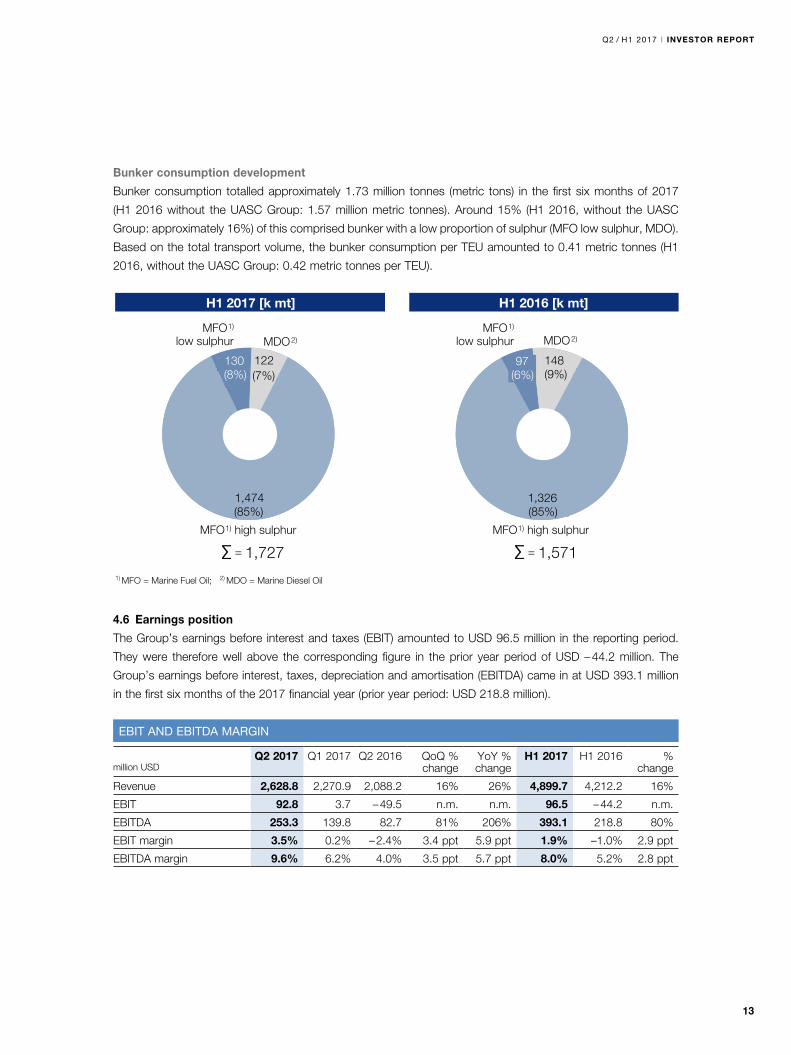
Bunker consumption development
Bunker consumption totalled approximately 1.73 million tonnes (metric tons) in the first six months of 2017
(H1 2016 without the UASC Group: 1.57 million metric tonnes). Around 15% (H1 2016, without the UASC
Group: approximately 16%) of this comprised bunker with a low proportion of sulphur (MFO low sulphur, MDO).
Based on the total transport volume, the bunker consumption per TEU amounted to 0.41 metric tonnes (H1
2016, without the UASC Group: 0.42 metric tonnes per TEU).
4.6 Earnings position
The Group’s earnings before interest and taxes (EBIT) amounted to USD 96.5 million in the reporting period.
They were therefore well above the corresponding figure in the prior year period of USD – 44.2 million. The
Group’s earnings before interest, taxes, depreciation and amortisation (EBITDA) came in at USD 393.1 million
in the first six months of the 2017 financial year (prior year period: USD 218.8 million).
108(17%)
533(83%) 708
(
24(3%)
H1 2017 [k mt] H1 2016 [k mt]
MDO2)
MFO1) high sulphur
MFO1)
low sulphur MDO2)
MFO1) high sulphur
= 1,727 = 1,571 1) MFO = Marine Fuel Oil; 2) MDO = Marine Diesel Oil
MFO1)
low sulphur
130(8%)
122(7%)
1,474(85%)
148(9%)
97(6%)
1,326(85%)
EBIT AND EBITDA MARGIN
million USD
Q2 2017 Q1 2017 Q2 2016 QoQ % change
YoY % change
H1 2017 H1 2016 % change
Revenue 2,628.8 2,270.9 2,088.2 16% 26% 4,899.7 4,212.2 16%
EBIT 92.8 3.7 – 49.5 n.m. n.m. 96.5 – 44.2 n.m.
EBITDA 253.3 139.8 82.7 81% 206% 393.1 218.8 80%
EBIT margin 3.5% 0.2% – 2.4% 3.4 ppt 5.9 ppt 1.9% –1.0% 2.9 ppt
EBITDA margin 9.6% 6.2% 4.0% 3.5 ppt 5.7 ppt 8.0% 5.2% 2.8 ppt
14
INVESTOR REPORT I Q2 / H1 2017
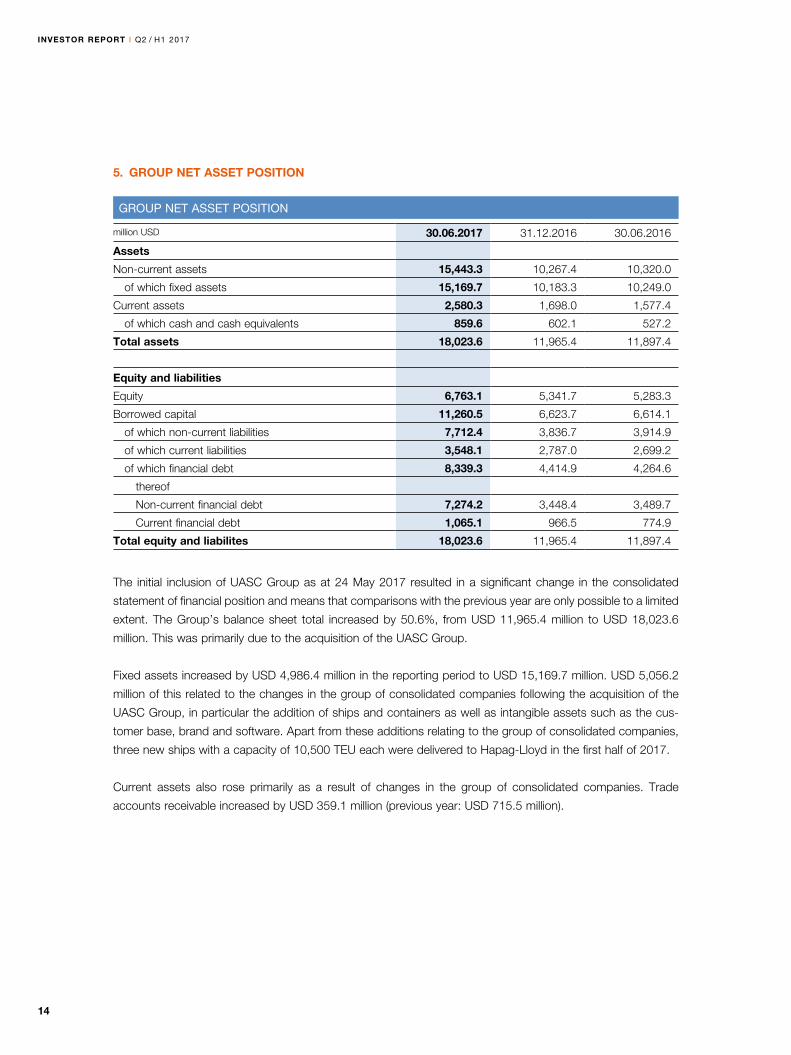
5. GROUP NET ASSET POSITION
The initial inclusion of UASC Group as at 24 May 2017 resulted in a significant change in the consolidated
statement of financial position and means that comparisons with the previous year are only possible to a limited
extent. The Group’s balance sheet total increased by 50.6%, from USD 11,965.4 million to USD 18,023.6
million. This was primarily due to the acquisition of the UASC Group.
Fixed assets increased by USD 4,986.4 million in the reporting period to USD 15,169.7 million. USD 5,056.2
million of this related to the changes in the group of consolidated companies following the acquisition of the
UASC Group, in particular the addition of ships and containers as well as intangible assets such as the cus-
tomer base, brand and software. Apart from these additions relating to the group of consolidated companies,
three new ships with a capacity of 10,500 TEU each were delivered to Hapag-Lloyd in the first half of 2017.
Current assets also rose primarily as a result of changes in the group of consolidated companies. Trade
accounts receivable increased by USD 359.1 million (previous year: USD 715.5 million).
GROUP NET ASSET POSITION
million USD 30.06.2017 31.12.2016 30.06.2016
Assets
Non-current assets 15,443.3 10,267.4 10,320.0
of which fixed assets 15,169.7 10,183.3 10,249.0
Current assets 2,580.3 1,698.0 1,577.4
of which cash and cash equivalents 859.6 602.1 527.2
Total assets 18,023.6 11,965.4 11,897.4
Equity and liabilities
Equity 6,763.1 5,341.7 5,283.3
Borrowed capital 11,260.5 6,623.7 6,614.1
of which non-current liabilities 7,712.4 3,836.7 3,914.9
of which current liabilities 3,548.1 2,787.0 2,699.2
of which financial debt 8,339.3 4,414.9 4,264.6
thereof
Non-current financial debt 7,274.2 3,448.4 3,489.7
Current financial debt 1,065.1 966.5 774.9
Total equity and liabilites 18,023.6 11,965.4 11,897.4
15
Q2 / H1 2017 I INVESTOR REPORT
On the liabilities side, the Group’s equity increased by USD 1,421.4 million to USD 6,763.1 million. This change
resulted on the one hand from the issuing of new ordinary shares as part of the acquisition of the UASC Group
in the amount of USD 1,438.4 million and, on the other hand, from the Group loss of USD 48.5 million and from
the balance of unrealised gains and losses of USD 29.2 million due to currency translation, as recognised in
other comprehensive income. The equity ratio fell to 37.5% as at 30 June 2017 (31 December 2016: 44.6%),
mainly as a result of the significant rise in borrowed capital following the first-time consolidation of the UASC
Group.
The Group’s borrowed capital rose by USD 4,636.8 million to USD 11,260.5 million in comparison to the 2016
consolidated financial statements, primarily as a result of the acquisition of the UASC Group.
There was a considerable change in the Company’s financial debt, which increased by USD 3,924.4 million
compared with 31 December 2016 to USD 8,339.3 million. The inclusion of the UASC Group as at 30 June
2017 contributed USD 3,910.7 million to this increase. Financial debt also rose as a result of loan disburse-
ments received for newbuilds and financing for containers amounting to USD 984.1 million. Hapag-Lloyd
issued a new corporate bond with an issue volume of EUR 250.0 million on 1 February 2017. This was in-
creased by EUR 200 million on 15 February 2017, taking the total amount to EUR 450 million. Together with
existing liquidity, the proceeds from the bond’s issuance were used for the early repayment of the US dollar
bond due in 2017 as well as for the partial repayment of the euro bond due in 2018. Hapag-Lloyd exercised
its contractually agreed early termination options here. The raising of cash and cash equivalents was offset by
capital repayments of USD 1,128.1 million.
Among others, the major impact that the acquisition of the UASC Group had on the development of the
Hapag-Lloyd Group’s borrowed capital can also be seen in the associated increase in current provisions
amounting to USD 178.2 million, in particular relating also to the creation of a restructuring provision in the
amount of USD 36.9 million.
Within current liabilities, trade accounts payable increased by USD 476.6 million to USD 1,829.9 million,
primarily as a result of the change in the group of consolidated companies and exchange rate fluctuations.
Net debt came to USD 7,408.1 million as at 30 June 2017 (31 December 2016: USD 3,793.1 million) including
cash and cash equivalents of USD 71.6 million (31 December 2016: USD 19.7 million) which serve as collateral
for existing financial debt and are classified as other assets due to their maturity.
16
INVESTOR REPORT I Q2 / H1 2017
6. GROUP FINANCIAL POSITION
6.1 Developments in cash and cash equivalents
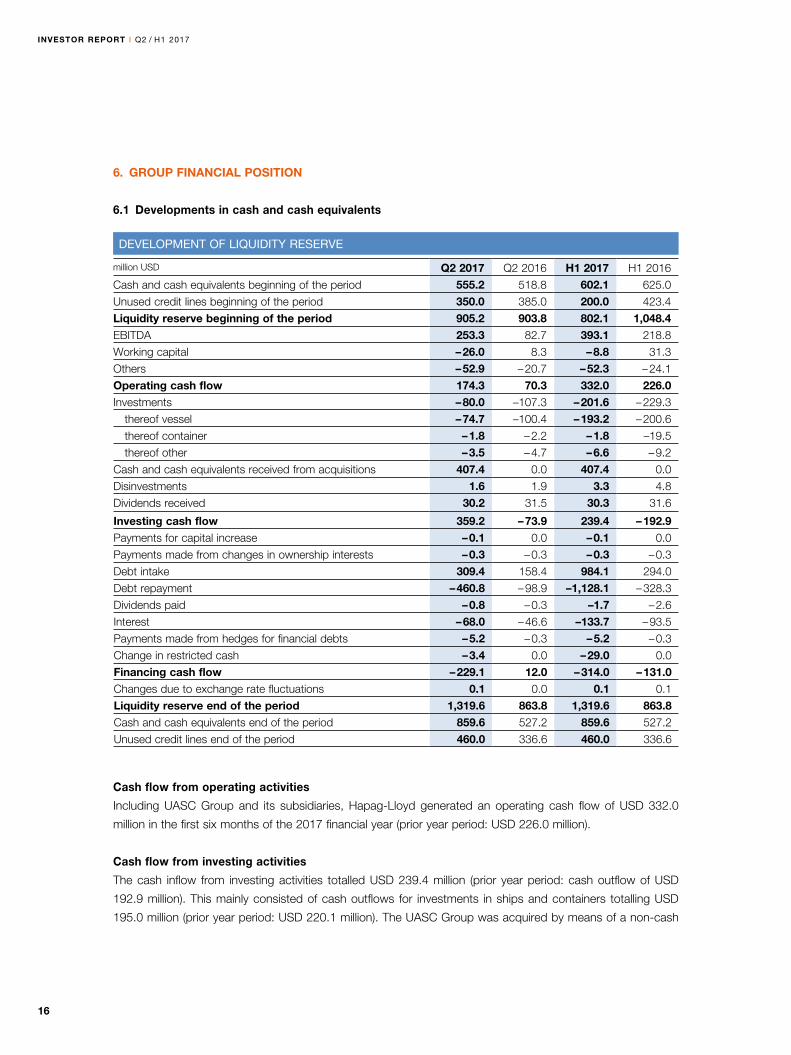
Cash flow from operating activities
Including UASC Group and its subsidiaries, Hapag-Lloyd generated an operating cash flow of USD 332.0
million in the first six months of the 2017 financial year (prior year period: USD 226.0 million).
Cash flow from investing activities
The cash inflow from investing activities totalled USD 239.4 million (prior year period: cash outflow of USD
192.9 million). This mainly consisted of cash outflows for investments in ships and containers totalling USD
195.0 million (prior year period: USD 220.1 million). The UASC Group was acquired by means of a non-cash
DEVELOPMENT OF LIQUIDITY RESERVE
million USD Q2 2017 Q2 2016 H1 2017 H1 2016
Cash and cash equivalents beginning of the period 555.2 518.8 602.1 625.0
Unused credit lines beginning of the period 350.0 385.0 200.0 423.4
Liquidity reserve beginning of the period 905.2 903.8 802.1 1,048.4EBITDA 253.3 82.7 393.1 218.8
Working capital – 26.0 8.3 – 8.8 31.3
Others – 52.9 – 20.7 – 52.3 – 24.1
Operating cash flow 174.3 70.3 332.0 226.0Investments – 80.0 –107.3 – 201.6 – 229.3
thereof vessel – 74.7 –100.4 – 193.2 – 200.6
thereof container – 1.8 – 2.2 – 1.8 –19.5
thereof other – 3.5 – 4.7 – 6.6 – 9.2
Cash and cash equivalents received from acquisitions 407.4 0.0 407.4 0.0
Disinvestments 1.6 1.9 3.3 4.8
Dividends received 30.2 31.5 30.3 31.6
Investing cash flow 359.2 – 73.9 239.4 – 192.9Payments for capital increase – 0.1 0.0 – 0.1 0.0
Payments made from changes in ownership interests – 0.3 – 0.3 – 0.3 – 0.3
Debt intake 309.4 158.4 984.1 294.0
Debt repayment – 460.8 – 98.9 –1,128.1 – 328.3
Dividends paid – 0.8 – 0.3 –1.7 – 2.6
Interest – 68.0 – 46.6 –133.7 – 93.5
Payments made from hedges for financial debts – 5.2 – 0.3 – 5.2 – 0.3
Change in restricted cash – 3.4 0.0 – 29.0 0.0
Financing cash flow – 229.1 12.0 – 314.0 – 131.0Changes due to exchange rate fluctuations 0.1 0.0 0.1 0.1
Liquidity reserve end of the period 1,319.6 863.8 1,319.6 863.8Cash and cash equivalents end of the period 859.6 527.2 859.6 527.2
Unused credit lines end of the period 460.0 336.6 460.0 336.6
17
investment involving the issuing of new shares. The inclusion of UASC resulted in the addition of cash and cash
equivalents of USD 407.4 million. This includes cash inflows of USD 409.9 million from the liquidity reserves of
the UASC Group and payments of USD 2.5 million for incurred acquisition costs. The Group received additional
cash inflows, in particular from dividend payments received.
Cash flow from financing activities
Financing activities resulted in a net cash outflow of USD 314.0 million in the current reporting period (prior year
period: USD 131.0 million). Borrowing amounting to USD 984.1 million (prior year period: USD 294.0 million)
related primarily to cash inflows from the issuing of a new euro bond and to loans for the financing of vessels
and containers. This was offset by cash outflows from the early repayment of the US dollar bond issued in 2010
and the euro bond issued in 2013 and by interest and capital repayments amounting to USD 1,128.1 million
(prior year period: USD 328.3 million).
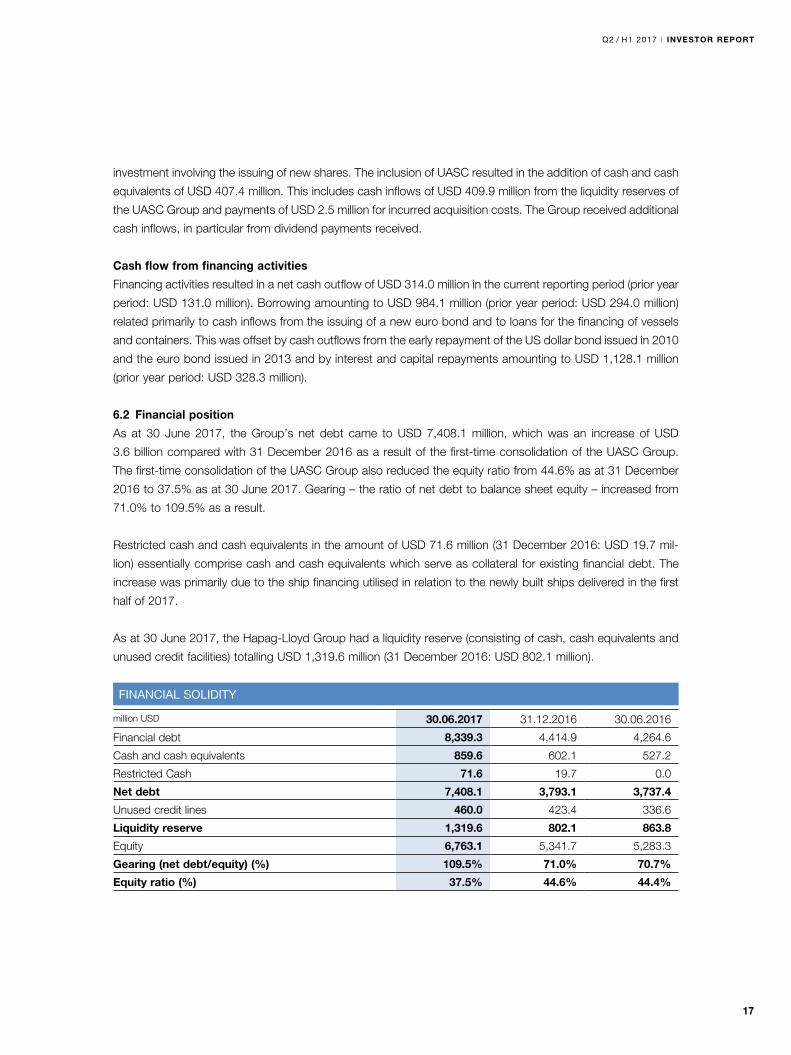
6.2 Financial position
As at 30 June 2017, the Group’s net debt came to USD 7,408.1 million, which was an increase of USD
3.6 billion compared with 31 December 2016 as a result of the first-time consolidation of the UASC Group.
The first-time consolidation of the UASC Group also reduced the equity ratio from 44.6% as at 31 December
2016 to 37.5% as at 30 June 2017. Gearing – the ratio of net debt to balance sheet equity – increased from
71.0% to 109.5% as a result.
Restricted cash and cash equivalents in the amount of USD 71.6 million (31 December 2016: USD 19.7 mil-
lion) essentially comprise cash and cash equivalents which serve as collateral for existing financial debt. The
increase was primarily due to the ship financing utilised in relation to the newly built ships delivered in the first
half of 2017.
As at 30 June 2017, the Hapag-Lloyd Group had a liquidity reserve (consisting of cash, cash equivalents and
unused credit facilities) totalling USD 1,319.6 million (31 December 2016: USD 802.1 million).
Q2 / H1 2017 I INVESTOR REPORT
FINANCIAL SOLIDITY
million USD 30.06.2017 31.12.2016 30.06.2016
Financial debt 8,339.3 4,414.9 4,264.6
Cash and cash equivalents 859.6 602.1 527.2
Restricted Cash 71.6 19.7 0.0
Net debt 7,408.1 3,793.1 3,737.4
Unused credit lines 460.0 423.4 336.6
Liquidity reserve 1,319.6 802.1 863.8
Equity 6,763.1 5,341.7 5,283.3
Gearing (net debt/equity) (%) 109.5% 71.0% 70.7%
Equity ratio (%) 37.5% 44.6% 44.4%
18
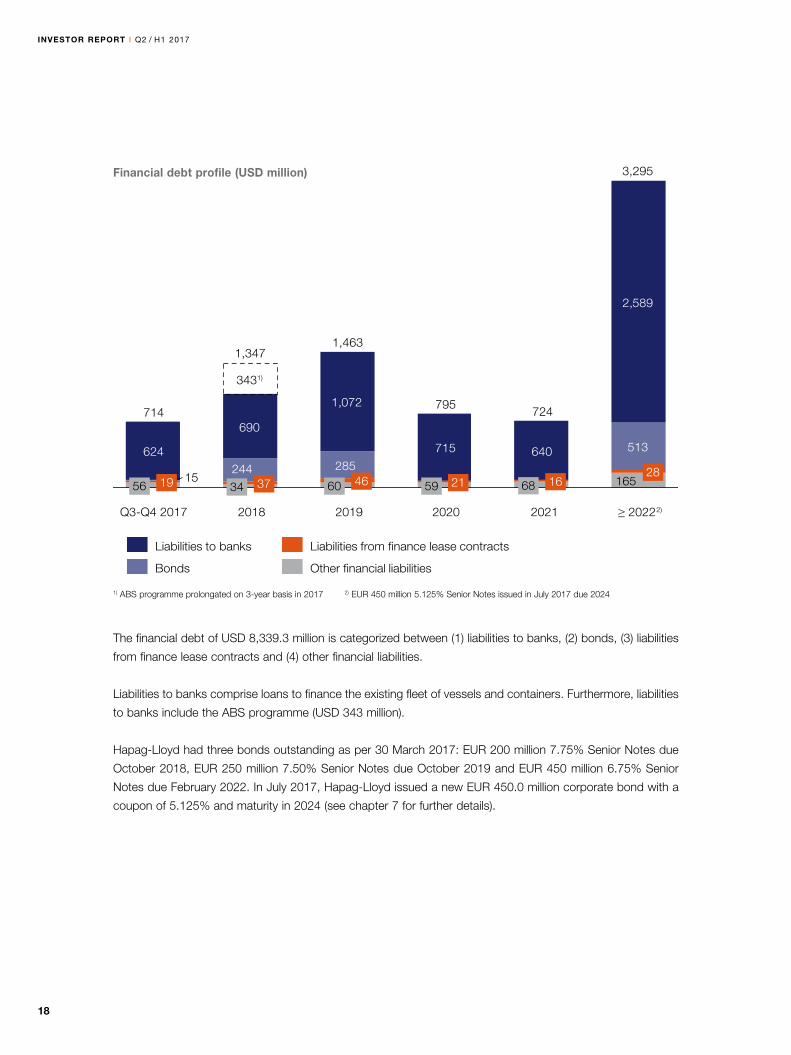
Financial debt profile (USD million)
The financial debt of USD 8,339.3 million is categorized between (1) liabilities to banks, (2) bonds, (3) liabilities
from finance lease contracts and (4) other financial liabilities.
Liabilities to banks comprise loans to finance the existing fleet of vessels and containers. Furthermore, liabilities
to banks include the ABS programme (USD 343 million).
Hapag-Lloyd had three bonds outstanding as per 30 March 2017: EUR 200 million 7.75% Senior Notes due
October 2018, EUR 250 million 7.50% Senior Notes due October 2019 and EUR 450 million 6.75% Senior
Notes due February 2022. In July 2017, Hapag-Lloyd issued a new EUR 450.0 million corporate bond with a
coupon of 5.125% and maturity in 2024 (see chapter 7 for further details).
1) ABS programme prolongated on 3-year basis in 2017 2) EUR 450 million 5.125% Senior Notes issued in July 2017 due 2024
20192018 ≥ 20222)2020 2021Q3-Q4 2017
Other financial liabilities
Liabilities from finance lease contracts
Bonds
Liabilities to banks
285
513
690
1,072
715 640
2,589
165244
15
624
3,295
6828
16
724795
59 21
1,463
60 46
1,347
34 37
714
56 19
3431)
INVESTOR REPORT I Q2 / H1 2017
19
Q2 / H1 2017 I INVESTOR REPORT
7. EVENTS AFTER THE BALANCE SHEET DATE
Hapag-Lloyd issued a EUR bond with a volume of EUR 450.0 million on 18 July 2017. The bond has a matu-
rity of seven years and a coupon of 5.125%. The purpose of the issue proceeds is to service Hapag-Lloyd’s
existing 7.75% and 7.50% EUR bonds which fall due in 2018 and 2019.
On 19 July 2017, 42.7 million shares assigned to UASC’s existing shareholders in the course of the merger
between Hapag-Lloyd and UASC were admitted to trading.
On 27 July 2017, Hapag-Lloyd launched the MV Afif, a ship with a transport capacity of 15,000 TEU. The last in-
stalment of USD 25.5 million for the construction work was paid to the shipyard upon delivery. The ship is financed
with a long-term loan in the amount of USD 94.8 million, which had already been utilised in full upon delivery.
8. REVISED OUTLOOK
The outlook for the 2017 financial year published in the Investor Report for the FY 2016 was based on the
Hapag-Lloyd Group’s existing business activities as at 31 December 2016 and therefore does not include the
UASC Group’s business activities. The outlook detailed in the Investor Report for Q1 2017 is no longer valid.
Hapag-Lloyd acquired the assets and assumed the liabilities of the UASC Group on 24 May 2017. The first out-
look for the Hapag-Lloyd Group since the acquisition of UASC has been provided for the current 2017 financial
year. The following forecast for the Company’s expected performance includes UASC from the date of its first-
time consolidation, 24 May 2017. The forecast made here thus relates for the first time to the extended Group
(including UASC’s container shipping activities) and cannot therefore be compared to the forecast in the 2016
annual report with regard to the system used.
In its latest economic outlook (July 2017), the International Monetary Fund (IMF) expects global economic growth
to reach 3.5% in the current year. This forecast means that the global economy is set to grow at a faster rate
in 2017 than in the previous year (+3.2%). According to the IMF, the volume of global trade, which is key to the
demand for container shipping services, will increase by 4.0% in the current year (2016: +2.3%). Compared
with its previous forecast (April 2017), the IMF has raised its outlook slightly for the increase in global trade
(+0.2 percentage points). This means that in 2017 the growth in global trade will outpace that of the global
economy. IHS Global Insight (May 2017) is forecasting that the global container shipping volume will increase
by 4.6% to approximately 139 million TEU in 2017 (2016: 3.2%). The current value is therefore 0.9 percentage
points higher than the one published in the forecast from February 2017. As such, the expected rise in world-
wide transport volumes in container shipping for 2017 would once again be sharper than the rate of growth for
global trade.
Following a rise in transport capacities of approximately 0.9 million TEU to 20.0 million TEU in 2016 (including
delays in deliveries), Drewry forecasts a nominal increase in transport capacities of up to approximately
1.1 million TEU for the current year. The growth in capacity supply could make it difficult again to push through
freight rate increases in 2017. Based on unchanged optimism about the general economic and sector-specific
conditions, Hapag-Lloyd, including the integration of UASC’s business activities from 24 May 2017, expects its
transport volume to increase significantly.
20
INVESTOR REPORT I Q2 / H1 2017
For 2017, Hapag-Lloyd expects a clear increase in the average bunker consumption price, above both the
average level for 2016 as well as the recorded level at the end of 2016. Due to the strong focus on the Middle
East and Far East trades as well as fewer hinterland services, UASC has a lower average freight rate than
Hapag-Lloyd. The average freight rate for the combined business activities is therefore likely to be broadly
unchanged in 2017 compared to the average freight rate for 2016 (without the UASC Group).
If the anticipated growth in volumes, a return to a better peak season in 2017, a significant contribution to the
positive result from UASC and the planned one-off expenses for the restructuring are considered, Hapag-Lloyd’s
EBITDA and EBIT, including UASC’s business activities, are expected to considerably exceed the level reached
in 2016 (without the UASC Group). Not accounted for here are impairments on goodwill, other intangible assets
and property, plant and equipment. Although not expected at present, these cannot be ruled out especially
given current political developments.
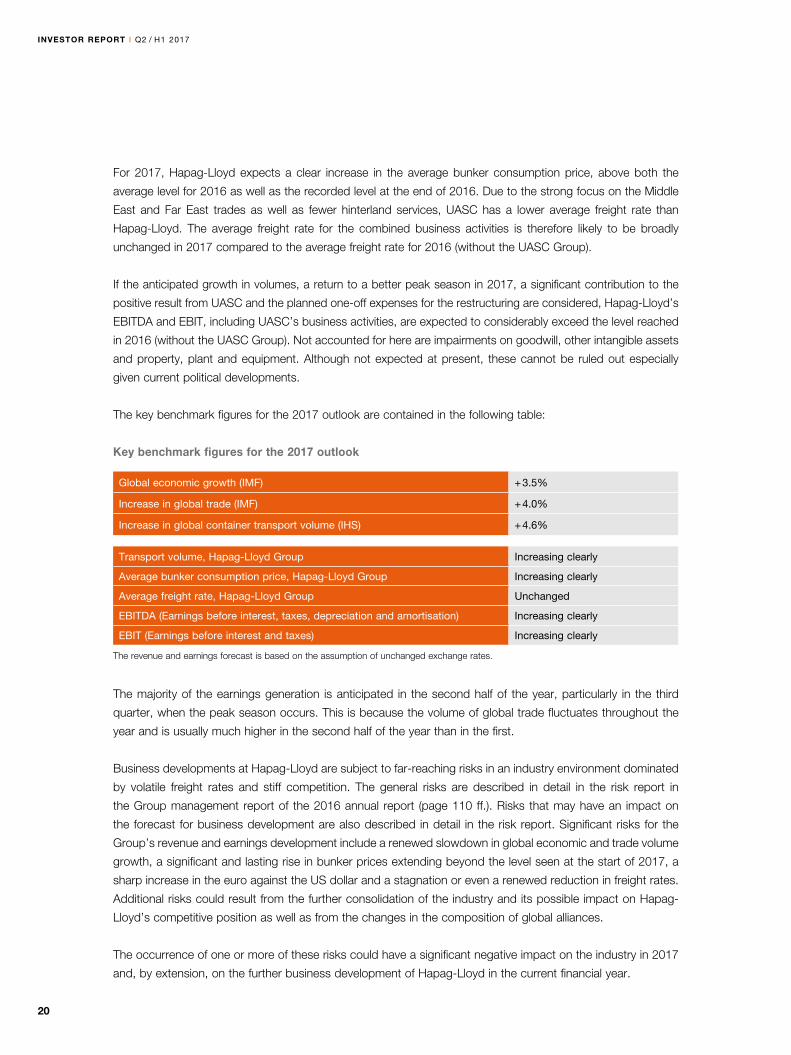
The key benchmark figures for the 2017 outlook are contained in the following table:
Key benchmark figures for the 2017 outlook
The majority of the earnings generation is anticipated in the second half of the year, particularly in the third
quarter, when the peak season occurs. This is because the volume of global trade fluctuates throughout the
year and is usually much higher in the second half of the year than in the first.
Business developments at Hapag-Lloyd are subject to far-reaching risks in an industry environment dominated
by volatile freight rates and stiff competition. The general risks are described in detail in the risk report in
the Group management report of the 2016 annual report (page 110 ff.). Risks that may have an impact on
the forecast for business development are also described in detail in the risk report. Significant risks for the
Group’s revenue and earnings development include a renewed slowdown in global economic and trade volume
growth, a significant and lasting rise in bunker prices extending beyond the level seen at the start of 2017, a
sharp increase in the euro against the US dollar and a stagnation or even a renewed reduction in freight rates.
Additional risks could result from the further consolidation of the industry and its possible impact on Hapag-
Lloyd’s competitive position as well as from the changes in the composition of global alliances.
The occurrence of one or more of these risks could have a significant negative impact on the industry in 2017
and, by extension, on the further business development of Hapag-Lloyd in the current financial year.
Global economic growth (IMF) + 3.5%
Increase in global trade (IMF) + 4.0%
Increase in global container transport volume (IHS) + 4.6%
Transport volume, Hapag-Lloyd Group Increasing clearly
Average bunker consumption price, Hapag-Lloyd Group Increasing clearly
Average freight rate, Hapag-Lloyd Group Unchanged
EBITDA (Earnings before interest, taxes, depreciation and amortisation) Increasing clearly
EBIT (Earnings before interest and taxes) Increasing clearly
The revenue and earnings forecast is based on the assumption of unchanged exchange rates.
21
Q2 / H1 2017 I INVESTOR REPORT
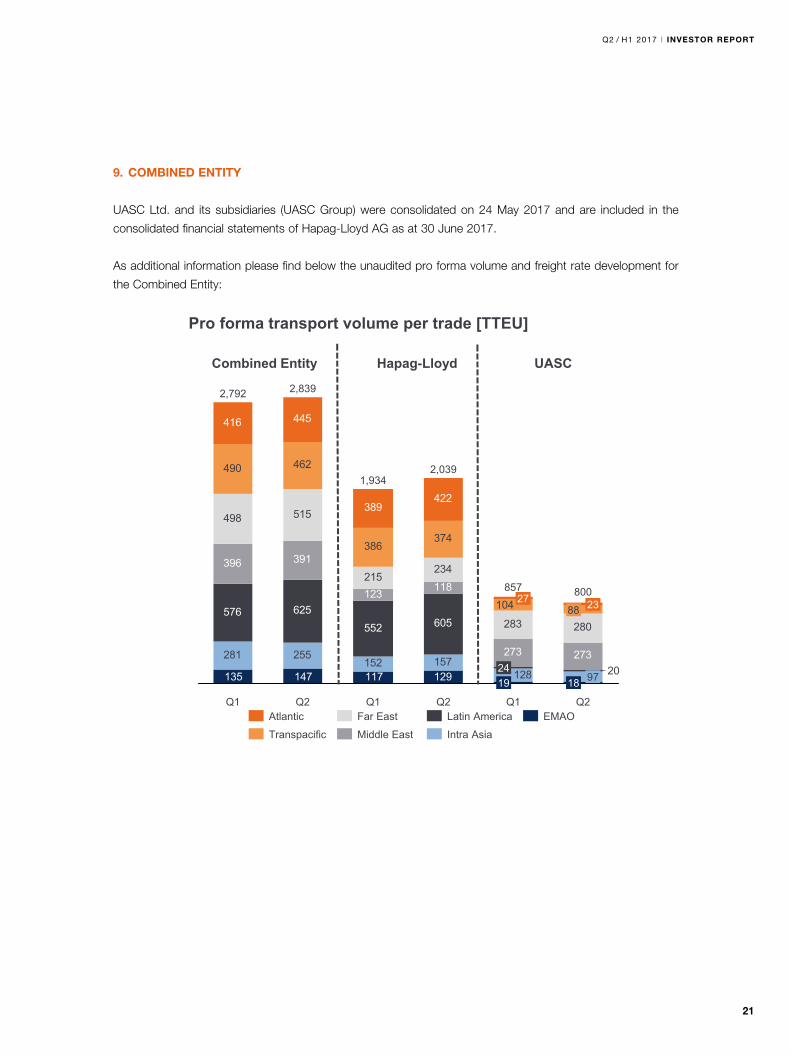
9. COMBINED ENTITY
UASC Ltd. and its subsidiaries (UASC Group) were consolidated on 24 May 2017 and are included in the
consolidated financial statements of Hapag-Lloyd AG as at 30 June 2017.
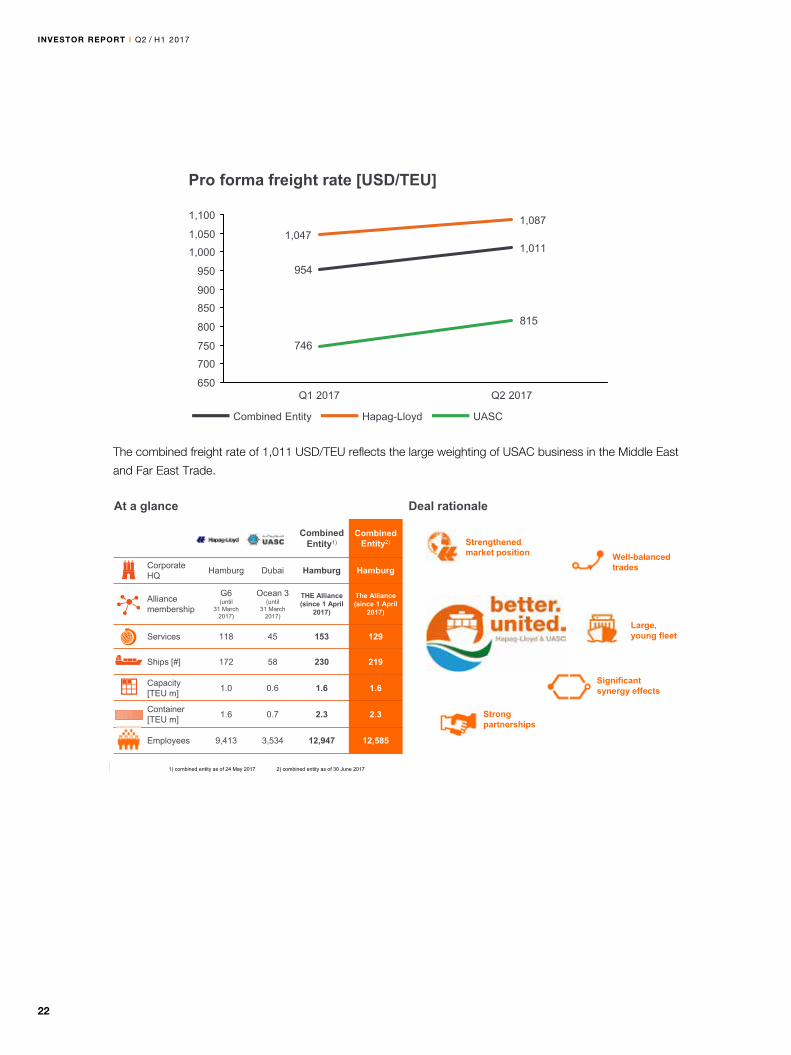
As additional information please find below the unaudited pro forma volume and freight rate development for
the Combined Entity:
1
281 255152 157
576 625552 605
396 391
123
273 273
498 515
215234
283 280
490 462
386374
416 445
389422
147135 129117 128 20
118104
Q1
23
1924
857
Q2
27
2,039
Q2 Q2
88
9718
800
2,839
1,934
Q1Q1
2,792
Far East
Transpacific
Atlantic
Intra Asia
Latin America
Middle East
EMAO
Pro forma transport volume per trade [TTEU]
Combined Entity Hapag-Lloyd UASC
4 UASC Integration
22
INVESTOR REPORT I Q2 / H1 2017
The combined freight rate of 1,011 USD/TEU reflects the large weighting of USAC business in the Middle East
and Far East Trade.
2
CombinedEntity1)
CombinedEntity2)
Corporate HQ Hamburg Dubai Hamburg Hamburg
Alliance membership
G6(until
31 March 2017)
Ocean 3(until
31 March 2017)
THE Alliance(since 1 April
2017)
The Alliance (since 1 April
2017)
Services 118 45 153 129
Ships [#] 172 58 230 219
Capacity [TEU m] 1.0 0.6 1.6 1.6
Container [TEU m] 1.6 0.7 2.3 2.3
Employees 9,413 3,534 12,947 12,585
Hapag-Lloyd / UASC merger successfully completed on 24 May 2017 –first optimization measures already implemented
Strengthened market position Well-balanced
trades
Large, young fleet
Strong partnerships
Significant synergy effects
Deal rationaleAt a glance
4 UASC Integration
1) combined entity as of 24 May 2017 2) combined entity as of 30 June 2017
2
Pro forma freight rate [USD/TEU]
954
815
746750
650
850
700
950
1,050
900
800
1,100
1,0001,047
Q1 2017
1,011
1,087
Q2 2017
4 UASC Integration
Combined Entity UASCHapag-Lloyd
23
Q2 / H1 2017 I INVESTOR REPORT
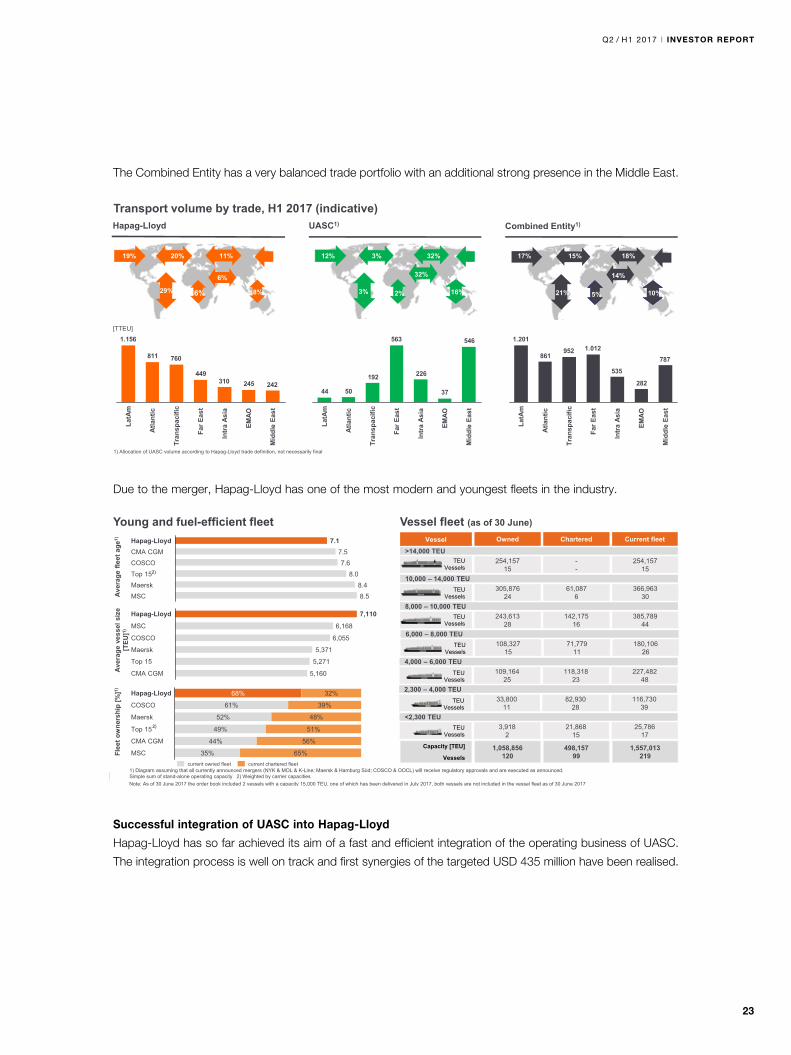
The Combined Entity has a very balanced trade portfolio with an additional strong presence in the Middle East.
Due to the merger, Hapag-Lloyd has one of the most modern and youngest fleets in the industry.
Successful integration of UASC into Hapag-Lloyd
Hapag-Lloyd has so far achieved its aim of a fast and efficient integration of the operating business of UASC.
The integration process is well on track and first synergies of the targeted USD 435 million have been realised.
3
Trade portfolio optimization – Enhanced market presence in attractiveMiddle East trade and solid position in all other tradesTransport volume by trade, H1 2017 (indicative)
1) Allocation of UASC volume according to Hapag-Lloyd trade definition, not necessarily final
4 UASC Integration
UASC1) Combined Entity1)
3%
12% 3%
2%
32%
16%
32%
29%
19% 11%
6% 8%
20%
6%
21%
17% 15%
5%
18%
10%
14%
Hapag-Lloyd
242245310449
760811
1.156
EMAO
Intr
a As
ia
Far E
ast
Tran
spac
ific
Atla
ntic
LatA
m
Mid
dle
East
546
37
226
563
192
5044
Atla
ntic
Mid
dle
East
Far E
ast
Tran
spac
ific
EMAO
Intr
a As
ia
LatA
m
787
282
535
1.012952861
1.201
EMAO
Intr
a As
ia
Tran
spac
ific
Far E
ast
Mid
dle
East
LatA
m
Atla
ntic
[TTEU]
1
Young and fuel-efficient fleet
MSC 8.5Maersk 8.4Top 15 8.0COSCO 7.6CMA CGM 7.5Hapag-Lloyd 7.1
Aver
age
vess
el s
ize
[TEU
]1)Av
erag
e fle
et a
ge1)
6,055
MSC 6,168
Hapag-Lloyd 7,110
CMA CGM
5,371Maersk
5,160
Top 15 5,271
COSCO
2)
Vessel
254,15715
--
Vessel fleet (as of 30 June)
>14,000 TEU 254,157
15
Owned Chartered Current fleet
1,058,856120
498,15799
1,557,013219
TEUVessels
Capacity [TEU]
Vessels
305,87624
61,0876
10,000 – 14,000 TEU366,963
30TEU
Vessels
243,61328
142,17516
8,000 – 10,000 TEU 385,789
44TEU
Vessels
108,32715
71,77911
6,000 – 8,000 TEU 180,106
26TEU
Vessels
109,16425
118,31823
4,000 – 6,000 TEU 227,482
48TEU
Vessels
33,80011
82,93028
2,300 – 4,000 TEU 116,730
39TEU
Vessels
3,9182
21,86815
<2,300 TEU 25,786
17TEU
Vessels
32%
MSC 35% 65%
CMA CGM 44% 56%
Top 15 49%
COSCO 61% 39%
Hapag-Lloyd 68%
51%
Maersk 52% 48%
Flee
t ow
ners
hip
[%]1)
2)
current chartered fleetcurrent owned fleet
Note: As of 30 June 2017 the order book included 2 vessels with a capacity 15,000 TEU, one of which has been delivered in July 2017, both vessels are not included in the vessel fleet as of 30 June 2017
1) Diagram assuming that all currently announced mergers (NYK & MOL & K-Line; Maersk & Hamburg Süd; COSCO & OOCL) will receive regulatory approvals and are executed as announced. Simple sum of stand-alone operating capacity 2) Weighted by carrier capacities
24
INVESTOR REPORT I Q2 / H1 2017
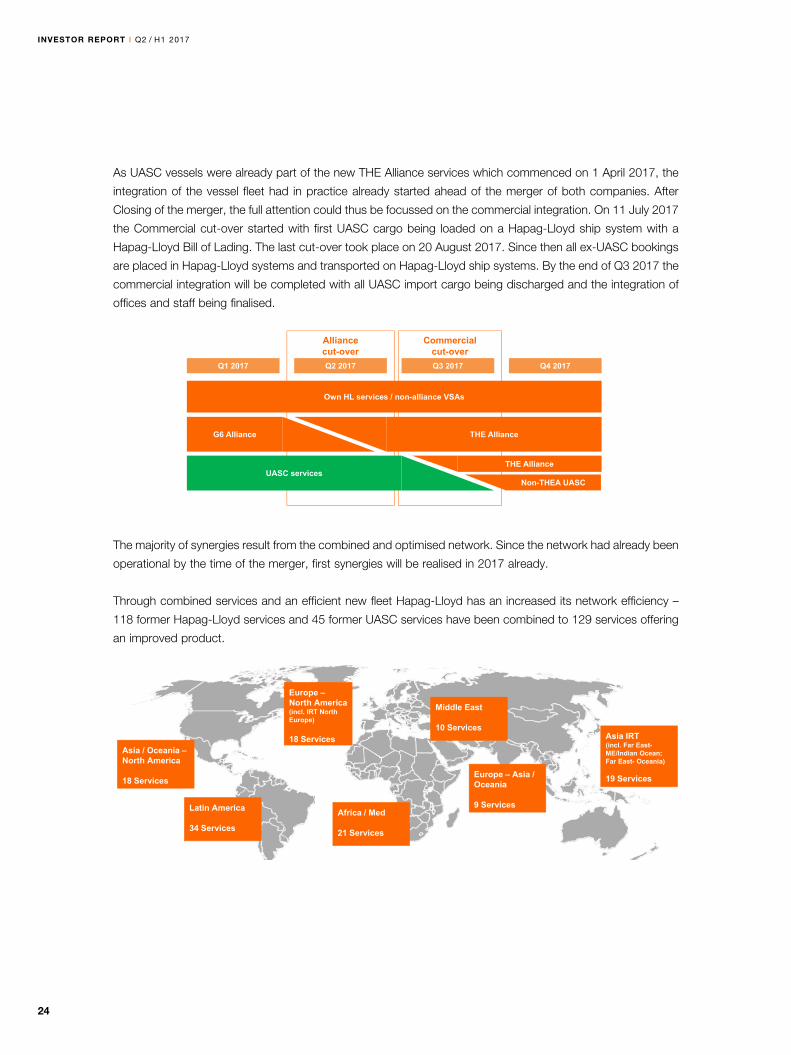
As UASC vessels were already part of the new THE Alliance services which commenced on 1 April 2017, the
integration of the vessel fleet had in practice already started ahead of the merger of both companies. After
Closing of the merger, the full attention could thus be focussed on the commercial integration. On 11 July 2017
the Commercial cut-over started with first UASC cargo being loaded on a Hapag-Lloyd ship system with a
Hapag-Lloyd Bill of Lading. The last cut-over took place on 20 August 2017. Since then all ex-UASC bookings
are placed in Hapag-Lloyd systems and transported on Hapag-Lloyd ship systems. By the end of Q3 2017 the
commercial integration will be completed with all UASC import cargo being discharged and the integration of
offices and staff being finalised.
The majority of synergies result from the combined and optimised network. Since the network had already been
operational by the time of the merger, first synergies will be realised in 2017 already.
Through combined services and an efficient new fleet Hapag-Lloyd has an increased its network efficiency –
118 former Hapag-Lloyd services and 45 former UASC services have been combined to 129 services offering
an improved product.
6
Network optimization – Combined network of 129 services offers a highly efficient global product
4 UASC Integration
Asia / Oceania –North America
18 Services
Africa / Med
21 Services
Latin America
34 Services
Europe – Asia / Oceania
9 Services
Asia IRT(incl. Far East-ME/Indian Ocean; Far East- Oceania)
19 Services
Europe –North America(incl. IRT North Europe)
18 Services
Middle East
10 Services
Through combined services and an efficient new fleet Hapag-Lloyd has increased its network efficiency – 118 former Hapag-Lloyd services and 45 former UASC services have been combined to 129 services offering an improved product
As UASC vessels were already part of THE Alliance services which commenced on 1 April 2017, network synergies could already be realized from day 1 onwards
Comments
5
Major integration projects well on track –Commercial integration to be completed by end of Q3
Commercialcut-over
Alliancecut-over
THE AllianceG6 Alliance
Q1 2017 Q2 2017 Q3 2017 Q4 2017
Own HL services / non-alliance VSAs
UASC servicesTHE Alliance
Non-THEA UASC
4 UASC Integration
25
Q2 / H1 2017 I INVESTOR REPORT
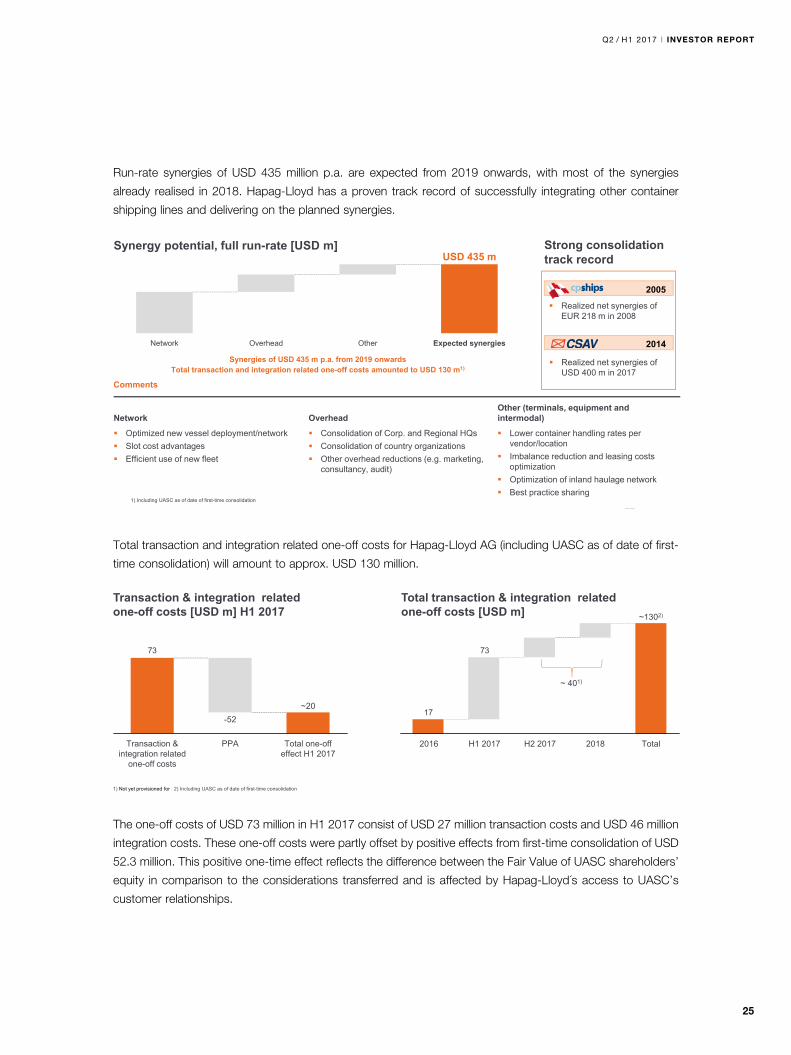
Run-rate synergies of USD 435 million p.a. are expected from 2019 onwards, with most of the synergies
already realised in 2018. Hapag-Lloyd has a proven track record of successfully integrating other container
shipping lines and delivering on the planned synergies.
Total transaction and integration related one-off costs for Hapag-Lloyd AG (including UASC as of date of first-
time consolidation) will amount to approx. USD 130 million.
The one-off costs of USD 73 million in H1 2017 consist of USD 27 million transaction costs and USD 46 million
integration costs. These one-off costs were partly offset by positive effects from first-time consolidation of USD
52.3 million. This positive one-time effect reflects the difference between the Fair Value of UASC shareholders’
equity in comparison to the considerations transferred and is affected by Hapag-Lloyd´s access to UASC’s
customer relationships.
1
Transaction & integration related one-off costs [USD m] H1 2017
73
17
~1302)
Total2018H2 2017H1 20172016
73
Transaction & integration related
one-off costs
PPA
~20-52
Total one-off effect H1 2017
~ 401)
Total transaction & integration related one-off costs [USD m]
1) Not yet provisioned for 2) Including UASC as of date of first-time consolidation
1
Synergies of USD 435 m p.a. expected from 2019 onwards –Focus on fast-track integration and realization of synergiesSynergy potential, full run-rate [USD m]
Synergies of USD 435 m p.a. from 2019 onwardsTotal transaction and integration related one-off costs amounted to USD 130 m1)
Expected synergies
USD 435 m
OtherOverheadNetwork
Network OverheadOther (terminals, equipment and intermodal)
Optimized new vessel deployment/network Slot cost advantages Efficient use of new fleet
Consolidation of Corp. and Regional HQs Consolidation of country organizations Other overhead reductions (e.g. marketing,
consultancy, audit)
Lower container handling rates per vendor/location
Imbalance reduction and leasing costs optimization
Optimization of inland haulage network Best practice sharing
Comments
Realized net synergies of EUR 218 m in 2008
2005
Strong consolidation track record
Realized net synergies of USD 400 m in 2017
2014
4 UASC Integration
1) Including UASC as of date of first-time consolidation
26
INVESTOR REPORT I Q2 / H1 2017
10. FINANCIAL CALENDAR 2017
14 November 2017 Publication of the Publication of the Financial Report 9M 2017
27
Q2 / H1 2017 I INVESTOR REPORT
11. DISCLAIMER
This report provides general information about Hapag-Lloyd AG. It consists of summary information based on
a calculation of USD figures. It does not purport to be complete and it is not intended to be relied upon as
advice to investors.
No representations or warranties, expressed or implied, are made as to, and no reliance should be placed on,
the accuracy, fairness or completeness of the information presented or contained in this report.
This report contains forward looking statements within the meaning of the 'safe harbor' provision of the US
securities laws. These statements are based on management's current expectations or beliefs and are subject
to a number of factors and uncertainties that could cause actual results to differ materially from those described
in the forward-looking statements. Actual results may differ from those set forth in the forward-looking state-
ments as a result of various factors (including, but not limited to, future global economic conditions, market
conditions affecting the container shipping industry, intense competition in the markets in which we operate,
potential environmental liability and capital costs of compliance with applicable laws, regulations and standards
in the markets in which we operate, diverse political, legal, economic and other conditions affecting the markets
in which we operate, our ability to successfully integrate business acquisitions and our ability to service our debt
requirements). Many of these factors are beyond our control.
This report is intended to provide a general overview of Hapag-Lloyd’s business and does not purport to deal
with all aspects and details regarding Hapag-Lloyd. Accordingly, neither Hapag-Lloyd nor any of its directors,
officers, employees or advisers nor any other person makes any representation or warranty, expressed or
implied, as to, and accordingly no reliance should be placed on, the fairness, accuracy or completeness of the
information contained in the presentation or of the views given or implied. Neither Hapag-Lloyd nor any of its
directors, officers, employees or advisors nor any other person shall have any liability whatsoever for any errors
or omissions or any loss howsoever arising, directly or indirectly, from any use of this information or its contents
or otherwise arising in connection therewith.
Neither the Company nor any of its affiliates, advisers or representatives make any undertaking to update any
such information subsequent to the date hereof.
Each investor must conduct and rely on its own evaluation in taking an investment decision.
Recipients of this report are not to construe the contents of this summary as legal, tax or investment advice
and recipients should consult their own advisors in this regard.
28
INVESTOR REPORT I Q2 / H1 2017
IMPRINT
Hapag-Lloyd AG
Ballindamm 25
20095 Hamburg
Investor Relations
Phone: +49 40 3001-2896
Fax: +49 40 3001-72896
Email: [email protected]
https://www.hapag-lloyd.com/en/ir.html