q3 2015 quarterly earnings call presentation relations... · 2015-11-12 · earnings call q3 2015...
TRANSCRIPT

Q3 2015 Quarterly Earnings Call
Presentation
November 12, 2015

Earnings Call Q3 2015 Presentation
Safe Harbor Statement
2
Certain statements and information included in this presentation constitute "forward-looking information" within the meaning of applicable Canadian securities legislation and"forward-looking statements" within the meaning of Section 27A of the Securities Act of 1933, as amended, and Section 21E of the Securities Exchange Act of 1934, asamended (collectively, "forward-looking statements"), which are made in reliance upon the protections provided by such legislation for forward-looking statements. Allstatements other than statements of historical facts included in this presentation, including statements regarding the update on the South Carolina Project, including theexpected cost savings and the expected capital expenditures for the project, the Company's losses resulting from the flooding at its Columbia facility and its insurancecoverage for such losses, the Company's dividends, the Company's renewed normal course issuer bid and the Company's outlook, including the expected fourth quarteradjusted EBITDA, 2015 manufacturing cost reductions, 2015 capital expenditures and the effective tax rate and cash taxes, may constitute forward-looking statements.These forward-looking statements are based on current beliefs, assumptions, expectations, estimates, forecasts and projections made by the Company's management.Words such as "may," "will," "should," "expect," "continue," "intend," "estimate," "anticipate," "plan," "foresee," "believe," or "seek" or the negatives of these terms or variationsof them or similar terminology are intended to identify such forward-looking statements. Although the Company believes that the expectations reflected in these forward-looking statements are reasonable, these statements, by their nature, involve risks and uncertainties and are not guarantees of future performance. Such statements are alsosubject to assumptions concerning, among other things: business conditions and growth or declines in the Company's industry, the Company's customers' industries and thegeneral economy; the anticipated benefits from the Company's manufacturing facility closures and other restructuring efforts; the quality, and market reception, of theCompany's products; the Company's anticipated business strategies; risks and costs inherent in litigation; the Company’s ability to maintain and improve quality and customerservice; anticipated trends in the Company's business; anticipated cash flows from the Company’s operations; availability of funds under the Company’s Credit Facility; andthe Company's ability to continue to control costs. The Company can give no assurance that these statements and expectations will prove to have been correct. Actualoutcomes and results may, and often do, differ from what is expressed, implied or projected in such forward-looking statements, and such differences may be material. Youare cautioned not to place undue reliance on any forward-looking statement.
For additional information regarding important factors that could cause actual results to differ materially from those expressed in these forward-looking statements and otherrisks and uncertainties, and the assumptions underlying the forward-looking statements, you are encouraged to read "Item 3. Key Information - Risk Factors," "Item 5.Operating and Financial Review and Prospects (Management's Discussion & Analysis)" and statements located elsewhere in the Company's annual report on Form 20-F forthe year ended December 31, 2014 and the other statements and factors contained in the Company's filings with the Canadian securities regulators and the US Securitiesand Exchange Commission. Each of these forward-looking statements speaks only as of the date of this presentation. The Company will not update these statements unlessapplicable securities laws require it to do so.
This presentation contains certain non-GAAP financial measures as defined under applicable securities legislation, including Adjusted EBITDA, Adjusted EBITDA as aPercentage of Revenue, Adjusted Net Earnings, Adjusted Earnings per Share, Free Cash Flow, and Debt to Trailing Twelve Month (“TTM”) Adjusted EBITDA. The Companybelieves such non-GAAP financial measures improve the transparency of the Company’s disclosures, and improves the period-to-period comparability of the Company’sresults from its core business operations. As required by applicable securities legislation, the Company has provided definitions of these non-GAAP measures contained inthis presentation, as well as a reconciliation of each of them to the most directly comparable GAAP measure, on its website at http://www.intertapepolymer.com under“Investor Relations” and “Events and Presentations” and “Investor Presentations. You are encouraged to review the related GAAP financial measures and the reconciliationof non-GAAP measures to their most directly comparable GAAP measures set forth on the website and should consider non-GAAP measures only as a supplement to, not asa substitute for or as a superior measure to, measures of financial performance prepared in accordance with GAAP.

Earnings Call Q3 2015 Presentation
• Revenue of $200.6MM, an increase of 2.1%– Sales volume increased 2% - certain tape products
• Gross margin decreased to 21.3% from 21.6%– Higher manufacturing overhead due to planned annual maintenance shut downs– Partially offset by increase in the spread between selling prices and lower raw material
costs
• Net Earnings of $15.7MM, an increase of 33%
• Adjusted EBITDA of $26.8MM, a decrease of 1.1% – Increase in research expenses mainly related to the South Carolina Project*
Q3 2015 vs Q2 2015 Highlights
3
*The South Carolina Project refers to refers to the previously announced relocation and modernization of the Company’s Columbia, South Carolina manufacturing operation. This project involves moving the Company’s duct tape and masking tape production to a new state-of-the-art facility in Blythewood, South Carolina as well as moving flatback tape production to the Company’s existing facility in Marysville, Michigan.

Earnings Call Q3 2015 Presentation
• Revenue of $200.6MM, a decrease of 4.1%– Average selling price, including the impact of unfavourable product mix and an unfavourable foreign
exchange impact, decreased 7%– Revenue reduction of $5.6MM attributed to the commissioning of the South Carolina Project– Sales volume increased 3% - demand for certain tape and woven products– Additional revenue of $4.8MM due to the Better Packages acquisition
• Gross margin increased to 21.3% from 19.4%– Increase in the spread between selling prices and lower raw material costs, non-recurrence of the
Brantford Pension Charge* and the favourable impact of the Company’s manufacturing cost reduction programs,
– Partially offset by unfavourable product mix, an increase in manufacturing inefficiencies mainly related to the South Carolina Project, an increase in certain manufacturing costs and an unfavourable foreign exchange impact
• Net Earnings of $15.7MM, an increase of $9.6MM– Decrease in SG&A, higher gross profit, and a decrease in manufacturing facility closures,
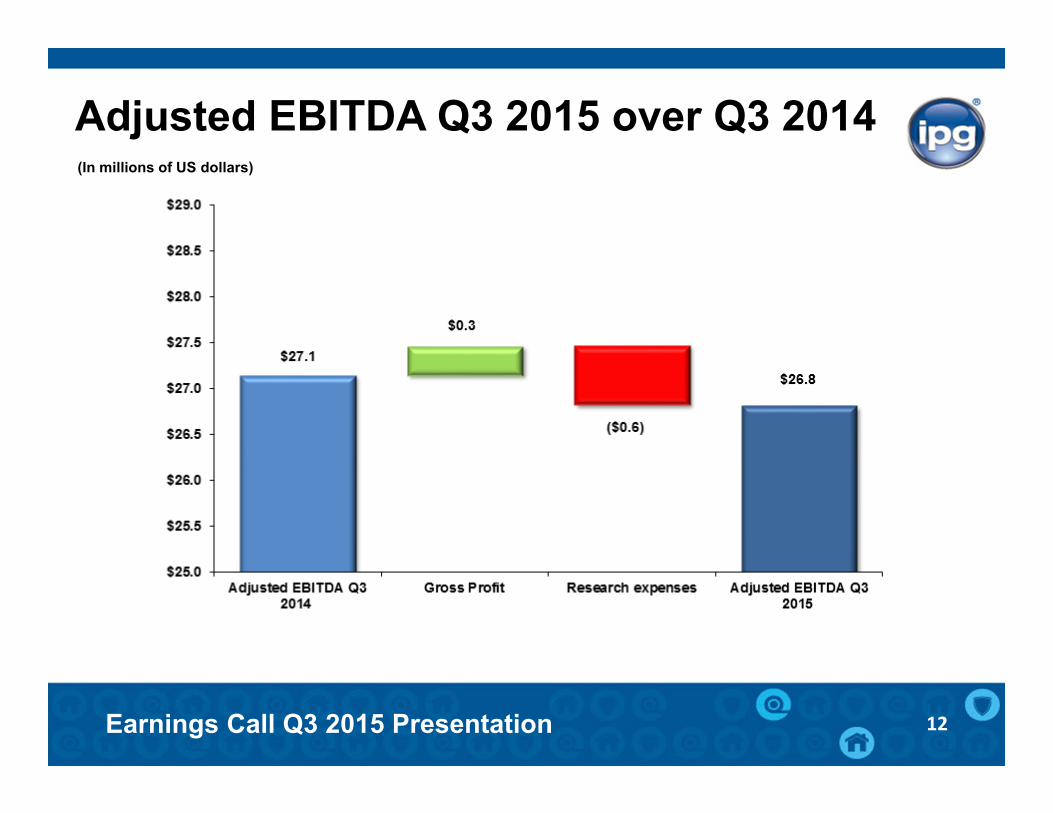
restructuring and other related charges, and a reduction in finance costs.• Adjusted EBITDA of $26.8MM, a decrease of 1.2%
– Increases in research expenses mainly related to the South Carolina Project partially offset by higher gross profit
Q3 2015 vs Q3 2014 Highlights
4
*The Brantford Pension Charge refers to a charge related to the settlement of the former Brantford, Ontario Manufacturing Facility Pension Plan.

Earnings Call Q3 2015 Presentation
• Revenue of $586.2MM, a decrease of 4.2%– Average selling price, including the impact of unfavourable product mix and an
unfavourable foreign exchange impact, decreased 6%– Revenue reduction of $10.5MM attributed to the commissioning of the South Carolina
Project– Sales volume increased 2% - increased demand for tape and woven products – Additional revenue of $9.1MM due to the Better Packages acquisition
• Gross margin was unchanged at 20.8%• Net Earnings of $39.2MM, an increase of 32%
– Decrease in income tax expense, SG&A, manufacturing facility closures, restructuring and other related charges, and finance costs
– Partially offset by a decrease in gross profit and an increase in research expenses• Adjusted EBITDA of $77.5MM, a decrease of 7.0%
– Lower gross profit, an increase in SG&A expenses, and an increase in research expenses
– Partially offset by a decrease in variable compensation expenses
Q3 YTD 2015 Highlights(as compared to Q3 YTD 2014)
5

Earnings Call Q3 2015 Presentation
Capital Expenditures
6
(In millions of US dollars)
Expected range

Earnings Call Q3 2015 Presentation
Manufacturing Cost Reductions (1)
7
(1) Approximate values. Cost reductions are calculated by comparing the cost of a manufacturing process before and after implementing an improvement. The savings are reported for a period of 12 months upon implementation of the initiative.
(In millions of US dollars)
Expected range

Earnings Call Q3 2015 Presentation
Other Significant Items
8
• TaraTape Acquisition on November 2, 2015– Manufacturer of filament and pressure sensitive tapes– Purchase price $11.0MM, subject to a post-closing working capital adjustment, funded by
revolving credit facility– Revenue for the most recently completed fiscal year was approximately $20MM
• Normal Course Issuer Bid Amended November 11, 2015– Amended to repurchase up to 4 million shares (previously 2 million share maximum)– Repurchased 2,487,188 common shares for a total purchase price of $30MM during
2015 through November 11, 2015
• Dividends– Dividend of $0.12 per common share paid on March 31 and June 30, 2015– Dividend of $0.13 per common share paid on September 30 and payable on December
31, 2015 to shareholders of record on December 15, 2015– Dividends paid expected to total approximately $30MM in 2015

Earnings Call Q3 2015 Presentation
Revenue Analysis
9
(In millions of US dollars)
(1) Reduction in revenue attributed to sales generated while the Company was in the process of commissioning the duct production line and therefore was accounted for as a reduction of revenue and a reduction of the cost of the South Carolina Project. However, the impact on gross profit and capital expenditures was not significant due to the requirement to offset this revenue with the associated cost of sales in the reclassification of the gross profit as a reduction of the capital expenditures.

Earnings Call Q3 2015 Presentation
Summary Q3 2015 Results
10
(1) Excluding EPS

Earnings Call Q3 2015 Presentation
Net Earnings Q3 2015 over Q3 2014
11
(In millions of US dollars)
Earnings Call Q3 2015 Presentation
Adjusted EBITDA Q3 2015 over Q3 2014
12
(In millions of US dollars)

Earnings Call Q3 2015 Presentation
Net Earnings Q3 2015 over Q2 2015
13
(In millions of US dollars)

Earnings Call Q3 2015 Presentation
Adjusted EBITDA Q3 2015 over Q2 2015
14
(In millions of US dollars)

Earnings Call Q3 2015 Presentation
Net Earnings Q3 YTD 2015 over Q3 YTD 2014
15
(In millions of US dollars)

Earnings Call Q3 2015 Presentation
Adjusted EBITDA Q3 YTD 2015 over Q3 YTD 2014
16
(In millions of US dollars)

Earnings Call Q3 2015 Presentation
Summary Q3 2015 Results
17

Earnings Call Q3 2015 Presentation
Columbia, SC Flood on October 4, 2015
18
• Permanent shutdown of the Columbia, SC facility due to significant flood damage
• 8 to 9 months in advance of the planned shutdown by the end of Q2 2016
• The Company believes that the losses will be substantially covered by insurance policies (deductible of $0.5 million)
• Estimated loss on damaged inventory ~$4MM
• Impairment of property, plant and equipment ~$1MM (for accounting purposes)
• Still assessing impact related to: property damage, business interruption, site clean-up and environmental remediation, and professional fees related to the insurance claim process

Earnings Call Q3 2015 Presentation
Update on South Carolina Project
19
Actual Project Results Q2 2015 Q3 2015 Q3 YTD2015
Net negative impact on gross profit and adjusted EBITDA
$1.3MM $0.6MM $1.9MM
South Carolina Duplicate Overhead Costs
$0.8MM $1.3MM $4.3MM
South Carolina Project Capital Expenditures
$0.8MM $1.9MM $6.0MM
• Guidance for expected cost savings from the South Carolina Project remains unchanged.• Duct tape production efficiency significantly improved by the end of the third quarter• Masking tape production beginning in Blythewood & Marysville in the fourth quarter
• Total project capital expenditures are expected to increase from the previously announced $55MM.
• South Carolina Duplicate Overhead Costs were estimated to be approximately $1MM per quarter until the completion of the masking tape transfer. As of October 4, 2015, they are now expected to be $0.

Earnings Call Q3 2015 Presentation
Outlook
20
Considering the uncertainty of numerous variables associated with the Columbia, South Carolina facility storm damage, the Company is limiting its guidance at this time to the following:
• Adjusted EBITDA in the fourth quarter of 2015, excluding the majority of the various impacts of the Columbia, South Carolina flood, is anticipated to be higher compared to the fourth quarter of 2014.
• Manufacturing cost reductions for 2015 are expected to be between $9 and $12 million, consistent with guidance provided in the second quarter of 2015 earnings presentation.
• Total capital expenditures for 2015 are still expected to be between $32 and $37 million, consistent with guidance provided in the second quarter of 2015 earnings presentation. Total capital expenditures for 2016 are expected to be greater than $40 million.
• The Company expects the effective tax rate for the fourth quarter of 2015 and full year 2016 to remain at approximately 25% to 30%, assuming the geographic source of earnings is consistent with first nine months of 2015.
• Cash taxes paid in 2015 are expected to be between $5 and $6 million and are expected to be approximately half of the income tax expense in 2016.

Earnings Call Q3 2015 Presentation 21
Industrial Packaging
Marine & Composites
Building & ConstructionHVAC
Geo Membrane AerospaceStructured FabricsAutomotive Aftermarket