q3 2016 earnings - s3.amazonaws.com · % of net revenue 14.9% 14.0% +0.9ppts adjustments (to gaap...
TRANSCRIPT

Q3 2016 Earnings

Related to Forward-Looking StatementsCertain items in this presentation and in today’s discussion, including matters relating to revenue, net income (loss), and percentages or calculations using these measures, capital structure, future business opportunities, plans, prospects or growth rates and other financial measurements and non-financial statements in future periods, constitute forward-looking statements. These forward-looking statements are based on management’s current views with respect to future results and are subject to risks and uncertainties. These statements are not guarantees of future performance. Actual results may differ materially from those contemplated by forward-looking statements. Travelport Worldwide Limited (the ‘Company’ or ‘Travelport’) refers you to our periodic reports and filings with the Securities and Exchange Commission (SEC), including our Annual Report on Form 10-K for the year ended December 31, 2015, filed with the SEC on February 18, 2016 and our Quarterly Reports on Form 10-Q for the quarter ended March 31, 2016, filed with the SEC on May 5, 2016, for the quarter ended June 30, 2016, filed with the SEC on August 4, 2016 and for the quarter ended September 30, 2016 to be filed with SEC on November 3, 2016, for additional discussion of these risks and uncertainties, as well as a cautionary statement regarding forward-looking statements. Forward-looking statements made during this presentation speak only as of today’s date. Travelport expressly disclaims any obligation to update or revise any forward-looking statements, whether as a result of new information, future events or otherwise.
Related to Non-GAAP Financial InformationTravelport analyzes its performance using Adjusted EBITDA, Adjusted Net Income/(Loss), Adjusted Income/(Loss) per Share, Adjusted Operating Income/(Loss), Capital Expenditures, Net Debt, and Adjusted Free Cash Flow, which are non-GAAP financial measures. Such measures may not be comparable to similarly named measures used by other companies. We utilize these measures to provide useful supplemental information to assist investors in understanding and assessing our performance and financial results on the same basis that management uses internally. These adjusted financial measures provide investors greater transparency with respect to key metrics used by management to evaluate our core operations, forecast future results, determine future capital investment allocations and understand business trends within the industry. Management believes the adjusted financial measures assist investors in the comparison of financial results between periods as such measures exclude certain items that management believes are not reflective of our core operating performance consistent with how management reviews the business. Adjusted EBITDA is the primary metric, used to evaluate and understand our underlying operations and business trends, forecasting and determining future capital investment allocations. Adjusted EBITDA, Adjusted Net Income/(Loss), Adjusted Income/(Loss) per Share and Adjusted Operating Income/(Loss) are also used by the Board of Directors to determine incentive compensation for future periods. Capital Expenditures, which impact depreciation and amortization, interest expense and income tax expense, are reviewed separately by management. These non-GAAP measures are defined in the ‘Definitions’ appendix of this presentation and discussed and reconciled to GAAP measures in our quarterly and annual filings with the SEC.
Disclaimers
2This document supports the Company’s Q3 2016 Results Presentation, a recording of which will be available on Travelport’s investor relations website shortly after the live presentation on November 3, 2016

Q3 2016Gordon WilsonPresident and Chief Executive Officer

Q3 2016 key point summary
4
Net revenue up 6%, Adjusted EBITDA up 15% and Adjusted EPS (diluted) up 32%
Continued leadership in Beyond Air, up 18%; eNett net revenue up 60%
Strong cash generation; Adjusted Free Cash Flow up $52m
Voluntary $50m principal prepayment of term loans; net leverage ratio down to 3.9x
%%
Revenue and Reported Segments
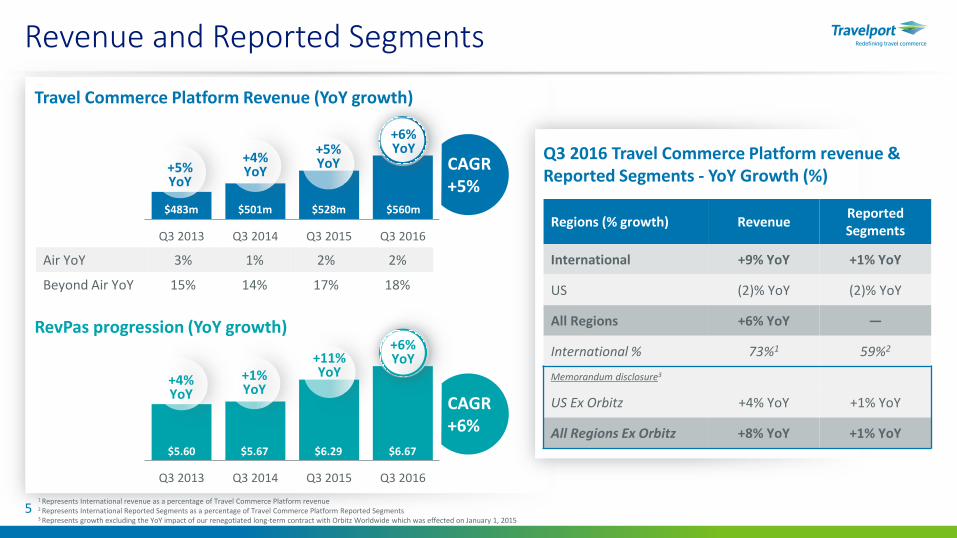
Travel Commerce Platform Revenue (YoY growth)
RevPas progression (YoY growth)
Regions (% growth) RevenueReportedSegments
International +9% YoY +1% YoY
US (2)% YoY (2)% YoY
All Regions +6% YoY —
International % 73%1 59%2
Memorandum disclosure3
US Ex Orbitz +4% YoY +1% YoY
All Regions Ex Orbitz +8% YoY +1% YoY
Air YoY 3% 1% 2% 2%
Beyond Air YoY 15% 14% 17% 18%
Q3 2016 Travel Commerce Platform revenue & Reported Segments - YoY Growth (%)
5
Q3 2013 Q3 2014 Q3 2015 Q3 2016
$6.29 $5.60 $5.67 $6.67
+1%YoY
+11%YoY
+6%YoY
CAGR+6%
CAGR+5%
Q3 2013 Q3 2014 Q3 2015 Q3 2016
+4%YoY
+5%YoY
+6%YoY
+5%YoY
$483m $501m $528m $560m
+4%YoY
1 Represents International revenue as a percentage of Travel Commerce Platform revenue2 Represents International Reported Segments as a percentage of Travel Commerce Platform Reported Segments3 Represents growth excluding the YoY impact of our renegotiated long-term contract with Orbitz Worldwide which was effected on January 1, 2015

6
Recent developments – Air
Away1
Air revenue
Q3 201666%2
AwayAir segments
Q3 201646%3
Airline merchandising
Q3 2016>180 Airlines4
Air revenue ($m)
CAGR+2%
$387m $390m $399m $408m
+3%YoY
+1%YoY
+2%YoY
+2%YoY
Q3 2016Q3 2015Q3 2014Q3 2013
1 Away bookings are defined as bookings made by travel buyers located outside the travel provider’s home country2 Represents % of total air segment revenue from Away bookings3 Represents % of total air segments from Away bookings4 Airlines live with merchandising including fares families, branded fares, ancillaries and tailored offers as of November 3, 2016
Air revenue up 2% with good performance in Europe and Asia Pacific, and RevPas benefit from airline merchandising
Continue to lead the industry for airline merchandising with >210 airlines signed and >180 implemented
Industry-first partnership with IndiGo, India’s largest carrier and one of the world’s fastest growing airlines
Strategic partnership with Mastercard expanding our data and analytics services to the airline industry

Beyond Air revenue up 18% (almost all organic) with growth across payments, mobile and hospitality
Attachment rate maintained at 49; with hospitality segments and airline tickets issued both increasing
Renewal of long-term mobile partnership with easyJet. Launched new apps for Aeroméxico and SilkAir. Added Collinson Group and XL Travel as new customers
eNett revenue up 60% (9M: up 72%). Continue to onboard new customers and grow share of wallet with existing customers
49 – Hospitality attachment1
Recent developments – Beyond Air
Beyond Air revenue ($m)
CAGR+16%
Q3 2016
stable YoY
17m – Hotel room nights sold
Q3 2016
+3% YoY
26m – Car rentaldays sold
Q3 2016
+2% YoY
Q3 2013 Q3 2014 Q3 2015 Q3 2016
$96m $111m $129m $152m
+15%YoY
+14%YoY
+17%YoY
+18%YoY
Q3 2013 Q3 2014 Q3 2015 Q3 2016
eNett revenue ($m)
+127%YoY
+44%YoY
+48%YoY
+60%YoY
CAGR+51%$12m $18m $27m $42m
71 Hospitality segments per 100 airline tickets issued

Q3 2016Bernard BotChief Financial Officer

Summarized income statement (1 of 2)
* SG&A – excluding ‘Non-core corporate costs’9
$ millions Q3 2016 Q3 2015 Better / (Worse)
Net revenue 591 560 6%
Commissions (274) (261) (5)%
Add back: Amortization of CLPs 21 15 44%
Subtotal 338 314 8%
% of Net revenue 57.2% 56.0% 1.2ppts
Technology costs (78) (75) (4)%
SG&A* (110) (108) (2)%
Adjusted EBITDA 150 131 15%
% of Net revenue 25.5% 23.4% 2.1ppts
Depreciation on property and equipment (42) (38) (9%)
Amortization of CLPs (21) (15) (44%)
Adjusted Operating Income 88 78 12%
% of Net revenue 14.9% 14.0% +0.9ppts
Adjustments (to GAAP Operating Income) (26) (24) (6%)
GAAP Operating Income 62 54 15%

Summarized income statement (2 of 2)
n/m = percentage calculated not meaningful1 ‘Interest expense, net’ in Q3 2016 excludes a $5m unrealized gain on interest rate derivative contracts, which is included within GAAP interest expense, net2 ‘Remaining provision for income taxes’ excludes the tax impact of items excluded from Adjusted Net Income
10
$ millions Q3 2016 Q3 2015 Better / (Worse)
Adjusted Operating Income 88 78 12%
Interest expense, net1 (34) (40) 15%
Subtotal 54 38 41%
Remaining provision for income taxes2 (13) (8) (61)%
Adjusted Net Income 41 30 36%
Amortization of acquired intangible assets (12) (18) 34%
Other adjustments (to GAAP Net Income) (8) (7) (9%)
GAAP Net Income 21 5 n/m
Adjusted Earnings Per Share – diluted $0.33 $0.25 $0.08
GAAP Earnings Per Share – diluted $0.17 $0.03 $0.14

Summary cash flows
n/m = percentage calculated not meaningful1 Includes purchase of property and equipment of $25m (Q3 2015: $23m) and repayment of capital lease obligations and other indebtedness of $11m (Q3 2015: $10m)2 ‘Other adjusting items’ relate to payments for corporate and restructuring costs
11
$ millions Q3 2016 Q3 2015 Better / (Worse)
Adjusted EBITDA 150 131 15%
Interest payments (24) (36) 34%
Tax payments (6) (5) (36)%
Changes in working capital and other related items 12 (11) n/m
Customer loyalty payments (13) (13) 6%
Defined benefit plan funding (1) (1) 17%
Capital Expenditures1 (36) (33) (7)%
Adjusted Free Cash Flow 83 31 167%
Other adjusting items2 (8) (3) n/m
Dividend to shareholders (9) (9) -
Repayment of term loans (56) (6) n/m
Acquisitions - (61) n/m
Other 2 22 n/m
Net increase/(decrease) in cash and cash equivalents 11 (26) n/m

Net Debt and Leverage
12
Net Debt down to $2.2bn
Net leverage ratio falls to 3.9x
Reminder of key terms
No significant maturities until 2021.
Further opportunity to re-price/re-finance post
December 2016
$ millions September 30, 2016 June 30, 2016 March 31, 2016Term Loan1 2,240 2,292 2,296
Capital leases and other indebtedness 119 118 129
Cash (138) (127) (128)
Net Debt 2,220 2,284 2,297
LTM Adjusted EBITDA2 573 554 552
Ratio 3.9x 4.1x 4.2x
1 Net of unamortized debt discount and unamortized debt issuance costs2 Adjusted EBITDA on a last twelve months (LTM) basis
Voluntary prepayment
In September, we made a voluntary prepayment of $50m (principal) of term
loans
Q3 benefit from re-price
Now paying LIBOR +400bps (with 1% LIBOR floor).
Interest rate swap (fixed at 1.4%) on notional
$1.4 billion effective from Feb 2017

Q3 2016Gordon WilsonPresident and Chief Executive Officer

Summary
Robust set of results
Revenue growth of 6% and Adjusted EBITDA up 15%.
Strong cash generation with further debt pay down
Guidance unchanged
Political and economic uncertainty continuing to impact industry growth; anticipate that full year
net revenue will come in towards the lower end of
our guidance range
14
Strong competitive performance
Continue to out-perform in key International
markets
Commercial momentum continues
With a number of key commercial deals and
strong industry recognition for airline
content, agency business, mobile services and
payments

Q3 2016AppendicesFinancial StatisticsOperating StatisticsKey FinancialsFull year 2016 guidanceDefinitions

Financial statistics
Travel Commerce Platform Revenue by Region ($ thousands) Q3 2016 Q3 2015 Better / (Worse) 9M 2016 9M 2015 Better / (Worse)
Asia Pacific 129,309 117,145 10% 388,330 350,315 11%
Europe 180,746 159,193 14% 558,303 474,833 18%
Latin America & Canada 26,336 27,022 (3)% 82,617 75,082 10%
Middle East & Africa 72,833 71,581 2% 223,629 219,529 2%
International 409,224 374,941 9% 1,252,879 1,119,759 12%
% of Travel Commerce Platform revenue 73% 71% 2.1ppts 73% 70% 2.8ppts
United States 150,559 153,023 (2)% 459,848 472,520 (3)%
Total Travel Commerce Platform revenue 559,783 527,964 6% 1,712,727 1,592,279 8%
Net Revenue ($ thousands) Q3 2016 Q3 2015 Better / (Worse) 9M 2016 9M 2015 Better / (Worse)
Air 407,926 398,781 2% 1,277,671 1,231,276 4%
Beyond Air 151,857 129,183 18% 435,056 361,003 21%
Travel Commerce Platform 559,783 527,964 6% 1,712,727 1,592,279 8%
Technology Services 30,973 31,873 (3)% 93,197 93,888 (1)%
Net Revenue 590,756 559,837 6% 1,805,924 1,686,167 7%
Travel Commerce Platform revenue as a % of Net revenue 95% 94% 0.5ppts 95% 94% 0.4ppts
Beyond Air revenue as a % of Travel Commerce Platform revenue 27% 24% 2.7ppts 25% 23% 2.7ppts
% of Air segment revenue from away bookings 66% 65% 1.1ppts 67% 65% 1.9ppts
16

Operating statistics
1 A hospitality segment refers to one complete hospitality booking. For example, a five night hotel stayequals one hospitality segment. Hospitality includes hotel, car, rail and other non-air bookings.
Reported Segments by Region (thousands) Q3 2016 Q3 2015 Better / (Worse) 9M 2016 9M 2015 Better / (Worse)
Asia Pacific 16,735 16,002 5% 50,733 48,763 4%
Europe 19,588 19,407 1% 63,282 62,476 1%
Latin America & Canada 4,279 4,269 — 13,353 12,750 5%
Middle East & Africa 9,243 9,601 (4)% 28,876 29,451 (2)%
International 49,845 49,279 1% 156,244 153,440 2%
United States 34,100 34,700 (2)% 104,481 112,209 (7)%
Total Reported Segments 83,945 83,979 — 260,725 265,649 (2)%
Travel Commerce Platform RevPas Q3 2016 Q3 2015 Better / (Worse) 9M 2016 9M 2015 Better / (Worse)
International RevPas $8.21 $7.61 8% $8.02 $7.30 10%
United States RevPas $4.41 $4.41 — $4.40 $4.21 5%
Travel Commerce Platform RevPas $6.67 $6.29 6% $6.57 $5.99 10%
Selected Travel Commerce Platform metrics Q3 2016 Q3 2015 Better / (Worse) 9M 2016 9M 2015 Better / (Worse)
Transaction value processed on the Travel Commerce Platform ($k) 19,912,707 20,791,039 (4)% 60,833,894 64,244,861 (5)%
Hotel room nights sold (thousands) 16,945 16,508 3% 50,041 49,134 2%
Car rental days sold (thousands) 25,669 25,231 2% 71,832 69,965 3%
Hospitality segments per 100 airline tickets issued (1) 49 49 — 47 46 2%
17

$ thousands Q3 2016 Q3 2015 Better / (Worse) 9M 2016 9M 2015 Better / (Worse)
Net Revenue 590,756 559,837 6% 1,805,924 1,686,167 7%
Adjusted EBITDA 150,432 130,977 15% 443,585 405,421 9%
Depreciation on property and equipment (41,743) (38,223) (9)% (121,375) (119,333) (2)%
Amortization of customer loyalty payments (20,932) (14,530) (44)% (55,193) (50,797) (9)%
Adjusted Operating Income 87,757 78,224 12% 267,017 235,291 13%
Interest expense, net1 (34,204) (40,346) 15% (112,350) (118,486) 5%
Remaining provision for income taxes (12,558) (7,791) (61)% (28,430) (21,654) (31)%
Adjusted Net Income 40,995 30,087 36% 126,237 95,151 33%
Amortization of acquired intangible assets (11,838) (18,047) 34% (36,693) (55,812) 34%
Non-core corporate costs2 (9,293) (6,086) n/m (67,932) (28,493) n/m
Tax impact of adjustments 2,495 (662) n/m 6,170 (2,349) n/m
Share of losses in equity method investments — (342) n/m — (517) n/m
Gain on sale of share of Orbitz Worldwide — — — — 6,271 n/m
Loss on early extinguishment of debt (955) — n/m (3,626) — n/m
Net Income 21,404 4,950 n/m 24,156 14,251 70%
Summarized income statement
n/m = percentage calculated not meaningful1 ‘Interest expense, net’ excludes unrealized gains and losses on interest rate derivative contracts (Q3 2016: $4,391k gain; 9M 2016: $17,471 loss), which is included within ‘Non-core corporate costs’2 ‘Non-core corporate costs’ include Equity-based compensation and related taxes, Corporate and restructuring costs, and Other–non cash (which consists of unrealized gains and losses on foreign currency derivative contracts, impairment ofproperty and equipment, unrealized gains and losses on interest rate derivative contracts, and other gains and losses)
18
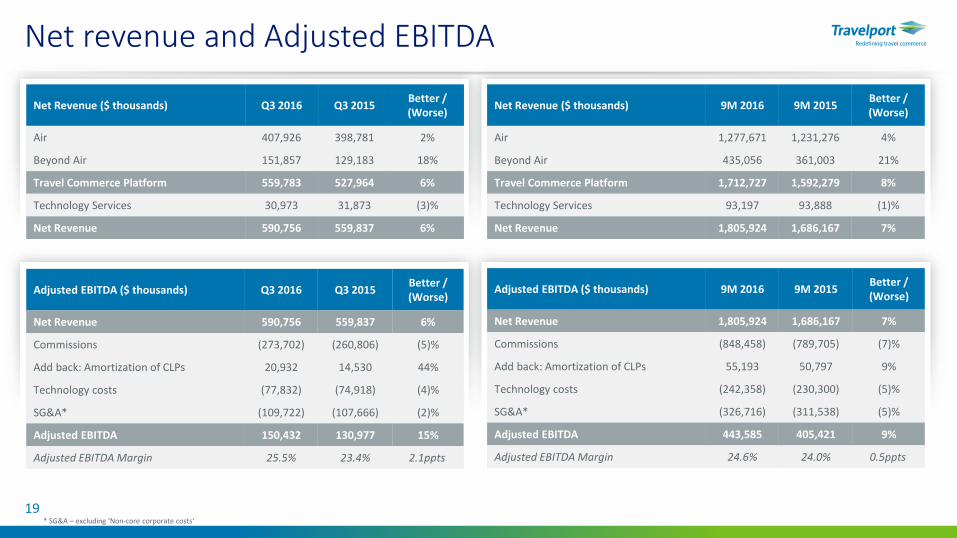
Net revenue and Adjusted EBITDA
Net Revenue ($ thousands) Q3 2016 Q3 2015Better / (Worse)
Air 407,926 398,781 2%
Beyond Air 151,857 129,183 18%
Travel Commerce Platform 559,783 527,964 6%
Technology Services 30,973 31,873 (3)%
Net Revenue 590,756 559,837 6%
Adjusted EBITDA ($ thousands) Q3 2016 Q3 2015Better / (Worse)
Net Revenue 590,756 559,837 6%
Commissions (273,702) (260,806) (5)%
Add back: Amortization of CLPs 20,932 14,530 44%
Technology costs (77,832) (74,918) (4)%
SG&A* (109,722) (107,666) (2)%
Adjusted EBITDA 150,432 130,977 15%
Adjusted EBITDA Margin 25.5% 23.4% 2.1ppts
Net Revenue ($ thousands) 9M 2016 9M 2015Better / (Worse)
Air 1,277,671 1,231,276 4%
Beyond Air 435,056 361,003 21%
Travel Commerce Platform 1,712,727 1,592,279 8%
Technology Services 93,197 93,888 (1)%
Net Revenue 1,805,924 1,686,167 7%
Adjusted EBITDA ($ thousands) 9M 2016 9M 2015Better / (Worse)
Net Revenue 1,805,924 1,686,167 7%
Commissions (848,458) (789,705) (7)%
Add back: Amortization of CLPs 55,193 50,797 9%
Technology costs (242,358) (230,300) (5)%
SG&A* (326,716) (311,538) (5)%
Adjusted EBITDA 443,585 405,421 9%
Adjusted EBITDA Margin 24.6% 24.0% 0.5ppts
19* SG&A – excluding ‘Non-core corporate costs’

Income per share
Income per share ($) Q3 2016 Q3 2015 9M 2016 9M 2015
Income per share – Diluted 0.17 0.03 0.18 0.09
Adjusted Income per Share – Diluted 0.33 0.25 1.02 0.78
Weighted average shares (millions) Q3 2016 Q3 2015 9M 2016 9M 2015
Weighted average common shares outstanding – Basic 123.9 122.5 123.8 122.1
Weighted average common shares outstanding – Diluted 124.3 122.7 124.2 122.6
20

Summary cash flows, Capital Expenditures and Net Debt
Adjusted Free Cash Flow ($ thousands) Q3 2016 Q3 2015 9M 2016 9M 2015
Adjusted EBITDA 150,432 130,977 443,585 405,421
Interest payments (24,134) (36,436) (110,988) (109,168)
Tax payments (6,496) (4,773) (15,069) (18,045)
Changes in working capital and other related items 12,391 (11,048) (23,776) (54,483)
Customer loyalty payments (12,611) (13,468) (56,533) (55,679)
Defined benefit plan funding (603) (726) (2,440) (2,276)
Capital Expenditures (35,809) (33,413) (104,336) (101,974)
Adjusted Free Cash Flow 83,170 31,113 130,443 63,796
Capital Expenditures ($ thousands) Q3 2016 Q3 2015 9M 2016 9M 2015
Purchase of property and equipment 25,145 23,891 70,130 76,385
Repayment of capital lease obligations and other indebtedness 10,664 9,522 34,206 25,589
Total 35,809 33,413 104,336 101,974
Total Capital Expenditures as % of Net revenue 6.1% 6.0% 5.8% 6.0%
1 Net of unamortized debt discount and unamortized debt issuance costs
21
Net Debt ($ thousands) September 30, 2016 June 30, 2016 March 31, 2016
Term Loan1 2,239,832 2,292,472 2,296,034
Capital leases and other indebtedness 118,557 118,310 128,655
Cash (138,400) (126,937) (127,993)
Net Debt 2,219,989 2,283,845 2,296,696

22
Full year 2016 guidance
* Guidance assumes spot foreign exchange rates as of October 27, 2016** Based on expected FY fully diluted shares outstanding of 125m
The information presented here represent forward-looking statements and reflect our expectations as of November 3, 2016. We assume no obligation to update these statements. Results may be materially different and are affected by many factorsdetailed in this presentation and in our Annual Report on Form 10-K for the year ended December 31, 2015, filed with the SEC on February 18, 2016 and our Quarterly Reports on Form 10-Q for the quarter ended March 31, 2016, filed with the SEC on May 5,2016, the quarter ended June 30, 2016, filed with the SEC on August 4, 2016, and the quarter ended September 30, 2016 to be filed with the SEC on November 3, 2016..
(in $ millions, except per share amounts)FY 2016
Guidance*Growth
Net revenue 2,350 – 2,400 6% – 8%
Adjusted EBITDA 565 – 580 6% – 8%
Adjusted Net Income 145 – 155 19% – 27%
Adjusted Income per Share – diluted** 1.16 – 1.24 16% – 24%
Adjusted Free Cash Flow 150 – 170 12% – 27%

Adjusted EBITDA is defined as Adjusted Net Income (Loss) excluding depreciation and amortization of property and equipment, amortization of customer loyalty payments, interest expense, net (excluding unrealized gains (losses) on interest rate derivative instruments), and related income taxes.
Adjusted Free Cash Flow is defined as net cash provided by (used in) operating activities of continuing operations, adjusted to remove the impact of cash paid for other adjusting items which we believe are unrelated to our ongoing operations and to deduct Capital Expenditures.
Adjusted Income (Loss) per Share – Diluted is defined as Adjusted Net Income (Loss) for the period divided by the weighted average number of dilutive common shares.
Adjusted Net Income (Loss) is defined as net income (loss) from continuing operations excluding amortization of acquired intangible assets, gain (loss) on early extinguishment of debt, share of earnings (losses) in equity method investments, and items that are excluded under our debt covenants, such as gain on sale of shares of Orbitz Worldwide, non-cash equity-based compensation, certain corporate and restructuring costs, certain litigation and related costs, and other non-cash items such as unrealized foreign currency gains (losses) on earnings hedges, and unrealized gains (losses) on interest rate derivative instruments, along with any income tax related to these exclusions.
Adjusted Operating Income (Loss) is defined as Adjusted EBITDA less depreciation and amortization of property and equipment and amortization of customer loyalty payments.
Capital Expenditures is defined as cash paid for property and equipment plus repayments in relation to capital leases and other indebtedness.
Customer Loyalty Payments are payments made to travel agencies or travel providers with an objective of increasing the number of travel bookings using the Company’s Travel Commerce Platform and to improve the travel agencies or travel providers’ loyalty, which are instrumented through agreements with a term over a year. Under the contractual terms, the travel agency or travel provider commits to achieve certain economic objectives for the Company. Such costs are specifically identifiable to individual contracts with travel agencies or travel providers, which have determinable contractual lives. Due to the contractual nature of the payments, the Company believes that such assets are appropriately classified as intangible assets.
Net Debt is defined as total debt comprising of current and non-current portion of long-term debt minus cash and cash equivalents.
Reported Segments means travel provider revenue generating units (net of cancellations) sold by the Company’s travel agency network, geographically presented by region based upon the point of sale location.
Travel Commerce Platform RevPas (“RevPas”) represents Travel Commerce Platform revenue per segment and is computed by dividing Travel Commerce Platform revenue by the total number of Reported Segments.
Definitions
23

Q3 2016 Earnings