q3 2019 results · 2019-11-22 · financial and operating results 5 robust q3 2019 performance,...
TRANSCRIPT

Q3 2019 Results22 NOVEMBER 2019
1

GENERAL AND DISCLAIMER
Except as the context otherwise indicates, ’Neptune’ or ‘Neptune Energy’, ‘Group’, ‘we’, ‘us’, and ‘our’, refers to the group of companies comprising Neptune Energy Group Midco Limited(‘the Company’) and its consolidated subsidiaries and equity accounted investments. ‘EPI’ refers to the business of ENGIE E&P International S.A. (now renamed Neptune EnergyInternational S.A.) and its direct or indirect subsidiaries.
This report includes the results of the acquired EPI business consolidated since 15 February 2018, which is the acquisition date as that is when Neptune acquired control over EPI.Comparative data for Neptune for the corresponding reporting period ended 30 September 2019 therefore includes only seven and a half months results contribution from the EPIbusiness.
In this report, unless otherwise indicated, our production, reserves and resources figures are presented on a basis including our ownership share of volumes of companies that weaccount for under the equity accounting method, in particular, for the interest held in the Touat project in Algeria through a joint venture company. Production for interests held underproduction sharing contracts is reported on an appropriate unit of production basis.
The discussion in this report includes forward-looking statements which, although based on assumptions that we consider reasonable, are subject to risks and uncertainties which couldcause actual events or conditions to materially differ from those expressed or implied by the forward-looking statements. While these forward-looking statements are based on ourinternal expectations, estimates, projections, assumptions and beliefs as at the date of such statements or information, including, among other things, assumptions with respect toproduction, future capital expenditures and cash flow, we caution you that the assumptions used in the preparation of such information may prove to be incorrect and no assurance canbe given that our expectations, or the assumptions underlying these expectations, will prove to be correct. Any forward-looking statements that we make in this report speak only as ofthe date of such statement or the date of this report.
This report contains non-GAAP and non-IFRS measures and ratios that are not required by, or presented in accordance with, any generally accepted accounting principles (‘GAAP’) orIFRS. These non-IFRS and non-GAAP measures and ratios may not be comparable to other similarly titled measures of other companies and have limitations as analytical tools andshould not be considered in isolation or as a substitute for analysis of our operating results as reported under IFRS or GAAP. Non-IFRS and non-GAAP measures and ratios are notmeasurements of our performance or liquidity under IFRS or GAAP and should not be considered as alternatives to operating profit or profit from continuing operations or any otherperformance measures derived in accordance with IFRS or GAAP or as alternatives to cash flow from operating, investing or financing activities.
2

Operational updateJIM HOUSE, CEO

OVERVIEW
4
GOOD STRATEGIC PROGRESS, CHALLENGING OPERATING ENVIRONMENT IN Q3 2019
▪ Neptune partially protected through production diversification and hedging through period of softer gas prices
▪ Q3 production lower due to planned and unplanned shutdowns and third party curtailments
▪ Production impact partially mitigated by actions taken across several fields
Softer commodity prices, challenging operating environment in Q3
▪ Strategic acquisitions in Indonesia, Norway and the UK have strengthened the business in core areas
▪ Transactions improve our reserves to production life and add additional near-term production projects
▪ Costs of acquired projects comparable or lower than existing portfolio
Value accretive growth, increasing long-life, low-cost reserves
▪ Production to return to expected levels in Q4, commodity prices strengthening
▪ Nine sanctioned projects under development, up from two at the time of the Engie E&P acquisition
▪ On course for production to exceed 200 kboepd in 2021
Strong project pipeline, ~110 kboepd of new production to come onstream
▪ $300 million Senior Note Offering closed in October, increases available headroom to $1.7 billion
▪ Investment to increase in 2020, before returning to current levels
▪ Leverage ratio remains low and forecast to remain well within the threshold
Strong balance sheet, disciplined capital allocation, healthy liquidity
Q3 operations
Strategic progress
Production outlook
Financial discipline
FINANCIAL AND OPERATING RESULTS
5
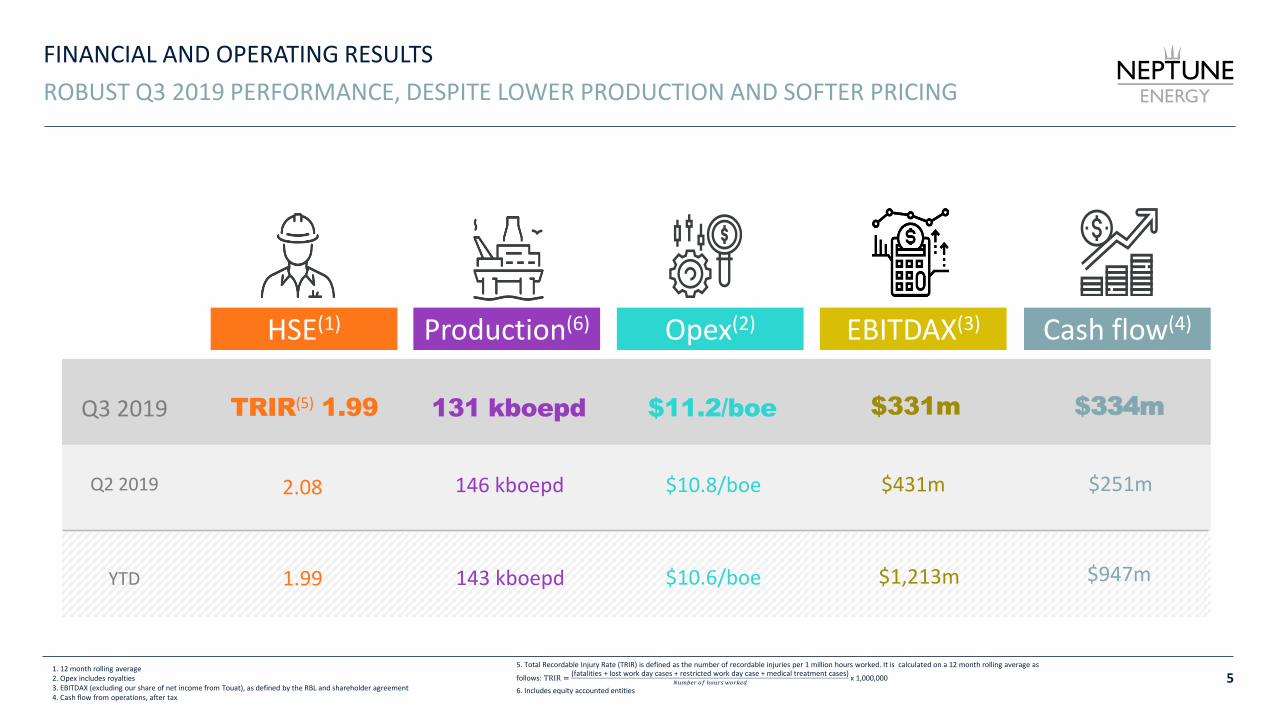
ROBUST Q3 2019 PERFORMANCE, DESPITE LOWER PRODUCTION AND SOFTER PRICING
1. 12 month rolling average2. Opex includes royalties3. EBITDAX (excluding our share of net income from Touat), as defined by the RBL and shareholder agreement4. Cash flow from operations, after tax
5. Total Recordable Injury Rate (TRIR) is defined as the number of recordable injuries per 1 million hours worked. It is calculated on a 12 month rolling average as
follows: TRIR =(fatalities + lost work day cases + restricted work day case + medical treatment cases)
𝑁𝑢𝑚𝑏𝑒𝑟 𝑜𝑓 ℎ𝑜𝑢𝑟𝑠 𝑤𝑜𝑟𝑘𝑒𝑑x 1,000,000
6. Includes equity accounted entities
Production(6)
131 kboepd
146 kboepd
Opex(2)
$11.2/boe
$10.8/boe
EBITDAX(3)
$331m
$431m
HSE(1)
TRIR(5) 1.99
2.08
Cash flow(4)
$334m
$251m
143 kboepd $10.6/boe $1,213m $947mYTD
Q2 2019
Q3 2019
1.99

DIVERSE GEOGRAPHICAL PORTFOLIO
6
CONTINUED OPERATIONAL DELIVERY IN Q3 2019
▪ Production lower due to planned shutdowns and thirdparty issues curtailing production at Gjøa and Gudrun;successful mitigation at Gjøa through alternativemarketing arrangements
▪ Acquired interests in the Nova and Dvalindevelopments adding 23 mmboe of reserves and 12kboepd of future production
▪ Important discovery at Echino South providespotential for fast-track development
▪ Production flat as increase from our acquisition is offset by project delays at Rӧmerberg
▪ Production to increase in Q4 reflecting drilling activity and a full contribution from assets acquired from Wintershall DEA in September
▪ Schwegenheim well started drilling in September
▪ Production impacted by shutdowns, curtailments anddelayed development drilling; production to return toplan in Q4
▪ Implemented an enhanced regional inspection andmaintenance campaign
▪ Cost efficiency programme on plan
▪ Cygnus production lower due to a shortage of blend gas, constrained pipeline capacity and a planned shutdown; shutdown completed 8 days ahead of plan
▪ Announced acquisition of 3 kboepd of production and a 25% interest in the material Glengorm discovery
▪ Seagull project on plan; rig contract awarded. Isabella well commenced operations in October
▪ Production up following start-up of Touat in September
▪ Technical and operational issues have slowed production ramp up at Touat
▪ Production in Egypt higher following completion of Karam-10 well
▪ Production constrained in Q3 due to offtake restrictions in Indonesia; Q4 currently on plan
▪ West Ganal PSC officially signed. Includes the Mahadiscovery with 24 mmboe of net resources
▪ New acreage in Indonesia provides material reserves and resources, in addition to exposure to multi-Tcfexploration potential
Q3 production: 12.4 kboepd (10% of portfolio)
GERMANY
Q3 production: 63.3 kboepd (48% of portfolio)
NORWAY
Q3 production: 15.0 kboepd (11% of portfolio)
UK
Q3 production: 18.1 kboepd (14% of portfolio)
NETHERLANDS
Q3 production: 5.4 kboepd (4% of portfolio)
NORTH AFRICA
Q3 production: 16.6 kboepd (13% of portfolio)
ASIA PACIFIC

PRODUCTION UPDATE
7
PRODUCTION TO AVERAGE ~145 KBOEPD FOR FY 2019
154 154 159
145
0
20
40
60
80
100
120
140
160
180
200
2016 2017 2018 2019
0
20
40
60
80
100
120
140
160
Q1 Q2 Q3 Q4
Norway The Netherlands UK Germany Asia Pacific North Africa
152146
131
c.151
kboepd kboepd
Production from existing assets to return to plan in Q4 Production growth phase now underway
▪ YTD production has been held back by planned and unplanned shutdowns, thirdparty curtailments and delays at Touat
▪ Gjøa curtailment successfully mitigated through alternative marketingarrangements
▪ Planned shutdown at Cygnus completed eight days ahead of schedule
▪ Excluding these issues, production has been close to plan and underlyingperformance among many assets has been strong
▪ Since acquiring Engie E&P, Neptune has sanctioned seven new developments,in addition to the existing Touat and the Njord Area projects
▪ All nine development projects are expected to come onstream by the end of2021, contributing ~110 kboepd at peak production levels(1)
▪ Daily production is expected to exceed 200 kboepd during 2021(2)
▪ Investment programme reduces the average age of our production assets andstrengthens core areas around key ‘Hubs’
1. Summation of individual project peak production2. Full year 2021 production is expected to average less than 200 kboepd
>200 kboepd

HIGH QUALITY GROWTH PIPELINE
8
PROJECTS TO DELIVER ~110 KBOEPD OVER NEXT TWO YEARS
10 kboepd
16 kboepd(3)
8 kboepd
15 kboepd(3)
25 kboepd
Latest progress 2019 2020 2021
Neptune 35%
Seagull
Neptune 22.5%(1)
Njord Area
Neptune 30%
Fenja
Neptune 30%
Duva/Gjøa P1
15 kboepd
10 kboepd
Njord project remains on track for production to recommence in late 2020. Includes recommencement of production from Hyme and first oil from the Bauge field – both in early 2021.
Rig contract awarded in Q3; drilling to commence in Q3 2020.
Development drilling brought forward to Q4 2019.
Offshore campaign (pipelines, umbilical cables, subsea templates and manifolds) successfully completed.
Key projects
Neptune 12%
Snøhvit satellites Snøhvit Nord (production commenced in Q3 2019) and Askeladd (2020 start-up). Askeladd development drilling to commence in Q4 2019.
Neptune 20%(2,4)
Merakes Merakes, Merakes East and the Maha fields are expected to be developed as tie-backs to the Jangkrik FPU. Peak production in 2024.
Neptune 35%
Touat Production commenced in September and is ramping up to plateau.
Full year 2019 development capex guidance of $750 million(5), excluding M&A activities
Neptune
ENI
Equinor
Neptune
Neptune
Neptune
Equinor
Operator
Neptune 10%(4)
Dvalin
Neptune 15%(4)
Nova
Wintershall DEA
Wintershall DEAAcquisition announced in October 2019. To be developed as a sub-sea tie-back to Gjøa. The Nova module will be installed in Q2 2020.
Acquisition announced in October 2019. To be developed as a sub-sea tie-back to Heidrun. In Q3, the processing module was successfully installed and development drilling commenced.
7 kboepd
5 kboepd
Production net to Neptune
1 Neptune has a 22.5% working interest in Njord and a 12.5% interest in the Hyme and Bauge satellites2 Neptune has a 20% working interest in Merakes/Merakes East and a 30% interest in Maha3 Entitlement production net to Neptune. Actual plateau rates are subject to debottlenecking, plant uptime and other commercial arrangements
4 Neptune participating interests in Merakes, Dvalin and Nova are subject to completion of acquisitions5 Including development and maintenance capex

DELIVERING LOW-COST GROWTH THROUGH ORGANIC AND INORGANIC PROJECTS
9
COST EFFICIENCY PROGRAMMES ON TRACK
Maintaining low operating costs
48%11% 17%
8%
16%
$7.1 $12.3
$25.7
$11.5
▪ Group opex marginally higher in Q3 ($11.2/boe), but YTD average ($10.6/boe)remains within original guidance
▪ Opex in the Netherlands, the UK and Indonesia impacted by lowerproduction
▪ Continued improvements in Germany and Norway
▪ Business improvement plan delivering revenue gains and cost savings
▪ Projects acquired(1) are highly competitive with an average forecast opex of just$5/boe at plateau production
▪ Neptune has a low all in pre-tax breakeven cost of around $27/boe(5)
▪ Acquired projects(1) have a similar cost profile with an equivalent all in pre-taxbreakeven cost of approximately $26/boe(6,7), including acquisition costs
▪ Acquisition costs have averaged less than $7/boe(2,3), with considerable additionalresource potential at Glengorm and Isabella
▪ Further improvements to measures through future investment opportunities
Breakeven costs of acquired projects are similar to existing assetsAcquired projects have highly competitive opex
$6.5/boe $7.1/boe
10.6
4.8
0.0
2.0
4.0
6.0
8.0
10.0
12.0
Neptune YTD Acquisitions(1,6)
$/boe $/boe
1. Acquired projects include, Merakes, Nova/Dvalin, Seagull and Fenja
2. Acquisitions include transactions with VNG, Apache, ENI and Energean
3. Acquisition costs average $6.7/boe including contingent resources (2P + 2C) and $7.6/boe excluding contingent resources (2P reserves only). Acquisition costs may include strategic premium given regional strategy
4. Breakeven costs are calculated after opex, G&A, capex, exploration expense and decommissioning expense, but before net interest costs and tax
5. Full year 2019 estimate reported at H1 2019 results.
6. Based on plateau production
7. Breakeven costs for acquired projects are subject to change
Breakeven costs(4) underline high asset quality
0.0
5.0
10.0
15.0
20.0
25.0
30.0
Neptune Acquisitions
All-in breakeven cost Acquisition cost
$26/boe$27/boe
(1,6)(5)
ENVIRONMENT, SOCIAL AND GOVERNANCE
10
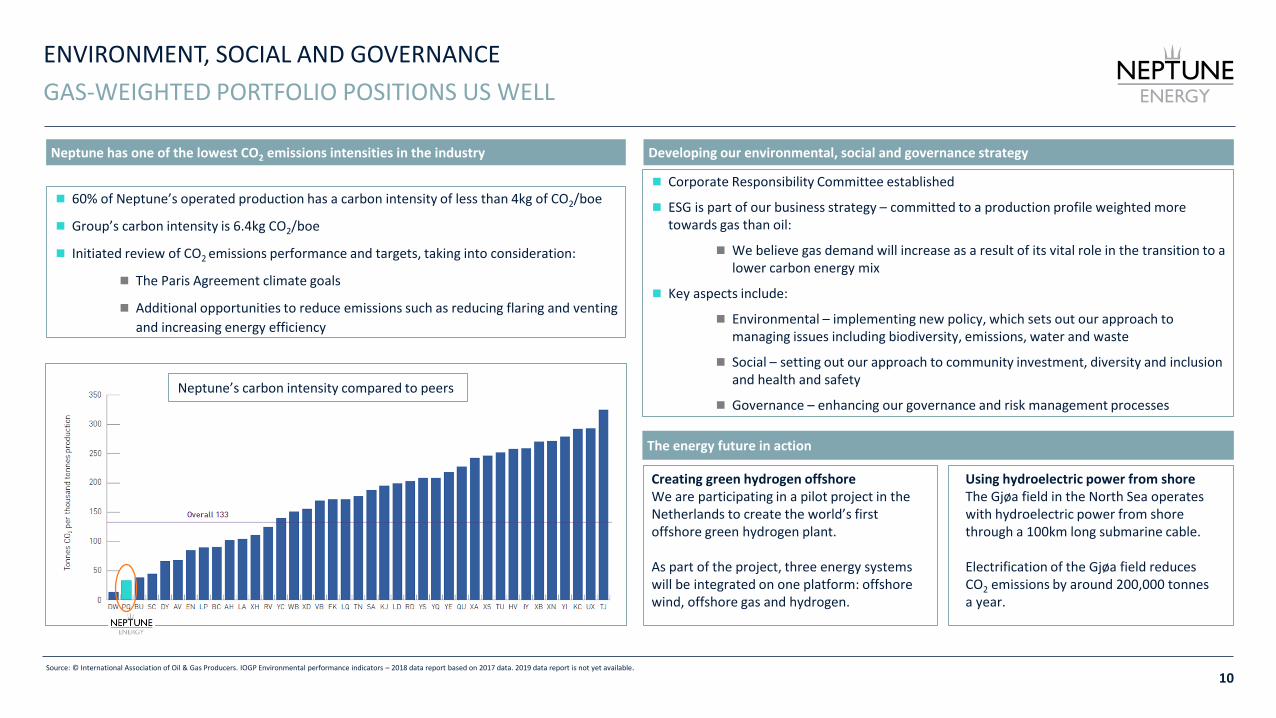
GAS-WEIGHTED PORTFOLIO POSITIONS US WELL
Neptune has one of the lowest CO2 emissions intensities in the industry
◼ 60% of Neptune’s operated production has a carbon intensity of less than 4kg of CO2/boe
◼ Group’s carbon intensity is 6.4kg CO2/boe
◼ Initiated review of CO2 emissions performance and targets, taking into consideration:
◼ The Paris Agreement climate goals
◼ Additional opportunities to reduce emissions such as reducing flaring and venting
and increasing energy efficiency
Developing our environmental, social and governance strategy
Creating green hydrogen offshoreWe are participating in a pilot project in the Netherlands to create the world’s first offshore green hydrogen plant.
As part of the project, three energy systems will be integrated on one platform: offshore wind, offshore gas and hydrogen.
◼ Corporate Responsibility Committee established
◼ ESG is part of our business strategy – committed to a production profile weighted more towards gas than oil:
◼ We believe gas demand will increase as a result of its vital role in the transition to a lower carbon energy mix
◼ Key aspects include:
◼ Environmental – implementing new policy, which sets out our approach to managing issues including biodiversity, emissions, water and waste
◼ Social – setting out our approach to community investment, diversity and inclusion and health and safety
◼ Governance – enhancing our governance and risk management processes
The energy future in action
Source: © International Association of Oil & Gas Producers. IOGP Environmental performance indicators – 2018 data report based on 2017 data. 2019 data report is not yet available.
Using hydroelectric power from shoreThe Gjøa field in the North Sea operates with hydroelectric power from shore through a 100km long submarine cable.
Electrification of the Gjøa field reduces CO2 emissions by around 200,000 tonnes a year.
Neptune’s carbon intensity compared to peers

Financial resultsARMAND LUMENS, CFO

FINANCIAL HIGHLIGHTS
12
RESULTS FOR THE NINE MONTHS ENDED 30 SEPTEMBER 2019
Revenues$1,679 million
▪ Neptune production of 38.8 mmboe
▪ Realised oil price of $62.1/bbl and dry gas sales price of $5.0/mcf before hedging
▪ Third quarter oil and gas prices were weaker than in the second quarter
Post-tax operating cash flow$947 million
FCF(2)
$182 million
▪ Strong cash flow generation YTD
▪ Cash flows continue to meet investment and financing requirements
▪ Net debt of $1,086 million(6)
Operating costs$412 million
▪ Good progress made on cost control across the Group
▪ Opex of $10.6/boe compared to $11.2 in the comparable period(5) in 2018
Total capex$631 million
▪ Development capex of $601 million
▪ $50 million invested in Touat in the period
EBITDAX(1)
$1,213 million
▪ Strong earnings performance, despite higher exploration and restructuring expenses
▪ Depreciation and amortisation expense of $487 million, representing $12.5/boe
Net debt to EBITDAX: 0.62x
▪ Leverage ratio(3) remains well within desired level
‒ RBL requirement is <3.5x net debt to EBITDAX
▪ $1.4 billion of available liquidity(4); $1.7 billion including $300 million Senior Notes Offering
Pre-tax profit$445 million
Net income after tax$83 million
▪ Pre-tax profits increased $60 million from H1 results
▪ High tax charge in the third quarter
Hedged position2019Oil 49%Gas 65%
▪ 2019: Oil has been hedged with an average downside floor of $61/bbl and a capped upside of $75/bbl
▪ 2019: Gas has been hedged with an average floor price of $5.7/mmbtu and an upside cap of $7.3/mmbtu
1. EBITDAX comprises net income for the period before equity accounted affiliates, income tax expense, financial expenses, financial income, non-recurring acquisition-related expenses mark-to-market adjustments on commodity contracts, exploration expense, depreciation and amortisation
2. Free cash flow defined as operating cash flow before acquisition expenses and net of development and exploration capex, investment in equity accounted entities and net interest paid
3. For the twelve months ended 30 September 2019
4. Excludes $300 million Senior Notes Offering announced October 2019
5. Reflects the acquired EPI business from 15 February to 30 September 2018
6. Net debt excluding Subordinate Neptune Energy Group Limited Loan and Touat Project finance facility as defined in RBL and shareholders agreement

COMMODITY PRICES IN Q3 2019
13
REALISED OIL AND GAS PRICES REMAINED SOFT
Realised LNG price1 ($/mcf)Realised oil price ($/bbl) Realised gas price ($/mcf)
Brent crude price average2
9mths 2018$72.7/bbl
9mths 2019$64.8/bbl
TTF price average2
9mths 2018$8.0/mcf
9mths 2019$4.7/mcf
Japan-Korea marker price average2
9mths 2018$9.3/mcf
9mths 2019$5.3/mcf
Neptune’s realised prices
70.7
62.1
64.1
61.3
9 M T H S 2 0 1 8 9 M T H S 2 0 1 9
Pre-hedging Post hedging7.8
5.0
6.6
5.5
9 M T H S 2 0 1 8 9 M T H S 2 0 1 9
Pre-hedging Post hedging
7.6
8.4
9 M T H S 2 0 1 8 9 M T H S 2 0 1 9
1. The average realised LNG price reflects some contracts that are linked to JCC prices averaged over an agreed lagged period. Those volumes are hedged using oil-linked instruments
2. Benchmark prices for illustrative purposes only

KEY FINANCIALS
14
EARNINGS FOR THE NINE MONTHS ENDED 30 SEPT 2019
▪ Revenues of $1,679 million, down 5% from $1,767 million in 2018(1)
▪ Operating costs per barrel 5% lower at $10.6/boe and well within original full year guidance
▪ Depreciation and amortisation expense increased to $12.5/boe from $11.9/boe in 2018(1)
▪ Exploration expense decreased by $9 million to $37 million on lower seismic acquisition costs
▪ Tax charge of 81.3% of pre-tax income
Nine months ended 30 Sept 2019
Total revenues 1,679
Operating costs (412)
DD&A (487)
Exploration expense (37)
G&A (58)
Other operating items 3
Operating profit 688
Other non-operating items (14)
Restructuring costs (68)
Net financial items (161)
Profit before tax 445
Tax (362)
Reported net income 83
EBITDA 1,176
Adjustments 37
EBITDAX 1,213
Consolidated income statement ($m) Commentary EBITDAX(2)
Net income$m
$m
1. Results for this period consolidate the acquired EPI business for the post acquisition period only, from 15 February 2018 to 30 September 2018
2. EBITDAX excludes equity accounted affiliates

KEY FINANCIALS
15
CASH FLOW
▪ Operating cash flows of $947 million after cash taxes of $261 million
▪ Cash capex before acquisitions of $630 million includes:
- Development capex $601 million
- Exploration capex of $29 million
▪ FY 2019 development capex guidance of $750 million, excluding acquisitions
▪ Acquisition costs of around $640 million, subject to completion adjustments
‐ Includes estimated capex for 2019 of ~$180 million
▪ Free cash flow after financing costs remains strong at $182 million
Nine months ended 30 Sept 2019
EBITDAX(3) 1,213
Cash taxes (261)
Change in WC and other items (5)
Cash flows from operations 947
Exploration capex (29)
Development capex (601)
Investments in equity accounted entities (50)
Other 14
Cash flows from investment (666)
Change in debt (219)
Lease accounting (15)
Interest paid (84)
Cash flows from financing (318)
Net change in cash (36)
Cash at end of period 159
Free cash Flow after financing costs 182
Consolidated cash flow statement ($m) Commentary Operating cash flow
Capex(2)
$m
$m
1. Results for this period consolidate the acquired EPI business for the post acquisition period only, from 15 February 2018 to 30 September 2018.
2. Excluding M&A activities
3. EBITDAX excluding equity accounted affiliates
4. Our ENI and Energean acquisitions are expected to complete in late 2019 or early 2020
231
630
0
100
200
300
400
500
600
700
9mths 2018 9mths 2019

KEY FINANCIALS
16
BALANCE SHEET
Source: Company information1. Book value of total debt2. Excludes $300 million Senior Notes Offering announced October 20193. As defined in our RBL and shareholders agreement
30 Sept 2019
Goodwill 620
PPE and intangibles 4,099
Investments in JVs 586
Other 557
Non-current assets 5,862
Trade and other receivables 619
Cash 159
Other 168
Current assets 946
Total assets 6,807
Equity 1,758
Long-term borrowings 1,509
Provisions 1,614
Other 936
Non-current liabilities 4,059
Short-term borrowings 94
Trade payables 154
Taxes payable 221
Other 522
Current liabilities 991
Total liabilities 5,050
Net assets 1,758
Consolidated balance sheet ($m) Commentary Debt breakdown
x
▪ Net debt(3) at the end of the period of $1,086 million
▪ Total debt(1,2) of $1,603 million
- $720 million drawn under Reserve Base Lending facility
- $550 million senior notes
- $113 million Engie Vendor Loan Note
- $244 million project financing facility for Touat
- $35 million short term borrowing facility
▪ Available liquidity of $1,358 million(2)
- Cash at end of the period of $159 million
- $1,199 million undrawn headroom under RBL
▪ 79% debt portfolio was fixed rate at 30 September 2019
▪ Average weighted cost of borrowing 5.7%
▪ Net debt to EBITDAX of 0.62x(3)
▪ $300 million Senior Notes Offering announced October 2019 enhances liquidity
Net debt to EBITDAX
0.62
0.50.55
0.62
0.00
0.10
0.20
0.30
0.40
0.50
0.60
0.70
FY 2018 Q1 2019 H1 2019 Q3 2019
RBL, $720m
Senior Notes, $550m
Touat, $244m
Engie Vendor Loan, $113m
Short term facility, $35m

FINANCIAL POSITION
17
SIGNIFICANT AVAILABLE LIQUIDITY(1)
$m
Source: Company information
1. The chart shows our pro forma balance sheet as reported at 30 September 2019, adjusted for the $300 million Senior Notes offering announced in October 2019. The proceeds of the offering were used to reduce the outstanding balance on the RBL facility from $720 million, increasing the pro forma available and undrawn RBL balance to $1,499 million (from $1,199 million) and our available headroom to $1,658 million (from $1,358 million).
420
850
244
113 35 591,603 159
1,4441,499
159 1,658
947 681
795 182
--
500
1,000
1,500
2,000
DrawnRBL
SeniorNotes
TouatProjectFinance
EngieVendorLoan B
Short-term
facility
DebtIssuance
Costs
Total Debt Cash Net Debt UndrawnRBL
Cash Headroom OperatingCF
InvestingCF
Netfinance
Other Free CFsurplus
Recent$300 mm Offering
(1) (1)

OutlookJIM HOUSE, CEO

OVERVIEW
19
GOOD STRATEGIC PROGRESS, FULLY FUNDED INVESTMENT PLANS
▪ North Sea acquisition strengthens core areas
▪ Provides additional low-cost reserves and contingent resources and near-term production growth
▪ Follows acquisitions in Indonesia and Germany
▪ Enhanced exploration portfolio; important discovery at Echino South
Strategic progress
▪ Touat successfully brought onstream in September
▪ Full year 2019 production guidance lowered to around 145 kboepd
▪ ~110 kboepd of projects in development(2); Merakes and Dvalin projects to come onstream in 2020
▪ Production expected to reach 200 kboepd in 2021(1);
Material near-term growth in
production
▪ Cost efficiency programmes in place across the business
▪ Full year opex guidance of around $10.5/boe
▪ Opex expected to be in $10 -11/boe range in 2020
▪ Acquired assets have similar or lower operating costs
Maintaining a focus on low operating
costs
▪ Strong organic cash flow generation
▪ $300 million Senior Notes offering increases headroom
▪ Development capex to increase to $1-1.1 billion(3) in 2020, before reducing to around current levels from 2021
▪ Leverage ratios to remain well within threshold in 2020, before falling sharply in 2021
Fully funded investment plans
Jangkrik FPU
Echino South
1. Production is expected to reach 200 kboepd in 2021, but will average less than this for the full year
2. Includes Touat, which is ramping up to plateau
3. Proposed development capex in 2020 includes capex for acquisitions and is subject to final board approval. The figure excludes acquisition costs and associated 2019 capex of $640 million, subject to the completion date.

Q&A
